anoka county – blaine airport (ane) - metroairports.org facility requirements and runway...
TRANSCRIPT
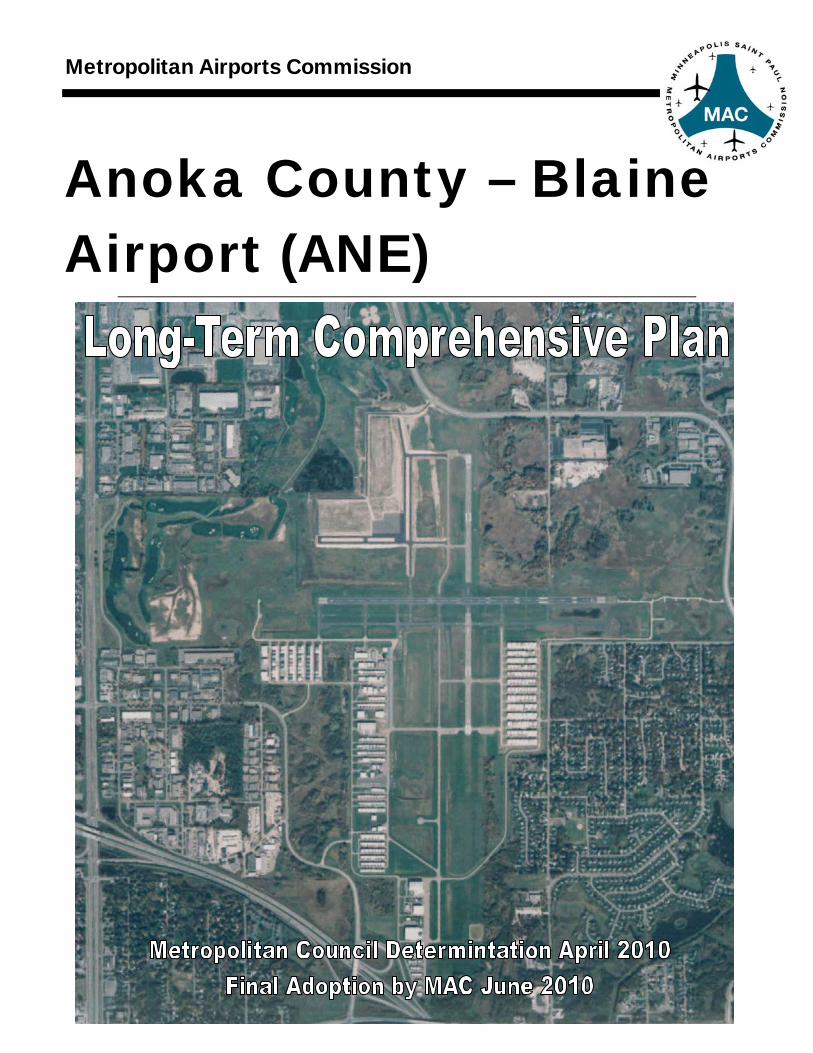
Metropolitan Airports Commission
Anoka County – Blaine Airport (ANE)
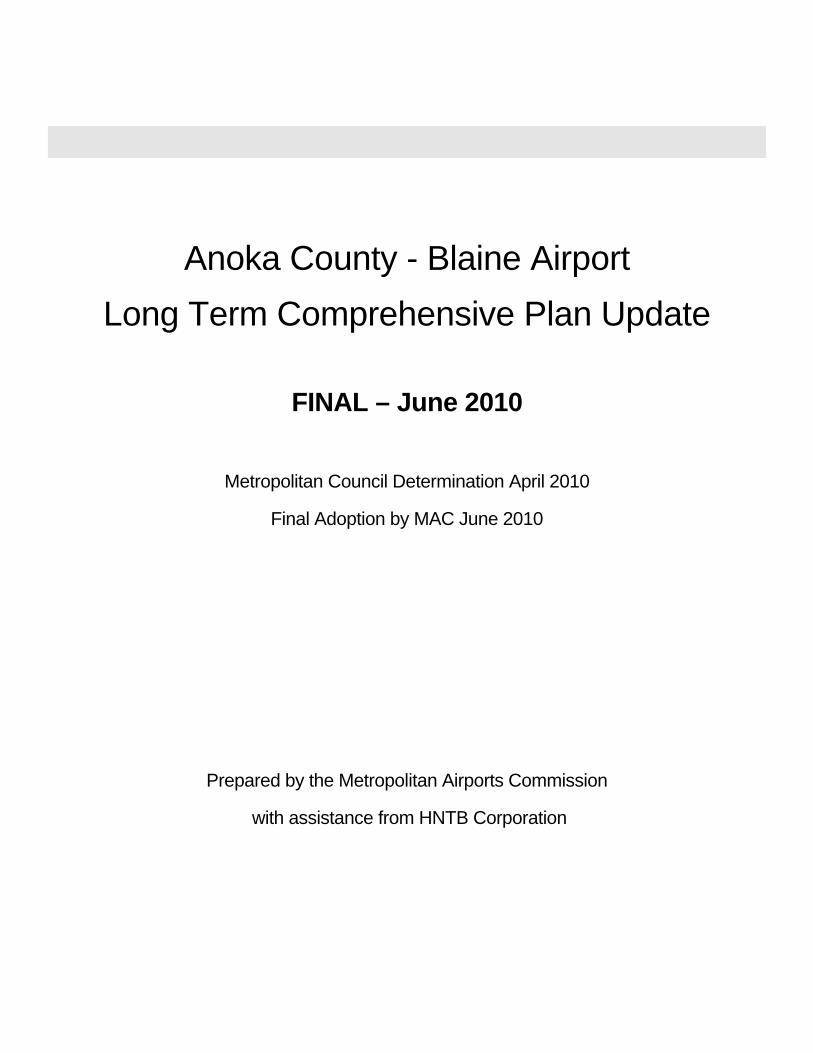
Anoka County - Blaine Airport Long Term Comprehensive Plan Update
FINAL – June 2010
Metropolitan Council Determination April 2010
Final Adoption by MAC June 2010
Prepared by the Metropolitan Airports Commission
with assistance from HNTB Corporation
Table of Contents
Table of Contents ..................................................................... i
List of Tables........................................................................... iv
List of Figures......................................................................... vi
Executive Summary ............................................................. viii ES.1 Report Organization................................................................................................................... viii ES.2 Forecasts ....................................................................................................................................... ix ES.3 Facility Requirements and Runway Length............................................................................. ix
ES.3.1 Runway Length ......................................................................................................................... x ES.4 Plan Recommendations ............................................................................................................... xi
ES.4.1 Security Gates...........................................................................................................................xi ES.4.2 Taxiway Charlie Extension ......................................................................................................xii ES.4.3 Xylite Street Relocation............................................................................................................xii ES.4.4 Pavement Maintenance Program .......................................................................................... xiii ES.4.5 Concurrent Use / Development Parcels ................................................................................ xiii ES.4.6 Agency Coordination.............................................................................................................. xiii
ES.5 Noise Contours and Land Use .................................................................................................. xiii ES.6 Public Involvement Process..................................................................................................... xiv
Existing Conditions/Inventory ............................................... 1 1.1 Airport History and Location ........................................................................................................... 1 1.2 Airport Role ........................................................................................................................................ 2
1.2.1 MAC Classification ....................................................................................................................... 3 1.2.2 FAA Classification ........................................................................................................................ 3 1.2.3 Mn/DOT Classification ................................................................................................................. 3 1.2.4 Metropolitan Council Classification.............................................................................................. 4
1.3 Existing Airside Facilities................................................................................................................. 4 1.3.1 Pavement Areas........................................................................................................................... 5 1.3.2 Lighting and Navigation ............................................................................................................... 5 1.3.3 Airspace Management System ................................................................................................... 6 1.3.4 Airspace Structure........................................................................................................................ 6 1.3.5 Delegation of Air Traffic Control Responsibilities........................................................................ 7 1.3.6 Approach Procedures and Traffic Patterns................................................................................. 7 1.3.7 Imaginary Surfaces and Obstructions......................................................................................... 7 1.3.8 Runway Protection Zones/State Safety Zones........................................................................... 8
1.4 Existing Landside Facilities............................................................................................................. 8 1.4.1 Fixed Base Operators (FBOs)..................................................................................................... 8 1.4.2 Hangar Storage Areas ................................................................................................................. 9 1.4.3 Aircraft Space Utilization.............................................................................................................. 9 1.4.4 Maintenance and Equipment Areas..........................................................................................10 1.4.5 Roadway Access........................................................................................................................10
i
1.4.6 Vehicle Parking Areas................................................................................................................10 1.5 Airport Environment .......................................................................................................................10
1.5.1 Utilities and Local Services........................................................................................................11 1.5.2 Drainage and Water Quality ......................................................................................................12 1.5.3 Sanitary Sewer and Water.........................................................................................................13
1.6 Meteorological Data ........................................................................................................................13 1.7 Area Land Use, Airspace and Zoning ..........................................................................................13 1.8 Area Socioeconomic Data .............................................................................................................13 1.9 Historic Airport Activity ..................................................................................................................14
Aviation Forecast .................................................................. 15 2.1 Aircraft Fleet Mix and Based Aircraft Forecasts ........................................................................15 2.2 Aircraft Operations Forecasts.......................................................................................................15 2.3 Peak Activity Forecasts..................................................................................................................17 2.4 Forecast Scenarios .........................................................................................................................17
2.4.1 High Forecast Scenario ............................................................................................................17 2.4.2 Low Forecast Scenario .............................................................................................................18
2.5 Summary..........................................................................................................................................19
Airside and Landside Facility Requirements..................... 20 3.1 Airside Requirements .....................................................................................................................20
3.1.1 Airport Reference Code .............................................................................................................20 3.1.2 Approach Category ....................................................................................................................20 3.1.3 Airplane Design Group...............................................................................................................21 3.1.4 Wind Coverage...........................................................................................................................21
3.2 Airside Capacity Requirements ....................................................................................................23 3.2.1 Annual Service Volume..............................................................................................................23 3.2.2 Runway Length ..........................................................................................................................23 3.2.3 Runway Width and Shoulders...................................................................................................26 3.2.4 Runway Orientation....................................................................................................................26 3.2.5 Runway Safety and Object Free Areas ....................................................................................26 3.2.6 Taxiway Requirements ..............................................................................................................26
3.3 Landside Requirements .................................................................................................................27 3.3.1 Hangar Facilities.........................................................................................................................27 3.3.2 Fixed Base Operators ................................................................................................................27 3.3.3 Airport Access, Roadway Circulation and Parking...................................................................28 3.3.4 Maintenance and Fuel Storage Areas ......................................................................................28
3.4 Lighting and Navigation Requirements.......................................................................................28 3.4.1 Runway and Taxiway Edge Lighting.........................................................................................28 3.4.2 PAPI/VASI ..................................................................................................................................28 3.4.4 Instrument Approach..................................................................................................................28
3.5 Security Requirements...................................................................................................................28 3.6 Utility Requirements........................................................................................................................29 3.7 Obstruction Related Issues ...........................................................................................................29
Plan Recommendations ....................................................... 30
ii
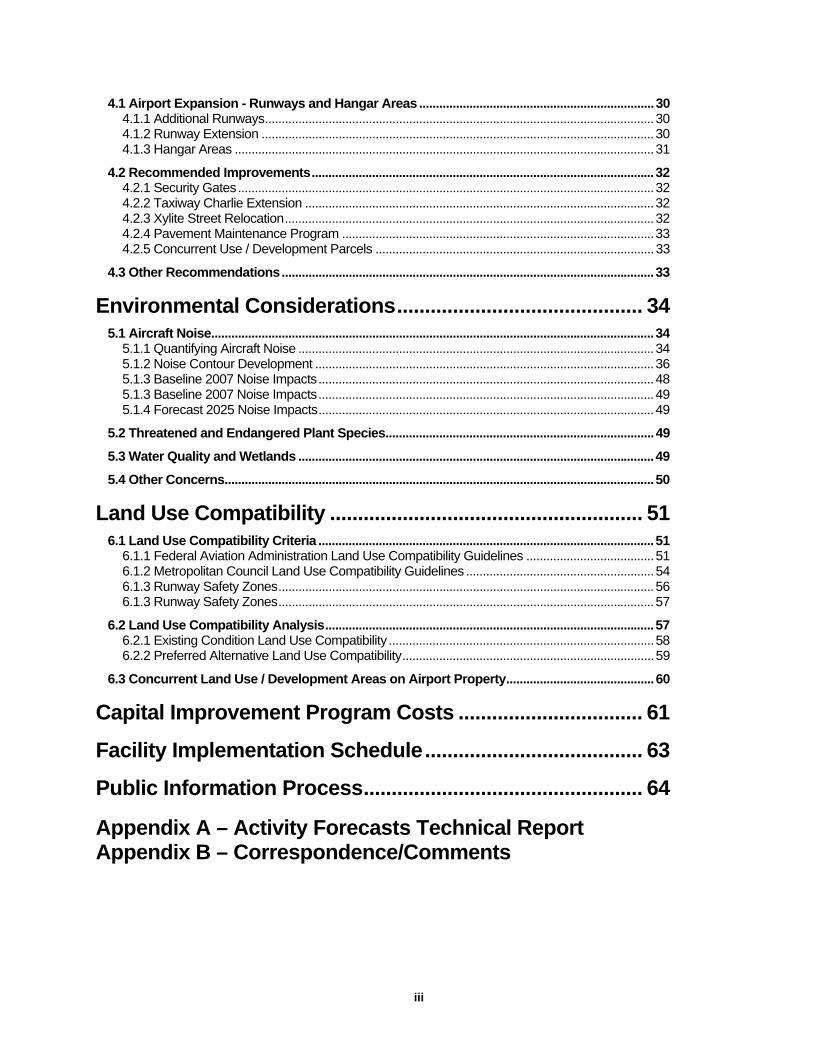
4.1 Airport Expansion - Runways and Hangar Areas ......................................................................30 4.1.1 Additional Runways....................................................................................................................30 4.1.2 Runway Extension .....................................................................................................................30 4.1.3 Hangar Areas .............................................................................................................................31
4.2 Recommended Improvements......................................................................................................32 4.2.1 Security Gates............................................................................................................................32 4.2.2 Taxiway Charlie Extension ........................................................................................................32 4.2.3 Xylite Street Relocation..............................................................................................................32 4.2.4 Pavement Maintenance Program .............................................................................................33 4.2.5 Concurrent Use / Development Parcels ...................................................................................33
4.3 Other Recommendations...............................................................................................................33
Environmental Considerations............................................ 34 5.1 Aircraft Noise....................................................................................................................................34
5.1.1 Quantifying Aircraft Noise ..........................................................................................................34 5.1.2 Noise Contour Development .....................................................................................................36 5.1.3 Baseline 2007 Noise Impacts....................................................................................................48 5.1.3 Baseline 2007 Noise Impacts....................................................................................................49 5.1.4 Forecast 2025 Noise Impacts....................................................................................................49
5.2 Threatened and Endangered Plant Species................................................................................49 5.3 Water Quality and Wetlands ..........................................................................................................49 5.4 Other Concerns................................................................................................................................50
Land Use Compatibility ........................................................ 51 6.1 Land Use Compatibility Criteria ....................................................................................................51
6.1.1 Federal Aviation Administration Land Use Compatibility Guidelines ......................................51 6.1.2 Metropolitan Council Land Use Compatibility Guidelines ........................................................54 6.1.3 Runway Safety Zones................................................................................................................56 6.1.3 Runway Safety Zones................................................................................................................57
6.2 Land Use Compatibility Analysis..................................................................................................57 6.2.1 Existing Condition Land Use Compatibility ...............................................................................58 6.2.2 Preferred Alternative Land Use Compatibility...........................................................................59
6.3 Concurrent Land Use / Development Areas on Airport Property............................................60
Capital Improvement Program Costs ................................. 61
Facility Implementation Schedule....................................... 63
Public Information Process.................................................. 64
Appendix A – Activity Forecasts Technical Report Appendix B – Correspondence/Comments
iii
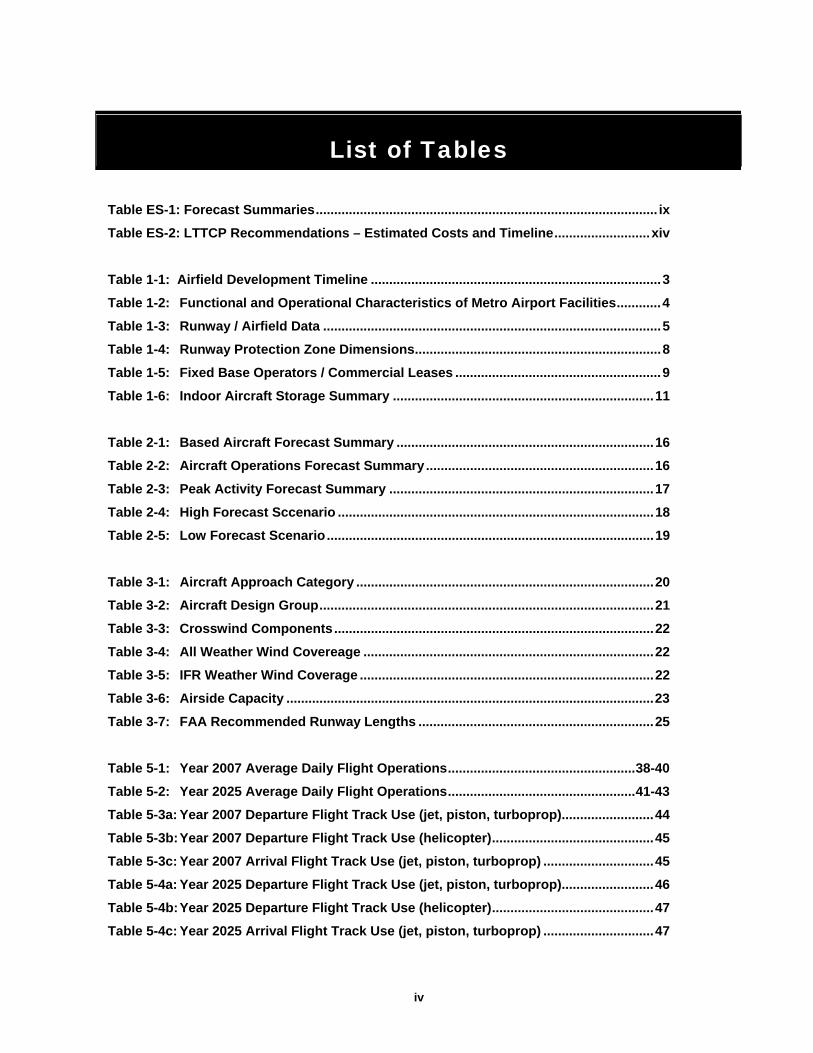
List of Tables
Table ES-1: Forecast Summaries............................................................................................. ix
Table ES-2: LTTCP Recommendations – Estimated Costs and Timeline..........................xiv
Table 1-1: Airfield Development Timeline ...............................................................................3
Table 1-2: Functional and Operational Characteristics of Metro Airport Facilities............4
Table 1-3: Runway / Airfield Data ............................................................................................5
Table 1-4: Runway Protection Zone Dimensions...................................................................8
Table 1-5: Fixed Base Operators / Commercial Leases ........................................................9
Table 1-6: Indoor Aircraft Storage Summary .......................................................................11
Table 2-1: Based Aircraft Forecast Summary ......................................................................16
Table 2-2: Aircraft Operations Forecast Summary..............................................................16
Table 2-3: Peak Activity Forecast Summary ........................................................................17
Table 2-4: High Forecast Sccenario ......................................................................................18
Table 2-5: Low Forecast Scenario.........................................................................................19
Table 3-1: Aircraft Approach Category .................................................................................20
Table 3-2: Aircraft Design Group...........................................................................................21
Table 3-3: Crosswind Components.......................................................................................22
Table 3-4: All Weather Wind Covereage ...............................................................................22
Table 3-5: IFR Weather Wind Coverage ................................................................................22
Table 3-6: Airside Capacity ....................................................................................................23
Table 3-7: FAA Recommended Runway Lengths ................................................................25
Table 5-1: Year 2007 Average Daily Flight Operations...................................................38-40
Table 5-2: Year 2025 Average Daily Flight Operations...................................................41-43
Table 5-3a: Year 2007 Departure Flight Track Use (jet, piston, turboprop).........................44
Table 5-3b: Year 2007 Departure Flight Track Use (helicopter)............................................45
Table 5-3c: Year 2007 Arrival Flight Track Use (jet, piston, turboprop) ..............................45
Table 5-4a: Year 2025 Departure Flight Track Use (jet, piston, turboprop).........................46
Table 5-4b: Year 2025 Departure Flight Track Use (helicopter)............................................47
Table 5-4c: Year 2025 Arrival Flight Track Use (jet, piston, turboprop) ..............................47
iv
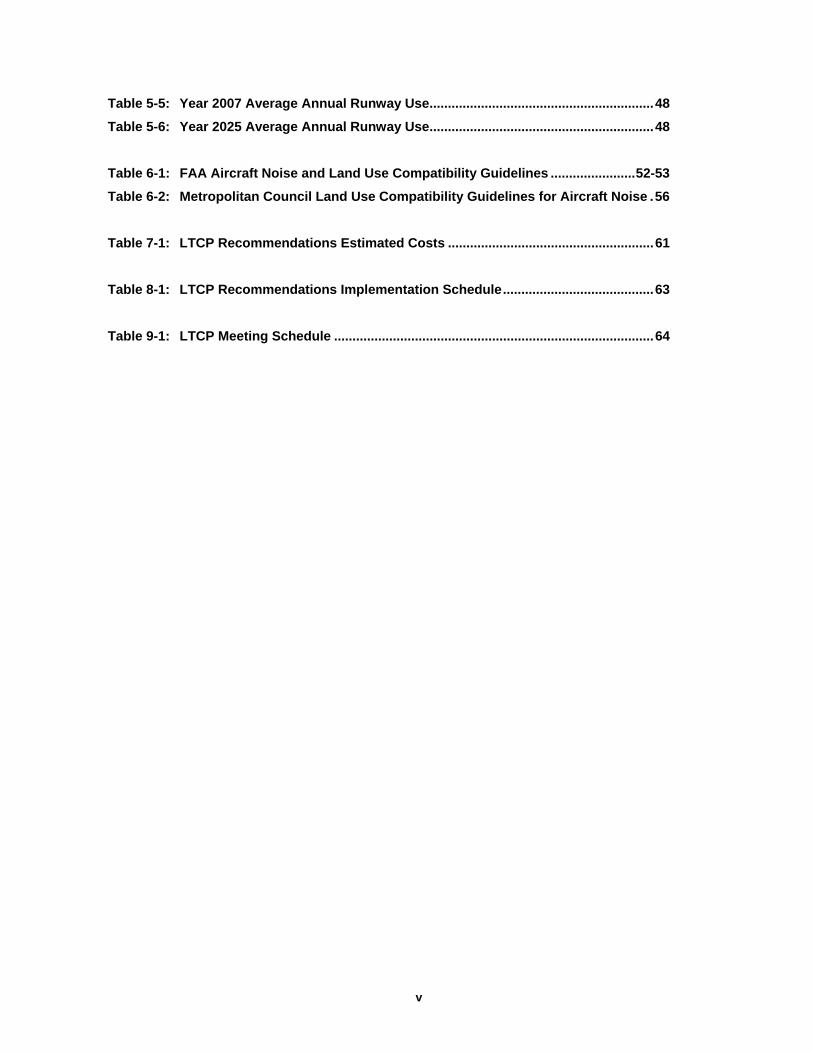
Table 5-5: Year 2007 Average Annual Runway Use.............................................................48
Table 5-6: Year 2025 Average Annual Runway Use.............................................................48
Table 6-1: FAA Aircraft Noise and Land Use Compatibility Guidelines .......................52-53
Table 6-2: Metropolitan Council Land Use Compatibility Guidelines for Aircraft Noise .56
Table 7-1: LTCP Recommendations Estimated Costs ........................................................61
Table 8-1: LTCP Recommendations Implementation Schedule.........................................63
Table 9-1: LTCP Meeting Schedule .......................................................................................64
v
List of Figures
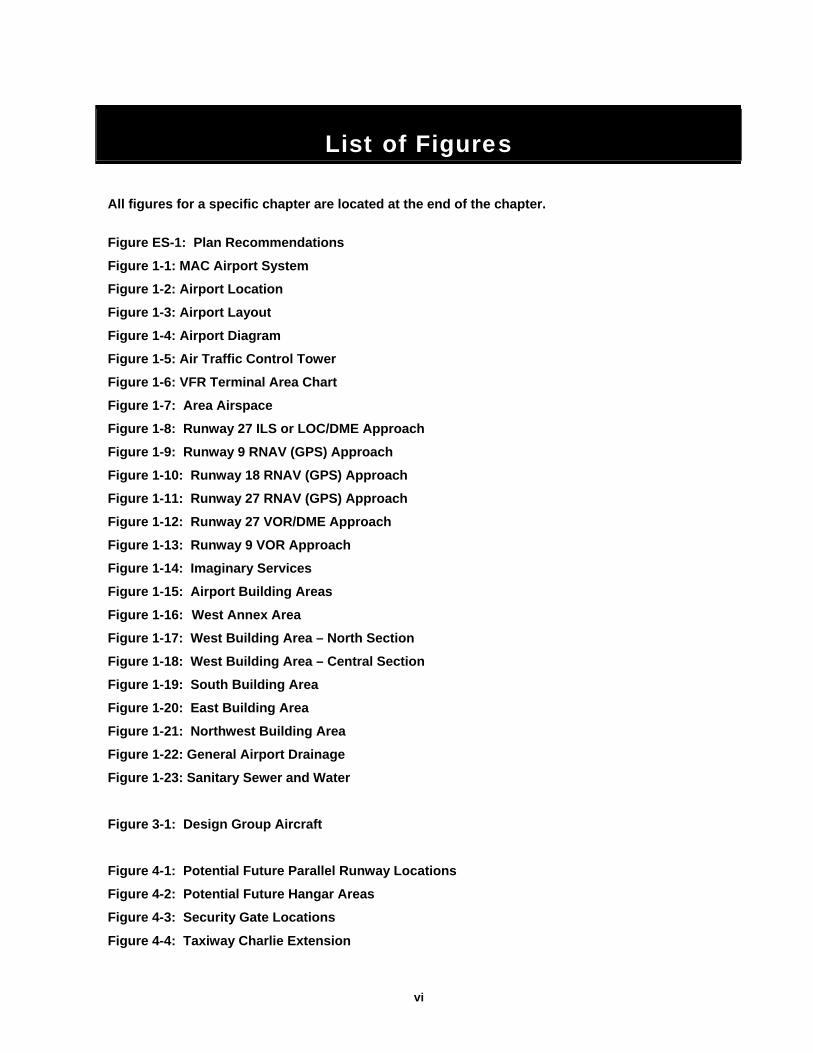
All figures for a specific chapter are located at the end of the chapter.
Figure ES-1: Plan Recommendations
Figure 1-1: MAC Airport System
Figure 1-2: Airport Location
Figure 1-3: Airport Layout
Figure 1-4: Airport Diagram
Figure 1-5: Air Traffic Control Tower
Figure 1-6: VFR Terminal Area Chart
Figure 1-7: Area Airspace
Figure 1-8: Runway 27 ILS or LOC/DME Approach
Figure 1-9: Runway 9 RNAV (GPS) Approach
Figure 1-10: Runway 18 RNAV (GPS) Approach
Figure 1-11: Runway 27 RNAV (GPS) Approach
Figure 1-12: Runway 27 VOR/DME Approach
Figure 1-13: Runway 9 VOR Approach
Figure 1-14: Imaginary Services
Figure 1-15: Airport Building Areas
Figure 1-16: West Annex Area
Figure 1-17: West Building Area – North Section
Figure 1-18: West Building Area – Central Section
Figure 1-19: South Building Area
Figure 1-20: East Building Area
Figure 1-21: Northwest Building Area
Figure 1-22: General Airport Drainage
Figure 1-23: Sanitary Sewer and Water
Figure 3-1: Design Group Aircraft
Figure 4-1: Potential Future Parallel Runway Locations
Figure 4-2: Potential Future Hangar Areas
Figure 4-3: Security Gate Locations Figure 4-4: Taxiway Charlie Extension
vi
Figure 4-5: Xylite Street Relocation
Figure 4-6: Potential Concurrent Use / Development Parcels
Figure 5-1: Sound Levels of Typical Noise Sourses (dBA)
Figure 5-2: Typical Range of Outdoor Community Day-Night Average Sound Levels
Figure 5-3a: Fixed Wing INM Tracks – Runway 27
Figure 5-3b: Fixed Wing INM Tracks – Runway 36
Figure 5-3c: Fixed Wing INM Tracks – Runway 9
Figure 5-3d: Fixed Wing INM Tracks – Runway 18
Figure 5-3e: Helicopter INM Tracks
Figure 5-3f: Touch and Go INM Tracks
Figure 5-4: 2007 Base Contours
Figure 5-5: 2025 Preferred Alternative Contours
Figure 6-1: 2007 RPZs and State Zones
Figure 6-2: 2007 Base Contours with 2005 Land Use
Figure 6-3: RPZs and State Zones with 2005 Land Use
Figure 6-4: 2025 Preferred Alternative with 2005 Land Use
vii
Executive Summary The Anoka County – Blaine Airport is one of seven airports owned and operated by the Metropolitan Airports Commission (MAC). The airport identifier, or reference code, is ANE. This airport has played an important role in the Twin Cities since the airport was acquired by MAC in 1950. The airport is located in the southern part of Anoka County and the City of Blaine, approximately 12 miles from downtown Minneapolis and 12 miles from downtown St. Paul. It is considered by the MAC to be a primary reliever airport for the main Minneapolis – St. Paul International Airport (MSP). In a 2005 economic report prepared by MAC, its contribution to the local economy was estimated to be more than $35 million annually. This comprehensive planning document serves as a frame work for future development activity at the airport. This report follows guidelines set forth by the Federal Aviation Administration (FAA) and the Metropolitan Council. The last long term plan for Anoka County – Blaine was completed in 2000. Since that time, MAC has completed environmental reviews and implemented recommendations from that plan.
ES.1 Report Organization
This report is organized into the following chapters:
1. Existing Conditions / Inventory 2. Aviation Forecasts 3. Airside and Landside Facility Requirements 4. Plan Recommendations 5. Environmental Considerations 6. Land Use Compatibility 7. Capital Improvement Program Costs 8. Facility Implementation Schedule 9. Public Information Process
The inventory of existing conditions is used to establish a baseline of facilities and services available at the airport. The forecasts are used to determine the type of activity likely to occur at the airport and at what projected levels. Facility requirements use the forecasts to determine what facilities will be required to support the level of activity indicated by the forecast. The projected facility needs are compared to the existing infrastructure to determine if additional facilities at the airport will be needed in the future. The plan recommendations chapter identifies improvements considered for the airport. The environmental considerations and land use sections discuss the existing conditions and proposed recommendations in relation to environmental issues, such as noise, and surrounding land use compatibility. The last sections identify the preferred alternative project items, costs and the proposed timeline for implementation. The final section outlines the public information program that was followed, and summarizes any comments received during the document development process.
viii
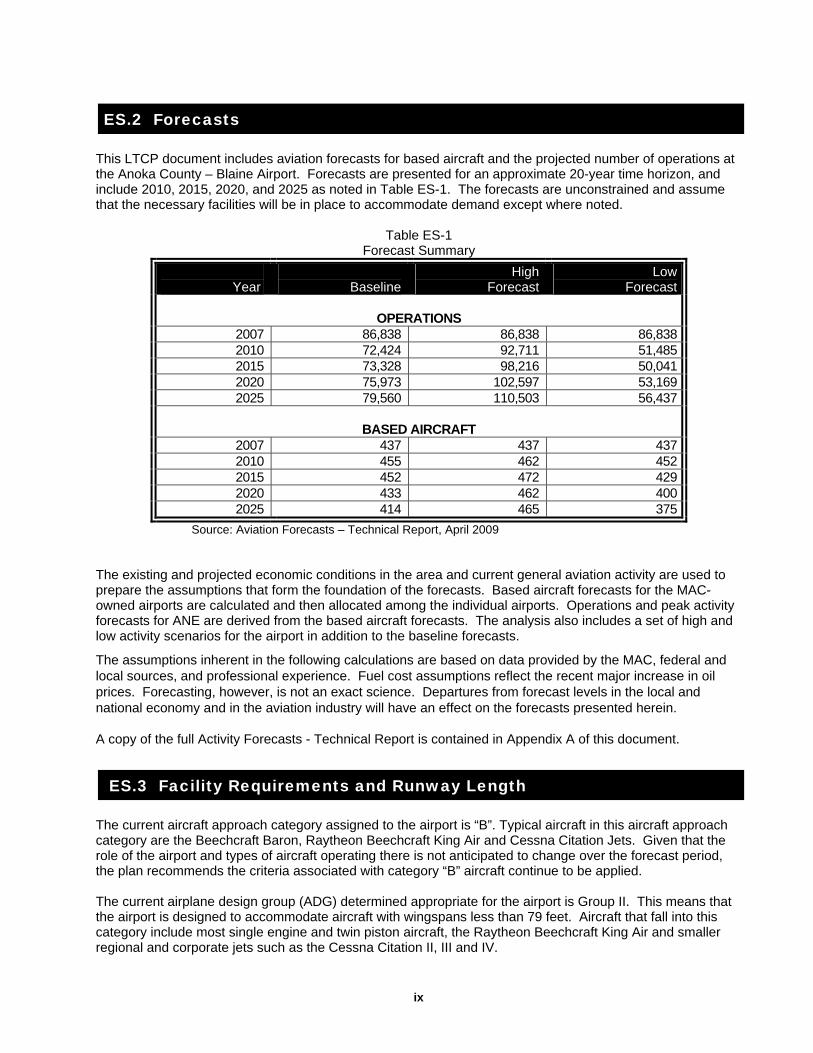
ES.2 Forecasts
This LTCP document includes aviation forecasts for based aircraft and the projected number of operations at the Anoka County – Blaine Airport. Forecasts are presented for an approximate 20-year time horizon, and include 2010, 2015, 2020, and 2025 as noted in Table ES-1. The forecasts are unconstrained and assume that the necessary facilities will be in place to accommodate demand except where noted.
Table ES-1
Forecast Summary Year
Baseline
High Forecast
LowForecast
OPERATIONS
2007 86,838 86,838 86,8382010 72,424 92,711 51,4852015 73,328 98,216 50,0412020 75,973 102,597 53,1692025 79,560 110,503 56,437
BASED AIRCRAFT 2007 437 437 4372010 455 462 4522015 452 472 4292020 433 462 4002025 414 465 375
Source: Aviation Forecasts – Technical Report, April 2009 The existing and projected economic conditions in the area and current general aviation activity are used to prepare the assumptions that form the foundation of the forecasts. Based aircraft forecasts for the MAC-owned airports are calculated and then allocated among the individual airports. Operations and peak activity forecasts for ANE are derived from the based aircraft forecasts. The analysis also includes a set of high and low activity scenarios for the airport in addition to the baseline forecasts.
The assumptions inherent in the following calculations are based on data provided by the MAC, federal and local sources, and professional experience. Fuel cost assumptions reflect the recent major increase in oil prices. Forecasting, however, is not an exact science. Departures from forecast levels in the local and national economy and in the aviation industry will have an effect on the forecasts presented herein.
A copy of the full Activity Forecasts - Technical Report is contained in Appendix A of this document.
ES.3 Facility Requirements and Runway Length
The current aircraft approach category assigned to the airport is “B”. Typical aircraft in this aircraft approach category are the Beechcraft Baron, Raytheon Beechcraft King Air and Cessna Citation Jets. Given that the role of the airport and types of aircraft operating there is not anticipated to change over the forecast period, the plan recommends the criteria associated with category “B” aircraft continue to be applied. The current airplane design group (ADG) determined appropriate for the airport is Group II. This means that the airport is designed to accommodate aircraft with wingspans less than 79 feet. Aircraft that fall into this category include most single engine and twin piston aircraft, the Raytheon Beechcraft King Air and smaller regional and corporate jets such as the Cessna Citation II, III and IV.
ix
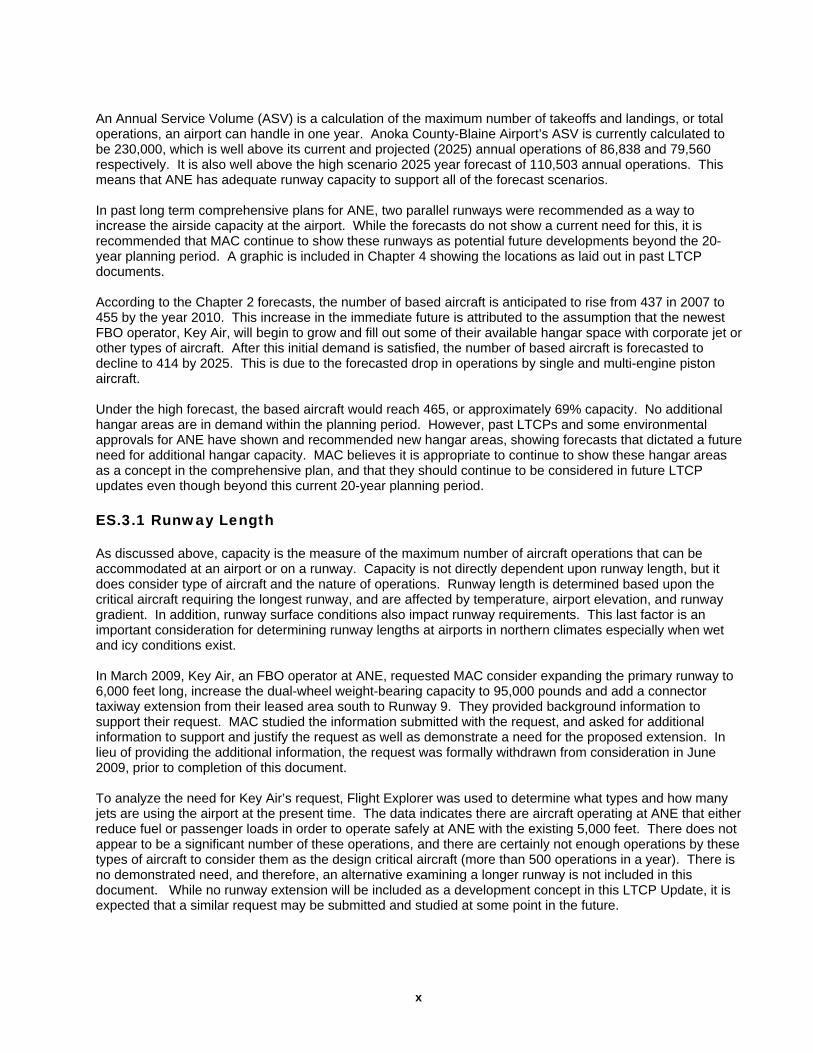
An Annual Service Volume (ASV) is a calculation of the maximum number of takeoffs and landings, or total operations, an airport can handle in one year. Anoka County-Blaine Airport’s ASV is currently calculated to be 230,000, which is well above its current and projected (2025) annual operations of 86,838 and 79,560 respectively. It is also well above the high scenario 2025 year forecast of 110,503 annual operations. This means that ANE has adequate runway capacity to support all of the forecast scenarios. In past long term comprehensive plans for ANE, two parallel runways were recommended as a way to increase the airside capacity at the airport. While the forecasts do not show a current need for this, it is recommended that MAC continue to show these runways as potential future developments beyond the 20-year planning period. A graphic is included in Chapter 4 showing the locations as laid out in past LTCP documents. According to the Chapter 2 forecasts, the number of based aircraft is anticipated to rise from 437 in 2007 to 455 by the year 2010. This increase in the immediate future is attributed to the assumption that the newest FBO operator, Key Air, will begin to grow and fill out some of their available hangar space with corporate jet or other types of aircraft. After this initial demand is satisfied, the number of based aircraft is forecasted to decline to 414 by 2025. This is due to the forecasted drop in operations by single and multi-engine piston aircraft. Under the high forecast, the based aircraft would reach 465, or approximately 69% capacity. No additional hangar areas are in demand within the planning period. However, past LTCPs and some environmental approvals for ANE have shown and recommended new hangar areas, showing forecasts that dictated a future need for additional hangar capacity. MAC believes it is appropriate to continue to show these hangar areas as a concept in the comprehensive plan, and that they should continue to be considered in future LTCP updates even though beyond this current 20-year planning period. ES.3.1 Runway Length
As discussed above, capacity is the measure of the maximum number of aircraft operations that can be accommodated at an airport or on a runway. Capacity is not directly dependent upon runway length, but it does consider type of aircraft and the nature of operations. Runway length is determined based upon the critical aircraft requiring the longest runway, and are affected by temperature, airport elevation, and runway gradient. In addition, runway surface conditions also impact runway requirements. This last factor is an important consideration for determining runway lengths at airports in northern climates especially when wet and icy conditions exist. In March 2009, Key Air, an FBO operator at ANE, requested MAC consider expanding the primary runway to 6,000 feet long, increase the dual-wheel weight-bearing capacity to 95,000 pounds and add a connector taxiway extension from their leased area south to Runway 9. They provided background information to support their request. MAC studied the information submitted with the request, and asked for additional information to support and justify the request as well as demonstrate a need for the proposed extension. In lieu of providing the additional information, the request was formally withdrawn from consideration in June 2009, prior to completion of this document. To analyze the need for Key Air’s request, Flight Explorer was used to determine what types and how many jets are using the airport at the present time. The data indicates there are aircraft operating at ANE that either reduce fuel or passenger loads in order to operate safely at ANE with the existing 5,000 feet. There does not appear to be a significant number of these operations, and there are certainly not enough operations by these types of aircraft to consider them as the design critical aircraft (more than 500 operations in a year). There is no demonstrated need, and therefore, an alternative examining a longer runway is not included in this document. While no runway extension will be included as a development concept in this LTCP Update, it is expected that a similar request may be submitted and studied at some point in the future.
x
In order for a runway extension beyond 5,000 feet to be considered, there are several things that would need to be accomplished including, but not limited to:
• A request to study additional runway length must be received or existing use of the airport may identify a need to study longer runway lengths;
• MAC would need to determine if it is appropriate to update or amend the Long Term Comprehensive Plan, and the timing for such action;
• *The LTCP would need to provide adequate justification and show a demonstrated need in order for a runway extension to be identified as a preferred alternative;
• *The LTCP would also study whether it is appropriate to change the classification of the airport;
• *Minnesota State Statute 473.641 would need to be changed to allow for runways longer than 5,000 feet at Minor Airports such as the Anoka County – Blaine Airport;
• *Metropolitan Council would need to determine that the LTCP is consistent with their Development Guide;
• *MAC would need to adopt a LTCP that includes a longer runway as the preferred alternative;
• *An environmental review process is required – a State Environmental Impact Statement and a Federal Environmental Assessment (if federal funds are to be pursued), including but not limited to examination of potential impacts to wetlands, storm water, airport noise, land use, wildlife and plant species, historic/archeological areas, and air quality;
• The Airport Layout Plan would need to be updated to show the proposed runway extension and other associated changes, and be approved by the FAA;
• Funding for all of the necessary studies and construction implementation would need to be procured.
An asterisk (*) denotes steps that have a public involvement process.
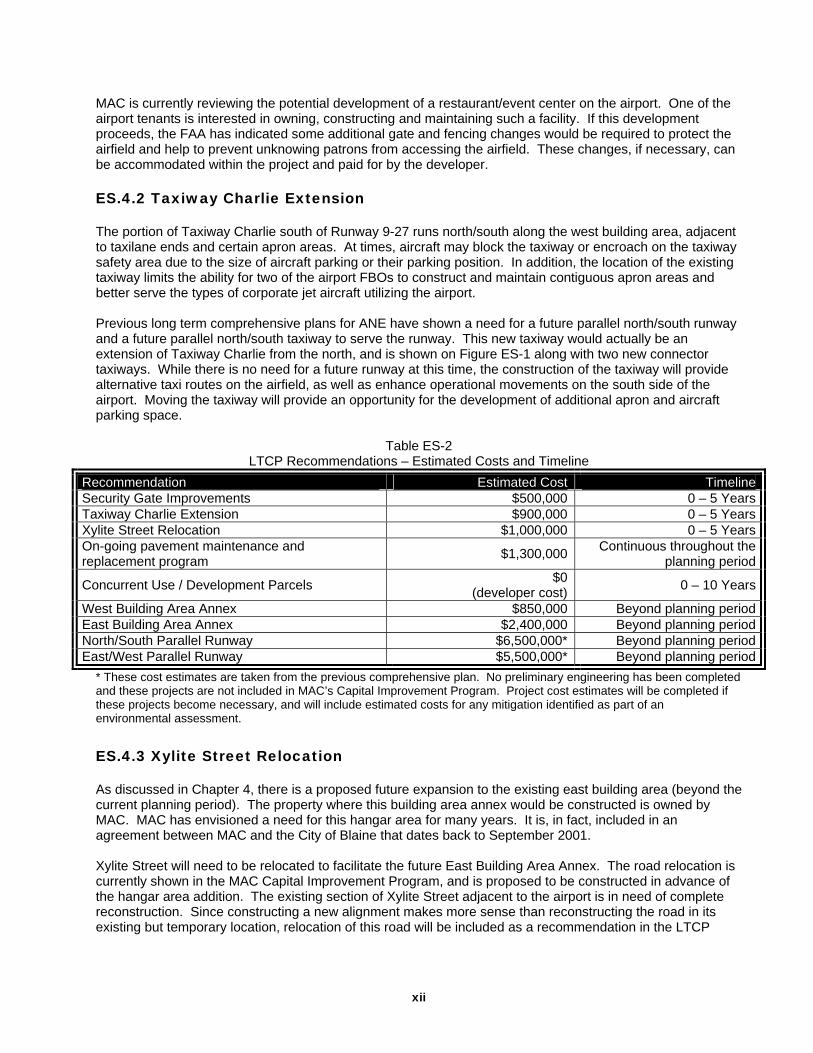
ES.4 Plan Recommendations
As discussed above, there is no demonstrated need for additional runways, runway extensions or new hangar areas at the Anoka County – Blaine Airport at this time. However, the parallel runways and future hangar areas are listed in the estimated cost table even though they are considered beyond this current 20-year planning period (see Table ES-2). In addition, there are various airside and landside improvements that are recommended for implementation. They are itemized below and shown on Figure ES-1. Estimated costs and implementation timelines are listed in Table ES-2.
ES.4.1 Security Gates
All three airport entrance roads have power-operated automatic gates. These gates remain closed until a vehicle approaches, at which time they open for a short time then close again. The combined size and weight of the gates themselves in conjunction with the repetitive operation has resulted in high maintenance requirements for the gates. Improvements to the existing security gate system are recommended, including updating existing gates to dual-operator systems, modifying gate locations, and installing additional fencing. Figure ES-1 identifies the existing gate locations.
xi
MAC is currently reviewing the potential development of a restaurant/event center on the airport. One of the airport tenants is interested in owning, constructing and maintaining such a facility. If this development proceeds, the FAA has indicated some additional gate and fencing changes would be required to protect the airfield and help to prevent unknowing patrons from accessing the airfield. These changes, if necessary, can be accommodated within the project and paid for by the developer. ES.4.2 Taxiway Charlie Extension
The portion of Taxiway Charlie south of Runway 9-27 runs north/south along the west building area, adjacent to taxilane ends and certain apron areas. At times, aircraft may block the taxiway or encroach on the taxiway safety area due to the size of aircraft parking or their parking position. In addition, the location of the existing taxiway limits the ability for two of the airport FBOs to construct and maintain contiguous apron areas and better serve the types of corporate jet aircraft utilizing the airport. Previous long term comprehensive plans for ANE have shown a need for a future parallel north/south runway and a future parallel north/south taxiway to serve the runway. This new taxiway would actually be an extension of Taxiway Charlie from the north, and is shown on Figure ES-1 along with two new connector taxiways. While there is no need for a future runway at this time, the construction of the taxiway will provide alternative taxi routes on the airfield, as well as enhance operational movements on the south side of the airport. Moving the taxiway will provide an opportunity for the development of additional apron and aircraft parking space.
Table ES-2
LTCP Recommendations – Estimated Costs and Timeline Recommendation Estimated Cost TimelineSecurity Gate Improvements $500,000 0 – 5 YearsTaxiway Charlie Extension $900,000 0 – 5 YearsXylite Street Relocation $1,000,000 0 – 5 YearsOn-going pavement maintenance and replacement program $1,300,000 Continuous throughout the
planning period
Concurrent Use / Development Parcels $0 (developer cost) 0 – 10 Years
West Building Area Annex $850,000 Beyond planning periodEast Building Area Annex $2,400,000 Beyond planning periodNorth/South Parallel Runway $6,500,000* Beyond planning periodEast/West Parallel Runway $5,500,000* Beyond planning period
* These cost estimates are taken from the previous comprehensive plan. No preliminary engineering has been completed and these projects are not included in MAC’s Capital Improvement Program. Project cost estimates will be completed if these projects become necessary, and will include estimated costs for any mitigation identified as part of an environmental assessment.
ES.4.3 Xylite Street Relocation
As discussed in Chapter 4, there is a proposed future expansion to the existing east building area (beyond the current planning period). The property where this building area annex would be constructed is owned by MAC. MAC has envisioned a need for this hangar area for many years. It is, in fact, included in an agreement between MAC and the City of Blaine that dates back to September 2001. Xylite Street will need to be relocated to facilitate the future East Building Area Annex. The road relocation is currently shown in the MAC Capital Improvement Program, and is proposed to be constructed in advance of the hangar area addition. The existing section of Xylite Street adjacent to the airport is in need of complete reconstruction. Since constructing a new alignment makes more sense than reconstructing the road in its existing but temporary location, relocation of this road will be included as a recommendation in the LTCP
xii
Update. In addition, the necessary environmental study and permitting has been completed for the street relocation. ES.4.4 Pavement Maintenance Program
Continued pavement reconstruction and rehabilitation as part of MAC’s on-going pavement maintenance program is included as a recommendation.
ES.4.5 Concurrent Use / Development Parcels
Continued research for and potential development of concurrent land uses for the purposes of generating revenue on airport property is included as a recommendation. ES.4.6 Agency Coordination
MAC will continue cooperation with the cities surrounding the airport through the existing Anoka County Airport Advisory Commission and on-going MAC/City staff interaction.
ES.5 Noise Contours and Land Use
The noise contours presented in this document were developed using INM Version 7.0a. The contours represent predicted levels, or noise contours, of equal aircraft noise exposure on the ground as expressed in DNL. The FAA currently suggests that three different DNL levels (65, 70, and 75 DNL) be modeled. The Metropolitan Council suggests that the 60 DNL contour be included for airports in an urban environment. The methodology utilized the following data: aircraft activity levels, fleet mix, day/night split of operations, flight tracks and runway use.
In the 2007 Baseline Noise Contours there are 45 single-family homes located in the 60 DNL contour around Anoka County - Blaine Airport. The 60 DNL contour contains approximately 0.96 square miles. The 65 DNL contour contains approximately 0.43 square miles with no residential dwellings in the contour. The entire 70 DNL contour is contained on the airport property, essentially overlying the areas immediately adjacent to the runways. The 2007 70 and 75 DNL contours contain 0.21 square miles and 0.09 square miles, respectively.
The Forecast 2025 noise contours around Anoka County - Blaine Airport contain approximately 0.97 square miles in the 60 DNL contour and approximately 0.43 square miles in the 65 DNL contour. The residential structures within the 60 DNL contour decrease from 45 to 12 single family homes. There are no residential units in the 2025 65 DNL contour. The 70 and 75 DNL contours contain 0.21 square miles and 0.09 square miles, respectively, with no residential structures in the contours. The 2025 noise contours are shown in Figure 5-5.
In summary, there will be a 1 percent increase in the 60 DNL contour, while the 65 DNL and greater contours remain relatively unchanged. Although there is a slight increase in the size of the 60 DNL contour, there is a decrease of 33 single family homes in the contour. The growth in the 60 DNL contour occurs primarily to the east of the airport over uninhabited non-residential areas. This can be attributed to more west-bound jet aircraft operations arriving on Runway 27 and east-bound departing from Runway 09.
Planning for the maintenance and development of airport facilities is a complex process. Successfully developing airports requires pragmatic decision-making predicated on various facts that drive the need for the development of additional airport infrastructure. Furthermore, these efforts need to consider surrounding community land uses. Airports cannot be developed in a vacuum; the development effort must consider the needs of the surrounding populations and the land uses in the area surrounding the airport. The success of
xiii
airport planning is predicated on close consideration and coordination of surrounding land use to ensure compatibility with the community surrounding the airport. The Metropolitan Council has developed a set of land-use planning guidelines for responsible community development in the Minneapolis-St. Paul Metropolitan Area. The intent is to provide city governments with a comprehensive resource with regard to planning community development in a manner that considers adequacy, quality and environmental elements of planned land-uses. The State of Minnesota Department of Transportation (Mn/DOT) has established regulations that control the type of development allowed off runway ends in order to prevent incompatible development. These guidelines should be used to establish zoning ordinances to protect areas around an airport. The states zoning areas overlay and extend beyond the RPZs. The most restrictive areas created by Mn/DOT regulations are called State Safety Zones A and B. The safety zones should exist off each runway end and follow the approach zones out to the total length of the runway. As defined by Mn/DOT, the recommended length of Safety Zone A is 2/3 of the total runway length; Safety Zone B is 1/3 of the total runway length and extends from Safety Zone A. There is also an area called Safety Zone C which is circular and typically follows the FAA FAR Part 77 horizontal surface. Chapter 6 details the land use compatibility for both the existing and preferred alternative runway protection zones and state safety zones. For each runway end, the number of acres and types of land use are summarized. In addition, there is a discussion on the status of the Joint Airport Zoning Board (JAZB).
ES.6 Public Involvement Process
At the onset of this long term comprehensive plan update process, a public involvement program was developed. It included a specific plan for group meetings. The meetings held as part of this public process are listed in Table 9-1. The purpose of the meetings was to inform the airport users and the public about the process and schedule, and offer an opportunity for question-and-answer sessions. The goal was to receive informal input as the process advanced, and prior to the formal public comment period that took place upon completion of the full draft document. In addition, MAC held two meetings and corresponded regularly with a technical advisory group, made up of members of MAC staff, the FAA, Mn/DOT Aeronautics, and Metropolitan Council. Informal comments were accepted at all meetings. The MAC committee meetings were open to the public, and verbal comments were invited at each of them. Meetings with the Anoka County Airport Advisory Commission typically involved a short presentation by MAC followed by a question and answer period. During the long term comprehensive plan drafting process, MAC solicited informal written or verbal comments regarding the LTCP Update. Advertisements for the MAC public open house meeting were published in the Pioneer Press on June 10, 2009 and in the MN Sun: Blaine – Spring Lake Life on June 12, 2009. The open house was held on June 24, 2009, and 39 people signed the attendance sheet. As of July 2009, MAC had received 15 written comments. MAC also received summary minutes of the June 24 meeting from the Anoka Airport tenant representative on the Reliever Airport Advisory Council. All correspondence received prior to the 30-day written public comment period are included in Appendix B. The draft LTCP document was completed in November, 2009, and made available for a 30-day written comment period starting November 23, 2009. The comment period ended on December 22, 2009. Advertisements for the 30-day public written comment period on the draft LTCP were published in the Pioneer Press and Star Tribune newspapers on November 19, 2009 and in the Blaine – Spring Lake Life on November 20, 2009.
xiv
xv
Upon completion of the written comment period on December 22, 2009, MAC received two letters from adjacent cities and three e-mailed comments. The letters from the City of Blaine, the City of Circle Pines, the three e-mails from residents, and MAC’s responses to them are included in Appendix B. In February 2010, MAC submitted the draft LTCP document, along with all written comments received and MAC responses to those comments, to the Metropolitan Council for their review. The Metropolitan Council issued their determination in April 2010, finding the LTCP Update consistent with the Metropolitan Council’s development guide. Correspondence from the Metropolitan Council has been included in Appendix B. In June 2010, the Commission took action to adopt this LTCP as the final plan. MAC is committed to preparing updates to this LTCP on a regular basis.
Chapter
1 Existing Conditions/Inventory
1.1 Airport History and Location
The Anoka County – Blaine Airport is one of seven airports owned and operated by the Metropolitan Airports Commission (MAC). See Figure 1-1. The airport identifier, or reference code, is ANE. This airport has played an important role in the Twin Cities since the airport was acquired by MAC in 1950. Located approximately 12 miles from downtown Minneapolis and 12 miles from downtown St. Paul, the airport is considered by the MAC to be a primary reliever airport for the Minneapolis – St. Paul International Airport (MSP). In a 2005 economic report prepared by MAC, its contribution to the local economy was estimated to be more than $35 million annually. The airport is located in the southern part of Anoka County and the City of Blaine. It can be accessed from U.S. Highway 10 from the south, MN State Highway 65 (Central Avenue) from the west, and County Road 52 from the north and east. See Figures 1-2 and 1-3. MAC acquired the airport in 1950. At that time, the primary north-south runway was 5,900 feet in length. In the mid-1960’s, this runway was reduced to its current 4,855 feet. The east-west runway was 3,200 feet, but was extended to 4,000 feet in 1992. The east side hangar area was constructed in 1986, with expansion occurring in 1991. In 1994, MAC constructed the west building area. An air traffic control tower was opened in 1996. In 2006, MAC extended the east-west runway to 5,000 feet and an instrument approach system was installed. MAC owns approximately 1,860 acres of airport property. The Anoka County – Blaine Airport has a significant planning history and previous airport studies. This history has played a significant role in the current layout and status of the airport as it exists today. The following highlights some of the more significant chronology: • In 1983, an Airport Master Plan was adopted by MAC. The plan recommended a total of four runways,
parallels in each direction for the 20-year planning period. It retained the existing north/south runway length at 4,855 feet and added a shorter 3,200 foot long parallel, primarily for flight training activity. Similarly, for the east/west direction, a short (3,200 foot) training runway was envisioned. For future hangar building area, the plan included new hangar areas on the east and west sides of the airport as well as to the northwest.
• In 1986, the Federal/State Environmental Impact Statement (EIS) was completed. The EIS addressed
specifically shifting the north/south runway further north, away from Mounds View, addition of 800 feet to the east/west runway (for a total of 4,000 feet), the development of two new hangar areas, some taxiway changes and acquisition of a small land parcel adjacent to the airport. During development of the EIS, the north/south runway was shifted further north (2,580 feet instead of 950 feet).
• In July 1986, a Stipulation Agreement was executed between the Metropolitan Council, the MAC and the
City of Mounds View within which it was agreed that certain things (listed below) be accomplished. The agreement stipulated that:
a. The airport be developed as a Minor use facility as defined by the Metropolitan Development Guide as of the date of the Agreement (7/28/86), i.e., 5,000 foot runway is acceptable;
b. The southerly 2,580 feet of the existing north/south runway be removed and the addition of 2,580 feet be added north of the existing east/west runway;
c. The east/west runway be extended 800 feet to the east for a total 4,000 feet, consistent with the earlier Development Guide criteria;
d. The installation and use of precision instrumentation be confined to the east/west runway; e. MAC adopt field rules consistent with Master Plan to define safe and efficient airspace use; and f. MAC develops a long-term comprehensive plan to include a noise abatement strategy.
1
• Between 1988 and 1993, projects some studied in the 1986 EIS were implemented. These projects included an 800-foot extension of the east/west runway, expansion of the east building area, and initial development of the west building area.
• On January 20, 1998, the MAC adopted the Long Term Comprehensive Plan (LTCP) for the Anoka County-Blaine Airport and directed that the Plan be submitted to the Metropolitan Council for a determination of consistency with the Metropolitan Development Guide. The list of recommendations in the LTCP Update included:
a. Extend the east/west runway from 4,000 to 5,000 feet and widen the runway from 75-feet to 100-feet;
b. Install a precision instrument approach and an approach lighting system on the east/west runway; c. Construct parallel runways in both directions to increase the annual service volume to 355,000
operations; d. Expand hangar areas in the east building area and northwest portion of the airport; e. Construct a compass calibration pad on the airfield; f. Relocate the north/south taxiway; g. Widen taxiways to the MAC standard 40-feet width; h. Develop a golf/outdoor recreational complex in the northwest portion of airport property; and i. Work with the City to construct a frontage road along Highway 65 on airport property.
• On September 23, 1998, the Metropolitan Council requested MAC to withdraw the LTCP because of
pending litigation. On October 8, 1998 the Ramsey County District Court, at Mounds View’s request, ordered MAC to withdraw the long-term plan from consideration by the Council.
• On September 20, 1999, the Second Judicial District Court ordered that a Motion for Summary Judgment
favoring the Metropolitan Council and the Metropolitan Airports Commission be granted. • On January 13, 2000, the MAC requested that the Metropolitan Council re-initiate, as soon as possible,
the review process for the ANE Long Term Comprehensive Plan.
• The MAC/City of Mounds View/Metropolitan Council “debate” became an issue in the Year 2000 Minnesota Legislative session. Following weeks of debate and hearings, Legislation was passed that defined, in law, that a Minor Airport has runways no longer than 5,000 feet.
• On August 30, 2000, the Metropolitan Council concludes its review of the Anoka County-Blaine Long
Term Comprehensive Plan and declares it consistent with the Metropolitan Development Guide. Since the adoption of the 2000 LTCP, MAC has implemented many of the proposed improvements. A Federal Environmental Assessment and State Environmental Impact Statement joint document was completed in January 2003 that reviewed potential impacts from the proposed 5,000 foot runway. Items from the 2000 LTCP that have been constructed include the 5,000 foot east/west runway, installation of a precision approach landing system, construction of a compass calibration pad, development of a youth golf course facility, and construction of the Highway 65 frontage road. Table 1-1 lists the airfield development timeline. Figure 1-4 shows the current Airport Diagram. Figure 1-5 shows a picture of the Air Traffic Control Tower.
1.2 Airport Role
The definition of “classification” for an airport differs slightly between the MAC, Federal Aviation Administration (FAA), Minnesota Department of Transportation – Aeronautics (Mn/DOT), and the Metropolitan Council.
2
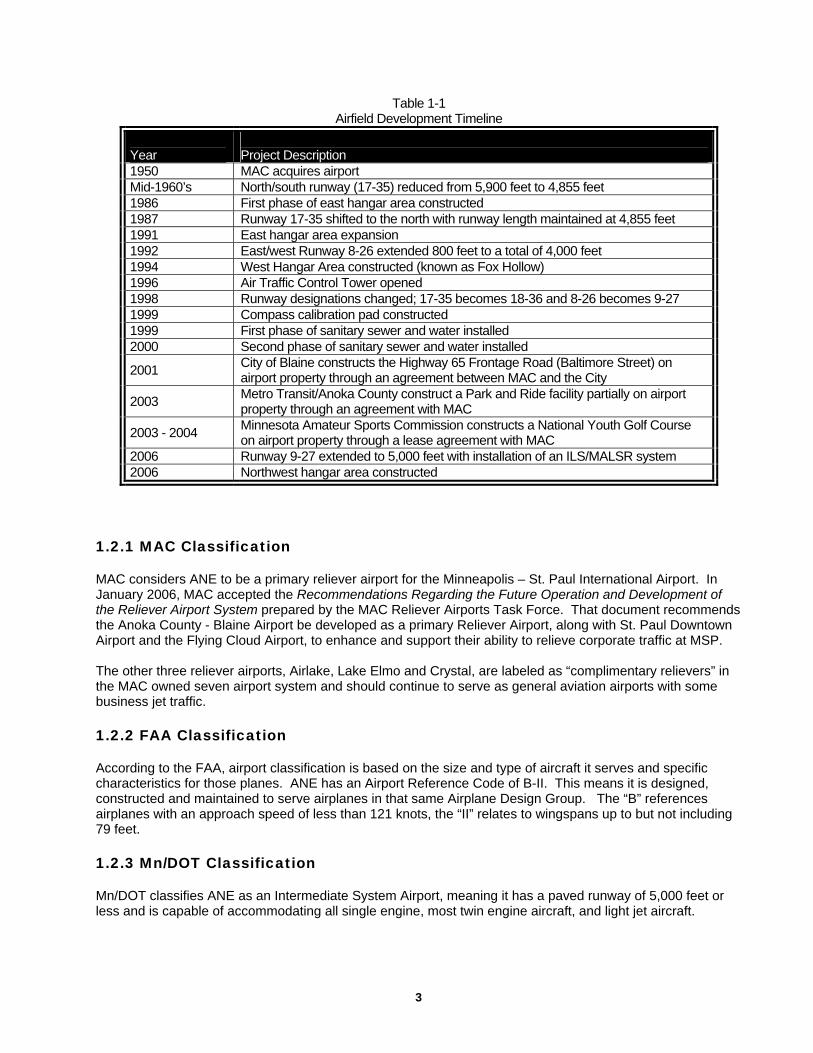
Table 1-1 Airfield Development Timeline
Year
Project Description
1950 MAC acquires airport Mid-1960’s North/south runway (17-35) reduced from 5,900 feet to 4,855 feet 1986 First phase of east hangar area constructed 1987 Runway 17-35 shifted to the north with runway length maintained at 4,855 feet 1991 East hangar area expansion 1992 East/west Runway 8-26 extended 800 feet to a total of 4,000 feet 1994 West Hangar Area constructed (known as Fox Hollow) 1996 Air Traffic Control Tower opened 1998 Runway designations changed; 17-35 becomes 18-36 and 8-26 becomes 9-27 1999 Compass calibration pad constructed 1999 First phase of sanitary sewer and water installed 2000 Second phase of sanitary sewer and water installed
2001 City of Blaine constructs the Highway 65 Frontage Road (Baltimore Street) on airport property through an agreement between MAC and the City
2003 Metro Transit/Anoka County construct a Park and Ride facility partially on airport property through an agreement with MAC
2003 - 2004 Minnesota Amateur Sports Commission constructs a National Youth Golf Course on airport property through a lease agreement with MAC
2006 Runway 9-27 extended to 5,000 feet with installation of an ILS/MALSR system 2006 Northwest hangar area constructed
1.2.1 MAC Classification
MAC considers ANE to be a primary reliever airport for the Minneapolis – St. Paul International Airport. In January 2006, MAC accepted the Recommendations Regarding the Future Operation and Development of the Reliever Airport System prepared by the MAC Reliever Airports Task Force. That document recommends the Anoka County - Blaine Airport be developed as a primary Reliever Airport, along with St. Paul Downtown Airport and the Flying Cloud Airport, to enhance and support their ability to relieve corporate traffic at MSP. The other three reliever airports, Airlake, Lake Elmo and Crystal, are labeled as “complimentary relievers” in the MAC owned seven airport system and should continue to serve as general aviation airports with some business jet traffic. 1.2.2 FAA Classification
According to the FAA, airport classification is based on the size and type of aircraft it serves and specific characteristics for those planes. ANE has an Airport Reference Code of B-II. This means it is designed, constructed and maintained to serve airplanes in that same Airplane Design Group. The “B” references airplanes with an approach speed of less than 121 knots, the “II” relates to wingspans up to but not including 79 feet.
1.2.3 Mn/DOT Classification
Mn/DOT classifies ANE as an Intermediate System Airport, meaning it has a paved runway of 5,000 feet or less and is capable of accommodating all single engine, most twin engine aircraft, and light jet aircraft.
3
1.2.4 Metropolitan Council Classification
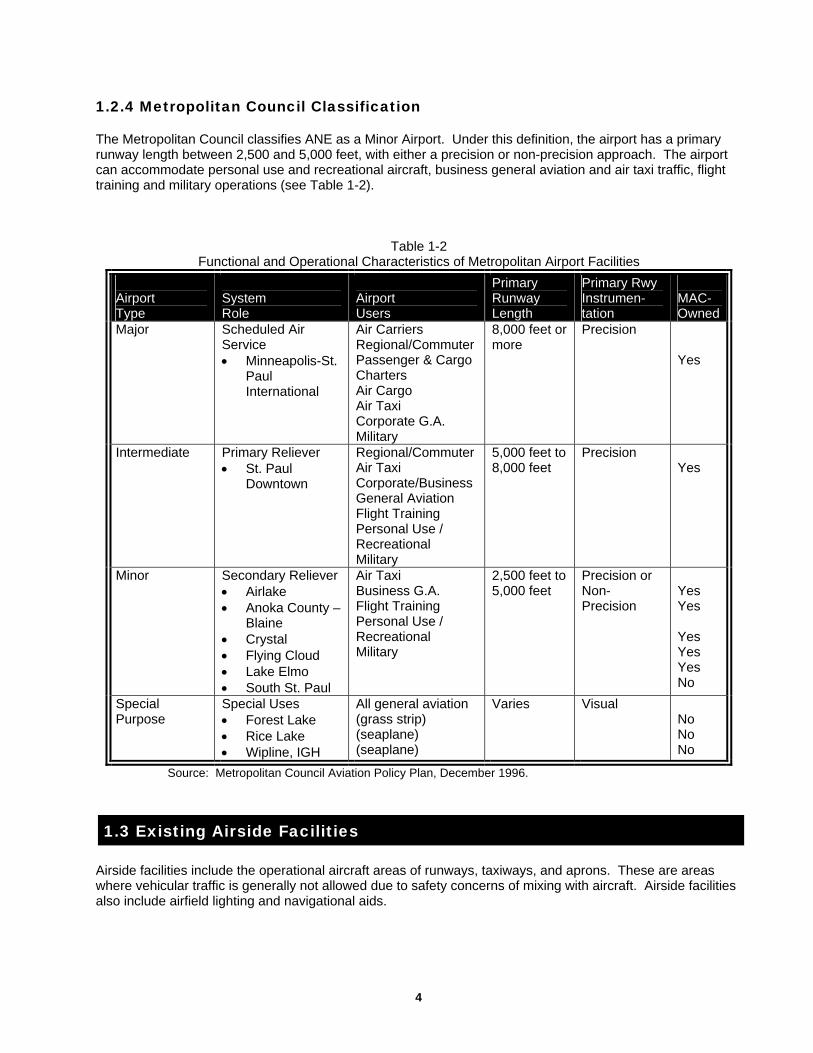
The Metropolitan Council classifies ANE as a Minor Airport. Under this definition, the airport has a primary runway length between 2,500 and 5,000 feet, with either a precision or non-precision approach. The airport can accommodate personal use and recreational aircraft, business general aviation and air taxi traffic, flight training and military operations (see Table 1-2).
Table 1-2 Functional and Operational Characteristics of Metropolitan Airport Facilities
Airport Type
System Role
Airport Users
Primary Runway Length
Primary Rwy Instrumen- tation
MAC-Owned
Major Scheduled Air Service • Minneapolis-St.
Paul International
Air Carriers Regional/Commuter Passenger & Cargo Charters Air Cargo Air Taxi Corporate G.A. Military
8,000 feet or more
Precision Yes
Intermediate Primary Reliever • St. Paul
Downtown
Regional/Commuter Air Taxi Corporate/Business General Aviation Flight Training Personal Use / Recreational Military
5,000 feet to 8,000 feet
Precision Yes
Minor Secondary Reliever • Airlake • Anoka County –
Blaine • Crystal • Flying Cloud • Lake Elmo • South St. Paul
Air Taxi Business G.A. Flight Training Personal Use / Recreational Military
2,500 feet to 5,000 feet
Precision or Non-Precision
Yes Yes Yes Yes Yes No
Special Purpose
Special Uses • Forest Lake • Rice Lake • Wipline, IGH
All general aviation (grass strip) (seaplane) (seaplane)
Varies Visual No No No
Source: Metropolitan Council Aviation Policy Plan, December 1996.
1.3 Existing Airside Facilities
Airside facilities include the operational aircraft areas of runways, taxiways, and aprons. These are areas where vehicular traffic is generally not allowed due to safety concerns of mixing with aircraft. Airside facilities also include airfield lighting and navigational aids.
4
1.3.1 Pavement Areas
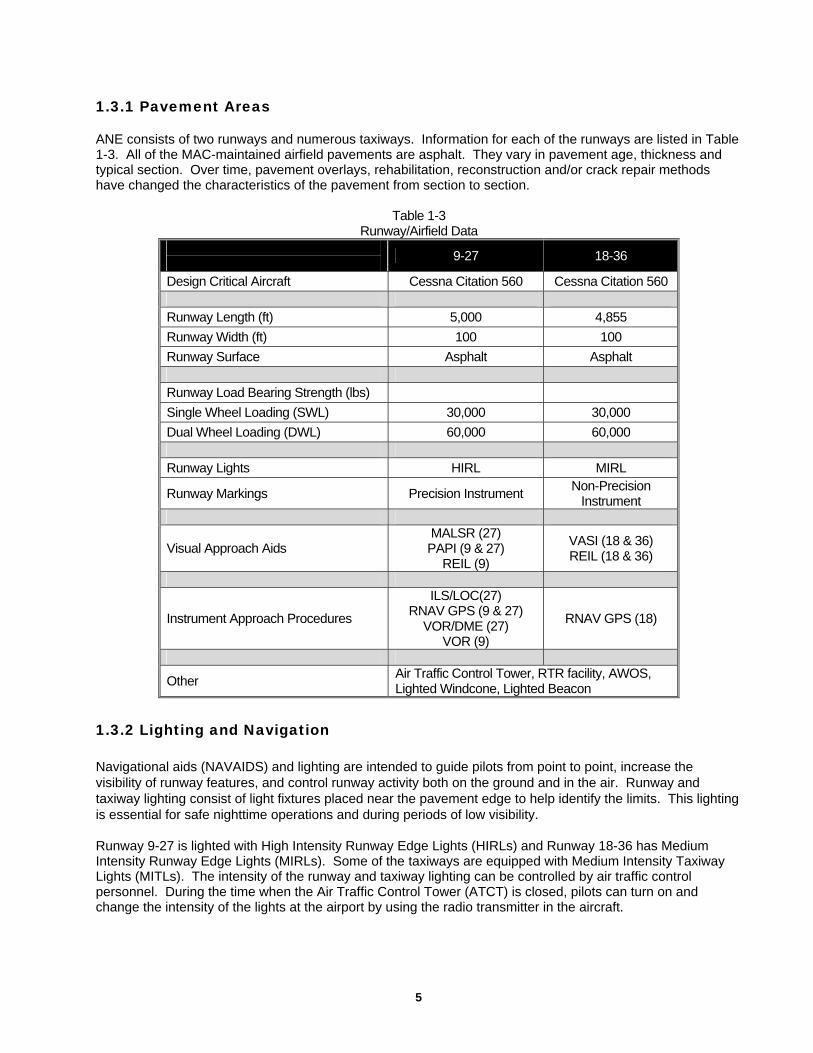
ANE consists of two runways and numerous taxiways. Information for each of the runways are listed in Table 1-3. All of the MAC-maintained airfield pavements are asphalt. They vary in pavement age, thickness and typical section. Over time, pavement overlays, rehabilitation, reconstruction and/or crack repair methods have changed the characteristics of the pavement from section to section.
Table 1-3 Runway/Airfield Data
9-27 18-36
Design Critical Aircraft Cessna Citation 560 Cessna Citation 560 Runway Length (ft) 5,000 4,855 Runway Width (ft) 100 100 Runway Surface Asphalt Asphalt Runway Load Bearing Strength (lbs) Single Wheel Loading (SWL) 30,000 30,000 Dual Wheel Loading (DWL) 60,000 60,000 Runway Lights HIRL MIRL
Runway Markings Precision Instrument Non-Precision Instrument
Visual Approach Aids MALSR (27) PAPI (9 & 27)
REIL (9)
VASI (18 & 36) REIL (18 & 36)
Instrument Approach Procedures
ILS/LOC(27) RNAV GPS (9 & 27)
VOR/DME (27) VOR (9)
RNAV GPS (18)
Other Air Traffic Control Tower, RTR facility, AWOS, Lighted Windcone, Lighted Beacon
1.3.2 Lighting and Navigation
Navigational aids (NAVAIDS) and lighting are intended to guide pilots from point to point, increase the visibility of runway features, and control runway activity both on the ground and in the air. Runway and taxiway lighting consist of light fixtures placed near the pavement edge to help identify the limits. This lighting is essential for safe nighttime operations and during periods of low visibility.
Runway 9-27 is lighted with High Intensity Runway Edge Lights (HIRLs) and Runway 18-36 has Medium Intensity Runway Edge Lights (MIRLs). Some of the taxiways are equipped with Medium Intensity Taxiway Lights (MITLs). The intensity of the runway and taxiway lighting can be controlled by air traffic control personnel. During the time when the Air Traffic Control Tower (ATCT) is closed, pilots can turn on and change the intensity of the lights at the airport by using the radio transmitter in the aircraft.
5
A Medium Intensity Approach Lighting System with Runway Alignment Indicator Lights (MALSR) extends 2,400 feet prior to the Runway 27 threshold. This system consists of a combination of flashing and steady burning lights and gives visual indicators during landing at the facility to transition from instrument flight to visual flight. Runways 9, 18 and 36 have runway end identifier lights (REILs). REILs are synchronized flashing lights to help pilots visually acquire the runway end as they approach for landing. Runways 9 and 27 have precision approach path indicators (PAPI) and Runways 18 and 36 have visual approach slope indicators (VASIs). The PAPI and VASI systems use a combination of red and white lights only visible at certain angles that help pilots determine appropriate angles of descent during landings.
En route NAVAIDS utilize ground-based transmission facilities to provide navigational fix information to properly-equipped aircraft. The Very High Frequency Omni-Directional Range (VOR) station designated as Gopher (GEP) is located 6.9 miles from the Airport. A VOR transmits radio signals 360 degrees in azimuth on a designated frequency. This information provides a tool for pilots to navigate point-to-point within the National Airspace System (NAS). This is particularly useful for low altitude and high altitude airway vectoring through the airspace surrounding the airport, as well as transition navigation into or out of the en route airspace structure. In addition to providing en-route navigational assistance to aircraft, VORs also allow for non-precision approaches thereby enhancing the capability of the airport. Anoka County Airport has four published non-precision instrument approaches to the airport (RNAV (GPS) and VOR).
There is one precision instrument approach at the airport. Navigation aids for this system include a glide slope and localizer with distance measuring equipment (DME). Runway 27 has an ILS or LOC/DME approach with ½ mile visibility minimums.
Lastly, the airport has a lighted airfield beacon and a lighted windcone.
1.3.3 Airspace Management System
The airspace around an airport is defined by FAA classification, air traffic control designation, navigational aids (NAVAIDS), other surrounding airports, and flight rules specific to the Anoka County Airport. The Federal Aviation Act of 1958 gave jurisdiction of all US airspace to the FAA. The National Airspace System (NAS) was hence established to manage this system safely and efficiently among commercial, general aviation, military and other competing users. It is a common network of NAVAIDS, airport and landing sites, charting and information, procedures, regulations, technical support, and resources. Figure 1-6 shows the airports, airspace and radio aids for navigation in the vicinity of the Anoka County Airport. 1.3.4 Airspace Structure
The airspace structure is complex and requires the use of highly technical air traffic control (ATC) procedures. Airspace is either controlled or uncontrolled. Controlled airspace is managed by ground-to-air communications, NAVAIDS and air traffic services. The Anoka County Airport is located in what is considered Class D, controlled airspace when the Air Traffic Control Tower is open (7:00 am to 10:00 pm May through September and 7:00 am to 9:00 pm October through April) and Class E airspace during the other times. Class D airspace is under the jurisdiction of a local Air Traffic Control Tower (ATCT). (See Figure 1-7). The purpose of the ATCT is to sequence arriving and departing aircraft and direct aircraft on the ground. Aircraft operating within this area are required to maintain radio communication with the ATCT. It is normally a circular area with a radius of five miles around the airport and extends upward from the surface to about 2,500 feet AGL. The ceiling elevation of Anoka County’s Class D airspace is 3,400 feet MSL (2,488 feet above the airport elevation of 912 feet).
When the ATCT is not operating at Anoka County, the airspace classification is Class E. Class E airspace is a general category of controlled airspace that is intended to provide air traffic service and separation for Instrument Flight Rules (IFR) aircraft from other aircraft. IFR means that the pilot is certified to fly under Instrument Meteorological Conditions (IMC) (less than three statute miles visibility and/or 1,000 foot ceilings). Pilots rated only for Visual Flight Rules (VFR) can operate in Class E airspace only when visibility is three
6
statute miles and above and cloud heights are 1,000 feet above ground level (AGL) and higher. These pilots are not required to maintain contact with ATC. Class E is a common classification for airports without air traffic control towers (ATCTs). Class E airspace typically extends to 18,000 feet mean sea level (MSL) and generally fills in the gaps between other classes of airspace in the United States. At ANE, Class E airspace extends from the surface up to the base of the MSP Class B airspace when the ATCT is closed.
The Anoka County Airport also lies under Minneapolis/ St. Paul International Airport’s (MSP) Class B Airspace which consists of controlled airspace normally extending upward from different floor elevations to a ceiling height of 10,000 feet MSL. There are very specific operating instructions and rules pilots must follow when flying within this airspace. Anoka County Airport lies under the area where the floor elevation is 4,000 feet MSL. As long as pilots stay below 4,000 feet they remain outside this MSP Class B airspace.
1.3.5 Delegation of Air Traffic Control Responsibilities
Anoka County Airport has its own Air Traffic Control Tower (ATCT). During the times when it is open, it provides air traffic control services. When the ATCT is closed services are provided by Minneapolis Terminal Radar Approach Control (TRACON) located at Minneapolis-St. Paul International Airport. Aircraft operating at Anoka County when the ATCT is closed are advised to broadcast their intentions and monitor Common Traffic Advisory Frequency (CTAF). Pilots making instrument approaches or departures are in contact with the ATCT or Minneapolis TRACON.
1.3.6 Approach Procedures and Traffic Patterns
There are two different types of flight rules set out in FAR Part 91. Visual Flight Rules (VFR) applies in generally good weather conditions based on visibility. Instrument Flight Rules (IFR) come into play when visibility levels fall to less than three statute miles and/or cloud levels go below 1,000 feet.
The local traffic pattern altitude is 1,912 feet MSL (1,000 feet above the airport elevation). All the runways follow standard left traffic pattern. The ATCT directs runway use when winds are calm (less than 5 knots).
Aircraft with IFR instrumentation can utilize established approach procedures at Anoka County Airport. IFR flight rules have specific departure and arrival instructions, flight routing, altitude assignment, and communication procedures that are required. As stated, it allows a pilot to operate in controlled airspace and operate in poor weather at appropriately-equipped airport facilities such as Anoka County. There is one precision instrument approach procedure and four non-precision instrument approach procedures established for Anoka County Airport. The ILS or LOC/DME RWY 27, RNAV (GPS) RWY 9, RNAV (GPS) RWY 18, RNAV (GPS) RWY 27, VOR/DME RWY 27, and VOR RWY 9 approaches are shown on Figures 1-8 to 1-13, respectively.
1.3.7 Imaginary Surfaces and Obstructions
FAR Part 77 is the guidance used to determine obstructions to navigational airspace. The surfaces are comprised of primary, approach, transitional, horizontal and conical three-dimensional imaginary surfaces. (See Figure 1-14.) Their exact configuration varies based upon the approach type of runway. Obstructions are defined as objects that penetrate these imaginary surfaces. Mitigative measures such as obstruction lights, removal or relocation may be required for the obstruction not to be considered a hazard. All obstructions should be catalogued and their disposition noted. The Airport Layout Plan (ALP), published separately from this report, shows the location of obstructions. Critical obstructions are also shown on the approach procedures for the airport.
7
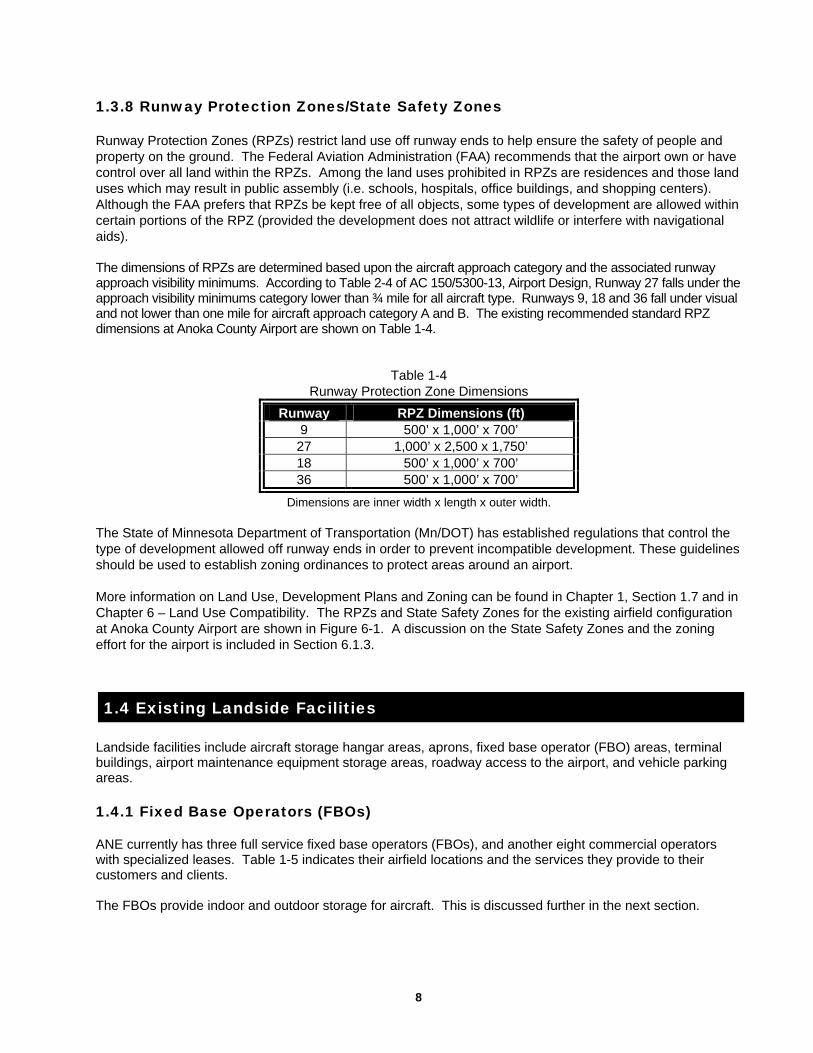
1.3.8 Runway Protection Zones/State Safety Zones Runway Protection Zones (RPZs) restrict land use off runway ends to help ensure the safety of people and property on the ground. The Federal Aviation Administration (FAA) recommends that the airport own or have control over all land within the RPZs. Among the land uses prohibited in RPZs are residences and those land uses which may result in public assembly (i.e. schools, hospitals, office buildings, and shopping centers). Although the FAA prefers that RPZs be kept free of all objects, some types of development are allowed within certain portions of the RPZ (provided the development does not attract wildlife or interfere with navigational aids).
The dimensions of RPZs are determined based upon the aircraft approach category and the associated runway approach visibility minimums. According to Table 2-4 of AC 150/5300-13, Airport Design, Runway 27 falls under the approach visibility minimums category lower than ¾ mile for all aircraft type. Runways 9, 18 and 36 fall under visual and not lower than one mile for aircraft approach category A and B. The existing recommended standard RPZ dimensions at Anoka County Airport are shown on Table 1-4.
Table 1-4 Runway Protection Zone Dimensions
Runway RPZ Dimensions (ft) 9 500’ x 1,000’ x 700’
27 1,000’ x 2,500 x 1,750’ 18 500’ x 1,000’ x 700’ 36 500’ x 1,000’ x 700’
Dimensions are inner width x length x outer width.
The State of Minnesota Department of Transportation (Mn/DOT) has established regulations that control the type of development allowed off runway ends in order to prevent incompatible development. These guidelines should be used to establish zoning ordinances to protect areas around an airport.
More information on Land Use, Development Plans and Zoning can be found in Chapter 1, Section 1.7 and in Chapter 6 – Land Use Compatibility. The RPZs and State Safety Zones for the existing airfield configuration at Anoka County Airport are shown in Figure 6-1. A discussion on the State Safety Zones and the zoning effort for the airport is included in Section 6.1.3.
1.4 Existing Landside Facilities
Landside facilities include aircraft storage hangar areas, aprons, fixed base operator (FBO) areas, terminal buildings, airport maintenance equipment storage areas, roadway access to the airport, and vehicle parking areas.
1.4.1 Fixed Base Operators (FBOs)
ANE currently has three full service fixed base operators (FBOs), and another eight commercial operators with specialized leases. Table 1-5 indicates their airfield locations and the services they provide to their customers and clients. The FBOs provide indoor and outdoor storage for aircraft. This is discussed further in the next section.
8
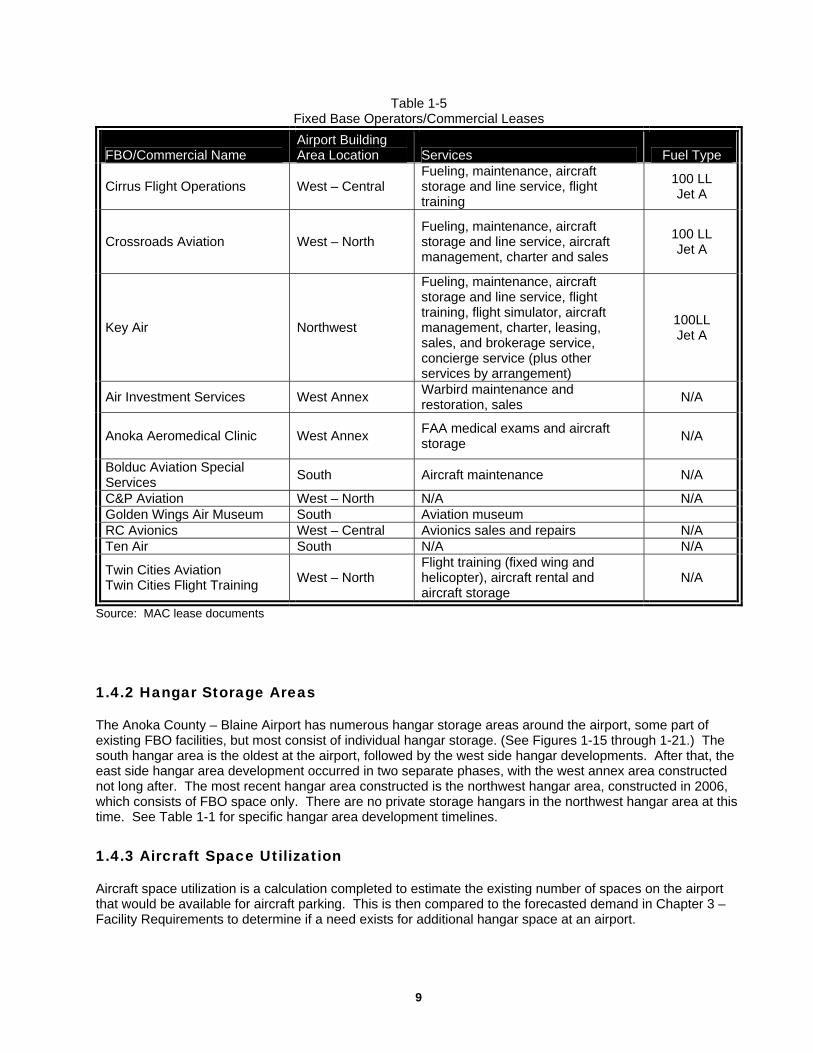
Table 1-5 Fixed Base Operators/Commercial Leases
FBO/Commercial Name Airport Building Area Location Services Fuel Type
Cirrus Flight Operations West – Central Fueling, maintenance, aircraft storage and line service, flight training
100 LL Jet A
Crossroads Aviation West – North Fueling, maintenance, aircraft storage and line service, aircraft management, charter and sales
100 LL Jet A
Key Air Northwest
Fueling, maintenance, aircraft storage and line service, flight training, flight simulator, aircraft management, charter, leasing, sales, and brokerage service, concierge service (plus other services by arrangement)
100LL Jet A
Air Investment Services West Annex Warbird maintenance and restoration, sales N/A
Anoka Aeromedical Clinic West Annex FAA medical exams and aircraft storage
N/A
Bolduc Aviation Special Services South Aircraft maintenance N/A
C&P Aviation West – North N/A N/A Golden Wings Air Museum South Aviation museum RC Avionics West – Central Avionics sales and repairs N/A Ten Air South N/A N/A
Twin Cities Aviation Twin Cities Flight Training West – North
Flight training (fixed wing and helicopter), aircraft rental and aircraft storage
N/A
Source: MAC lease documents
1.4.2 Hangar Storage Areas The Anoka County – Blaine Airport has numerous hangar storage areas around the airport, some part of existing FBO facilities, but most consist of individual hangar storage. (See Figures 1-15 through 1-21.) The south hangar area is the oldest at the airport, followed by the west side hangar developments. After that, the east side hangar area development occurred in two separate phases, with the west annex area constructed not long after. The most recent hangar area constructed is the northwest hangar area, constructed in 2006, which consists of FBO space only. There are no private storage hangars in the northwest hangar area at this time. See Table 1-1 for specific hangar area development timelines. 1.4.3 Aircraft Space Utilization Aircraft space utilization is a calculation completed to estimate the existing number of spaces on the airport that would be available for aircraft parking. This is then compared to the forecasted demand in Chapter 3 – Facility Requirements to determine if a need exists for additional hangar space at an airport.
9
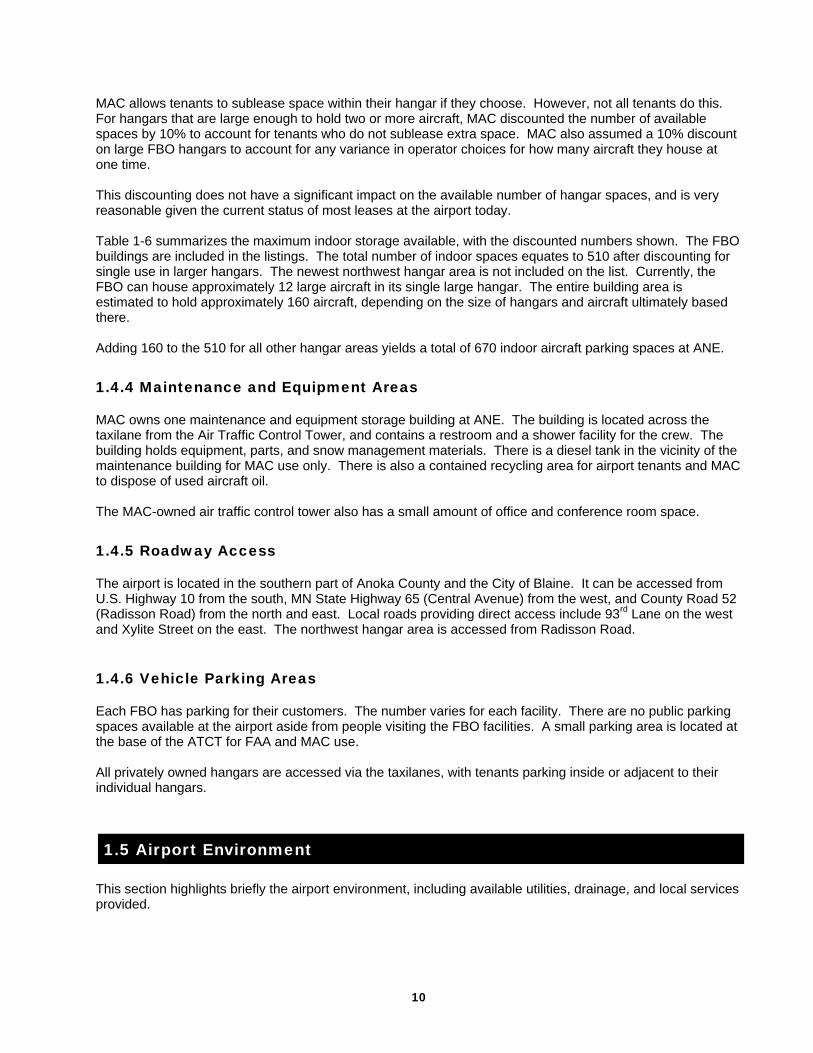
MAC allows tenants to sublease space within their hangar if they choose. However, not all tenants do this. For hangars that are large enough to hold two or more aircraft, MAC discounted the number of available spaces by 10% to account for tenants who do not sublease extra space. MAC also assumed a 10% discount on large FBO hangars to account for any variance in operator choices for how many aircraft they house at one time. This discounting does not have a significant impact on the available number of hangar spaces, and is very reasonable given the current status of most leases at the airport today. Table 1-6 summarizes the maximum indoor storage available, with the discounted numbers shown. The FBO buildings are included in the listings. The total number of indoor spaces equates to 510 after discounting for single use in larger hangars. The newest northwest hangar area is not included on the list. Currently, the FBO can house approximately 12 large aircraft in its single large hangar. The entire building area is estimated to hold approximately 160 aircraft, depending on the size of hangars and aircraft ultimately based there. Adding 160 to the 510 for all other hangar areas yields a total of 670 indoor aircraft parking spaces at ANE. 1.4.4 Maintenance and Equipment Areas
MAC owns one maintenance and equipment storage building at ANE. The building is located across the taxilane from the Air Traffic Control Tower, and contains a restroom and a shower facility for the crew. The building holds equipment, parts, and snow management materials. There is a diesel tank in the vicinity of the maintenance building for MAC use only. There is also a contained recycling area for airport tenants and MAC to dispose of used aircraft oil. The MAC-owned air traffic control tower also has a small amount of office and conference room space. 1.4.5 Roadway Access
The airport is located in the southern part of Anoka County and the City of Blaine. It can be accessed from U.S. Highway 10 from the south, MN State Highway 65 (Central Avenue) from the west, and County Road 52 (Radisson Road) from the north and east. Local roads providing direct access include 93rd Lane on the west and Xylite Street on the east. The northwest hangar area is accessed from Radisson Road. 1.4.6 Vehicle Parking Areas
Each FBO has parking for their customers. The number varies for each facility. There are no public parking spaces available at the airport aside from people visiting the FBO facilities. A small parking area is located at the base of the ATCT for FAA and MAC use. All privately owned hangars are accessed via the taxilanes, with tenants parking inside or adjacent to their individual hangars.
1.5 Airport Environment
This section highlights briefly the airport environment, including available utilities, drainage, and local services provided.
10
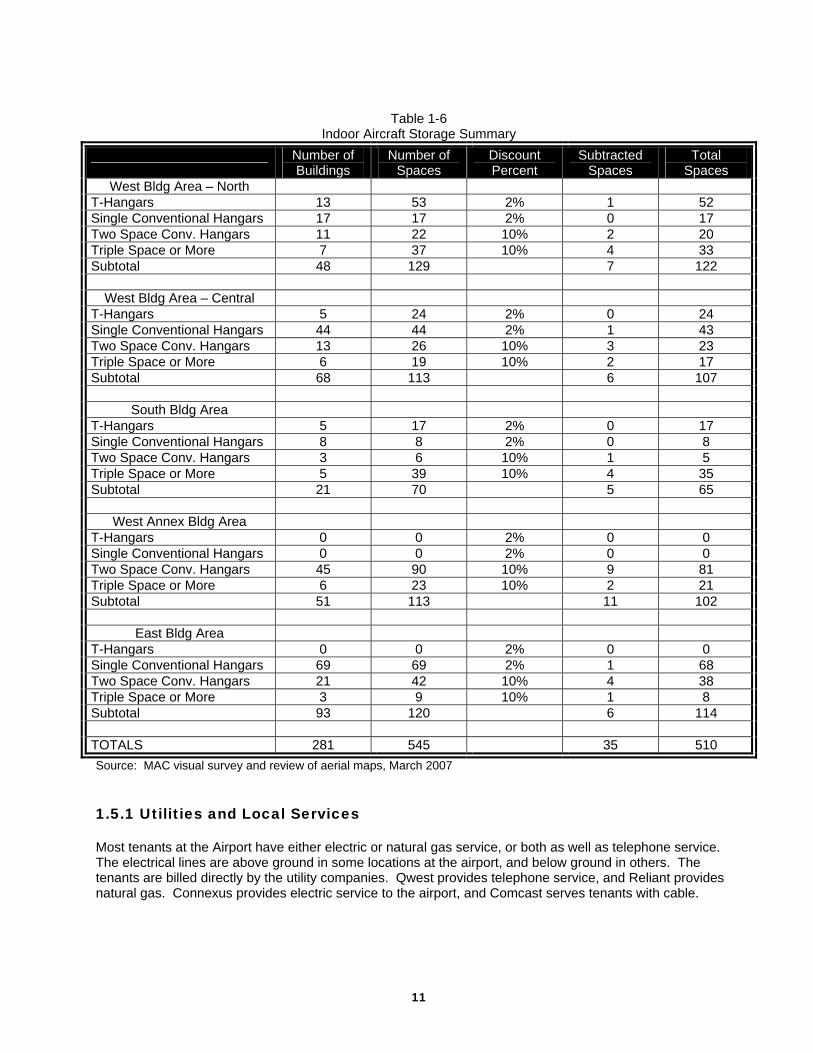
Table 1-6
Indoor Aircraft Storage Summary
Number of Buildings
Number of Spaces
Discount Percent
Subtracted Spaces
Total Spaces
West Bldg Area – North T-Hangars 13 53 2% 1 52 Single Conventional Hangars 17 17 2% 0 17 Two Space Conv. Hangars 11 22 10% 2 20 Triple Space or More 7 37 10% 4 33 Subtotal 48 129 7 122
West Bldg Area – Central
T-Hangars 5 24 2% 0 24 Single Conventional Hangars 44 44 2% 1 43 Two Space Conv. Hangars 13 26 10% 3 23 Triple Space or More 6 19 10% 2 17 Subtotal 68 113 6 107
South Bldg Area
T-Hangars 5 17 2% 0 17 Single Conventional Hangars 8 8 2% 0 8 Two Space Conv. Hangars 3 6 10% 1 5 Triple Space or More 5 39 10% 4 35 Subtotal 21 70 5 65
West Annex Bldg Area
T-Hangars 0 0 2% 0 0 Single Conventional Hangars 0 0 2% 0 0 Two Space Conv. Hangars 45 90 10% 9 81 Triple Space or More 6 23 10% 2 21 Subtotal 51 113 11 102
East Bldg Area T-Hangars 0 0 2% 0 0 Single Conventional Hangars 69 69 2% 1 68 Two Space Conv. Hangars 21 42 10% 4 38 Triple Space or More 3 9 10% 1 8 Subtotal 93 120 6 114 TOTALS 281 545 35 510 Source: MAC visual survey and review of aerial maps, March 2007
1.5.1 Utilities and Local Services
Most tenants at the Airport have either electric or natural gas service, or both as well as telephone service. The electrical lines are above ground in some locations at the airport, and below ground in others. The tenants are billed directly by the utility companies. Qwest provides telephone service, and Reliant provides natural gas. Connexus provides electric service to the airport, and Comcast serves tenants with cable.
11
The City of Blaine provides police services for the Airport. Fire rescue services are provided by the cities of Mounds View, Spring Lake Park, and Blaine. This is achieved through an agreement between MAC and the cities. 1.5.2 Drainage and Water Quality
According to MAC’s 1996 Water Management Plan, the soils at the Anoka County – Blaine Airport fall under the Zimmerman-Isanti-Lino and Rifle-Isanti associations. The Zimmerman-Isanti-Lino soils, which form the perimeter of the Anoka Sand Plain, are generally described as nearly level to undulating, excessively drained to very poorly drained soils dominated by fine sands throughout. The Rifle-Isanti soils are generally described as nearly level, very poorly drained soils formed in organic material and fine sand. The majority if pre-existing soils have low infiltration rates and high runoff potential. Natural vegetation consists of grasses, sedges, willows, reeds, cattails, and a mixed oak forest. Most of the surface drainage from the airport flows through Anoka County Ditch 41, which is located on the western portion of the property. This ditch is governed by the Coon Creek Watershed District and is subject to the rules of the district and Minnesota State Statutes. Figure 1-22 shows the general airport drainage patterns. Ditch 41 ultimately discharges into Coon Creek, about six miles downstream from the airport. A portion of the airport property also lies within the Rice Creek Watershed District. A significant number of wetlands exist on airport property. Airport expansion projects have required and included wetland filling and permitted mitigation in the past. Mitigated wetlands exist on the airport property, primarily northeast of the existing runway intersection and just west of the west hangar area. Since the mid-1990’s, the Federal Aviation Administration (FAA) has determined wetlands may be hazardous wildlife attractants, and no longer allow wetland mitigation on airport property. In 2006, as a part of the Runway 9-27 extension to 5,000 feet and construction of the northwest hangar area, MAC purchased approximately 123 acres of land in Ham Lake, on which about 120 acres of new wetland and upland wetland areas were created. This provided enough acreage for mitigation for the construction projects as well as a number of wetland bank acres for MAC to hold for future use or sale. This mitigation was reviewed and permitted through the 2002 Federal Environmental Assessment and State Environmental Impact Statement (EA/EIS) that was completed for the airport expansion projects. The airport also contains floodplain areas, primarily associated with Ditch 41. As noted, the wetlands and floodplains are regulated by the two watershed districts. In some cases, the wetlands fall under the jurisdiction of the Minnesota Department of Natural Resources. MAC maintains a Storm Water Pollution Prevention Plan (SWPP) and a Spill Prevention Control and Countermeasure Plan (SPCC) for MAC-owned facilities at the Airport. The MAC has a general storm water discharge permit from the Minnesota Pollution Control Agency (MPCA). In addition, MAC maintains a Water Management Plan for the Airport. It includes best management practices for protecting the storm water conveyances, wetlands, and groundwater. Due to the activities performed by the Fixed Base Operators (FBOs), they are required to maintain their own general storm water discharge permit from the MPCA, along with their own SWPP and SPCC plans.
Chemicals used in deicing activities at airports is of concern because of the potential effects on receiving water bodies. Airport tenants and/or FBOs conduct aircraft deicing at ANE. Most aircraft can be stored inside heated hangars prior to takeoff or cannot fly when icing conditions exist, which eliminates the need for glycol use. MAC may use some amounts of urea on the runways during icing conditions. The amount used varies annually. Salt is not used due to its corrosive nature. Sand is used on a limited basis, depending on weather conditions. Given these minor uses, and as supported in the EIS document referenced above, the potential impact on water quality from the airport is minimal.
12
1.5.3 Sanitary Sewer and Water
The majority of the Anoka County - Blaine Airport is now served with sanitary sewer and water. Two major projects in 1999 and in 2000 completed the service to and around the airport. A third project was completed in 2006 with the construction of the new northwest hangar area. Figure 1-23 identifies the main sewer and water locations, but not each and every service line or connection. There are a few localized areas within the airport where only cold storage hangars exist that do not have the ability to connect at the present time. The water service to the hangars also includes numerous hydrants for fire protection. The City of Blaine maintains the system, and tenants are responsible for connecting, repairing their own connections and for payment to the City. The MAC owned maintenance facility and the air traffic control tower are also connected to the services.
1.6 Meteorological Data
The Anoka County Airport is equipped with an Automated Weather Observation System (AWOS). The AWOS provides computerized weather readings 24-hours a day, with updates every minute, continuously reporting significant weather changes as they occur. The AWOS system reports cloud ceiling, visibility, temperature, dew point, wind direction and speed, altimeter setting (barometric pressure), and density altitude (airfield elevation corrected for non-standard temperature). The recording and monitoring equipment for the AWOS is located on the northwest portion of the airport (see Figure 1-15). A 1,000-foot radius in which no obstructions or significant amount of pavement exists is desirable since they may interfere with the weather readings.
1.7 Area Land Use, Airspace and Zoning
One of the biggest challenges facing airports in general today is the presence of incompatible land use either adjacent to the airport or in runway flight paths. Working closely with City officials, airport users, developers, and nearby residents, airports can reduce these types of conflicts through the use of zoning regulations that disallow certain types of nearby development.
The City of Blaine has a review process that requires all applications for development be reviewed by MAC and the FAA to determine if the proposed structure would be a “general obstruction to air navigation” or an “obstruction to a public airport”, and to ensure that proper notification to the Commissioner of Transportation is made if so required. Land uses around the airport vary. There are many residential areas not far from the airport boundary, especially to the east and south. The area to the west, immediately adjacent to airport property, is primarily industrial development. To the north, there is a section of mixed use commercial/high density residential, followed further north by full residential development.
A more in-depth discussion and figures showing the land uses are included in Chapter 6 of this report.
1.8 Area Socioeconomic Data
The reliever airport system, owned and operated by MAC, includes the Anoka County – Blaine Airport and five other airports in the metropolitan area. According to the Economic Analysis of Reliever Airport System, prepared by Wilder Research in October 2005 for MAC, it is estimated that ANE contributes $35 million annually to the local economy and supports 350 jobs. This includes on-airport services, fuel sales, and visitor spending in the community.
13
14
1.9 Historic Airport Activity
Aircraft based at and using the Anoka County - Blaine Airport include single engine, twin-engine piston and turbo props, small business jets, and helicopters. There are no military aircraft based at the airport, but they may fly in on occasion to complete training operations. It is assumed that flights in and out of ANE are of both a business and a recreational nature.
The based aircraft fleet mix currently registered with the State of Minnesota, as of 2007, consists of 359 single engine planes (82%), 51 multi-engine piston aircraft/light twins (12%), six turboprops (1%), eight helicopters (2%), and 12 jets (3%). One of the twelve jets is a very-light-jet. In recent years, the activity at the airport has been declining. This is due to the overall downward trend in aviation since 9-11, primarily in general aviation. It is assumed that the majority of single engine operations are recreational. While single engine aircraft operations are forecasted to continue declining, jet operations are anticipated to increase at the airport over time. See Chapter 2.
Chapter
2 Aviation Forecast
This chapter provides a summary of the aviation activity forecasts prepared for the Long-Term Comprehensive Plan (LTCP) for the Anoka County-Blaine Airport (ANE). The forecasts are intended for use in subsequent facility requirements analyses for the airside and landside area development. A credible and usable forecast is critical to ensure that the type and size of the planned facilities are appropriate for future conditions. Forecasts are presented for an approximate 20-year time horizon, and include 2010, 2015, 2020, and 2025. The forecasts are unconstrained and assume that the necessary facilities will be in place to accommodate demand except where noted. The existing and projected socioeconomic conditions in the area and current general aviation activity are used to prepare the assumptions that form the foundation of the forecasts. Based aircraft forecasts for the Metropolitan Airports Commission (MAC) airports are calculated and then allocated among the individual airports. Operations and peak activity forecasts for Anoka County are derived from the based aircraft forecasts. The analysis includes a set of high and low activity scenarios for the airport.
The assumptions inherent in the following calculations are based on data provided by the MAC, federal and local sources, and professional experience. Fuel cost assumptions reflect the recent major increase in oil prices. Forecasting, however, is not an exact science. Departures from forecast levels in the local and national economy and in the aviation industry could have an effect on the forecasts presented herein.
A copy of the full Activity Forecasts - Technical Report is contained in Appendix A of this document. The report includes background information, socioeconomic data, historical trends, and detailed descriptions of the assumptions for the forecasts. This chapter is a brief synopsis of that report as it pertains to the Anoka County Airport.
2.1 Aircraft Fleet Mix and Based Aircraft Forecasts
The number of based aircraft at Anoka County Airport is expected to grow from 437 in 2007 to 455 in 2010, and then decline to 414 in 2025. Most of the initial growth would be from aircraft on the waiting list. Jet aircraft (including microjets) are projected to almost triple from 12 to 35 over the forecast period. Based turboprop aircraft and helicopters are also projected in increase while piston powered aircraft are projected to decrease.
The absence of anticipated growth in the piston aircraft category is attributable to several factors. The Airport is located in Anoka County, which is projected to be one of the slower growing counties. Also, the FAA projects piston powered aircraft to grow more slowly than the other categories. In addition, high fuel costs are anticipated to discourage the acquisition of new aircraft and the number of aircraft accommodated at MAC airports is declining.
2.2 Aircraft Operations Forecasts
The forecasts of aircraft operations were derived from the based aircraft forecasts. Estimates of base year operation levels were obtained from the FAA’s ATADS data base, supplemented by ANOMS data for operations that occur when the Air Traffic Control Tower is not open. Base year operations by aircraft type were based on ANOMS data collected by the MAC. The ANOMS data base was not designed to capture many of the aircraft flying under Visual Flight Rules (VFR). Those were allocated among piston aircraft according to the distribution of based aircraft.
15
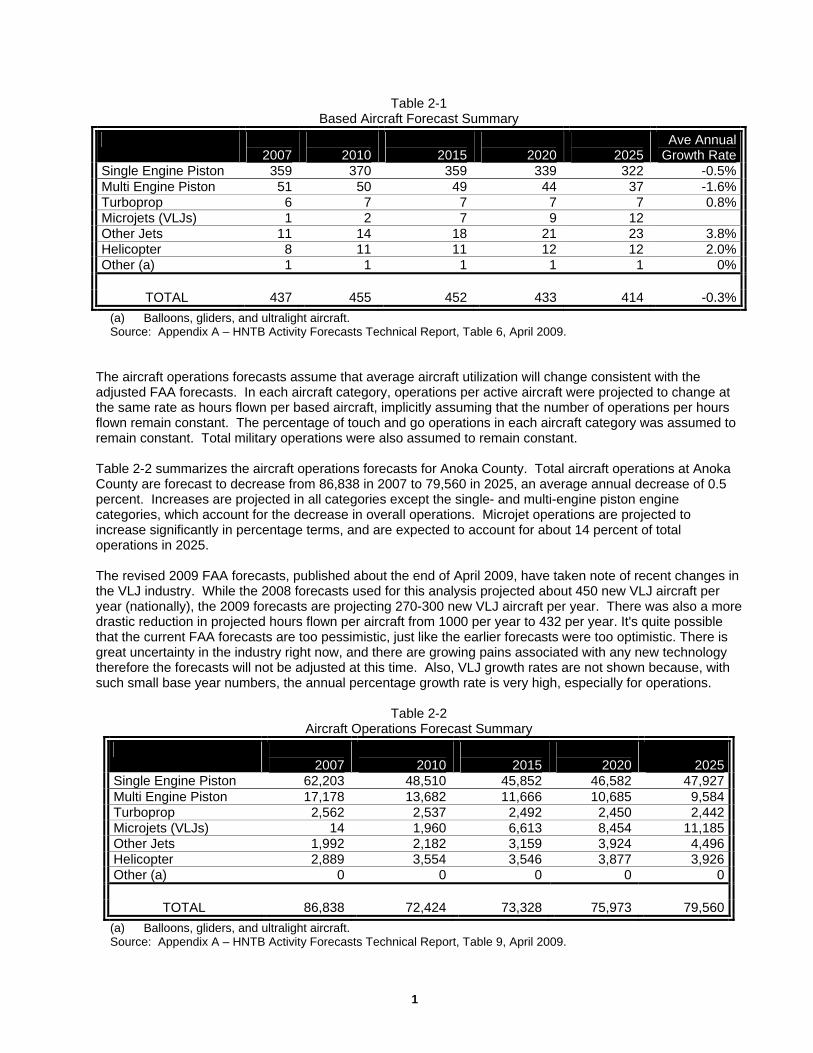
Table 2-1 Based Aircraft Forecast Summary
2007
2010
2015
2020
2025
Ave AnnualGrowth Rate
Single Engine Piston 359 370 359 339 322 -0.5%Multi Engine Piston 51 50 49 44 37 -1.6%Turboprop 6 7 7 7 7 0.8%Microjets (VLJs) 1 2 7 9 12 Other Jets 11 14 18 21 23 3.8%Helicopter 8 11 11 12 12 2.0%Other (a) 1 1 1 1 1 0%
TOTAL 437 455 452 433 414 -0.3%(a) Balloons, gliders, and ultralight aircraft. Source: Appendix A – HNTB Activity Forecasts Technical Report, Table 6, April 2009.
The aircraft operations forecasts assume that average aircraft utilization will change consistent with the adjusted FAA forecasts. In each aircraft category, operations per active aircraft were projected to change at the same rate as hours flown per based aircraft, implicitly assuming that the number of operations per hours flown remain constant. The percentage of touch and go operations in each aircraft category was assumed to remain constant. Total military operations were also assumed to remain constant.
Table 2-2 summarizes the aircraft operations forecasts for Anoka County. Total aircraft operations at Anoka County are forecast to decrease from 86,838 in 2007 to 79,560 in 2025, an average annual decrease of 0.5 percent. Increases are projected in all categories except the single- and multi-engine piston engine categories, which account for the decrease in overall operations. Microjet operations are projected to increase significantly in percentage terms, and are expected to account for about 14 percent of total operations in 2025. The revised 2009 FAA forecasts, published about the end of April 2009, have taken note of recent changes in the VLJ industry. While the 2008 forecasts used for this analysis projected about 450 new VLJ aircraft per year (nationally), the 2009 forecasts are projecting 270-300 new VLJ aircraft per year. There was also a more drastic reduction in projected hours flown per aircraft from 1000 per year to 432 per year. It's quite possible that the current FAA forecasts are too pessimistic, just like the earlier forecasts were too optimistic. There is great uncertainty in the industry right now, and there are growing pains associated with any new technology therefore the forecasts will not be adjusted at this time. Also, VLJ growth rates are not shown because, with such small base year numbers, the annual percentage growth rate is very high, especially for operations.
Table 2-2 Aircraft Operations Forecast Summary
2007
2010
2015
2020 2025
Single Engine Piston 62,203 48,510 45,852 46,582 47,927Multi Engine Piston 17,178 13,682 11,666 10,685 9,584Turboprop 2,562 2,537 2,492 2,450 2,442Microjets (VLJs) 14 1,960 6,613 8,454 11,185Other Jets 1,992 2,182 3,159 3,924 4,496Helicopter 2,889 3,554 3,546 3,877 3,926Other (a) 0 0 0 0 0
TOTAL 86,838 72,424 73,328 75,973 79,560(a) Balloons, gliders, and ultralight aircraft. Source: Appendix A – HNTB Activity Forecasts Technical Report, Table 9, April 2009.
16
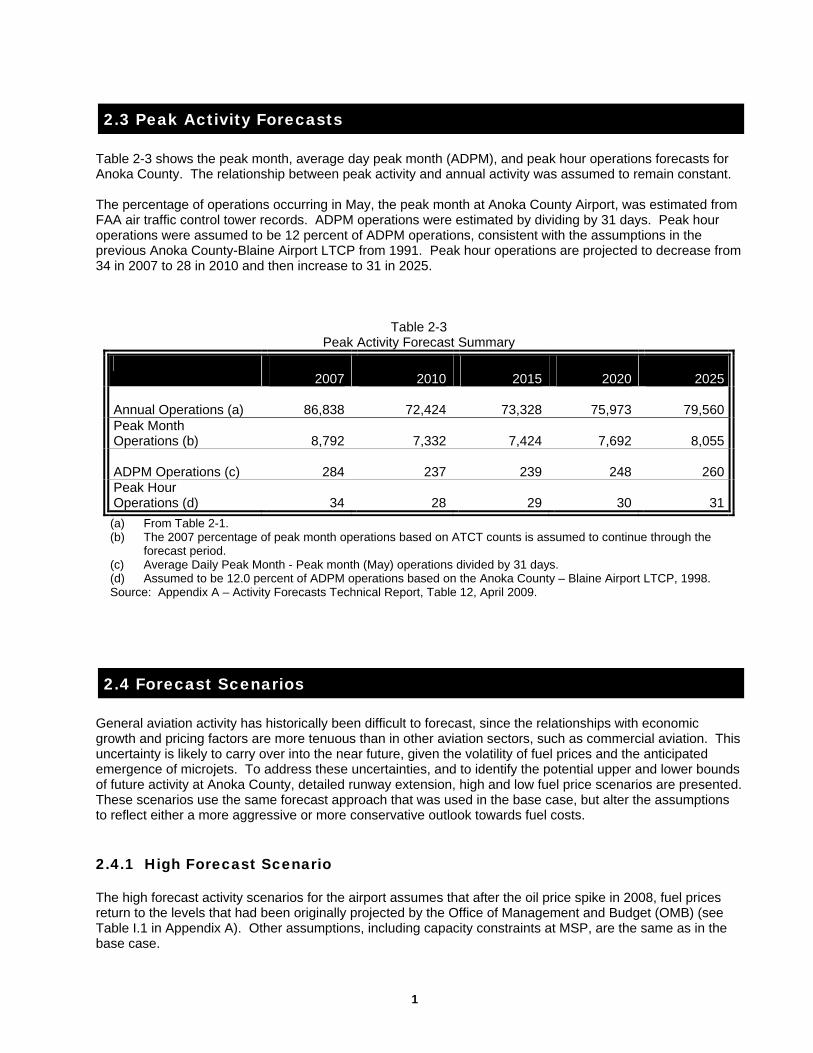
2.3 Peak Activity Forecasts
Table 2-3 shows the peak month, average day peak month (ADPM), and peak hour operations forecasts for Anoka County. The relationship between peak activity and annual activity was assumed to remain constant.
The percentage of operations occurring in May, the peak month at Anoka County Airport, was estimated from FAA air traffic control tower records. ADPM operations were estimated by dividing by 31 days. Peak hour operations were assumed to be 12 percent of ADPM operations, consistent with the assumptions in the previous Anoka County-Blaine Airport LTCP from 1991. Peak hour operations are projected to decrease from 34 in 2007 to 28 in 2010 and then increase to 31 in 2025.
Table 2-3 Peak Activity Forecast Summary
2007
2010
2015
2020 2025
Annual Operations (a)
86,838
72,424
73,328
75,973 79,560
Peak Month Operations (b)
8,792
7,332
7,424
7,692 8,055
ADPM Operations (c)
284
237
239
248 260
Peak Hour Operations (d)
34
28
29
30 31
(a) From Table 2-1. (b) The 2007 percentage of peak month operations based on ATCT counts is assumed to continue through the
forecast period. (c) Average Daily Peak Month - Peak month (May) operations divided by 31 days. (d) Assumed to be 12.0 percent of ADPM operations based on the Anoka County – Blaine Airport LTCP, 1998. Source: Appendix A – Activity Forecasts Technical Report, Table 12, April 2009.
2.4 Forecast Scenarios
General aviation activity has historically been difficult to forecast, since the relationships with economic growth and pricing factors are more tenuous than in other aviation sectors, such as commercial aviation. This uncertainty is likely to carry over into the near future, given the volatility of fuel prices and the anticipated emergence of microjets. To address these uncertainties, and to identify the potential upper and lower bounds of future activity at Anoka County, detailed runway extension, high and low fuel price scenarios are presented. These scenarios use the same forecast approach that was used in the base case, but alter the assumptions to reflect either a more aggressive or more conservative outlook towards fuel costs. 2.4.1 High Forecast Scenario
The high forecast activity scenarios for the airport assumes that after the oil price spike in 2008, fuel prices return to the levels that had been originally projected by the Office of Management and Budget (OMB) (see Table I.1 in Appendix A). Other assumptions, including capacity constraints at MSP, are the same as in the base case.
17
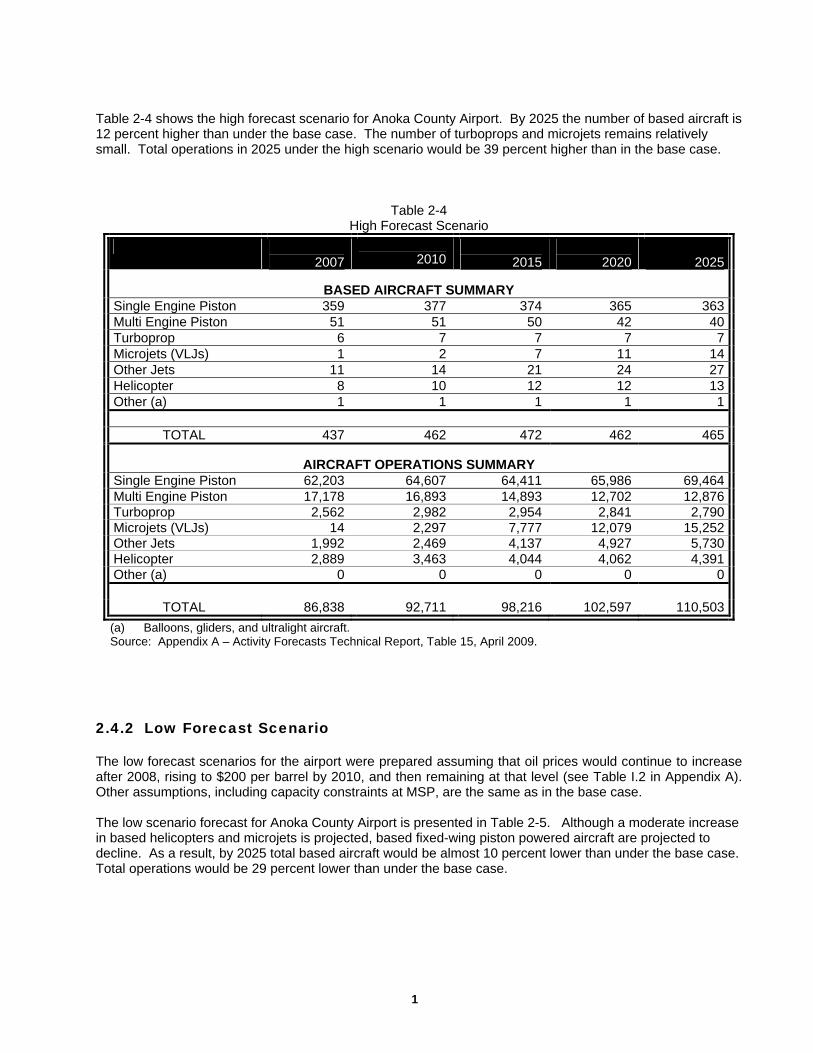
Table 2-4 shows the high forecast scenario for Anoka County Airport. By 2025 the number of based aircraft is 12 percent higher than under the base case. The number of turboprops and microjets remains relatively small. Total operations in 2025 under the high scenario would be 39 percent higher than in the base case.
Table 2-4 High Forecast Scenario
2007
2010
2015
2020 2025
BASED AIRCRAFT SUMMARY
Single Engine Piston 359 377 374 365 363Multi Engine Piston 51 51 50 42 40Turboprop 6 7 7 7 7Microjets (VLJs) 1 2 7 11 14Other Jets 11 14 21 24 27Helicopter 8 10 12 12 13Other (a) 1 1 1 1 1
TOTAL 437 462 472 462 465
AIRCRAFT OPERATIONS SUMMARY Single Engine Piston 62,203 64,607 64,411 65,986 69,464Multi Engine Piston 17,178 16,893 14,893 12,702 12,876Turboprop 2,562 2,982 2,954 2,841 2,790Microjets (VLJs) 14 2,297 7,777 12,079 15,252Other Jets 1,992 2,469 4,137 4,927 5,730Helicopter 2,889 3,463 4,044 4,062 4,391Other (a) 0 0 0 0 0
TOTAL 86,838 92,711 98,216 102,597 110,503(a) Balloons, gliders, and ultralight aircraft. Source: Appendix A – Activity Forecasts Technical Report, Table 15, April 2009.
2.4.2 Low Forecast Scenario
The low forecast scenarios for the airport were prepared assuming that oil prices would continue to increase after 2008, rising to $200 per barrel by 2010, and then remaining at that level (see Table I.2 in Appendix A). Other assumptions, including capacity constraints at MSP, are the same as in the base case.
The low scenario forecast for Anoka County Airport is presented in Table 2-5. Although a moderate increase in based helicopters and microjets is projected, based fixed-wing piston powered aircraft are projected to decline. As a result, by 2025 total based aircraft would be almost 10 percent lower than under the base case. Total operations would be 29 percent lower than under the base case.
18
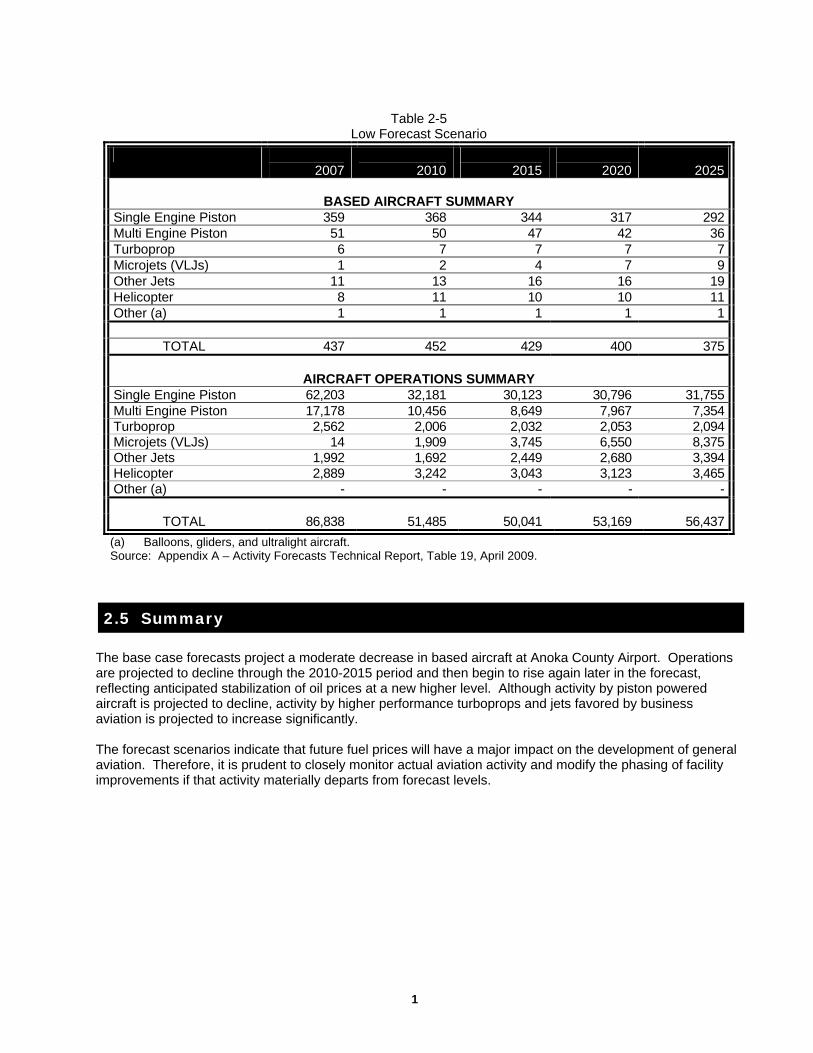
Table 2-5
Low Forecast Scenario
2007
2010
2015
2020 2025
BASED AIRCRAFT SUMMARY Single Engine Piston 359 368 344 317 292Multi Engine Piston 51 50 47 42 36Turboprop 6 7 7 7 7Microjets (VLJs) 1 2 4 7 9Other Jets 11 13 16 16 19Helicopter 8 11 10 10 11Other (a) 1 1 1 1 1
TOTAL 437 452 429 400 375
AIRCRAFT OPERATIONS SUMMARY Single Engine Piston 62,203 32,181 30,123 30,796 31,755Multi Engine Piston 17,178 10,456 8,649 7,967 7,354Turboprop 2,562 2,006 2,032 2,053 2,094Microjets (VLJs) 14 1,909 3,745 6,550 8,375Other Jets 1,992 1,692 2,449 2,680 3,394Helicopter 2,889 3,242 3,043 3,123 3,465Other (a) - - - - -
TOTAL 86,838 51,485 50,041 53,169 56,437(a) Balloons, gliders, and ultralight aircraft. Source: Appendix A – Activity Forecasts Technical Report, Table 19, April 2009.
2.5 Summary
The base case forecasts project a moderate decrease in based aircraft at Anoka County Airport. Operations are projected to decline through the 2010-2015 period and then begin to rise again later in the forecast, reflecting anticipated stabilization of oil prices at a new higher level. Although activity by piston powered aircraft is projected to decline, activity by higher performance turboprops and jets favored by business aviation is projected to increase significantly.
The forecast scenarios indicate that future fuel prices will have a major impact on the development of general aviation. Therefore, it is prudent to closely monitor actual aviation activity and modify the phasing of facility improvements if that activity materially departs from forecast levels.
19
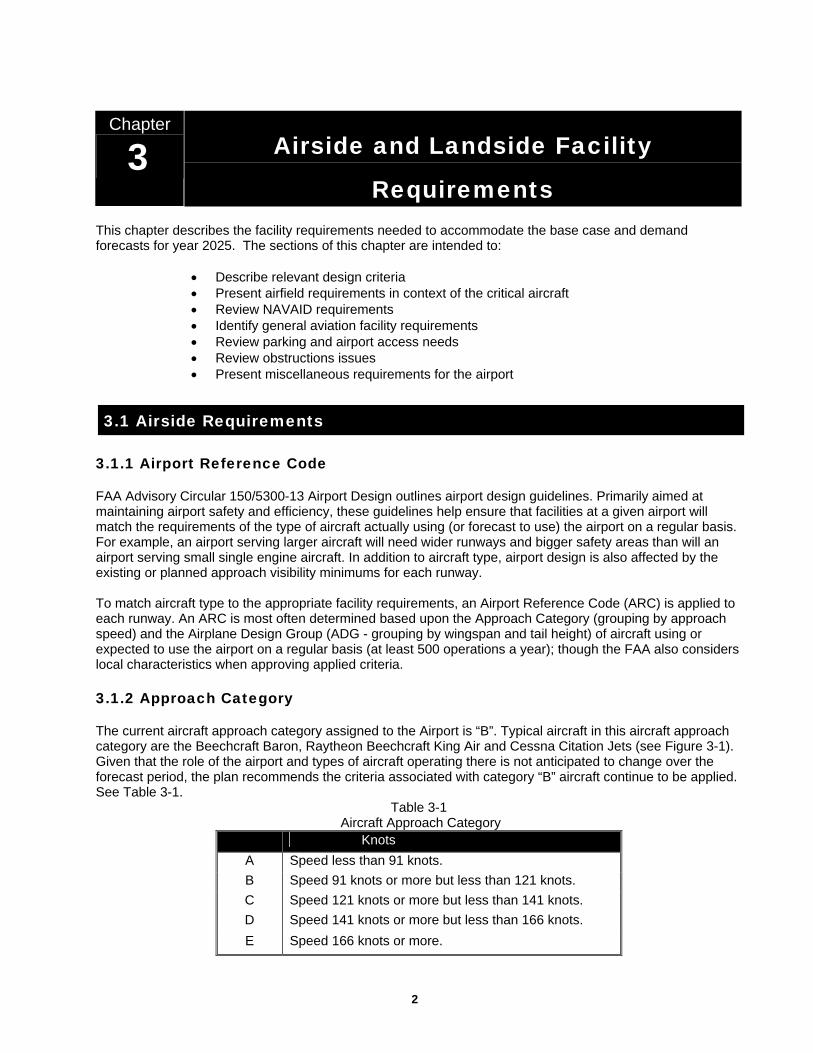
Chapter
3 Airside and Landside Facility
Requirements
This chapter describes the facility requirements needed to accommodate the base case and demand forecasts for year 2025. The sections of this chapter are intended to:
• Describe relevant design criteria • Present airfield requirements in context of the critical aircraft • Review NAVAID requirements • Identify general aviation facility requirements • Review parking and airport access needs • Review obstructions issues • Present miscellaneous requirements for the airport
3.1 Airside Requirements
3.1.1 Airport Reference Code FAA Advisory Circular 150/5300-13 Airport Design outlines airport design guidelines. Primarily aimed at maintaining airport safety and efficiency, these guidelines help ensure that facilities at a given airport will match the requirements of the type of aircraft actually using (or forecast to use) the airport on a regular basis. For example, an airport serving larger aircraft will need wider runways and bigger safety areas than will an airport serving small single engine aircraft. In addition to aircraft type, airport design is also affected by the existing or planned approach visibility minimums for each runway. To match aircraft type to the appropriate facility requirements, an Airport Reference Code (ARC) is applied to each runway. An ARC is most often determined based upon the Approach Category (grouping by approach speed) and the Airplane Design Group (ADG - grouping by wingspan and tail height) of aircraft using or expected to use the airport on a regular basis (at least 500 operations a year); though the FAA also considers local characteristics when approving applied criteria.
3.1.2 Approach Category The current aircraft approach category assigned to the Airport is “B”. Typical aircraft in this aircraft approach category are the Beechcraft Baron, Raytheon Beechcraft King Air and Cessna Citation Jets (see Figure 3-1). Given that the role of the airport and types of aircraft operating there is not anticipated to change over the forecast period, the plan recommends the criteria associated with category “B” aircraft continue to be applied. See Table 3-1.
Table 3-1 Aircraft Approach Category
Knots A Speed less than 91 knots. B Speed 91 knots or more but less than 121 knots. C Speed 121 knots or more but less than 141 knots. D Speed 141 knots or more but less than 166 knots. E Speed 166 knots or more.
20
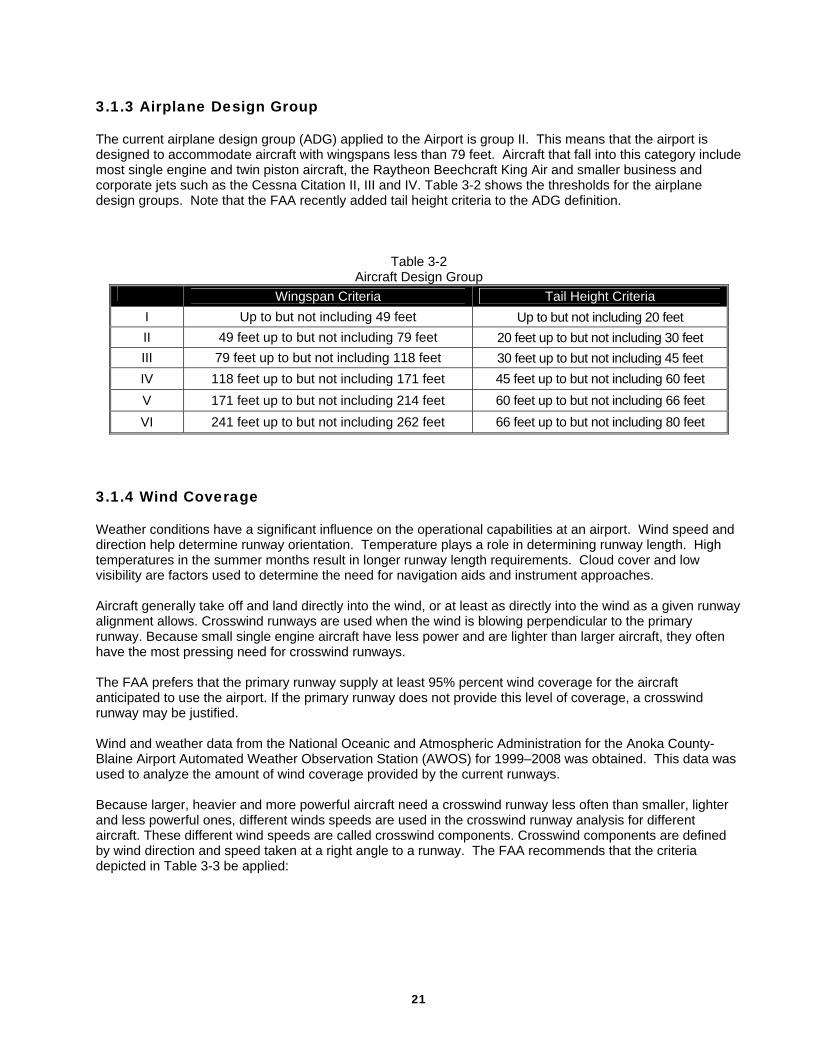
3.1.3 Airplane Design Group The current airplane design group (ADG) applied to the Airport is group II. This means that the airport is designed to accommodate aircraft with wingspans less than 79 feet. Aircraft that fall into this category include most single engine and twin piston aircraft, the Raytheon Beechcraft King Air and smaller business and corporate jets such as the Cessna Citation II, III and IV. Table 3-2 shows the thresholds for the airplane design groups. Note that the FAA recently added tail height criteria to the ADG definition.
Table 3-2 Aircraft Design Group
Wingspan Criteria Tail Height Criteria I Up to but not including 49 feet Up to but not including 20 feet II 49 feet up to but not including 79 feet 20 feet up to but not including 30 feet III 79 feet up to but not including 118 feet 30 feet up to but not including 45 feet IV 118 feet up to but not including 171 feet 45 feet up to but not including 60 feet V 171 feet up to but not including 214 feet 60 feet up to but not including 66 feet VI 241 feet up to but not including 262 feet 66 feet up to but not including 80 feet
3.1.4 Wind Coverage
Weather conditions have a significant influence on the operational capabilities at an airport. Wind speed and direction help determine runway orientation. Temperature plays a role in determining runway length. High temperatures in the summer months result in longer runway length requirements. Cloud cover and low visibility are factors used to determine the need for navigation aids and instrument approaches. Aircraft generally take off and land directly into the wind, or at least as directly into the wind as a given runway alignment allows. Crosswind runways are used when the wind is blowing perpendicular to the primary runway. Because small single engine aircraft have less power and are lighter than larger aircraft, they often have the most pressing need for crosswind runways. The FAA prefers that the primary runway supply at least 95% percent wind coverage for the aircraft anticipated to use the airport. If the primary runway does not provide this level of coverage, a crosswind runway may be justified. Wind and weather data from the National Oceanic and Atmospheric Administration for the Anoka County-Blaine Airport Automated Weather Observation Station (AWOS) for 1999–2008 was obtained. This data was used to analyze the amount of wind coverage provided by the current runways. Because larger, heavier and more powerful aircraft need a crosswind runway less often than smaller, lighter and less powerful ones, different winds speeds are used in the crosswind runway analysis for different aircraft. These different wind speeds are called crosswind components. Crosswind components are defined by wind direction and speed taken at a right angle to a runway. The FAA recommends that the criteria depicted in Table 3-3 be applied:
21
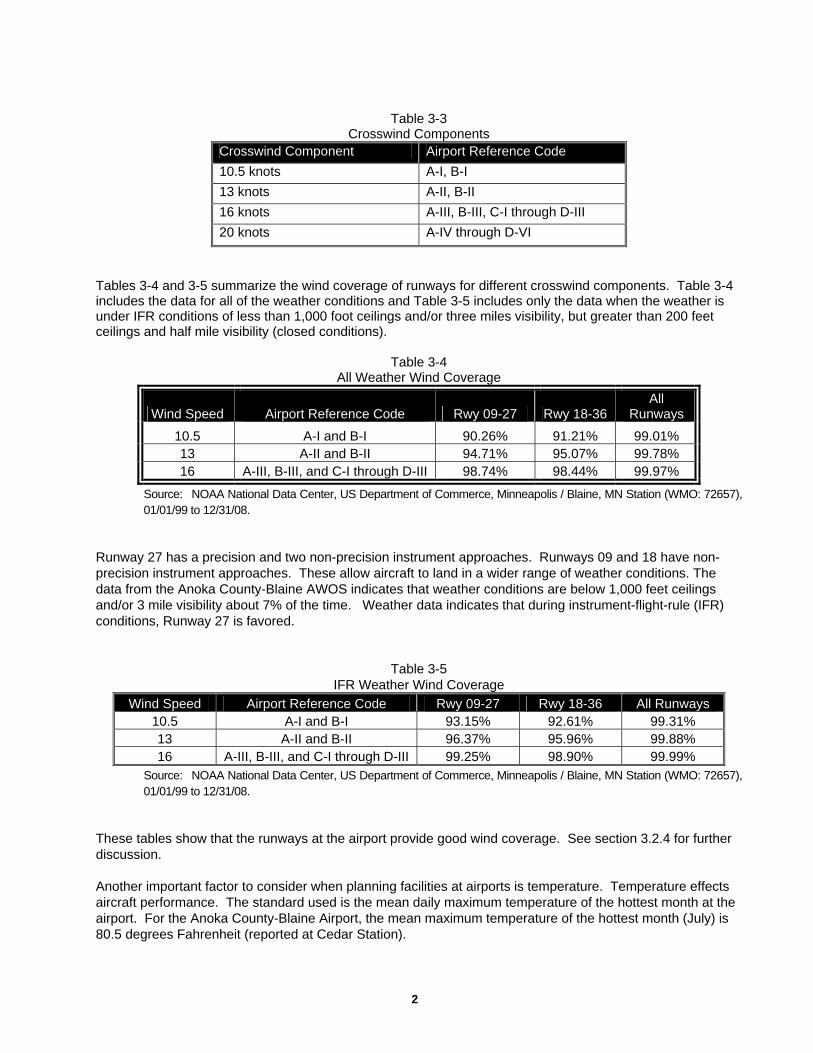
Table 3-3
Crosswind Components Crosswind Component Airport Reference Code 10.5 knots A-I, B-I 13 knots A-II, B-II 16 knots A-III, B-III, C-I through D-III 20 knots A-IV through D-VI
Tables 3-4 and 3-5 summarize the wind coverage of runways for different crosswind components. Table 3-4 includes the data for all of the weather conditions and Table 3-5 includes only the data when the weather is under IFR conditions of less than 1,000 foot ceilings and/or three miles visibility, but greater than 200 feet ceilings and half mile visibility (closed conditions).
Table 3-4
All Weather Wind Coverage
Wind Speed Airport Reference Code Rwy 09-27 Rwy 18-36 All
Runways
10.5 A-I and B-I 90.26% 91.21% 99.01% 13 A-II and B-II 94.71% 95.07% 99.78% 16 A-III, B-III, and C-I through D-III 98.74% 98.44% 99.97%
Source: NOAA National Data Center, US Department of Commerce, Minneapolis / Blaine, MN Station (WMO: 72657), 01/01/99 to 12/31/08.
Runway 27 has a precision and two non-precision instrument approaches. Runways 09 and 18 have non-precision instrument approaches. These allow aircraft to land in a wider range of weather conditions. The data from the Anoka County-Blaine AWOS indicates that weather conditions are below 1,000 feet ceilings and/or 3 mile visibility about 7% of the time. Weather data indicates that during instrument-flight-rule (IFR) conditions, Runway 27 is favored.
Table 3-5
IFR Weather Wind Coverage Wind Speed Airport Reference Code Rwy 09-27 Rwy 18-36 All Runways
10.5 A-I and B-I 93.15% 92.61% 99.31% 13 A-II and B-II 96.37% 95.96% 99.88% 16 A-III, B-III, and C-I through D-III 99.25% 98.90% 99.99%
Source: NOAA National Data Center, US Department of Commerce, Minneapolis / Blaine, MN Station (WMO: 72657), 01/01/99 to 12/31/08.
These tables show that the runways at the airport provide good wind coverage. See section 3.2.4 for further discussion.
Another important factor to consider when planning facilities at airports is temperature. Temperature effects aircraft performance. The standard used is the mean daily maximum temperature of the hottest month at the airport. For the Anoka County-Blaine Airport, the mean maximum temperature of the hottest month (July) is 80.5 degrees Fahrenheit (reported at Cedar Station).
22
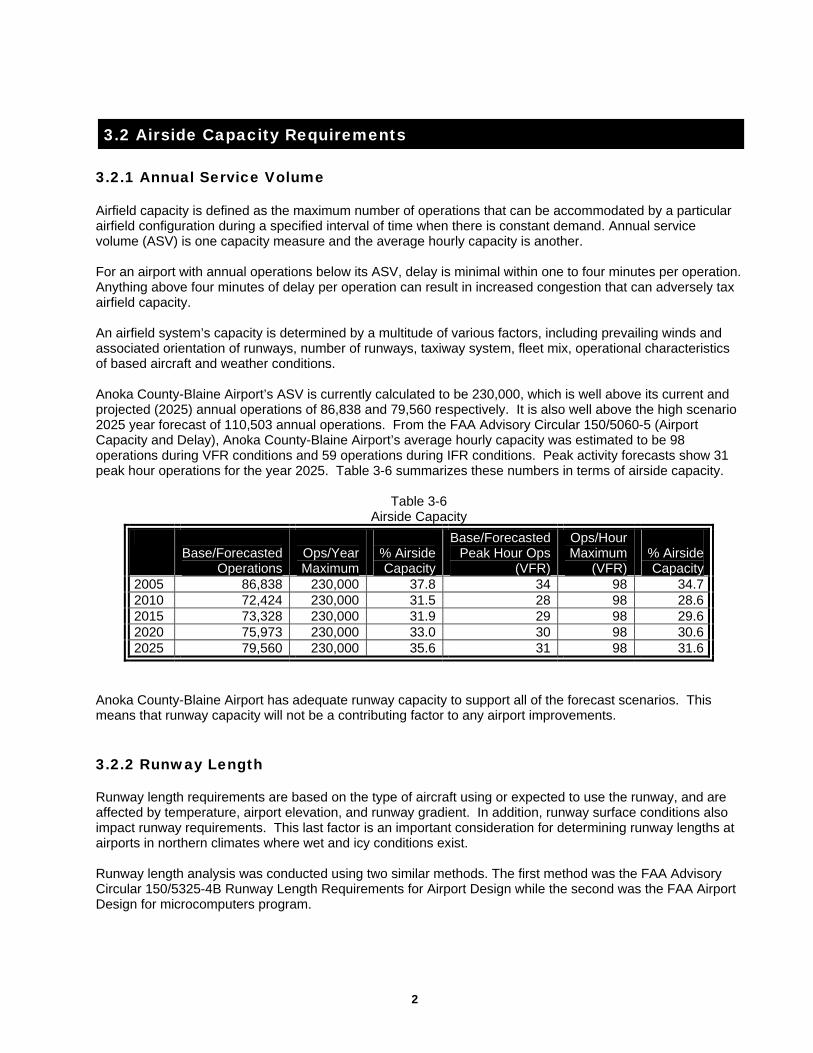
3.2 Airside Capacity Requirements
3.2.1 Annual Service Volume
Airfield capacity is defined as the maximum number of operations that can be accommodated by a particular airfield configuration during a specified interval of time when there is constant demand. Annual service volume (ASV) is one capacity measure and the average hourly capacity is another. For an airport with annual operations below its ASV, delay is minimal within one to four minutes per operation. Anything above four minutes of delay per operation can result in increased congestion that can adversely tax airfield capacity. An airfield system’s capacity is determined by a multitude of various factors, including prevailing winds and associated orientation of runways, number of runways, taxiway system, fleet mix, operational characteristics of based aircraft and weather conditions. Anoka County-Blaine Airport’s ASV is currently calculated to be 230,000, which is well above its current and projected (2025) annual operations of 86,838 and 79,560 respectively. It is also well above the high scenario 2025 year forecast of 110,503 annual operations. From the FAA Advisory Circular 150/5060-5 (Airport Capacity and Delay), Anoka County-Blaine Airport’s average hourly capacity was estimated to be 98 operations during VFR conditions and 59 operations during IFR conditions. Peak activity forecasts show 31 peak hour operations for the year 2025. Table 3-6 summarizes these numbers in terms of airside capacity.
Table 3-6 Airside Capacity
Base/Forecasted
Operations
Ops/Year Maximum
% Airside Capacity
Base/Forecasted Peak Hour Ops
(VFR)
Ops/Hour Maximum
(VFR) % Airside Capacity
2005 86,838 230,000 37.8 34 98 34.72010 72,424 230,000 31.5 28 98 28.62015 73,328 230,000 31.9 29 98 29.62020 75,973 230,000 33.0 30 98 30.62025 79,560 230,000 35.6 31 98 31.6
Anoka County-Blaine Airport has adequate runway capacity to support all of the forecast scenarios. This means that runway capacity will not be a contributing factor to any airport improvements. 3.2.2 Runway Length
Runway length requirements are based on the type of aircraft using or expected to use the runway, and are affected by temperature, airport elevation, and runway gradient. In addition, runway surface conditions also impact runway requirements. This last factor is an important consideration for determining runway lengths at airports in northern climates where wet and icy conditions exist. Runway length analysis was conducted using two similar methods. The first method was the FAA Advisory Circular 150/5325-4B Runway Length Requirements for Airport Design while the second was the FAA Airport Design for microcomputers program.
23
FAA Advisory Circular (AC) 150/5325-4B, Runway Length Requirements for Airport Design uses a five-step procedure to determine recommended lengths for a list of critical design aircraft or “family grouping of aircraft having similar performance characteristics and operating weights.” Although this methodology is general in nature, it recognizes that there is uncertainty about the composition of the Airport’s fleet mix during the forecast period. Determining runway length based on a family of aircraft ensures the greatest measure of flexibility. The AC provides runway length requirement tables for three groups of aircraft based upon the MTOW: • Airplane Weight Category 12,500 pounds or less; • Airplane Weight Category over 12,500 pounds but less than 60,000 pounds; and • Airplane Weight Category 60,000 pounds or more or Regional Jets.
Based on both the existing and future fleet mix the Airplane Weight Category over 12,500 pounds but less than 60,000 pounds is the critical group for the airport. Under this weight range, one of two “percentage of fleet” categories can be used (75 percent or 100 percent). Tables 3-1 and 3-2 of the advisory circular outline which aircraft make up 75% of the fleet and the remaining 25% of aircraft between 12,500 pounds up to and including 60,000 pounds maximum certificated takeoff weight. Most of these sized aircraft using ANE make up 75% of the fleet. Therefore, the 75% of fleet was used for this analysis. Typical aircraft are the Cessna Citation I, II, and III, the Learjet 35 and 45and the Falcon 10 and 20. Figure 3-1 of the advisory circular was used to calculate runway length requirements. The calculations consider airport elevation above mean sea level, mean daily maximum temperature of the hottest month and critical design aircraft. Based on the above analysis, to accommodate 75 percent of the fleet at 60% useful load, the runway length should be approximately 5,405 feet (adjusted for wet and slippery conditions). To accommodate 75 percent of the fleet at 90% useful load, the runway length should be approximately 7,000 feet long (adjusted for wet and slippery conditions). Another way to calculate runway length requirements is to use the Airport Design for microcomputers program that is part of FAA AC 150/5200-13-Airport Design. This program incorporates Airport elevation, mean daily maximum temperature, length of haul, and runway conditions. The following analysis was done as a cross check. The Airport Design for microcomputers program provides runway length requirement tables for six groups of aircraft: • Small airplanes with approach speeds of less than 30 knots • Small airplanes with approach speeds of less than 50 knots • Small airplanes with less than 10 passenger seats • Small airplanes with 10 or more passenger seats • Large airplanes of 60,000 pounds or less • Airplanes of more than 60,000 pounds
Based on the above criteria, the category of large airplanes of 60,000 pounds or less is the critical grouping of aircraft for the Anoka County-Blaine Airport since aircraft of this category will fly in and out of the airport more than 500 times per year; the runway length should be approximately 5,420 feet to accommodate 75 percent of these aircraft at 60% useful load and 7,000 feet to accommodate 75 percent of these aircraft at 90% useful load (each noted by a * in Table 3-7). In March 2009, Key Air, an FBO operator at ANE, requested MAC consider expanding the primary runway to 6,000 feet long, increase the dual-wheel weight-bearing capacity to 95,000 pounds and add a connector taxiway extension from their leased area south to Runway 9. They provided background information to support their request. The information was reviewed and a more in-depth analysis was done to determine if the information provided would change the recommended lengths determined using the standard Runway Length Requirements
24
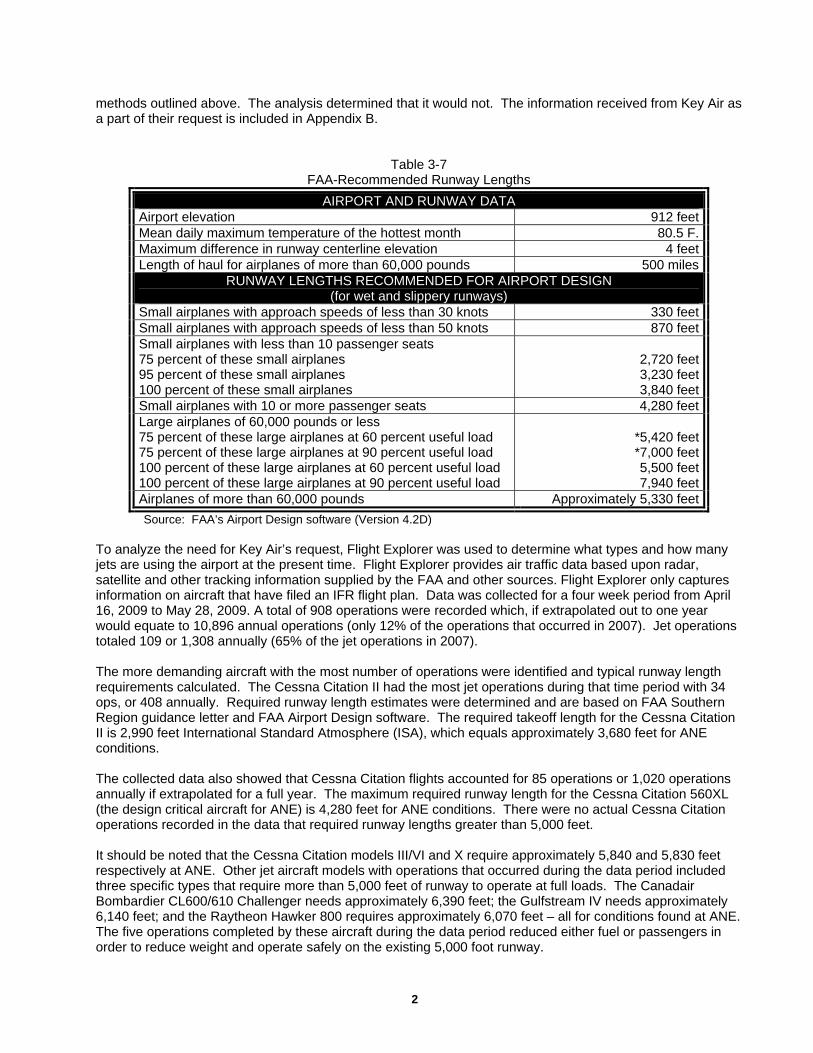
methods outlined above. The analysis determined that it would not. The information received from Key Air as a part of their request is included in Appendix B.
Table 3-7 FAA-Recommended Runway Lengths
AIRPORT AND RUNWAY DATA Airport elevation 912 feet Mean daily maximum temperature of the hottest month 80.5 F.Maximum difference in runway centerline elevation 4 feet Length of haul for airplanes of more than 60,000 pounds 500 miles
RUNWAY LENGTHS RECOMMENDED FOR AIRPORT DESIGN (for wet and slippery runways)
Small airplanes with approach speeds of less than 30 knots 330 feetSmall airplanes with approach speeds of less than 50 knots 870 feet Small airplanes with less than 10 passenger seats 75 percent of these small airplanes 95 percent of these small airplanes 100 percent of these small airplanes
2,720 feet3,230 feet3,840 feet
Small airplanes with 10 or more passenger seats 4,280 feet Large airplanes of 60,000 pounds or less 75 percent of these large airplanes at 60 percent useful load 75 percent of these large airplanes at 90 percent useful load 100 percent of these large airplanes at 60 percent useful load 100 percent of these large airplanes at 90 percent useful load
*5,420 feet *7,000 feet 5,500 feet 7,940 feet
Airplanes of more than 60,000 pounds Approximately 5,330 feet Source: FAA’s Airport Design software (Version 4.2D)
To analyze the need for Key Air’s request, Flight Explorer was used to determine what types and how many jets are using the airport at the present time. Flight Explorer provides air traffic data based upon radar, satellite and other tracking information supplied by the FAA and other sources. Flight Explorer only captures information on aircraft that have filed an IFR flight plan. Data was collected for a four week period from April 16, 2009 to May 28, 2009. A total of 908 operations were recorded which, if extrapolated out to one year would equate to 10,896 annual operations (only 12% of the operations that occurred in 2007). Jet operations totaled 109 or 1,308 annually (65% of the jet operations in 2007). The more demanding aircraft with the most number of operations were identified and typical runway length requirements calculated. The Cessna Citation II had the most jet operations during that time period with 34 ops, or 408 annually. Required runway length estimates were determined and are based on FAA Southern Region guidance letter and FAA Airport Design software. The required takeoff length for the Cessna Citation II is 2,990 feet International Standard Atmosphere (ISA), which equals approximately 3,680 feet for ANE conditions. The collected data also showed that Cessna Citation flights accounted for 85 operations or 1,020 operations annually if extrapolated for a full year. The maximum required runway length for the Cessna Citation 560XL (the design critical aircraft for ANE) is 4,280 feet for ANE conditions. There were no actual Cessna Citation operations recorded in the data that required runway lengths greater than 5,000 feet. It should be noted that the Cessna Citation models III/VI and X require approximately 5,840 and 5,830 feet respectively at ANE. Other jet aircraft models with operations that occurred during the data period included three specific types that require more than 5,000 feet of runway to operate at full loads. The Canadair Bombardier CL600/610 Challenger needs approximately 6,390 feet; the Gulfstream IV needs approximately 6,140 feet; and the Raytheon Hawker 800 requires approximately 6,070 feet – all for conditions found at ANE. The five operations completed by these aircraft during the data period reduced either fuel or passengers in order to reduce weight and operate safely on the existing 5,000 foot runway.
25
3.2.3 Runway Width and Shoulders The FAA establishes 75 feet as the required width for a runway supporting B-II ARC with visibility minimums not lower than ¾ miles and 100 feet for lower than ¾ mile. Both existing runways are 100’ wide. Runway 9-27 was widened in 2006 to 100-feet to accommodate the instrument landing system. Runway shoulders are intended to provide a transition surface between the runway pavement and the adjacent surface, to support aircraft running off the pavement, provide blast protection, and enhance erosion control and drainage. For B-II ARC, the required shoulder width is 10 feet. The airport meets this requirement. 3.2.4 Runway Orientation
For optimum runway design, the primary runway should be orientated to capture 95 percent of the crosswind component perpendicular to the runway centerline for any aircraft that is to use the airport. This is not always achievable. In cases where this cannot be done, a crosswind runway is recommended. A crosswind runway is also recommended when certain aircraft with lower crosswind capabilities are unable to utilize the primary runway, provided they have over 500 annual operations at that airport. According to criteria found in FAA Advisory Circular 150/5325-4B, Runway Length Requirements for Airport Design, dated July 1, 2005, crosswind runway length should be 100% of the recommended runway length for the aircraft with lower crosswind capabilities. If the crosswind runway is designed to accommodate the same aircraft as the primary runway, it should be the same length as the primary. If it is designed for different (typically smaller) aircraft, it should be designed to accommodate the needs of those aircraft. The primary runway only provides 90.26% for 10.5 knot crosswind coverage and 94.71% for 13 knots (see Table 3-4). The crosswind runway should be designed to accommodate smaller aircraft than the primary runway and therefore the recommended length of the crosswind runway is 2,720’ to accommodate 75% of these small aircraft up to 3,840’ to accommodate 100% of them. The crosswind runway is 4,855 feet long, and therefore, meets this requirement. 3.2.5 Runway Safety and Object Free Areas The Runway Safety Area (RSA) for Runway 09-27 at Anoka County meets FAA requirements for ARC II with ½ mile visibility minimums (600 feet beyond the runway end, and 300 feet wide). The RSA for Runway 18-36 meets FAA requirements for ARC-II with 1 mile visibility minimums (300 feet beyond the runway end, and 150 feet wide). The Runway Object Free Area (ROFA) is centered on the runway centerline and should be clear of any above ground objects protruding into the runway safety area edge elevation. The only exception to this rule is related to objects necessary for air navigation or aircraft ground movement. The standard ROFA extends 600 feet beyond the runway end and is 800 feet wide for Runway 09-27, it is 500 feet wide and extends 300 feet beyond the end of Runway 18-36. The runways meet these requirements.
The Runway Obstacle Free Zone (OFZ) is a defined airspace centered above the runway and extends 200 feet beyond each runway end. The width varies depending on the characteristics of the runway’s critical aircraft. For Anoka County, it is 400 feet wide for both Runways 09-27 and 18-36. The Runways meet FAA requirements. 3.2.6 Taxiway Requirements
The parallel taxiways and all connector taxiways are currently 40 feet wide. ADG II criteria for taxiway width are 35 feet.
26
For ADG II aircraft, the recommended runway centerline-to-taxiway centerline separation is 300 feet for approach minimums less than ¾ mile and 240 feet for approach minimums not lower than ¾ mile. For Runway 09-27, the parallel taxiway separation distance is 400 feet. Runway18-36 separation is 350 feet. Taxiway turnoffs should be present to facilitate aircraft exit off of the supported runway, to reduce incursions and minimize time on runway. The existing connectors currently provide this functionality and AC 150/5300-13 guidance will be utilized for proposed future parallel taxiway extensions. Paved or stabilized shoulders are recommended along taxiways. ADG II aircraft would require 10 foot shoulders. Anoka County-Blaine has 10-foot wide turf shoulders on its taxiways. The Taxiway Object Free Area (OFA) width for ADG II aircraft is 131 feet, which is met for most taxiways. However, there are some areas along Taxiway Charlie that do not meet this criteria at times, depending on aircraft parking at the FBO locations. The FAA-recommended taxilane OFA width is 115 feet for B-II airports. Any new hangar areas should be designed to meet this standard. Many of the existing taxilanes do not meet this standard for B-II aircraft. The FAA offers a calculation as an alternative that utilizes the wingspan of a particular aircraft to determine an adequate OFA. The formula takes the wingspan times 1.2, plus 20 feet. Based upon this calculation, the taxilanes in most building areas are designed for wingspan Group I aircraft (wingspan less than 49’). The Group II aircraft using the airport likely are hangared at FBO facilities or other areas where the adequate taxilane OFA is provided.
3.3 Landside Requirements
3.3.1 Hangar Facilities The Anoka County - Blaine Airport, like all of the MAC airports, has a wide variety of hangar sizes and hangar ages. In recent years, MAC has tried to standardize the size of hangars within new hangar areas at any of the Reliever Airports. However, aircraft also come in many different sizes, and trying to accommodate everyone leads to variability. As shown in Chapter 1, the airport is estimated to have 510 indoor aircraft storage spaces, with another 160 available when hangars are constructed in the new northwest building area. This number includes an assumption that most airport tenants sublease extra space for additional aircraft within their hangars, but also includes a small discount for those who opt not to lease extra space. Tenants own their hangars and lease the ground space from MAC. It is currently the policy of the MAC that no tenant can lease more space than they can justify with actual aircraft ownership. This practice has reduced the number of large hangar demands, and subsequently, reduces some of the subleasing opportunities at the airport. However, it is feasible that a tenant that owns a 3,600 square foot hangar and two aircraft can sell the hangar to a person who owns only one aircraft. That new tenant then would be allowed to sublet his extra space to house a second aircraft. According to the Chapter 2 forecasts, the number of based aircraft is anticipated to first rise from 437 in 2007 to 455 by the year 2010. This increase in the immediate future is attributed to the assumption that the newest FBO operator, Key Air, will begin to grow and fill out some of their available hangar space with corporate jet or other types of aircraft. After this initial demand is satisfied, the number of based aircraft is forecasted to decline to 414 by 2025. This is due to the forecasted drop in operations by the single and multi-engine piston aircraft. The airport currently has enough hangar capacity available through the planning period. 3.3.2 Fixed Base Operators At this time no additional space is needed for an FBO. Currently, the three existing FBOs can meet the demands from current air traffic levels.
27
3.3.3 Airport Access, Roadway Circulation and Parking At this time, there are no issues related to airport roadway access or parking. 3.3.4 Maintenance and Fuel Storage Areas At this time, there is no demand or requirement for additional maintenance equipment or fueling capabilities at the airport.
3.4 Lighting and Navigation Requirements
3.4.1 Runway and Taxiway Edge Lighting Runway edge lights are used to outline the edges of runways during periods of reduced visibility or darkness. These light systems are classified according to the intensity they are capable of producing. Currently there are high intensity runway edge lights (HIRLs) on Runway 9-27 and medium intensity runway lights on Runway 18-36. The runway lighting circuit for Runway 18-36 was replaced in 2007, and Runway 9-27 received all new wiring with the 2006 widening and extension. No upgrades are recommended at this time. Some of the taxiways at ANE have medium intensity taxiway lighting, primarily Taxiway B, the portion of Taxiway C north of Runway 9-27, and the taxiways in the new northwest building area. Taxiways that do not have lighting have blue reflectors. The existing systems are adequate for operations at the airport. 3.4.2 PAPI/VASI Precision Approach Path Indicator (PAPI) and Visual Approach Slope Indicator (VASI) systems consist of lights normally located on the left side of a runway that provide visual descent guidance information during an approach to a runway. The lights are visible from about 5 miles during the day and up to 20 miles at night. Currently there is a PAPI system on Runway 9 and Runway 27, and a VASI system on Runway 18 and Runway 36. MAC owns and maintains the PAPI systems. They were installed in 2006. The VASI systems are owned by the FAA, and it is expected they will upgrade to PAPIs at some point in the future. 3.4.4 Instrument Approach As noted in the inventory, Runway 27 has an Instrument Landing System (ILS) with a MASLR approach lighting system. The ILS system, consisting of a glideslope and localizer, we installed by the Minnesota Department of Transportation (Mn/DOT) in 2006 as a part of the runway extension and widening. Mn/DOT maintains the system. The MALSR system, installed in 2006, is owned and maintained by MAC.
3.5 Security Requirements
The Anoka County – Blaine Airport is fully surrounded by a security fence. It provides dual functions in providing security as well as help to keep the deer population outside of the fence and off the airfield. Fence installation began in the late 1980’s, with additions and improvements made well into the 1990’s. In 1999, automatic gates were installed at all three airport entrances.
28
The automatic gates have provided the appropriate amount of security, however, they require a significant amount of maintenance. This is due to there overall size and weight, as well as the constant frequency of use. It is recommended that these gates be upgraded with dual operators to reduce weight and provide for more reliable operation.
3.6 Utility Requirements
At this time, there is no demand or requirement for additional utilities at the airport. If a new hangar area is constructed, certain utility installations will be included in the project, including sanitary sewer and water, electricity, telephone, natural gas, etc.
3.7 Obstruction Related Issues
Obstructions, if any, are typically analyzed when an Airport Layout Plan (ALP) is prepared. Obstructions will be identified with a proposed disposition for each. In recent years, trees on airport property that were identified as potential obstructions were removed.
29
Chapter
4 Plan Recommendations In this chapter the different potential development options are analyzed for the airport. While the number of concepts could be infinite, the ones in this chapter have been developed taking into consideration the airport inventories, forecasted growth and facility requirements. In addition, other concepts or ideas arising from public input during the LTCP process also received consideration.
4.1 Airport Expansion - Runways and Hangar Areas
The Anoka County – Blaine Airport currently has two runways, as discussed in Chapter 1. Alternatives for airport runways can include additional runways at an airport or runway extensions, depending on existing needs, forecasts, and airfield capacity. 4.1.1 Additional Runways
As shown in the forecasts for 2007, the number of operations was 86,838. In Chapter 3, the maximum number of operations the airport can handle, the annual service volume, was identified as 230,000 operations based on the existing two runway configuration. Therefore, from an airside standpoint, the airport is currently at 38% capacity. The baseline 2025 forecast number of operations is lower than 2007. Under the high scenario, the 110,503 forecasted number of operations in 2025 would result in 48% capacity. None of these figures trigger the need to study additional runways at ANE at this time. However, past LTCPs for ANE have recommended parallel runways, showing forecasts that dictated a future need for additional capacity. MAC believes it is appropriate to continue to show the possibility of two additional runways as a concept in the comprehensive plan, and that they should continue to be considered in future LTCP updates even though likely beyond this current 20-year planning period. See Figure 4-1. 4.1.2 Runway Extension
As identified in the Chapter 1 inventory, Runway 9-27 is currently 5,000 feet long, and Runway 18-36 is currently 4,855-feet. A runway length of 5,000 feet is the maximum allowed under Minnesota State law for a Minor Use Airport such as ANE.
Chapter 3, Section 3.2.2 discusses the FAA recommendations for runway length. While the existing length serves the majority of airport users, some types of aircraft at certain loads and in certain weather conditions would be better served with a longer runway option. Therein lies the justification and need, which become the reasoning and provide the support for such a proposal.
As also discussed in Section 3.2.2, one of the airport FBOs requested MAC study the concept of extending Runway 9-27 to 6,000 feet. Their request also included a pavement strength increase to 95,000 pounds dual wheel gear. MAC staff studied the information submitted with the request, and asked for additional information to support and justify the request as well as demonstrate a need for the proposed extension. In lieu of providing the additional information, the request was formally withdrawn from consideration prior to completion of this document. Correspondence related to the request is included in Appendix B.
30
Data retrieved to analyze the runway extension request indicated there are aircraft operating at ANE that either reduce fuel or passenger loads in order to operate safely at ANE with the existing 5,000 feet. There does not appear to be a significant number of these operations, and there are certainly not enough operations by these types of aircraft to consider them as the design critical aircraft (more than 500 operations in a year). There is no demonstrated need, and therefore, an alternative examining a longer runway is not included in this document. While no runway extension will be included as a development concept in this LTCP Update, it is expected that a similar request may be submitted and studied at some point in the future. In order for a runway extension beyond 5,000 feet to be considered, there are several things that would need to be accomplished including, but not limited to:
• A request to study additional runway length must be received or existing use of the airport may identify a need to study longer runway lengths;
• MAC would need to determine if it is appropriate to update or amend the Long Term Comprehensive Plan, and the timing for such action;
• *The LTCP would need to provide adequate justification and show a demonstrated need in order for a runway extension to be identified as a preferred alternative;
• *The LTCP would also study whether it is appropriate to change the classification of the airport;
• *Minnesota State Statute 473.641 would need to be changed to allow for runways longer than 5,000 feet at Minor Airports such as the Anoka County – Blaine Airport;
• *Metropolitan Council would need to determine that the LTCP is consistent with their Development Guide;
• *MAC would need to adopt a LTCP that includes a longer runway as the preferred alternative;
• *An environmental review process is required – a State Environmental Impact Statement and a Federal Environmental Assessment (if federal funds are to be pursued), including but not limited to examination of potential impacts to wetlands, storm water, airport noise, land use, wildlife and plant species, historic/archeological areas, and air quality;
• The Airport Layout Plan would need to be updated to show the proposed runway extension and other associated changes, and be approved by the FAA;
• Funding for all of the necessary studies and construction implementation would need to be procured.
An asterisk (*) denotes steps that have a public involvement process.
4.1.3 Hangar Areas
The number of based aircraft registered for ANE in 2007 was 437 aircraft, as identified in the base year of the forecasts in Chapter 2. Chapter 3 indicated that there is an estimated 670 actual indoor hangar spaces at the airport, including the new northwest hangar area. This means the current landside capacity equates to about 65%. Under the high forecast, the based aircraft would reach 465, or approximately 69% capacity. No additional hangar areas are in demand within the planning period. However, past LTCPs and some environmental approvals for ANE have shown and recommended new hangar areas, showing forecasts that dictated a future need for additional hangar capacity. MAC believes it is appropriate to continue to show these hangar areas
31
as a concept in the comprehensive plan, and that they should continue to be considered in future LTCP updates even though beyond this current 20-year planning period. See Figure 4-2.
4.2 Recommended Improvements
As discussed above, there is no demonstrated need for additional runways, runway extensions or new hangar areas at the Anoka County – Blaine Airport at this time. There are, however, various airside and landside improvements that are recommended for implementation. They are itemized below.
4.2.1 Security Gates
As discussed in Chapter 3, all three of the airport entrance roads have power-operated automatic gates. These gates remain closed until a vehicle approaches, at which time they open for a short time then close again. The combined size and weight of the gates themselves in conjunction with the repetitive operation has resulted in high maintenance requirements for the gates. Improvements to the existing security gate system are recommended, including updating existing gates to dual operator systems, modifying gate locations, and installing additional fencing. Figure 4-3 identifies the existing gate locations. MAC is currently reviewing the potential development of a restaurant/event center within the airfield fence. One of the airport tenants is interested in owning, constructing and maintaining such a facility. If this development proceeds, the FAA has indicated some additional gate and fencing changes would be required to protect the airfield and help to prevent unknowing patrons from accessing the airfield. These changes, if necessary, can be accommodated within the project and paid for by the developer. 4.2.2 Taxiway Charlie Extension
The portion of Taxiway Charlie south of Runway 9-27 runs north/south along the west building area, adjacent to taxilane ends and certain apron areas. At times, aircraft may block the taxiway or encroach on the taxiway safety area due to the size of aircraft parking or their parking position. In addition, the location of the existing taxiway limits the ability for two of the airport FBOs to construct and maintain contiguous apron areas and better serve the types of corporate jet aircraft utilizing the airport. Previous long term comprehensive plans for ANE have shown a need for a future parallel north/south runway and a future parallel north/south taxiway to serve the runway. This extension of Taxiway Charlie is shown on Figure 4-4 along with two new taxiway connectors. While there is no need for a future runway at this time, the construction of the taxiway will provide alternative taxi routes on the airfield, as well as enhance operational movements on the south side of the airport. Moving the taxiway will provide an opportunity for the development of additional apron and aircraft parking space. 4.2.3 Xylite Street Relocation
As shown in Figure 4-2, there is a proposed future expansion to the existing east building area. The property where this building area annex would be constructed is on MAC property. MAC has envisioned a need for this hangar area for many years. It is, in fact, included in an agreement between MAC and the City of Blaine that dates back to September 2001. The Xylite Street relocation related to the future East Building Area Annex is currently shown in the MAC Capital Improvement Program, and will likely be constructed in advance of the hangar area addition. The existing section of Xylite Street adjacent to the airport is in need of reconstruction. Since constructing a new alignment makes more sense than reconstructing the road in its existing but temporary location, relocation of this road will be included as a recommendation in the LTCP Update. See Figure 4-5. In addition, the necessary environmental study and permitting has been completed for the street relocation.
32
33
4.2.4 Pavement Maintenance Program
Continued pavement reconstruction and rehabilitation as part of MAC’s on-going pavement maintenance program will be included as a recommendation.
4.2.5 Concurrent Use / Development Parcels
Continued research for and potential development of concurrent land uses for the purposes of generating revenue on airport property is included as a recommendation. The parcels that have been identified for this type of development are shown in Figure 4-6.
4.3 Other Recommendations
MAC will continue cooperation with the cities surrounding the airport through the existing Anoka County Airport Advisory Commission and on-going MAC/City staff interaction.
Chapter
5 Environmental Considerations
An integral part of the airport planning process focuses on the manner in which the airport and any planned enhancements to the facility pose environmental impacts. This chapter evaluates the environmental implications of the planned operation and development of the Anoka County - Blaine Airport.
5.1 Aircraft Noise
5.1.1 Quantifying Aircraft Noise
5.1.1.1 Basics of Sound
Sound is a physical disturbance in a medium, a pressure wave typically moving through air. A sound source vibrates or otherwise disturbs the air immediately surrounding the source, causing variations in pressure above and below the static (at-rest) value of atmospheric pressure. These disturbances force air to compress and expand, setting up a wavelike movement of air particles that move away from the source. Sound waves, or fluctuations in pressure, vibrate the eardrum creating audible sound.
The decibel, or dB, is a measure of sound pressure level that is compressed into a convenient range, that being the span of human sensitivity to pressure. Using a logarithmic relationship and the ratio of sensed pressure compared against a fixed reference pressure value, the dB scale accounts for the range of hearing with values from 0 to around 200. Most human sound experience falls into the 30 dB to 120 dB range.
Decibels are logarithmic and thus cannot be added directly. Two identical noise sources each producing 70 dB do not add to a total of 140 dB. The correct answer is 73 dB. Each time the number of sources is doubled, the sound pressure level is increased 3 dB.
Baseline: 70 dB
2 sources: 70 dB + 70 dB = 73 dB
4 sources: 70 dB + 70 dB + 70 dB + 70 dB = 76 dB
8 sources: 70 dB + 70 dB + 70 dB + 70 dB + 70 dB + 70 dB + 70 dB + 70 dB = 79 dB
The just-noticeable change in loudness for normal hearing adults is about 3 dB. That is, changes in sound level of 3 dB or less are difficult to notice. A doubling of loudness for the average listener of A-weighted sound is about 10 dB.1 Measured, A-weighted sound levels changing by 10 dBA effect a subjective perception of being “twice as loud”.2
Figure 5-1 provides the noise levels for various common sources.
1 A-weighted decibels represent noise levels that are adjusted relative to the frequencies that are most audible to the human ear. 2 Peppin and Rodman, Community Noise, p. 47-48; additionally, Harris, Handbook, Beranek and Vér, Noise and Vibration Control Engineering, among others.
34
5.1.1.2 Day-Night Average Sound Level (DNL)
In 1979 the United States Congress passed the Aviation Safety and Noise Abatement Act. The Act required the Federal Aviation Administration (FAA) to develop a single methodology for measuring and determining airport noise impacts. In January 1985 the FAA formally implemented the Day-Night Average Sound Level (DNL) as the noise metric descriptor of choice for determining long-term community noise exposure in the airport noise compatibility planning provisions of 14 C.F.R. Part 150. Additionally, FAA Order 1050.1, “Environmental Impacts: Policies and Procedures” and FAA Order 5050.4, “National Environmental Policy Act (NEPA) Implementing Instructions for Airport Actions,” outline DNL as the noise metric for measuring and analyzing aircraft noise impacts.
As detailed above, the FAA requires the DNL noise metric to determine and analyze noise exposure and aid in the determination of aircraft noise and land use compatibility issues around United States airports. Because the DNL metric correlates well with the degree of community annoyance from aircraft noise, DNL has been formally adopted by most federal agencies dealing with noise exposure. In addition to the FAA, these agencies include the Environmental Protection Agency (EPA), Department of Defense, Department of Housing and Urban Development, and the Veterans Administration.
The DNL metric is calculated by cumulatively averaging sound levels over a twenty four-hour period. This average cumulative sound exposure includes the application of a 10-decibel penalty to sound exposures occurring during the nighttime hours (10:00 PM to 7:00 AM). Since the ambient, or background, noise levels usually decrease at night the night sound exposures are increased by 10 decibels because nighttime noise is more intrusive.
Figure 5-2 provides examples of typical DNL levels in various environments.
The FAA considers the 65 DNL contour line as the threshold of significance for noise impact. As such, sensitive land use areas (e.g., residential) around airports that are located in the 65 or greater DNL contours are considered by the FAA as incompatible structures.
5.1.1.3 Integrated Noise Model (INM)
The Federal Aviation Administration's (FAA) Office of Environment and Energy (AEE-100) has developed the Integrated Noise Model (INM) for evaluating aircraft noise impacts in the vicinity of airports. INM has many analytical uses, such as assessing changes in noise impact resulting from new or extended runways or runway configurations and evaluating other operational procedures. The INM has been the FAA's standard tool since 1978 for determining the predicted noise impact in the vicinity of airports. Statutory requirements for INM use are defined in FAA Order 1050.1, “Environmental Impacts: Polices and Procedures” and FAA Order 5050.4, “National Environmental Policy Act (NEPA) Implementing Instructions for Airport Actions,” and Federal Aviation Regulations (FAR) Part 150, “Airport Noise Compatibility Planning.”
The model utilizes flight track information, runway use information, operation time of day data, aircraft fleet mix, standard and user defined aircraft profiles, and terrain as inputs. The INM model produces DNL noise exposure contours that are used for land use compatibility maps. The INM program includes built in tools for comparing contours and utilities that facilitate easy export to commercial Geographic Information Systems. The model also calculates predicted noise at specific sites such as hospitals, schools or other sensitive locations. For these grid points, the model reports detailed information for the analyst to determine which events contribute most significantly to the noise at that location. The model supports 16 predefined noise metrics that include cumulative sound exposure, maximum sound level and time-above metrics from both the A-Weighted, C-Weighted and the Effective Perceived Noise Level families.
The INM aircraft profile and noise calculation algorithms are based on several guidance documents published by the Society of Automotive Engineers (SAE). These include the SAE-AIR-1845 report titled "Procedure for the Calculation of Airplane Noise in the Vicinity of Airports," as well as others which address atmospheric
35
absorption and noise attenuation. The INM is an average-value-model and is designed to estimate long-term average effects using average annual input conditions. Because of this, differences between predicted and measured values can occur because certain local acoustical variables are not averaged, or because they may not be explicitly modeled in INM. Examples of detailed local acoustical variables include temperature profiles, wind gradients, humidity effects, ground absorption, individual aircraft directivity patterns and sound diffraction terrain, buildings, barriers, etc.
As detailed previously, INM considers multiple airport and aircraft operational and noise propagation variables. The primary inputs into the model include aircraft activity levels, fleet mix, day/night split of operations, flight tracks and runway use.
5.1.2 Noise Contour Development
The noise contours presented in this document were developed using INM Version 7.0a. The contours represent predicted levels, or noise contours, of equal aircraft noise exposure on the ground as expressed in DNL. The FAA currently suggests that three different DNL levels (65, 70, and 75 DNL) be modeled. The Metropolitan Council suggests that the 60 DNL contour be included for airports in an urban environment and the 55 DNL in cases where airports are located outside the Metropolitan Urban Service Area (MUSA).
The Metropolitan Airports Commission (MAC) owns and operates an Airport Noise and Operations Monitoring System (ANOMS) at Minneapolis/St. Paul International Airport (MSP). In addition to monitoring noise levels at 39 noise monitoring poles located around MSP, the system receives flight track data from the FAA radar located at MSP. The flight track data extends to approximately 40 miles around MSP. Anoka County - Blaine Airport is located approximately 16.5 miles from MSP. As such, radar flight track data in the vicinity of Anoka County - Blaine Airport was provided by ANOMS to aid in the INM input file development process. ANOMS flight track data from 2007 was utilized in the development of the 2007 Baseline INM Inputs. Due to the distance and geography between the FAA radar at MSP and operations in the vicinity of Anoka County - Blaine Airport, data acquisition/availability is reduced. However, for 2007 ANOMS reported 16,541 operations in the vicinity of Anoka County - Blaine Airport. This provided an adequate data sample for purposes of contributing to the construction of the INM input variables.
The following details the methodology utilized in developing the data inputs for the INM contour modeling.
5.1.2.1 Aircraft Activity Levels
The total number of Anoka County - Blaine Airport operations in 2007 was 86,838. As detailed in Chapter 2 the total number of 2007 operations was developed based on the control tower counts at the Anoka County - Blaine Airport. Supplemental ANOMS operations data was used to account for operations during the non-tower hours.
The 2025 preferred alternative forecast number of total operations at Anoka County - Blaine Airport is 79,560. The assumptions that were factored in the determination of the 2025 forecasted operations are detailed in Chapter 2 and Appendix A.
5.1.2.2 Fleet Mix
Using the ANOMS flight track data available in the vicinity of Anoka County - Blaine Airport for 2007, various data processing steps were taken to develop an actual 2007 fleet mix. The flight track analysis process began by first excluding all MSP carrier jet flight tracks. Then all flight tracks with a start point or end point that did not fall within a 10km radius and 1km (above ground level) ceiling around Anoka County - Blaine Airport were filtered out of the data. If the starting point of a track was within the radius/ceiling criteria around Anoka County - Blaine Airport it was considered a departure operation. If the endpoint of a track was within the radius/ceiling criteria around Anoka County - Blaine Airport it was considered an arrival operation.
36
The aircraft type distribution derived from the ANOMS flight track analysis was then applied to the 2007 total number of operations to develop the baseline 2007 fleet mix as detailed in Table 5-1.
The 2025 forecast fleet mix at Anoka County - Blaine Airport is provided in Table 5-2. The assumptions that were factored in the determination of the 2025 fleet mix are detailed in Chapter 2 and Appendix A.
5.1.2.3 Day/Night Split of Operations
Based on the ANOMS flight track fleet mix data sample for Anoka County - Blaine Airport the split of day and nighttime operations was determined. The daytime hours are defined as 7:00 a.m. to 10:00 p.m. and nighttime hours are 10:00 p.m. to 7:00 a.m.
The day/night operations distribution derived from the ANOMS flight track analysis was then applied to the 2007 total number of operations to develop the baseline 2007 day/night split as detailed in Table 5-1.
The 2025 forecast day/night operations at Anoka County - Blaine Airport are provided in Table 5-2.
5.1.2.4 Flight Tracks
The Baseline 2007 INM flight track locations were developed based on the flight track trends established by the ANOMS flight tracks that met the fleet mix data sample criteria for Anoka County - Blaine Airport. The 2007 INM flight tracks are provided in Figures 5-3(a-f) and the 2007 flight track use is detailed in Tables 5-3(a-c).
The 2025 INM flight tracks are also provided in Figures 5-3(a-f) and the 2025 flight track use is detailed in Table 5-4 (a-c).
5.1.2.5 Runway Use
Using the Anoka County - Blaine Airport fleet mix ANOMS flight track data set, a runway use analysis was conducted. The analysis first included the development of trapezoids off the end of each runway to determine which runway a flight track was operating on. Each trapezoid ran along the axis of the centerline beginning at the runway endpoint and extending 3km from runway end. The trapezoid was 0.1km wide at the runway end point and 1km wide at the extent furthest from the runway end. For the purpose of the runway use analysis the last five, or first five, radar points of each track in the vicinity of Anoka County - Blaine Airport were analyzed relative to the runway trapezoids.
In cases where the last five radar points of a track were in the vicinity of Anoka County - Blaine Airport, if any one of the radar points were located within a respective runway trapezoid, the track was assigned as an arrival operation on that runway. Conversely, in cases where the first five radar points were in the vicinity of Anoka County - Blaine Airport, if any one of the radar points were located within a respective runway trapezoid, the track was assigned as a departure operation on that runway. An operation was considered a “touch & go” if the track was assigned both an arrival and departure at the airport. The resultant runway use trends were then analyzed and adjusted relative to wind pattern data around Anoka County - Blaine Airport.
The 2007 runway use derived from the ANOMS flight track analysis is detailed in Table 5-5.
The 2025 forecast runway use at Anoka County - Blaine Airport is provided in Table 5-6.
37
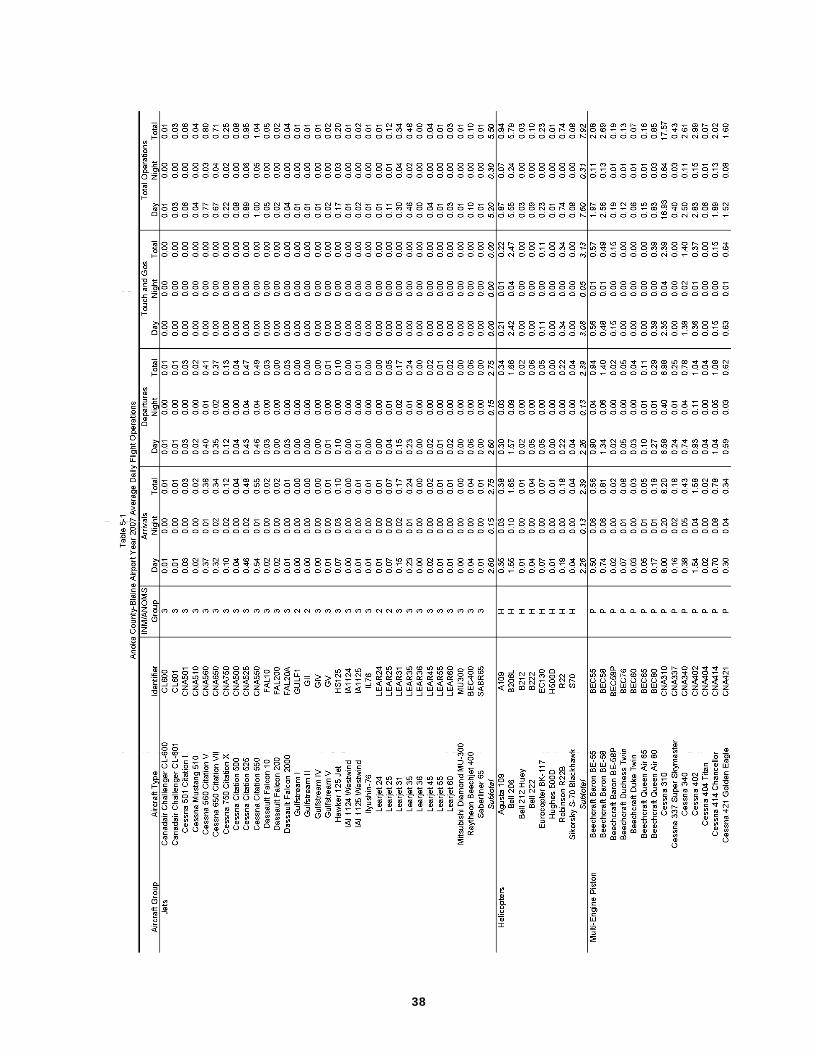
38
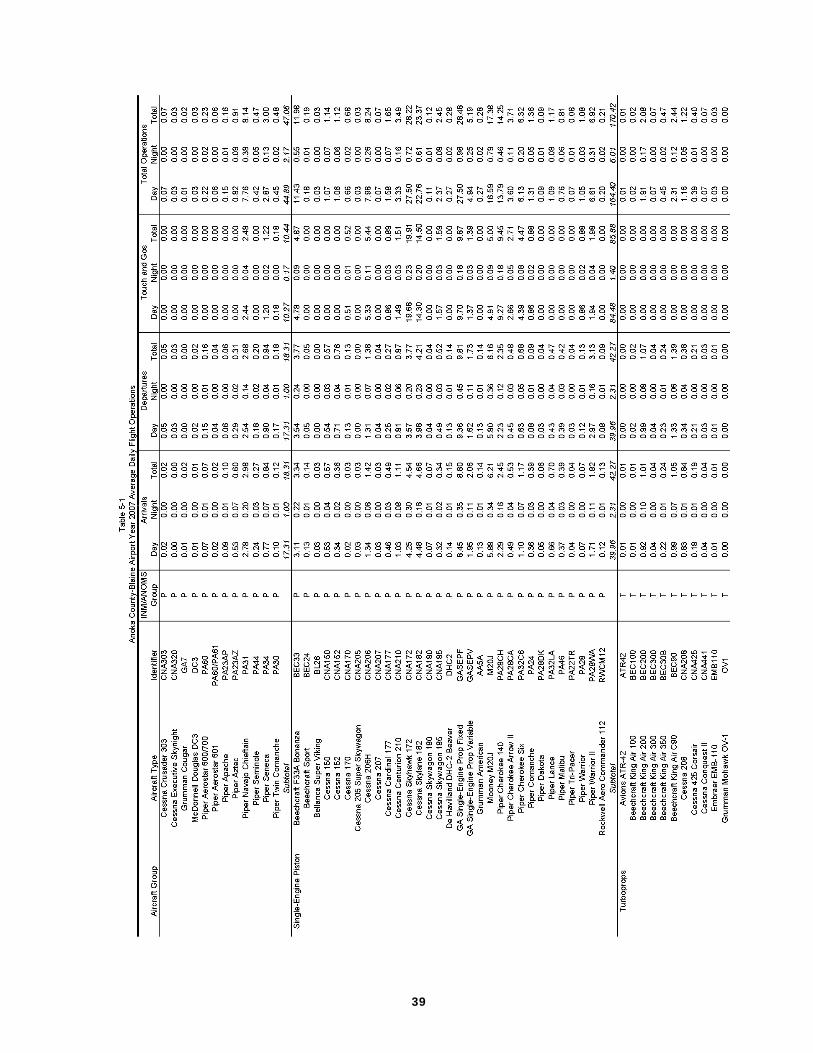
39
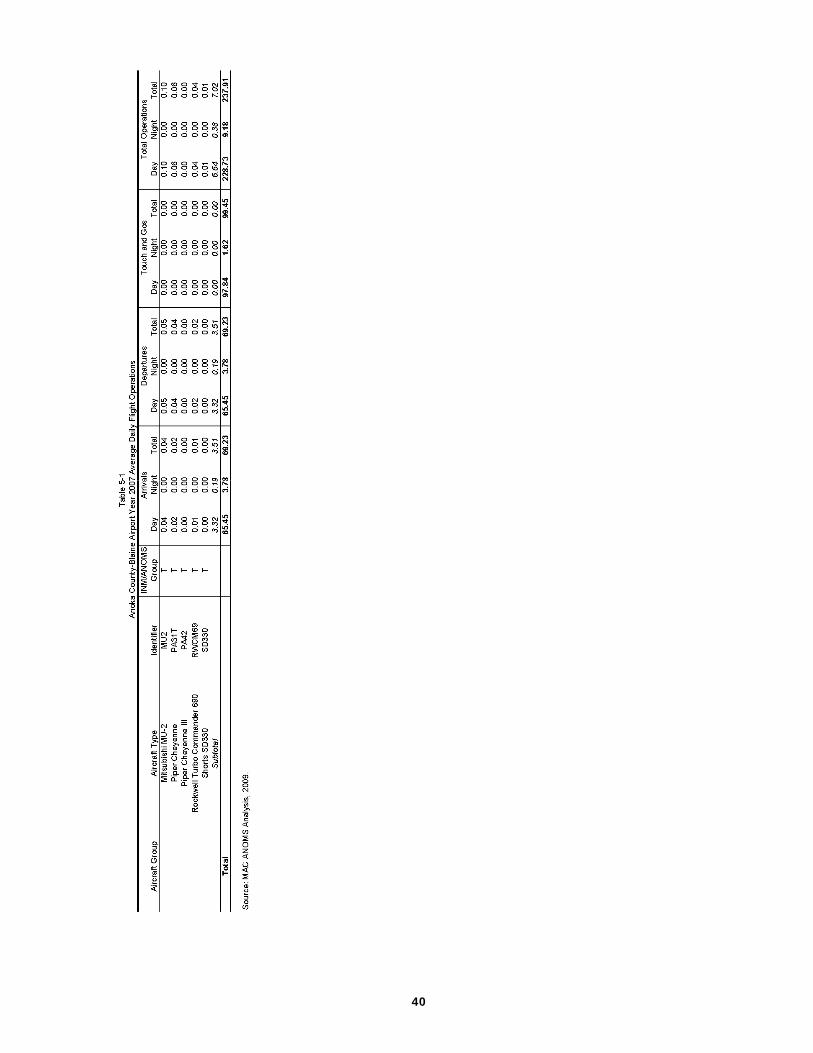
40
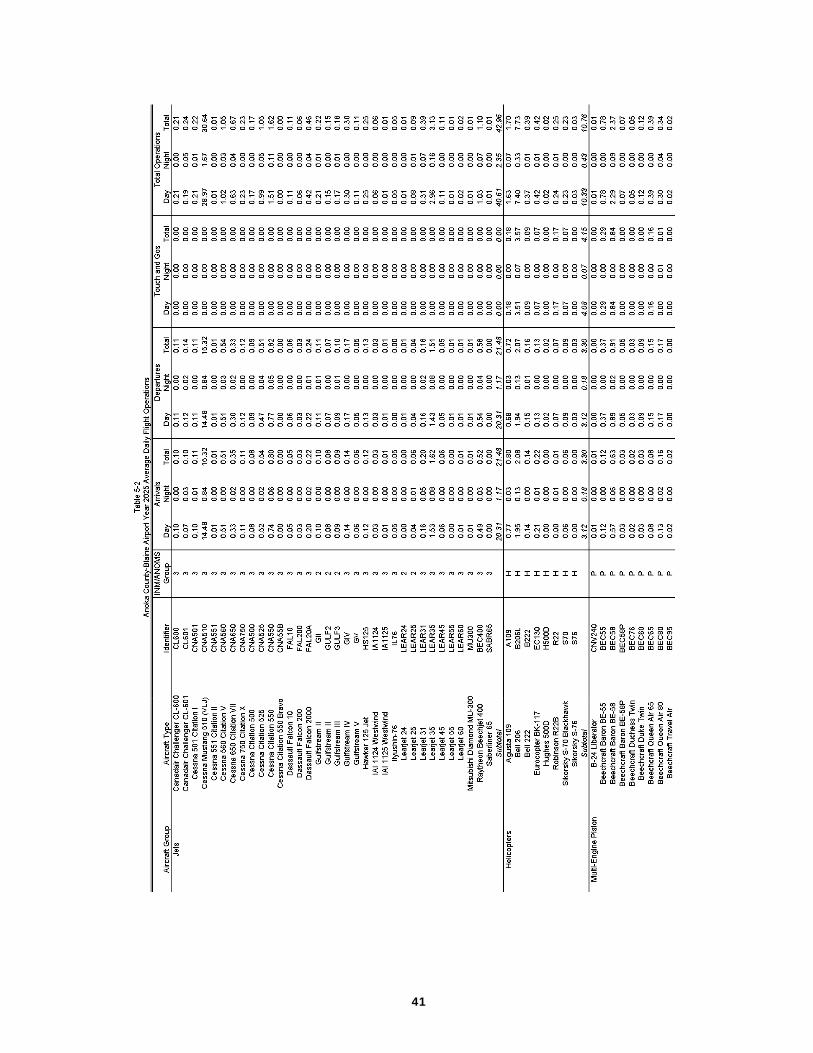
41
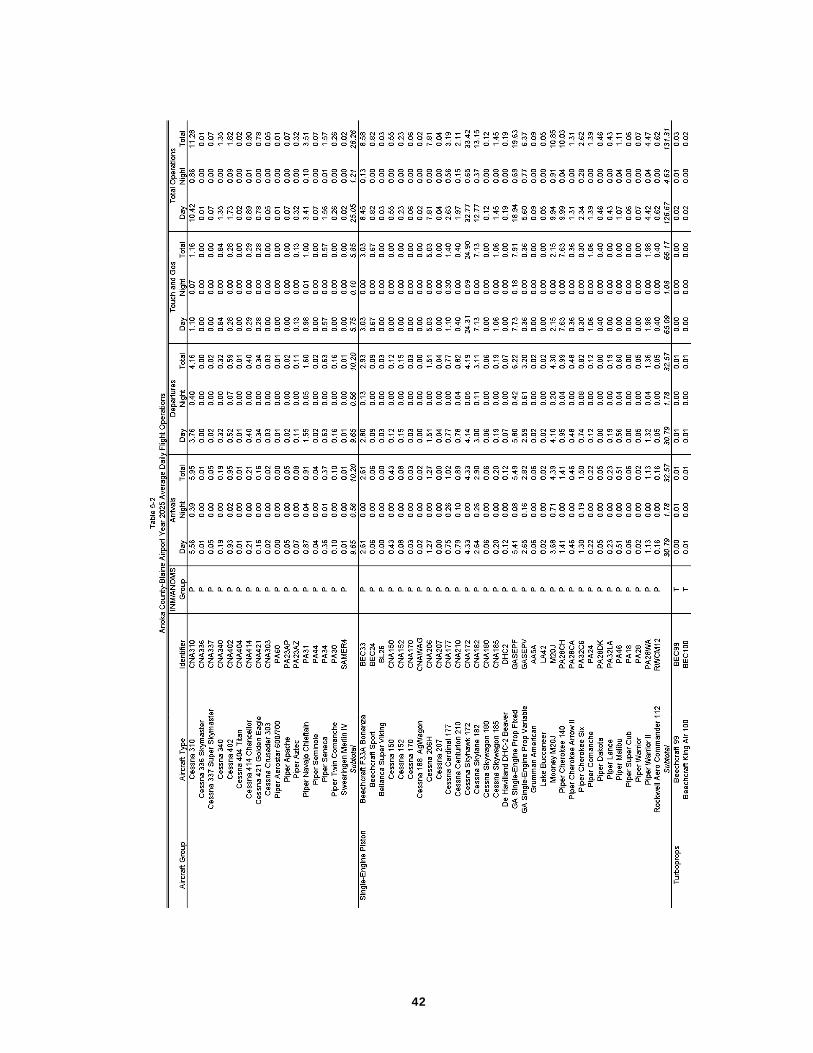
42
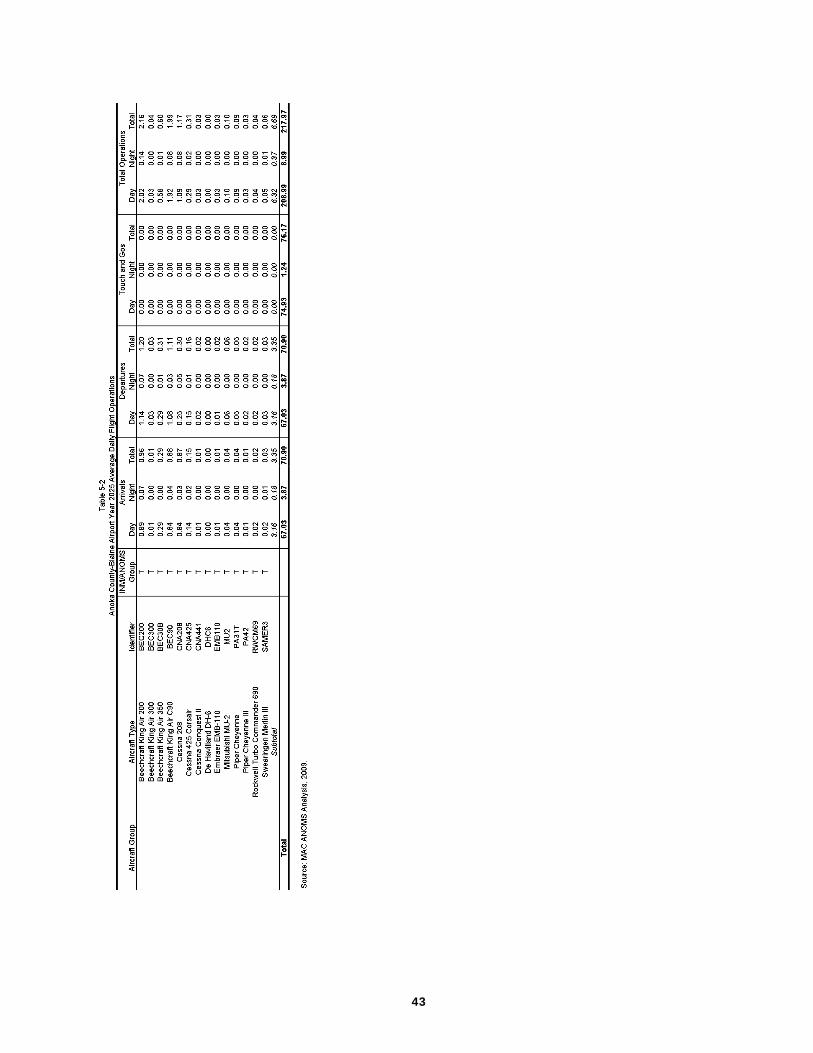
43
44
45
46
47
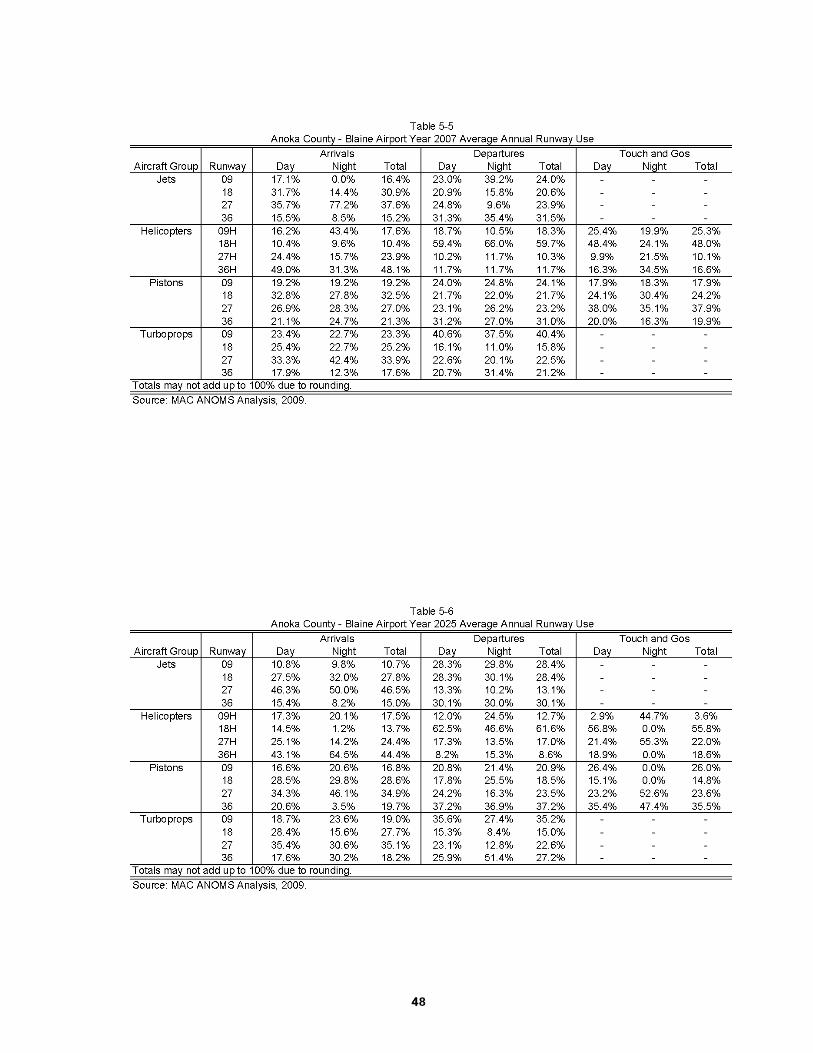
4
48 8
5.1.3 Baseline 2007 Noise Impacts
In the 2007 Baseline Noise Contours there are 45 single-family homes located in the 60 DNL contour around Anoka County - Blaine Airport. The 60 DNL contour contains approximately 0.96 square miles. The 65 DNL contour contains approximately 0.43 square miles with no residential dwellings in the contour. The entire 70 DNL contour is contained on the airport property, essentially overlying the areas immediately adjacent to the runways. The 2007 70 and 75 DNL contours contains 0.21 square miles and 0.09 square miles, respectively.
The 2007 Baseline Noise Contours are shown in Figure 5-4.
5.1.4 Forecast 2025 Noise Impacts
The Forecast 2025 noise contours around Anoka County - Blaine Airport contain approximately 0.97 square miles in the 60 DNL contour and approximately 0.43 square miles in the 65 DNL contour. The residential structures within the 60 DNL contour decrease to 12 single family homes. There are no residential units in the 2025 65 DNL contour. The 70 and 75 DNL contours contain 0.21 square miles and 0.09 square miles, respectively, with no residential structures in the contours. The 2025 noise contours are shown in Figure 5-5.
In summary, there will be a 1 percent increase in the 60 DNL contour, while the 65 DNL and greater contours remain relatively unchanged. Although there is a slight increase in the size of the 60 DNL contour, there is a decrease of 33 single family homes in the contour. The growth in the 60 DNL contour occurs primarily to the east of the airport over uninhabited non-residential areas. This can be attributed to more jet aircraft operations arriving on Runway 27 and departing from Runway 09 to the east of the airport.
5.2 Threatened and Endangered Plant Species
ANE is known to have populations of certain State protected plant species. In 2006, as a part of the permitting for the Runway 9-27 extension and ILS installation, MAC was required to mitigate for impacted populations of two endangered plant species (an orchid and a violet), as well as for a special concern species (a rush). This is detailed in the 2002 Federal Environmental Assessment and State Environmental Impact Statement. MAC dedicated an easement to the Department of Natural Resources (DNR) over 44 acres of MAC owned property where these species exist, and continues to manage the area for exotic plant eradication. The area has been defined as a Scientific and Natural Area by the DNR, who oversees the management and any permitting for pedestrian access to the area. Future projects at the airport must include a site survey for these and other threatened or endangered species to ensure there is no impact to existing populations, or that they are appropriately counted and mitigated for as necessary.
5.3 Water Quality and Wetlands
Numerous wetlands exist on MAC-owned property at ANE. These wetlands are regulated by either the DNR or the Wetland Conservation Act (WCA). WCA wetlands are regulated by the Coon Creek Watershed District or the Rice Creek Watershed District, depending on their location. Any projects completed at the airport require conformance with the watershed districts, WCA and/or DNR regulations regarding wetlands. Projects requiring environmental review would include alternatives that address avoidance, if possible, and if not, minimization of impacts. Appropriate mitigation would also be discussed should wetland impacts arise from any proposed projects.
49

50
Any environmental review will also include plans for storm water quality. Previous airport projects have required rate and volume controls, infiltration or other means to enhance water quality. These and other best management practices will continue with future projects listed in the preferred alternative.
5.4 Other Concerns
Other areas that will be studied in the environmental documents to be prepared for the preferred alternative development include, but are not limited to, air quality; farmlands; fish, wildlife and plant species; and historic/archeological research. A full study of these issues at this time is beyond the scope of this long term planning document.
Chapter
6 Land Use Compatibility
Planning for the maintenance and development of airport facilities is a complex process. Successfully developing airports requires insightful decision-making predicated on various facts that drive the need for the development of additional airport infrastructure. Furthermore, these efforts should consider surrounding community land uses. Airports cannot be developed in a vacuum; the development effort must consider the needs of the surrounding populations and the land uses in the area surrounding the airport. The success of airport planning is predicated on close consideration and coordination of surrounding land use to ensure compatibility with the communities around the airport.
Cities and airport operators are both responsible for the ongoing development of public assets. The development of U.S. airports, as well as city infrastructure is within the concept of conducting development predicated on the greater public interest. The responsible development of such community and airport infrastructure requires cooperative efforts on behalf of the airport proprietor and the community.
As city governments are responsible for the development and enhancement of city infrastructure, airport proprietors are responsible for the federally endorsed enhancement of our nation’s airport system. Airport operators would be remiss in their duties if such efforts did not consider the land use consequences of decisions made regarding airport development.
This chapter evaluates the land use implications of the planned operation and development of the Anoka County - Blaine Airport.
6.1 Land Use Compatibility Criteria
The Federal Aviation Administration has established Land Use Compatibility criteria in 14 C.F.R. Part 150 detailing acceptable land uses around airports considering noise impacts in terms of DNL. In the case of airports located in the Minneapolis/St. Paul Metropolitan Area additional criteria also must be evaluated in relation to noise exposure as established by the Metropolitan Council’s Transportation Policy Plan (TPP).
6.1.1 Federal Aviation Administration Land Use Compatibility Guidelines
Federal guidelines for compatible land use that take into account the impact of aviation noise have been developed for land near airports. They were derived through an iterative process that started before 1972. Independent efforts by the FAA, HUD, USAF, USN, EPA and other Federal agencies to develop compatible land use criteria were melded into a single effort by the Federal Interagency Committee on Urban Noise in 1979, and resulted in the FICUN Guidelines document (1980). The Guidelines document adopted DNL as its standard noise descriptor, and the Standard Land Use Coding Manual (SLUCM) as its standard descriptor for land uses. The noise-to-land use relationships were then expanded for FAA’s Advisory Circular Airport-Land Use Compatibility Planning. The current individual agency compatible land use criteria have been, for the most part, derived from those in the FICUN Guidelines. Airport environments pertain only to certain categories of these guidelines.3
In 1985 the FAA adopted 14 C.F.R. Part 150 outlining land use compatibility guidelines around airports. Table 6-1 provides the land use compatibility guidelines as established by the FAA.
3 Federal Interagency Committee On Noise (FICON), “Federal Agency Review of Selected Airport Noise Analysis Issues, “ (1992), pp. 2-6 to 2-7.
51
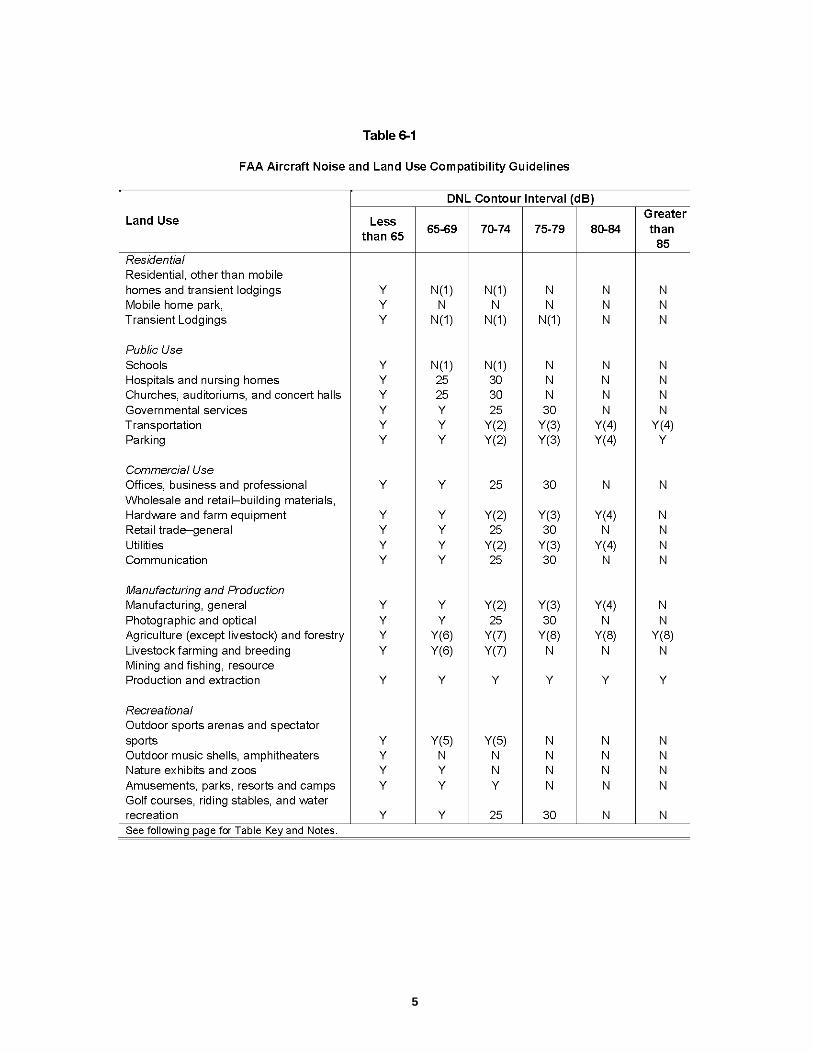
52
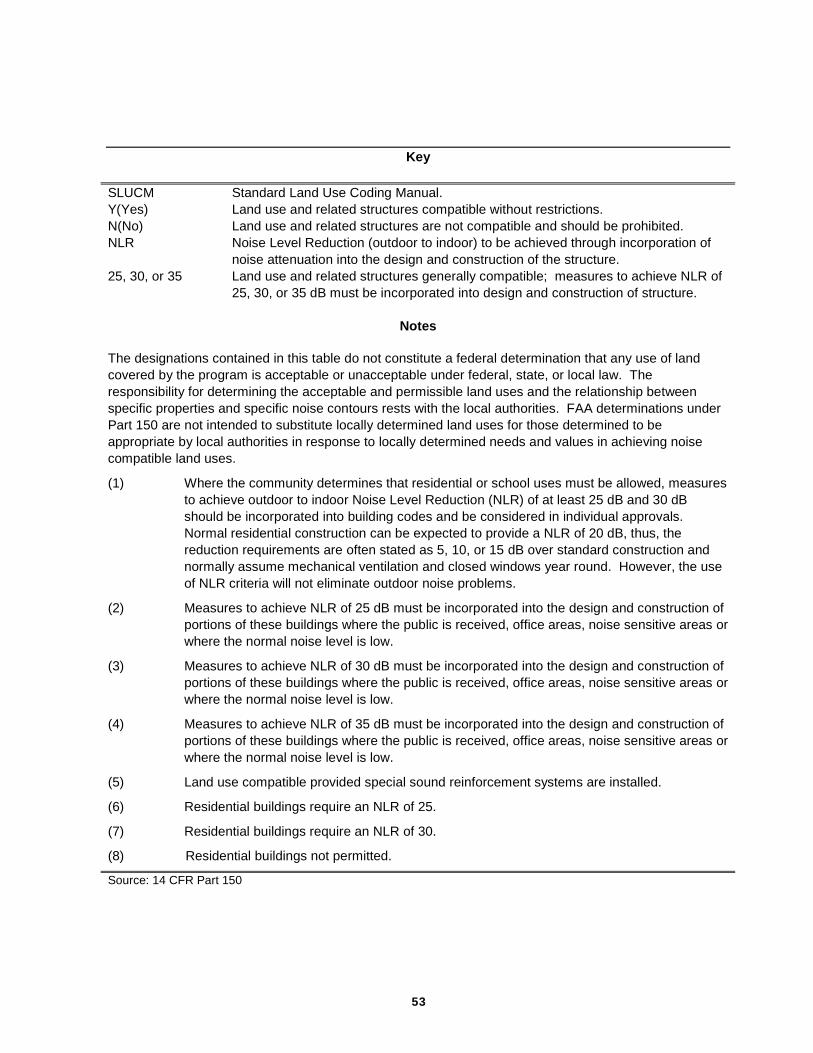
5
Key
SLUCM Standard Land Use Coding Manual. Y(Yes) Land use and related structures compatible without restrictions. N(No) Land use and related structures are not compatible and should be prohibited. NLR Noise Level Reduction (outdoor to indoor) to be achieved through incorporation of
noise attenuation into the design and construction of the structure. 25, 30, or 35 Land use and related structures generally compatible; measures to achieve NLR of
25, 30, or 35 dB must be incorporated into design and construction of structure.
Notes The designations contained in this table do not constitute a federal determination that any use of land covered by the program is acceptable or unacceptable under federal, state, or local law. The responsibility for determining the acceptable and permissible land uses and the relationship between specific properties and specific noise contours rests with the local authorities. FAA determinations under Part 150 are not intended to substitute locally determined land uses for those determined to be appropriate by local authorities in response to locally determined needs and values in achieving noise compatible land uses.
(1) Where the community determines that residential or school uses must be allowed, measures to achieve outdoor to indoor Noise Level Reduction (NLR) of at least 25 dB and 30 dB should be incorporated into building codes and be considered in individual approvals. Normal residential construction can be expected to provide a NLR of 20 dB, thus, the reduction requirements are often stated as 5, 10, or 15 dB over standard construction and normally assume mechanical ventilation and closed windows year round. However, the use of NLR criteria will not eliminate outdoor noise problems.
(2) Measures to achieve NLR of 25 dB must be incorporated into the design and construction of portions of these buildings where the public is received, office areas, noise sensitive areas or where the normal noise level is low.
(3) Measures to achieve NLR of 30 dB must be incorporated into the design and construction of portions of these buildings where the public is received, office areas, noise sensitive areas or where the normal noise level is low.
(4) Measures to achieve NLR of 35 dB must be incorporated into the design and construction of portions of these buildings where the public is received, office areas, noise sensitive areas or where the normal noise level is low.
(5) Land use compatible provided special sound reinforcement systems are installed.
(6) Residential buildings require an NLR of 25.
(7) Residential buildings require an NLR of 30.
(8) Residential buildings not permitted.
Source: 14 CFR Part 150
3
According to FAA standards, areas with noise levels less than 65 DNL are considered compatible with residential development.
6.1.2 Metropolitan Council Land Use Compatibility Guidelines
The Metropolitan Council has developed a set of land-use planning guidelines for responsible community development in the Minneapolis-St. Paul Metropolitan Area. The intent is to provide city governments with a comprehensive resource with regard to planning community development in a manner that considers adequacy, quality and environmental elements of planned land-uses.
Specifically, the Minnesota State Land Planning Act, the underlying law that requires local units of government to prepare a comprehensive plan and submit it for Metropolitan Council review, was enacted in 1976. By 1980, all community plans had been approved. The 1973 Aviation Chapter of the Metropolitan Development Guide was updated in 1977. In 1983, the Metropolitan Council amended the Aviation Policy Plan to include “Land Use Compatibility Guidelines for Aircraft Noise.”
In 1994, the Land Planning Act of 1976 had been amended to require communities to update their comprehensive plans at least every ten years. Therefore, all Metropolitan Development Guide chapters were updated by December 1996.
Under the 1976 legislation, communities designated land uses and defined the zoning applicable to the particular land use parcel; the zoning took precedence. The land use measure was a request that local jurisdictions review existing zoning in Airport Noise Zones to determine their consistency with the regional compatibility guidelines, and rezone the property for compatible development if consistent with other development factors. This policy changed in 1994.
Under the amended Land Planning Act, communities determine the land use designation, and the zoning must be consistent with that designation. Thus, the communities had to re-evaluate designated use, permitted uses within the designation, zoning classifications, and adequacy.
In 2004 the Aviation Policy Plan was incorporated into the Transportation Policy Plan (TPP) of the Metropolitan Development Guide. Land use compatibility guidelines for all metropolitan system airports are included in the TPP. It has since been updated in January 2009.
In the case of airports located in the Minneapolis/St. Paul Metropolitan Area, the Metropolitan Council Development Guidelines in relation to airport noise exposure need to be considered. The TPP provides land use guidelines based on 4 noise zones around an airport. The following provides the Metropolitan Council’s description of each noise zone:
• Zone 1 – Occurs on and immediately adjacent to the airport property. Existing and projected noise intensity in the zone is severe and permanent. It is an area affected by frequent landings and takeoffs and subjected to aircraft noise greater than 75 DNL. Proximity of the airfield operating area, particularly runway thresholds, reduces the probability of relief resulting from changes in the operating characteristics of either the aircraft or the airport. Only new, non-sensitive, land uses should be considered – in addition to preventing future noise problems the severely noise-impacted areas should be fully evaluated to determine alternative land use strategies including eventual changes in existing land uses.4
4 Metropolitan Council 2030 Transportation Policy Plan, Appendix L, adopted in January 2009.
54
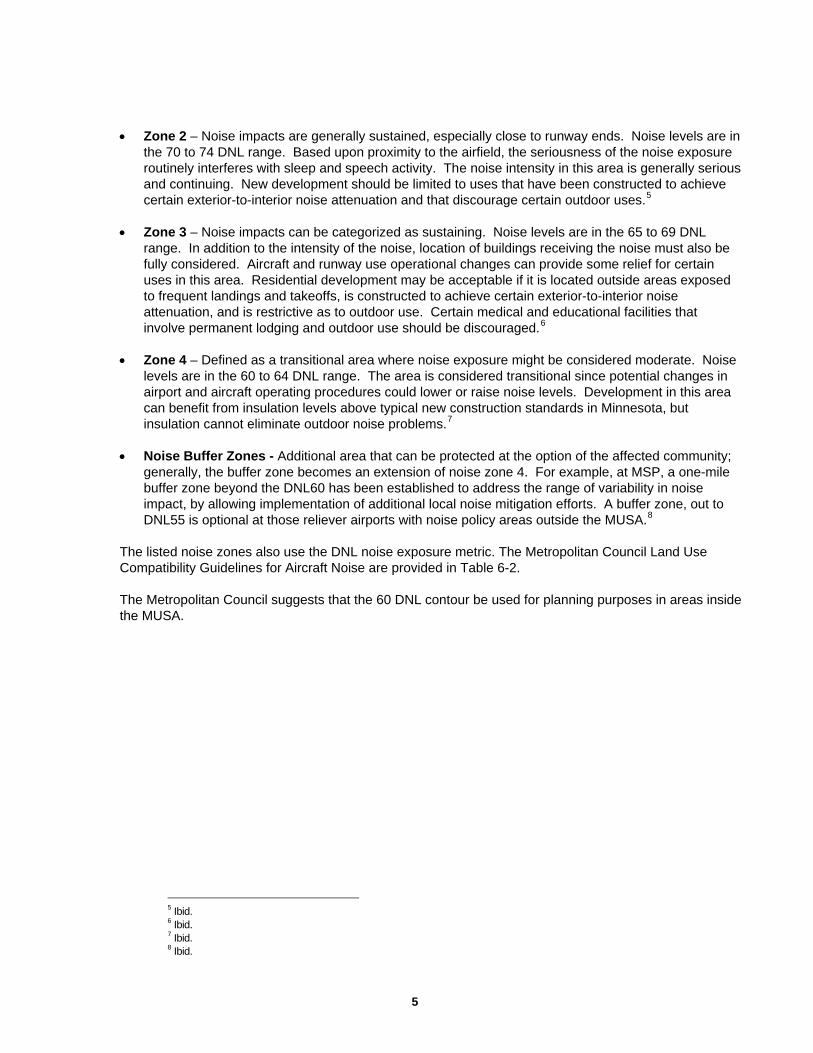
• Zone 2 – Noise impacts are generally sustained, especially close to runway ends. Noise levels are in the 70 to 74 DNL range. Based upon proximity to the airfield, the seriousness of the noise exposure routinely interferes with sleep and speech activity. The noise intensity in this area is generally serious and continuing. New development should be limited to uses that have been constructed to achieve certain exterior-to-interior noise attenuation and that discourage certain outdoor uses.5
• Zone 3 – Noise impacts can be categorized as sustaining. Noise levels are in the 65 to 69 DNL range. In addition to the intensity of the noise, location of buildings receiving the noise must also be fully considered. Aircraft and runway use operational changes can provide some relief for certain uses in this area. Residential development may be acceptable if it is located outside areas exposed to frequent landings and takeoffs, is constructed to achieve certain exterior-to-interior noise attenuation, and is restrictive as to outdoor use. Certain medical and educational facilities that involve permanent lodging and outdoor use should be discouraged.6
• Zone 4 – Defined as a transitional area where noise exposure might be considered moderate. Noise levels are in the 60 to 64 DNL range. The area is considered transitional since potential changes in airport and aircraft operating procedures could lower or raise noise levels. Development in this area can benefit from insulation levels above typical new construction standards in Minnesota, but insulation cannot eliminate outdoor noise problems.7
• Noise Buffer Zones - Additional area that can be protected at the option of the affected community; generally, the buffer zone becomes an extension of noise zone 4. For example, at MSP, a one-mile buffer zone beyond the DNL60 has been established to address the range of variability in noise impact, by allowing implementation of additional local noise mitigation efforts. A buffer zone, out to DNL55 is optional at those reliever airports with noise policy areas outside the MUSA.8
The listed noise zones also use the DNL noise exposure metric. The Metropolitan Council Land Use Compatibility Guidelines for Aircraft Noise are provided in Table 6-2.
The Metropolitan Council suggests that the 60 DNL contour be used for planning purposes in areas inside the MUSA.
5 Ibid. 6 Ibid. 7 Ibid. 8 Ibid.
55
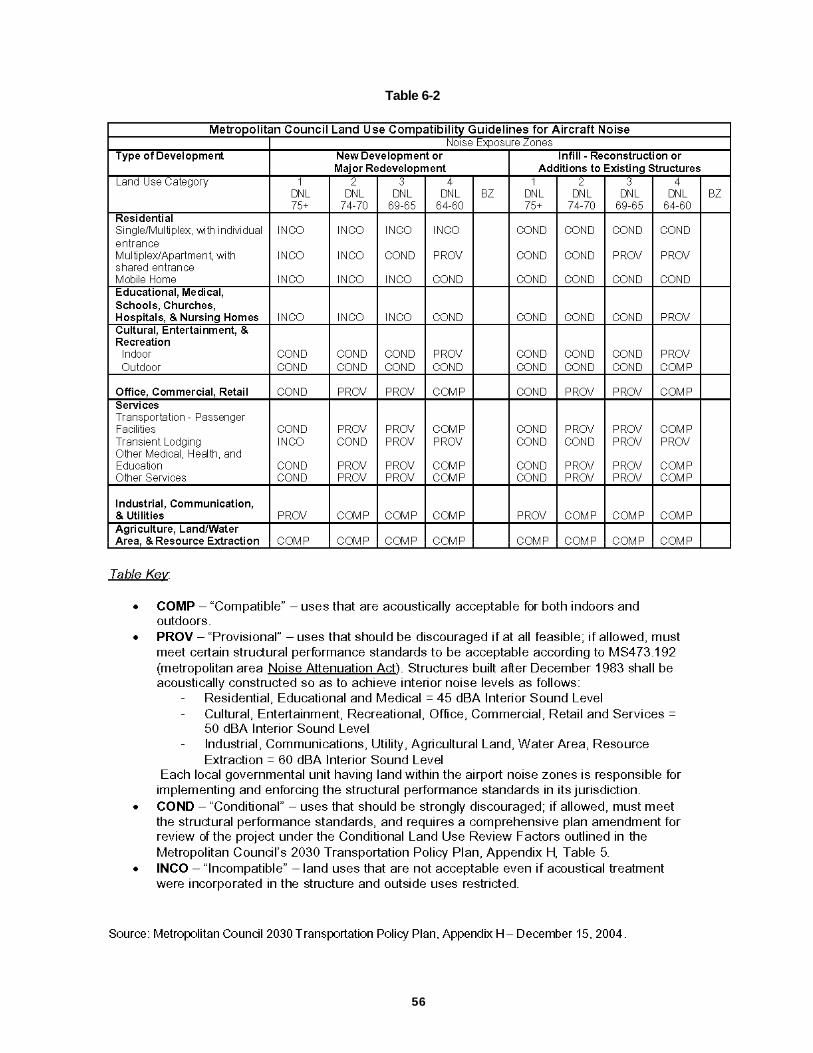
5
Table 6-2
6
6.1.3 Runway Safety Zones
The State of Minnesota Department of Transportation (Mn/DOT) has established regulations that control the type of development allowed off runway ends in order to prevent incompatible development. These guidelines should be used to establish zoning ordinances to protect areas around an airport. The states zoning areas overlay and extend beyond the RPZs. The most restrictive areas created by Mn/DOT regulations are called State Safety Zones A and B. The safety zones should exist off each runway end and follow the approach zones out to the total length of the runway. The recommended length of Safety Zone A is 2/3 of the total runway length; Safety Zone B is 1/3 of the total runway length and extends from Safety Zone A. There is also an area called Safety Zone C which is circular and typically follows the FAAs FAR Part 77 horizontal surface.
Safety Zone A does not allow any buildings or temporary structures, places of public assembly or transmission lines. Permitted uses include agriculture, livestock, cemeteries and auto parking areas.
Safety Zone B does not allow places of public or semipublic assembly (i.e. churches, hospitals, schools) and is subject to site-to-building area ratios and site population limits. Permitted uses are generally the same as Zone A, plus some low-density developments.
Safety Zone C does not allow use that causes interference with radio or electronic facilities on the airport or interference with radio or electronic communications between the airport and aircraft, lighting that makes it difficult for pilots to distinguish between airport lights and other lights or that results in glare in pilot's eyes, and lighting that impairs visibility in the airport vicinity.
A complete description and copy of the Minnesota Rules Chapter 8800 Department of Transportation Aeronautics Section 2400 Airport Zoning Standards can be found at http://www.dot.state.mn.us/aero/avoffice/planning/zoning.html.
Mn/DOT prefers that airports own all of State Zone A. For land within the area that is not airport-owned, land use protection is recommended by including the safety zones in local zoning codes and zoning maps. Inclusion of the safety zones on community Comprehensive Plans is also strongly encouraged. The RPZ’s and recommended State Safety Zones for Anoka County - Blaine Airport are shown on Figure 6-1.
6.2 Land Use Compatibility Analysis
The Anoka County - Blaine Airport is located in Anoka County, north of the City of Minneapolis. The airport is located in the City of Blaine and is bordered to the south by Mounds View and to the east by Lexington. The airport is bordered by primarily residential land uses to the south and southeast. A combination of mixed use industrial, commercial and single family residential exists to the northeast of the airport. The airport is primarily bordered by mixed use industrial, commercial and retail development to the northwest and southwest. The City of Blaine has adopted minimum noise abatement construction standards for homes located in close proximity to the airport. The City’s zoning ordinance contains height limits for structures over 50 feet.
The following sections detail land use considerations in the context of existing and planned land uses around Anoka County - Blaine Airport focusing on airport noise and runway safety zones.
57
6.2.1 Existing Condition Land Use Compatibility
In general, the area around the airport is primarily residential to the south and southeast and a combination of commercial/industrial and park/open space land uses to the northeast, northwest, west and southwest. Residential uses border portions of airport property to the east and southeast. Commercial/industrial uses border Highway 65 along the west side of the airport and Highway 10 on the south/southwest side of the airport.
6.2.1.1 Land Use Compatibility and Airport Noise Considerations
As detailed in Chapter 5, Section 5.1, the 2007 baseline noise contours around Anoka County - Blaine Airport contain 45 single-family homes in the 60 DNL and no single family homes in the 65 and greater DNL noise contours.
Figure 6-2 provides the 2007 baseline 60 and greater DNL noise contours around Anoka County - Blaine Airport with 2005 land use data provided by the Metropolitan Council. As is detailed on the map, areas of residential use are contained within the 60 DNL noise contour to the southeast of the airport.
The 2007 baseline 65 and greater DNL contours are contained on airport property.
6.2.1.2 Land Use Compatibility and Existing Runway Protection/Safety Zones
The existing RPZs and State Safety Zones A and B for Runways 09/27 and 18/36 at Anoka County - Blaine Airport are depicted in Figure 6-3 with the existing land uses around the airport.
The Runway 18 RPZ encompasses 14.0 total acres; entirely on airport property. State Zone A contains 61.15 total acres; all are airport property. State Zone B contains 48.6 total acres; 35.2 acres are on airport property, 8.0 acres are agricultural, 3.4 acres are institutional, 1.7 acres are undeveloped, 0.3 acres retail and other commercial and less than 0.1 acres are on a golf course.
The Runway 36 RPZ encompasses 13.7 total acres on airport property. State Zone A contains 61.2 total acres; all are airport property. State Zone B contains 48.6 total acres; 45.7 acres are on airport property, 1.9 acres are major highway, 0.7 acres are undeveloped land, 0.3 acres are industrial and utility, and less than 0.1 acres are institutional.
The Runway 27 RPZ encompasses 78.8 total acres; 75.9 acres are airport property, 2.1 acres are undeveloped, and 0.8 acres are single family residential. The RPZ includes 3 single family homes. State Zone A contains 114.7 total acres; 105.0 acres are airport property, 2.3 acres are single family residential, 3.3 acres are undeveloped, and 4.1 acres are major highway. There are 7 single family residential structures located in State Zone A. State Zone B contains 85.7 total acres, 17.9 acres are on airport property, 33.7 acres are major highway, 32.8 acres are undeveloped and 1.3 acres are industrial and utility.
The Runway 09 RPZ encompasses 48.9 total acres on airport property. State Zone A contains 114.7 total acres; 112.0 acres are airport property, 1.5 acres are retail and other commercial, 0.8 acres are industrial and utility and 0.4 acres are undeveloped. State Zone B contains 86.0 total acres, 11.2 are on airport property, 19.8 acres are retail and other commercial, 11.6 acres are undeveloped land, 11.8 acres are major highway and 31.6 acres are manufactured housing park. There are 198 manufactured housing units located in State Zone B.
58
6.2.2 Preferred Alternative Land Use Compatibility
The preferred development alternative at Anoka County - Blaine Airport maintains the existing airport infrastructure and runway lengths. The decrease in overall operations, increase in total jet operations and changes in forecast runway use percentages results in changes to the noise contour.
6.2.2.1 Forecast Land Use Compatibility and Airport Noise Considerations
As detailed in Chapter 5, Section 5.1, the 2025 preferred alternative forecast 60 and greater DNL noise contours around Anoka County - Blaine Airport contains 12 single family homes. The 2025 preferred alternative forecast 65 DNL and greater contours are contained on airport property.
Figure 6-4 provides the 2025 preferred alternative forecast 60 and greater DNL noise contours around Anoka County - Blaine Airport with 2005 land use data provided by the Metropolitan Council.
The preferred development alternative does not include residential structures in recognized airport noise areas as outlined in the FAA land use guidelines in Table 6-1.
6.2.2.2 Land Use Compatibility and Preferred Alternative Runway Protection/Safety Zones
The preferred alternative RPZs and state safety zones A and B for Runways 09/27, and 18/36 at Anoka County - Blaine Airport are the same as the 2007 RPZs and zones. They are depicted in Figure 6-3 with existing land uses around the airport.
In the future the MAC will be convening a Joint Airport Zoning Board (JAZB) that will include the respective Responsible Governmental Units (RGUs) that control land use development around the Anoka County - Blaine Airport. This effort will address land uses around Anoka County - Blaine Airport in the context of the Preferred Alternative runway zones and may result in modification to the State Model Safety Zone dimensions and development restrictions. The airport zoning process is spelled out in detail in Minn. Stat. Chap. 360, 360.061 – 360.074 and Minn. Rules Chap. 8800.1200 and 8800.2400. Specifically, Minn. Stat. § 360.062 establishes that “airport hazards” endanger lives, property and airport utility and should be prevented, with consideration given to avoiding the disruption of existing land uses based on social and financial costs. In an effort to prevent the creation or establishment of “airport hazards,” the statute states that “the Metropolitan Airports Commission shall request creation of one joint airport zoning board for each airport operated under its authority.” The statute states that “A joint board shall have as members two representatives appointed by the municipality owning or controlling the airport and two from the county or municipality, or in case more than one county or municipality is involved two from each county or municipality, in which the airport hazard is located, and in addition a chair elected by a majority of the members so appointed.”
The goal of the JAZB will be to develop a Anoka County - Blaine Airport Zoning Ordinance for review and approval by the Commissioner of Transportation, for subsequent adoption by the Board and then by local municipalities. The Board will determine if the state model zoning ordinance provisions are appropriate for the Anoka County - Blaine Airport or if modifications to the model are necessary considering the provisions of Minn. Stat. §360.066, subd. 1. The focus of this discussion is likely to be on the following:
• MnDOT Model Ordinance – Minnesota Rule 8800.2100 and Minnesota Rule 8800.2400 (additional information on the MnDOT Model Zoning Ordinance is available on the Internet at http://www.dot.state.mn.us/aero/avoffice/planning/zoning.html)
• Anoka County - Blaine Airport unique characteristics in the context of existing and planned land uses around the airport
59
• Maintaining a “reasonable standard of safety” while considering the social and financial costs to the community
• Minn. Stat. §360.066, subd. 1, which is especially instructive when addressing the question of balancing the safety with the social and economic impacts in the zoning process.
6.3 Concurrent Land Use / Development Areas on Airport Property
As discussed in Chapter 4, MAC is currently analyzing and marketing the potential for concurrent use, revenue-generating development at ANE and all of its Reliever Airports. Any parcels reviewed by MAC at ANE will be compatible with the airport and MAC will work with the City of Blaine to address any concerns.
60
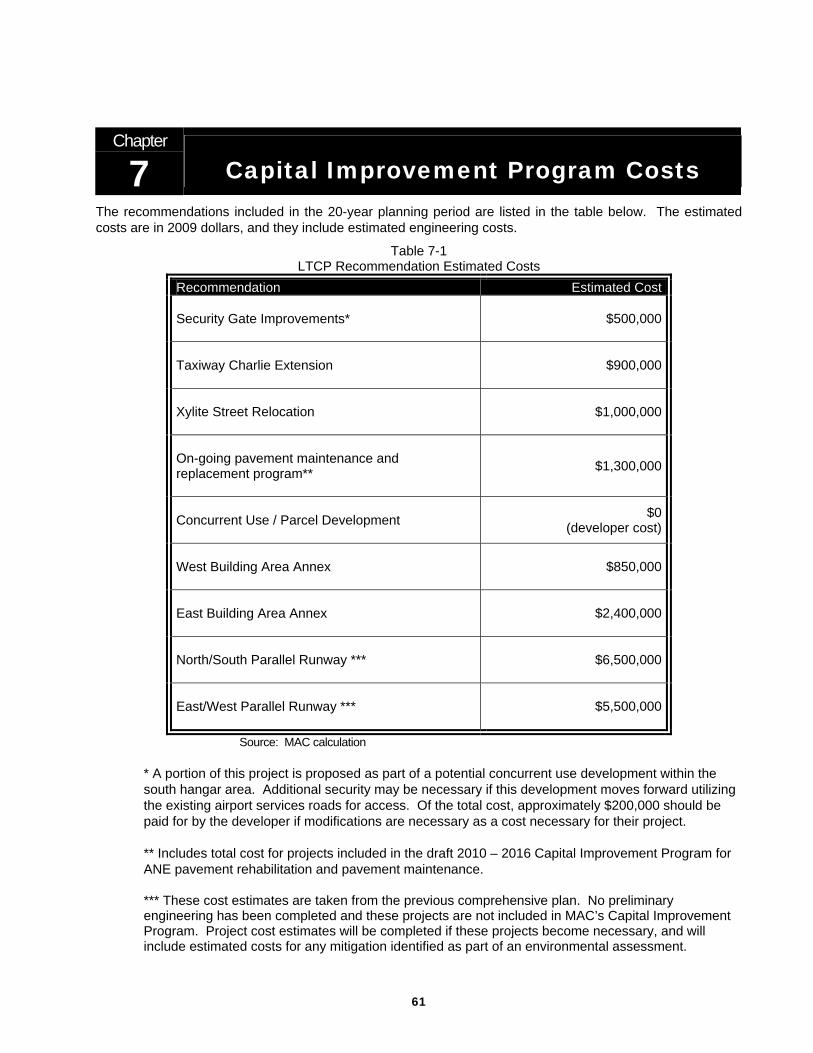
Chapter
7 Capital Improvement Program Costs The recommendations included in the 20-year planning period are listed in the table below. The estimated costs are in 2009 dollars, and they include estimated engineering costs.
Table 7-1 LTCP Recommendation Estimated Costs
Recommendation Estimated Cost Security Gate Improvements*
$500,000
Taxiway Charlie Extension
$900,000
Xylite Street Relocation
$1,000,000
On-going pavement maintenance and replacement program**
$1,300,000
Concurrent Use / Parcel Development
$0(developer cost)
West Building Area Annex
$850,000
East Building Area Annex
$2,400,000
North/South Parallel Runway ***
$6,500,000
East/West Parallel Runway ***
$5,500,000
Source: MAC calculation
* A portion of this project is proposed as part of a potential concurrent use development within the south hangar area. Additional security may be necessary if this development moves forward utilizing the existing airport services roads for access. Of the total cost, approximately $200,000 should be paid for by the developer if modifications are necessary as a cost necessary for their project. ** Includes total cost for projects included in the draft 2010 – 2016 Capital Improvement Program for ANE pavement rehabilitation and pavement maintenance.
*** These cost estimates are taken from the previous comprehensive plan. No preliminary engineering has been completed and these projects are not included in MAC’s Capital Improvement Program. Project cost estimates will be completed if these projects become necessary, and will include estimated costs for any mitigation identified as part of an environmental assessment.
61

62
Please note that these are recommendations for future airport improvements. Having them listed in this planning document does not guarantee that all or any of them will be completed. Additional engineering and environmental study as necessary will be completed prior to any implementation of projects. This summary provides a guide for MAC when planning the Capital Improvement Program. Costs for Reliever Airport projects must be carefully programmed to ensure all necessary funding is available. Those projects that will be eligible for federal or state funding will be placed in years when the opportunity to receive such funds is greatest. Projects that are not eligible for federal or state funds must have other funding sources identified prior to implementation.
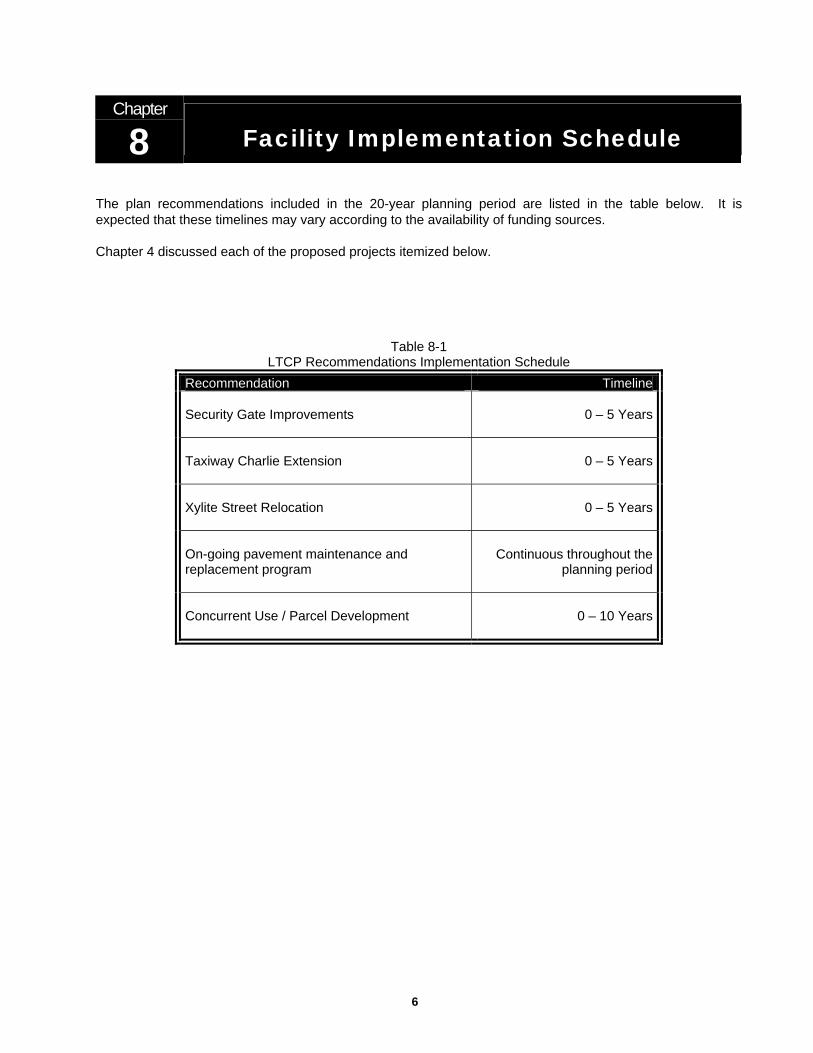
Chapter
8 Facility Implementation Schedule
The plan recommendations included in the 20-year planning period are listed in the table below. It is expected that these timelines may vary according to the availability of funding sources.
Chapter 4 discussed each of the proposed projects itemized below.
Table 8-1 LTCP Recommendations Implementation Schedule
Recommendation Timeline Security Gate Improvements
0 – 5 Years
Taxiway Charlie Extension
0 – 5 Years
Xylite Street Relocation
0 – 5 Years
On-going pavement maintenance and replacement program
Continuous throughout the planning period
Concurrent Use / Parcel Development
0 – 10 Years
63
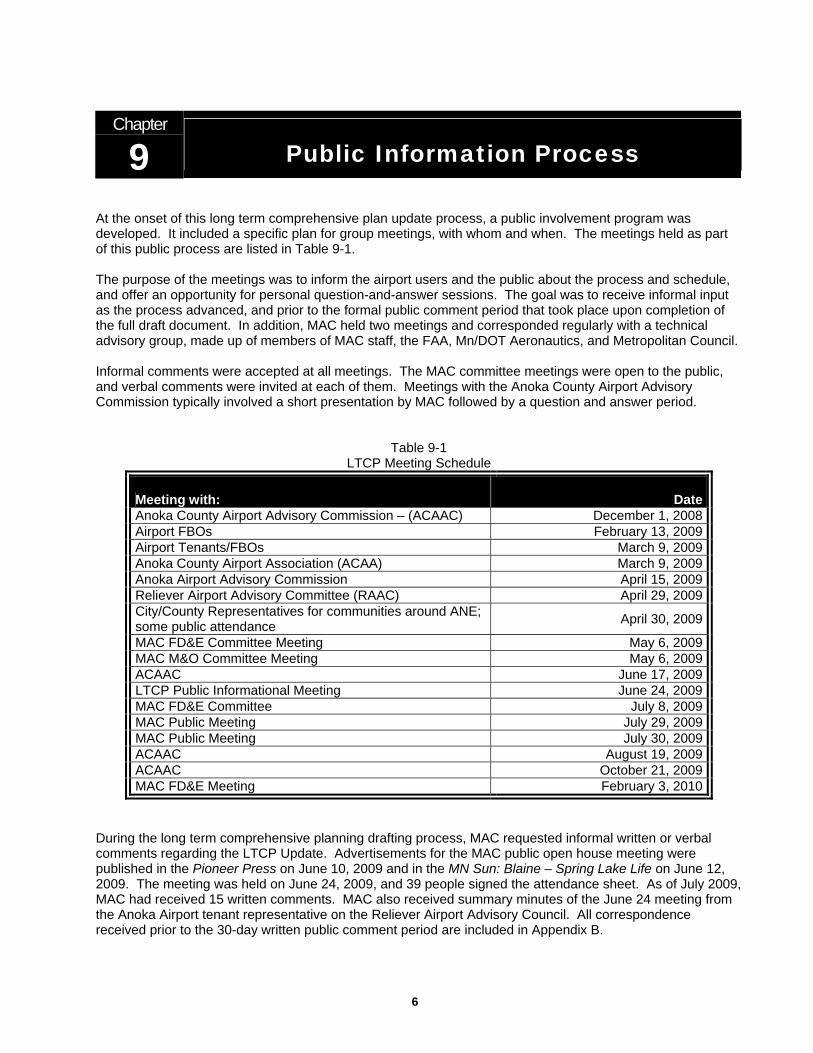
Chapter
9 Public Information Process
At the onset of this long term comprehensive plan update process, a public involvement program was developed. It included a specific plan for group meetings, with whom and when. The meetings held as part of this public process are listed in Table 9-1. The purpose of the meetings was to inform the airport users and the public about the process and schedule, and offer an opportunity for personal question-and-answer sessions. The goal was to receive informal input as the process advanced, and prior to the formal public comment period that took place upon completion of the full draft document. In addition, MAC held two meetings and corresponded regularly with a technical advisory group, made up of members of MAC staff, the FAA, Mn/DOT Aeronautics, and Metropolitan Council. Informal comments were accepted at all meetings. The MAC committee meetings were open to the public, and verbal comments were invited at each of them. Meetings with the Anoka County Airport Advisory Commission typically involved a short presentation by MAC followed by a question and answer period.
Table 9-1 LTCP Meeting Schedule
Meeting with: DateAnoka County Airport Advisory Commission – (ACAAC) December 1, 2008Airport FBOs February 13, 2009Airport Tenants/FBOs March 9, 2009Anoka County Airport Association (ACAA) March 9, 2009Anoka Airport Advisory Commission April 15, 2009Reliever Airport Advisory Committee (RAAC) April 29, 2009City/County Representatives for communities around ANE; some public attendance April 30, 2009
MAC FD&E Committee Meeting May 6, 2009MAC M&O Committee Meeting May 6, 2009ACAAC June 17, 2009LTCP Public Informational Meeting June 24, 2009MAC FD&E Committee July 8, 2009MAC Public Meeting July 29, 2009MAC Public Meeting July 30, 2009ACAAC August 19, 2009ACAAC October 21, 2009MAC FD&E Meeting February 3, 2010
During the long term comprehensive planning drafting process, MAC requested informal written or verbal comments regarding the LTCP Update. Advertisements for the MAC public open house meeting were published in the Pioneer Press on June 10, 2009 and in the MN Sun: Blaine – Spring Lake Life on June 12, 2009. The meeting was held on June 24, 2009, and 39 people signed the attendance sheet. As of July 2009, MAC had received 15 written comments. MAC also received summary minutes of the June 24 meeting from the Anoka Airport tenant representative on the Reliever Airport Advisory Council. All correspondence received prior to the 30-day written public comment period are included in Appendix B.
64
65
The draft LTCP document was completed in November, 2009, and made available for a 30-day written comment period starting November 23, 2009. The comment period ended on December 22, 2009. Advertisements for the 30-day public written comment period on the draft LTCP were published in the Pioneer Press and Star Tribune newspapers on November 19, 2009 and in the Blaine – Spring Lake Life on November 20, 2009. Upon completion of the written comment period on December 22, 2009, MAC received two letters from adjacent cities and three e-mailed comments. The letters from the City of Blaine, the City of Circle Pines, the three e-mails from residents, and MAC’s responses to them are included in Appendix B. In February 2010, MAC submitted the draft LTCP document, along with all written comments received and MAC responses to those comments, to the Metropolitan Council for their review. The Metropolitan Council issued their determination in April 2010, finding the LTCP Update consistent with the Metropolitan Council’s development guide. Correspondence from the Metropolitan Council has been included in Appendix B. In June 2010, the Commission took action to adopt this LTCP as the final plan. MAC is committed to preparing updates to this LTCP on a regular basis.