analytical report n8 - home page - european data … · analytical report n8 analytical report 8:...
TRANSCRIPT

1
Analytical Report 8: The Future of Open Data Portals
Analytical Report n8

2
Analytical Report 8:
The Future of Open Data Portals
Last update: October 2017
www: http://www.europeandataportal.eu/
Licence: CC-BY
Authors: Elena Simperl, Johanna Walker (University of Southampton)
Reviewers: Wendy Carrara and Cosmina Radu (Capgemini)
3
Executive Summary
Portals are central points of access for datasets which allow data to be found easily. Their development
is associated with the emergence of Open Data, and therefore they have largely been government led
and funded initiatives for the purpose of opening appropriate government datasets – a supply-led ap-
proach. However, this drive by publishers, often to meet mandates, can only take portals so far. This
report presents ten ways portals can organise for sustainability and added value by examining what is
required on the other side of the equation – meeting and provoking demand. As users become an
increasingly wider and more diverse group, these changes will increasingly be required.
These ten ways are:
Organising for use of the datasets (rather than simply for publication);
Learning from the techniques utilised by recently emerged commercial data marketplaces;
promoting use via the sharing of knowledge, co-opting methods common in the open source
software community;
Investing in discoverability best practices, borrowing from e-commerce;
Publishing good quality metadata, to enhance reuse;
Adopting standards to ensure interoperability;
Co-locating tools, so that a wider range of users and re-users can be engaged with;
Linking datasets to enhance value;
Being accessible by offering both options for big data, such as Application Programme Inter-
faces, and options for more manual processing, such as comma separated value files, thus
ensuring a wide range of user needs are met;
Co-locating documentation, so that users do not need to be domain experts in order to under-
stand the data;
Being measurable, as a way to assess how well they are meeting users’ needs.
These ten ways are not simply an abstract list. It is hoped this list will be operationalised by portals by
looking critically at their offering and taking an honest inventory; by addressing front end issues to
meet user needs; by engaging with data providers not only to deliver the content in appropriate for-
mats but also to share their domain knowledge; and finally, by engaging with other portals to solve
joint challenges, primarily those of standards.
4
Contents Executive Summary ................................................................................................................................. 3
Introduction ............................................................................................................................................. 5
1. Organise for Use .............................................................................................................................. 7
2. Promote Use .................................................................................................................................... 9
3. Be Discoverable ............................................................................................................................. 11
4. Publish Metadata .......................................................................................................................... 14
5. Promote Standards ........................................................................................................................ 15
6. Co-locate Documentation ............................................................................................................. 16
7. Link Data ........................................................................................................................................ 17
8. Be Measurable ............................................................................................................................... 19
9. Co-locate Tools .............................................................................................................................. 20
10. Be Accessible ................................................................................................................................ 23
Outlook .................................................................................................................................................. 24
Conclusion ............................................................................................................................................. 25
Endnotes ................................................................................................................................................ 26
5
Introduction
Two decades after the emergence of web portals in the mid-1990s, there has been a rise in the number
of Open Data portals, particularly amongst public institutions. Portals are central points of access for
datasets. As of 2017. Liechtenstein was alone within the EU28+ countries in not having launched a
national Open Data Portal1. So compelling has the portal model been that transnational portals have
also emerged: the European Data Portal, offering access to Open Data from over 34 countries was
launched in 2015.
Portals enable Open Data to be found easily – for example, if a user is looking for a dataset created by
a given organisation, their data portal may be the first address to find that data. The portal of the data
publisher would typically provide visitors with a search feature, as well as tools to browse through their
entire collection of datasets, and understand the provenance, terms of use, scope and timeliness of
the datasets. Occasionally, Open Data portals host data from multiple organisations. For those who
release their data openly, such portals offer many useful services, from hosting reliable URLs to facili-
tating data discovery to metadata and version management. In addition, this second category of por-
tals can assist data publishers in keeping track of how often their data is accessed, or understand de-
mand2 for and usage3 of their data. Finally, it has even been suggested that governments increasingly
use Open Data portals as primary tools to communicate with their citizens.4
Data is created, maintained and published by different parties. If every organisation offered their own
tools to give others access to data, discovering relevant datasets would require a type of infrastructure
similar to that which we have for Web search today. At the same time, organisations that release their
data openly would have an even greater challenge to pinpoint where their highly distributed consumer
base is located and what the impact of their Open Data efforts is –this would require stable identifiers
as well as tracking and analysis tools that exist elsewhere (for example on the Web or on social media),
but are simply not available for data today. Some communities, especially when they have a history
and culture of open access (for instance, science), have in time developed their own technologies and
guidelines to facilitate this, including DataCite5 and the FAIR principles (listed below).6 Others, includ-
ing governmental data publishers, are by comparison less experienced and can make fewer assump-
tions about the scenarios in which their data will be reused and about the skills and background of
their data users. In this case, having a single point of access with rich capabilities, including usage logs,
can have benefits.

6
However, independently of the Open Data maturity of one’s organisation, simply publishing the data
to a portal risks creating what has been called ‘virtuous data dumps’.7 As the use of open government
data becomes more common, it is necessary to think about moving to the next stage in publishing,
managing and using data. Central, aggregated portals were an early and necessary step in developing
the Open Data narrative, but their aim cannot be to fulfil a mandate for publishing – ultimately, they
are a means to facilitate broad use and generate impactful change. For the average citizen, it is what
is done with the data that is important. For the data professional looking for the right source of data
for their task, the challenge is mostly around finding and making sense of the data. Going forward, the
focus should be on understanding these scenarios better and choosing the best tools, whether portals
or others that deliver the capabilities and user experience people are asking for. In the end, it is very
likely that this would benefit existing portal owners as well, as it will provide insight into how they
could improve their offers and help publishers release better data over time.
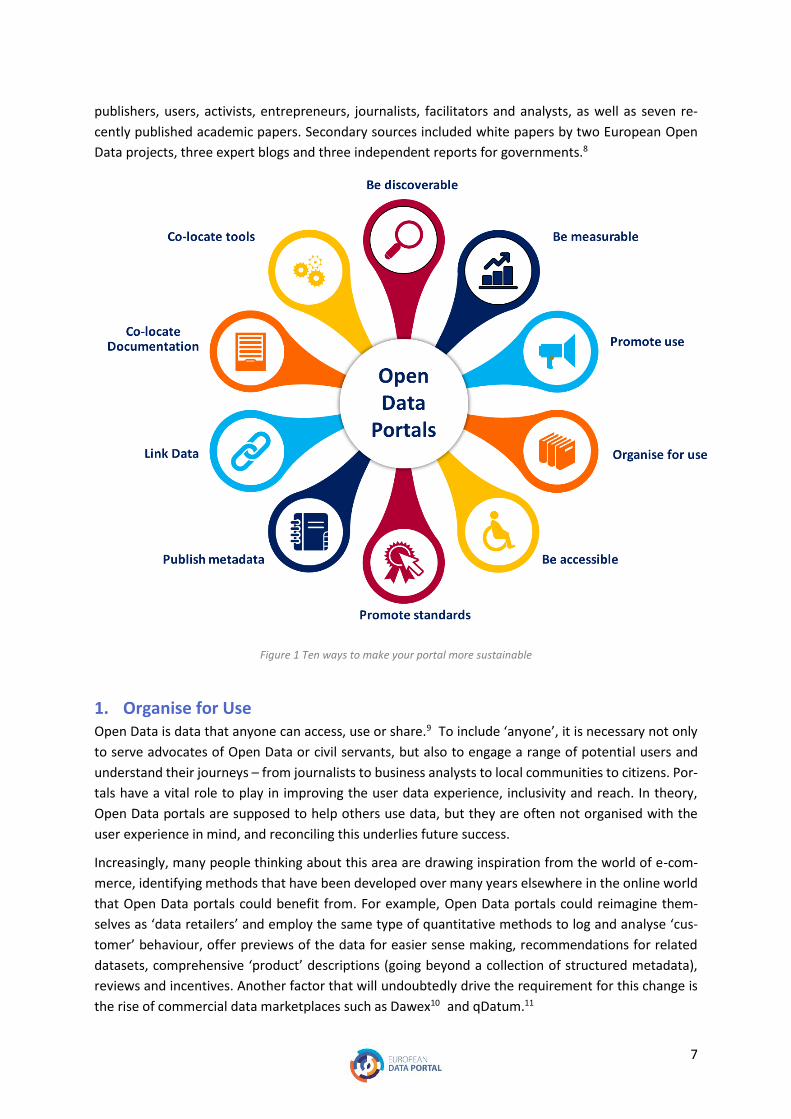
In this paper, we take these ideas further. We present ten ways in which Open Data portals must evolve
for sustainability and added value (Figure 1). They are the result of our own research around Open
Data, human-data interfaces, and linked data; of interactions with data portals in several countries,
their users, data publishers, and Open Data experts; and of the lessons we learned when publishing
our own data on the Web. We reviewed the transcripts of three focus groups comprising Open Data
The Fair Principles
To be Findable
F1 (meta)data are assigned a globally unique and eternally persistent identifier
F2 data are described with rich metadata
F3 (meta)data are registered or indexed in a searchable resource
F4 metadata specify the data identifier
To be Accessible
A1 (meta)data are retrievable by their identifier using a standardized communications protocol
A1.1 the protocol is open, free and universally implementable
A1.2 the protocol allows for an authentication and authorisation procedure, where necessary
A2 metadata are accessible, even when the data are no longer available
To be Interoperable
I1 (meta)data use a formal, accessible, shared and broadly applicable language for knowledge
representation
I2 (meta)data use vocabularies that follow FAIR principles
I3 (meta)data include qualified references to other (meta)data
To be Reusable
R1 (meta)data have a plurality of accurate and relevant attributes
R1.1 (meta)data are released with a clear and accessible data usage licence
R1.2 (meta)data are associated with their provenance
R1.3 (meta)data meet domain-relevant community standards
7
publishers, users, activists, entrepreneurs, journalists, facilitators and analysts, as well as seven re-
cently published academic papers. Secondary sources included white papers by two European Open
Data projects, three expert blogs and three independent reports for governments.8
Figure 1 Ten ways to make your portal more sustainable
1. Organise for Use Open Data is data that anyone can access, use or share.9 To include ‘anyone’, it is necessary not only
to serve advocates of Open Data or civil servants, but also to engage a range of potential users and
understand their journeys – from journalists to business analysts to local communities to citizens. Por-
tals have a vital role to play in improving the user data experience, inclusivity and reach. In theory,
Open Data portals are supposed to help others use data, but they are often not organised with the
user experience in mind, and reconciling this underlies future success.
Increasingly, many people thinking about this area are drawing inspiration from the world of e-com-
merce, identifying methods that have been developed over many years elsewhere in the online world
that Open Data portals could benefit from. For example, Open Data portals could reimagine them-
selves as ‘data retailers’ and employ the same type of quantitative methods to log and analyse ‘cus-
tomer’ behaviour, offer previews of the data for easier sense making, recommendations for related
datasets, comprehensive ‘product’ descriptions (going beyond a collection of structured metadata),
reviews and incentives. Another factor that will undoubtedly drive the requirement for this change is
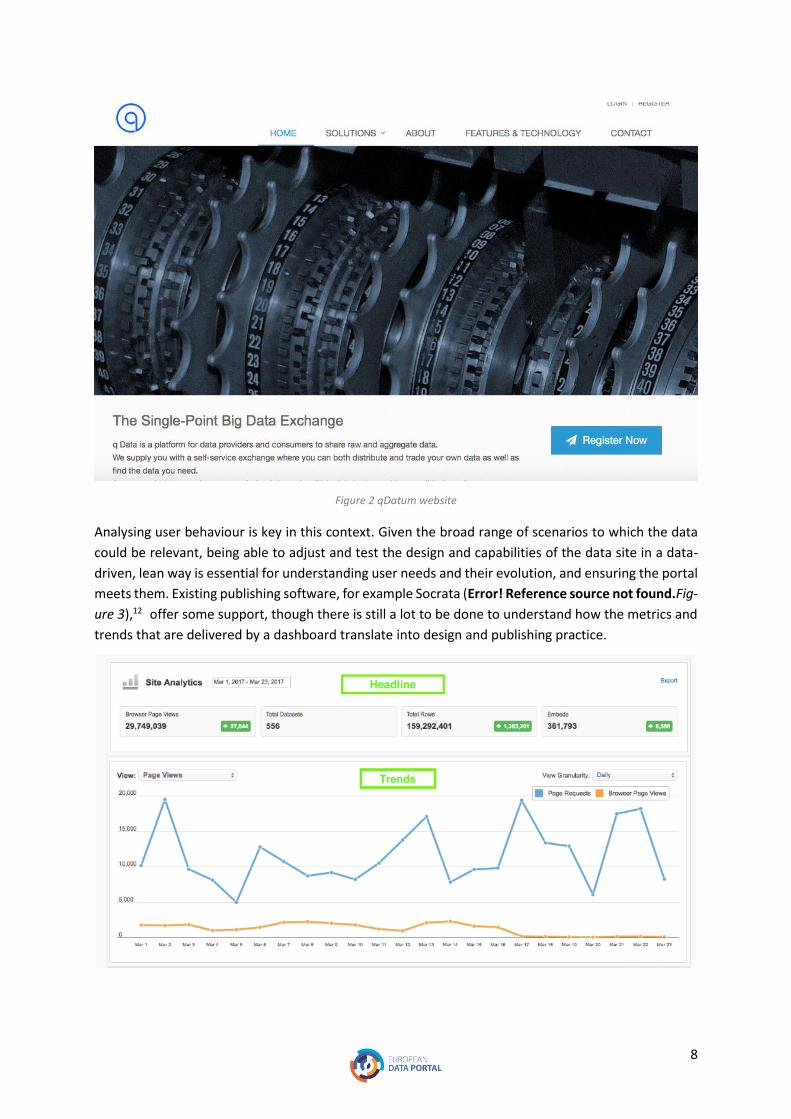
the rise of commercial data marketplaces such as Dawex10 and qDatum.11
8
Figure 2 qDatum website
Analysing user behaviour is key in this context. Given the broad range of scenarios to which the data
could be relevant, being able to adjust and test the design and capabilities of the data site in a data-
driven, lean way is essential for understanding user needs and their evolution, and ensuring the portal
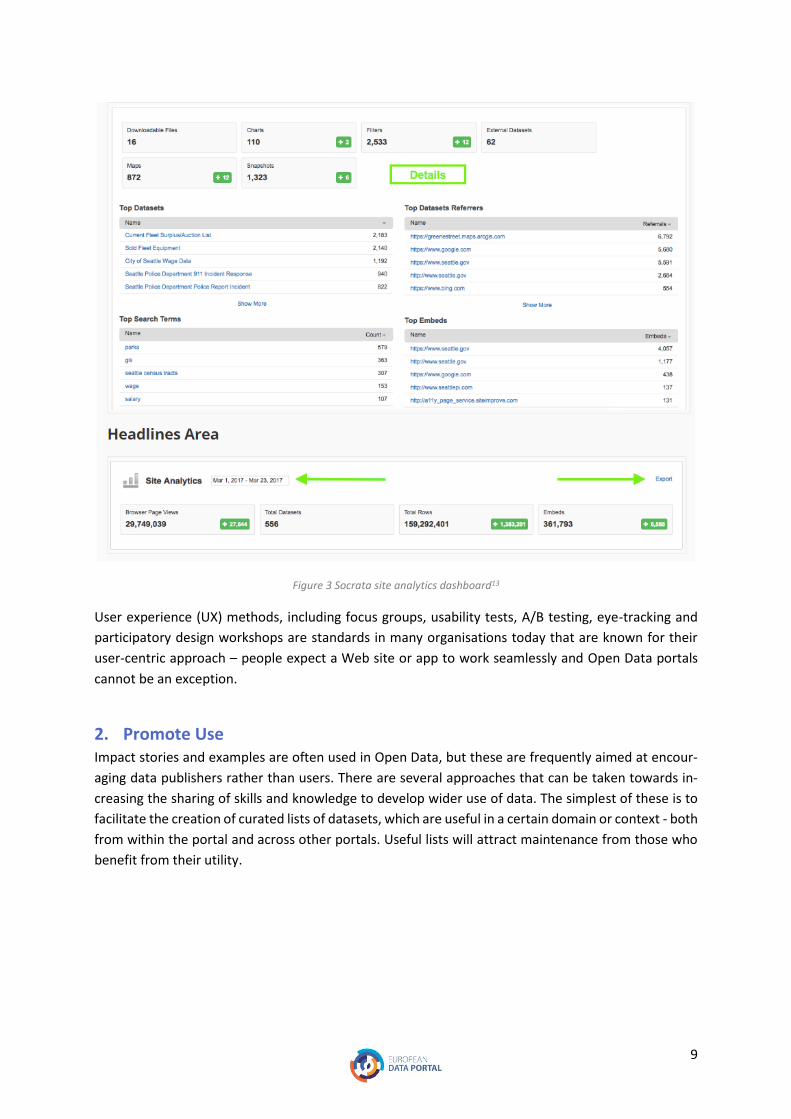
meets them. Existing publishing software, for example Socrata (Error! Reference source not found.Fig-
ure 3),12 offer some support, though there is still a lot to be done to understand how the metrics and
trends that are delivered by a dashboard translate into design and publishing practice.
9
Figure 3 Socrata site analytics dashboard13
User experience (UX) methods, including focus groups, usability tests, A/B testing, eye-tracking and
participatory design workshops are standards in many organisations today that are known for their
user-centric approach – people expect a Web site or app to work seamlessly and Open Data portals
cannot be an exception.
2. Promote Use Impact stories and examples are often used in Open Data, but these are frequently aimed at encour-
aging data publishers rather than users. There are several approaches that can be taken towards in-
creasing the sharing of skills and knowledge to develop wider use of data. The simplest of these is to
facilitate the creation of curated lists of datasets, which are useful in a certain domain or context - both
from within the portal and across other portals. Useful lists will attract maintenance from those who
benefit from their utility.

10
Figure 4 Data.gouv.fr’s ‘best reuse’ feature
Another concept borrows from the open-source community, where it is common practice to store the
files for a project in a repository where others can access and use them. Projects created during the
many hackathons across Europe, of which many go no further than the prize-giving at the end of the
weekend, could be shared in this way with the possibility of building on them in future. There is also
an argument for the provision, alongside the data, of clear guides that demonstrate for users the pro-
cess of a project, including the data, domain knowledge, skills and process required. One such example
is that of Data Campfire (Figure 5), which enables users to share very detailed information about their
creation of a data story, which not only promotes the data and its publisher, but crucially helps other
understand what is needed to reuse that dataset or carry out similar analyses.
Figure 5 Data Campfire
In the software world, it is also common for the community to discuss issues around the use or future
development of a piece of code, or ask and offer advice on known problems and workarounds. While
Open Data portals sometimes support comments, the practice of promoting a community of practice
11
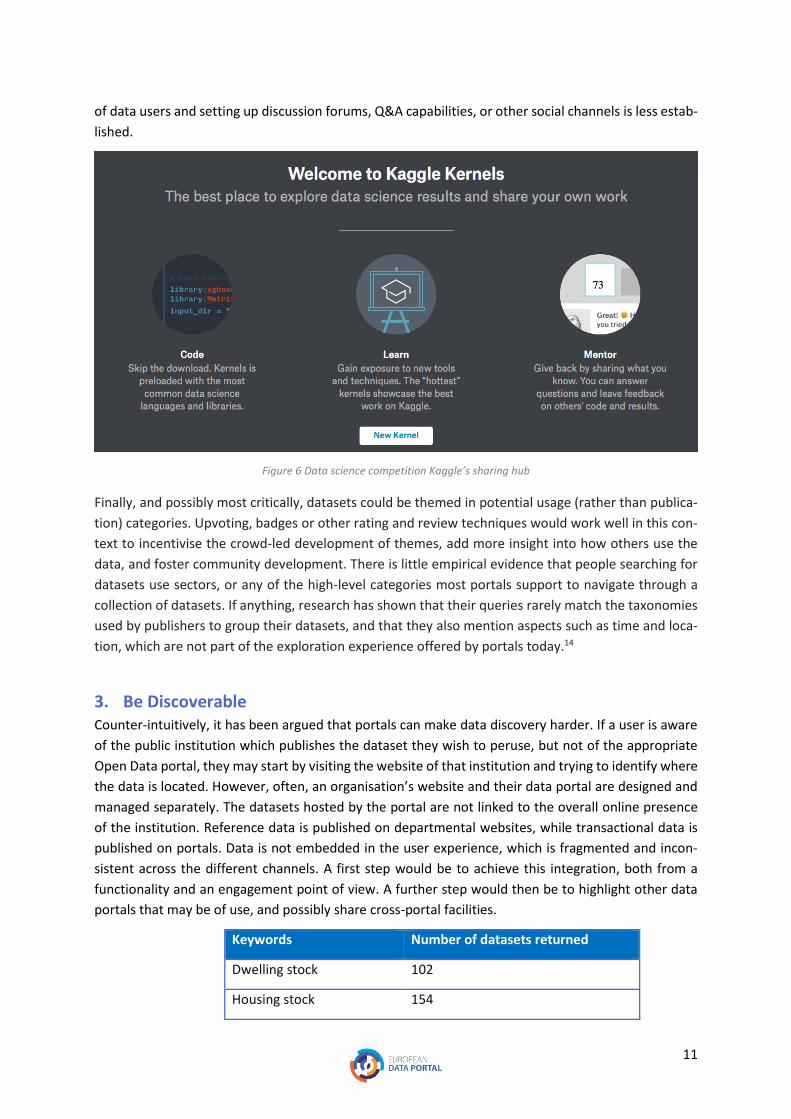
of data users and setting up discussion forums, Q&A capabilities, or other social channels is less estab-
lished.
Figure 6 Data science competition Kaggle’s sharing hub
Finally, and possibly most critically, datasets could be themed in potential usage (rather than publica-
tion) categories. Upvoting, badges or other rating and review techniques would work well in this con-
text to incentivise the crowd-led development of themes, add more insight into how others use the
data, and foster community development. There is little empirical evidence that people searching for
datasets use sectors, or any of the high-level categories most portals support to navigate through a
collection of datasets. If anything, research has shown that their queries rarely match the taxonomies
used by publishers to group their datasets, and that they also mention aspects such as time and loca-
tion, which are not part of the exploration experience offered by portals today.14
3. Be Discoverable Counter-intuitively, it has been argued that portals can make data discovery harder. If a user is aware
of the public institution which publishes the dataset they wish to peruse, but not of the appropriate
Open Data portal, they may start by visiting the website of that institution and trying to identify where
the data is located. However, often, an organisation’s website and their data portal are designed and
managed separately. The datasets hosted by the portal are not linked to the overall online presence
of the institution. Reference data is published on departmental websites, while transactional data is
published on portals. Data is not embedded in the user experience, which is fragmented and incon-
sistent across the different channels. A first step would be to achieve this integration, both from a
functionality and an engagement point of view. A further step would then be to highlight other data
portals that may be of use, and possibly share cross-portal facilities.
Keywords Number of datasets returned
Dwelling stock 102
Housing stock 154

12
Dwelling supply 17
Housing supply 78
Figure 7 Study of 2015 on sensitivity of keywords when searching for data on ‘housing stock’ on data.gov.uk
Data searches are prone to be adversely affected by the subjectivity of choice of terms, as can be seen
in Figure 7. The Web offers several search engines with well-honed algorithmic capabilities that have
solved similar problems. Again, borrowing from e-commerce, data portals should be, if not optimised,
certainly enabled for search engines. This is likely to be more effective than attempting to engage users
with Boolean logic (or worse, technical formats such as SQL or SPARQL) to facilitate advanced search.
At an individual data level, Schema.org offers a format for microdata mark-up to make pages discov-
erable by standard search engines. Extensions for dataset mark-up have recently attracted some in-
terest.15 As noted earlier, there are several communities that have embraced a culture of the open
and developed a huge arsenal of best practices and tools to do just what Open Data portals are aiming
to achieve: publishing data for others to use, describing data in a way that it can be identified and
indexed effectively, making data management and use a community activity. Learning from their
achievements and leveraging their solutions could give the emerging open government data ecosys-
tem the confidence and bandwidth it needs to keep the momentum going and remain relevant and
cutting-edge.
Open Data Portal Watch, a project whose key aim is to improve the quality of Open Data, crawls the
Web to find portals – currently 260+ – whose dataset collections would otherwise remain hidden to
regular users (Figure 8).
Figure 8 Open Data portal watch: keeping track of Open Data portals online
However, there are other visibility measures that could be taken without having to invest in a fully-
fledged crawler infrastructure. Portal owners should also consider publishing a list of datasets which
are known to exist, but are not currently available. This would limit the time wasted on abortive
searches, while showing visitors that the publisher is monitoring demand and is aware of areas that
they need to improve. Identifying a dataset as existing but not available would also offer greater trans-
parency and could help initiate focused discussions between users and publishers, on top of existing
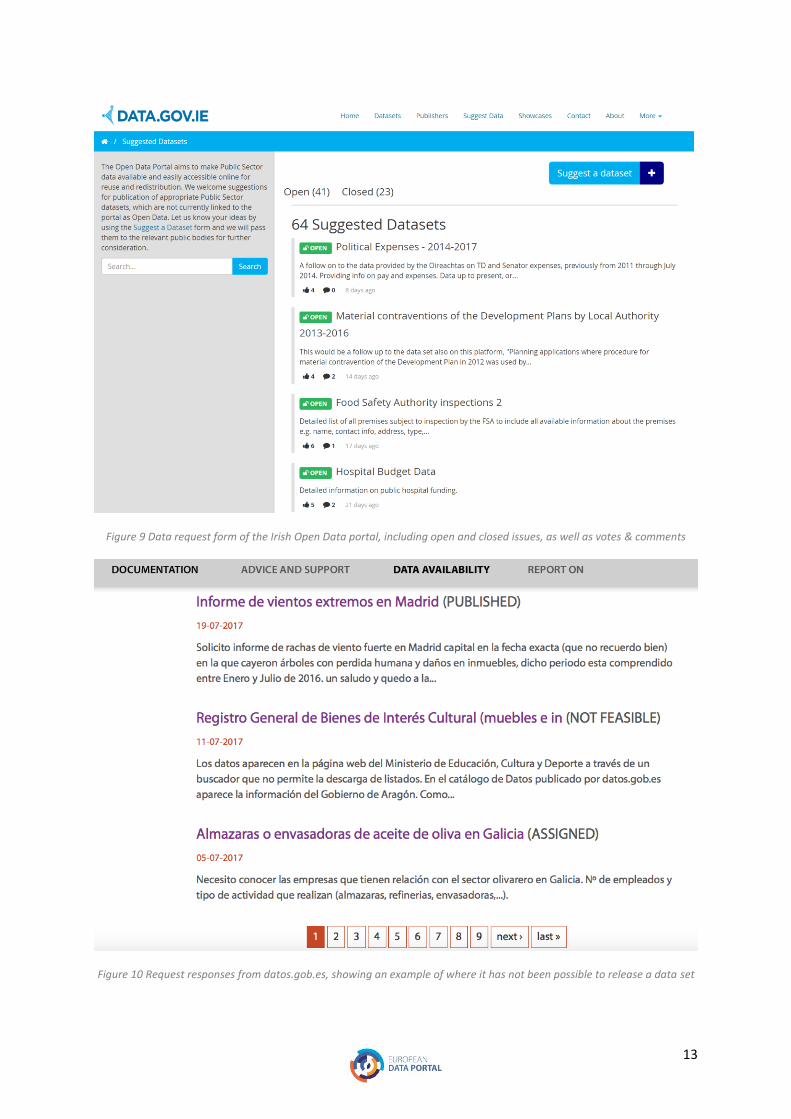
request tools (Figure 9, Figure 10, Figure 11).
13
Figure 9 Data request form of the Irish Open Data portal, including open and closed issues, as well as votes & comments
Figure 10 Request responses from datos.gob.es, showing an example of where it has not been possible to release a data set

14
Figure 11 Netherlands Open Data Portal showing 75 unavailable datasets
4. Publish Metadata The requirement for enlightening, consistent, usable metadata - data about data - is not new. But nei-
ther has this issue been resolved. Accurate metadata is vital not only for findability but also cataloguing
- poor metadata can undermine the portal itself. A study by Koesten et al. explored the data search
and sense making needs of 20 data professionals,16 including aspects that are directly relevant when
deciding whether a dataset is relevant or not. They distinguish between three dimensions: relevance
(is this the data I need?); usability (can I use it in practice?) and quality (how good is the data and how
easy is it going to be do use it?). Data should be accompanied by descriptions of these aspects, either
as structured metadata, but also in the form of comments, case studies, experience reports, examples
of use, etc. (Figure 12).
Assess Information needed about
Relevance Context, coverage, original purpose, granularity,
summary, time frame
Usability Labeling, documentation, licence, access, machine-
readability, language used, format, schema, ability
to share
Quality Collection methods, provenance, consistency of
formatting/labeling, completeness, what has been
excluded
Figure 12 Table from Koesten et al showing the metadata users consider useful to make sense of data
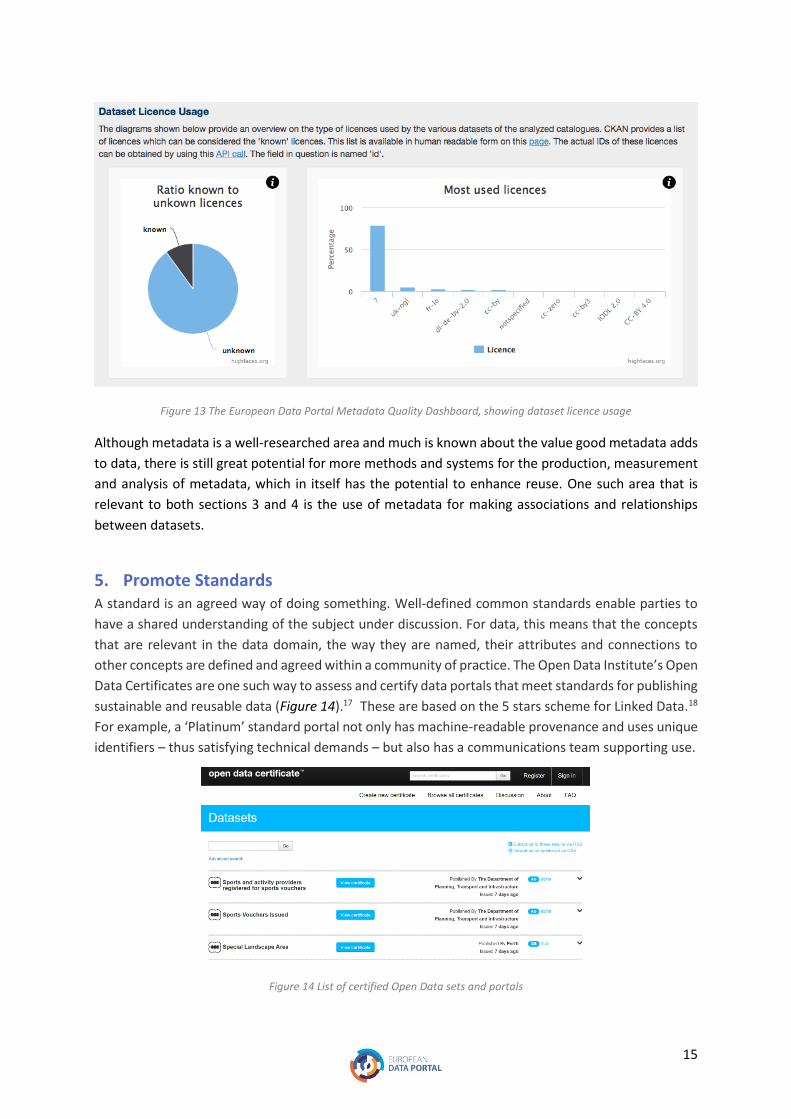
The European Data Portal for example has a Metadata Quality Assistant, that analyses metadata qual-
ity of associated portals on a weekly basis. The review is based on three criteria: the accessibility of
distributions, their machine readability and their compliance with the DCAT-AP specification, which is
discussed further in section 6.
15
Figure 13 The European Data Portal Metadata Quality Dashboard, showing dataset licence usage
Although metadata is a well-researched area and much is known about the value good metadata adds
to data, there is still great potential for more methods and systems for the production, measurement
and analysis of metadata, which in itself has the potential to enhance reuse. One such area that is
relevant to both sections 3 and 4 is the use of metadata for making associations and relationships
between datasets.
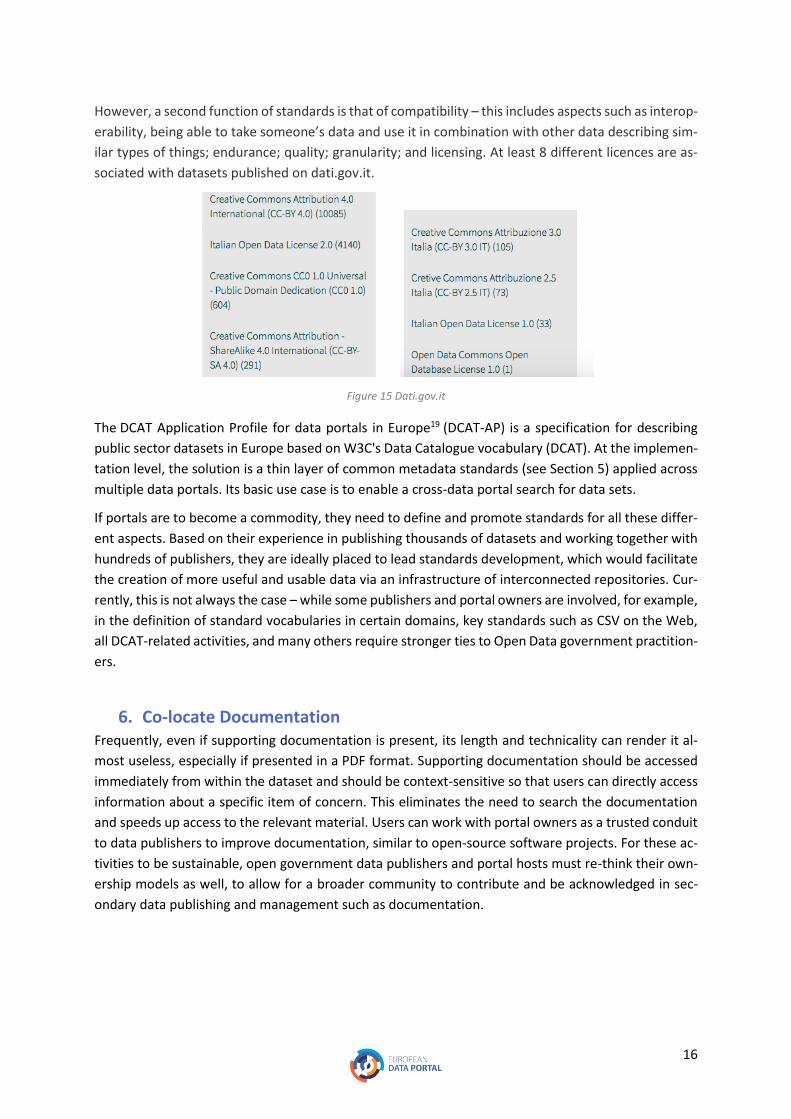
5. Promote Standards A standard is an agreed way of doing something. Well-defined common standards enable parties to
have a shared understanding of the subject under discussion. For data, this means that the concepts
that are relevant in the data domain, the way they are named, their attributes and connections to
other concepts are defined and agreed within a community of practice. The Open Data Institute’s Open
Data Certificates are one such way to assess and certify data portals that meet standards for publishing
sustainable and reusable data (Figure 14).17 These are based on the 5 stars scheme for Linked Data.18
For example, a ‘Platinum’ standard portal not only has machine-readable provenance and uses unique
identifiers – thus satisfying technical demands – but also has a communications team supporting use.
Figure 14 List of certified Open Data sets and portals
16
However, a second function of standards is that of compatibility – this includes aspects such as interop-
erability, being able to take someone’s data and use it in combination with other data describing sim-
ilar types of things; endurance; quality; granularity; and licensing. At least 8 different licences are as-
sociated with datasets published on dati.gov.it.
Figure 15 Dati.gov.it
The DCAT Application Profile for data portals in Europe19 (DCAT-AP) is a specification for describing
public sector datasets in Europe based on W3C's Data Catalogue vocabulary (DCAT). At the implemen-
tation level, the solution is a thin layer of common metadata standards (see Section 5) applied across
multiple data portals. Its basic use case is to enable a cross-data portal search for data sets.
If portals are to become a commodity, they need to define and promote standards for all these differ-
ent aspects. Based on their experience in publishing thousands of datasets and working together with
hundreds of publishers, they are ideally placed to lead standards development, which would facilitate
the creation of more useful and usable data via an infrastructure of interconnected repositories. Cur-
rently, this is not always the case – while some publishers and portal owners are involved, for example,
in the definition of standard vocabularies in certain domains, key standards such as CSV on the Web,
all DCAT-related activities, and many others require stronger ties to Open Data government practition-
ers.
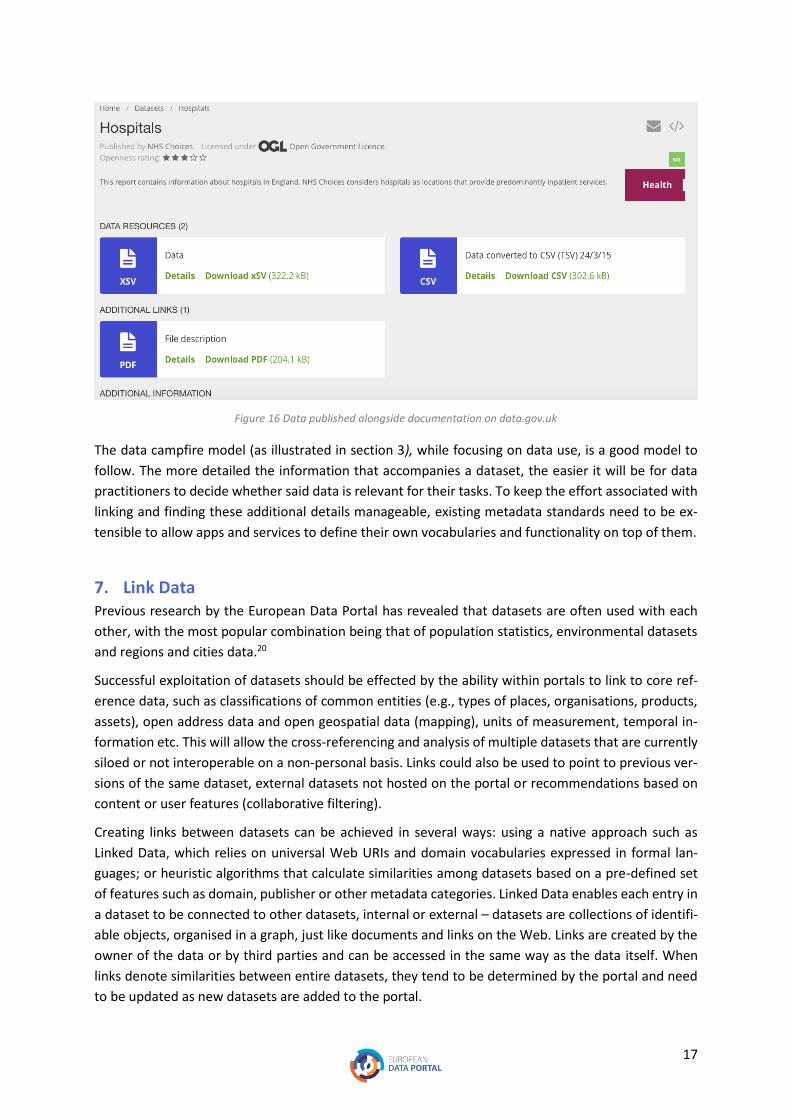
6. Co-locate Documentation Frequently, even if supporting documentation is present, its length and technicality can render it al-
most useless, especially if presented in a PDF format. Supporting documentation should be accessed
immediately from within the dataset and should be context-sensitive so that users can directly access
information about a specific item of concern. This eliminates the need to search the documentation
and speeds up access to the relevant material. Users can work with portal owners as a trusted conduit
to data publishers to improve documentation, similar to open-source software projects. For these ac-
tivities to be sustainable, open government data publishers and portal hosts must re-think their own-
ership models as well, to allow for a broader community to contribute and be acknowledged in sec-
ondary data publishing and management such as documentation.
17
Figure 16 Data published alongside documentation on data.gov.uk
The data campfire model (as illustrated in section 3), while focusing on data use, is a good model to
follow. The more detailed the information that accompanies a dataset, the easier it will be for data
practitioners to decide whether said data is relevant for their tasks. To keep the effort associated with
linking and finding these additional details manageable, existing metadata standards need to be ex-
tensible to allow apps and services to define their own vocabularies and functionality on top of them.
7. Link Data Previous research by the European Data Portal has revealed that datasets are often used with each
other, with the most popular combination being that of population statistics, environmental datasets
and regions and cities data.20
Successful exploitation of datasets should be effected by the ability within portals to link to core ref-
erence data, such as classifications of common entities (e.g., types of places, organisations, products,
assets), open address data and open geospatial data (mapping), units of measurement, temporal in-
formation etc. This will allow the cross-referencing and analysis of multiple datasets that are currently
siloed or not interoperable on a non-personal basis. Links could also be used to point to previous ver-
sions of the same dataset, external datasets not hosted on the portal or recommendations based on
content or user features (collaborative filtering).
Creating links between datasets can be achieved in several ways: using a native approach such as
Linked Data, which relies on universal Web URIs and domain vocabularies expressed in formal lan-
guages; or heuristic algorithms that calculate similarities among datasets based on a pre-defined set
of features such as domain, publisher or other metadata categories. Linked Data enables each entry in
a dataset to be connected to other datasets, internal or external – datasets are collections of identifi-
able objects, organised in a graph, just like documents and links on the Web. Links are created by the
owner of the data or by third parties and can be accessed in the same way as the data itself. When
links denote similarities between entire datasets, they tend to be determined by the portal and need
to be updated as new datasets are added to the portal.

18
Figure 17 EU Open Data Portal showing SPARQL search
Figure 18 The EU Business Graph creates links between separate datasets around corporate entities
As national governments and the EU encourage the use of higher-starred Open Data (3 stars or more)
and Google starts indexing some types of Open Data, there will be demand for professional specialist
19
services that can carry out the interlinking of repositories and repository collections both accurately
and at scale. At the same time, there is a need to understand that linking is as core to Open Data as
support for a variety of formats (see Section 11) or defining identifiers.
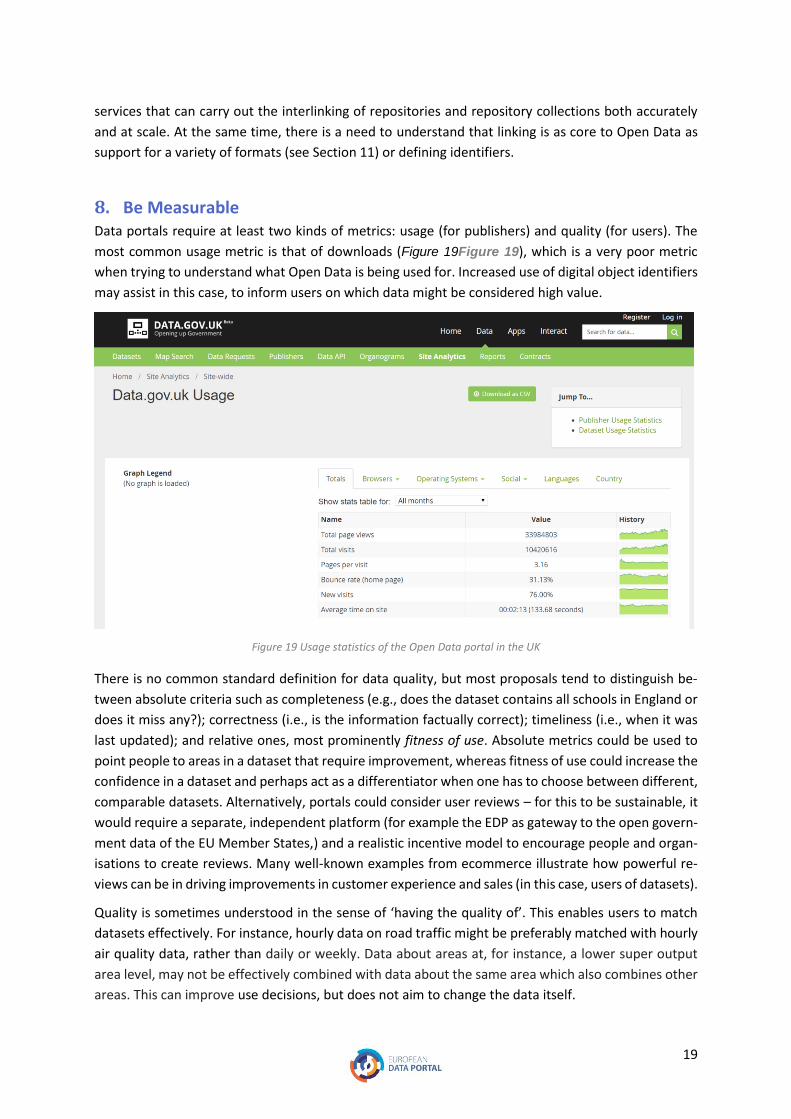
8. Be Measurable Data portals require at least two kinds of metrics: usage (for publishers) and quality (for users). The
most common usage metric is that of downloads (Figure 19Figure 19), which is a very poor metric
when trying to understand what Open Data is being used for. Increased use of digital object identifiers
may assist in this case, to inform users on which data might be considered high value.
Figure 19 Usage statistics of the Open Data portal in the UK
There is no common standard definition for data quality, but most proposals tend to distinguish be-
tween absolute criteria such as completeness (e.g., does the dataset contains all schools in England or
does it miss any?); correctness (i.e., is the information factually correct); timeliness (i.e., when it was
last updated); and relative ones, most prominently fitness of use. Absolute metrics could be used to
point people to areas in a dataset that require improvement, whereas fitness of use could increase the
confidence in a dataset and perhaps act as a differentiator when one has to choose between different,
comparable datasets. Alternatively, portals could consider user reviews – for this to be sustainable, it
would require a separate, independent platform (for example the EDP as gateway to the open govern-
ment data of the EU Member States,) and a realistic incentive model to encourage people and organ-
isations to create reviews. Many well-known examples from ecommerce illustrate how powerful re-
views can be in driving improvements in customer experience and sales (in this case, users of datasets).
Quality is sometimes understood in the sense of ‘having the quality of’. This enables users to match
datasets effectively. For instance, hourly data on road traffic might be preferably matched with hourly
air quality data, rather than daily or weekly. Data about areas at, for instance, a lower super output
area level, may not be effectively combined with data about the same area which also combines other
areas. This can improve use decisions, but does not aim to change the data itself.
20
A key issue for portals is to remain aware of different user groups’ prioritisation of the attributes of
data, and not to impose a ‘one form of data quality fits all’ regime. Examples of this include de-empha-
sising certain datasets because their timeliness is low - this may not matter in certain scenarios.
9. Co-locate Tools There is a plethora of tools for data manipulation available, but while some tools are household names
to the Open Data evangelist, others, including basic mapping and visualisation tools, are unknown to
most potential users. The standard process that currently exists is for a user to select datasets from a
portal, and then appropriate tools – often ones that have significant financial and knowledge barriers
– from a separate location. As Nicholas Terpolilli writes, “The modern way to manage data is to give
tools to the average person. And they don’t want to scrap HTML tables, look at a CSV file, nor do they
want to learn SPARQL.”21 In other words, the barriers to use are orders of magnitude larger than the
benefits of use for most people. However, it is exactly these audiences that will ultimately make Open
Data and the portals hosting them a household name in many professions and civic projects. For these
audiences, what counts is the ability to either be able to inspect or answer queries from the data on
site, or have a downloadable package that installs locally to do the same job.
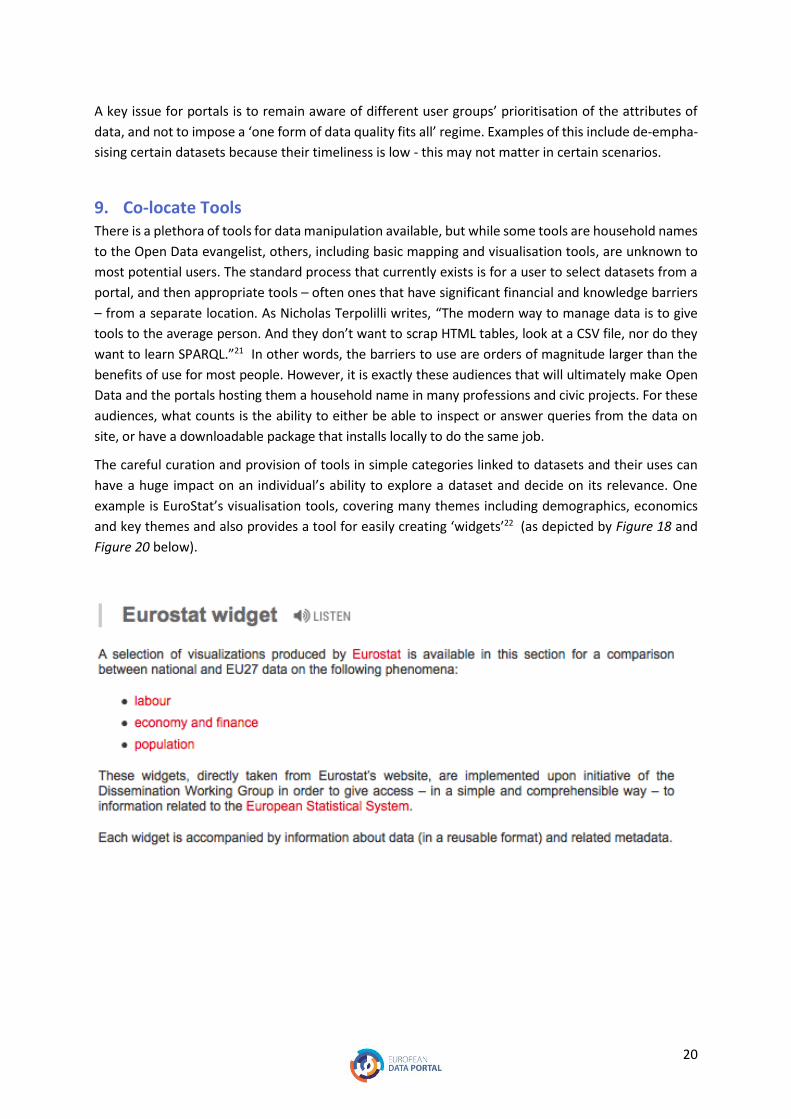
The careful curation and provision of tools in simple categories linked to datasets and their uses can
have a huge impact on an individual’s ability to explore a dataset and decide on its relevance. One
example is EuroStat’s visualisation tools, covering many themes including demographics, economics
and key themes and also provides a tool for easily creating ‘widgets’22 (as depicted by Figure 18 and
Figure 20 below).
21
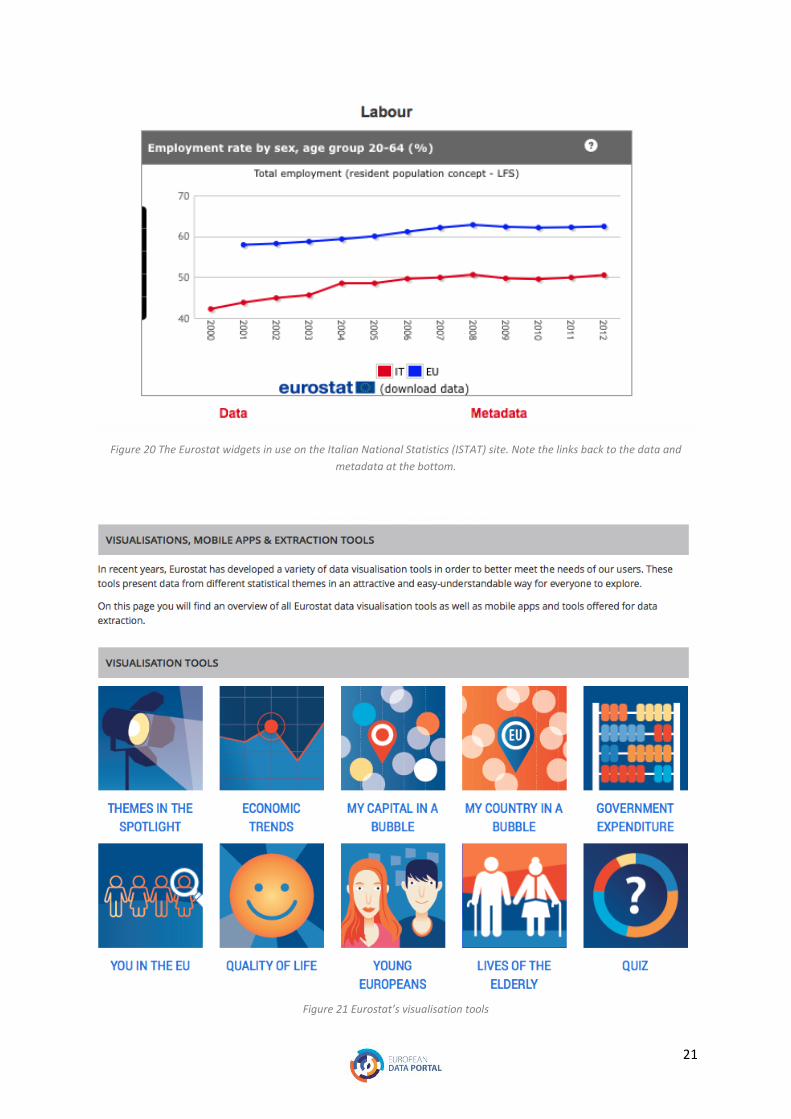
Figure 20 The Eurostat widgets in use on the Italian National Statistics (ISTAT) site. Note the links back to the data and
metadata at the bottom.
Figure 21 Eurostat’s visualisation tools

22
Another, more in depth tool, is Geo-Explore, created by a team from the University of Southampton.
This tool eliminates the need for the use of geographic information systems software to utilise UK
Inspire geodata.23 This means that geodata – possibly the most valuable data in terms of potential for
reuse in the world – is opened up to a vastly larger range of use opportunities (Figure 22).
Figure 22 Co-locating tools with geodata
Data.gouv.fr links to easily available and accessible tools, including those found on many desktops, in
its ‘Reuse’ section, with short but clear instructions as to how to use them, with examples of how the
results might look.
Figure 23 Data.gouv.fr
23
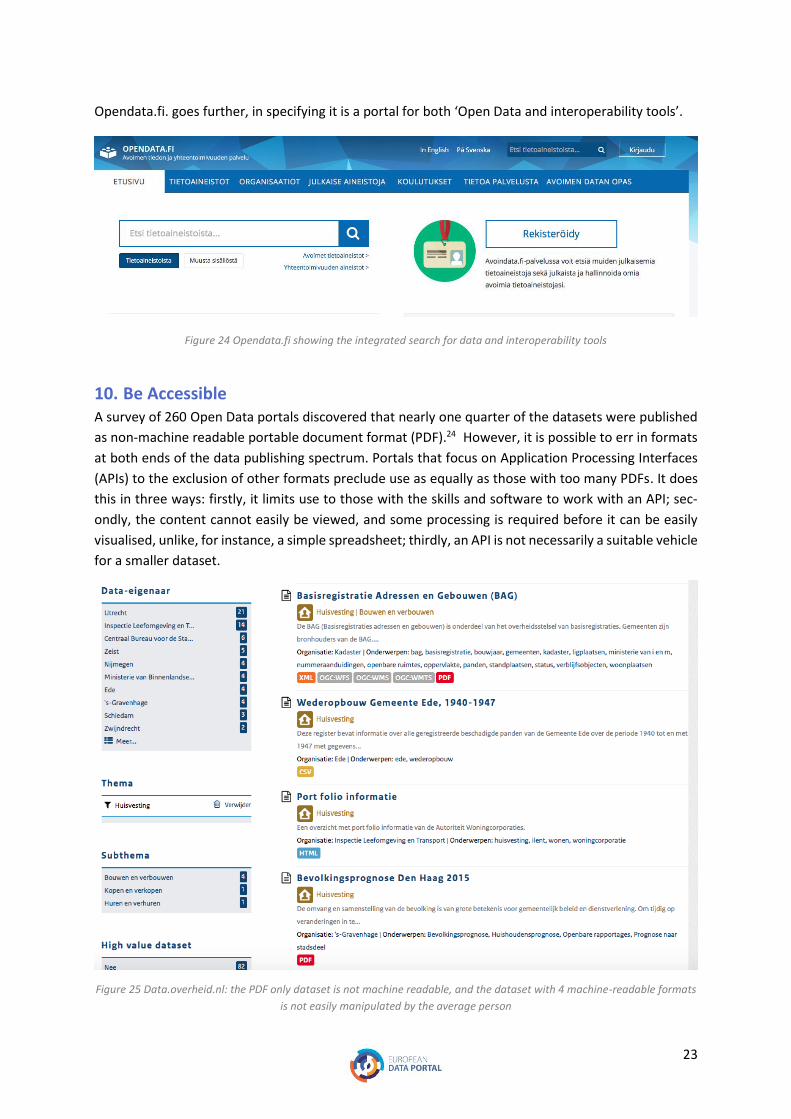
Opendata.fi. goes further, in specifying it is a portal for both ‘Open Data and interoperability tools’.
Figure 24 Opendata.fi showing the integrated search for data and interoperability tools
10. Be Accessible A survey of 260 Open Data portals discovered that nearly one quarter of the datasets were published
as non-machine readable portable document format (PDF).24 However, it is possible to err in formats
at both ends of the data publishing spectrum. Portals that focus on Application Processing Interfaces
(APIs) to the exclusion of other formats preclude use as equally as those with too many PDFs. It does
this in three ways: firstly, it limits use to those with the skills and software to work with an API; sec-
ondly, the content cannot easily be viewed, and some processing is required before it can be easily
visualised, unlike, for instance, a simple spreadsheet; thirdly, an API is not necessarily a suitable vehicle
for a smaller dataset.
Figure 25 Data.overheid.nl: the PDF only dataset is not machine readable, and the dataset with 4 machine-readable formats
is not easily manipulated by the average person
24
Portal owners can work with data publishers to improve publication formats, and act as a feedback
filter between users and publishers. This would fulfil a need for users to recommend and request im-
provements, while at the same time preventing overload for data publishers via third party prioritisa-
tion.
Outlook These 10 areas may seem intimidating for portal owners, but can be operationalised as effective future
proofing, using the following 4 steps:
1. The first step to implement is a review of the portal to see how it measures up. What is the
gap between the ideal solution and the existing one?
2. Secondly, address the front end issues such as co-location of tools, and better organisation.
Engage with users for their feedback and suggestions. This may include the piloting of changes
to the way the catalogue is ordered, or simple exit surveys on whether visitors found the data
they were looking for.
3. Thirdly, engage data owners. Linked data and increased documentation require their input, so
it is vital to ensure they are aware of the benefits of these.
4. Finally, identify the challenges that cannot be solved alone. Challenges that require joined up
solutions can be tackled by working together with other countries/stakeholders under the um-
brella of projects such as the European Data Portal. Data owners should ensure they are ac-
tively engaged with such programmes.
This should ensure that portals stand in good stead for a future which is going to see a greater balance
of users and publishers. On the publishing side, data will increasingly come from not just government
but also other sources of publicly funded data; as the Internet of Things develops then citizen sensor
data sets will proliferate and become more valuable when shared; resource-scarce groups such as so-
cial enterprises may also find value in sharing and combining data – especially when this allows them
access to tools that enhance their understanding of their data. Regarding users, commercial data hubs
such as Kaggle and qDatum already think of their customers in more forensic detail and portals should
follow this lead. In a post entitled, ‘Making Kaggle the home of Open Data’ the following types of cus-
tomers are listed: scientist, hobbyist, package author, data vendor, student, company or non-profit
and government.25 Although it makes little sense in the highly distributed world of Open Data for por-
tal owners to try to attempt to understand the vast range of possible uses of data, it is certainly valu-
able to try to understand a range of users, and consider the best value proposition.
25
Conclusion To conclude, not all these approaches are equal in effort. Some are more challenging than others, but
together they represent a coherent strategy to minimise current problems and achieve use and impact.
Ultimately, the Open Data ecosystem will have to embrace a paradigm shift towards a Web of Data
where datasets are described and discovered just like ordinary Web documents. At the same time,
portals will remain an important tool to bring together data and other resources, including documen-
tation, reviews, stories, applications and requests in a coherent narrative; to promote and inform
about the work of the publishers, aggregate content and drive traffic; and to engage with different
communities. However, even in this role, portal owners and publishers need to substantially improve
their customer experience, using tools and methods that are the norm in many other digital areas, and
consider sustainable financing models, whether that means paywalls for certain types of datasets, ad-
vertising, a wider range of publishers or co-ownership models.
26
Endnotes
1 According to European Data Portal report ‘Open Data Maturity in Europe’ ( 2016), only four of the EU28+ countries did not yet have a national Open Data Portal; Latvia, Liechtenstein, Luxembourg and Malta. In 2016 Luxembourg launched its portal and was joined in 2017 by Latvia and Malta. 2 See, for example, https://data.london.gov.uk/data-requests/ 3 See, for example, https://data.gov.uk/apps 4 Anne L. Washington (George Mason University), David Cristian Morar (George Mason University): Open Data Repositories: Intimating Data Publics through File Formats. 5 https://www.datacite.org/cite-your-data.html 6 https://www.nature.com/articles/sdata201618 7 Sarah Leonard, 2012 8 Apart from those referenced elsewhere: Recommendations for Open Data Portals, from Set up to Sustainability https://www.europeandataportal.eu/sites/default/files/edp_s3wp4_sustainability_recommendations.pdf Open Data User Group, National Information Infrastructure https://data.gov.uk/sites/default/files/library/odugUK_NII_final%20%281%29.pdf Open Data in the Health Sector http://openhealthcare.org.uk/open-data-in-the-health-sector Data Experiences and Data Visualisation and Data Worlds http://jonathangray.org/2017/02/28/data-experience-density/ Do we need portals for Open Data? http://odcamp.org.uk/do-we-need-a-portals-for-open-data/ Best Practice: (Re)Use Federated Tools https://www.europeandataportal.eu/sites/default/files/reuse-federated-tools.pdf 9 https://theodi.org/what-is-open-data 10 https://www.dawex.com/en/ 11 https://www.qdatum.io/ 12 https://socrata.com/ 13https://support.socrata.com/hc/en-us/articles/202949968-Learn-about-data-portal-usage-from-Socrata-Site-
Analytics 14 Kacprzak, E., Koesten, L. M., Ibáñez, L. D., Simperl, E., & Tennison, J. (2017). A Query Log Analysis of Dataset Search. In International Conference on Web Engineering (pp. 429-436). Springer. 15 https://developers.google.com/search/docs/data-types/datasets 16 Koesten, L, Kacprzak, E, Tennison, J and Simperl, E (2017) Trials and Tribulations of Working with Structured Data - a Study on Information Seeking Behaviour CHI ’17 Proceedings of the 2017 ACM SIGCHI Conference on Human Factors in Computing Systems 17 https://certificates.theodi.org/en/ 18 http://5stardata.info/en/ 19 https://joinup.ec.europa.eu/asset/dcat_application_profile/description 20 https://www.europeandataportal.eu/sites/default/files/re-using_open_data.pdf p40 21 https://medium.com/@nicolasterpolilli/the-global-epic-of-data-distribution-779638eab6be 22 http://visual.ons.gov.uk 23 http://geo-explore.ecs.soton.ac.uk 24 Open Data Portal Watch http://data.wu.ac.at/portalwatch 25 http://blog.kaggle.com/2016/08/17/making-kaggle-the-home-of-open-data/