african markets revealed — january 2012... · advanced economies growing at 1.9% in 2012, but we...
TRANSCRIPT

African Markets Revealed — January 2012
Fixed Income Research
Index
African markets Rolling with the punches 3
Angola Managing expansion 16
Botswana Commodity cycle to dominate sentiment 20
Côte d’Ivoire Strong post-crisis rebound 24
Democratic Republic of the Congo Threat to stability 28
Egypt New political dawn 32
Gabon Initiating economic transformation 36
Ghana Seeking Goldilocks 40
Kenya Let the yield compression games begin 44
Malawi Subdued outlook for the economy 48
Mauritius Economic resilience pays off 52
Mozambique Moving to more accommodative policies 60
Namibia Commodity cycle to impact output growth 64
Nigeria Pushing through structural reforms 68
Republic of the Congo Output diversification is key 72
Senegal Decision time 76
South Africa Keeping its head above water 80
Tanzania Economic growth moderating 84
Uganda Policy focused on macroeconomic stabilisation 92
Zambia A new day, a new dawn 96
Tunisia Delivering a successful transition 88
Morocco A diversifier in a volatile region 56

African Markets Revealed — January 2012
2 Fixed Income Research
Yvette Babb* +27-11-378-7239 [email protected]
Stephen Bailey-Smith* +44-20-3145-6964 [email protected]
Adriaan du Toit* +27-11-378-7329 [email protected]
Jan Duvenage* +27-11-378-7229 [email protected]
Samir Gadio* +44-20-3145-6774 [email protected]
Thabi Leoka* +27-11-378-8151 [email protected]
Phumelele Mbiyo* +254 (020) 3638988 ext 89 [email protected]
Dmitry Shishkin* +44-20-3145-6963 [email protected]

3 Fixed Income Research
African Markets Revealed — January 2012
that recession is likely across EZ as a whole with the UK also getting sucked in. While the US may avoid negative growth, it will continue to struggle to keep economic ac-tivity growing, and the Fed is likely to further ease mone-tary policy in an attempt to do so. The last WEO saw advanced economies growing at 1.9% in 2012, but we suspect this will be nearer 1.2%.
China’s slowdown has further to go
With its clear export links to growth in the DM econo-mies, we have been fairly negative on China’s growth outlook since Q2:11. Not only is there a drag from the net export component of GDP, but China’s business/investment cycle also appears to be rolling over. While China is not fiscally constrained to the extent that most DM economies are, we are still looking for China to grow around 7.2% y/y in 2012 compared to the WEO estimate of 9.0%.
Global growth re-balancing
Growth in the EM economies is likely to be nearer 5.6% in 2012, compared to the 6.4% projected in the WEO. Importantly, while EM economic growth will clearly be dragged back by the problems facing the DM econo-mies, the increasing broadening of intra-EM trade and
Global growth: still slowing
Following the 2008 financial crisis, we were generally more constructive than the market on the likely strength of the economic rebound. As such, we generally found our global growth outlook on the bullish side of the mar-ket throughout 2009 and 2010. It was a position that proved appropriate. We switched our stance in Q2:11 and have since found ourselves on the bearish side of consensus. This still appears to be the case. In our Sep 11 AMR, we were looking for the IMF’s last WEO (Sep 11) to revise down its global economic growth outlook. This was indeed the case. The IMF is now looking for global growth of 4.0% in 2012, the same as in 2011, compared to their previous forecast of 4.4% y/y in 2011 and 4.5% y/y in 2012 in the Jun 11 WEO. Once again we suspect both will have to be revised down, with global growth probably nearer 3.0% in 2012.
Eurozone problems hold the key
Central to our more bearish global growth view has been our concern over the ability of EZ policy makers to de-liver a solution to the region’s structural troubles. We are still of the view that the credibility in EZ policy makers gets worse before it gets better. We are now of the view
African markets: rolling with the punches
• The significant downward re-pricing of global growth since May 2011 fostered a jittery risk environment, which added to the very testing circumstances already faced by many African markets. Although we are still cautious on global growth, we are more constructive on asset prices that have already discounted plenty of bad news and are benefiting from ample G4 liquidity. Such an outlook should prove more supportive for commodity prices and portfolio flows into Africa that have been extremely limited in recent years.
• Of the exogenous variables driving Africa’s markets, political risk derived from a series of elections will remain a key differentiator in 2012.
• In recent months we have also seen a marked improvement in the performance of Africa’s currencies as the markets again pressed home the message that real interest rates matter. The sharp increases in interest rates have added significant protection to a number of currencies and made them extremely attractive from a carry trade prospective. We are extremely constructive on UGX, KES and TZS seeing further appreciation. There is also attractive risk reward for being long NGN, AOA, MZN and probably EGP given the extra-ordinary rates of-fered by the NDFs. We are ambivalent on ZMK and ZAR and nervous on GHS.
• In the local bonds, we see huge yield compression in Uganda, Kenya, Zambia and possibly even in Egypt, if our core muddle-through political scenario materialises. We are relatively neutral on Nigeria, nervous on Ghana and we would be paying rates in South Africa at present.
• We are modestly constructive on African equity markets seeing some value in Nigeria, Kenya and arguably Egypt in coming months.
• In Africa’s Eurobonds, we are positive on Côte d’Ivoire 32s and Egypt’s 20s and 40s. We are neutral on Nigeria 21s and Rep Con 29s and negative on Gabon 17s, Senegal 21s, and Ghana 17s.
African Markets Revealed — January 2012
4 Fixed Income Research
financial flows means that the influence is increasingly muted. EM economies are likely to provide the bulk of the contribution to global growth for years to come. EM economies presently produce around a third of global output. The IMF assumes they would produce more than half by 2028. We suspect that they will contribute more than half of global output faster than that. We continue to believe that the 2008 global financial crisis marked a sig-nificant turning point in the organisation of the interna-tional economic system. An extended period of de-leveraging in the DM means slower growth and a sus-tained reversal of financial flows, which will foster a sharp outperformance by EM economies for years to come.
Search for yield
A key feature of EM economic outperformance will be the continued search for yield from DM investors and actually EM investors that had previously been long “safer” DM assets. In particular, the cyclical policy of degrading DM currencies via quantitative easing will foster greater de-mand for scarcer EM assets while the loose monetary policy stance persists. Interesting, while foreign direct investment into EM and frontier markets (FM) has been reasonably solid post 2008 crisis, FM, including Africa, have underperformed wider EM in terms of portfolio flows. We see this as a cyclical opportunity as part of a wider multi-year structural shift towards a search for al-pha returns from fast growing economies coming off low bases.
Commodity prices: lower slower
The downward pressure on commodity prices since early May has certainly been associated with sliding growth expectations. Our still somewhat more bearish-than-
market global growth expectations continue to suggest we see the risks for commodity prices towards the down-side, although we suspect the trajectory is likely to be more moderate. Our core view for USD strength against the major currencies in coming months also feeds into our modestly bearish expectations for commodity price which are still predominantly priced against the USD.
Importantly, the grind lower in commodity prices will moderate the deceleration in global GDP growth both directly via the consumption substitution channel and indirectly via lower inflation and thus reduced interest rates.
Perhaps the major commodity price influence for global economic activity remains the level of oil prices and to a lesser extent food prices. In line with broader commodity prices, we are relatively sanguine on oil and food prices with a core scenario of a fairly gradual grind lower in line with price trends in recent months. That said, recent oil price action on growing concerns over oil supply from Iran appear to have added a further support for prices during 2012. Having been looking for benchmark Brent front-month to move down to the mid-USD90.0/bbl be-fore rebounding somewhat and averaging around USD100.0/bbl, our core scenario is now for an average price of USD110.0/bbl and USD100.0/bbl probably hold-ing.
Global rates: lower still
Our expectations for slower global economic growth with ensuing lower commodity prices and declining inflation points to the likelihood of even lower rates for longer across DM. The US Fed has already signalled there will be no change to its reference rate until at least mid-2013
Sources: Bloomberg; Standard Bank Research
Figure 1: Downward commodity price bias to continue Figure 2: UST 10-y still in downward channel
0
5
10
15
20
May-78 Aug-86 Nov-94 Jan-03 Apr-11
%
Sources: Bloomberg; Standard Bank Research
Jan 09 = 100
60.0
132.5
205.0
277.5
350.0
Oct-06 Oct-07 Oct-08 Oct-09 Nov-10 Nov-11
CRB Index Oil S&P Softs

5 Fixed Income Research
African Markets Revealed — January 2012
and in Jan 12 it will start making their 2-year forecast for the reference rate explicit. What this probably means is that the period for which rates are expected to remain extremely low will be pushed out even further.
Meanwhile, the UK announced a programme of further quantitative easing as expected, which will run at least until Feb 12. At the same time the expected reversal of the ECB’s tightening bias has materialised. In fact, the ECB has arguably also started on its own attempt at additional liquidity creation via a programme of providing collateralised 3-y term loans for EZ banks.
The anticipated bull flattening in DM sovereign rates curves (with the exception of those under extreme credit stress) is also materialising and we see this continuing in coming months. Importantly, we see the bid for 10-y UST continuing to push down yields (albeit modestly) in coming months, which will continue to provide solid sup-port for EM sovereign USD Eurobonds.
Although average EM 10-y yields are higher than they were in early Sep 11, prior to a sharp sell-off at the end of that month, they have now taken back most of the losses. We are thus relatively sanguine on the future direction seeing sideways price action similar to that seen over the last two years. The key driver of short-term moves is likely to remain currency developments, which in turn remain subject to significant swings in global risk appetite.
Global currency: further EUR/USD downside
Our core view for EUR/USD downside has materialised well since May 2011 and we see few reasons to reverse our core view, while the fiscal and debt issues facing the EZ countries remain in place. We have shifted our multi-
month EUR/USD target to 1.15.
That said, with all G4 continuing to deliberately under-mine their currency values, the ugly currency competi-tion looks set to role on for some time. As such, we con-tinue to look for EM currencies to outperform DM on an outright basis and certainly on a interest rate adjusted (forward) basis.
That said, there has been limited evidence of EM FX outperformance since our Sep 11 AMR. Not including interest rates, our simple average EM FX basket has lost around 9.4% against the EUR, while it has only gained a modest 1.5% against the EUR. This is hardly a solid argument for EM outperformance over DM. The much-mused problem remains the correlation between negative global risk-appetite and USD strength.
Sources: Bloomberg; Standard Bank Research
Figure 3: Simple average EM 10-y bond yield Figure 4: EUR/USD in solid down channel post May 11
Sources: Bloomberg; Standard Bank Research
Sources: Bloomberg; Standard Bank Research
Figure 5: EM FX performance is mixed
6.00
7.75
9.50
11.25
13.00
Jun-99 May-02 Apr-05 Mar-08 Feb-11
EM 10-y bond yield
1.15
1.25
1.35
1.45
1.55
Apr-10 Sep-10 Feb-11 Jul-11 Dec-11
EUR/USD
Jan 00 = 100
80.00
107.50
135.00
162.50
190.00
Jun-99 Jul-02 Aug-05 Sep-08 Oct-11
USD/EMFX EUR/EMFX

African Markets Revealed — January 2012
6 Fixed Income Research
crisis, because of the thin positioning by international investors. This means that the main source of beta is extremely diluted at present, which is probably a good thing in a muddle-through risk-on, risk-off jittery type of environment.
Global equities: further downside
Our negative expectations for global equities back in early Sep 11 was broadly born out. MSCI DM was flat between early Sep and end Dec 11, taking the decline for 2011 to a moderate 7.6%. Interestingly, S&P500 was up 7.1% over the last 4-m of 2011, taking the index flat for 2011. MSCI EM was down 10.3% in the last 4-m of 2011 taking the decline to 20.4% for the full year. MSCI FM was again the star underperformer losing 22.1% during 2011, although it was only 6.7% down in the final 4-m period.
Interestingly, price action in the first couple of weeks of 2012 has been more encouraging for equity markets gen-erally. MSCI DM is up 1.6%, MSCI EM is up 4.0%, al-though MSCI FM is down 1.2%. We have been arguing for the outperformance of FM equities for some time and still believe they offer significant upside relative to EM and especially DM. However, by nature they are less highly correlated than other equity markets and thus rely more on local idiosyncratic factors. These have not been particularly supportive during 2011 in a number of the larger countries in the index, especially in the Middle-East and peripheral Europe.
We are generally looking for another year of muddle through for global equities with a volatile but ultimately directionless year. We would expect EM to outperform DM after its underperformance in 2011, but still not to offer much in the way of price upside, despite the best
Global risk appetite: reasonable
Ironically, the failure of EM FX to outperform DM since early Sep 11 is not just a product of global risk appetite, but actually reflected a decided anti-EM risk bias during the period. Actually after the Sep 11’s spike, risk appe-tite, as measured by the VIX which is a traded volatility index based on the S&P500 and arguably the best ba-rometer of global risk sentiment, improved significantly. In fact, there was an associated shift lower in EM FX volatility suggesting that there was not so much uncer-tainty but a clear lack of demand for EM FX.
Ironically, the high level of risk aversion throughout 2011, but particularly in Sep 11, actually makes us moderately more constructive on sentiment going forward, as we feel that there is a considerable amount of bad news built into assets prices. Indeed, for another marked downturn in assets prices, we would need a major negative event to overturn fairly thin long positioning. These are by nature difficult to predict and thus impossible to position for. Thus our core risk scenario is for a muddle-through in the EZ crisis with the authorities continuing to provide enough liquidity to prevent massive dislocation in the banking sector and to smooth the inevitable de-leveraging of the banking sector across the EZ. Such a course of action will, however, arguably make the length of the corrective G4 de-leveraging period longer.
The combination of moderate muddle-through risk senti-ment and extremely low G4 rates should provide a rea-sonably constructive environment for EM and FM assets. Such a muddle through prognosis is also likely to make investors more discerning regarding the peculiarities of particular cyclical or structural stories, which are able to offer some genuine alpha. Importantly, FM assets have clearly been underperforming post the 2008 financial
Sources: Bloomberg; Standard Bank Research
Figure 6: risk appetite recovering
0.00
22.50
45.00
67.50
90.00
Sep-05 Apr-07 Oct-08 May-10 Nov-11
EM FX Volatility VIX
Figure 7: DM equity outperformance in 2011
Jan 09 = 100
60.0
107.5
155.0
202.5
250.0
Oct-06 Jan-08 May-09 Aug-10 Dec-11
MSCI EM MSCI DM MSCI FM
Sources: Bloomberg; Standard Bank Research

7 Fixed Income Research
African Markets Revealed — January 2012
efforts of the G4 policy makers to keep liquidity ample and growth rolling forward.
Africa’s election schedule remains heavy
Africa’s investment climate was heavily influenced by the continent’s shifting political sands in 2011. There was the usually risk going into elections generated by policy uncertainty. Yet from early 2011, political risk was addi-tional augmented by the clamouring for democratic change across the Arab world. The risk of a popular uprising to overthrow less democratic leaders added to the risk around elections. Political risk perceptions across the continent were also increased by the slide into civil war in Côte d’Ivoire due to the incumbent’s un-willingness to relinquish power.
There is no shortage of election risks across Africa in 2012, with elections (or referendums) taking place in possibly 20 out of the 54 countries across the continent. The most closely followed by the international investor community will be the outcome of the ongoing electoral process in Egypt, presidential election in Senegal on 26 Feb 12, parliamentary and presidential elections in
Kenya (although they may be delayed until 2013) and parliamentary and presidential elections in Ghana in Dec 12.
African growth: slower
Since May 2011 we have been revising down our growth estimates for Africa predominantly in line with an expected slowdown in global growth activity. Our projec-tion for weighted sub-Saharan African growth was 5.0% in 2011 (which is still below the IMF’s expectation of 5.2% revised down from 5.6%) and a similar trajectory in 2012, which is well below the IMF’s expectation of 5.8%.
One of the key issues of disparity between the IMF and our view is with regards to South Africa, which remains the largest economy on the continent. The IMF has South Africa growing at 3.6% in 2012 (up from 3.4% in 2011), but we expect both of these numbers to be lower than expected, pulling down the SSA aggregate. An-other potential complicating factor will be the likely sharp upward revision to GDP that Nigeria is likely to get from the result of new survey data. This will increase the weights of the faster growing sectors of the economy in a similar way to the process in Ghana in late 2010.
Interestingly, excluding SA and Nigeria, the IMF sees SSA growth of 6.8% y/y in 2012 from 5.4% y/y in 2011. Once again we are more cautious, projecting a figure of 6.0% for 2012 as more likely, as we see SA as the key drain rather than Nigeria.
It is also worth noting, that we are broadly in accord with the IMF in seeing not one economy actually slipping into recession in SSA during 2012.
The transmission mechanism between global growth and African growth remains complex. The channel of trade in goods and services (especially tourism) will be most marked in South and North Africa, where the link-ages are most developed.
Good and service linkages actually remain rather weak in most of the countries in the middle of Africa, where we maintain the main linkage to global growth will be commodity prices. The transmission from commodity prices will also be complex across countries. The key division remains between oil importers and oil exporters, with the importers looking like they will benefit less than we had previously thought in line with our modest up-ward revision in international oil prices for 2012.
Remittances will be another potential dampener as growth slows across DM. However, we continue to see growing evidence of the market pro-cyclicality tied to expectations of currency movements. As such, we sus-pect higher rates, more stable currencies and improving
Figure 8: Africa’s election schedule 2012
Country Election type DateEgypt Parliamentary (Stage 3) 03-Jan-12Egypt Legislative (1st round) 03-Jan-12Senegal Presidential 26-Feb-12Gambia, The Legislative 24-Mar-12Egypt Presidential Mar-12Madagascar Presidential (Tentative) Mar-12Madagascar
y(Tentative) Mar-12
Mali Presidential (1st round) 29-Apr-12Mali Presidential (2nd round) 13-May-12Burkina Faso Parliamentary May-12Mali
y (round) 01-Jul-12
Maliy (
round) 22-Jul-12Cameroon Legislative Jul-12Kenya Presidential (1st round) 14-Aug-12Kenya Parliamentary 14-Aug-12Sierra Leone Legislative Aug-12Angola Parliamentary Sep-12Sierra Leone Presidential 17-Nov-12Ghana Presidential Dec 12Ghana Legislative Dec-12Senegal Parliamentary 2012Lesotho Parliamentary 2012Togo Parliamentary 2012Zimbabwe
y(Tentative) 2012
Equatorial Guinea Parliamentary 2012Congo (Brazzaville) Legislative 2012Algeria Legislative 2012Guinea Legislative 2012Sudan Referendum 2012Zimbabwe Referendum (Tentative) 2012Zambia Referendum 2012
Source: Standard Bank Research

African Markets Revealed — January 2012
8 Fixed Income Research
relative investment opportunities will certainly neutralise some of the negative impact from slowing DM growth.
The key linkage between Africa’s growth and the global environment is via investment confidence. It is quite pos-sible that we see a slowing of investment decisions as confidence in the global financial system continues to be questioned and assumptions around commodity prices have to be re-cut. That said, as already discussed we are reasonably sanguine on global risk sentiment in 2012, having had a period of extreme risk aversion during 2011.
There are, of course, a number of endogenous cyclical drivers of African growth that should be taken into consid-eration. We have argued for some time that the expan-sionary fiscal and monetary policies post the 2008 crisis were inappropriate for many of Africa’s economies which would subsequently overheat fostering depreciation/inflation spirals. The resulting sharp increases in interest rates across a number of countries will almost certainly undermine credit extension to both the private and public sides of the economy, slowing growth.
African FX: time for outperformance
Our AF10 index (which includes 10 of the most easily traded African currencies) has performed much better over the months since Sep 11. The AF10 depreciated 7.3% against the USD and 5.5% against the EUR during 2011. However, since early Oct 11 the situation has changed. The AF10 has appreciated 2.0% against the USD and around 11.4% against the EUR.
Importantly, we believe a great deal of the recent outper-formance reflects the product of the reversal of previous
weakness, in line with drastic changes in monetary pol-icy. Once the sharply higher interest rates are taken into account, the situation looks even more favourable with the AF10 returning around 5.0% against the USD over the last 4-m which was a significant outperformance rela-tive to EM benchmark bond indices (down around 5.0% over the period).
Interestingly, there has been a huge discrepancy be-tween the performances of the various African currencies suggesting they have the potential to offer genuine idio-syncratic low beta risk at present.
The outlook for Africa’s currencies still looks extremely mixed, but with some offering exceptional carry trade opportunities.
Our favourite carry trade back in Sep 11 was UGX, which has performed extremely well and we see this continuing over the next few months at least. We certainly see it as unlikely that the USD/UGX upside will be greater than the 20.0% plus interest rates on offer. In fact, we are targeting a move down to 2150.
We feel similarly about the potential for the carry trade in KES, where T-bill rates are also 20.0% plus and we sus-pect the authorities will go out of their way to ensure KES stability or strength in coming months at least.
We suspect that USD/TZS would prove a similarly posi-tive investment, but it is extremely difficult for foreign investors to gain access to the carry.
We feel that the appreciation of MZN against the USD has run its course and that the MZN has now joined the group of heavily managed currencies which attempt to remain stable against the USD. Access remains difficult, but we would look to buy the local bonds when offered at
Figure 9: Sub-Sahara Africa GDP by demand
-5.0
0.0
5.0
10.0
15.0
2005 2006 2007 2008 2009 2010 2011f 2012f
%
Investment Imports
Exports Private consumption
Gov consumption Real GDP
Sources: IMF; WEO; Standard Bank Research
Figure 10: AF10(1) index has lost against EUR and USD
Jan 09 = 100
85.0
93.8
102.5
111.3
120.0
Nov-08 Aug-09 May-10 Mar-11 Dec-11
AF10 USD AF10 EUR
Sources: Bloomberg; Standard Bank Research
1. Note AF10 is Botswana, Egypt, Ghana, Kenya, Mauritius, Nigeria, South Africa, Tanzania, Uganda and Zambia.
9 Fixed Income Research
African Markets Revealed — January 2012
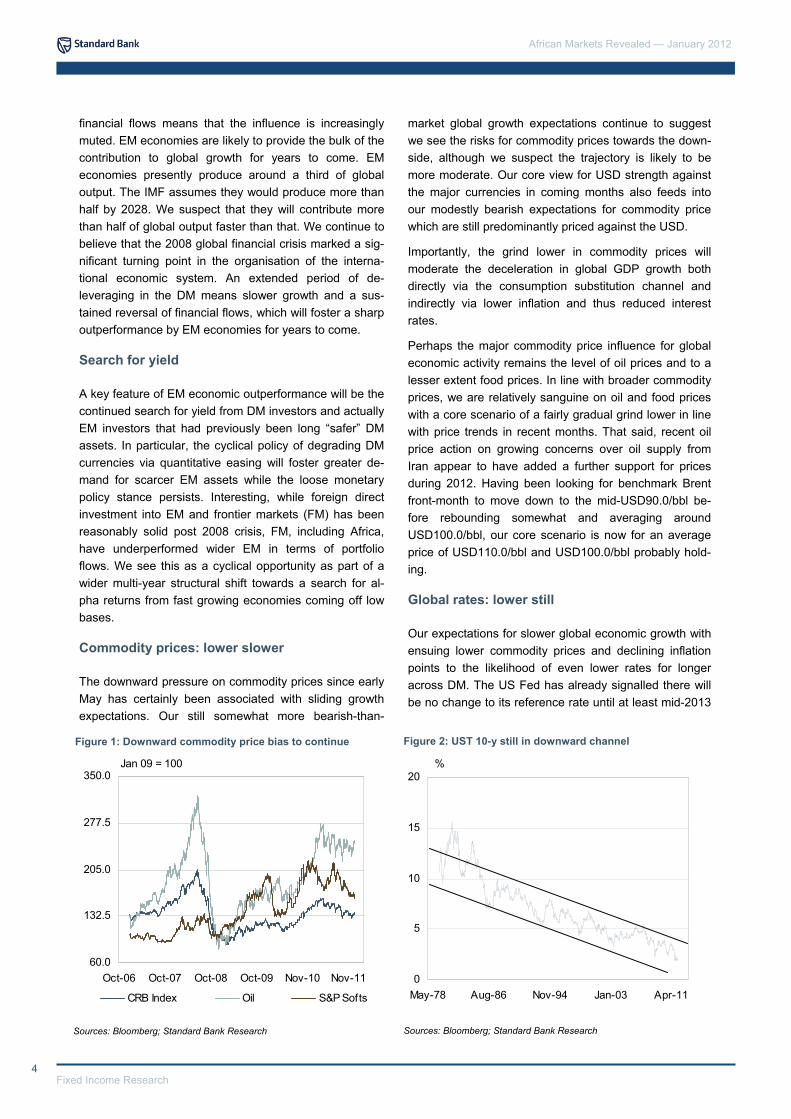
the next primary auction, assuming rates remain in the present attractive levels.
The relatively low rates in both nominal and real terms in Angola make the argument for a short USD/AOA posi-tion less compelling than it has been in the past. How-ever, there is access via 1-y NDFs that look attractive at implied yields of around 9.5%. The external fundamen-tals remain extraordinary supportive for the AOA and there may well be technical pressure for some apprecia-tion as a result of legislation designed to reduce dollari-sation in the economy.
After the Central Bank of Nigeria sharply increased inter-est rates in Oct 11, in order to help stabilise confidence in the currency, we like the carry trade in NGN arguably most of all Africa’s currencies at present.
Our confidence in the GHS has been rattled significantly over the last few months and we are concerned that as foreign investors lose confidence in the GHS, there will
be an unwinding of their positions, making the move higher in USD/GHS somewhat self-fulfilling.
One of the highest implied interest rates on offer at the moment is in EGP NDFs where 1m rates are above 50.0% as the market grapples with the ability of the CBE to continue delivering USD/EGP stability despite FX re-serves rapidly disappearing. We are increasingly coming around to the idea that USD/EGP stability can be main-tained.
We are reasonably agnostic on USD/ZMK as the easing of monetary policy has made the carry at the front end of curve less attractive and offers the ZMK less protection in a still rather jittery global risk environment.
Although we are reasonably constructive on the ZAR during 2012, we suspect there will be some modest fur-ther weakening prior to an expected rebound. The main directional driver remains portfolio flows, which will con-tinue to be directed by global risk sentiment.
Figure 11: Carry trade return against the USD since Sep 11
-10.0
-5.0
0.0
5.0
10.0
15.0
20.0
25.0
Ango
la
Bots
wan
a
DR
C
Egyp
t
Gha
na
Keny
a
Mal
awi
Mau
ritiu
s
Moz
ambi
que
Nig
eria
Sout
hAf
rica
Tanz
ania
Uga
nda
Zam
bia
Aver
age
4m FX return (USD) 4m IR return (USD)
Sources: Bloomberg; Standard Bank Research
Figure 12: Carry trade return against the EUR since Sep 11
-10.0
0.0
10.0
20.0
30.0
40.0
Ango
la
Bots
wan
a
DR
C
Egyp
t
Gha
na
Keny
a
Mal
awi
Mau
ritiu
s
Moz
ambi
que
Nig
eria
Sout
hAf
rica
Tanz
ania
Uga
nda
Zam
bia
Aver
age
4m FX return (EUR) 4m IR return (EUR)
Sources: Bloomberg; Standard Bank Research

African Markets Revealed — January 2012
10 Fixed Income Research
Sources: Bloomberg; Standard Bank Research
Sources: Bloomberg; Standard Bank Research
Figure 13: SB FX Money Market Index vs. EM Global bond indices
0.8
0.9
1
1.1
1.2
1.3
1.4
1.5
1.6
1.7
1.8
Nov-06 Jun-07 Jan-08 Jul-08 Feb-09 Aug-09 Mar-10 Sep-10 Apr-11 Nov-11
SB FX Index Markit iBoxx Global Bond EM JPMorgan GBI-EM Global
Figure 14: AF10 yield curve: simple yield average
8%
9%
10%
11%
12%
13%
14%
15%
16%
0 2 4 6 8 10 12 14 16 18 20
Modified duration
Sep-11 Jan-12

11 Fixed Income Research
African Markets Revealed — January 2012
Africa’s simple average local yield curve, as measured by our AF10 currencies, has bear flattened over the last four months. We suspect the curve will deliver significant yield compression during 2012, with some moderate compression occurring in the next few months as the start of the easing cycle in a number of countries gets underway.
As with our conviction currency trades, Uganda and Kenya once again come top of the list, with the potential for some 1000bps of compression at the short-end of the bond curve as they normalise in line with inflation falling dramatically.
The heavily inverted nature of the Nigerian curve means we are looking for some bear flattening before we look at taking on duration again. Although this may be within weeks, once the market has dealt with the partial re-moval of fuel subsidies and the CBN’s response to the change.
We are a little ambivalent on duration in Zambia, al-though the heavy tax and illiquidity make our conviction rather marginal.
We are still watching and waiting to get involved in dura-tion in Egypt’s local curve despite the 5-y bond yields reaching 16.7% on 17 Jan 12. While we are becoming more constructive as we see the possibility of an end to present political uncertainty, we need to see a little more confidence return to the currency first.
In line with our concern over the GHS, we have become a lot less constructive on duration in Ghana and expect to see yields pick up along what is already a fairly steep curve.
We are not presently constructive on duration in South
Africa and would be paying rates as we suspect there is more risk to inflation expectations increasing in coming months as we get a spike in inflation fuelled by ZAR weakness and regional food prices.
African equities: enough already
Our negative outlook for equities across Africa in Sep 11 proved reasonably appropriate with MSCI Africa index down 1.8%. That said, so far 2012 has opened up on a more constructive tone for a number of markets. The JSE is at all time highs at the time of writing.
We suspect that there is a degree of catch up that takes place in coming months between EM equities and the performance of the S&P500, which actually performed well, increasing 17.9% since its lows in early Oct 11.
The mildly bullish equity tone should assist Africa’s mar-kets but will need significant improvement in some of the endogenous drivers to really rebound aggressively.
We are still in wait-and-see mode in Egypt, but are tempted to start mildly accumulating on a modestly more constructive political view, as we feel a huge amount of negative political economy news is already in the prices.
We are also becoming mildly constructive on Nigeria mainly because the valuation have started to look very cheap with the main index on a PE value of around 7.0. We are reasonably happy on the stability of the NGN which has been a major constraint to foreign participa-tion in past years. High interest rates will, however, con-tinue to mitigate equity market growth and we are not convinced this is coming down any time soon.
If one is looking for underperforming equity markets, Kenya has to qualify, falling around 30.0% during 2011.
Figure 15: Africa aggregate comparative equity performance
Jan 09 = 100
20
80
140
200
260
Jan-02 Jun-04 Dec-06 May-09 Nov-11
MSCI EM MSCI Africa MSCI FM MSCI DM
Sources: Bloomberg; Standard Bank Research
Figure 16: Africa’s individual stock market performances
Jan 09 = 100
-10.0
60.0
130.0
200.0
270.0
Oct-07 Nov-08 Nov-09 Dec-10 Dec-11Egypt Nigeria KenyaMauritius SA MSCI Africa
Sources: Bloomberg; Standard Bank Research

African Markets Revealed — January 2012
12 Fixed Income Research
We are tempted to suggest that there will be a rebound on a multi-month basis as a great deal of the bad news is in the price. The elections, which the market had thought would be in Aug 12 now look likely in Mar 13 and will push political risk down the road a little. Perhaps most importantly the stability and probably additional strength of the KES will make foreign investors happy to own the local equities. P/E ratio have increased in recent months to around 11.0, as earnings have been worse than anticipated. Our expectation that inflation and thus interest rates will come off aggressively during 2012 also add to our growing conviction on Kenyan equities.
African Eurobonds: differentiated
According to our African sovereign Eurobond indices, the underperformance of our Africa indices with and without South Africa relative to the EMBI Global index continued in the 4-m since early Sep 11 and the last AMR. In terms of total return, EMBI Global was up 1.0% taking the return for 2011 to 8.5%. Our Africa (SBAFSO Bloomberg) which in-cludes SA returned 1.7% since Sep 11 but was up 5.6% during 2011. Our (SBAFSOZ) which excludes SA performed similarly falling 1.5% since Sep 11 and returning 5.3% during 2011.
We remain broadly constructive on the sovereign Eurobond asset class during 2012. In particular, we see the risks to a sharp rebound in US treasury yields as modest, with the risks probably skewed towards lower UST yields for longer. Such an outlook will continue to give the asset class protec-tion going forward.
In terms of the African index we are actually reasonably con-structive. In particular, we are looking for a marked rebound in the performance of Egypt 40s and 20s, which have been the star underperformers in recent months. Importantly, we are becoming more constructive on a muddle-through politi-cal outcome, which provides enough stability for investment decisions to start being made again.
Our other favourite overweight position remains Côte d’Ivoire 32s and our strategy of accumulation on sell-offs to the low 50s appears appropriate at present. Indeed, we suspect that after the investor meeting with the Ivorian government on 23 Jan 12, at which we expect more clarity on the process of the government becoming current on the CIV 32s, the price will shift into a new range between 55 and 60 until the Jun 12 coupon payment is actually made. Our longer-term expecta-tion is for Côte d’Ivoire to trade near to Ghana which pres-ently would be a price of around 75.0.
We would be underweight Gabon 17s, which continue to trade a little rich despite us being reasonably happy with credit matrix on the back of some apparent diversification effort.
We are also nervous of being long Senegal 21s going into Feb 12 elections, which will probably be noisy with a fairly uncertain outcome.
We are also nervous of holding Ghana 17s going into elections in Dec 12, which will continue to place funding pressure on the government at a time when the currency is demonstrating signs that the economy is overheating.
We are relatively neutral to negative on Nigeria 21s as they are trading reasonably tight and require a coherent structural adjustment strategy to start being delivered in order to tighten the bond spreads much further. Although we are less bearish on oil prices for 2012, Nigeria clearly still remains extremely vulnerable to them moving sharply lower.
We remain constructive on Rep Con 29s given the ex-tremely strong fundamentals. Yet the bonds have rallied hard already and we would probably look to dips to build larger positions.

13 Fixed Income Research
African Markets Revealed — January 2012
Figure 17: African Sovereign and Corporate bonds (spread over US Treasuries)
Congo '29
IvyCoast '32
Nigeria '21
Senegal '21
Seychelles '26
BTUN '27Gabon ' 17
Ghana '17
Grtbnl '16
Esafrb '16
Afrln '16
Afrexi '16
Afrexi '14
Namibia '21
0
300
600
900
1200
0 1 2 3 4 5 6 7 8 9 10 11 12 13 14Modified duration
Bps
Egypt S. Africa African Corporares
Sources: Bloomberg; Standard Bank Research
Figure 18: African and broader EM bonds (spread over US Treasuries versus credit rating)
S. Africa '20
Namibia '21
Egypt '20
Gabon '17
Ghana '17
Nigeria '21
Senegal '21
Tunisia '27
Seychelles '26
Afrln '16
Afrexi '16
Esafrb '16
Grtbnl '16
0
300
600
900
1200
AA- A+ A A- BBB+ BBB BBB- BB+ BB BB- B+ B B-
S&P credit rating
Bps
Sources: Bloomberg; Standard Bank Research

African Markets Revealed — January 2012
14 Fixed Income Research
Figure 19: 5-year performance of African sovereign USD bonds vs. JPM EMBI Global index
0.70
0.80
0.90
1.00
1.10
1.20
1.30
1.40
1.50
1.60
Jan-07 Jul-07 Feb-08 Aug-08 Mar-09 Oct-09 Apr-10 Nov-10 May-11 Dec-11
Bps
SB Africa Sovereign SB Africa Sovereign (ex ZA) EMBI Global
Sources: Bloomberg; Standard Bank Research
Figure 20: 1-year performance of African sovereign USD bonds vs. JPM EMBI Global index
0.94
0.96
0.98
1.00
1.02
1.04
1.06
1.08
1.10
1.12
1.14
1.16
Jan-11 Feb-11 Mar-11 Apr-11 May-11 Jun-11 Jul-11 Aug-11 Sep-11 Oct-11 Nov-11 Dec-11 Jan-12
Bps
SB Africa Sovereign SB Africa Sovereign (ex ZA) EMBI Global
Sources: Bloomberg; Standard Bank Research

15 Fixed Income Research
African Markets Revealed — January 2012
Figure 21: 5-year history of spread between African sovereign USD bonds and US Treasuries
0
200
400
600
800
1000
1200
1400
Jan-07 Aug-07 Feb-08 Sep-08 Mar-09 Oct-09 Apr-10 Nov-10 Jun-11 Dec-11
Bps
SB Africa Sovereign SB Africa Sovereign (ex ZA) EMBI Global
Sources: Bloomberg; Standard Bank Research
Figure 22: 1-year history of spread between African sovereign USD bonds and US Treasuries
200
335
470
605
740
Jan-11 Feb-11 Mar-11 Apr-11 May-11 Jun-11 Jul-11 Aug-11 Sep-11 Oct-11 Nov-11 Dec-11 Jan-12
Bps
SB Africa Sovereign SB Africa Sovereign (ex ZA) EMBI Global
Sources: Bloomberg; Standard Bank Research
African Markets Revealed — January 2012
16 Fixed Income Research
Angola: managing expansion
Notes: pe — period end; pa — period average; na — not available Sources: Banco Nacional de Angola; Bloomberg; Angola Ministry of Finance; Standard Bank Research
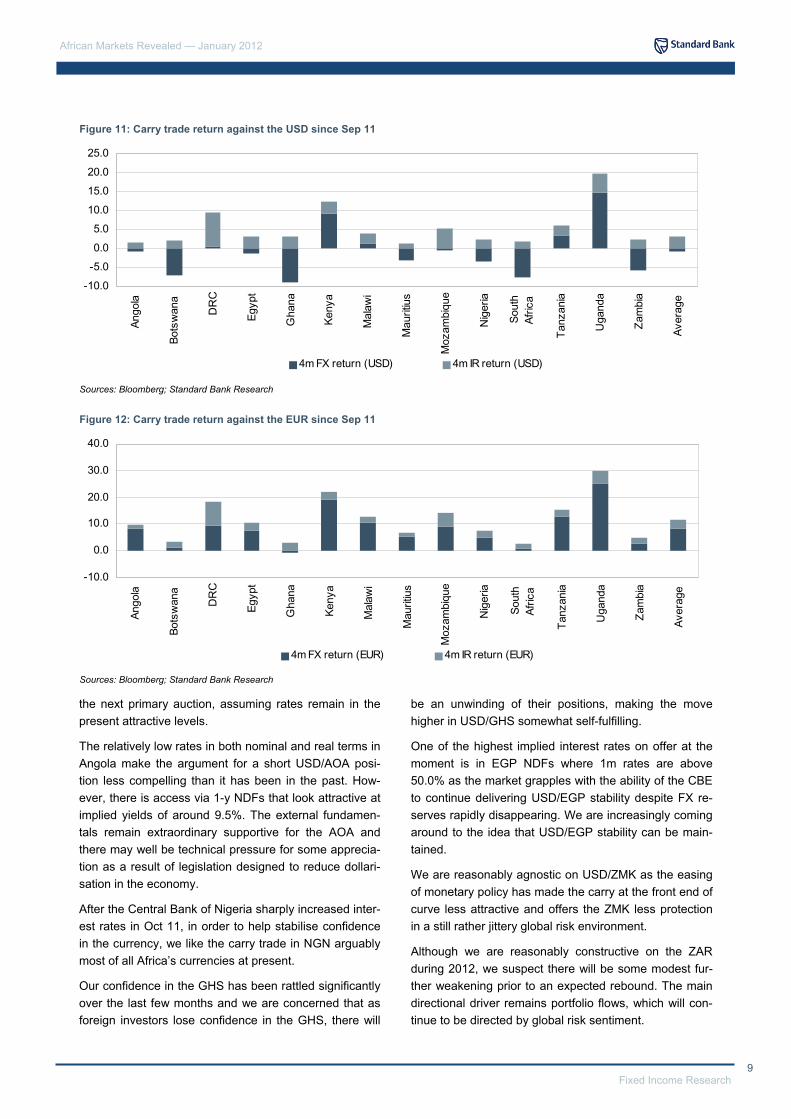
Legislative elections are scheduled to take place in Sep 12, with the head of the party with the most seats in par-liament automatically becoming president, as per the amended electoral law. While speculation about who will succeed Dos Santos as head of the MPLA is rife, it is likely that he will bid for re-election. He may choose to appoint his successor as vice president. This post will also be bestowed with the responsibilities of the prime minister, as the position will no longer exist after the elec-tions. The main opposition party, UNITA, re-elected Isaias Samakuva for the third time as the leader of the party in Dec 11. This despite internal wrangling last year and calls from senior party members earlier in the year for him to step down. A group of five opposition parties (who currently do not hold seats in parliament) are pre-paring to unite forces in the 2012 elections.
Following 3-y of relatively subdued growth, economic activity is set to rebound sharply in 2012 on the back of expanding oil output, the start of production at the lique-fied natural gas (LNG) plant in Soy, as well as continued public and private sector investment. We expect GDP growth to accelerate to 11.4% y/y in 2012, from 4.1% y/y in 2011 and 3.4% y/y in 2010. Oil production is likely to expand to 1.8m bpd in 2012, from 1.7m bpd in 2011, which, in combination with relatively constructive oil prices, is likely to result in a significant positive net export position. From a demand perspective, consumption is likely to receive support from lower levels of inflation. The elections will add to public consumption. The public in-vestment programme (worth USD8.0bn in 2012) is set to boost gross fixed capital formation in transport and en-ergy infrastructure.
Quarterly indicators
Political risk: succession debate continues Election results
GDP growth: strong rebound in 2012 Composition of GDP
Sources: Banco Nacional de Angola; Standard Bank Research
Presidential election (1992) Party % of votes
José Eduardo dos Santos MPLA 49.57
Jonas Malheiro Savimbi UNITA 40.07
António Alberto Neto PDA 2.16
Holden Roberto FNLA 2.11
Legislative election (2008) % of votes Seats
Movimento Popular de Libertação de Angola (MPLA)
81.73 191
União Nacional para a Independência Total de Angola (UNITA)
10.38 16
Frente Nacional de Libertação de Angola 1.13 3
Partido de Renovação Social de Angola (PRS) 3.10 8
Source: Comissao Nacional Eleitoral
Q1:10 Q2:10 Q3:10 Q4:10 Q1:11 Q2:11 Q3:11e Q4:11f Q1:12f Q2:11f Q3:12f Q4:12f
GDP (% y/y) pa 2.6 3.2 3.4 4.2 3.4 4.1 3.9 5.0 9.4 13.2 13.4 9.5
CPI (% y/y) pa 13.8 13.8 14.5 15.8 15.0 14.6 13.2 11.2 11.1 10.7 11.3 11.7
M3 (% y/y) pe 64.6 54.0 22.7 21.5 64.6 54.0 22.7 35.7 28.9 31.5 35.7 26.4
CA/GDP (%) pe 11.7 11.7 11.7 11.7 16.3 16.3 16.3 16.3 9.4 9.4 9.4 9.4
FX reserves (USD bn) pe 14.5 16.2 17.7 19.7 20.5 24.1 25.6 26.1 29.3 32.5 35.7 38.9
Import cover (months) pe 4.3 4.7 5.2 5.7 6.4 7.2 8.0 8.8 9.2 9.6 10.0 10.4
3-m rate (%) pe 20.0 19.0 18.0 11.0 10.0 7.8 3.3 3.9 4.2 5.4 6.5 7.2
1-y rate (%) pe 25.0 25.0 21.0 13.6 12.5 8.0 4.1 5.0 6.2 7.2 8.7 9.4
USD/AOA pe 92.9 92.6 91.8 92.6 93.3 93.3 94.2 94.6 95.1 95.6 96.3 96.8
REER pe 582.1 590.9 598.9 603.4 610.1 616.0 611.4 607.1 606.4 605.9 604.7 603.2
NEER pe 36.4 36.5 36.2 36.6 36.8 36.9 37.1 37.4 37.5 38.4 38.6 38.9
-10.0%
-1.3%
7.5%
16.3%
25.0%
2006 2008 2010 2012f
y/y
GDE Netex Real GDP

17 Fixed Income Research
African Markets Revealed — January 2012
As Africa’s second-largest oil producer, Angola continues to enjoy a large trade surplus, which, combined with sub-stantial financial inflows and fiscal prudence, is likely to contribute to further FX reserve accumulation in 2012. Oil production was constrained by various technical issues in 2011. Our assumptions for oil production in 2012 remain fairly conservative, at 1.8m bpd (in line with budget as-sumptions); however, there is considerable upside risk to these projections as new projects come online and fields undergoing maintenance come back on line. Contrary to 2011, we expect foreign direct and portfolio investments received by Angola to exceed outflows, allowing the C/A surplus to be complemented by a positive balance on the financial account. As such, we expect considerable re-serve accumulation as a result, reaching USD38.9bn by Dec 12, from USD25.5bn in Nov 11.
Fiscal prudence is set to continue in 2012, with the budget expected to reach a sizeable surplus of 9.5% of GDP. The government, which has already repaid USD5.7bn in arrears, aims to conclude the arrears clear-ance process by Jun 12, with a final USD1.5bn to settle the rescheduled arrears in full. Comprehensive reform of the tax system starts this year. Fiscal management has benefited from the establishment of a debt management unit within the Ministry of Finance, which, through the formulation of a MT debt management strategy, will more effectively ensure sustainable levels of public debt. Under this strategy, the government aims to reduce its debt to 23% of GDP within 5-y, from around 33% of GDP in Dec 11. The government is also considering some fiscal sav-ing rules (and potentially a stabilization fund) to assist in smoothing expenditure. Sources: Angola Ministry of Finance; Standard Bank Research
The central bank aims to reduce inflation further, to 10% y/y by Dec 12, from 11.3% y/y in Nov 11 (which marked 14-m of disinflation). Under the new monetary policy framework, the BNA announces its interest rate decision on a monthly basis. The exchange rate will, however, remain the main anchor for monetary policy. We expect the central bank to continue to maintain a relatively stable USD/AOA exchange rate in order to limit the impact of the cost of imported goods on inflation. The BNA’s ability to stabilise the exchange rate is likely to be bolstered by the favourable BOP developments we antici-pate in 2012. We believe that demand side pressures may limit further downside for inflation in 2012, not least as a result of a rise in public spending in the run-up to the elections. We expect inflation to reach 10.7% y/y by the end of Q1:12, before increasing as we move closer to the elections.
Balance of payments: FX reserves to swell BOP developments
Sources: Banco Nacional de Angola; Standard Bank Research
Monetary policy: disinflation to slow Inflation and interest rates
Sources: Banco Nacional de Angola; Standard Bank Research
Angola
Fiscal policy: avoiding boom-bust cycles Central government budget
% of GDP 2010 2011e
Total revenue (+ grants) 43.5 48.3
- oil 33.0 38.3
Total expenditure 36.7 39.0
- current 27.0 28.2
- interest 1.2 1.8
- transfers 6.7 5.5
- development 9.7 10.8
Overall balance (- arrears) 6.8 9.3
2012f
47.6
36.6
38.3
27.4
1.4
5.0
11.0
9.3
-50
-25
0
25
50
75
2005 2007 2009 2011f 2013f
USD bn
Trade balance Services (Net)Income account TransfersCurrent account
10
14
18
8
16
24
32
Jan-07 Jan-08 Jan-09 Dec-09 Dec-10 Nov-11
%
Rediscount CPI y/y (RHS)Central Bank Rate
African Markets Revealed — January 2012
18 Fixed Income Research
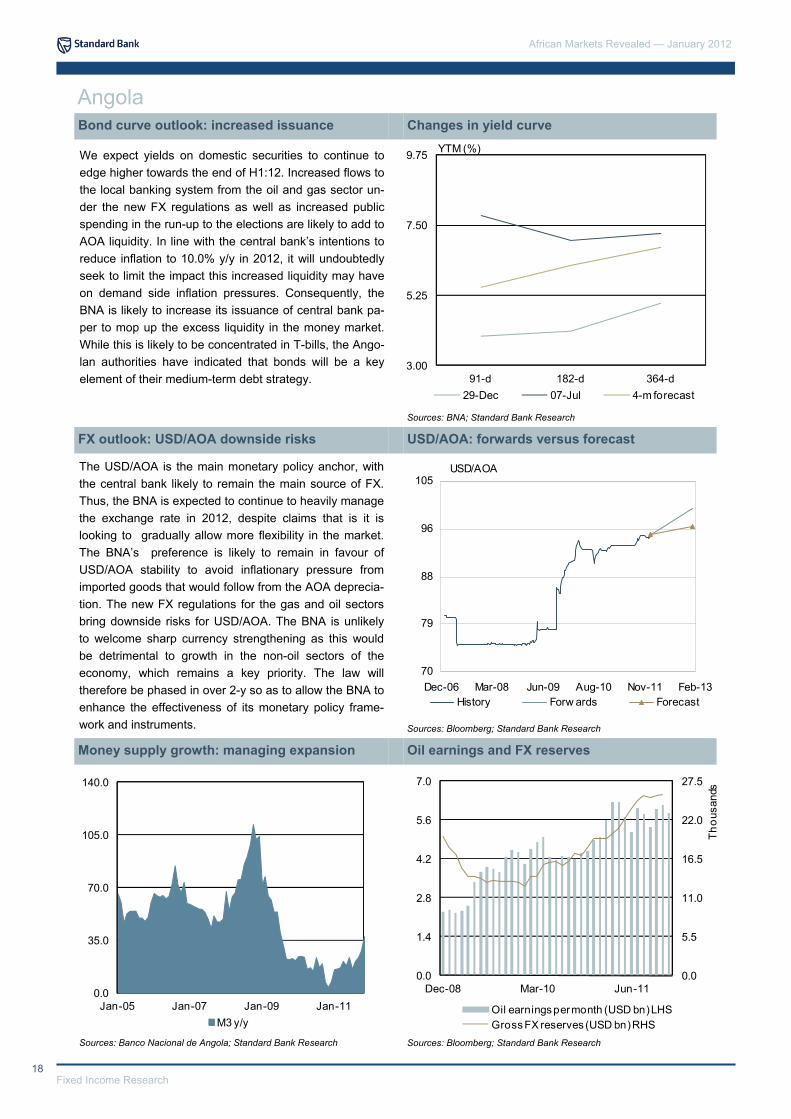
We expect yields on domestic securities to continue to edge higher towards the end of H1:12. Increased flows to the local banking system from the oil and gas sector un-der the new FX regulations as well as increased public spending in the run-up to the elections are likely to add to AOA liquidity. In line with the central bank’s intentions to reduce inflation to 10.0% y/y in 2012, it will undoubtedly seek to limit the impact this increased liquidity may have on demand side inflation pressures. Consequently, the BNA is likely to increase its issuance of central bank pa-per to mop up the excess liquidity in the money market. While this is likely to be concentrated in T-bills, the Ango-lan authorities have indicated that bonds will be a key element of their medium-term debt strategy.
The USD/AOA is the main monetary policy anchor, with the central bank likely to remain the main source of FX. Thus, the BNA is expected to continue to heavily manage the exchange rate in 2012, despite claims that is it is looking to gradually allow more flexibility in the market. The BNA’s preference is likely to remain in favour of USD/AOA stability to avoid inflationary pressure from imported goods that would follow from the AOA deprecia-tion. The new FX regulations for the gas and oil sectors bring downside risks for USD/AOA. The BNA is unlikely to welcome sharp currency strengthening as this would be detrimental to growth in the non-oil sectors of the economy, which remains a key priority. The law will therefore be phased in over 2-y so as to allow the BNA to enhance the effectiveness of its monetary policy frame-work and instruments.
Bond curve outlook: increased issuance Changes in yield curve
Sources: BNA; Standard Bank Research
FX outlook: USD/AOA downside risks USD/AOA: forwards versus forecast
Sources: Bloomberg; Standard Bank Research
Money supply growth: managing expansion Oil earnings and FX reserves
Sources: Bloomberg; Standard Bank Research Sources: Banco Nacional de Angola; Standard Bank Research
Angola
3.00
5.25
7.50
9.75
91-d 182-d 364-d
YTM (%)
29-Dec 07-Jul 4-m forecast
0.0
35.0
70.0
105.0
140.0
Jan-05 Jan-07 Jan-09 Jan-11M3 y/y
0.0
1.4
2.8
4.2
5.6
7.0
0.0
5.5
11.0
16.5
22.0
27.5
Dec-08 Mar-10 Jun-11
Thou
sand
s
Oil earnings per month (USD bn) LHSGross FX reserves (USD bn) RHS
70
79
88
96
105
Dec-06 Mar-08 Jun-09 Aug-10 Nov-11 Feb-13
USD/AOA
History Forw ards Forecast

19 Fixed Income Research
African Markets Revealed — January 2012
Angola: annual indicators
Notes: pe — period end; pa — period average; na — not available; nr — not rated
Sources: Banco Nacional de Angola; Angola Ministry of Finance; Standard Bank Research; Bloomberg
Angola
2007 2008 2009 2010 2011e 2012f
Output
Population (million) 17.6 18.0 18.5 19.1 19.6 20.2
Nominal GDP (AOAbn) 4,637 6,316 5,989 7,580 8,913 10,927
Nominal GDP (USDbn) 60.4 84.2 75.6 82.5 95.1 113.9
GDP / capita (USD) 3,440 4,673 4,087 4,328 4,846 5,634
Real GDP growth (%) 20.3 13.4 2.4 3.4 4.1 11.4
Oil production capacity ('000 bpd) 1,410 1,700 1,795 1,831 1,690 1,840
Central Government Operations
Budget balance / GDP (%) 12.4 8.9 -9.8 8.9 9.3 9.3
Domestic debt / GDP (%) 16.0 15.0 16.3 16.0 15.4 12.4
External debt / GDP (%) 9.9 16.5 20.0 19.0 17.5 14.7
Balance Of Payments
Exports of goods & services (USDbn) 33.3 38.0 40.0 41.9 53.6 68.6
Imports of goods & services (USDbn) 16.3 26.3 43.1 41.8 35.6 44.8
Trade balance (USDbn) 17.1 11.7 -3.1 0.1 18.0 23.8
Current account (USDbn) 9.7 7.2 -7.6 9.6 15.5 10.7
- % of GDP 16.1 8.5 -10.0 11.7 16.3 9.4
Capital & Financial account (USDbn) -6.3 -0.7 -1.6 -3.5 -9.2 2.1
- FDI (USDbn) -0.9 1.7 2.2 9.9 4.2 5.4
Basic balance / GDP (%) 14.6 10.5 -7.1 23.7 20.7 14.1
FX reserves (USDbn) pe 11.2 17.9 13.7 19.7 26.1 38.9
- Import cover (months) pe 8.3 8.2 3.8 5.7 8.8 10.4
Sovereign Credit Rating
S&P NR NR NR B+ BB- BB-
Moody’s NR NR NR B1 Ba3 Ba3
Fitch NR NR NR B+ BB- BB-
Monetary & Financial Indicators
Consumer inflation (%) pa 12.3 12.5 13.7 14.4 13.5 11.2
Consumer inflation (%) pe 11.8 13.2 14.0 15.3 11.0 11.6
M3 money supply (% y/y) pa 42.9 74.4 45.4 16.5 21.6 34.1
M3 money supply (% y/y) pe 45 93.1 21.5 21.5 35.7 26.4
BNA discount rate (%) pa 18 24.5 29.2 21.7 20.8 20.0
BNA discount rate (%) pe 19.6 30.0 25.0 20.0 20.0 20.0
3-m rate (%) pe 14.1 14.6 15.0 11.0 3.9 7.2
1-y rate (%) pe 14.0 14.5 20.4 13.6 5.0 9.4
USD/AOA pa 76.8 75.0 79.2 91.9 93.7 96.0
USD/AOA pe 75.0 75.2 89.2 92.6 94.6 96.8
REER pa 503 563 603 630 594 603 NEER pa 27.7 28.5 29.4 31.6 36.4 38.9
2013f
20.8
13,076
133.3
6,402
8.9
2,105
6.7
11.3
14.4
73.4
47.0
26.5
17.5
13.1
1.0
6.7
18.2
57.4
14.7
BB-
Ba3
BB-
10.8
9.7
24.2
17.4
17.6
16.5
5.9
8.2
98.1
99.4
596 38.7

African Markets Revealed — January 2012
20 Fixed Income Research
Botswana: commodity cycle to dominate sentiment
With the next general election due in Oct 14, the political environment is likely to be relatively quiet over the com-ing year. However, the trade unions have entered the political arena after the largely unsuccessful public sector strike, as the government, which deemed the strike ille-gal, retrenched a large number of workers. The public sector wage settlement of 3% was also below union de-mands. The strike, which has now ended, started in Apr 11 and disrupted the normally stable political status quo. It is possible that the unions may pledge their support for some of the opposition parties, which could alter the po-litical landscape. The ruling party, the BDP, is likely to continue to see defections to the opposition parties, par-ticularly to the newly-formed Botswana Movement for Democracy (BMD), but should be able to maintain its majority in parliament.
We expect the economy to grow by about 6.2% y/y in 2011 and 6.3% y/y in 2012. Downside risks to the rela-tively positive outlook emanate from the weak global growth expected, particularly in the EU/US (and slower growth in China). Export growth, particularly of diamonds, which accounts for about 75% of total exports, is likely to continue to boost the economy in 2011 and 2012, but at a slower pace. Average polished diamond prices were 24.5% y/y higher in 2011 over 2010, but have eased by 9.0% between the peak in Jul 11 and Dec 11. Marginally lower diamond prices in H2:11 are likely to continue into 2012 as US and Chinese growth slows down. PCE is likely to remain robust, with the civil servants’ salary in-crease becoming a base for the rest of the economy in 2011. Investment in the power and mining sectors will underpin GFCF growth. GCE is likely to remain high.
Quarterly indicators
Political risk: strike damage contained Election results (2009)
GDP growth: diamond prices to drop marginally Composition of GDP
Q1:10 Q2:10 Q3:10 Q4:10 Q1:11 Q2:11 Q3:11e Q4:11f Q1:12f Q2:12f Q3:12f Q4:12f
GDP (% y/y) pa 17.2 3.6 10.0 -2.0 6.4 6.5 6.6 5.3 6.2 6.5 6.2 6.3 CPI (% y/y) pa 6.1 7.5 6.9 7.3 8.3 8.1 8.4 9.0 8.4 8.1 7.7 7.5
M3 (% y/y) pa 3.6 7.1 7.1 10.8 11.9 8.1 8.3 10.8 9.5 11.7 10.7 9.3
CA/GDP (%) pe -3.2 -8.3 -6.4 -2.5 -0.4 0.8 1.2 1.6 2.1 2.1 2.3 2.3
FX reserves (USD bn) pe 8.3 7.9 8.4 7.9 8.4 8.6 8.3 8.8 8.9 8.9 9.0 9.0
Import cover (months) pe 17.5 16.5 17.7 16.6 17.6 18.1 17.5 18.5 18.4 18.4 18.6 18.6
3-m rate (%) pe 7.2 7.2 7.1 7.2 6.6 6.6 6.7 3.5 3.5 3.5 3.5 3.5
5-y rate (%) pe 7.6 7.8 7.8 7.7 7.9 7.9 7.8 7.8 7.8 7.8 7.6 7.6 USD/BWP pe 6.77 7.06 6.60 6.45 6.53 6.52 7.47 7.47 7.45 7.45 7.30 7.27 REER pe 100.9 101.9 102.3 102.4 103.2 103.3 103.3 105.0 105.0 107.0 107.0 107.0 NEER pe 91.0 90.2 89.5 88.8 88.3 87.7 87.4 88.0 90.0 90.0 90.0 90.0 Notes: pe — period end; pa — period average; na — not available Sources: Bank of Botswana; CSO; Standard Bank Research
Sources: Bank of Botswana; Standard Bank Research
Legislative election Seats % of votes
Botswana Democratic Party (BDP) 45 52.9
Botswana National Front (BNF) 6 22.8
Botswana Congress Party (BCP) 4 19.9
Botswana Alliance Movement (BAM) 1 2.2
Botswana People’s Party (BPP) 0 1.1
New Democratic Front (NDF) 0 0.1
MELS Movement of Botswana 0 0.1
Independents 1 0.9
Total 57 100
Source: Independent Electoral Commission
-15.0
-7.5
0.0
7.5
15.0
2005 2007 2009 2011f 2013f
y/y
PCE GCE GFCFStocks Netex GDP

21 Fixed Income Research
African Markets Revealed — January 2012
We expect the trade account to register small deficits in 2011 to 2013. Relatively high polished diamond prices are likely to support export earnings over the coming year. The capital and financial account is likely to be boosted by foreign direct investment, particularly in the mining (the De Beers relocation, and coal and copper mines) and finance sectors. However, imports will proba-bly outpace exports as capital imports for infrastructure development, new mining ventures and power sector investments, drive total imports higher. Fuel imports, the second-largest import item, are likely to rise on the back of the weaker BWP. Higher SACU receipts are expected to boost the transfer account. The C/A is likely to register a deficit of 5.1% of GDP in 2012. We expect FX reserves of about USD9.0bn in Dec 12, covering ca. 18 months of imports.
We expect the fiscal deficit to be lower than projected in the FY2011/12 budget. South Africa’s Budget Review 2011 projected that total SACU payments would rise by 21.6% y/y in FY2011/12, to ZAR21.76bn (USD3.1bn). In FY2012/13, total SACU payments are projected to rise by 49.0%, to ZAR32.43bn (USD4.4bn). The higher total SACU revenue will boost union members’ revenues, in-cluding Botswana’s revenues. SACU revenue contributed 26.4% to Bostwana’s total revenue in FY2009/10. Higher mining taxes will also support total revenue if mineral production is sustained and commodity prices hold on their current levels in 2012. However, the oversized wage bill will rise on the back of the increase in civil servants salaries after the 2011 strike. The improved outlook gen-erally depends on sustained global growth, which is in-creasingly looking more doubtful.
The MPC is likely to keep the bank rate at current levels of 9.5% for the next 6-m. It continues to expect that infla-tion will drop to within the 3-6% objective range in H2:12. We expect inflation to average 7.9% y/y in 2012, from an estimated 8.5% y/y in 2011. Consumer inflation surged in Nov 11, to 9.2% y/y, the highest print in 2011, and aver-aged 8.4% from Jan to Nov 11. Nevertheless, we expect headline inflation to ease as base effects are likely to impact the two main CPI groups from Q1:12. Transport inflation (CPI weight of 18.9%) was high and averaged 13.0% y/y, but food inflation (CPI weight of 21.8%) re-mained low at 6.7% y/y from Jan to Nov 11. Lower im-ported inflation from South Africa, which is expected to average 6.0% y/y in 2012, is also likely to moderate prices pressures. The weaker BWP is a risk to the out-look.
Balance of payments: trade deficit likely Current account developments
Fiscal policy: fiscal pressures subdued Central government budget
Monetary policy: neutral policy stance Inflation and interest rates
Sources: Bank of Botswana; IMF; Standard Bank Research
Source: Ministry of Finance
Sources: Bank of Botswana; CSO; Standard Bank Research
% of GDP 2010/11 2011/12
Total revenue 29.8 31.1
Total expenditure 39.9 37.5
- wages 11.7 10.6
- interest 0.5 0.5
- development 13.1 9.8
Overall balance (- grants) -9.5 -6.0
Overall balance (+ grants) -10.1 -6.3
Net external borrowing 19.1 19.0
Net domestic borrowing 6.4 8.0
Donor support (grants) 0.5 0.3
Botswana
-1,800
-550
700
1,950
3,200
2006 2008 2010 2012f
USD m
Trade Services IncomeTransfers C/A
0.0
4.5
9.0
13.5
18.0
Dec-05 Jun-07 Dec-08 Jun-10 Dec-11
Inflation Lower boundUpper bound Bank rate
%, y/y

African Markets Revealed — January 2012
22 Fixed Income Research
We expect that yields will remain largely unchanged over the coming 6-m period. Yields on BOBCs have been volatile over the past few weeks after the BOB unexpect-edly changed its conduct of monetary policy in mid-Nov. The BOB reduced the amount of BOBCs it issues as it needed to drain less excess liquidity from the money market on the back of lower BOP surpluses. The yield on the 91-d BOBC fell to 3.45% at the auction on 6 Dec from 6.62% previously, but rose to 5.29% on 30 Dec. The 14-d BOBC yield increased to 4.46% at the auction on 6 Dec compared to 2.69% the auction on 29 Nov, but is below the 6.48% level at earlier auctions. On 30 Dec the yield was 4.51%. Since 2006 only commercial banks have been permitted to hold BOBCs. The bank rate is also likely to remain at the current level of 9.5%. Bond auc-tions are only held in Mar and Sep.
We expect the USD/BWP to trade weaker in 2012. The USD/BWP is forecast to average 7.39 in 2012 and to trade at 7.27 in Dec 12, compared to an average of 6.84 in 2011. In 2010, the USD/BWP averaged 6.79. USD/BWP volatility is likely to persist and risks are to the up-side. Risk-off sentiment towards emerging markets drove the BWP sharply higher to 7.46 in Sep 11, from 6.68 in Aug 11. Ongoing concerns about the possible break-up of the Euro area, sovereign credit defaults in Greece and other Eurozone countries and heightened risks to US, Chinese and global growth will continue to depress inves-tor sentiment over the coming year. Given the ZAR’s dominant share in the BWP basket peg (estimated at 65%, with the SDR at about 35%), the USD/BWP is likely to continue to track the USD/ZAR higher. Since Sep, the USD/BWP has weakened in tandem with USD/ZAR.
We expect the BSE to generally disappoint in 2012. Risk aversion towards emerging markets is likely to have a negative influence on the local equity market as well as emerging markets in general. The BSE is likely to per-form broadly in line with the MSCI EM index. Both the Foreign Companies Index (FCI) and the Domestic Com-panies Index (DCI) are strongly correlated with the MSCI EM index, the FCI by a coefficient of 0.76 and the DCI by 0.68. Nevertheless, both the FCI and DCI outperformed the MSCI EM index in 2011, supported by buoyant do-mestic economic growth. The MSCI EM index dropped by 19.2% y/y in 2011, from an increase of 13.3% y/y in 2010. The FCI rose by 1.8% y/y, compared to 16.2% y/y in 2010, and the DCI rose by 8.7% y/y in 2011, against a drop of 11.7% y/y in 2010.
Bond curve outlook: stable yields expected Changes in yield curve
FX outlook: further weakness in sight USD/BWP: forwards versus forecast
Equity market: lacklustre performance ahead Botswana Stock Exchange
Sources: Bank of Botswana; Standard Bank Research
Sources: Reuters; Standard Bank Research
Sources: Reuters; Standard Bank Research
Botswana
3.0
4.5
6.0
7.5
9.0
91-d 182-d 2-y 5-y 8-y 9-y 15-y
6-m forcast 12-Dec-11 12-Jul-11
YTM
2,000
4,250
6,500
8,750
11,000
400
1,050
1,700
2,350
3,000
Jan-05 Oct-06 Jun-08 Mar-10 Dec-11
FCI (lh) MSCI EM (lh) DCI (rh)
FCI & MSCI EM DCI
5.0
6.0
7.0
8.0
9.0
Dec-06 Mar-08 Jun-09 Aug-10 Nov-11 Feb-13
USD/BWP
History Forw ards Forecast
23 Fixed Income Research
African Markets Revealed — January 2012
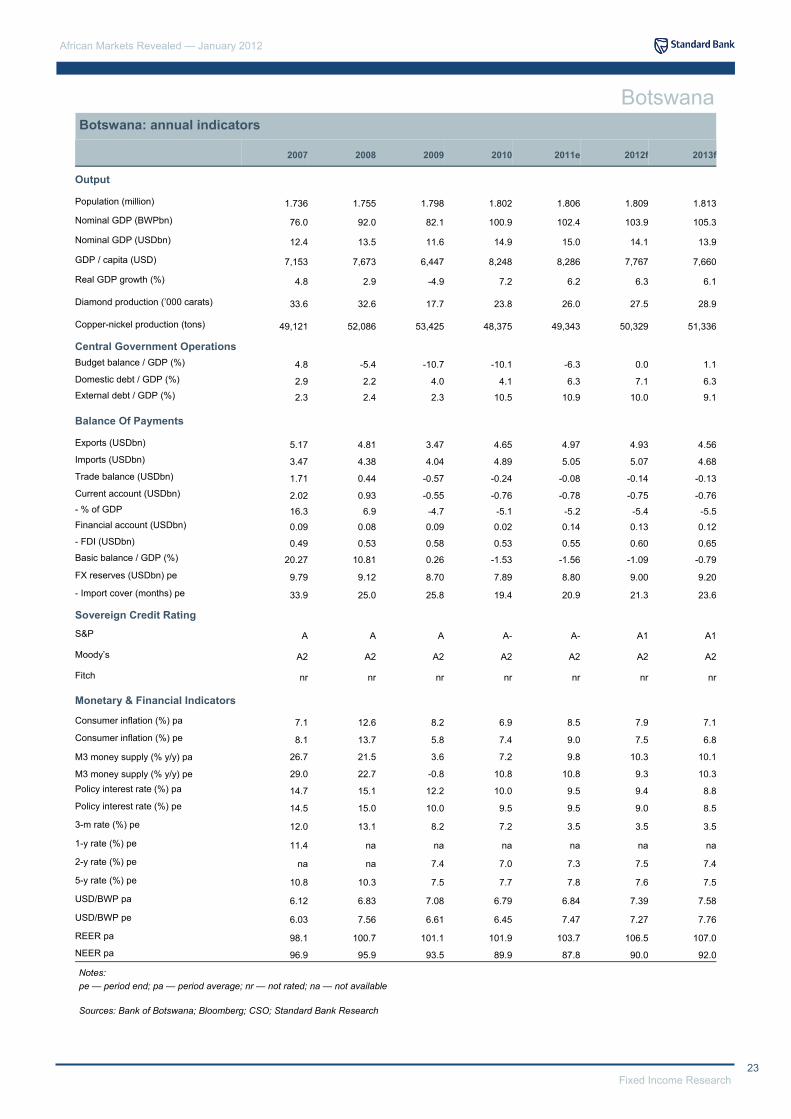
Botswana: annual indicators
2007 2008 2009 2010 2011e 2012f 2013f
Output Population (million) 1.736 1.755 1.798 1.802 1.806 1.809 1.813
Nominal GDP (BWPbn) 76.0 92.0 82.1 100.9 102.4 103.9 105.3
Nominal GDP (USDbn) 12.4 13.5 11.6 14.9 15.0 14.1 13.9
GDP / capita (USD) 7,153 7,673 6,447 8,248 8,286 7,767 7,660
Real GDP growth (%) 4.8 2.9 -4.9 7.2 6.2 6.3 6.1
Diamond production (’000 carats) 33.6 32.6 17.7 23.8 26.0 27.5 28.9
Copper-nickel production (tons) 49,121 52,086 53,425 48,375 49,343 50,329 51,336
Central Government Operations
Budget balance / GDP (%) 4.8 -5.4 -10.7 -10.1 -6.3 0.0 1.1 Domestic debt / GDP (%) 2.9 2.2 4.0 4.1 6.3 7.1 6.3 External debt / GDP (%) 2.3 2.4 2.3 10.5 10.9 10.0 9.1
Balance Of Payments
Exports (USDbn) 5.17 4.81 3.47 4.65 4.97 4.93 4.56 Imports (USDbn) 3.47 4.38 4.04 4.89 5.05 5.07 4.68 Trade balance (USDbn) 1.71 0.44 -0.57 -0.24 -0.08 -0.14 -0.13 Current account (USDbn) 2.02 0.93 -0.55 -0.76 -0.78 -0.75 -0.76 - % of GDP 16.3 6.9 -4.7 -5.1 -5.2 -5.4 -5.5 Financial account (USDbn) 0.09 0.08 0.09 0.02 0.14 0.13 0.12 - FDI (USDbn) 0.49 0.53 0.58 0.53 0.55 0.60 0.65 Basic balance / GDP (%) 20.27 10.81 0.26 -1.53 -1.56 -1.09 -0.79 FX reserves (USDbn) pe 9.79 9.12 8.70 7.89 8.80 9.00 9.20
- Import cover (months) pe 33.9 25.0 25.8 19.4 20.9 21.3 23.6
Sovereign Credit Rating
S&P A A A A- A- A1 A1
Moody’s A2 A2 A2 A2 A2 A2 A2
Fitch nr nr nr nr nr nr nr
Monetary & Financial Indicators Consumer inflation (%) pa 7.1 12.6 8.2 6.9 8.5 7.9 7.1 Consumer inflation (%) pe 8.1 13.7 5.8 7.4 9.0 7.5 6.8
M3 money supply (% y/y) pa 26.7 21.5 3.6 7.2 9.8 10.3 10.1
M3 money supply (% y/y) pe 29.0 22.7 -0.8 10.8 10.8 9.3 10.3 Policy interest rate (%) pa 14.7 15.1 12.2 10.0 9.5 9.4 8.8 Policy interest rate (%) pe 14.5 15.0 10.0 9.5 9.5 9.0 8.5
3-m rate (%) pe 12.0 13.1 8.2 7.2 3.5 3.5 3.5
1-y rate (%) pe 11.4 na na na na na na
2-y rate (%) pe na na 7.4 7.0 7.3 7.5 7.4
5-y rate (%) pe 10.8 10.3 7.5 7.7 7.8 7.6 7.5
USD/BWP pa 6.12 6.83 7.08 6.79 6.84 7.39 7.58
USD/BWP pe 6.03 7.56 6.61 6.45 7.47 7.27 7.76
REER pa 98.1 100.7 101.1 101.9 103.7 106.5 107.0 NEER pa 96.9 95.9 93.5 89.9 87.8 90.0 92.0
Notes: pe — period end; pa — period average; nr — not rated; na — not available
Sources: Bank of Botswana; Bloomberg; CSO; Standard Bank Research
Botswana
African Markets Revealed — January 2012
24 Fixed Income Research
Côte d’Ivoire: strong post-crisis rebound
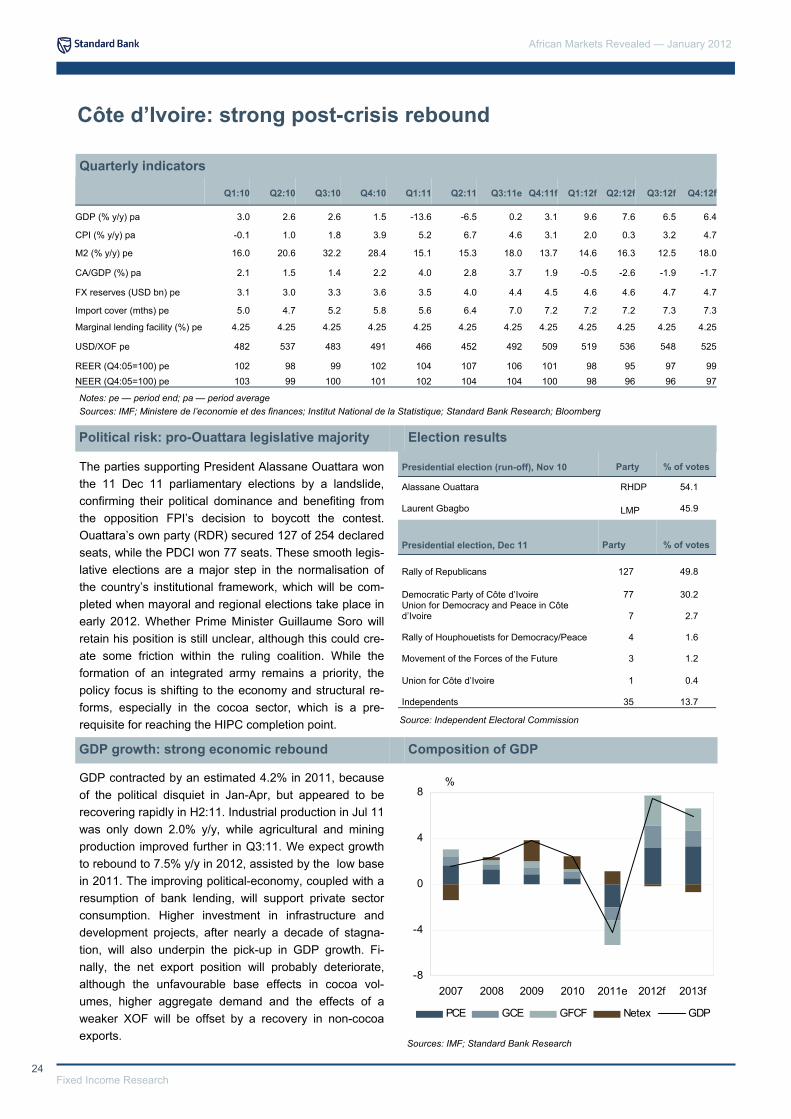
The parties supporting President Alassane Ouattara won the 11 Dec 11 parliamentary elections by a landslide, confirming their political dominance and benefiting from the opposition FPI’s decision to boycott the contest. Ouattara’s own party (RDR) secured 127 of 254 declared seats, while the PDCI won 77 seats. These smooth legis-lative elections are a major step in the normalisation of the country’s institutional framework, which will be com-pleted when mayoral and regional elections take place in early 2012. Whether Prime Minister Guillaume Soro will retain his position is still unclear, although this could cre-ate some friction within the ruling coalition. While the formation of an integrated army remains a priority, the policy focus is shifting to the economy and structural re-forms, especially in the cocoa sector, which is a pre-requisite for reaching the HIPC completion point.
GDP contracted by an estimated 4.2% in 2011, because of the political disquiet in Jan-Apr, but appeared to be recovering rapidly in H2:11. Industrial production in Jul 11 was only down 2.0% y/y, while agricultural and mining production improved further in Q3:11. We expect growth to rebound to 7.5% y/y in 2012, assisted by the low base in 2011. The improving political-economy, coupled with a resumption of bank lending, will support private sector consumption. Higher investment in infrastructure and development projects, after nearly a decade of stagna-tion, will also underpin the pick-up in GDP growth. Fi-nally, the net export position will probably deteriorate, although the unfavourable base effects in cocoa vol-umes, higher aggregate demand and the effects of a weaker XOF will be offset by a recovery in non-cocoa exports.
Quarterly indicators
Political risk: pro-Ouattara legislative majority Election results
GDP growth: strong economic rebound Composition of GDP
Notes: pe — period end; pa — period average Sources: IMF; Ministere de l’economie et des finances; Institut National de la Statistique; Standard Bank Research; Bloomberg
Sources: IMF; Standard Bank Research
Source: Independent Electoral Commission
Q1:10 Q2:10 Q3:10 Q4:10 Q1:11 Q2:11 Q3:11e Q4:11f Q1:12f Q2:12f Q3:12f Q4:12f
GDP (% y/y) pa 3.0 2.6 2.6 1.5 -13.6 -6.5 0.2 3.1 9.6 7.6 6.5 6.4
CPI (% y/y) pa -0.1 1.0 1.8 3.9 5.2 6.7 4.6 3.1 2.0 0.3 3.2 4.7
M2 (% y/y) pe 16.0 20.6 32.2 28.4 15.1 15.3 18.0 13.7 14.6 16.3 12.5 18.0
CA/GDP (%) pa 2.1 1.5 1.4 2.2 4.0 2.8 3.7 1.9 -0.5 -2.6 -1.9 -1.7
FX reserves (USD bn) pe 3.1 3.0 3.3 3.6 3.5 4.0 4.4 4.5 4.6 4.6 4.7 4.7
Import cover (mths) pe 5.0 4.7 5.2 5.8 5.6 6.4 7.0 7.2 7.2 7.2 7.3 7.3
Marginal lending facility (%) pe 4.25 4.25 4.25 4.25 4.25 4.25 4.25 4.25 4.25 4.25 4.25 4.25
USD/XOF pe 482 537 483 491 466 452 492 509 519 536 548 525
REER (Q4:05=100) pe 102 98 99 102 104 107 106 101 98 95 97 99 NEER (Q4:05=100) pe 103 99 100 101 102 104 104 100 98 96 96 97
Presidential election (run-off), Nov 10 Party % of votes
Alassane Ouattara RHDP 54.1
Laurent Gbagbo LMP 45.9
Presidential election, Dec 11 Party % of votes
Rally of Republicans 127 49.8
Democratic Party of Côte d’Ivoire 77 30.2 Union for Democracy and Peace in Côte d’Ivoire 7 2.7
Rally of Houphouetists for Democracy/Peace 4 1.6
Movement of the Forces of the Future 3 1.2
Union for Côte d’Ivoire 1 0.4
Independents 35 13.7
-8
-4
0
4
8
2007 2008 2009 2010 2011e 2012f 2013f
%
PCE GCE GFCF Netex GDP
25 Fixed Income Research
African Markets Revealed — January 2012
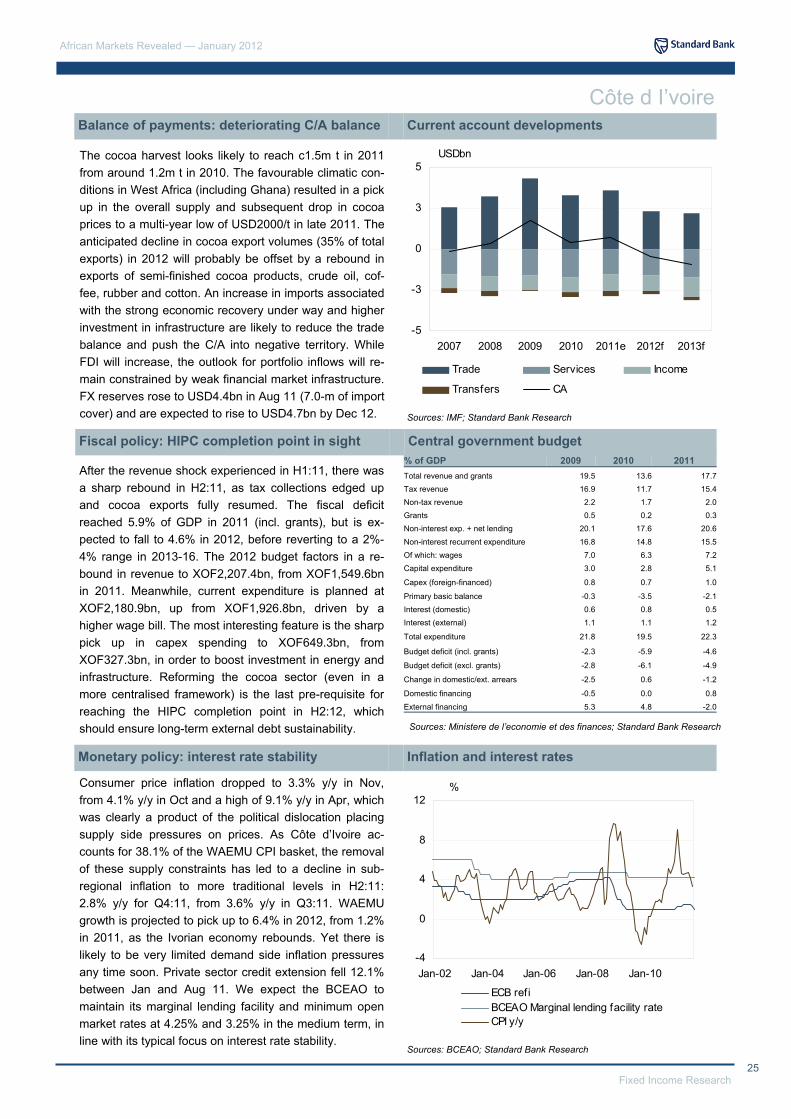
The cocoa harvest looks likely to reach c1.5m t in 2011 from around 1.2m t in 2010. The favourable climatic con-ditions in West Africa (including Ghana) resulted in a pick up in the overall supply and subsequent drop in cocoa prices to a multi-year low of USD2000/t in late 2011. The anticipated decline in cocoa export volumes (35% of total exports) in 2012 will probably be offset by a rebound in exports of semi-finished cocoa products, crude oil, cof-fee, rubber and cotton. An increase in imports associated with the strong economic recovery under way and higher investment in infrastructure are likely to reduce the trade balance and push the C/A into negative territory. While FDI will increase, the outlook for portfolio inflows will re-main constrained by weak financial market infrastructure. FX reserves rose to USD4.4bn in Aug 11 (7.0-m of import cover) and are expected to rise to USD4.7bn by Dec 12.
After the revenue shock experienced in H1:11, there was a sharp rebound in H2:11, as tax collections edged up and cocoa exports fully resumed. The fiscal deficit reached 5.9% of GDP in 2011 (incl. grants), but is ex-pected to fall to 4.6% in 2012, before reverting to a 2%-4% range in 2013-16. The 2012 budget factors in a re-bound in revenue to XOF2,207.4bn, from XOF1,549.6bn in 2011. Meanwhile, current expenditure is planned at XOF2,180.9bn, up from XOF1,926.8bn, driven by a higher wage bill. The most interesting feature is the sharp pick up in capex spending to XOF649.3bn, from XOF327.3bn, in order to boost investment in energy and infrastructure. Reforming the cocoa sector (even in a more centralised framework) is the last pre-requisite for reaching the HIPC completion point in H2:12, which should ensure long-term external debt sustainability.
Consumer price inflation dropped to 3.3% y/y in Nov, from 4.1% y/y in Oct and a high of 9.1% y/y in Apr, which was clearly a product of the political dislocation placing supply side pressures on prices. As Côte d’Ivoire ac-counts for 38.1% of the WAEMU CPI basket, the removal of these supply constraints has led to a decline in sub-regional inflation to more traditional levels in H2:11: 2.8% y/y for Q4:11, from 3.6% y/y in Q3:11. WAEMU growth is projected to pick up to 6.4% in 2012, from 1.2% in 2011, as the Ivorian economy rebounds. Yet there is likely to be very limited demand side inflation pressures any time soon. Private sector credit extension fell 12.1% between Jan and Aug 11. We expect the BCEAO to maintain its marginal lending facility and minimum open market rates at 4.25% and 3.25% in the medium term, in line with its typical focus on interest rate stability.
Balance of payments: deteriorating C/A balance Current account developments
Fiscal policy: HIPC completion point in sight Central government budget
Monetary policy: interest rate stability Inflation and interest rates
Sources: IMF; Standard Bank Research
Sources: Ministere de l’economie et des finances; Standard Bank Research
Sources: BCEAO; Standard Bank Research
Côte d I’voire
% of GDP 2009 2010 Total revenue and grants 19.5 13.6 Tax revenue 16.9 11.7 Non-tax revenue 2.2 1.7
Non-interest exp. + net lending 20.1 17.6
Non-interest recurrent expenditure 16.8 14.8 Of which: wages 7.0 6.3 Capital expenditure 3.0 2.8
Capex (foreign-financed) 0.8 0.7
Grants 0.5 0.2
2011 17.7 15.4
2.0 0.3
20.6
15.5 7.2 5.1
1.0
Primary basic balance -0.3 -3.5 -2.1 Interest (domestic) 0.6 0.8 0.5 Interest (external) 1.1 1.1 1.2
Total expenditure 21.8 19.5 22.3
Budget deficit (incl. grants) -2.3 -5.9 -4.6
Budget deficit (excl. grants) -2.8 -6.1 -4.9
Change in domestic/ext. arrears -2.5 0.6 -1.2
Domestic financing -0.5 0.0 0.8
External financing 5.3 4.8 -2.0
-5
-3
0
3
5
2007 2008 2009 2010 2011e 2012f 2013f
USDbn
Trade Services Income
Transfers CA
-4
0
4
8
12
Jan-02 Jan-04 Jan-06 Jan-08 Jan-10
%
ECB refiBCEAO Marginal lending facility rateCPI y/y

African Markets Revealed — January 2012
26 Fixed Income Research
The USD2.3bn defaulted Eurobond (due in 2032) has continued to trade in a 50-55 range since Jun 11 (54 on 10 Jan 12), excepting a few outliers. This resilience re-flects the expected resumption of regular coupon pay-ments in 2012. The Finance Ministry confirmed in mid-Nov 11 that it would resume regular service payment from Jun 12’s coupon, but said it will only be able to make a good faith payment on the three missed coupons (Dec 10, Jun 11 and Dec 11). A more detailed schedule for the arrears clearance will probably be released in 2012 as the country heads for the HIPC completion point. Despite Côte d’Ivoire’s poor track record, the price risks look asymmetric, with a shift to 65 or beyond possible with a coupon payment in Jun. Meanwhile, the stock of local T-bills (XOF607bn) was restructured in Nov into 2-, 3- and 5-y bonds at marginally lower rates.
USD/XOF tracks EUR/USD via the EUR/XOF peg (655.9), a mechanism that has been in place since 1960. The EUR/XOF peg was adjusted only once in 1994, at a time when CFA countries experienced significant fiscal and external distortions. Recent media speculation that XOF (XAF) would be devalued has been denied by the BCEAO (BEAC) as well as WAEMU (CEMAC) Finance Ministers and senior officials. We also believe that there will be no devaluation, which is after all consistent with relatively healthy fundamentals and the zone’s positive balance with its French counterparty (the BCEAO [BEAC] places 50% of its net foreign assets with the French Treasury). WAEMU’s external competitiveness is likely to improve further as the EUR weakens amid significant fiscal distortions. We see USD/XOF trending higher to 540 in 6-m, before recovering modestly in late 2012.
The BRVM index lost 12.7% in 2011, primarily due to the general risk aversion among international investors, a difficult post-electoral environment and sharp deteriora-tion in corporate results for H1:11. For example, Societe Generale’s Ivorian Unit (SGBCI) recorded a 53% y/y de-cline in profit over the period. Furthermore, Senegal-based telecoms operator SONATEL (c40% of market cap) also weighed negatively on the BRVM, as its stock fell 22.0% last year. In this context, one may argue that the performance of the Ivorian stocks was probably not as disastrous as might be expected, especially compared to the MSCI EM (-18.7%) and MSCI FM (-21.6%) indices. Despite the likely difficult global environment in 2012 (and EUR [XOF] weakness), BRVM stocks will be sup-ported by an economic rebound in Côte d’Ivoire and sub-sequent recovery in corporate results.
Eurobond: resuming regular coupon payments Côte d’Ivoire 2032
FX outlook: no devaluation in sight USD/XOF: forwards versus forecast
Equity market: recovery in corporate results Bourse Regionale Valuers Mobiliers
Sources: Reuters; Standard Bank Research
Sources: Bloomberg; Standard Bank Research
Sources: Bloomberg; Standard Bank Research
Côte d I’voire
30
40
50
60
70
Apr-10 Aug-10 Dec-10 Apr-11 Aug-11 Dec-11
Price
60
110
160
210
260
Jan-02 Nov-04 Sep-07 Jul-10
Index
400
440
480
520
560
Dec-06 Mar-08 Jun-09 Aug-10 Nov-11 Feb-13
USD/XOF
History Forw ards Forecast

27 Fixed Income Research
African Markets Revealed — January 2012
Côte d I’voire: annual indicators
Sources: Institut National de la Statistique, Ministere de l’economie et des finances; IMF; Standard Bank Research; Bloomberg
Notes: pe — period end; pa — period average; na — not available; nr — not rated
Côte d I’voire
2007 2008 2009 2010 2011e 2012f
Output
Population (million) 20.2 20.8 21.4 22.0 22.7 23.4
Nominal GDP (XOFbn) 9,487 10,485 10,999 11,443 11,523 12,687
Nominal GDP (USDbn) 19.8 23.4 23.8 23.1 23.2 23.8
GDP / capita (USD) 983 1,127 1,113 1,048 1,024 1,019
Real GDP growth (%) 1.6 2.3 3.8 2.4 -4.2 7.5
Oil Production ('000 bbl) 53,132 60,209 58,861 45,295 40,270 46,250
Central Government Operations
Budget balance (excl. Grants) / GDP (%) -1.9 -2.3 -2.1 -2.8 -6.1 -4.9
Budget balance (incl. Grants) / GDP (%) -1.3 -0.6 -1.6 -2.3 -5.9 -4.6
Domestic debt / GDP (%) 10.8 13.4 12.5 15.7 14.9 14.1
External debt / GDP (%) 64.8 61.9 53.3 50.2 52.0 48.0
Balance of Payments
Exports of goods and services (USDbn) 8.7 10.1 10.9 10.8 11.1 10.0
Imports of goods and services (USDbn) 6.1 6.9 6.6 7.5 7.5 7.7
Trade balance (USDbn) 2.6 3.2 4.3 3.3 3.6 2.3
Current account (USDbn) -0.1 0.3 1.7 0.4 0.7 -0.4
- % of GDP -0.7 1.5 7.3 1.8 3.1 -1.7
Capital & Financial account (USDbn) -0.6 -0.1 -2.7 -0.8 -1.6 0.2
- FDI (USDbn) 0.4 0.2 0.4 0.3 0.3 0.4
Basic balance / GDP (%) 1.1 2.4 9.0 3.3 4.6 -0.2
FX reserves (USDbn) pe 2.5 2.3 3.2 3.6 4.5 4.7
- Import cover (months) pe 4.9 3.9 5.8 5.8 7.2 7.3
Sovereign Credit Rating
S&P NR NR NR NR NR nr
Moody’s NR NR NR NR NR nr
Fitch NR NR NR NR NR nr
Monetary & Financial Indicators
Consumer inflation (%) pa 1.9 6.5 1.1 1.6 4.9 2.6
Consumer inflation (%) pe 1.5 8.9 -1.6 5.1 1.9 5.5
M2 money supply (% y/y) pa 19.1 16.9 4.1 24.5 15.5 15.3
M2 money supply (% y/y) pe 43.0 10.1 24.0 28.4 13.3 20.9
Marginal lending facility (%) pe 4.75 4.75 4.25 4.25 4.25 4.25
USD/XOF pa 479 448 462 496 474 533
USD/XOF pe 447 467 457 491 509 525
REER pa 103 108 104 101 105 98
NEER pa 103 106 104 101 103 97
2013f
24.1
13,791
27.9
1,158
5.9
54,500
-4.4
-3.4
13.4
48.1
11.1
8.9
2.2
-0.9
-3.3
0.7
0.5
-1.4
4.9
6.6
nr
nr
nr
2.8
2.0
18.9
19.6
4.25
495
469
101
100
Cocoa production (m. tonnes) 1.29 1.37 1.22 1.24 1.50 1.38 1.36
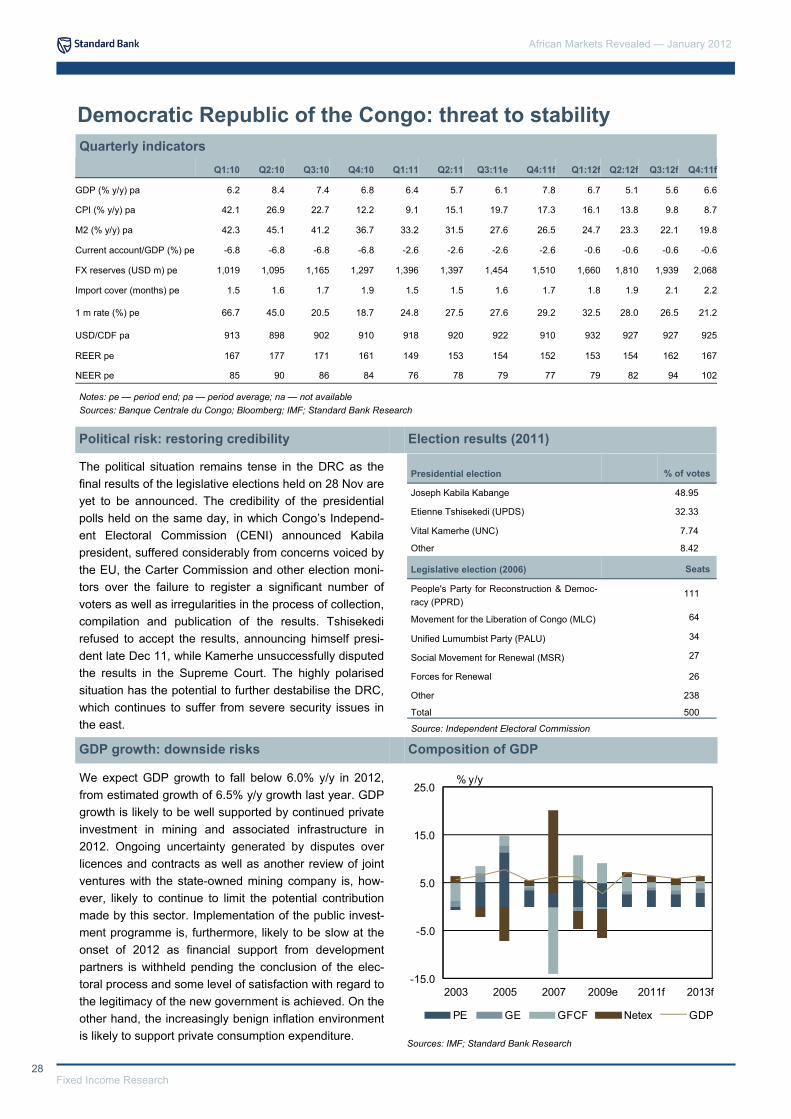
African Markets Revealed — January 2012
28 Fixed Income Research
Democratic Republic of the Congo: threat to stability
The political situation remains tense in the DRC as the final results of the legislative elections held on 28 Nov are yet to be announced. The credibility of the presidential polls held on the same day, in which Congo’s Independ-ent Electoral Commission (CENI) announced Kabila president, suffered considerably from concerns voiced by the EU, the Carter Commission and other election moni-tors over the failure to register a significant number of voters as well as irregularities in the process of collection, compilation and publication of the results. Tshisekedi refused to accept the results, announcing himself presi-dent late Dec 11, while Kamerhe unsuccessfully disputed the results in the Supreme Court. The highly polarised situation has the potential to further destabilise the DRC, which continues to suffer from severe security issues in the east.
We expect GDP growth to fall below 6.0% y/y in 2012, from estimated growth of 6.5% y/y growth last year. GDP growth is likely to be well supported by continued private investment in mining and associated infrastructure in 2012. Ongoing uncertainty generated by disputes over licences and contracts as well as another review of joint ventures with the state-owned mining company is, how-ever, likely to continue to limit the potential contribution made by this sector. Implementation of the public invest-ment programme is, furthermore, likely to be slow at the onset of 2012 as financial support from development partners is withheld pending the conclusion of the elec-toral process and some level of satisfaction with regard to the legitimacy of the new government is achieved. On the other hand, the increasingly benign inflation environment is likely to support private consumption expenditure.
Quarterly indicators
Political risk: restoring credibility Election results (2011)
GDP growth: downside risks Composition of GDP
Notes: pe — period end; pa — period average; na — not available Sources: Banque Centrale du Congo; Bloomberg; IMF; Standard Bank Research
Sources: IMF; Standard Bank Research
Source: Independent Electoral Commission
Presidential election % of votes
Joseph Kabila Kabange 48.95
Etienne Tshisekedi (UPDS) 32.33
Vital Kamerhe (UNC) 7.74
Other 8.42
Legislative election (2006)
People's Party for Reconstruction & Democ-racy (PPRD)
111
Movement for the Liberation of Congo (MLC) 64
Unified Lumumbist Party (PALU) 34
Social Movement for Renewal (MSR) 27
Forces for Renewal 26
Other 238
Total 500
Seats
Q1:10 Q2:10 Q3:10 Q4:10 Q1:11 Q2:11 Q3:11e Q4:11f Q1:12f Q2:12f Q3:12f Q4:11f
GDP (% y/y) pa 6.2 8.4 7.4 6.8 6.4 5.7 6.1 7.8 6.7 5.1 5.6 6.6
CPI (% y/y) pa 42.1 26.9 22.7 12.2 9.1 15.1 19.7 17.3 16.1 13.8 9.8 8.7
M2 (% y/y) pa 42.3 45.1 41.2 36.7 33.2 31.5 27.6 26.5 24.7 23.3 22.1 19.8
Current account/GDP (%) pe -6.8 -6.8 -6.8 -6.8 -2.6 -2.6 -2.6 -2.6 -0.6 -0.6 -0.6 -0.6
FX reserves (USD m) pe 1,019 1,095 1,165 1,297 1,396 1,397 1,454 1,510 1,660 1,810 1,939 2,068
Import cover (months) pe 1.5 1.6 1.7 1.9 1.5 1.5 1.6 1.7 1.8 1.9 2.1 2.2
1 m rate (%) pe 66.7 45.0 20.5 18.7 24.8 27.5 27.6 29.2 32.5 28.0 26.5 21.2
USD/CDF pa 913 898 902 910 918 920 922 910 932 927 927 925
REER pe 167 177 171 161 149 153 154 152 153 154 162 167
NEER pe 85 90 86 84 76 78 79 77 79 82 94 102
-15.0
-5.0
5.0
15.0
25.0
2003 2005 2007 2009e 2011f 2013f
PE GE GFCF Netex GDP
% y/y

29 Fixed Income Research
African Markets Revealed — January 2012
We expect the C/A deficit to persist in 2012, while further gains in mineral and metal export volumes are likely to see it decline to 0.6% of GDP, from 2.6% in 2011. This deficit has remained well funded by FDI, aid flows and official financing in the past. Concerns around the politi-cal process as well as the transparency of the regulatory environment could, however, negatively impact disburse-ments from development partners and international fi-nance institutions. Structural benchmarks around trans-parency in the mining sector under the USD550m ECF with the IMF remain contentious, and may see delays in further disbursements of funds. FDI flows to the DRC are, however, likely to remain significant in 2012, exceeding USD2bn, compared to just over USD1.5bn in 2011. FX reserves were equal to USD1.26bn in Nov 11 (1.7 months of imports), likely to reach USD2.2bn by Dec 12.
Fiscal policy is likely to remain expansive as authorities aim to supplement domestic revenue with considerable external borrowing to finance expenditure equal to c35% of GDP. Expenditure is, however, likely to fall slightly in 2012 relative to 2011 when the elections added consid-erably to current expenditure. There is a risk that the au-thorities face additional cost pressures connected to so-cial discontent and political frictions that followed the Nov 11 elections. The government intends to continue to ad-just fuel prices in line with international oil prices, reduc-ing the burden of the fuel subsidy programme. The 2012 budget also aims to increase domestic revenue through administrative measures and broadening of the tax base (including the introduction of VAT). The budget deficit is set to decline to 5.0% of GDP in 2012, from 7.5% in 2011.
While the inflationary environment is likely to become increasingly benign in 2012, we don’t expect the BCC to significantly ease monetary conditions in the next 4-m. The BCC reduced the policy rate by 450 bps, to 20% at its meeting in Dec 11, bringing the cumulative rate cuts in Q4:11 to 950 bps. Inflation fell for the fifth consecutive month in Dec 11, to 15.8% y/y, from 19.8% y/y at the end of Q3:11. The central bank’s objective is to reduce infla-tion to single digits by Dec 12. While rising fuel prices and the introduction of VAT may exert some upward pressure on prices, we expect slowing domestic demand to allow further disinflation. The USD/CDF exchange rate is likely to remain a key nominal anchor in this regard as the central bank aims to limit the cost of imported goods on inflation. Positive real yields are likely to support the central bank’s preference for exchange rate stability.
Balance of payments: securing financing Current account developments
Fiscal policy: mobilising domestic resources Central government budget
Monetary policy: neutral bias Interest rates
Sources: IMF; Standard Bank Research
Sources: Banque Centrale du Congo; IMF; Standard Bank Research
Sources: Banque Centrale du Congo; IMF; Standard Bank Research
Democratic Republic of the Congo
% of GDP 2010 2011e 2012f
Total revenue 33.0 28.3 28.9
Total expenditure 30.6 35.4 34.9
- Wages 14.5 17.3 16.6
- Interest 2.2 2.6 2.4
- Transfers and subsidies 2.5 3.1 2.7
Overall fiscal balance 1.2 -7.5 -5.0
Net domestic financing -4.8 0.8 0.0
Net foreign borrowing 3.6 6.7 4.8
Donor support (grants ) 14.1 8.7 8.6
-4.5
-2.3
0.0
2.3
4.5
2004 2006 2008 2010e 2012f
Trade balance ServicesIncome TransfersCurrent account
USD m
-10.0
12.5
35.0
57.5
80.0
Jan-09 Jan-10 Jan-11
Policy rate Treasury bills 28-d
Headline inflation
% y/y
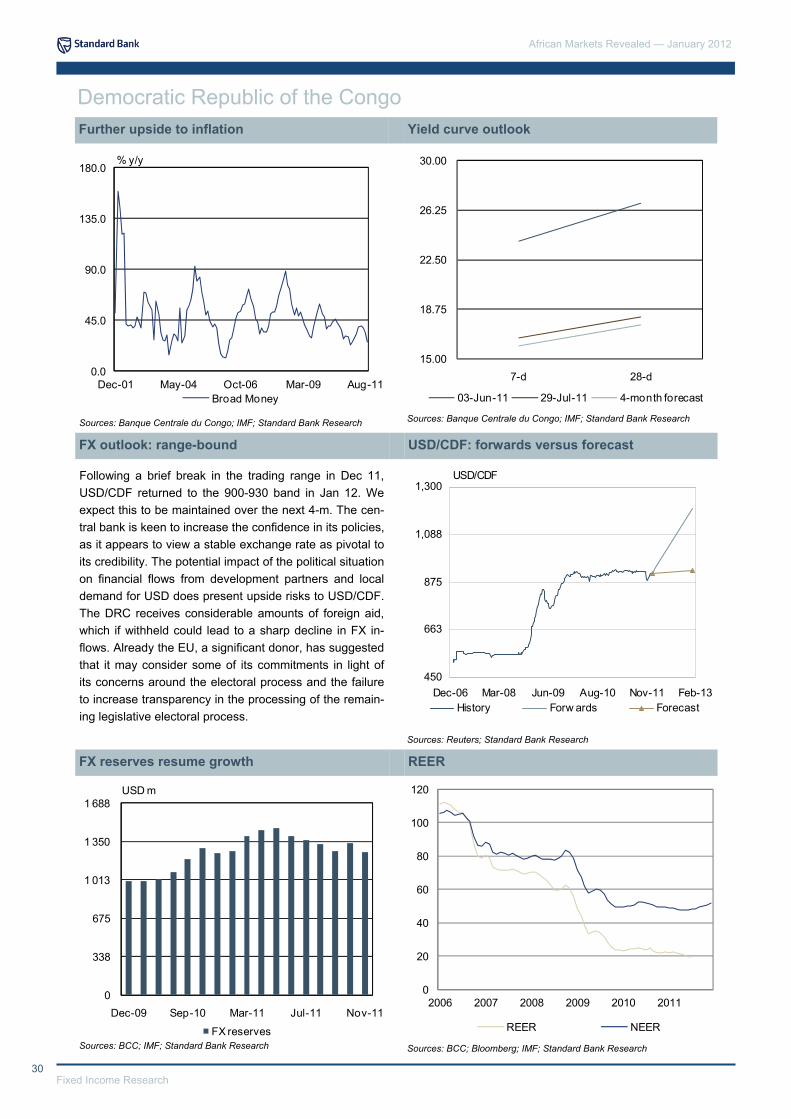
African Markets Revealed — January 2012
30 Fixed Income Research
Following a brief break in the trading range in Dec 11, USD/CDF returned to the 900-930 band in Jan 12. We expect this to be maintained over the next 4-m. The cen-tral bank is keen to increase the confidence in its policies, as it appears to view a stable exchange rate as pivotal to its credibility. The potential impact of the political situation on financial flows from development partners and local demand for USD does present upside risks to USD/CDF. The DRC receives considerable amounts of foreign aid, which if withheld could lead to a sharp decline in FX in-flows. Already the EU, a significant donor, has suggested that it may consider some of its commitments in light of its concerns around the electoral process and the failure to increase transparency in the processing of the remain-ing legislative electoral process.
Further upside to inflation Yield curve outlook
FX outlook: range-bound USD/CDF: forwards versus forecast
FX reserves resume growth REER
Sources: Reuters; Standard Bank Research
Sources: BCC; Bloomberg; IMF; Standard Bank Research
Sources: Banque Centrale du Congo; IMF; Standard Bank Research
Democratic Republic of the Congo
Sources: Banque Centrale du Congo; IMF; Standard Bank Research
Sources: BCC; IMF; Standard Bank Research
0.0
45.0
90.0
135.0
180.0
Dec-01 May-04 Oct-06 Mar-09 Aug-11Broad Money
% y/y
15.00
18.75
22.50
26.25
30.00
7-d 28-d
03-Jun-11 29-Jul-11 4-month forecast
0
338
675
1 013
1 350
1 688
Dec-09 Sep-10 Mar-11 Jul-11 Nov-11
FX reserves
USD m
450
663
875
1,088
1,300
Dec-06 Mar-08 Jun-09 Aug-10 Nov-11 Feb-13
USD/CDF
History Forw ards Forecast
0
20
40
60
80
100
120
2006 2007 2008 2009 2010 2011
REER NEER

31 Fixed Income Research
African Markets Revealed — January 2012
Democratic Republic of Congo: annual indicators
Sources: Banque Centrale du Congo; IMF; Standard Bank Research
Notes: pe — period end; pa — period average, nr — not rated
Democratic Republic of the Congo
2007 2008 2009 2010 2011e 2012f 2013f
Output Population (million) 63.3 65.2 67.2 69.2 71.3 73.4 75.5
Nominal GDP (CDFbn) 5,182 6,674 9,027 11,950 14 815 17 496 19 945
Nominal GDP (USDbn) 9.3 11.8 11.1 13.2 16.1 18.9 21.5
GDP / capita (USD) 146.9 181.3 164.5 190.6 225.9 256.9 285.0
Real GDP growth (%) 6.1 6.3 2.8 7.2 6.5 6.0 6.8
Central Government Operations Domestic budget balance / GDP (%) -2.5 -2.3 -4.2 2.4 -7.1 -6.0 -5.0
Domestic debt / GDP (%) na na na na na na na
External debt / GDP (%) 144.3 111.2 115.7 30.4 30.7 32.4 30.4
Balance Of Payments Goods exports (USD m) 6,143 6,585 4,370 8,350 10,931 11,421 13,520
Goods imports (USD m) 5,257 6,711 4,949 8,360 10,931 11,144 13,220
Trade balance (USD m) 886 -126 -579 -10 0 277 300
Current account (USD m) -153 -1,840 -1,166 -898 -419 -109 110
- % of GDP -1.6 -15.6 -10.6 -6.8 -2.6 -0.6 0.5
Capital and financial account (USD m) 661 266 198 1,647 522 283 -219
FDI 374 1,435 1,033 1,501 1,649 2,383 2,586
Basic balance 221 -405 -133 603 1,230 2,274 2,696
- % of GDP 2.4 -3.4 -1.2 4.6 7.6 12.1 12.5
FX reserves (USDm) pe 184 290 1,001 1,297 1,510 2,068 2,218
- Import cover (months) pe 2.4 1.9 1.7 2.2 2.0
Sovereign Credit Rating S&P nr nr nr nr nr nr nr
Moody’s nr nr nr nr nr nr nr
Fitch nr nr nr nr nr
Monetary & Financial Indicators Headline inflation pa 16.7 18.0 46.1 23.5 15.2 12.7 9.4
Headline inflation pe 10.0 27.6 53.4 9.5 9.8 8.4 7.8
M2 money supply (% y/y) pa 27.1 32.8 41.7 41.3 29.7 22.5 18.7
Policy interest rate (%) pa 30.8 28.5 67.9 55.5 27.9 27.9 19.8
Policy interest rate (%) pe 22.5 40.0 70.0 22.0 22.0 20.0 19.0
1-m rate (%) pa 29.0 27.6 64.6 37.7 27.3 27.0 25.2
2-y rate (%) pa na na na na na na na
USD/CDF pa 557 564 817 906 919 928 926
USD/CDF pe 550 640 907 915 928 925 922
Diamond production (m carats) 28.3 21.0 18.3 25.1 26.7 28.4 28.4
Crude oil (‘000 barrels) 8,816 8,365 9,382 8,628 8 812 8 980 9 870
Copper 94.1 335.1 309.2 497.5 440.0 497.0 587.0
REER (05M1=100) pa 100 106 150 169 152 167 171
NEER (05M1=100) pa 63 58 77 86 78 102 114
nr nr

African Markets Revealed — January 2012
32 Fixed Income Research
Egypt: new political dawn
With around two-thirds of the parliamentary voting proc-ess now confirmed, it looks likely that the Muslim Brother-hood’s coalition Freedom and Justice Party (FJP) will be the dominant party, with 45-50% of the vote. The more radical Muslim Salafist Al Nour party is likely to gain around 20-25%, while the more liberal parties, including numerous small parties and independents, will make 25%-30%. Voting for the upper Shura house will now take place in late Jan 12 and late Feb 12, with presiden-tial du by end Jun 12, at which stage the Supreme Coun-cil of the Armed Forces (SCAF) is supposed to hand over power. Our low-conviction, but still core, scenario is for a FJP-dominated coalition government with the secularist bloc rather than the Salafist Al Nour Party. Under such a scenario, a smooth succession from the military rulers can be envisaged.
The lower-than-expected 0.3% y/y GDP growth in Q3:11 has prompted us to revised down our full 2011 estimate to -0.6%, from 0.1% in Sep 11. We are looking for GDP growth to rebound to 5.2% in 2012, not least because of the harsh base influences, which have now lasted for most of 2011. Importantly, it is difficult to see the neces-sary rebound in investment until H2:12, when we should have some greater clarity around the new government’s policy environment. Our base case is constructed around a reasonable benign political outcome, with the FJP gov-ernment being reasonable orthodox in terms of economic policy. It also assumes that the present policy-makers can prevent a more significant period of macroeconomic instability, including a sharp EGP depreciation, albeit at the cost of holding down imports via more restrictive monetary policy and constrained fiscal policy.
Quarterly indicators
Political risk: Islamist government? Election results (2005)
GDP growth: still a political hostage Composition of GDP
Notes: pe — period end; pa — period average Sources: Central Bank of Egypt; Central Authority for Public Mobilization and Statistics; Standard Bank Research; Bloomberg
Sources: Central Bank of Egypt; Standard Bank Research
Source: Egypt Election Commission
Presidential election Party % of votes
Mohamed Hosni Mubarak NDP 88.6
Ayman Abdel Aziz Nour Al Ghad 7.6
Noman Khalil Gomaa Al Wafd 2.9
Parliamentary election Seats
(322 of 498) % of
votes
Freedom and Justice Party (FJP) 149 46.3
Salafist Al Nour party 80 24.8
New Wafd Party 25 7.8
Others (including 12 independents) 45 14.0
Osama Abdel Shafi Shaltout Al Takaful 0.4
Egyptian Bloc 23 7.1
Q1:10 Q2:10 Q3:10 Q4:10 Q1:11 Q2:11 Q3:11e Q4:11f Q1:12f Q2:12f Q3:12f Q4:12f
GDP (% y/y) pa 5.6 6.1 5.5 5.7 -3.8 -0.1 0.3 1.2 4.2 5.0 5.5 6.0
CPI (% y/y) pa 11.1 10.8 10.9 10.6 12.5 11.9 8.2 9.5 8.7 9.8 7.3 7.7
M2 (% y/y) pe 9.8 10.4 11.8 12.4 11.2 10.0 8.0 7.0 6.0 8.0 10.0 12.0
CA/GDP (%) pe -2.60 -3.31 -2.13 -1.06 -1.97 -0.65 -3.35 -1.13 -2.36 -2.95 -4.28 -1.75
FX reserves (USD bn) pe 34.5 35.2 35.5 36.0 30.1 26.5 24.0 18.1 15.0 13.0 15.0 17.0
Import cover (months) pe -8.6 -7.8 -8.4 -8.1 -8.0 -5.9 -4.9 -3.9 -3.8 -2.8 -2.9 -3.5
3-m rate (%) pe 10.0 10.2 9.0 9.0 11.5 12.0 13.0 14.0 14.0 13.0 12.0 11.0
5-y rate (%) pe 12.2 12.5 12.5 12.4 14.0 14.0 14.5 15.5 16.0 15.0 14.0 13.0
USD/EGP pe 5.45 5.69 5.70 5.80 5.95 5.90 5.95 6.03 6.05 6.10 6.15 6.20
REER pe 90.8 93.5 95.5 92.6 88.0 90.0 94.0 94.5 95.0 95.0 95.0 95.0
NEER pe 53.7 54.9 52.1 50.8 47.9 48.6 48.3 48.6 48.2 48.0 47.5 47.0
-5.0
-1.3
2.5
6.3
10.0
2008 2009 2010 2011 2012
%
PCE GE GFCF
Stocks Netex GDP

33 Fixed Income Research
African Markets Revealed — January 2012
The CBE’s official FX reserves fell to USD18.1bn at the end of Dec 11. This was down from USD36.0bn at end Dec 10. In fact, between Sep 10 and Mar 11, the CBE lost another USD10.0bn of reserves held at the commer-cial banks linked to portfolio inflows. Interestingly, in the four quarters to Sep 11, the C/A deficit was USD4.1bn (1.8% of GDP suggesting financial outflows of some USD24.0bn. Clearly Egypt is suffering from a crisis of investors confidence generated by the political-economy uncertainty, rather than a fundamentally unsustainable external position. Concern over a sharp move higher in the USD/EGP is clearly adding to the financial outflows. Despite seeing little real deterioration in the C/A deficit during 2012, we suspect the FX reserves will continue to dwindle to around USD14.0bn by mid-Jun 12 before starting to rebuild as a degree of confidence returns.
It is unlikely that the new finance minister Momtaz El Saieed will have more joy in delivering fiscal reform clar-ity than his predecessor Dr Hazem El-Beblawi who was in the position for less than 5-m, from early Jul 11. In-deed, fiscal policy clarity, including any new deal with the IMF which is presently back on the agenda, is unlikely until the new government and president is in place. This is unlikely until mid-2012. In the meantime, the deficit will continue to add to uncomfortably high debt levels. Actu-ally, the headline deficit figure of 9.8% of GDP (EGP134.3bn) for FY10/11 is likely to be revised up to 10.3% as it is presently based on the old GDP estimate. The estimate of 8.6% of GDP will also likely be revised up to 9.3% for similar reasons. The figures will push do-mestic debt to 88% of GDP and external debt to around 16% of GDP by end 2012.
Egypt’s monetary policy is now being set with the main objective of securing currency confidence. The CBE raised its reference rate 100 bps on 24 Nov 11, taking the deposit rate to 9.25% and the discount rate to 9.5%. However, reflecting the purpose of the change to bolster EGP confidence, the overnight lending rate an the 7-day repo rate were raised by only 50 bps, to 10.25% and 9.75% respectively. Although headline inflation did pick up to 9.5% y/y in Dec, our non-food inflation measure remained benign, at 6.9% y/y. With GDP growth almost non-existent and M2 growth at 7.1% y/y in Nov 11, the demand-side inflation drivers look likely to remain muted for some time to come. Ironically, the CBE’s monetary bias will remain hawkish until some confidence returns to the EGP market. The political changes required for this are unlikely to be in place before mid-2012.
Balance of payments: confidence game Current account developments
Fiscal policy: limited clarity Central government budget
Monetary policy: currency stability focus Inflation and interest rates
Sources: Central Bank of Egypt; Standard Bank Research
Sources: Egypt Ministry of Finance; Standard Bank Research
Sources: Central Bank of Egypt; Standard Bank Research
Egypt
% of GDP 10/11 11/12
Total revenue 19.3 22.4
Total expenditure 29.3 31.4
wages 7.0 7.5
interest 6.2 6.8
subsidies 9.0 10.1
grants 0.2 0.6
Overall balance (+ grants) -9.8 -8.6
Net asset position 0.2 0.4
Net external borrowing 0.2 0.7
Net domestic borrowing 9.4 7.5
-40,000
-20,000
0
20,000
40,000
Q1 08 Q4 08 Q3 09 Q2 10 Q1 11 Q4 11 Q3 12
USD m
Goods Services Transfers
Income C/A
%
0.0
7.5
15.0
22.5
30.0
Sep-05 Mar-07 Sep-08 Mar-10 Sep-11
CBE lending rate CPI y/y
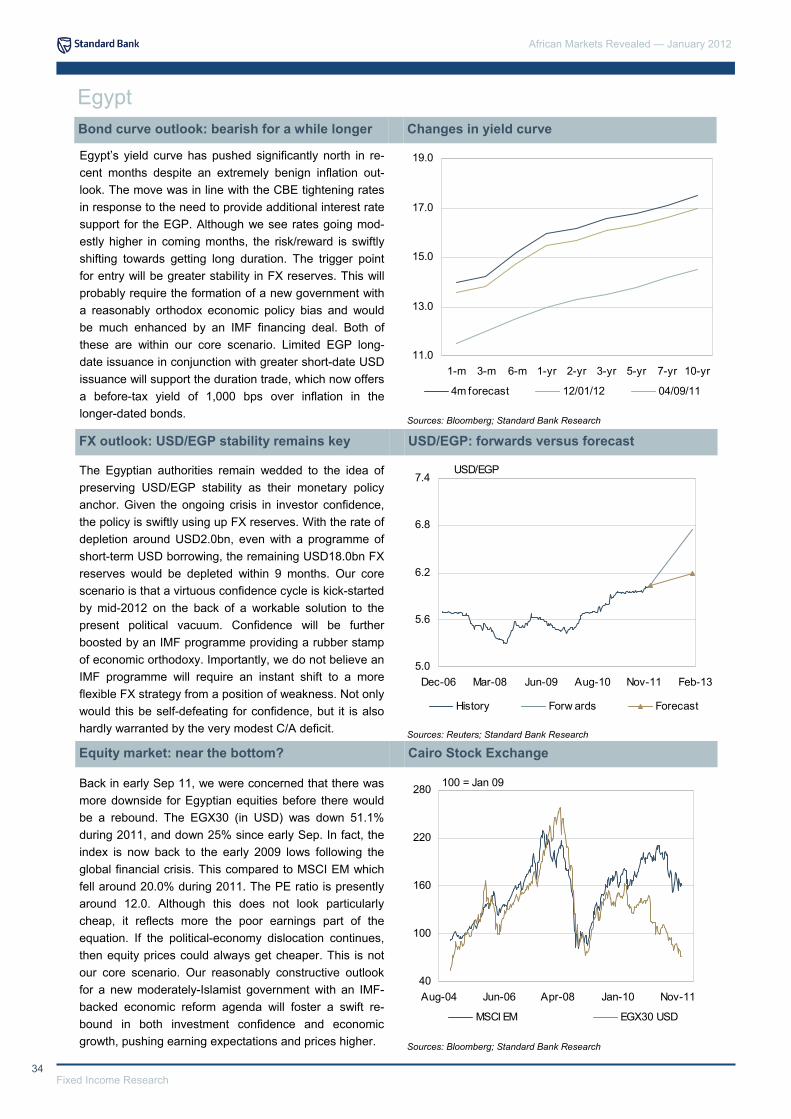
African Markets Revealed — January 2012
34 Fixed Income Research
Egypt’s yield curve has pushed significantly north in re-cent months despite an extremely benign inflation out-look. The move was in line with the CBE tightening rates in response to the need to provide additional interest rate support for the EGP. Although we see rates going mod-estly higher in coming months, the risk/reward is swiftly shifting towards getting long duration. The trigger point for entry will be greater stability in FX reserves. This will probably require the formation of a new government with a reasonably orthodox economic policy bias and would be much enhanced by an IMF financing deal. Both of these are within our core scenario. Limited EGP long-date issuance in conjunction with greater short-date USD issuance will support the duration trade, which now offers a before-tax yield of 1,000 bps over inflation in the longer-dated bonds.
The Egyptian authorities remain wedded to the idea of preserving USD/EGP stability as their monetary policy anchor. Given the ongoing crisis in investor confidence, the policy is swiftly using up FX reserves. With the rate of depletion around USD2.0bn, even with a programme of short-term USD borrowing, the remaining USD18.0bn FX reserves would be depleted within 9 months. Our core scenario is that a virtuous confidence cycle is kick-started by mid-2012 on the back of a workable solution to the present political vacuum. Confidence will be further boosted by an IMF programme providing a rubber stamp of economic orthodoxy. Importantly, we do not believe an IMF programme will require an instant shift to a more flexible FX strategy from a position of weakness. Not only would this be self-defeating for confidence, but it is also hardly warranted by the very modest C/A deficit.
Back in early Sep 11, we were concerned that there was more downside for Egyptian equities before there would be a rebound. The EGX30 (in USD) was down 51.1% during 2011, and down 25% since early Sep. In fact, the index is now back to the early 2009 lows following the global financial crisis. This compared to MSCI EM which fell around 20.0% during 2011. The PE ratio is presently around 12.0. Although this does not look particularly cheap, it reflects more the poor earnings part of the equation. If the political-economy dislocation continues, then equity prices could always get cheaper. This is not our core scenario. Our reasonably constructive outlook for a new moderately-Islamist government with an IMF-backed economic reform agenda will foster a swift re-bound in both investment confidence and economic growth, pushing earning expectations and prices higher.
Bond curve outlook: bearish for a while longer Changes in yield curve
FX outlook: USD/EGP stability remains key USD/EGP: forwards versus forecast
Equity market: near the bottom? Cairo Stock Exchange
Sources: Bloomberg; Standard Bank Research
Sources: Reuters; Standard Bank Research
Sources: Bloomberg; Standard Bank Research
Egypt
11.0
13.0
15.0
17.0
19.0
1-m 3-m 6-m 1-yr 2-yr 3-yr 5-yr 7-yr 10-yr
4m forecast 12/01/12 04/09/11
100 = Jan 09
40
100
160
220
280
Aug-04 Jun-06 Apr-08 Jan-10 Nov-11
MSCI EM EGX30 USD
5.0
5.6
6.2
6.8
7.4
Dec-06 Mar-08 Jun-09 Aug-10 Nov-11 Feb-13
USD/EGP
History Forw ards Forecast

35 Fixed Income Research
African Markets Revealed — January 2012
Egypt: annual indicators
Notes: pe — period end; pa — period average; na — not available
Sources: Central Bank of Egypt; Central Authority for Public Mobilization and Statistics; Standard Bank Research; Bloomberg
Egypt
2007 2008 2009 2010 2011e 2012f
Output Population (million) 72.8 74.2 75.7 77.2 78.8 80.3
Nominal GDP (EGPbn) 744 931 1069 1247 1380 1564
Nominal GDP (USDbn) 131.9 168.9 195.2 215.0 228.8 252.2
GDP / capita (USD) 1,813 2,275 2,578 2,784 2,905 3,139
Real GDP growth (%) 7.1 6.0 4.6 5.7 -0.6 5.2
Oil Production ('000 b/d) 619.0 639.0 643.0 641.5 630.0 625.0
Gas Production (bcm) 44.7 46.5 50.0 54.0 62.8 70.0
Central Government Operations
Budget balance (excl. Grants) / GDP (%) -7.10 -7.20 -7.40 -8.50 -9.60 -11.40
Budget balance (incl. Grants) / GDP (%) -6.80 -6.50 -6.63 -8.19 -9.24 -10.81
Domestic debt / GDP (%) 85.53 75.52 76.59 79.07 85.32 89.84
External debt / GDP (%) 22.67 20.07 16.65 16.28 16.61 16.65
Balance of Payments
Exports of goods and services (USDbn) 24.45 29.85 23.09 25.02 28.22 28.04
Imports of goods and services (USDbn) -45.26 -56.62 -45.56 -51.54 -53.29 -55.96
Trade balance (USDbn) -20.81 -26.77 -22.48 -26.51 -25.08 -27.92
Current account (USDbn) 0.24 -1.33 -3.19 -4.94 -4.22 -7.34
- % of GDP 0.18 -0.79 -1.64 -2.30 -1.84 -2.91
Capital & Financial account (USDbn) 4.90 6.00 2.70 8.20 -16.50 6.30
- FDI (USDbn) 11.60 7.60 6.10 6.30 4.00 6.00
Basic balance / GDP (%) 8.98 3.71 1.49 0.63 -0.09 -0.53
FX reserves (USDbn) pe 31.68 34.11 34.20 36.00 18.10 17.0
- Import cover (months) pe -8.40 6.00 -9.01 -8.38 -4.08 -3.65
Sovereign Credit Rating
S&P BB+ BB+ BB+ BB+ B+ BB-
Moody’s Ba1 Ba1 Ba1 Baa1 B2 B1
Fitch BB+ BB+ BB+ BB+ BB- BB
Monetary & Financial Indicators
Consumer inflation (%) pa 9.56 17.73 14.98 11.05 10.05 8.60
Consumer inflation (%) pe 7.09 18.30 11.50 10.60 9.50 7.70
M2 money supply (% y/y) pa 17.16 16.06 7.85 11.10 9.70 9.50
M2 money supply (% y/y) pe 19.12 10.50 9.50 12.40 7.00 12.00
CBE Lending rate (%) pa 10.75 12.13 11.63 9.75 10.00 10.13
CBE Lending rate (%) pe 10.75 13.50 9.75 9.75 10.25 10.00
3-m rate (%) pe 7.10 11.84 9.80 9.00 14.50 11.00
1-y rate (%) pe 7.65 12.20 11.30 11.80 15.00 12.00
2-y rate (%) pe 7.45 10.35 11.50 12.00 15.30 12.50
5-y rate (%) pe 8.84 11.75 10.50 12.35 16.30 13.00
USD/EGP pa 5.67 5.58 5.55 5.66 5.92 6.12
USD/EGP pe 5.64 5.51 5.48 5.80 6.03 6.20
REER pa 76.5 87.0 87.3 93.1 91.6 95.0
NEER pa 51.3 51.4 52.3 52.9 48.4 47.7
2013f
82.0
1798
299.7
3,657
5.0
620.0
80.0
-8.00
-7.00
85.0
20.0
29.5
-57.5
-28.00
-6.00
-2.00
10.0
8.00
0.67
25.00
-5.22
BB
Ba3
BB+
7.85
8.00
14.0
16.0
9.50
9.00
10.0
11.0
12.0
13.0
6.10
6.00
97.0
50.0
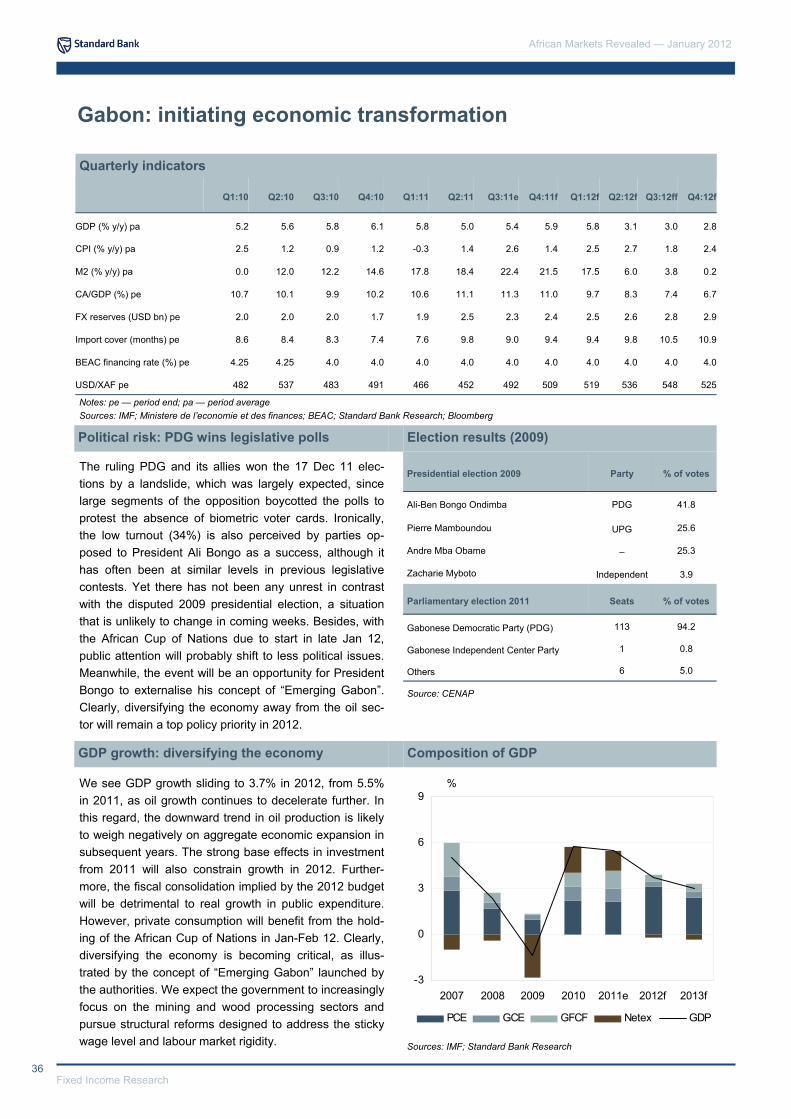
African Markets Revealed — January 2012
36 Fixed Income Research
Gabon: initiating economic transformation
The ruling PDG and its allies won the 17 Dec 11 elec-tions by a landslide, which was largely expected, since large segments of the opposition boycotted the polls to protest the absence of biometric voter cards. Ironically, the low turnout (34%) is also perceived by parties op-posed to President Ali Bongo as a success, although it has often been at similar levels in previous legislative contests. Yet there has not been any unrest in contrast with the disputed 2009 presidential election, a situation that is unlikely to change in coming weeks. Besides, with the African Cup of Nations due to start in late Jan 12, public attention will probably shift to less political issues. Meanwhile, the event will be an opportunity for President Bongo to externalise his concept of “Emerging Gabon”. Clearly, diversifying the economy away from the oil sec-tor will remain a top policy priority in 2012.
We see GDP growth sliding to 3.7% in 2012, from 5.5% in 2011, as oil growth continues to decelerate further. In this regard, the downward trend in oil production is likely to weigh negatively on aggregate economic expansion in subsequent years. The strong base effects in investment from 2011 will also constrain growth in 2012. Further-more, the fiscal consolidation implied by the 2012 budget will be detrimental to real growth in public expenditure. However, private consumption will benefit from the hold-ing of the African Cup of Nations in Jan-Feb 12. Clearly, diversifying the economy is becoming critical, as illus-trated by the concept of “Emerging Gabon” launched by the authorities. We expect the government to increasingly focus on the mining and wood processing sectors and pursue structural reforms designed to address the sticky wage level and labour market rigidity.
Quarterly indicators
Political risk: PDG wins legislative polls Election results (2009)
GDP growth: diversifying the economy Composition of GDP
Notes: pe — period end; pa — period average Sources: IMF; Ministere de l’economie et des finances; BEAC; Standard Bank Research; Bloomberg
Presidential election 2009 Party % of votes
Ali-Ben Bongo Ondimba PDG 41.8
Pierre Mamboundou UPG 25.6
Andre Mba Obame – 25.3
Zacharie Myboto Independent 3.9
Parliamentary election 2011 Seats % of votes
Gabonese Democratic Party (PDG) 113 94.2
Gabonese Independent Center Party 1 0.8
Others 6 5.0
Sources: IMF; Standard Bank Research
Source: CENAP
Q1:10 Q2:10 Q3:10 Q4:10 Q1:11 Q2:11 Q3:11e Q4:11f Q1:12f Q2:12f Q3:12ff Q4:12f
GDP (% y/y) pa 5.2 5.6 5.8 6.1 5.8 5.0 5.4 5.9 5.8 3.1 3.0 2.8
CPI (% y/y) pa 2.5 1.2 0.9 1.2 -0.3 1.4 2.6 1.4 2.5 2.7 1.8 2.4
M2 (% y/y) pa 0.0 12.0 12.2 14.6 17.8 18.4 22.4 21.5 17.5 6.0 3.8 0.2
CA/GDP (%) pe 10.7 10.1 9.9 10.2 10.6 11.1 11.3 11.0 9.7 8.3 7.4 6.7
FX reserves (USD bn) pe 2.0 2.0 2.0 1.7 1.9 2.5 2.3 2.4 2.5 2.6 2.8 2.9
Import cover (months) pe 8.6 8.4 8.3 7.4 7.6 9.8 9.0 9.4 9.4 9.8 10.5 10.9
BEAC financing rate (%) pe 4.25 4.25 4.0 4.0 4.0 4.0 4.0 4.0 4.0 4.0 4.0 4.0
USD/XAF pe 482 537 483 491 466 452 492 509 519 536 548 525
-3
0
3
6
9
2007 2008 2009 2010 2011e 2012f 2013f
%
PCE GCE GFCF Netex GDP

37 Fixed Income Research
African Markets Revealed — January 2012
With a trade surplus projected at 36.4% of GDP for 2012, the external position remains robust. Yet oil production has peaked, which suggests oil exports (c85% of total exports) will decline steadily in the LT. Meanwhile, non-oil imports will continue to edge up in coming years as a product of infrastructure projects and economic diversifi-cation. The services and income balances and current transfers have consistently been in negative territory. Overall, the C/A will remain in surplus, albeit gradually declining in 2012-13. Further risks to the C/A stem from the weaker XAF (EUR) pushing up import costs. We see FDI averaging USD750m in 2012, but the outlook for portfolio inflows is constrained by the absence of equity and liquid debt securities on the BVMAC bourse. FX re-serves reached USD2.3bn in Oct 11 (9.0-m of import cover) and will rise to USD2.9bn by end 2012.
The 2012 fiscal framework suggests growing restraint, with aggregate spending increasing only 3.4% y/y in nominal terms. While recurrent expenditure will remain almost flat at, XAF1,060bn, capital expenditure will be reduced to XAF699bn, from XAF857bn in 2011. Although the lower capex figure is at odds with the authorities’ stance since 2009, it reflects the high base effect in infra-structure spending last year ahead of the Jan-Feb 12 African Cup of Nations. It is also consistent with an IMF agreement and a function of Gabon’s limited administra-tive and execution capacity. The country will continue to post fiscal surpluses in coming years, which we see in-creasing to 6.1% of GDP in 2012. Consolidating public finances, rationalising expenditure and accumulating FX reserves are necessary to cushion against oil price vola-tility and declining output.
Gabon’s inflation edged above 3.0% y/y at some point in Q3:11, but is still expected to average around 1.3% y/y in 2011 before climbing to an average of 2.4% y/y in 2012. The trend appears to be at odds with the BEAC’s outlook for the CEMAC region, where it sees inflation averaging 2.2% y/y in 2011 and subsequently falling to 1.7% in 2012. Meanwhile, the central bank also expects regional growth to reach 6.0% in 2012, from 4.8% in 2011. As such, we see limited chance of the BEAC adjusting its benchmark rate any time soon. The rate has been at 4% since Jul 10, and there has only been one increase in Jul 08 over the last decade. In the meantime, the BEAC will continue to influence market liquidity conditions via its deposit rate, which was cut by 25 bps at the 16 Dec 11 MPC, back to a 0.6%-1.25% range.
Balance of payments: positive C/A balance Current account developments
Fiscal policy: restraint in public spending Central government budget
Monetary policy: modest asymmetric easing Inflation and interest rates
Sources: IMF; Standard Bank Research
Sources: IMF; BEAC; Standard Bank Research
Sources: IMF; BEAC; Standard Bank Research
Gabon
% of GDP 2010 2011
Total revenue (+ grants) 30.7 31.1
Oil revenue 18.2 18.3
Non-oil revenue 12.5 12.8
Total expenditure and net lending 25.8 27.6
Current expenditure 15.6 15.0
- interest 1.6 1.6
Capital expenditure 9.2 12.6
Overall balance 4.8 3.5
2012
30.5
17.9
12.6
24.4
14.7
1.5
9.7
6.1
Changes in arrears -4.5 0.0 -0.1
Net external borrowing (saving) -0.1 0.1 -1.4
Net domestic borrowing (saving) -0.2 -3.6 -4.6
-4
-1
2
5
8
2007 2008 2009 2010 2011e 2012f 2013f
USDbn
Goods Services Income
Transfers CA
-3
0
3
6
9
Jun-99 Jul-02 Aug-05 Sep-08 Oct-11
%
ECB refi BEAC rate CPI y/y
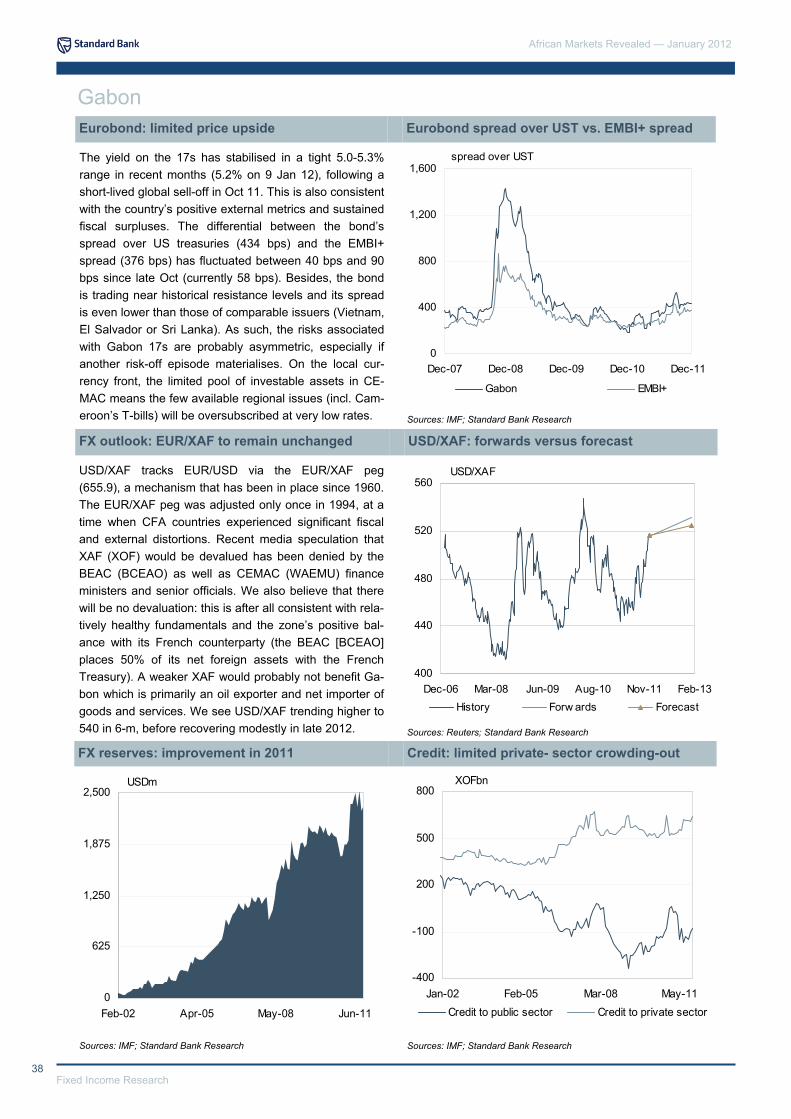
African Markets Revealed — January 2012
38 Fixed Income Research
The yield on the 17s has stabilised in a tight 5.0-5.3% range in recent months (5.2% on 9 Jan 12), following a short-lived global sell-off in Oct 11. This is also consistent with the country’s positive external metrics and sustained fiscal surpluses. The differential between the bond’s spread over US treasuries (434 bps) and the EMBI+ spread (376 bps) has fluctuated between 40 bps and 90 bps since late Oct (currently 58 bps). Besides, the bond is trading near historical resistance levels and its spread is even lower than those of comparable issuers (Vietnam, El Salvador or Sri Lanka). As such, the risks associated with Gabon 17s are probably asymmetric, especially if another risk-off episode materialises. On the local cur-rency front, the limited pool of investable assets in CE-MAC means the few available regional issues (incl. Cam-eroon’s T-bills) will be oversubscribed at very low rates.
USD/XAF tracks EUR/USD via the EUR/XAF peg (655.9), a mechanism that has been in place since 1960. The EUR/XAF peg was adjusted only once in 1994, at a time when CFA countries experienced significant fiscal and external distortions. Recent media speculation that XAF (XOF) would be devalued has been denied by the BEAC (BCEAO) as well as CEMAC (WAEMU) finance ministers and senior officials. We also believe that there will be no devaluation: this is after all consistent with rela-tively healthy fundamentals and the zone’s positive bal-ance with its French counterparty (the BEAC [BCEAO] places 50% of its net foreign assets with the French Treasury). A weaker XAF would probably not benefit Ga-bon which is primarily an oil exporter and net importer of goods and services. We see USD/XAF trending higher to 540 in 6-m, before recovering modestly in late 2012.
Eurobond: limited price upside Eurobond spread over UST vs. EMBI+ spread
FX outlook: EUR/XAF to remain unchanged USD/XAF: forwards versus forecast
FX reserves: improvement in 2011 Credit: limited private- sector crowding-out
Sources: IMF; Standard Bank Research
Sources: Reuters; Standard Bank Research
Sources: IMF; Standard Bank Research Sources: IMF; Standard Bank Research
Gabon
spread over UST
0
400
800
1,200
1,600
Dec-07 Dec-08 Dec-09 Dec-10 Dec-11
Gabon EMBI+
0
625
1,250
1,875
2,500
Feb-02 Apr-05 May-08 Jun-11
USDm
-400
-100
200
500
800
Jan-02 Feb-05 Mar-08 May-11
XOFbn
Credit to public sector Credit to private sector
400
440
480
520
560
Dec-06 Mar-08 Jun-09 Aug-10 Nov-11 Feb-13
USD/XAF
History Forw ards Forecast

39 Fixed Income Research
African Markets Revealed — January 2012
Gabon: annual indicators
Notes: pe — period end; pa — period average; na — not available; nr — not rated
Sources: Direction Generale des Statistiques; MF; Banque des Etats de l’Afrique Centrale (BEAC); Standard Bank Research
Gabon
2007 2008 2009 2010 2011e 2012f 2013f
Output Population (million) 1.4 1.5 1.5 1.5 1.5 1.5 1.6
Nominal GDP (XAFbn) 5,490 5,906 5,936 6,363 6,796 7,211 7,622
Nominal GDP (USDbn) 12.3 12.6 13.0 13.0 13.4 13.7 16.3
GDP / capita (USD) 8,589 8,609 8,806 8,663 8,799 8,921 10,397
Real GDP growth (%) 5.0 2.3 -1.4 5.7 5.5 3.7 3.0
Crude oil Production (k bbls/day) 244 248 242 228 235 228 218
Central Government Operations
Budget balance (excl. Grants) / GDP (%) 8.7 11.7 6.5 4.8 3.5 6.1 5.8
Budget balance (incl. Grants) / GDP (%) 8.7 11.7 6.5 4.8 3.5 6.1 5.8
Domestic debt / GDP (%) 8.3 5.2 7.6 5.7 4.3 3.2 2.9
External debt / GDP (%) 34.9 15.6 18.8 15.7 14.1 17.5 17.2
Balance of Payments
Exports of goods and services (USDbn) 6.4 9.4 6.0 7.5 8.2 8.2 7.9
Imports of goods and services (USDbn) 1.5 2.2 2.3 2.8 3.1 3.2 3.3
Trade balance (USDbn) 4.9 7.2 3.6 4.6 5.1 5.0 4.6
Current account (USDbn) 4.6 3.4 0.9 1.3 1.5 1.1 1.0
- % of GDP 14.7 26.7 6.7 10.2 11.0 8.0 5.8
Capital & Financial account (USDbn) -4.8 -4.0 -0.9 -1.1 -2.1 -1.6 -1.5
- FDI (USDbn) 0.2 0.8 0.6 0.5 0.7 0.7 0.8
Basic balance / GDP (%) 39.2 32.8 11.2 14.3 16.4 13.4 10.5
FX reserves (USDbn) pe 1.3 1.9 2.0 1.7 2.4 2.9 3.4
- Import cover (months) pe 10.3 10.3 10.4 7.4 9.4 10.9 12.4
Sovereign Credit Rating
S&P BB- BB- BB- BB- BB- BB- BB-
Moody’s N/R N/R N/R N/R N/R nr nr
Fitch BB- BB- BB- BB- BB- BB- BB-
Monetary & Financial Indicators Consumer inflation (%) pa 5.0 5.3 1.9 1.5 1.3 2.4 2.7
Consumer inflation (%) pe 5.9 5.5 0.9 0.7 1.9 2.5 2.3
M2 (% y/y) pa 15.4 11.6 4.0 9.7 20.0 6.9 16.5
M2 (% y/y) pe 11.6 12.3 -1.0 19.8 15.9 0.2 19.2
BEAC discount rate (%) pa 5.5 5.1 4.4 4.1 4.0 4.0 4.0
BEAC discount rate (%) pe 5.5 4.8 4.3 4.0 4.0 4.0 4.0
USD/XAF pa 479 448 462 496 474 533 495
USD/XAF pe 447 467 457 491 509 525 469

African Markets Revealed — January 2012
40 Fixed Income Research
Ghana: seeking Goldilocks
The Dec 12 election is likely to be another closely fought contest between the incumbent NDC and the previous-governing NPP. Yet, based on the example of 2008, we are not too concerned by socio-political risks. Moreover, from a policy perspective, we see limited differences be-tween the likely direction of the two parties. Our key po-litical risk concern remains the chance of economic over-heating and currency stress, which also has strong his-torical precedence ahead of elections. That said, at pre-sent we are reasonably comfortable that we are not going to see the excesses of the run-up to 2008 elections. In-deed, the repayment of the arrears accumulated during this period has been a key part of deficit financing needs of the government in 2011. At present, we are with the IMF in giving the government the benefit of the doubt on its fiscal plans.
Latest figures for Q2:11 imply that Ghana’s real GDP grew 16.0% y/y, compared to 23.0% y/y in Q1:11, sug-gesting it was the fastest-growing economy globally in H1:11. Mining was the main source of growth, increasing 210.6% y/y in Q2:11, representing the coming on stream of oil production. That said, agriculture was also up 82.3% y/y, from 61.3% in Q1:11. Construction was up 19.4% y/y and financial services were up 76.5% y/y (although there were some strange base influences in the figure). We see growth moderating to an annual average of 16.3% y/y in 2011, which is still above the govern-ment’s budget estimate of 13.6% y/y. They are looking for 9.4% y/y overall growth and 7.6% for non-oil growth in 2012. Broadly due to our larger base influence, we see growth easing to around 8.25% y/y. Not least, we are less constructive on another bumper agricultural season.
Quarterly indicators
Political risk: preparing for elections Election results (2008)
GDP growth: roaring Composition of GDP
Notes: pe — period end; pa — period average; na — not available.
Sources: Bank of Ghana; Ghana Central Statistical Service; Standard Bank Research; Bloomberg
Sources: Bank of Ghana; Standard Bank Research
Source: Ghana Electoral Commission
Presidential election Party % of votes
Second-round run-off
Prof. John Atta-MIlls NDC 50.23
Nana Akuffo Addo NPP 49.77
Legislative election Seats
New Patriotic Party (NPP) 108
National Democratic Congress (NDC) 115
People’s National Convention (PNC) 2
Convention People’s Party (CPP) 1
Independent 4
Total 230
Q1:10 Q2:10 Q3:10 Q4:10 Q1:11 Q2:11 Q3:11e Q4:11f Q1:12f Q2:12f Q3:12f Q4:12f
GDP (% y/y) pa 6.7 5.2 8.7 9.5 23.0 16.4 13.0 11.5 8.3 8.3 8.3 8.3
CPI (% y/y) pa 14.1 10.6 9.4 9.0 9.1 9.1 8.4 8.5 10.0 9.6 9.2 9.0
M2 (% y/y) pe 29.8 27.5 25.0 37.5 33.0 33.0 33.0 33.0 33.0 33.0 33.0 33.0
CA/GDP (%) pe -7.5 -8.2 -6.9 -12.3 -5.2 -5.7 -8.3 -12.6 -5.2 -8.1 -9.7 -14.7
FX reserves (USD bn) pe 3.3 3.5 3.6 4.7 4.5 4.6 4.7 5.0 5.3 5.2 5.5 5.9
Import cover (months) pe 4.0 3.9 4.0 4.6 4.1 3.3 3.5 3.3 3.9 3.0 3.3 3.2
3-m rate (%) pe 20.0 14.0 12.5 12.3 12.0 10.5 9.5 10.5 11.0 11.5 11.8 12.0
5-y rate (%) pe 20.0 16.0 14.5 14.2 14.0 13.8 13.5 16.0 16.5 16.8 17.2 17.5
USD/GHS pe 1.42 1.44 1.42 1.48 1.53 1.52 1.59 1.64 1.68 1.72 1.75 1.80
NEER pe 65.4 65.9 64.7 62.4 60.2 59.8 57.80 57.0 56.0 55.0 54.0 53.0
REER pe 117.8 124.0 119.8 115.5 114.9 118.2 111.8 109.5 110.0 109.5 108.0 107.5
-5.00
1.25
7.50
13.75
20.00
2007 2008 2009 2010 2011 2012
Agriculture IndustryServices GDP (Real y/y)
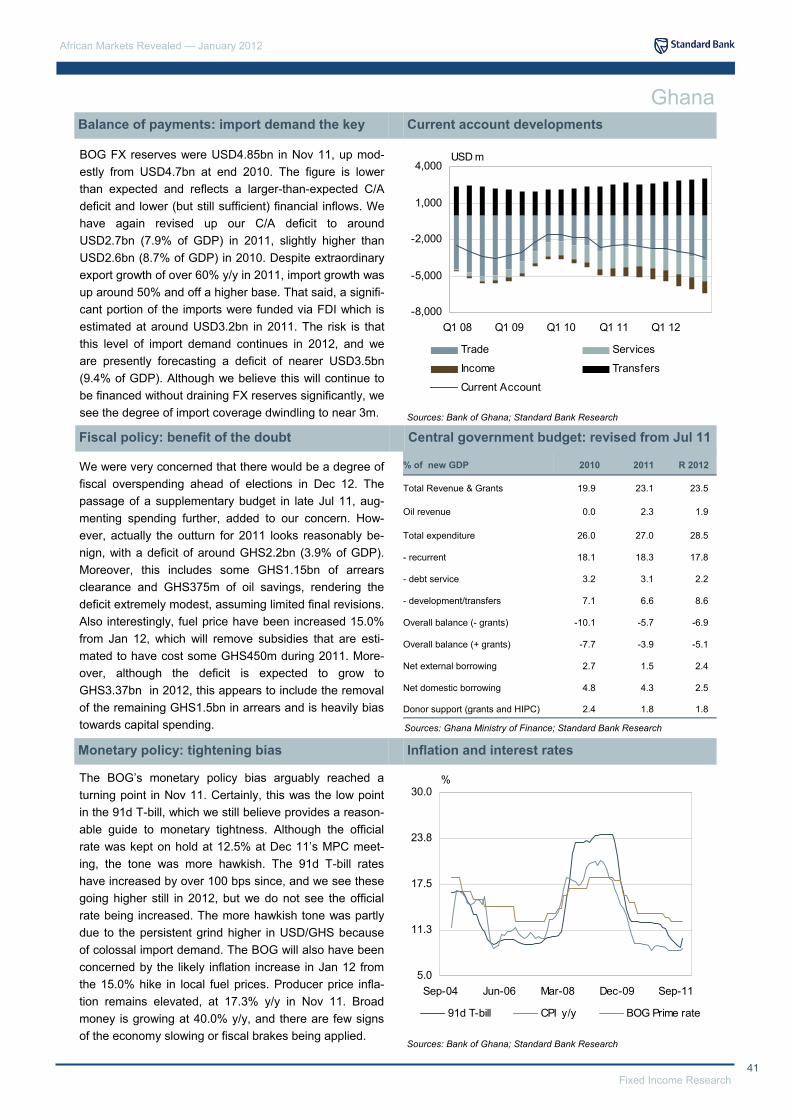
41 Fixed Income Research
African Markets Revealed — January 2012
BOG FX reserves were USD4.85bn in Nov 11, up mod-estly from USD4.7bn at end 2010. The figure is lower than expected and reflects a larger-than-expected C/A deficit and lower (but still sufficient) financial inflows. We have again revised up our C/A deficit to around USD2.7bn (7.9% of GDP) in 2011, slightly higher than USD2.6bn (8.7% of GDP) in 2010. Despite extraordinary export growth of over 60% y/y in 2011, import growth was up around 50% and off a higher base. That said, a signifi-cant portion of the imports were funded via FDI which is estimated at around USD3.2bn in 2011. The risk is that this level of import demand continues in 2012, and we are presently forecasting a deficit of nearer USD3.5bn (9.4% of GDP). Although we believe this will continue to be financed without draining FX reserves significantly, we see the degree of import coverage dwindling to near 3m.
We were very concerned that there would be a degree of fiscal overspending ahead of elections in Dec 12. The passage of a supplementary budget in late Jul 11, aug-menting spending further, added to our concern. How-ever, actually the outturn for 2011 looks reasonably be-nign, with a deficit of around GHS2.2bn (3.9% of GDP). Moreover, this includes some GHS1.15bn of arrears clearance and GHS375m of oil savings, rendering the deficit extremely modest, assuming limited final revisions. Also interestingly, fuel price have been increased 15.0% from Jan 12, which will remove subsidies that are esti-mated to have cost some GHS450m during 2011. More-over, although the deficit is expected to grow to GHS3.37bn in 2012, this appears to include the removal of the remaining GHS1.5bn in arrears and is heavily bias towards capital spending.
The BOG’s monetary policy bias arguably reached a turning point in Nov 11. Certainly, this was the low point in the 91d T-bill, which we still believe provides a reason-able guide to monetary tightness. Although the official rate was kept on hold at 12.5% at Dec 11’s MPC meet-ing, the tone was more hawkish. The 91d T-bill rates have increased by over 100 bps since, and we see these going higher still in 2012, but we do not see the official rate being increased. The more hawkish tone was partly due to the persistent grind higher in USD/GHS because of colossal import demand. The BOG will also have been concerned by the likely inflation increase in Jan 12 from the 15.0% hike in local fuel prices. Producer price infla-tion remains elevated, at 17.3% y/y in Nov 11. Broad money is growing at 40.0% y/y, and there are few signs of the economy slowing or fiscal brakes being applied.
Balance of payments: import demand the key Current account developments
Fiscal policy: benefit of the doubt Central government budget: revised from Jul 11
Monetary policy: tightening bias Inflation and interest rates
Sources: Bank of Ghana; Standard Bank Research
Sources: Ghana Ministry of Finance; Standard Bank Research
Sources: Bank of Ghana; Standard Bank Research
Ghana
% of new GDP 2010 2011
Total Revenue & Grants 19.9 23.1
Oil revenue 0.0 2.3
Total expenditure 26.0 27.0
- recurrent 18.1 18.3
- debt service 3.2 3.1
- development/transfers 7.1 6.6
Overall balance (- grants) -10.1 -5.7
Overall balance (+ grants) -7.7 -3.9
Net external borrowing 2.7 1.5
Net domestic borrowing 4.8 4.3
R 2012
23.5
1.9
28.5
17.8
2.2
8.6
-6.9
-5.1
2.4
2.5
Donor support (grants and HIPC) 2.4 1.8 1.8
-8,000
-5,000
-2,000
1,000
4,000
Q1 08 Q1 09 Q1 10 Q1 11 Q1 12
USD m
Trade Services
Income Transfers
Current Account
5.0
11.3
17.5
23.8
30.0
Sep-04 Jun-06 Mar-08 Dec-09 Sep-11
%
91d T-bill CPI y/y BOG Prime rate

African Markets Revealed — January 2012
42 Fixed Income Research
We are looking for the yield curve to bear-flatten in coming months, having bear-steepened in recent weeks. Impor-tantly, the hesitance of international investors to get in-volved at the last few 3y an 5y bond auctions has placed upward pressure on the longer-dated instruments, but we have not yet seen aggressive selling, which would make the curve steepen even more. Investor hesitance comes from the grind higher in USD/GHS which has all but re-moved any positive return for 2011. Currency weakness and debt issuance concerns ahead of Dec 12 elections are also undermining foreign investor confidence in the bonds, while local investors are more concerned by currency weakness pushing inflation higher and necessitating tighter monetary policy. We see inflation creeping higher, in line with USD/GHS upside, but we see no official rate hike unless confidence in the currency wanes significantly.
Our core scenario is for USD/GHS to grind higher to 1.8 towards the end of 2012. It is a relatively low-conviction call, as it depends heavily on monetary and fiscal policy which is presently being positively adjusted. If policy is aggressively tightened (slowing import demand some-what), then the growing loss of GHS confidence would not develop further, and we could end the year flat, at around 1.65 (presently) or perhaps even lower. If confi-dence is not proactively re-built, then there is a possibility we end the year nearer 2.0. Perhaps the key risk variable comes from foreign bond holdings. Although a disorderly unwinding of these holdings and a major switching into USD by local deposit holders is not our core scenario, the risks are rising with the slide higher in USD/GHS. Upward pressure on USD/GHS is also likely from a stronger USD against the majors.
Ghana’s all share equity index fell some 3.1% during 2011 in GHS terms (or 14.2% in USD terms). This com-pares to a decline of 20.4% for the MSCI EM index. How-ever, the outperformance seen in the year to Sep was reversed: the GSE fell some 12.3% during the last 4m of 2011 in GHS terms, and 18.2% in USD terms, and com-pared to a decline of 6.0% in the MSCI EM index. While at first look there appears to be limited correlation be-tween the GSE and wider EM equity performance, actu-ally it appears that the relationship is there, with a long multi-month lag. The GSE’s poor performance since Sep 11 should thus be seen as “catch-up”. Even after a rea-sonable correction, the P/E ratio remains a fairly high 16.5, compared to around 7.0 for the Nigerian All Share index. Multi-month, we suspect there is some additional downside to come despite a longer-term bullish story.
Bond outlook: bearish Changes in yield curve
FX outlook: USD/GHS moving higher still USD/GHS: forwards versus forecasts
Equity market: struggling Ghana Stock Exchange
Sources: Reuters; Standard Bank Research
Sources: Bank of Ghana; Standard Bank Research
Source: Bloomberg
Ghana
9.0
11.3
13.5
15.8
18.0
91d 182d 1y 2y 3y 5y
09-Jan-12 05-Sep-11 4-m forecast
20.00
47.50
75.00
102.50
130.00
Oct-06 Jan-08 May-09 Aug-10 Nov-11
GSE USD MSCI EM
0.85
1.14
1.43
1.71
2.00
Dec-06 Mar-08 Jun-09 Aug-10 Nov-11 Feb-13
USD/GHS
History Forw ards Forecast
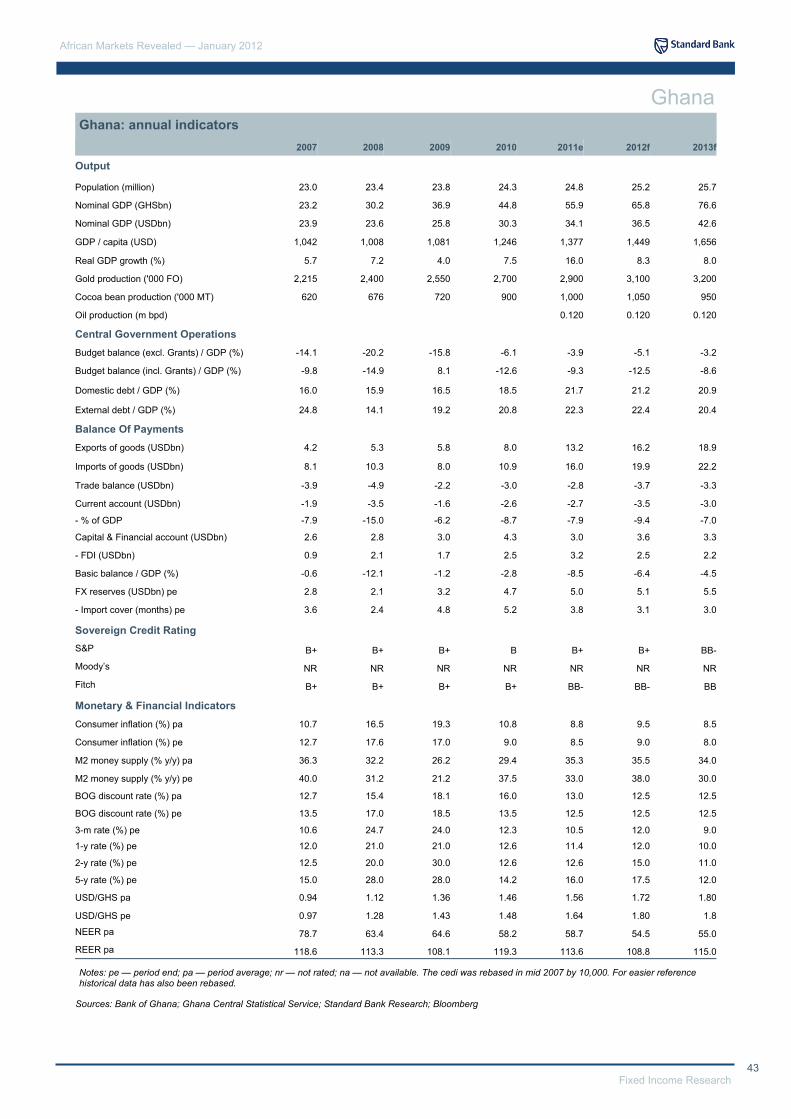
43 Fixed Income Research
African Markets Revealed — January 2012
Ghana: annual indicators
Notes: pe — period end; pa — period average; nr — not rated; na — not available. The cedi was rebased in mid 2007 by 10,000. For easier reference historical data has also been rebased.
Sources: Bank of Ghana; Ghana Central Statistical Service; Standard Bank Research; Bloomberg
Ghana
2007 2008 2009 2010 2011e 2012f
Output Population (million) 23.0 23.4 23.8 24.3 24.8 25.2
Nominal GDP (GHSbn) 23.2 30.2 36.9 44.8 55.9 65.8
Nominal GDP (USDbn) 23.9 23.6 25.8 30.3 34.1 36.5
GDP / capita (USD) 1,042 1,008 1,081 1,246 1,377 1,449
Real GDP growth (%) 5.7 7.2 4.0 7.5 16.0 8.3
Gold production ('000 FO) 2,215 2,400 2,550 2,700 2,900 3,100
Cocoa bean production ('000 MT) 620 676 720 900 1,000 1,050
Oil production (m bpd) 0.120 0.120
Central Government Operations Budget balance (excl. Grants) / GDP (%) -14.1 -20.2 -15.8 -6.1 -3.9 -5.1
Domestic debt / GDP (%) 16.0 15.9 16.5 18.5 21.7 21.2
External debt / GDP (%) 24.8 14.1 19.2 20.8 22.3 22.4
Balance Of Payments Exports of goods (USDbn) 4.2 5.3 5.8 8.0 13.2 16.2
Imports of goods (USDbn) 8.1 10.3 8.0 10.9 16.0 19.9
Trade balance (USDbn) -3.9 -4.9 -2.2 -3.0 -2.8 -3.7
Current account (USDbn) -1.9 -3.5 -1.6 -2.6 -2.7 -3.5
- % of GDP -7.9 -15.0 -6.2 -8.7 -7.9 -9.4
Capital & Financial account (USDbn) 2.6 2.8 3.0 4.3 3.0 3.6
- FDI (USDbn) 0.9 2.1 1.7 2.5 3.2 2.5
Basic balance / GDP (%) -0.6 -12.1 -1.2 -2.8 -8.5 -6.4
FX reserves (USDbn) pe 2.8 2.1 3.2 4.7 5.0 5.1
- Import cover (months) pe 3.6 2.4 4.8 5.2 3.8 3.1
Sovereign Credit Rating
S&P B+ B+ B+ B B+ B+
Moody’s NR NR NR NR NR NR
Fitch B+ B+ B+ B+ BB- BB-
Monetary & Financial Indicators Consumer inflation (%) pa 10.7 16.5 19.3 10.8 8.8 9.5
Consumer inflation (%) pe 12.7 17.6 17.0 9.0 8.5 9.0
BOG discount rate (%) pa 12.7 15.4 18.1 16.0 13.0 12.5
BOG discount rate (%) pe 13.5 17.0 18.5 13.5 12.5 12.5
3-m rate (%) pe 10.6 24.7 24.0 12.3 10.5 12.0
1-y rate (%) pe 12.0 21.0 21.0 12.6 11.4 12.0
2-y rate (%) pe 12.5 20.0 30.0 12.6 12.6 15.0
5-y rate (%) pe 15.0 28.0 28.0 14.2 16.0 17.5
USD/GHS pa 0.94 1.12 1.36 1.46 1.56 1.72
USD/GHS pe 0.97 1.28 1.43 1.48 1.64 1.80
NEER pa 78.7 63.4 64.6 58.2 58.7 54.5
REER pa 118.6 113.3 108.1 119.3 113.6 108.8
M2 money supply (% y/y) pe 40.0 31.2 21.2 37.5 33.0 38.0
M2 money supply (% y/y) pa 36.3 32.2 26.2 29.4 35.3 35.5
Budget balance (incl. Grants) / GDP (%) -9.8 -14.9 8.1 -12.6 -9.3 -12.5
2013f
25.7
76.6
42.6
1,656
8.0
3,200
950
0.120
-3.2
-8.6
20.9
20.4
18.9
22.2
-3.3
-3.0
-7.0
3.3
2.2
-4.5
5.5
3.0
BB-
NR
BB
8.5
8.0
34.0
30.0
12.5
12.5
9.0
10.0
11.0
12.0
1.80
1.8
55.0
115.0

African Markets Revealed — January 2012
44 Fixed Income Research
Kenya: let the yield compression games begin
The debate over the new Public Finance Management Bill reiterates graphically the policy confusion in Kenya at present. The Local Government Ministry, led by an ODM member, wants to introduce two bills to parliament, one governing the central government and another for the new counties that will be established under the new con-stitution. On the other hand, the Finance Ministry (PNU) wants a single integrated bill, the passing of which is a structural benchmark set by the IMF under the Extended Credit Facility. Attempts by President Kibaki and Prime Minister Odinga to craft a solution are tied up in the usual partisan politics. Those favouring two PFM Acts believe that it is necessary in order to be aligned with the two-tier system of government that the new constitution will intro-duce and are wary of having county governments subor-dinated to the central government.
GDP growth is slowing, a trend likely to last until H2:12. GDP growth slowed to 3.6% y/y in Q3:11, from 4.3% y/y and 4.6% y/y in Q2:11 and Q1:11 respectively. A notable decline in wholesale and retail trade, to 1.3% y/y in Q3:11, from an average of 4.7% y/y in H1:11 and 7.6% y/y in 2010, illustrates the dampening effect of declining real disposable incomes brought about by the upward spiral in inflation. Consumption spending is likely to re-main under pressure until H2:12, depressed by the high interest rate environment. Investment spending is also likely to remain depressed, especially public investment. The government has been looking to cut spending, squeezed by its inability to raise sufficient domestic bor-rowing. Meanwhile, the trade deficit that has grown sig-nificantly during 2011, to undermine net exports. The negative contribution from net export to growth will de-cline in 2012.
Quarterly indicators
Political risk: decentralisation focus Election results (2007)
GDP growth: slowing Composition of GDP
Sources: National Bureau of Statistics; Standard Bank Research
Source: Electoral Commission of Kenya
Notes: pe — period end; pa — period average Sources: Central Bank of Kenya; Kenya National Bureau of Statistics; Standard Bank Research
Presidential election Party % of votes
Mwai Kibaki PNU 47.1
Raila Amolo Odinga ODM 46.5
Stephen Kalonzo Musyoka ODM-K 5.9
Parliamentary election Seats
Orange Democratic Movement (ODM) 99
Party of National Unity (PNU) 43
Orange Democratic Movement -Kenya (ODM-K) 16
Total 207
Others 0.5
Kenya African National Union (KANU) 14
Q1:10 Q2:10 Q3:10 Q4:10 Q1:11 Q2:11 Q3:11e Q4:11f Q1:12f Q2:12f Q3:12f Q4:12f
GDP (% y/y) pa 4.5 4.6 5.7 7.2 4.9 4.3 3.6 2.8 3.0 3.4 3.7 5.1 CPI (% y/y) pa 4.6 3.7 3.3 3.8 7.0 13.2 16.5 19.2 17.4 13.3 10.0 6.4 M3 (% y/y) pa 22.3 26.2 26.0 21.6 19.6 15.2 19.3 21.3 20.2 21.3 17.9 17.7 CA/GDP (%) pe -6.4 -6.2 -6.7 -8.1 -6.7 -7.4 -7.2 -12.6 -10.2 -10.5 -10.3 -10.1 FX reserves (USD bn) pe 3.7 3.8 4.4 4.3 4.2 4.2 4.0 4.3 4.8 4.9 4.8 5.7 Import cover (months) pe 3.9 3.9 4.5 4.5 3.4 3.4 3.2 3.5 4.3 3.7 3.6 4.3 3-m rate (%) pe 4.9 2.6 2.4 2.3 2.9 9.0 12.5 19.9 16.9 13.1 10.4 6.8 5-y rate (%) pe 8.3 7.0 5.7 5.2 9.0 9.2 13.3 13.8 13.0 12.5 12.3 10.3 USD/KES pe 77.3 81.6 80.8 80.7 83.0 89.3 100.3 85.1 80.3 82.0 82.3 85.0 REER pe 154.4 146.7 148.3 150.6 148.1 142.6 135.7 140.4 143.7 143.1 143.4 142.0 NEER pe 102.9 98.1 99.6 99.9 97.8 93.8 88.8 91.5 93.2 92.3 92.1 90.8
-7.0
-1.5
4.0
9.5
15.0
2002 2004 2006 2008 2010 2012f
y/y
Netex Stocks GFCFGE PCE GDP

45 Fixed Income Research
African Markets Revealed — January 2012
The C/A deficit, which we estimate at 12.6% of GDP in 2011, is likely to fall to 10.1% of GDP in 2012 and 9.7% in 2013 as slowing domestic demand restricts import growth. Financing the large deficit is likely to come mainly from official financial inflows. However, after obtaining approval from the IMF to fast track disbursements from the Extended Credit Facility and to expand the pro-gramme to USD760m, the government has also been negotiating a USD600m loan from foreign commercial banks. Private capital outflows due to the underperform-ing equity market, low yields and the weakening currency in 2011 are likely to be reversed in 2012, giving more attractive equities, high yields and a strengthening/stable currency. FX reserves, at USD4.0bn in Nov 11 (accounting for 3.2 months of goods and services im-ports) are likely to rise beyond 4.0 months by end 2012.
Difficulties in raising domestic funding for the FY11/12 budget prompted the government to rationalise its spend-ing and financing plans. Net of redemptions, the govern-ment raised less than KES12bn from domestic sales of T-bills and T-bonds by 31 Dec 11, far less than half of the KES119.5bn financing planned for domestic issuance in FY11/12 budget. Although the government has looked at cutting low-priority spending, like foreign travel, the more substantial reduction in spending is likely to be achieved by cutting back on capital spending. Furthermore, the government is in the process of borrowing a KES54.0bn (about USD600m) 2-y syndicated loan to substitute do-mestic borrowing at a time of extremely high nominal rates. The loan, if successfully raised, will spare the gov-ernment from having to institute more drastic spending cuts.
Inflation developments in Q1:12 are likely to prompt an easing of monetary policy. Headline inflation started to fall in Dec 11, reaching 18.9% y/y, from 19.7% y/y in Nov. Notably, food inflation declined to 25.0% y/y, from 26.2% y/y. We believe this is the commencement of a disinflationary phase that will see headline inflation de-cline into single digits in Q3:12. In addition to lower food inflation, lower fuel and electricity prices are likely to un-derpin the disinflationary process, as better rainfall condi-tions improve local food supply and hydro-electricity gen-eration. The stronger KES will also help reduce the infla-tionary impact from global food and fuel prices. More-over, domestic demand is likely to slow due to the tight monetary policy stance that has forced commercial banks to raise their base lending rates to a range of 23%-25%. These rates will come down fairly gradually.
Balance of payments: well supported Current account developments
Fiscal policy: re-prioritising expenditure Central government budget
Monetary policy: easing imminent Inflation and interest rates
Sources: Central Bank of Kenya; Standard Bank Research
Source: Kenya Ministry of Finance
Sources: National Bureau of Statistics; Reuters
Kenya
% of GDP 2010/2011 2011/2012
Total revenue 27.6 27.6
Total expenditure 36.9 37.3
wages 8.1 7.6
interest 3.0 2.9
development 12.3 14.0
Overall balance (- grants) -9.3 -9.7
Overall balance (+ grants) -7.5 -8.3
Net external borrowing 2.5 4.1
Net domestic borrowing 5.0 4.2
Donor support (grants and loans) 4.3 5.5
-10,000
-6,000
-2,000
2,000
6,000
2001 2003 2005 2007 2009 2011f 2013f
USD m
Trade Service Income
Tranfers C/A
0.0
6.3
12.5
18.8
25.0
Jan-07 Apr-08 Jul-09 Sep-10 Dec-11
%
CPI y/y 91-day T-bill rate Central bank rate
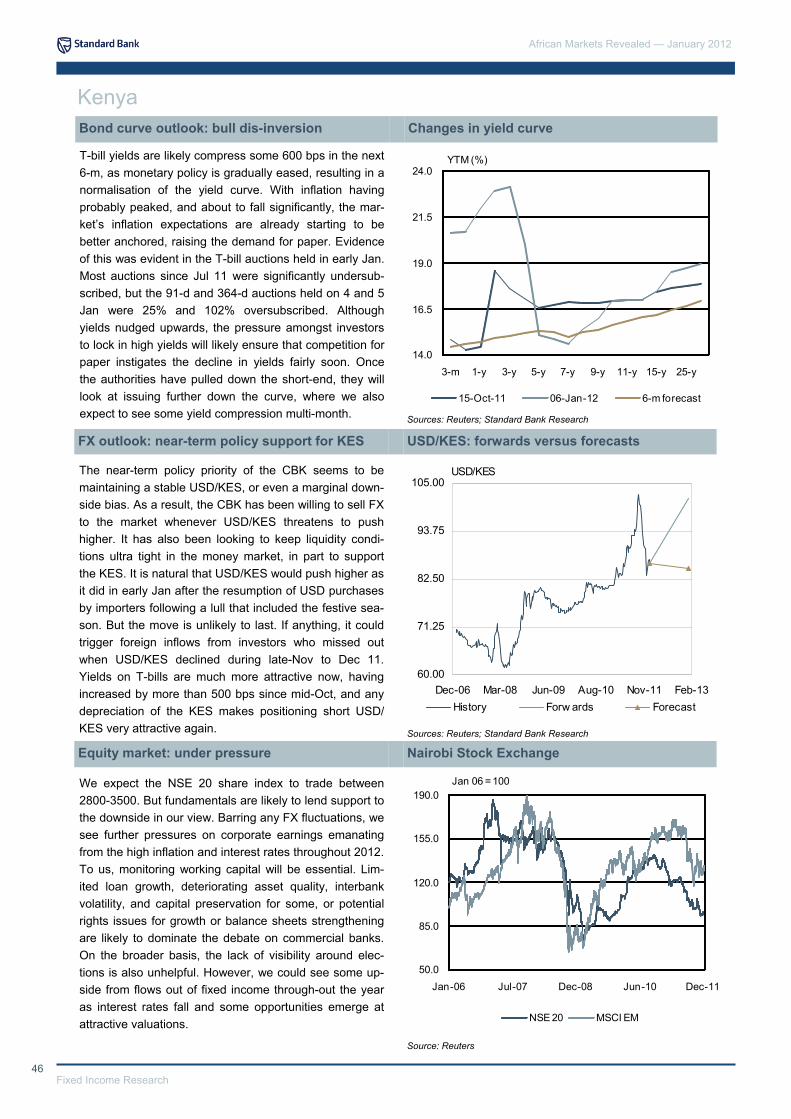
African Markets Revealed — January 2012
46 Fixed Income Research
T-bill yields are likely compress some 600 bps in the next 6-m, as monetary policy is gradually eased, resulting in a normalisation of the yield curve. With inflation having probably peaked, and about to fall significantly, the mar-ket’s inflation expectations are already starting to be better anchored, raising the demand for paper. Evidence of this was evident in the T-bill auctions held in early Jan. Most auctions since Jul 11 were significantly undersub-scribed, but the 91-d and 364-d auctions held on 4 and 5 Jan were 25% and 102% oversubscribed. Although yields nudged upwards, the pressure amongst investors to lock in high yields will likely ensure that competition for paper instigates the decline in yields fairly soon. Once the authorities have pulled down the short-end, they will look at issuing further down the curve, where we also expect to see some yield compression multi-month.
The near-term policy priority of the CBK seems to be maintaining a stable USD/KES, or even a marginal down-side bias. As a result, the CBK has been willing to sell FX to the market whenever USD/KES threatens to push higher. It has also been looking to keep liquidity condi-tions ultra tight in the money market, in part to support the KES. It is natural that USD/KES would push higher as it did in early Jan after the resumption of USD purchases by importers following a lull that included the festive sea-son. But the move is unlikely to last. If anything, it could trigger foreign inflows from investors who missed out when USD/KES declined during late-Nov to Dec 11. Yields on T-bills are much more attractive now, having increased by more than 500 bps since mid-Oct, and any depreciation of the KES makes positioning short USD/KES very attractive again.
We expect the NSE 20 share index to trade between 2800-3500. But fundamentals are likely to lend support to the downside in our view. Barring any FX fluctuations, we see further pressures on corporate earnings emanating from the high inflation and interest rates throughout 2012. To us, monitoring working capital will be essential. Lim-ited loan growth, deteriorating asset quality, interbank volatility, and capital preservation for some, or potential rights issues for growth or balance sheets strengthening are likely to dominate the debate on commercial banks. On the broader basis, the lack of visibility around elec-tions is also unhelpful. However, we could see some up-side from flows out of fixed income through-out the year as interest rates fall and some opportunities emerge at attractive valuations.
Bond curve outlook: bull dis-inversion Changes in yield curve
FX outlook: near-term policy support for KES USD/KES: forwards versus forecasts
Equity market: under pressure Nairobi Stock Exchange
Sources: Reuters; Standard Bank Research
Sources: Reuters; Standard Bank Research
Source: Reuters
Kenya
14.0
16.5
19.0
21.5
24.0
3-m 1-y 3-y 5-y 7-y 9-y 11-y 15-y 25-y
YTM (%)
15-Oct-11 06-Jan-12 6-m forecast
50.0
85.0
120.0
155.0
190.0
Jan-06 Jul-07 Dec-08 Jun-10 Dec-11
Jan 06 = 100
NSE 20 MSCI EM
60.00
71.25
82.50
93.75
105.00
Dec-06 Mar-08 Jun-09 Aug-10 Nov-11 Feb-13
USD/KES
History Forw ards Forecast

47 Fixed Income Research
African Markets Revealed — January 2012
Kenya: annual indicators
Notes: pe — period end; pa — period average, nr — not rated; na — not available
Sources: Central Bank of Kenya; Kenya National Bureau of Statistics; Standard Bank Research
Kenya
2007 2008 2009 2010 2011e 2012f
Output Population (million) 37.2 38.3 39.4 40.5 41.4 42.2
Nominal GDP (KESbn) 1,829 2,077 2,274 2,485 2,823 3,214
Nominal GDP (USDbn) 27.3 29.5 29.5 31.6 31.7 39.0
GDP / capita (USD) 734 770 748 779 765 925
Real GDP growth (%) 7.0 1.6 2.6 5.6 3.9 3.8
Coffee production ('000 tons) 52.2 38.7 54.0 42.0 51.0 58.0
Tea production ('000 kgs) 369.3 345.6 314.1 398.5 375.1 414.0
Central Government Operations Budget balance (excl. Grants) / GDP (%) -5.2 -4.8 -6.7 -4.6 -9.3 -9.7
Domestic debt / GDP (%) 23.6 21.2 23.3 26.8 26.5 25.8
External debt / GDP (%) 23.1 21.6 24.2 23.2 23.6 25.2
Balance Of Payments
Exports (USDbn) 4.1 5.0 4.5 5.2 6.2 7.4
Imports (USDbn) 8.4 10.7 9.5 11.6 14.8 15.9
Trade balance (USDbn) -4.3 -5.6 -5.0 -6.4 -8.6 -8.5
Current account (USDbn) -1.0 -2.0 -1.7 -2.6 -4.0 -3.9
- % of GDP -3.78 -6.72 -5.64 -8.08 -12.58 -10.09
Financial account (USDbn) 2.23 1.17 2.59 2.38 3.95 5.08
- FDI (USDbn) 0.73 0.10 0.12 0.19 0.30 0.39
Basic balance / GDP (%) -1.11 -6.39 -5.23 -7.49 -11.64 -9.09
FX reserves (USDbn) pe 3.40 2.88 3.85 4.32 4.29 5.68
- Import cover (mths) pe 4.9 3.2 4.9 4.5 3.5 4.3
Sovereign Credit Rating
S&P B+ B B+ B+ B+ B+
Moody’s nr nr nr nr nr nr
Fitch B+ B+ B+ B+ B+ B+
Monetary & Financial Indicators
Consumer inflation (%) pa 9.8 16.2 9.4 3.9 14.0 11.8
Consumer inflation (%) pe 12.0 17.8 5.4 4.5 18.9 5.5
M3 money supply (% y/y) pa 18.1 20.0 12.9 23.1 19.0 19.9
M3 money supply (% y/y) pe 18.1 15.9 16.0 21.6 21.3 17.7
Policy interest rate (%) pa 8.5 8.9 7.9 6.4 8.4 12.7
Policy interest rate (%) pe 8.8 8.5 7.0 6.0 18.0 7.0
3-m rate (%) pe 6.9 9.0 6.6 2.3 19.9 6.8
1-y rate (%) pe 8.5 8.8 8.0 3.1 21.0 7.8
2-y rate (%) pe 9.2 9.8 8.5 3.4 22.3 8.4
5-y rate (%) pe 9.9 10.5 9.9 5.2 13.8 10.3
USD/KES pa 67.0 70.4 77.2 78.7 89.1 82.3
USD/KES pe 63.8 79.5 75.7 80.7 85.1 85.0
REER pa 135.3 156.6 158.4 151.6 144.7 143.8
NEER pa 117.0 116.1 104.3 101.1 94.4 92.8
Budget balance (incl. Grants) / GDP (%) -3.9 -4.0 -5.3 -3.1 -7.5 -8.3
2013f
43.1
3,627
41.7
967
6.7
61.0
433.0
-6.6
-5.1
26.2
25.1
8.5
17.9
-9.4
-4.1
-9.74
4.85
0.43
-8.70
6.62
4.4
B+
nr
B+
5.0
5.3
19.4
21.3
6.2
6.0
5.5
6.3
8.1
9.9
87.1
87.8
147.4
90.5

African Markets Revealed — January 2012
48 Fixed Income Research
Malawi: subdued outlook for the economy
The widespread civil unrest, which started in Jul 11, has ended, but many of the causes remain in place. Riots were sparked by fuel and electricity shortages, poor gov-ernance, economic mismanagement, restrictions on free-dom of the press and citizens’ rights to seek injunctions against the government and allegations of high-level gov-ernment corruption. The violent suppression of the upris-ing by government forces, in which an estimated 19 per-sons were killed and more than 250 arrested, will have a strong bearing on the political landscape up to the next election due in May 2014, when President Mutharika’s term of office also expires. The political stresses are in-tensified by the general economic hardship. The scaling back of the Farm Input Subsidy Programme (FISP) is likely to erode the ruling party’s mainly rural support base.
We expect real GDP growth to drop to about 6.0% y/y in 2012, from an estimated 6.9% y/y in 2011. The govern-ment will need to scale back its successful FISP, due to fiscal constraints and the devaluation of the MWK, which will drive input prices, mainly seed and fertilizer prices, higher agricultural and lower food production. Tobacco earnings fell by 38% y/y, to USD249.8m in 2011, but could recover in 2012 if production rises and tobacco prices improve. PCE, with an estimated share of 86% in GDP, will be negatively impacted by lower agricultural production. GFCF and GCE are likely to drop as donors continue to withhold budget and other financial support. Net exports are likely to continue detracting from overall GDP growth as import costs will rise steeply from a weaker MWK and relatively high commodity prices.
Quarterly indicators
Political risk: political tensions remain 2009 election results
GDP growth: lower output growth expected Composition of GDP
Notes: pe — period end; pa — period average; na — not available Sources: Reserve Bank of Malawi; National Statistical Office; IMF; Standard Bank Research
Presidential election Party % of votes
Bingu wa Mutharika DPP 66.0
John Tembo MCP 30.7
Walter Chibambo PETRA 0.8
Parliamentary election Seats
Democratic Progressive Party (DPP) 114
Malawi Congress Party (MCP) 26
United Democratic Front (UDF) 17
Total 193
Stanley Masauli RP 0.8
Others - mainly independents (32) 37
Sources: National Statistics Office; IMF; Standard Bank Research
Q1:10 Q2:10 Q3:10 Q4:10 Q1:11 Q2:11 Q3:11e Q4:11f Q1:12f Q2:12f Q3:12f Q4:12f
GDP (% y/y) pa 7.7 6.2 6.9 6.0 6.0 6.8 6.9 7.9 7.0 7.2 6.8 3.0 CPI (% y/y) pa 8.1 7.8 7.2 6.5 6.9 7.1 7.6 8.5 8.3 7.9 7.8 7.6 M2 (% y/y) pa 17.4 16.0 9.5 14.9 21.8 28.1 34.6 29.6 30.0 30.0 32.0 32.0 CA/GDP (%) pe -19.0 -20.5 -19.8 -20.7 -20.7 -22.2 -21.5 -22.4 -22.2 -23.7 -23.0 -23.9 FX reserves (USD bn) pe 0.21 0.25 0.28 0.37 0.27 0.32 0.41 0.39 0.39 0.39 0.39 0.39 Import cover (months) pe 2.2 2.3 2.4 2.7 2.0 2.2 2.2 2.4 2.0 2.0 2.0 2.0 3-m rate (%) pe 7.3 7.2 7.1 6.2 6.3 7.3 5.1 6.8 6.8 6.7 6.7 6.7 3-y rate (%) pe 17.3 17.3 17.3 17.3 17.3 15.0 15.0 15.0 15.0 15.0 15.0 15.0 USD/MWK pe 150.8 150.8 151.6 152.3 151.9 151.8 165.0 165.0 165.0 165.0 185.0 185.0 REER pe 107.5 110.0 107.9 106.8 107.2 107.2 100.0 100.0 100.0 100.0 95.0 95.0 NEER pe 93.2 95.4 92.8 91.5 90.3 89.8 85.0 85.0 85.0 85.0 80.0 80.0
Source: Malawi Electoral Commission
-15.00
-6.25
2.50
11.25
20.00
2007 2008 2009 2010 2011 2012 2013
%
PCE GCE GFCFStocks NetEx GDP

49 Fixed Income Research
African Markets Revealed — January 2012
Sources: IMF; Malawi Ministry of Finance
Imports are likely to rise at a quicker pace than exports over the coming 6-m period. We expect the C/A deficit to amount to about 21.7% of GDP in 2011 and rise to 23.2% of GDP in 2012, compared to 20.0% in 2010. The devaluation of the MWK in Aug 11 will likely drive import costs higher, particularly of fuel, medical supplies, fertil-izer and seed. Another MWK devaluation cannot be ruled out in 2012, which would have a similarly negative impact on import costs. Tobacco export earnings may recover in 2012. Uranium earnings are expected to disappoint as uranium prices have dropped to about USD52/lb. Sugar production may be boosted by high prices. Government transfers, which have risen steeply in recent years, are expected to rise but at a slower pace. FX reserves, which amounted to USD393.6m in Oct 11, are likely to remain at current levels over the coming year.
Donor support is unlikely to return to previous levels in the near term as Malawi is still in breach of the IMF’s Extended Credit Facility (ECF), which requires a market-clearing exchange rate. Donors are only likely to resume budget support if relations with the IMF are normalised. Donor support funded about a third of total expenditure over the past few years. The IMF visited Malawi in Dec 11, but the outcome of the talks is not yet known. The UK and Malawi governments have not yet resolved the diplo-matic quarrel and budget support from the UK, Malawi’s largest donor, has not resumed. The recent budget aimed at self-financing and thus had to cut back on gov-ernment spending, particularly on infrastructure invest-ment, which will hamper economic growth in the longer term. RBM data shows that the fiscal balance posted a surplus of 2.5% of GDP in Q2:11.
We expect inflation to rise to an average of 7.9% y/y in 2012, from an estimated 7.5% y/y in 2011. The increase in headline inflation is likely to be partly driven by the 2012 fuel price increases announced in Nov 11. Addition-ally, the devaluation of the MWK in Aug 11 by 10% and the introduction of VAT on some previously-exempt goods are likely to pass through to headline inflation. A further devaluation would exacerbate existing price pres-sures. Food inflation, the main inflation driver with a 58.1% weight in the CPI, will exert upward pressure on headline inflation with the scaling back of the FISP and lower agricultural output. Hitherto, the FISP has sup-ported domestic food production and kept food prices at benign levels. The monetary authorities are likely to keep the bank rate at 13%, unchanged since Aug 10.
Balance of payments: deficits ahead Current account developments
Fiscal policy: IMF and donors on the sidelines Central government budget
Monetary policy: inflation likely to rise Inflation and interest rates
Sources: IMF; RBM; Standard Bank Research
Sources: National Statistical Office; RBM
% of GDP 2010/11 2011/12
Total revenue 37.5 35.2
Total expenditure 40.5 34.8
- recurrent 29.1 26.8
- development 11.1 7.9
Overall balance (- grants) -14.3 -7.0
Overall balance (+ grants) -3.0 0.4
Net external borrowing 23.3 24.7
Net domestic borrowing 11.1 7.1
Donor support (grants) 11.3 7.4
Malawi
-1,500
-1,050
-600
-150
300
2007 2008 2009 2010 2011e 2012f 2013f
USDm
Trade Services Income
Transfers C/A
0.0
7.5
15.0
22.5
30.0
Jan-05 Oct-06 Jul-08 Apr-10 Jan-12
%
Bank rate 91-d T-bill Inflation
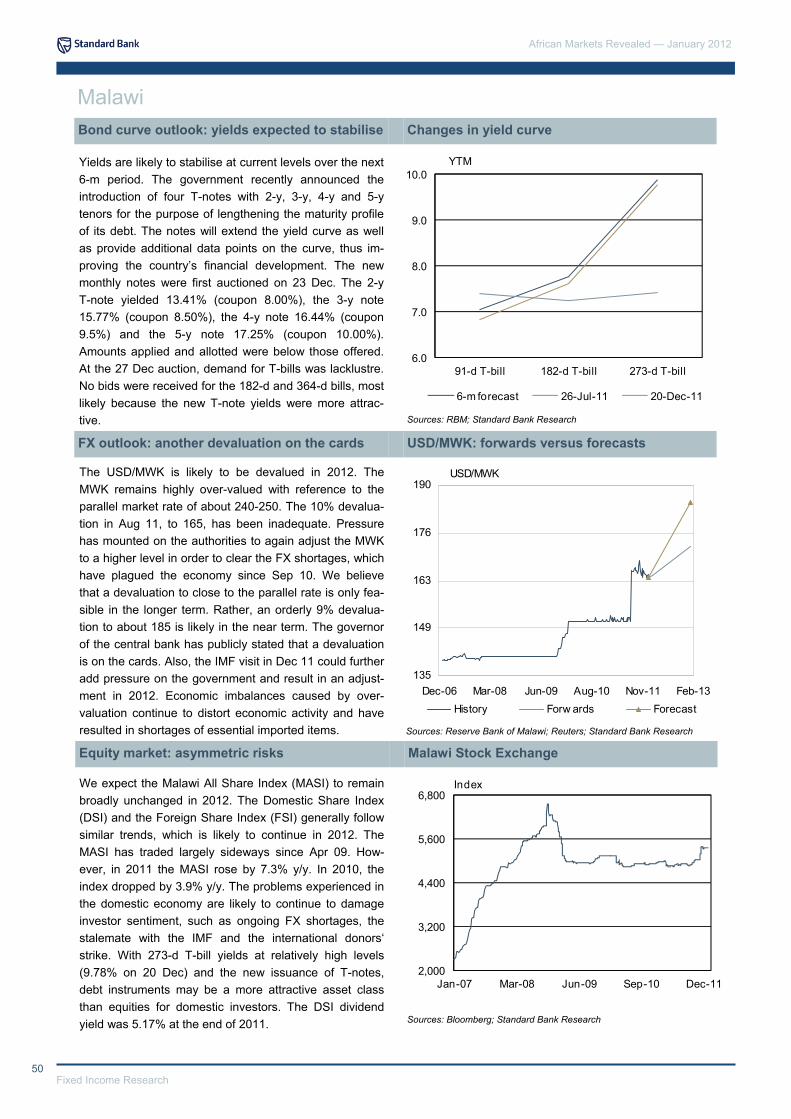
African Markets Revealed — January 2012
50 Fixed Income Research
Sources: RBM; Standard Bank Research
Yields are likely to stabilise at current levels over the next 6-m period. The government recently announced the introduction of four T-notes with 2-y, 3-y, 4-y and 5-y tenors for the purpose of lengthening the maturity profile of its debt. The notes will extend the yield curve as well as provide additional data points on the curve, thus im-proving the country’s financial development. The new monthly notes were first auctioned on 23 Dec. The 2-y T-note yielded 13.41% (coupon 8.00%), the 3-y note 15.77% (coupon 8.50%), the 4-y note 16.44% (coupon 9.5%) and the 5-y note 17.25% (coupon 10.00%). Amounts applied and allotted were below those offered. At the 27 Dec auction, demand for T-bills was lacklustre. No bids were received for the 182-d and 364-d bills, most likely because the new T-note yields were more attrac-tive.
The USD/MWK is likely to be devalued in 2012. The MWK remains highly over-valued with reference to the parallel market rate of about 240-250. The 10% devalua-tion in Aug 11, to 165, has been inadequate. Pressure has mounted on the authorities to again adjust the MWK to a higher level in order to clear the FX shortages, which have plagued the economy since Sep 10. We believe that a devaluation to close to the parallel rate is only fea-sible in the longer term. Rather, an orderly 9% devalua-tion to about 185 is likely in the near term. The governor of the central bank has publicly stated that a devaluation is on the cards. Also, the IMF visit in Dec 11 could further add pressure on the government and result in an adjust-ment in 2012. Economic imbalances caused by over-valuation continue to distort economic activity and have resulted in shortages of essential imported items.
We expect the Malawi All Share Index (MASI) to remain broadly unchanged in 2012. The Domestic Share Index (DSI) and the Foreign Share Index (FSI) generally follow similar trends, which is likely to continue in 2012. The MASI has traded largely sideways since Apr 09. How-ever, in 2011 the MASI rose by 7.3% y/y. In 2010, the index dropped by 3.9% y/y. The problems experienced in the domestic economy are likely to continue to damage investor sentiment, such as ongoing FX shortages, the stalemate with the IMF and the international donors‘ strike. With 273-d T-bill yields at relatively high levels (9.78% on 20 Dec) and the new issuance of T-notes, debt instruments may be a more attractive asset class than equities for domestic investors. The DSI dividend yield was 5.17% at the end of 2011.
Bond curve outlook: yields expected to stabilise Changes in yield curve
FX outlook: another devaluation on the cards USD/MWK: forwards versus forecasts
Equity market: asymmetric risks Malawi Stock Exchange Sources: Reserve Bank of Malawi; Reuters; Standard Bank Research
Sources: Bloomberg; Standard Bank Research
Malawi
6.0
7.0
8.0
9.0
10.0
91-d T-bill 182-d T-bill 273-d T-bill
YTM
6-m forecast 26-Jul-11 20-Dec-11
2,000
3,200
4,400
5,600
6,800
Jan-07 Mar-08 Jun-09 Sep-10 Dec-11
Index
135
149
163
176
190
Dec-06 Mar-08 Jun-09 Aug-10 Nov-11 Feb-13
USD/MWK
History Forw ards Forecast
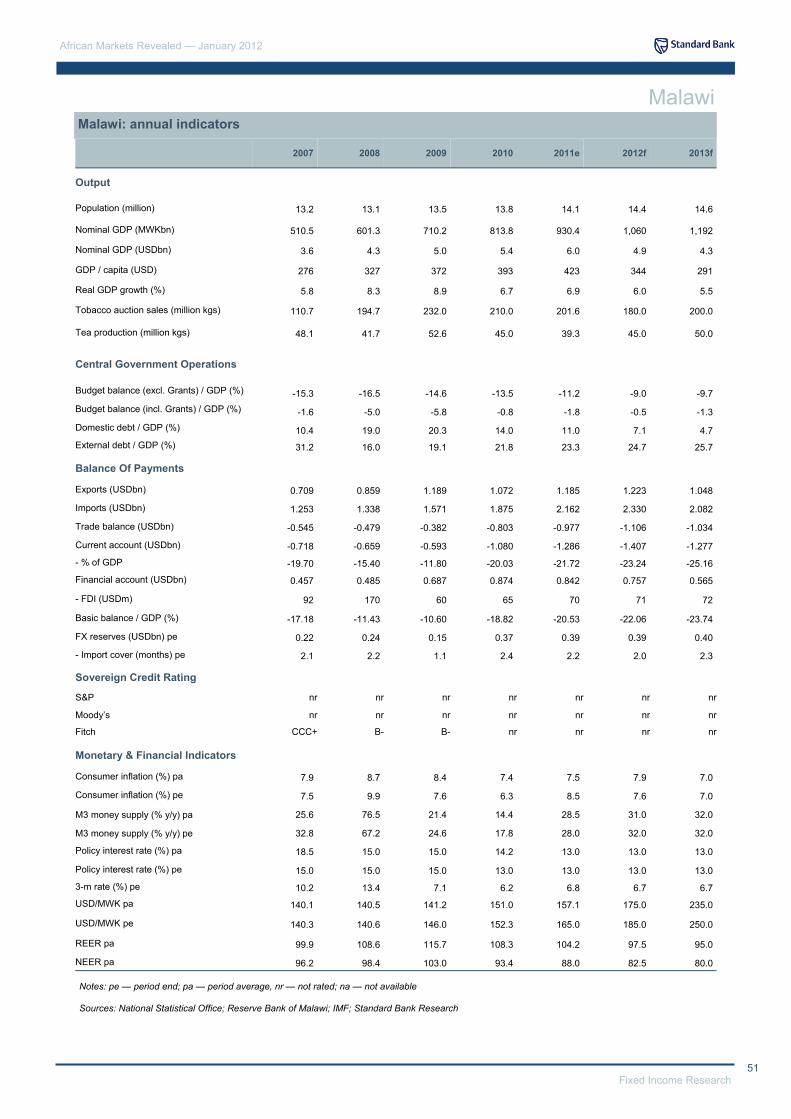
51 Fixed Income Research
African Markets Revealed — January 2012
Malawi: annual indicators
2007 2008 2009 2010 2011e 2012f
Output
Population (million) 13.2 13.1 13.5 13.8 14.1 14.4
Nominal GDP (MWKbn) 510.5 601.3 710.2 813.8 930.4 1,060
Nominal GDP (USDbn) 3.6 4.3 5.0 5.4 6.0 4.9
GDP / capita (USD) 276 327 372 393 423 344
Real GDP growth (%) 5.8 8.3 8.9 6.7 6.9 6.0
Tobacco auction sales (million kgs) 110.7 194.7 232.0 210.0 201.6 180.0
Tea production (million kgs) 48.1 41.7 52.6 45.0 39.3 45.0
Central Government Operations
Budget balance (excl. Grants) / GDP (%) -15.3 -16.5 -14.6 -13.5 -11.2 -9.0 Budget balance (incl. Grants) / GDP (%) -1.6 -5.0 -5.8 -0.8 -1.8 -0.5 Domestic debt / GDP (%) 10.4 19.0 20.3 14.0 11.0 7.1 External debt / GDP (%) 31.2 16.0 19.1 21.8 23.3 24.7
Balance Of Payments
Exports (USDbn) 0.709 0.859 1.189 1.072 1.185 1.223
Imports (USDbn) 1.253 1.338 1.571 1.875 2.162 2.330
Trade balance (USDbn) -0.545 -0.479 -0.382 -0.803 -0.977 -1.106
Current account (USDbn) -0.718 -0.659 -0.593 -1.080 -1.286 -1.407
- % of GDP -19.70 -15.40 -11.80 -20.03 -21.72 -23.24
Financial account (USDbn) 0.457 0.485 0.687 0.874 0.842 0.757
- FDI (USDm) 92 170 60 65 70 71
Basic balance / GDP (%) -17.18 -11.43 -10.60 -18.82 -20.53 -22.06
FX reserves (USDbn) pe 0.22 0.24 0.15 0.37 0.39 0.39
- Import cover (months) pe 2.1 2.2 1.1 2.4 2.2 2.0
Sovereign Credit Rating
S&P nr nr nr nr nr nr
Moody’s nr nr nr nr nr nr
Fitch CCC+ B- B- nr nr nr
Monetary & Financial Indicators
Consumer inflation (%) pa 7.9 8.7 8.4 7.4 7.5 7.9
Consumer inflation (%) pe 7.5 9.9 7.6 6.3 8.5 7.6
M3 money supply (% y/y) pa 25.6 76.5 21.4 14.4 28.5 31.0
M3 money supply (% y/y) pe 32.8 67.2 24.6 17.8 28.0 32.0
Policy interest rate (%) pa 18.5 15.0 15.0 14.2 13.0 13.0
Policy interest rate (%) pe 15.0 15.0 15.0 13.0 13.0 13.0
3-m rate (%) pe 10.2 13.4 7.1 6.2 6.8 6.7
USD/MWK pa 140.1 140.5 141.2 151.0 157.1 175.0
USD/MWK pe 140.3 140.6 146.0 152.3 165.0 185.0
REER pa 99.9 108.6 115.7 108.3 104.2 97.5
NEER pa 96.2 98.4 103.0 93.4 88.0 82.5
2013f
14.6
1,192
4.3
291
5.5
200.0
50.0
-9.7
-1.3
4.7
25.7
1.048
2.082
-1.034
-1.277
-25.16
0.565
72
-23.74
0.40
2.3
nr
nr
nr
7.0
7.0
32.0
32.0
13.0
13.0
6.7
235.0
250.0
95.0
80.0
Notes: pe — period end; pa — period average, nr — not rated; na — not available
Sources: National Statistical Office; Reserve Bank of Malawi; IMF; Standard Bank Research
Malawi
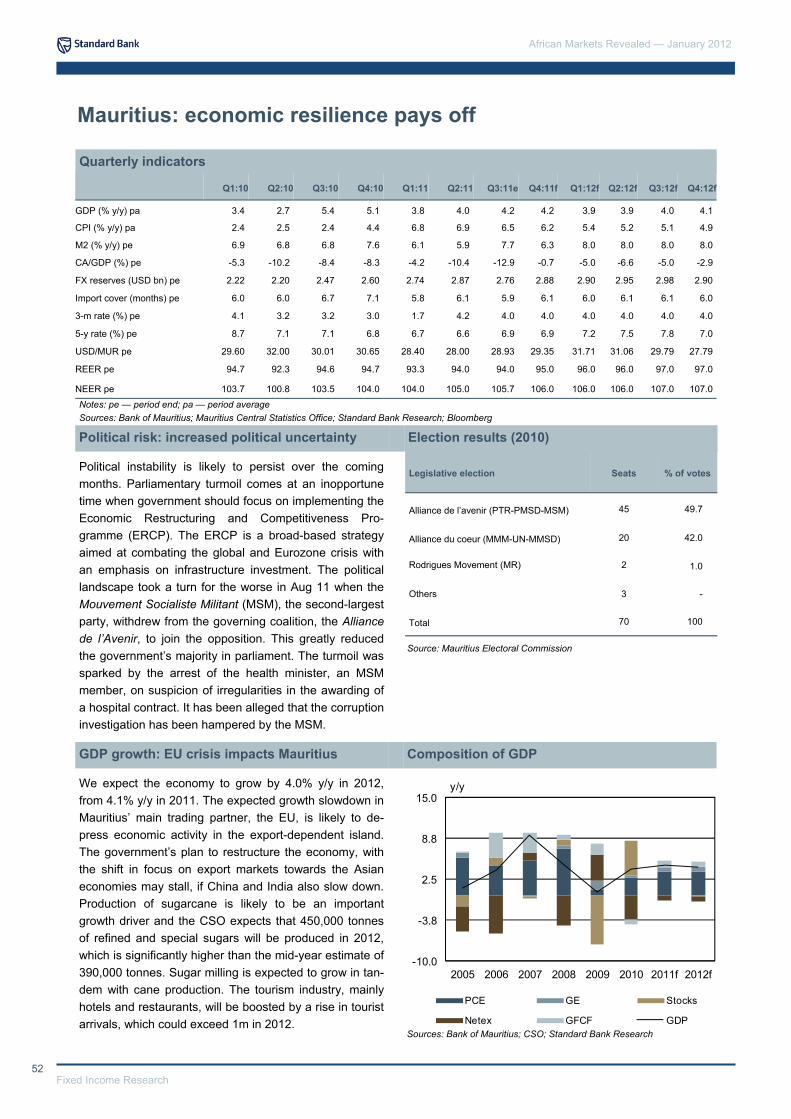
African Markets Revealed — January 2012
52 Fixed Income Research
Mauritius: economic resilience pays off
Political instability is likely to persist over the coming months. Parliamentary turmoil comes at an inopportune time when government should focus on implementing the Economic Restructuring and Competitiveness Pro-gramme (ERCP). The ERCP is a broad-based strategy aimed at combating the global and Eurozone crisis with an emphasis on infrastructure investment. The political landscape took a turn for the worse in Aug 11 when the Mouvement Socialiste Militant (MSM), the second-largest party, withdrew from the governing coalition, the Alliance de l’Avenir, to join the opposition. This greatly reduced the government’s majority in parliament. The turmoil was sparked by the arrest of the health minister, an MSM member, on suspicion of irregularities in the awarding of a hospital contract. It has been alleged that the corruption investigation has been hampered by the MSM.
We expect the economy to grow by 4.0% y/y in 2012, from 4.1% y/y in 2011. The expected growth slowdown in Mauritius’ main trading partner, the EU, is likely to de-press economic activity in the export-dependent island. The government’s plan to restructure the economy, with the shift in focus on export markets towards the Asian economies may stall, if China and India also slow down. Production of sugarcane is likely to be an important growth driver and the CSO expects that 450,000 tonnes of refined and special sugars will be produced in 2012, which is significantly higher than the mid-year estimate of 390,000 tonnes. Sugar milling is expected to grow in tan-dem with cane production. The tourism industry, mainly hotels and restaurants, will be boosted by a rise in tourist arrivals, which could exceed 1m in 2012.
Quarterly indicators
Political risk: increased political uncertainty Election results (2010)
GDP growth: EU crisis impacts Mauritius Composition of GDP
Notes: pe — period end; pa — period average Sources: Bank of Mauritius; Mauritius Central Statistics Office; Standard Bank Research; Bloomberg
Sources: Bank of Mauritius; CSO; Standard Bank Research
Legislative election Seats % of votes
Alliance de l’avenir (PTR-PMSD-MSM) 45 49.7
Alliance du coeur (MMM-UN-MMSD) 20 42.0
Rodrigues Movement (MR) 2 1.0
Others 3 -
Total 70 100
Source: Mauritius Electoral Commission
Q1:10 Q2:10 Q3:10 Q4:10 Q1:11 Q2:11 Q3:11e Q4:11f Q1:12f Q2:12f Q3:12f Q4:12f
GDP (% y/y) pa 3.4 2.7 5.4 5.1 3.8 4.0 4.2 4.2 3.9 3.9 4.0 4.1
CPI (% y/y) pa 2.4 2.5 2.4 4.4 6.8 6.9 6.5 6.2 5.4 5.2 5.1 4.9
M2 (% y/y) pe 6.9 6.8 6.8 7.6 6.1 5.9 7.7 6.3 8.0 8.0 8.0 8.0
CA/GDP (%) pe -5.3 -10.2 -8.4 -8.3 -4.2 -10.4 -12.9 -0.7 -5.0 -6.6 -5.0 -2.9
FX reserves (USD bn) pe 2.22 2.20 2.47 2.60 2.74 2.87 2.76 2.88 2.90 2.95 2.98 2.90
Import cover (months) pe 6.0 6.0 6.7 7.1 5.8 6.1 5.9 6.1 6.0 6.1 6.1 6.0
3-m rate (%) pe 4.1 3.2 3.2 3.0 1.7 4.2 4.0 4.0 4.0 4.0 4.0 4.0
5-y rate (%) pe 8.7 7.1 7.1 6.8 6.7 6.6 6.9 6.9 7.2 7.5 7.8 7.0
USD/MUR pe 29.60 32.00 30.01 30.65 28.40 28.00 28.93 29.35 31.71 31.06 29.79 27.79
REER pe 94.7 92.3 94.6 94.7 93.3 94.0 94.0 95.0 96.0 96.0 97.0 97.0
NEER pe 103.7 100.8 103.5 104.0 104.0 105.0 105.7 106.0 106.0 106.0 107.0 107.0
-10.0
-3.8
2.5
8.8
15.0
2005 2006 2007 2008 2009 2010 2011f 2012f
y/y
PCE GE Stocks
Netex GFCF GDP
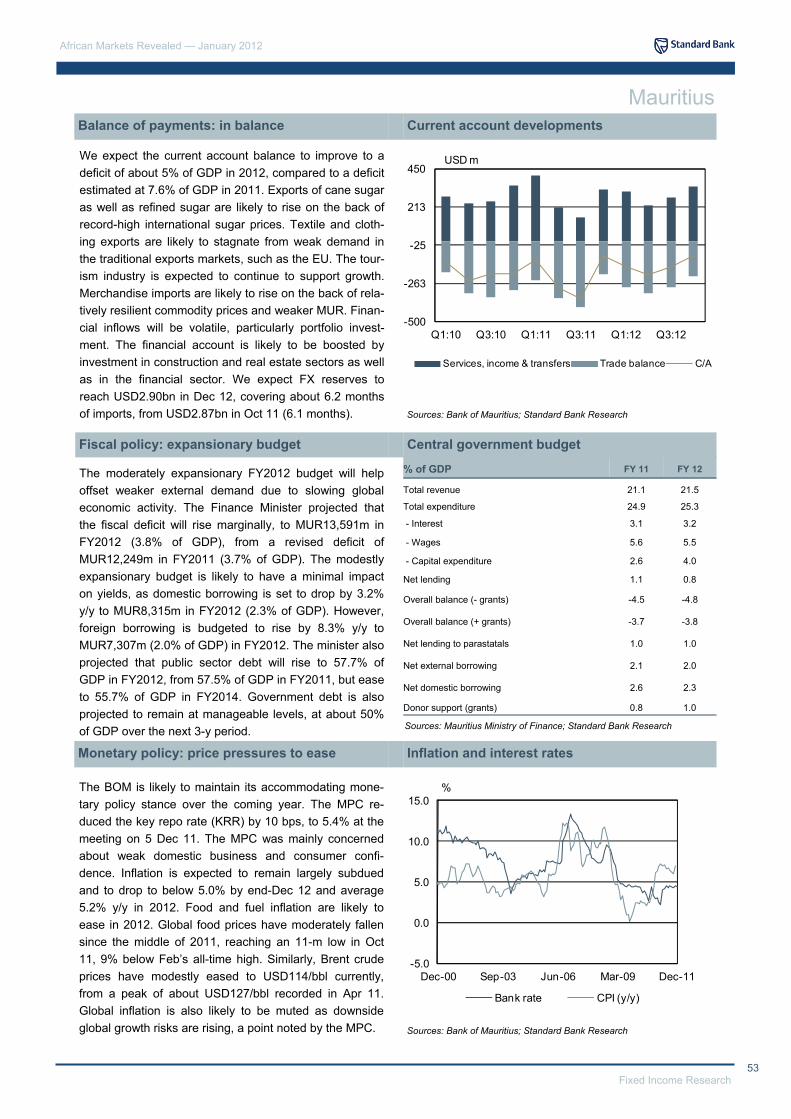
53 Fixed Income Research
African Markets Revealed — January 2012
We expect the current account balance to improve to a deficit of about 5% of GDP in 2012, compared to a deficit estimated at 7.6% of GDP in 2011. Exports of cane sugar as well as refined sugar are likely to rise on the back of record-high international sugar prices. Textile and cloth-ing exports are likely to stagnate from weak demand in the traditional exports markets, such as the EU. The tour-ism industry is expected to continue to support growth. Merchandise imports are likely to rise on the back of rela-tively resilient commodity prices and weaker MUR. Finan-cial inflows will be volatile, particularly portfolio invest-ment. The financial account is likely to be boosted by investment in construction and real estate sectors as well as in the financial sector. We expect FX reserves to reach USD2.90bn in Dec 12, covering about 6.2 months of imports, from USD2.87bn in Oct 11 (6.1 months).
The moderately expansionary FY2012 budget will help offset weaker external demand due to slowing global economic activity. The Finance Minister projected that the fiscal deficit will rise marginally, to MUR13,591m in FY2012 (3.8% of GDP), from a revised deficit of MUR12,249m in FY2011 (3.7% of GDP). The modestly expansionary budget is likely to have a minimal impact on yields, as domestic borrowing is set to drop by 3.2% y/y to MUR8,315m in FY2012 (2.3% of GDP). However, foreign borrowing is budgeted to rise by 8.3% y/y to MUR7,307m (2.0% of GDP) in FY2012. The minister also projected that public sector debt will rise to 57.7% of GDP in FY2012, from 57.5% of GDP in FY2011, but ease to 55.7% of GDP in FY2014. Government debt is also projected to remain at manageable levels, at about 50% of GDP over the next 3-y period.
The BOM is likely to maintain its accommodating mone-tary policy stance over the coming year. The MPC re-duced the key repo rate (KRR) by 10 bps, to 5.4% at the meeting on 5 Dec 11. The MPC was mainly concerned about weak domestic business and consumer confi-dence. Inflation is expected to remain largely subdued and to drop to below 5.0% by end-Dec 12 and average 5.2% y/y in 2012. Food and fuel inflation are likely to ease in 2012. Global food prices have moderately fallen since the middle of 2011, reaching an 11-m low in Oct 11, 9% below Feb’s all-time high. Similarly, Brent crude prices have modestly eased to USD114/bbl currently, from a peak of about USD127/bbl recorded in Apr 11. Global inflation is also likely to be muted as downside global growth risks are rising, a point noted by the MPC.
Balance of payments: in balance Current account developments
Fiscal policy: expansionary budget Central government budget
Monetary policy: price pressures to ease Inflation and interest rates
Sources: Bank of Mauritius; Standard Bank Research
Sources: Mauritius Ministry of Finance; Standard Bank Research
Sources: Bank of Mauritius; Standard Bank Research
Mauritius
% of GDP FY 11 FY 12
Total revenue 21.1 21.5
Total expenditure 24.9 25.3
- Interest 3.1 3.2
- Wages 5.6 5.5
- Capital expenditure 2.6 4.0
Net lending 1.1 0.8
Overall balance (- grants) -4.5 -4.8
Overall balance (+ grants) -3.7 -3.8
Net lending to parastatals 1.0 1.0
Net external borrowing 2.1 2.0
Net domestic borrowing 2.6 2.3
Donor support (grants) 0.8 1.0
-500
-263
-25
213
450
Q1:10 Q3:10 Q1:11 Q3:11 Q1:12 Q3:12
USD m
Services, income & transfers Trade balance C/A
-5.0
0.0
5.0
10.0
15.0
Dec-00 Sep-03 Jun-06 Mar-09 Dec-11
%
Bank rate CPI (y/y)
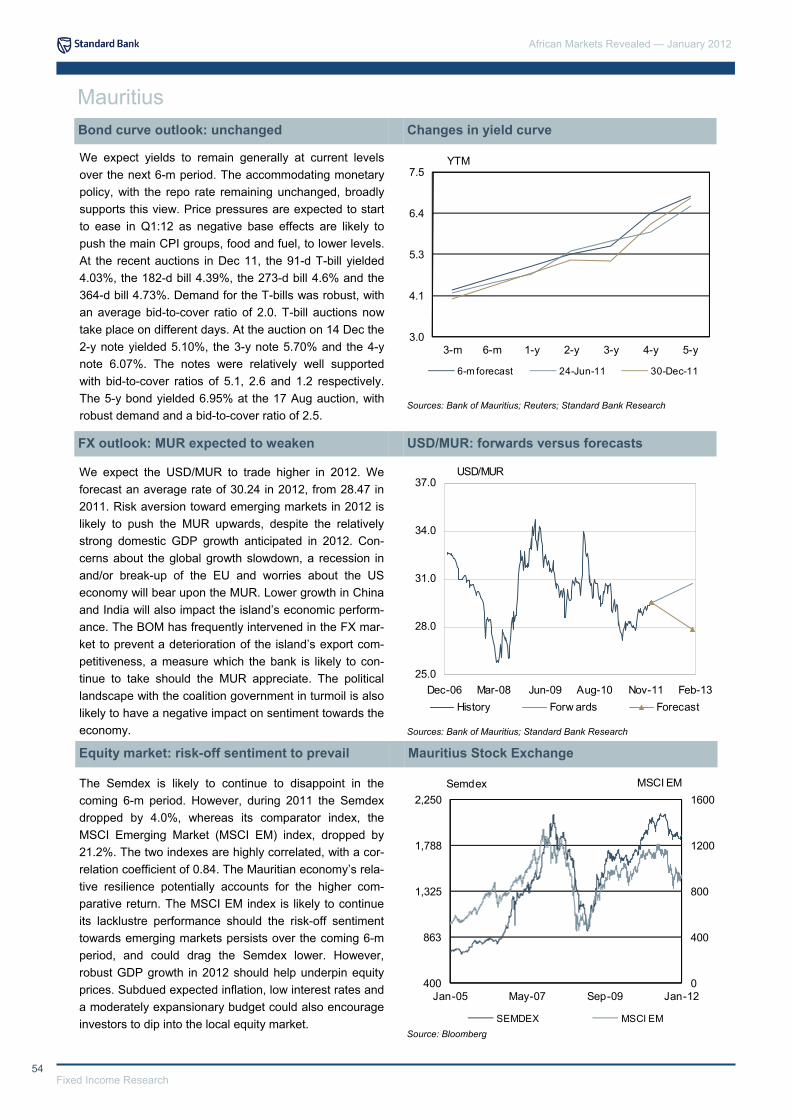
African Markets Revealed — January 2012
54 Fixed Income Research
We expect yields to remain generally at current levels over the next 6-m period. The accommodating monetary policy, with the repo rate remaining unchanged, broadly supports this view. Price pressures are expected to start to ease in Q1:12 as negative base effects are likely to push the main CPI groups, food and fuel, to lower levels. At the recent auctions in Dec 11, the 91-d T-bill yielded 4.03%, the 182-d bill 4.39%, the 273-d bill 4.6% and the 364-d bill 4.73%. Demand for the T-bills was robust, with an average bid-to-cover ratio of 2.0. T-bill auctions now take place on different days. At the auction on 14 Dec the 2-y note yielded 5.10%, the 3-y note 5.70% and the 4-y note 6.07%. The notes were relatively well supported with bid-to-cover ratios of 5.1, 2.6 and 1.2 respectively. The 5-y bond yielded 6.95% at the 17 Aug auction, with robust demand and a bid-to-cover ratio of 2.5.
We expect the USD/MUR to trade higher in 2012. We forecast an average rate of 30.24 in 2012, from 28.47 in 2011. Risk aversion toward emerging markets in 2012 is likely to push the MUR upwards, despite the relatively strong domestic GDP growth anticipated in 2012. Con-cerns about the global growth slowdown, a recession in and/or break-up of the EU and worries about the US economy will bear upon the MUR. Lower growth in China and India will also impact the island’s economic perform-ance. The BOM has frequently intervened in the FX mar-ket to prevent a deterioration of the island’s export com-petitiveness, a measure which the bank is likely to con-tinue to take should the MUR appreciate. The political landscape with the coalition government in turmoil is also likely to have a negative impact on sentiment towards the economy.
The Semdex is likely to continue to disappoint in the coming 6-m period. However, during 2011 the Semdex dropped by 4.0%, whereas its comparator index, the MSCI Emerging Market (MSCI EM) index, dropped by 21.2%. The two indexes are highly correlated, with a cor-relation coefficient of 0.84. The Mauritian economy’s rela-tive resilience potentially accounts for the higher com-parative return. The MSCI EM index is likely to continue its lacklustre performance should the risk-off sentiment towards emerging markets persists over the coming 6-m period, and could drag the Semdex lower. However, robust GDP growth in 2012 should help underpin equity prices. Subdued expected inflation, low interest rates and a moderately expansionary budget could also encourage investors to dip into the local equity market.
Bond curve outlook: unchanged Changes in yield curve
FX outlook: MUR expected to weaken USD/MUR: forwards versus forecasts
Equity market: risk-off sentiment to prevail Mauritius Stock Exchange
Sources: Bank of Mauritius; Reuters; Standard Bank Research
Sources: Bank of Mauritius; Standard Bank Research
Source: Bloomberg
Mauritius
3.0
4.1
5.3
6.4
7.5
3-m 6-m 1-y 2-y 3-y 4-y 5-y
YTM
6-m forecast 24-Jun-11 30-Dec-11
0
400
800
1200
1600
400
863
1,325
1,788
2,250
Jan-05 May-07 Sep-09 Jan-12
MSCI EMSemdex
SEMDEX MSCI EM
25.0
28.0
31.0
34.0
37.0
Dec-06 Mar-08 Jun-09 Aug-10 Nov-11 Feb-13
USD/MUR
History Forw ards Forecast

55 Fixed Income Research
African Markets Revealed — January 2012
Mauritius: annual indicators
Notes: pe — period end; pa — period average; nr— not rated
Sources: Bank of Mauritius; Mauritius Central Statistical Service; Standard Bank Research; Bloomberg
Mauritius
2007 2008 2009 2010 2011e 2012f
Output Population (million) 1.26 1.27 1.27 1.28 1.29 1.30
Nominal GDP (MURbn) 243.9 274.3 282.0 299.1 324.8 354.4
Nominal GDP (USDbn) 7.8 9.6 8.8 9.7 11.4 11.7
GDP / capita (USD) 6,227 7,589 6,957 7,604 8,842 9,004
Real GDP growth (%) 5.7 5.5 3.1 4.2 4.1 4.0
Sugar production ('000 Tonnes) 471 452 467 452 430 450
Tourist arrivals ('000) 907 930 871 935 980 1,010
Central Government Operations
Budget balance (excl. Grants) / GDP (%) -4.0 -3.6 -4.0 -4.1 -4.9 -5.2
Budget balance (incl. Grants) / GDP (%) -3.9 -3.4 -3.0 -3.4 -4.1 -4.1
Domestic debt / GDP (%) 44.5 40.0 44.3 42.9 57.5 57.7
External debt / GDP (%) 5.5 4.5 6.0 7.4 9.4 11.2
Balance Of Payments
Exports of goods and services (USDbn) 2.25 2.39 1.94 2.26 2.74 2.78
Imports of goods and services (USDbn) 3.91 4.65 3.72 4.41 5.65 5.85
Trade balance (USDbn) -1.66 -2.26 -1.78 -2.14 -2.92 -3.07
Current account (USDbn) -0.43 -0.97 -0.65 -0.80 -0.81 -0.58
- % of GDP -5.43 -10.07 -7.35 -8.24 -7.04 -4.90
Capital & Financial account (USDbn) 0.06 0.74 0.37 0.65 0.53 0.56
- FDI (USDbn) 0.37 0.40 0.28 0.45 0.54 0.53
Basic balance / GDP (%) -0.71 -5.91 -4.25 -3.58 -2.35 -0.42
FX reserves (USDbn) pe 2.20 2.47 2.60 2.74 2.87 2.76
- Import cover (months) pe 6.7 6.4 8.4 7.5 6.1 5.7
Sovereign Credit Rating
S&P nr nr nr nr nr nr
Moody’s Baa1 Baa1- Baa1- Baa2 Baa2 Baa2
Fitch nr nr nr nr nr nr
Monetary & Financial Indicators
Consumer inflation (%) pa 8.8 9.7 2.5 2.9 6.6 5.2
Consumer inflation (%) pe 8.6 6.7 1.5 6.1 5.5 4.9
M2 money supply (% y/y) pa 10.36 15.80 11.65 6.36 6.77 8.00
M2 money supply (% y/y) pe 15.32 14.62 8.08 7.64 6.30 8.00
BOM policy rate (%) pa 8.90 8.20 5.92 5.42 5.30 5.40
BOM policy rate (%) pe 9.25 6.75 5.75 4.75 5.40 5.40
3-m rate (%) pe 9.11 8.89 4.33 3.00 4.03 4.00
1-y rate (%) pe 10.20 9.20 5.50 3.87 4.60 5.60
2-y rate (%) pe 10.30 9.80 6.20 5.28 5.60 5.80
5-y rate (%) pe 10.60 11.00 8.50 6.81 6.90 7.00
USD/MUR pa 31.09 28.46 31.92 30.72 28.47 30.28
USD/MUR pe 28.15 31.75 30.35 30.65 29.35 27.79 REER pa 94.2 98.0 88.2 94.1 94.1 96.5 NEER pa 98.8 107.1 97.4 103.0 105.4 106.5
2013f
1.31
390.6
15.2
11,599
4.2
464
1,050
-4.9
-4.2
56.2
11.5
3.54
7.58
-4.04
-0.70
-4.59
0.68
0.64
-0.38
2.88
4.6
nr
Baa2
nr
6.0
6.0
8.50
8.50
5.00
5.00
4.00
5.30
5.60
6.50
25.70
24.52
97.0 107.0
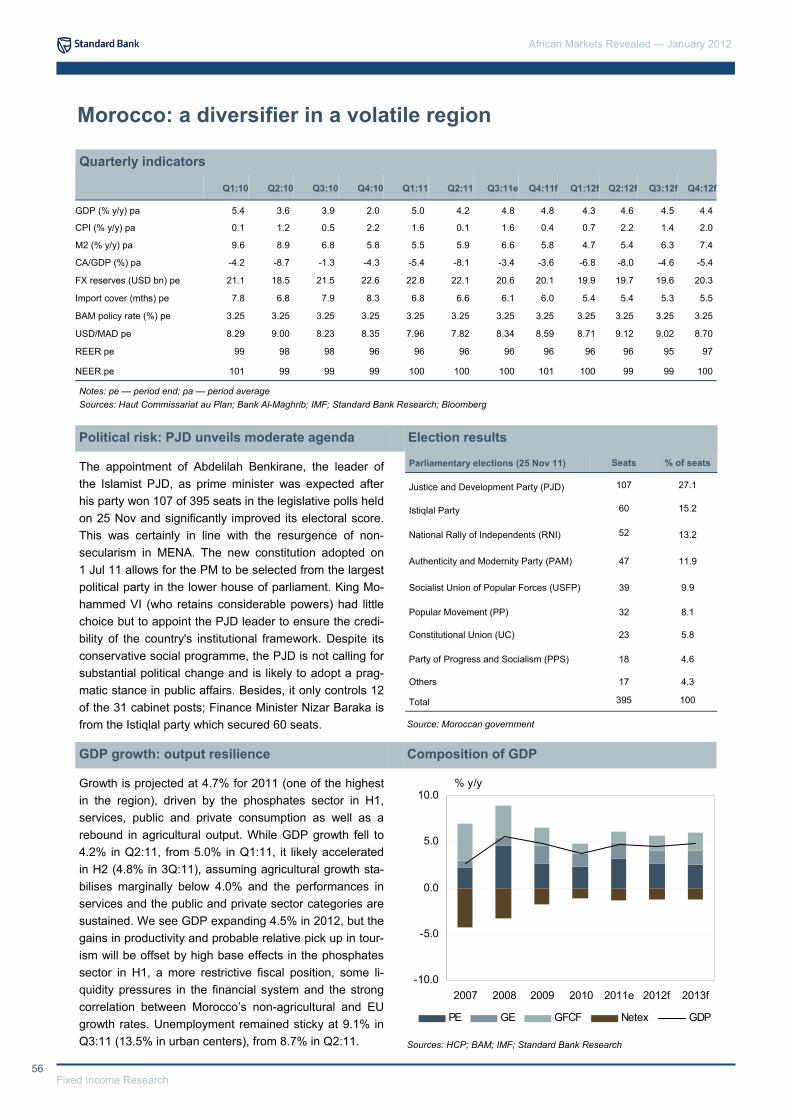
African Markets Revealed — January 2012
56 Fixed Income Research
Morocco: a diversifier in a volatile region
The appointment of Abdelilah Benkirane, the leader of the Islamist PJD, as prime minister was expected after his party won 107 of 395 seats in the legislative polls held on 25 Nov and significantly improved its electoral score. This was certainly in line with the resurgence of non-secularism in MENA. The new constitution adopted on 1 Jul 11 allows for the PM to be selected from the largest political party in the lower house of parliament. King Mo-hammed VI (who retains considerable powers) had little choice but to appoint the PJD leader to ensure the credi-bility of the country's institutional framework. Despite its conservative social programme, the PJD is not calling for substantial political change and is likely to adopt a prag-matic stance in public affairs. Besides, it only controls 12 of the 31 cabinet posts; Finance Minister Nizar Baraka is from the Istiqlal party which secured 60 seats.
Growth is projected at 4.7% for 2011 (one of the highest in the region), driven by the phosphates sector in H1, services, public and private consumption as well as a rebound in agricultural output. While GDP growth fell to 4.2% in Q2:11, from 5.0% in Q1:11, it likely accelerated in H2 (4.8% in 3Q:11), assuming agricultural growth sta-bilises marginally below 4.0% and the performances in services and the public and private sector categories are sustained. We see GDP expanding 4.5% in 2012, but the gains in productivity and probable relative pick up in tour-ism will be offset by high base effects in the phosphates sector in H1, a more restrictive fiscal position, some li-quidity pressures in the financial system and the strong correlation between Morocco’s non-agricultural and EU growth rates. Unemployment remained sticky at 9.1% in Q3:11 (13.5% in urban centers), from 8.7% in Q2:11.
Quarterly indicators
Political risk: PJD unveils moderate agenda Election results
GDP growth: output resilience Composition of GDP
Notes: pe — period end; pa — period average Sources: Haut Commissariat au Plan; Bank Al-Maghrib; IMF; Standard Bank Research; Bloomberg
Sources: HCP; BAM; IMF; Standard Bank Research
Parliamentary elections (25 Nov 11) Seats % of seats
Justice and Development Party (PJD) 107 27.1
Istiqlal Party 60 15.2
National Rally of Independents (RNI) 52 13.2
Authenticity and Modernity Party (PAM) 47 11.9
Socialist Union of Popular Forces (USFP) 39 9.9
Popular Movement (PP) 32 8.1
Constitutional Union (UC) 23 5.8
Party of Progress and Socialism (PPS) 18 4.6
Others 17 4.3
Total 395 100
Source: Moroccan government
Q1:10 Q2:10 Q3:10 Q4:10 Q1:11 Q2:11 Q3:11e Q4:11f Q1:12f Q2:12f Q3:12f Q4:12f
GDP (% y/y) pa 5.4 3.6 3.9 2.0 5.0 4.2 4.8 4.8 4.3 4.6 4.5 4.4
CPI (% y/y) pa 0.1 1.2 0.5 2.2 1.6 0.1 1.6 0.4 0.7 2.2 1.4 2.0
M2 (% y/y) pa 9.6 8.9 6.8 5.8 5.5 5.9 6.6 5.8 4.7 5.4 6.3 7.4
CA/GDP (%) pa -4.2 -8.7 -1.3 -4.3 -5.4 -8.1 -3.4 -3.6 -6.8 -8.0 -4.6 -5.4
FX reserves (USD bn) pe 21.1 18.5 21.5 22.6 22.8 22.1 20.6 20.1 19.9 19.7 19.6 20.3
Import cover (mths) pe 7.8 6.8 7.9 8.3 6.8 6.6 6.1 6.0 5.4 5.4 5.3 5.5
BAM policy rate (%) pe 3.25 3.25 3.25 3.25 3.25 3.25 3.25 3.25 3.25 3.25 3.25 3.25
USD/MAD pe 8.29 9.00 8.23 8.35 7.96 7.82 8.34 8.59 8.71 9.12 9.02 8.70
REER pe 99 98 98 96 96 96 96 96 96 96 95 97
NEER pe 101 99 99 99 100 100 100 101 100 99 99 100
-10.0
-5.0
0.0
5.0
10.0
2007 2008 2009 2010 2011e 2012f 2013f
% y/y
PE GE GFCF Netex GDP
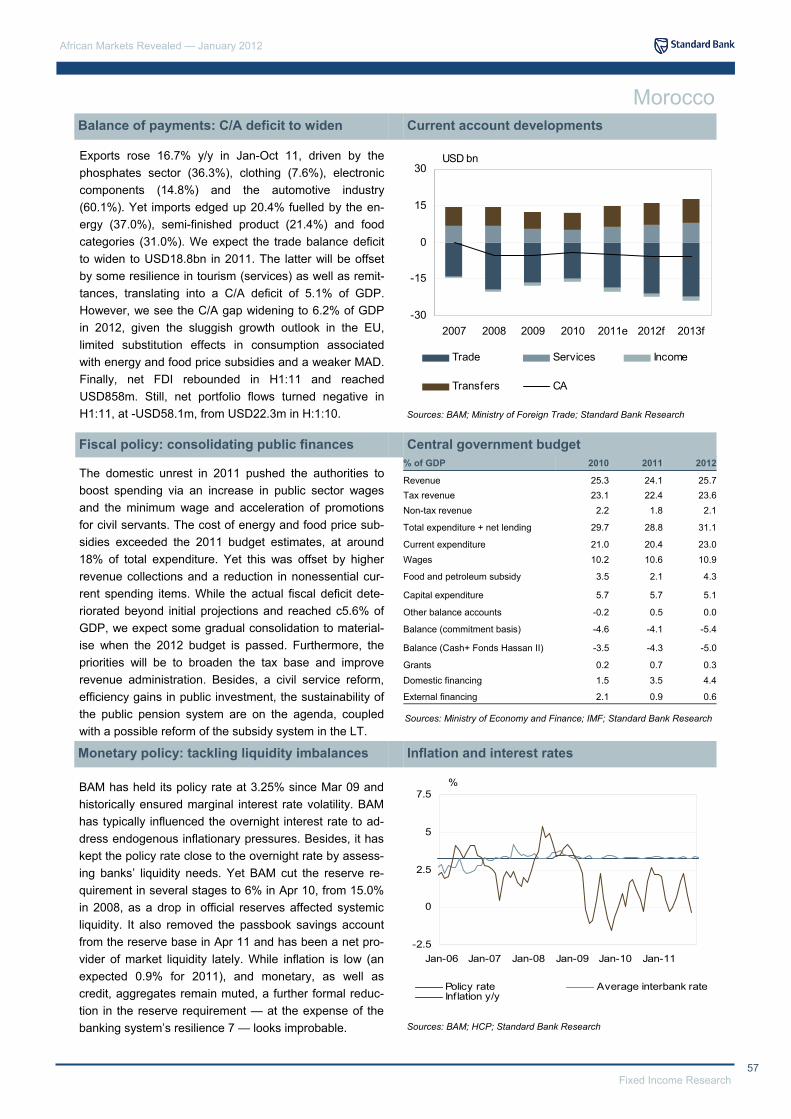
57 Fixed Income Research
African Markets Revealed — January 2012
Exports rose 16.7% y/y in Jan-Oct 11, driven by the phosphates sector (36.3%), clothing (7.6%), electronic components (14.8%) and the automotive industry (60.1%). Yet imports edged up 20.4% fuelled by the en-ergy (37.0%), semi-finished product (21.4%) and food categories (31.0%). We expect the trade balance deficit to widen to USD18.8bn in 2011. The latter will be offset by some resilience in tourism (services) as well as remit-tances, translating into a C/A deficit of 5.1% of GDP. However, we see the C/A gap widening to 6.2% of GDP in 2012, given the sluggish growth outlook in the EU, limited substitution effects in consumption associated with energy and food price subsidies and a weaker MAD. Finally, net FDI rebounded in H1:11 and reached USD858m. Still, net portfolio flows turned negative in H1:11, at -USD58.1m, from USD22.3m in H:1:10.
The domestic unrest in 2011 pushed the authorities to boost spending via an increase in public sector wages and the minimum wage and acceleration of promotions for civil servants. The cost of energy and food price sub-sidies exceeded the 2011 budget estimates, at around 18% of total expenditure. Yet this was offset by higher revenue collections and a reduction in nonessential cur-rent spending items. While the actual fiscal deficit dete-riorated beyond initial projections and reached c5.6% of GDP, we expect some gradual consolidation to material-ise when the 2012 budget is passed. Furthermore, the priorities will be to broaden the tax base and improve revenue administration. Besides, a civil service reform, efficiency gains in public investment, the sustainability of the public pension system are on the agenda, coupled with a possible reform of the subsidy system in the LT.
BAM has held its policy rate at 3.25% since Mar 09 and historically ensured marginal interest rate volatility. BAM has typically influenced the overnight interest rate to ad-dress endogenous inflationary pressures. Besides, it has kept the policy rate close to the overnight rate by assess-ing banks’ liquidity needs. Yet BAM cut the reserve re-quirement in several stages to 6% in Apr 10, from 15.0% in 2008, as a drop in official reserves affected systemic liquidity. It also removed the passbook savings account from the reserve base in Apr 11 and has been a net pro-vider of market liquidity lately. While inflation is low (an expected 0.9% for 2011), and monetary, as well as credit, aggregates remain muted, a further formal reduc-tion in the reserve requirement — at the expense of the banking system’s resilience 7 — looks improbable.
Balance of payments: C/A deficit to widen Current account developments
Fiscal policy: consolidating public finances Central government budget
Monetary policy: tackling liquidity imbalances Inflation and interest rates
Sources: BAM; Ministry of Foreign Trade; Standard Bank Research
Sources: Ministry of Economy and Finance; IMF; Standard Bank Research
Sources: BAM; HCP; Standard Bank Research
Morocco
% of GDP 2010 2011
Revenue 25.3 24.1 Tax revenue 23.1 22.4 Non-tax revenue 2.2 1.8
Total expenditure + net lending 29.7 28.8
Current expenditure 21.0 20.4 Wages 10.2 10.6
Food and petroleum subsidy 3.5 2.1
Capital expenditure 5.7 5.7
Other balance accounts -0.2 0.5
Balance (commitment basis) -4.6 -4.1
2012
25.7 23.6 2.1
31.1
23.0 10.9
4.3
5.1
0.0
-5.4
Balance (Cash+ Fonds Hassan II) -3.5 -4.3 -5.0
Grants 0.2 0.7 0.3 Domestic financing 1.5 3.5 4.4
External financing 2.1 0.9 0.6
-30
-15
0
15
30
2007 2008 2009 2010 2011e 2012f 2013f
USD bn
Trade Services Income
Transfers CA
-2.5
0
2.5
5
7.5
Jan-06 Jan-07 Jan-08 Jan-09 Jan-10 Jan-11
%
Policy rate Average interbank rateInflation y/y
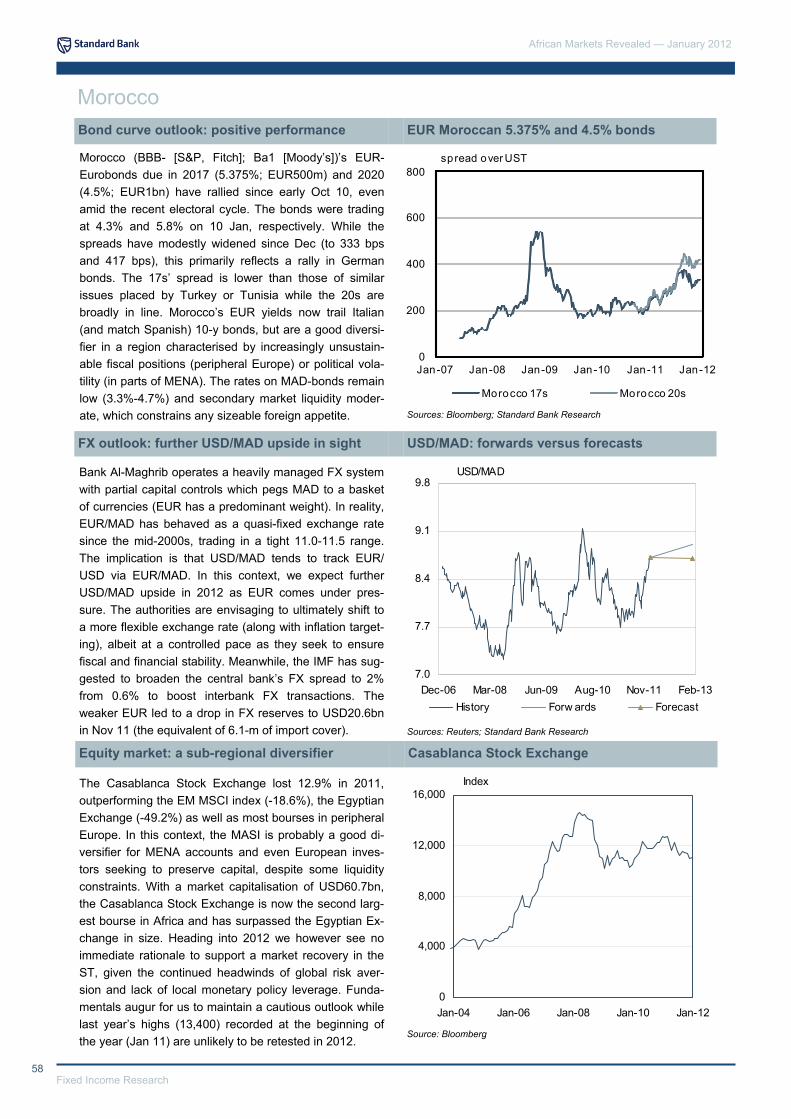
African Markets Revealed — January 2012
58 Fixed Income Research
Morocco (BBB- [S&P, Fitch]; Ba1 [Moody’s])’s EUR-Eurobonds due in 2017 (5.375%; EUR500m) and 2020 (4.5%; EUR1bn) have rallied since early Oct 10, even amid the recent electoral cycle. The bonds were trading at 4.3% and 5.8% on 10 Jan, respectively. While the spreads have modestly widened since Dec (to 333 bps and 417 bps), this primarily reflects a rally in German bonds. The 17s’ spread is lower than those of similar issues placed by Turkey or Tunisia while the 20s are broadly in line. Morocco’s EUR yields now trail Italian (and match Spanish) 10-y bonds, but are a good diversi-fier in a region characterised by increasingly unsustain-able fiscal positions (peripheral Europe) or political vola-tility (in parts of MENA). The rates on MAD-bonds remain low (3.3%-4.7%) and secondary market liquidity moder-ate, which constrains any sizeable foreign appetite.
Bank Al-Maghrib operates a heavily managed FX system with partial capital controls which pegs MAD to a basket of currencies (EUR has a predominant weight). In reality, EUR/MAD has behaved as a quasi-fixed exchange rate since the mid-2000s, trading in a tight 11.0-11.5 range. The implication is that USD/MAD tends to track EUR/USD via EUR/MAD. In this context, we expect further USD/MAD upside in 2012 as EUR comes under pres-sure. The authorities are envisaging to ultimately shift to a more flexible exchange rate (along with inflation target-ing), albeit at a controlled pace as they seek to ensure fiscal and financial stability. Meanwhile, the IMF has sug-gested to broaden the central bank’s FX spread to 2% from 0.6% to boost interbank FX transactions. The weaker EUR led to a drop in FX reserves to USD20.6bn in Nov 11 (the equivalent of 6.1-m of import cover).
The Casablanca Stock Exchange lost 12.9% in 2011, outperforming the EM MSCI index (-18.6%), the Egyptian Exchange (-49.2%) as well as most bourses in peripheral Europe. In this context, the MASI is probably a good di-versifier for MENA accounts and even European inves-tors seeking to preserve capital, despite some liquidity constraints. With a market capitalisation of USD60.7bn, the Casablanca Stock Exchange is now the second larg-est bourse in Africa and has surpassed the Egyptian Ex-change in size. Heading into 2012 we however see no immediate rationale to support a market recovery in the ST, given the continued headwinds of global risk aver-sion and lack of local monetary policy leverage. Funda-mentals augur for us to maintain a cautious outlook while last year’s highs (13,400) recorded at the beginning of the year (Jan 11) are unlikely to be retested in 2012.
Bond curve outlook: positive performance EUR Moroccan 5.375% and 4.5% bonds
FX outlook: further USD/MAD upside in sight USD/MAD: forwards versus forecasts
Equity market: a sub-regional diversifier Casablanca Stock Exchange
Sources: Bloomberg; Standard Bank Research
Sources: Reuters; Standard Bank Research
Source: Bloomberg
Morocco
0
200
400
600
800
Jan-07 Jan-08 Jan-09 Jan-10 Jan-11 Jan-12
spread over UST
Morocco 17s Morocco 20s
0
4,000
8,000
12,000
16,000
Jan-04 Jan-06 Jan-08 Jan-10 Jan-12
Index
7.0
7.7
8.4
9.1
9.8
Dec-06 Mar-08 Jun-09 Aug-10 Nov-11 Feb-13
USD/MAD
History Forw ards Forecast

59 Fixed Income Research
African Markets Revealed — January 2012
Morocco: annual indicators
Notes: pe — period end; pa — period average; na — not available; nr — not rated
Sources: Haut Commissariat au Plan; Bank Al-Maghrib; IMF; Standard Bank Research; Bloomberg
Morocco
2007 2008 2009 2010 2011e 2012f 2013f
Output Population (million) 30.8 31.2 31.5 31.9 32.2 32.5 32.9
Nominal GDP (MADbn) 616.3 688.8 732.4 767.1 810.3 859.6 913.8
Nominal GDP (USDbn) 75.3 88.8 90.6 91.0 100.1 96.6 110.1
GDP / capita (USD) 2,443 2,849 2,873 2,858 3,111 2,970 3,351
Real GDP growth (%) 2.7 5.6 4.8 3.7 4.7 4.5 4.8
Central Government Operations
Budget balance / GDP (%) 0.4 1.6 -2.2 -4.6 -5.6 -5.4 -4.5
Primary balance (incl. Grants) / GDP (%) 0.0 -2.4 -3.5 -2.6 -1.8
General gov. debt / GDP, domestic (%) 42.8 37.3 37.2 39.1 42.7 44.7 45.9
General gov. debt / GDP, foreign (%) 10.7 10.0 10.7 12.0 11.8 11.8 11.9
Balance of Payments
Exports of goods and services (USDbn) 15.1 20.3 14.0 17.6 21.6 23.2 26.9
Imports of goods and services (USDbn) 30.4 32.6 40.4 44.0 49.3
Trade balance (USDbn) -14.2 -19.5 -16.4 -15.1 -18.8 -20.9 -22.4
Current account (USDbn) -0.2 -5.7 -5.4 -4.2 -5.2 -6.0 -5.9
- % of GDP -0.3 -6.4 -5.9 -4.6 -5.1 -6.2 -5.4
Capital & Financial account (USDbn) -3.6 7.7 4.7 4.4 7.7 5.8 3.8
- FDI (USDbn) 2.3 2.0 0.9 0.8 1.7 1.5 1.8
Basic balance / GDP (%) 2.8 -4.1 -5.0 -3.8 -3.4 -4.6 -3.7
FX reserves (USDbn) pe 24.1 22.1 22.8 22.6 20.1 20.3 22.5
- Import cover (months) pe 9.9 6.7 9.0 8.3 6.0 5.5 5.5
Sovereign Credit Rating
S&P BB+ BB+ BB+ BBB- BBB- BBB- BBB-
Moody’s Ba1 Ba1 Ba1 Ba1 Ba1
Fitch BBB- BBB- BBB- BBB- BBB- BBB- BBB-
Monetary & Financial Indicators Consumer inflation (%) pa 2.0 3.8 0.9 1.0 0.9 1.6 1.5
Consumer inflation (%) pe -1.5 2.2 1.0 1.9 1.2
M2 money supply (% y/y) pa 17.7 11.5 5.7 7.8 5.9 6.0 8.1
M2 money supply (% y/y) pe 17.5 7.4 7.7 5.0 4.9 8.9 6.9
Policy rate (%) pa 3.25 3.33 3.29 3.25 3.25 3.25 3.25
Policy rate (%) pe 3.25 3.50 3.25 3.25 3.25 3.25 3.25
USD/MAD pa 8.18 7.75 8.09 8.43 8.09 8.90 8.30
USD/MAD pe 7.76 8.08 7.90 8.35 8.59 8.70 8.10
REER pa 100 100 102 98 96 96 99
NEER pa 100 101 103 100 100 100 101

African Markets Revealed — January 2012
60 Fixed Income Research
Mozambique: moving to more accommodative policies
At recent municipal council-president by-elections, oppo-sition party Movimento Democrático de Moçambique (MDM) beat the ruling party’s candidate in the largest of the three cities (Quelimane), winning 63.1% of the votes. The Constitutional Council confirmed the results and was also critical of the use of state resources by the ruling party during campaigning. (The main opposition party Resistência Nacional Moçambicana — Renamo — boy-cotted these elections). Notably, this is the second city that the MDM has beat a Frelimo candidate. Its possible that this proves a precursor for local elections to be held in Nov 13 and perhaps even for presidential and parlia-mentary elections not due until 2014. Dhlakama, the leader of Renamo, continues to call for peaceful demon-strations against the government. These have repeatedly failed to materialise.
An expansive fiscal budget, continued private investment as well as a low inflationary environment, which is sup-portive of private consumption expenditure (PCE), are likely to see growth accelerate further, to 7.1% in 2012, from 6.8% in 2011. Growth recovered to 6.7 y/y in Q3:11, from 5.7% y/y in Q2:11. The acceleration in activity was largely driven by strong growth in the extractive industry, reaching 34.2% y/y in Q3:11, from 0.8% y/y in the previ-ous quarter. This sector is likely to show strong growth as output of coal and gas improves. The construction sector also showed great improvement, expanding by 12.1% y/y, from a decline of 12.0% y/y in Q2:11. Strong public and private investment (in inter alia social and transport infrastructure) is likely to contribute to continued growth in this sector in 2012. The largest sector in the economy, agriculture, expanded by 0.2% y/y in Q3:11, from -2.0% y/y in Q2:11.
Quarterly indicators
Notes: pe — period end; pa — period average Sources: Bank of Mozambique; Bloomberg; Mozambique Ministry of Finance; Standard Bank Research
Political risk: signs of declining dominance? Election results (2009)
GDP growth: investment-led growth continues Composition of GDP
Sources: National Statistics Institute; Standard Bank Research
Source: National Elections Commission
Presidential election Party % of votes
Armando Guebuza Frelimo 75.01
Afonso Dhlakama Renamo 16.41
Daviz Simango MDM 8.59
Legislative election % of votes Seats
Frente de Libertação de Moçambique (Frelimo) 74.66 191
Resistência Nacional Moçambicana (Renamo) 17.68 51
Movimento Democrático de Moçambique (MDM) 3.93 8
Others 3.73 0
Q1:10 Q2:10 Q3:10 Q4:10 Q1:11 Q2:11 Q3:11e Q4:11f Q1:12f Q2:12f Q3:12f Q4:12f
GDP (% y/y) pa 8.6 6.4 5.6 6.6 8.7 5.7 6.7 7.2 7.5 8.1 7.4 8.4
CPI (% y/y) pa 6.3 12.1 16.7 15.7 15.7 11.2 7.8 7.2 5.6 6.1 5.8 6.2
M3 (% y/y) pe 31.6 32.9 32.7 22.8 19.4 9.5 3.9 4.8 11.2 14.8 17.4 22.5
CA/GDP (%) pe -11.9 -11.9 -11.9 -11.9 -10.9 -10.9 -10.9 -10.9 -9.7 -9.7 -9.7 -9.7
FX reserves (USD bn) pe 1.9 2.0 2.0 2.2 2.1 2.3 2.4 2.6 2.6 2.7 2.8 2.9
Import cover (months) pe 5.1 5.3 5.4 5.7 4.7 5.2 5.3 5.7 5.5 5.7 5.8 6.0
3-m rate (%) pe 9.5 13.0 13.2 14.7 16.4 16.5 14.3 11.6 9.8 8.4 6.7 6.9
1-y rate (%) pe 11.0 14.1 14.3 15.3 16.5 16.5 15.2 12.2 10.9 9.1 8.8 8.9
USD/MZN pe 34.6 34.3 36.3 32.4 31.0 28.6 26.6 27.1 27.8 27.8 28.5 28.5
REER pe 87.3 86.9 86.4 86.1 87.6 89.4 91.8 90.4 89.7 88.4 87.2 86.2
NEER pe 45.3 44.9 44.5 44.0 45.2 46.3 47.1 53.3 53.2 53.9 54.4 55.2
-8.5
-4.2
0.1
4.3
8.6
12.8
2006 2008 2010 2012f
% y/y
Netex Stocks GFCFGE PCE GDP

61 Fixed Income Research
African Markets Revealed — January 2012
The C/A is likely to benefit from strong export growth in various minerals and metals, not least coal. We expect exports values to grow by 15.0% y/y in 2012, and import values to grow 10.0% y/y. Importantly, coal production in Tête province is set to increase to 5.9m MT in 2012, from 1.0m MT in 2011. Not only will this increase export reve-nue, it will also diversify it away from aluminium. We also expect strong growth in the exports of electricity (12.3% of exports in 2010) and gas (6.0% of exports). While the C/A deficit remains large, at a forecast USD1.5bn (10% of GDP) in 2012, it is likely to continue to be easily fi-nanced via a combination of development partners’ grants and loans as well as considerable private FDI. We expect foreign investment to reach almost USD1.0bn in 2012 on the back of new and expanding mining opera-tions as well as in associated infrastructure.
The 2012 budget demonstrates a more expansionary stance, with greater allocation to public investment as well as social expenditure. Total expenditure is set to reach close to 35% of GDP in 2012, from 32.6% last year. The fiscal deficit is set to expand to 3.1% of GDP in FY2012, from 0.9% in FY2011. Domestic financing is set to remain flat, at MZN2.6bn (USD100m), or 0.6% of GDP. External financing is set to reach 6.8% of GDP, of which more than half will be dedicated to investment pro-jects financed by development partners. The balance of MZN13.4bn (ca. USD500m) will be raised through exter-nal facilities, which may be in the form of a benchmark size sovereign Eurobond. Public debt levels remain sus-tainable, at less than 40% of GDP, with the majority of debt provided on concessional terms by donors and only 10% of public debt is domestic.
Benign levels of inflation in H1:12 are likely to provide the BOM with room to ease monetary policy further through the interest channel in this period. The BOM is likely to continue to view the exchange rate channel as vital to containing inflation pressures, exhibiting a bias for a sta-ble or stronger MZN against the USD. The BOM reduced the Standing Lending Facility (SLF) by 100 bps, to 15.0%, while also reducing the reserve requirement ratio by 25 bps, to 8.5%. Inflation in the capital, Maputo, fell sharply in Dec 11 to 5.5% y/y (the lowest level since Jan 10), from 7.7% y/y in Nov 11. The national measure re-mained slightly more elevated, at 6.8% y/y in Dec 11, from 8.6% y/y in Nov 11. We expect inflation to face some upward pressure in Q1:12 as food prices rise in line with seasonal trends, but to remain below 6.0% y/y in this period.
Balance of payments: structural improvement Current account developments
Fiscal policy: strong support from donors Central government budget
Sources: Mozambique Ministry of Finance; Standard Bank Research
Monetary policy: inflation to remain benign Inflation and interest rates
Sources: Bank of Mozambique; Standard Bank Research
Source: Bank of Mozambique
Mozambique
% of GDP 2010e 2011e
Total revenue (+ grants) 30.7 29.1
Total expenditure 33.4 32.6
- wages 9.3 9.7
- interest 0.9 0.9
- development 14.0 11.6
Overall balance (- grants) -12.7 -11.3
Overall balance (+ grants) -3.7 -3.5
Grants 9.1 7.7
Net external borrowing 4.2 2.8
Net domestic borrowing -0.6 0.8
2012f
28.7
34.6
9.6
1.1
12.0
-12.4
-5.9
5.3
0.6
6.8
-3.3
-2.2
-1.1
0.0
1.1
2007 2008 2009 2010 2011e 2012f 2013f
USD bn
Transfers Services & income
Trade balance Currrent account
0
5
10
15
20
Aug-07 Jan-09 Jun-10 Nov-11
%
CPI Maputo BOM SLF 91-d T-bill
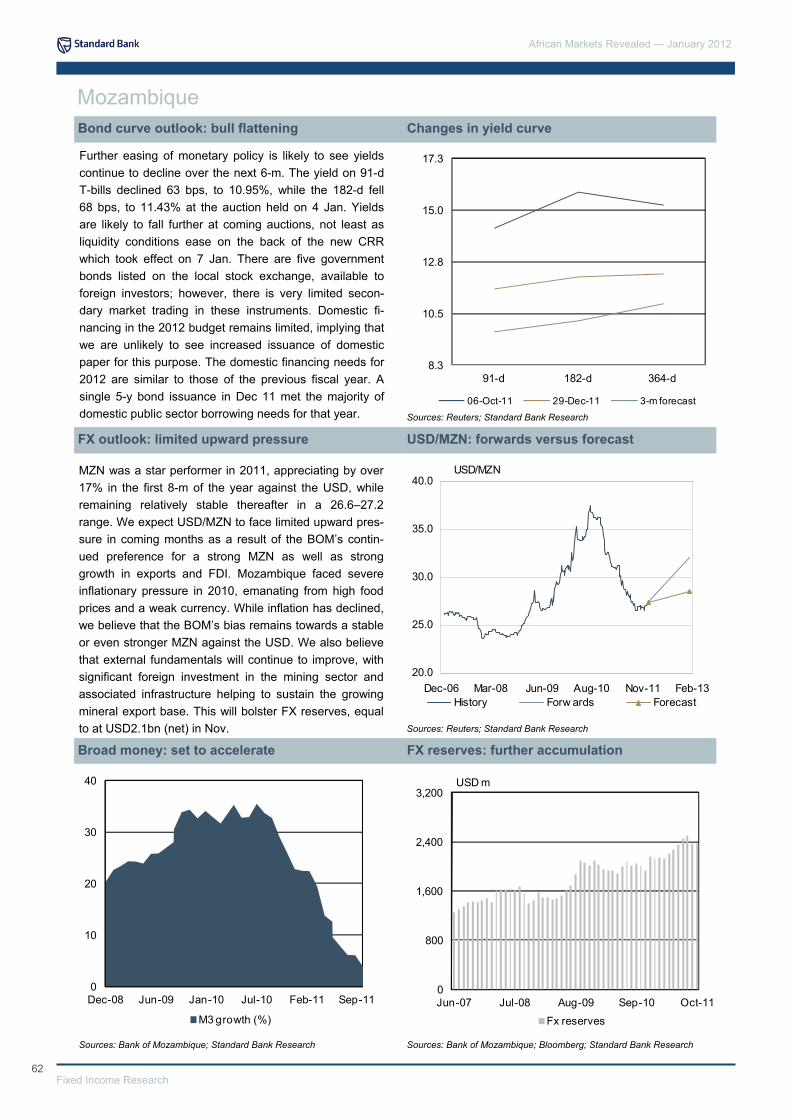
African Markets Revealed — January 2012
62 Fixed Income Research
Further easing of monetary policy is likely to see yields continue to decline over the next 6-m. The yield on 91-d T-bills declined 63 bps, to 10.95%, while the 182-d fell 68 bps, to 11.43% at the auction held on 4 Jan. Yields are likely to fall further at coming auctions, not least as liquidity conditions ease on the back of the new CRR which took effect on 7 Jan. There are five government bonds listed on the local stock exchange, available to foreign investors; however, there is very limited secon-dary market trading in these instruments. Domestic fi-nancing in the 2012 budget remains limited, implying that we are unlikely to see increased issuance of domestic paper for this purpose. The domestic financing needs for 2012 are similar to those of the previous fiscal year. A single 5-y bond issuance in Dec 11 met the majority of domestic public sector borrowing needs for that year.
MZN was a star performer in 2011, appreciating by over 17% in the first 8-m of the year against the USD, while remaining relatively stable thereafter in a 26.6–27.2 range. We expect USD/MZN to face limited upward pres-sure in coming months as a result of the BOM’s contin-ued preference for a strong MZN as well as strong growth in exports and FDI. Mozambique faced severe inflationary pressure in 2010, emanating from high food prices and a weak currency. While inflation has declined, we believe that the BOM’s bias remains towards a stable or even stronger MZN against the USD. We also believe that external fundamentals will continue to improve, with significant foreign investment in the mining sector and associated infrastructure helping to sustain the growing mineral export base. This will bolster FX reserves, equal to at USD2.1bn (net) in Nov.
.
Bond curve outlook: bull flattening Changes in yield curve
FX outlook: limited upward pressure USD/MZN: forwards versus forecast
Sources: Reuters; Standard Bank Research
Broad money: set to accelerate FX reserves: further accumulation
Sources: Reuters; Standard Bank Research
Sources: Bank of Mozambique; Bloomberg; Standard Bank Research
Mozambique
Sources: Bank of Mozambique; Standard Bank Research
8.3
10.5
12.8
15.0
17.3
91-d 182-d 364-d
06-Oct-11 29-Dec-11 3-m forecast
0
10
20
30
40
Dec-08 Jun-09 Jan-10 Jul-10 Feb-11 Sep-11
M3 growth (%)
0
800
1,600
2,400
3,200
Jun-07 Jul-08 Aug-09 Sep-10 Oct-11
USD m
Fx reserves
20.0
25.0
30.0
35.0
40.0
Dec-06 Mar-08 Jun-09 Aug-10 Nov-11 Feb-13
USD/MZN
History Forw ards Forecast
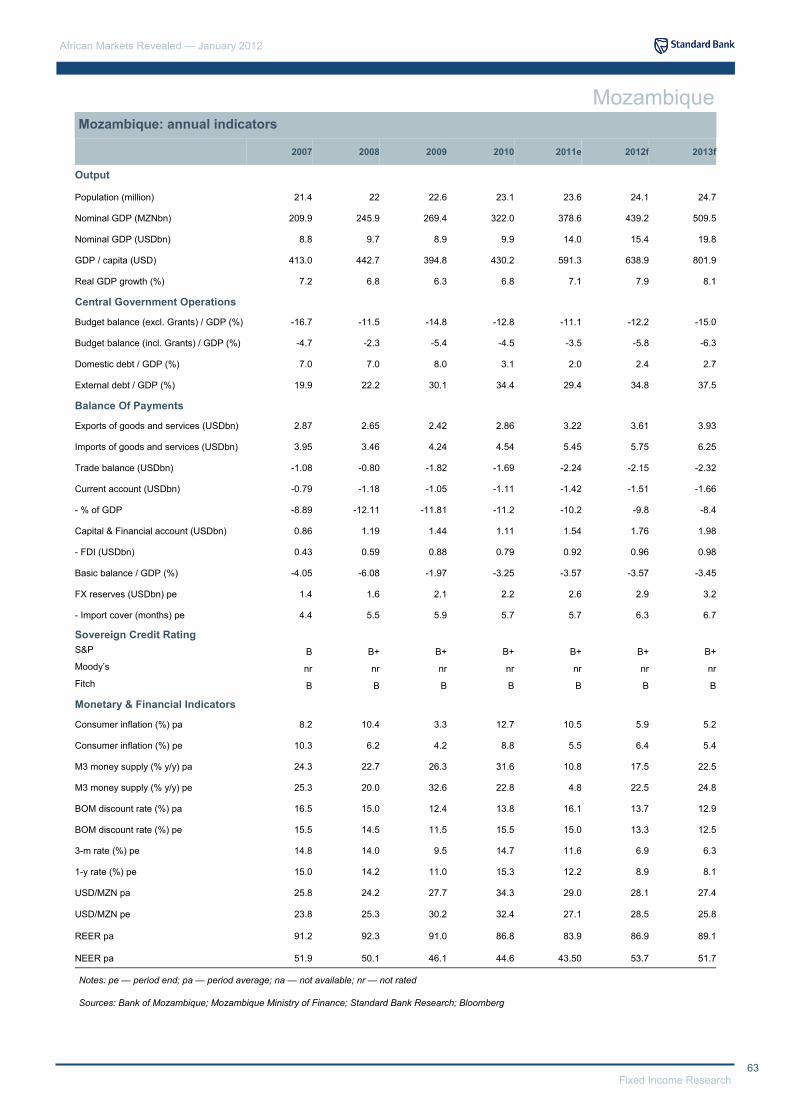
63 Fixed Income Research
African Markets Revealed — January 2012
Mozambique: annual indicators
Notes: pe — period end; pa — period average; na — not available; nr — not rated
Sources: Bank of Mozambique; Mozambique Ministry of Finance; Standard Bank Research; Bloomberg
Mozambique
2007 2008 2009 2010 2011e 2012f
Output Population (million) 21.4 22 22.6 23.1 23.6 24.1
Nominal GDP (MZNbn) 209.9 245.9 269.4 322.0 378.6 439.2
Nominal GDP (USDbn) 8.8 9.7 8.9 9.9 14.0 15.4
GDP / capita (USD) 413.0 442.7 394.8 430.2 591.3 638.9
Real GDP growth (%) 7.2 6.8 6.3 6.8 7.1 7.9
Central Government Operations Budget balance (excl. Grants) / GDP (%) -16.7 -11.5 -14.8 -12.8 -11.1 -12.2
Budget balance (incl. Grants) / GDP (%) -4.7 -2.3 -5.4 -4.5 -3.5 -5.8
External debt / GDP (%) 19.9 22.2 30.1 34.4 29.4 34.8
Balance Of Payments Exports of goods and services (USDbn) 2.87 2.65 2.42 2.86 3.22 3.61
Imports of goods and services (USDbn) 3.95 3.46 4.24 4.54 5.45 5.75
Trade balance (USDbn) -1.08 -0.80 -1.82 -1.69 -2.24 -2.15
Current account (USDbn) -0.79 -1.18 -1.05 -1.11 -1.42 -1.51
- % of GDP -8.89 -12.11 -11.81 -11.2 -10.2 -9.8
Capital & Financial account (USDbn) 0.86 1.19 1.44 1.11 1.54 1.76
- FDI (USDbn) 0.43 0.59 0.88 0.79 0.92 0.96
Basic balance / GDP (%) -4.05 -6.08 -1.97 -3.25 -3.57 -3.57
FX reserves (USDbn) pe 1.4 1.6 2.1 2.2 2.6 2.9
- Import cover (months) pe 4.4 5.5 5.9 5.7 5.7 6.3
Sovereign Credit Rating S&P B B+ B+ B+ B+ B+ Moody’s nr nr nr nr nr nr Fitch B B B B B B
Monetary & Financial Indicators Consumer inflation (%) pa 8.2 10.4 3.3 12.7 10.5 5.9
Consumer inflation (%) pe 10.3 6.2 4.2 8.8 5.5 6.4
M3 money supply (% y/y) pa 24.3 22.7 26.3 31.6 10.8 17.5
M3 money supply (% y/y) pe 25.3 20.0 32.6 22.8 4.8 22.5
BOM discount rate (%) pa 16.5 15.0 12.4 13.8 16.1 13.7
BOM discount rate (%) pe 15.5 14.5 11.5 15.5 15.0 13.3
3-m rate (%) pe 14.8 14.0 9.5 14.7 11.6 6.9
1-y rate (%) pe 15.0 14.2 11.0 15.3 12.2 8.9
USD/MZN pa 25.8 24.2 27.7 34.3 29.0 28.1
USD/MZN pe 23.8 25.3 30.2 32.4 27.1 28.5
REER pa 91.2 92.3 91.0 86.8 83.9 86.9
NEER pa 51.9 50.1 46.1 44.6 43.50 53.7
Domestic debt / GDP (%) 7.0 7.0 8.0 3.1 2.0 2.4
2013f
24.7
509.5
19.8
801.9
8.1
-15.0
-6.3
2.7
37.5
3.93
6.25
-2.32
-1.66
-8.4
1.98
0.98
-3.45
3.2
6.7
B+
nr
B
5.2
5.4
22.5
24.8
12.9
12.5
6.3
8.1
27.4
25.8
89.1
51.7

African Markets Revealed — January 2012
64 Fixed Income Research
Namibia: commodity cycle to impact output growth
Namibia’s political landscape is expected to remain rela-tively stable in 2012, with the dominance of the ruling Swapo party (which enjoys a two-thirds majority in parlia-ment) unlikely to be seriously challenged by the opposi-tion parties any time soon. Indeed, the next elections will only take place in Nov 14. However, there is already some discussion about incumbent president, Hifikepunye Pohamba, stepping down ahead before the end of his second and final term in 2014 because of ill health. At present, SWAPO is without a vice-president and thus an obvious successor to President Pohamba. The focus is now on SWAPO’s next party congress, which is sched-uled for this year, where the appointment of a new-vice president should stop much of the present party infight-ing. The son of former president Sam Nujoma appears to be increasingly well positioned to take on the position.
We expect the economy to grow by 4.3% y/y in 2012. Growth is likely to be broad-based, but underpinned by higher uranium and copper production, infrastructure de-velopment under the Targeted Intervention Program for Employment and Economic Growth (TIPEEG) and in-creased cement production. Uranium mining is likely to contribute a larger share to GDP than diamond mining over the next few years. Diamond mining output is likely to drop from declining onshore diamond deposits and the easing of polished diamond prices, which have dropped by 9.0% between the Jul 11 peak and Dec 11. The 3-y TIPEEG aims to expand public works, stimulate the economy and reduce the high unemployment rate. The plan and an expansionary fiscal policy are likely to boost consumption and investment expenditure generally.
Political risk: presidential race hots up Election results (2009)
GDP growth: broad-based growth likely Composition of GDP
Quarterly indicators Q1:10 Q2:10 Q3:10 Q4:10 Q1:11 Q2:11 Q3:11e Q4:11f Q1:12f Q2:12f Q3:12f Q4:12f
GDP (% y/y) pa 6.6 6.6 6.6 6.6 3.8 3.8 3.8 3.8 4.3 4.3 4.3 4.3
CPI (% y/y) pa 6.1 4.7 4.0 3.2 3.5 5.1 5.2 6.4 6.7 6.2 6.4 6.0 M2 (% y/y) pa 2.0 7.0 11.0 9.0 2.0 7.6 11.5 10.7 17.1 17.9 14.4 15.4 CA/GDP (%) pa -0.3 -0.3 -0.3 -0.3 2.0 2.0 2.0 2.0 3.0 3.0 3.0 3.0 FX reserves (USD bn) pa 1.93 1.80 1.83 1.70 1.36 1.62 1.32 1.86 1.92 1.98 2.04 2.10 Import cover (months) pe 4.7 4.4 4.5 4.1 3.1 3.7 3.0 4.3 4.4 4.5 4.7 4.8 3-m rate (%) pe 7.2 6.9 6.4 5.4 5.5 5.8 6.1 6.1 6.1 6.2 6.2 6.2 5-y rate (%) pe 8.1 8.1 6.9 5.9 6.4 6.2 6.5 6.6 6.6 6.7 6.9 7.0 USD/NAD pa 7.3 7.7 7.0 6.6 6.8 6.8 8.1 8.1 8.2 8.1 7.9 7.8 REER pa 94.2 94.0 94.5 95.1 94.1 94.7 92.1 91.0 93.0 94.0 95.0 96.0 NEER pa 96.6 96.5 96.9 98.0 96.7 97.0 94.7 92.6 92.0 92.5 93.0 93.5
Notes: pe — period end; pa — period average; na — not available Sources: Bank of Namibia; Central Bureau of Statistics; Ministry of Finance; IMF; Standard Bank Research
Sources: Bank of Namibia; IMF; Standard Bank Research
Source: INEC
Presidential election Party % of votes
Hifikepunye Lucas Pohamba SWAPO 75.25 Hidipo Hamutenya RDP 10.91 Katuutire Kaura DTA 2.98 Kuaima Riruako NUDO 2.92 Justus Garoëb UDF 2.37
Legislative election Seats % of votes
South West African People's Organization (SWAPO) 54 74.29 Rally for Democracy and Progress (RDP) 8 11.16 Democratic Turnhalle Alliance of Namibia (DTA) 2 3.13 National Unity Democratic Organization (NUDO) 2 3.01 United Democratic Front (UDF) 2 2.40
All People’s Party (APP) 1 1.33 Republican Party (RP) 1 0.81 Congress of Democrats (COD) 1 0.66 South West Africa National Union (SWANU) 1 0.62 Appointed members 6 Total 78
-20
-10
0
10
20
2006 2007 2008 2009 2010 2011f 2012f
y/y %
PCE GE GFCF Stocks
Netex Discrep GDP
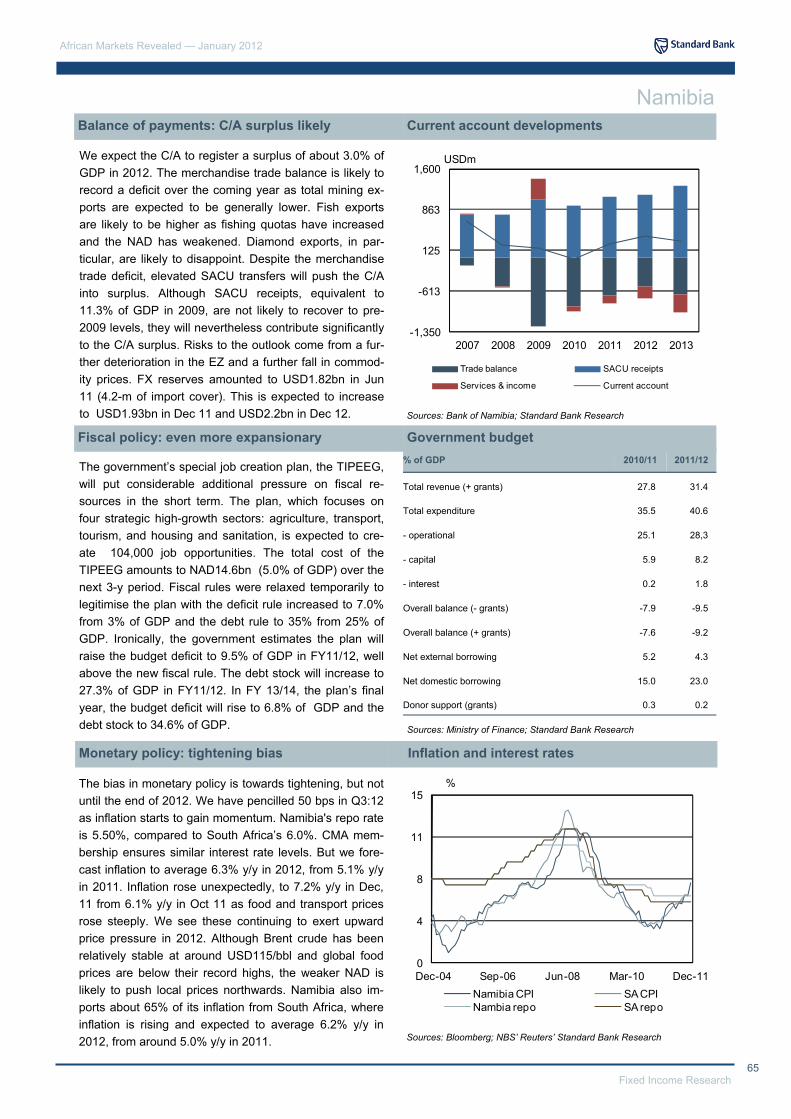
65 Fixed Income Research
African Markets Revealed — January 2012
We expect the C/A to register a surplus of about 3.0% of GDP in 2012. The merchandise trade balance is likely to record a deficit over the coming year as total mining ex-ports are expected to be generally lower. Fish exports are likely to be higher as fishing quotas have increased and the NAD has weakened. Diamond exports, in par-ticular, are likely to disappoint. Despite the merchandise trade deficit, elevated SACU transfers will push the C/A into surplus. Although SACU receipts, equivalent to 11.3% of GDP in 2009, are not likely to recover to pre-2009 levels, they will nevertheless contribute significantly to the C/A surplus. Risks to the outlook come from a fur-ther deterioration in the EZ and a further fall in commod-ity prices. FX reserves amounted to USD1.82bn in Jun 11 (4.2-m of import cover). This is expected to increase to USD1.93bn in Dec 11 and USD2.2bn in Dec 12.
The government’s special job creation plan, the TIPEEG, will put considerable additional pressure on fiscal re-sources in the short term. The plan, which focuses on four strategic high-growth sectors: agriculture, transport, tourism, and housing and sanitation, is expected to cre-ate 104,000 job opportunities. The total cost of the TIPEEG amounts to NAD14.6bn (5.0% of GDP) over the next 3-y period. Fiscal rules were relaxed temporarily to legitimise the plan with the deficit rule increased to 7.0% from 3% of GDP and the debt rule to 35% from 25% of GDP. Ironically, the government estimates the plan will raise the budget deficit to 9.5% of GDP in FY11/12, well above the new fiscal rule. The debt stock will increase to 27.3% of GDP in FY11/12. In FY 13/14, the plan’s final year, the budget deficit will rise to 6.8% of GDP and the debt stock to 34.6% of GDP.
Fiscal policy: even more expansionary Government budget
Balance of payments: C/A surplus likely Current account developments
The bias in monetary policy is towards tightening, but not until the end of 2012. We have pencilled 50 bps in Q3:12 as inflation starts to gain momentum. Namibia's repo rate is 5.50%, compared to South Africa’s 6.0%. CMA mem-bership ensures similar interest rate levels. But we fore-cast inflation to average 6.3% y/y in 2012, from 5.1% y/y in 2011. Inflation rose unexpectedly, to 7.2% y/y in Dec, 11 from 6.1% y/y in Oct 11 as food and transport prices rose steeply. We see these continuing to exert upward price pressure in 2012. Although Brent crude has been relatively stable at around USD115/bbl and global food prices are below their record highs, the weaker NAD is likely to push local prices northwards. Namibia also im-ports about 65% of its inflation from South Africa, where inflation is rising and expected to average 6.2% y/y in 2012, from around 5.0% y/y in 2011.
Monetary policy: tightening bias Inflation and interest rates
Sources: Bank of Namibia; Standard Bank Research
Sources: Ministry of Finance; Standard Bank Research
% of GDP 2010/11 2011/12
Total revenue (+ grants) 27.8 31.4
Total expenditure 35.5 40.6
- operational 25.1 28,3
- capital 5.9 8.2
- interest 0.2 1.8
Overall balance (- grants) -7.9 -9.5
Overall balance (+ grants) -7.6 -9.2
Net external borrowing 5.2 4.3
Net domestic borrowing 15.0 23.0
Donor support (grants) 0.3 0.2
Sources: Bloomberg; NBS’ Reuters’ Standard Bank Research
Namibia
-1,350
-613
125
863
1,600
2007 2008 2009 2010 2011 2012 2013
USDm
Trade balance SACU receipts
Services & income Current account
0
4
8
11
15
Dec-04 Sep-06 Jun-08 Mar-10 Dec-11
%
Namibia CPI SA CPINambia repo SA repo

African Markets Revealed — January 2012
66 Fixed Income Research
We expect the yield curve to remain broadly unchanged in coming months. Interest rates are likely to start to rise by 50 bps from the end of Q3:12. Namibia’s yield curve is generally tied to South Africa’s as the CMA agreement permits free capital flows within the area and Namibian bonds are benchmarked against South Africa’s. On aver-age, Namibian bonds trade at about a 100 bps premium to South Africa’s. At the end of Oct 11 Namibia success-fully launched its first Eurobond of USD500m (NAD3.9bn) with a 10-y tenor and a yield of 5.7% (coupon rate of 5.5%). The new bond will help to finance the TIPEEG. Moody’s rated the bond at Baa3 with a Stable outlook and Fitch Ratings rated the bond at BBB- with a Positive outlook. The ratings are both investment grade. The bulk of the bond was sold to US and UK investors.
We expect the NSX local index to continue to outperform the overall index. In 2011, the local index increased by 28.1% y/y, compared to 11.6% y/y in 2010. At the end of 2011, the index rose to its highest level ever. The strong performance of the local index is tied to pension fund regulations which require that funds must increase their investment in equities deemed as local companies. Turn-over of the local shares is also relatively low. The overall NSX index is expected to continue to be correlated to the performance of the dual-listed Anglo American share price, as it accounts for a significant portion of overall market capitalisation, as well as the JSE. The JSE and the overall index is expected to disappoint in 2012, driven by risk aversion towards emerging markets. The overall index dropped by 3.3% y/y in 2011, compared to an in-crease of 12.3% y/y in 2010.
FX outlook: NAD weakness ahead USD/NAD forwards versus forecast
Bond curve: yields to remain unchanged Changes in yield curve
Equity market: local companies to shine Namibian Stock Exchange
Sources: Bank of Namibia; Reuters; Standard Bank Research
Sources: Bloomberg; Standard Bank Research
Sources: Bloomberg; NSX; Standard Bank Research
Namibia
USD/ZAR is expected to continue going higher in H1:12, in line with the stronger USD and generally gloomy risk sentiment. However, we are reasonably comfortable there could be a reversal of the trajectory in H2:12. Probably the key driver will be developments in the EZ, now facing its third year of worries about fiscal and debt sustainability. That said, we are not looking for risk senti-ment to turn so bearish that we see a massive reversal of foreign investor equity and bond positions, threatening the funding of the C/A deficit, which will require around USD1.2bn monthly. Moreover, the SARB will be less keen to hold down the value of the ZAR via its usual monthly FX reserve accumulation, which has averaged USD440m per month over the last 10 years. Indeed, the SARB may even get involved in supporting the ZAR if the market becomes disorderly.
5.0
6.5
8.0
9.5
11.0
91-d 182-d 364-d 3-y 9-y 15-y
%
6-m forecast Jul-11 Dec-11
40
75
110
145
180
215
250
200
450
700
950
1,200
Jan-05 May-07 Sep-09 Jan-12
Overall index Local index
Overall index Local index
6.0
7.5
9.0
10.5
12.0
Dec-06 Mar-08 Jun-09 Aug-10 Nov-11 Feb-13
USD/NAD
History Forw ards Forecast

67 Fixed Income Research
African Markets Revealed — January 2012
Namibia: annual indicators
Notes: pe — period end; pa — period average; na — not available; nr — not rated
Sources: Bank of Namibia; Bloomberg; CBS; Ministry of Finance; IMF; Standard Bank Research
Namibia
2007 2008 2009 2010 2011e 2012f 2013f
Output
Population (million) 2.0 2.1 2.1 2.1 2.2 2.2 2.3
Nominal GDP (NADbn) 62.1 72.9 75.7 81.5 89.3 99.0 109.0
Nominal GDP (USDbn) 8.8 8.8 9.2 11.2 12.3 12.9 14.8
GDP / capita (USD) 4,355 4,268 4,366 5,205 5,639 5,807 6,498
Real GDP growth (%) 5.4 4.3 -0.4 6.6 3.8 4.3 4.5
Central Government Operations
Budget balance (excl. Grants) / GDP (%) 4.2 1.9 -1.4 -8.0 -9.5 -5.2 -6.8
Budget balance (incl. Grants) / GDP (%) 4.3 2.0 -1.1 -7.6 -9.2 -5.0 -6.7
Domestic debt / GDP (%) 20.0 12.0 12.9 15.0 23.0 26.7 30.3
External debt / GDP (%) 5.0 4.3 4.8 5.2 4.3 4.1 4.3
Balance of Payments
Exports (USDbn) 2.4 2.5 3.2 4.0 4.6 4.7 5.4
Imports (USDbn) 2.5 3.1 4.4 4.9 5.2 5.2 6.1
Trade balance (USDbn) -0.1 -0.5 -1.3 -0.9 -0.7 -0.5 -0.7
Current account (USDbn) 0.7 0.2 0.2 0.0 0.2 0.4 0.3
- % of GDP 7.4 2.4 1.8 -0.3 2.0 3.0 2.0
Financial account (USDbn) -0.5 -0.1 -0.2 -0.2 -0.2 -0.3 -0.3
- FDI (USDbn) 0.6 0.6 0.5 0.8 1.0 1.0 1.2
Basic balance / GDP (%) 14.0 8.9 7.6 6.9 10.4 11.1 10.3
FX reserves (USDbn) pe 0.9 1.3 2.1 1.7 1.9 2.1 2.4
- Import cover (months) pe 4.3 5.0 5.5 4.1 4.3 4.8 4.7
Sovereign Credit Rating
S&P nr nr nr nr nr nr nr
Moody’s nr nr nr nr nr nr nr
Fitch BBB- BBB- BBB- BBB- BBB- BBB- BBB-
Monetary & Financial Indicators
Consumer inflation (%) pa 6.7 10.3 8.8 4.5 5.1 6.3 5.6
Consumer inflation (%) pe 7.1 10.9 7.0 3.1 7.2 5.9 5.6
M2 money supply (% y/y) pa 19.4 18.5 66.8 7.3 8.0 16.2 15.8
M2 money supply (% y/y) pe 10.2 17.4 70.0 9.0 10.7 15.4 15.4
BON bank rate (%) pa 9.6 10.5 7.7 6.9 6.0 6.0 6.5
BON bank rate (%) pe 10.5 10.0 7.0 6.0 6.0 6.0 6.5
3-m rate (%) pe 9.8 11.3 7.4 5.4 6.1 6.2 6.2
5-y rate (%) pe 9.9 7.3 8.2 5.9 6.6 7.0 7.0
USD/NAD pa 7.02 8.26 8.25 7.31 7.25 7.65 7.38
USD/NAD pe 6.86 9.53 7.40 6.63 8.20 7.30 7.52
REER pa 92.9 90.0 92.6 96.4 95.5 94.3 95.0
NEER pa 90.1 86.5 90.1 94.0 93.3 92.7 93.0

African Markets Revealed — January 2012
68 Fixed Income Research
Nigeria: pushing through structural reforms
The government and unions agreed on a 50% increase in fuel prices following a nationwide strike in Jan 12 to pro-test the full deregulation of the sector. Nevertheless, the authorities still see the removal of the fuel subsidy as a key step to boost private sector participation in the refin-ing business and address major fiscal and economic dis-tortions. Other critical reforms have yet to be adopted, including the Petroleum Industry Bill, or effectively imple-mented in the case of the Sovereign Wealth Fund bill. Nigerians are also awaiting promised reforms in the power sector that should ultimately smooth electricity shortages. Clearly, 2012 will test the administration’s ability to deliver in these areas. Meanwhile, security is-sues have also come to the fore, given the continued and increasingly sophisticated attacks by the Boko Haram group in the northern and central regions.
Official figures suggest GDP growth reached 7.2% y/y in H1:11 and 7.4% in Q3:11, driven by non-oil growth. Growth in agriculture (43.6% of GDP in Q3:11) has con-sistently averaged 5.5% over the period. Services, whole-sale and retail trade as well as building and construction have expanded by more than 10%. Still, these sectors may come under pressure as the fuel subsidy is ad-justed, resulting in substitution effects within the private consumption category. Oil growth has surprisingly contin-ued to underperform (4.3% in Q3:11), despite a favour-able trend in crude output (c2.11m in 2011) and surge in prices. Yet elevated government oil revenue will sustain aggregate demand, at least until some tangible fiscal consolidation materialises. The NBS plans to rebase GDP this year which means Nigeria could overtake South Africa as the largest African economy in a few years.
Political risk: delivering structural reforms Election results (2011)
GDP growth: steady economic expansion Composition of GDP
Quarterly indicators
Notes: pe — period end; pa — period average; na — not available
Sources: Central Bank of Nigeria; National Bureau of Statistics; Budget Office of the Federation; NNPC; IMF; Standard Bank Research
Sources: Central Bank of Nigeria; IMF; Standard Bank Research
Source: INEC
Q1:10 Q2:10 Q3:10 Q4:10 Q1:11 Q2:11 Q3:11e Q4:11f Q1:12f Q2:12f Q3:12f Q4:12f
GDP (% y/y) pa 7.4 7.7 7.9 8.36 6.6 7.7 7.4 8.1 6.9 7.1 7.3 7.4
CPI (% y/y) pa 14.9 14.0 13.4 12.6 12.0 11.3 9.7 10.6 11.6 13.2 14.3 12.1
M2 (% y/y) pa 17.7 21.5 21.1 9.6 8.1 10.8 11.4 10.2 17.8 16.9 18.0 22.0
CA/GDP (%) pa 4.2 5 -8.2 8.8 8.5 11.5 8.0 8.2 10.4 12.2 11.3 10.7
FX reserves (USD bn) pe 40.3 37.4 34.5 32.3 33.2 31.9 31.7 32.9 33.5 34.5 35.4 36.5
Import cover (months) pe 9.0 8.3 7.7 7.2 7.5 7.2 7.2 7.4 10.0 10.3 10.6 10.9
3-m rate (%) pe 1.4 2.7 5.7 7.5 9.0 7.6 10.9 15.4 15.4 15.7 15.8 15.9
5-y rate (%) pe 4.3 7.0 9.3 11.6 12.7 12.0 12.5 15.1 15.3 15.6 16.6 16.3
USD/NGN pa 150.4 151 151 151.7 153.6 155.4 154.3 160.4 160.2 160.5 161.3 160.9
REER (Q4:05=100) pe 115 120 120 119 119 120 118 115 116 118 118 116
NEER (Q4:05=100) pe 84 87 85 83 82 81 82 78 78 78 77 78
Presidential election Party % of votes
Goodluck Jonathan PDP 58.89
Muhammadu Buhari CPC 31.98
Mallam Nuhu Ribadu ACN 5.41
Legislative election House of Reps. Senate
PDP 123 45
ACN 47 13
CPC 30 5
Others 9 4
Ibrahim Shekarau ANPP 2.40
ANPP 25 7
Seats still to be declared 126 37
Total 360 109
-2
0
2
4
6
8
2007 2008 2009 2010 2011e 2012f 2013f
%
PCE GE GFCF Netex GDP

69 Fixed Income Research
African Markets Revealed — January 2012
Official trade statistics remain problematic because of the continued disconnect between CBN and NBS time series and an unexplained surge in imports in 2010. This spike pushed down the aggregate trade balance and C/A sur-plus to record lows. Unlike the NBS data, CBN figures point to an improvement in the trade balance in 2011. We expect the import discrepancy to be eventually ad-dressed and see Nigeria posting a C/A surplus of 11.2% of GDP in 2012. The magnitude of the errors and omis-sions category in the financial account mitigates its rele-vance, although we still anticipate some modest pick-up in FDI and portfolio inflows this year. The key challenge on the BoP side will be to rebuild FX reserves (USD32.9bn in Dec 11 [7.4-m of import cover]) and fiscal savings in the MT, which will require the effective launch of the SWF and improved NGN confidence.
The 2012 budget draft freezes recurrent expenditure at NGN2.47tr, from NGN2.43tr in 2011, while capex spend-ing will rise to NGN1.32tr, from NGN1.15tr. At NGN560.0bn, public debt service implies an interest-to-FG revenue ratio of 15.4%. Total expenditure will only increase 5.9% to NGN4.75tr and represents a decline in real terms. The draft estimates federally-collected reve-nue at NGN9.40tr; the FG’s share is NGN3.64tr and re-sults in a budget deficit of NGN1.11tr (2.7% of GDP). The decline in the implied deficit is a favourable trend, but it overlooks the full fiscal picture, notably the position of the states and above-the-line expenditure. Also, fiscal sav-ings are critically low, at less than 2% of GDP vs. a me-dian of c67% among oil exporting countries. This makes urgent the effective launch of the SWF and accumulation of proceeds previously spent on the fuel subsidy.
Fiscal policy: timid steps in the right direction Government budget
Balance of payments: C/A likely to improve Current account developments
The CBN adopted a tight monetary policy stance last year to offset liquidity-driven pressures on USD/NGN and ensure real interest rates. Overall, it has hiked the MPR (currently 12%), SDF (10%), SLF (14%) and CRR (8%) rates by 600 bps, 900 bps, 600 bps and 700 bps since Sep 10 and pursued aggressive OMO to mop up liquidity. While the CBN paused rate hikes for the first time in more than a year at the Nov 11 MPC, the expected tran-sitory inflation shock associated with the increase in fuel prices in early 2012 is likely to result in further, albeit not proportional, hikes in the MPR. Inflation stood at 10.5% y/y in Nov 11, and will probably average 10.9% y/y in 2011, but we see it increasing to 12.8% y/y in 2012 primarily on the back of higher utility, transport and food prices. Meanwhile, private sector credit growth appeared to recover in H2:11, reaching 15.5% y/y in Nov.
Monetary policy: expected inflationary shock Inflation and interest rates
Sources: Central Bank of Nigeria; Standard Bank Research
Sources: Ministry of Finance; Standard Bank Research
Sources: NBS; Reuters; Standard Bank Research
Nigeria
% of GDP 2010 2011
Expenditure 13.2 12.9
Capital expenditure 3.1 3.3
Recurrent expenditure 7.6 7.0
Service debt 1.5 1.4
Supplementary budget 1.5 0.0
Total expenditure 14.7 12.9
Oil price assumption (US$/bbl) 60.0 75.0
Oil production assumption (m bbl)
2.20 2.30
Statutory transfers 1.0 1.2
2012
11.2
3.2
5.9
0.8
1.3
0.0
11.2
70.0
2.48
Budgeted FG Revenue 9.0 9.7 8.5
Exchange rate assumption 150 150 155
Domestic debt 15.6 15.7 15.4
Fiscal deficit -4.2 -3.3 -2.7
-40
-10
20
50
80
2007 2008 2009 2010 2011e 2012f 2013f
USD bn
Trade Services
Income Transfers
Current Account
-5
4
13
21
30
Jan-06 Jan-07 Jan-08 Jan-09 Jan-10 Jan-11
%
Headline inflation Food inflation
90-day NIBOR MPR

African Markets Revealed — January 2012
70 Fixed Income Research
The yield curve has been inverted since the sharp in-crease in policy rates at the 10 Oct 11 MPC. While ST rates have remained exceptionally high, bond rates dropped in late 2011, driven by institutional demand, notably after the neutral interest rate decision at the 21 Nov 11 MPC. The expected transitory inflation shock associated with the shift in fuel prices and the risk of fur-ther monetary tightening will at some point generate at-tractive re-entry points into the bond market. For now, we would recommend a carry trade at the short end of the curve (the 364-d T-bill yield has fluctuated around 20% lately). At a yield of 6.0% and spread of 433 bps (12 Jan 12), Nigeria’s Eurobond has broadly traded sideways since Nov 11, but the price will be sensitive to global risk perception and oil metrics on the downside and the im-plementation of structural reforms on the upside.
The CBN moved the mid-point of its USD/NGN target to 155 (from 150) in late 2011, aligning it with the exchange rate assumption of the 2012 budget. It also tightened the requirements for participation at the WDAS window on 10 Oct 11 which has, however, placed incremental pressure on the interbank FX market. As a result, the CBN has also become a major player in the interbank market as it seeks to control the spread between the two exchanges rates. As such, we expect USD/NGN to fluctuate around 160 in the foreseeable future assuming the oil price re-mains relatively robust. The CBN is committed to ex-change rate stability since a sizeable depreciation would not improve external competitiveness and result in a spike in imported inflation. On the upside, a rebound in FX reserves (via increased fiscal savings and the launch of the SWF) would certainly support the NGN.
FX outlook: stability at a higher USD/NGN level USD/NGN: forwards versus forecast
Bond curve: attractive carry trade Changes in yield curve
Equity market: banking sector consolidation Nigerian Stock Exchange
Sources: Reuters; Standard Bank Research
Sources: Bloomberg; Standard Bank Research
Sources: Central Bank of Nigeria; Standard Bank Research
Nigeria
Increased risk aversion in 2011 has not been conducive for the NSE as foreign investors reduced their exposure to frontier market equities. Additionally, continued upward pressure on USD/NGN, loose fiscal metrics and the slow pace of reforms have also deterred foreign participation, even despite attractive valuations. Meanwhile, the surge in T-bill rates, amid significant monetary policy tightening by the CBN, has curtailed domestic appetite for stocks. The NSE lost 16.3% last year, marginally outperforming the MSCI EM (-18.7%) and MSCI FM (-21.6%) indices. That said, the woes in the Nigerian financial system have been broadly addressed, with AMCON acquiring banks’ NPLs, and when necessary, taking direct control of some institutions. Acquisition deals were also initiated (incl. Oceanic and Intercontinental), which should ensure some structural consolidation in the banking sector.
YTM
12.5
15.0
17.5
20.0
22.5
91d 182d 1y 2y 3y 5y 10y 20y
13-Oct-11 17-Jan-12 6-m forecast
100 = Jan 05
30
108
185
263
340
Dec-01 May-04 Nov-06 May-09 Oct-11
NSE MSCI EM MSCI Africa
110.0
132.5
155.0
177.5
200.0
Dec-06 Mar-08 Jun-09 Aug-10 Nov-11 Feb-13
USD/NGN
History Forw ards Forecast

71 Fixed Income Research
African Markets Revealed — January 2012
Nigeria: annual indicators
Notes: pe — period end; pa — period average; na — not available; nr — not rated
Sources: Central Bank of Nigeria; NBS; Budget Office of the Federation; NNPC; IMF; Standard Bank Research
Nigeria
2007 2008 2009 2010 2011e 2012f
Output Population (million) 145.5 150.8 156.3 162.0 167.9 174.0
Nominal GDP (NGNbn) 20,678 23,842 24,794 29,206 34,577 41,479
Nominal GDP (USDbn) 164.4 201.2 165.5 193.4 221.8 258.1
GDP / capita (USD) 1,129 1,334 1,059 1,194 1,321 1,483
Real GDP growth (%) 6.3 6.0 7.0 7.8 7.5 7.2
Real Non-oil GDP growth (%) 9.8 9.0 8.3 8.4 8.5 8.1
Oil production (mbpd) 2.15 2.35 1.83 2.07 2.11 2.15
Bonny Light reference price (USD pb) 74.6 89.0 65.1 81.2 113.5 108.4
Central Government Operations Budget balance / GDP (%) -1.2 -2.3 -3.0 -4.2 -3.3 -2.7
Domestic debt / GDP (%) 11.1 9.7 13.0 15.6 15.7 15.4
External debt / GDP (%) 2.2 2.1 2.4 2.5 2.6 2.8
Excess Crude Account (USDbn; net) 14.2 18.3 13.6 0.3 3.5 6.0
Balance Of Payments Exports (USDbn) 66.6 84.1 60.0 75.1 89.9 85.0
Imports (USDbn) 30.4 36.9 29.4 53.8 53.0 40.2
Trade balance (USDbn) 23.7 47.2 30.6 21.3 36.9 44.8
Current account (USDbn) 31.2 42.2 23.2 4.8 20.1 28.8
- % of GDP 19.0 21.0 14.0 2.5 9.1 11.2
Financial account (USDbn) -40.4 -43.7 -12.6 5.3 -20.7 -32.4
- FDI (USDbn) 6.0 5.5 5.8 3.7 6.5 7.5
Basic balance / GDP (%) 22.6 23.7 17.5 4.4 12.0 14.1
FX reserves (USDbn) pe 51.5 53 42.4 32.3 32.9 36.5
- Import cover (months) pe 20.3 17.2 17.3 7.2 7.4 10.9
Sovereign Credit Rating
S&P BB- BB- B+ B+ B+ B+
Moody’s NR NR NR NR NR nr
Fitch BB- BB- BB- BB- BB- BB-
Monetary & Financial Indicators
Consumer inflation (%) pa 5.4 11.5 12.6 13.8 10.9 12.8
Core inflation (ex. food & energy, %) pa 3.2 6.7 11.2 12.0 10.8 12.2
Food inflation (%) pa 1.9 16.0 15.0 14.8 10.2 13.4
M2 money supply (% y/y) pa 23.1 78.3 18.1 17.5 10.1 18.7
M2 money supply ( %y/y) pe 30.6 58.2 17.5 6.7 12.5 20.9
Policy interest rate (%) pa 8.8 9.9 7.4 6.1 8.9 12.5
Policy interest rate (%) pe 9.50 9.75 6.0 6.25 12.00 13.00
3-m rate (%) pe 7.8 4.5 3.5 7.5 15.4 15.9
1-y rate (%) pe 9.6 5.3 5.2 10.5 19.4 20.1
3-y rate (%) pe 8.6 8.6 6.7 11.3 15.4 16.1
5-y rate (%) pe 9.6 11.5 8.3 11.6 15.1 16.3
USD/NGN pa 125.8 118.5 149.8 151.0 155.9 160.7
USD/NGN pe 117.9 139.7 150.3 152.0 162.3 161.1
2013f
180.4
48,783
302.2
1,676
7.1
8.0
2.25
107.2
-2.0
15.1
2.8
10.8
87.6
41.1
46.5
31.0
10.2
-36.4
8.7
13.1
41.9
12.2
B+
nr
BB-
10.5
10.2
11.1
22.0
20.2
12.0
11.5
14.2
17.4
14.6
15.0
161.4
162.0
NEER (Q4:05=100) pa 98 102 86 85 81 78 78
REER (Q4:05=100) pa 105 117 109 118 118 117 115

African Markets Revealed — January 2012
72 Fixed Income Research
Republic of the Congo: output diversification is key
The ruling PCT remains the dominant political party in the Congo and will probably win the parliamentary elections scheduled for 2012, which the government is publicly committed to make transparent and peaceful. President Denis Sassou N’Guesso’s speech on New Year’s eve highlighted the improved security situation and favour-able economic position of the Congo. Some of the meas-ures announced by the head of state, including a 10% increase in the public sector minimum wage and a 50% rise in student stipends, suggest the authorities are also keen to widen their support base ahead of the forthcom-ing elections. The opposition remains fragmented and even split over the government’s attempt to consensually discuss some of its demands regarding the technical framework of the polls (reshaping electoral constituen-cies, funding of the electoral commission, revision of electoral lists).
We project GDP growth at 6.2% for 2011 and 6.5% for 2012, down from the 8.9% recorded in 2010. The decel-eration in 2011 was a product of an unscheduled stop-page of oil output in Q1:11. Inauspiciously, it looks like oil production has virtually peaked, which means the sec-tor’s contribution to growth is set to slide. In the mean-time, the elevated oil price will still continue to support aggregate demand. The sizeable increase in public sec-tor capital expenditure this year will also underpin invest-ment. Furthermore, there are increasing signs suggesting the non-oil economy is starting to edge up, as illustrated by the telecoms, communications, transportation and timber sectors. Economic diversification, infrastructure development and reforms designed to improve the busi-ness environment will remain on the authorities’ agenda in 2012.
Quarterly indicators
Political risk: PCT still the dominant force Election results
GDP growth: diversifying output Composition of GDP
Notes: pe — period end; pa — period average; na — not available Sources: BEAC; IMF; Standard Bank Research
Sources: IMF; Standard Bank Research
Presidential election (2009) % of votes
Denis Sassou-Nguesso (PCT) 78.6
Joseph Kignoumbi Kia Mboungou (Ind) 7.5
Mathias Dzon (ARD) 2.3
Joseph Hondjouila Miokono (Ind) 2.0
Legislative election (2007) Seats
Congolese Labour Party (PCT) + allies 88
Pan-African Union for Social Democracy (UPADS)
11
Union for Democracy and the Republic (UDR)
1
Independents 37
Total 137
Nicephore Fylla de Saint-Eudes (PRL) 7.0
Source: Republic of Congo Electoral Commission
Q1:10 Q2:10 Q3:10 Q4:10 Q1:11 Q2:11 Q3:11e Q4:11f Q1:12f Q2:12f Q3:12f Q4:12f
GDP (% y/y) pa 8.7 9.2 9.1 8.5 4.9 5.8 7.1 7.0 7.5 6.5 6.1 6.0
CPI (% y/y) pa 0.5 -0.4 1.3 2.1 1.3 1.6 0.6 2.6 2.9 3.4 4.1 3.6
M2 (% y/y) pa 10.0 12.4 17.5 34.4 35.9 47.6 39.5 27.5 30.1 22.5 24.2 25.9
Trade balance GDP (%) pa 54.7 59.8 61.6 62.3 50.8 70.3 72.6 69.8 62.7 56.7 52.2 51.4
FX reserves (USDm) pe 3.8
3.6
4.3
4.4
5.2
5.7
5.9
6.2
6.5
6.9
7.3
7.8
Import cover (months) pe 13.0 12.3 14.6 15.2 12.7 14.0 14.4 15.2 16.0 17.0 18.0 19.2
BEAC financing rate (%) pe 4.25 4.25 4.0 4.0 4.0 4.0 4.0 4.0 4.0 4.0 4.0 4.0
USD/XAF pe 482 537 483 491 466 452 492 509 519 536 548 525
-9.0
-4.5
0.0
4.5
9.0
2007 2008 2009 2010 2011e 2012f 2013f
% y/y
PE GE GFCF Netex GDP
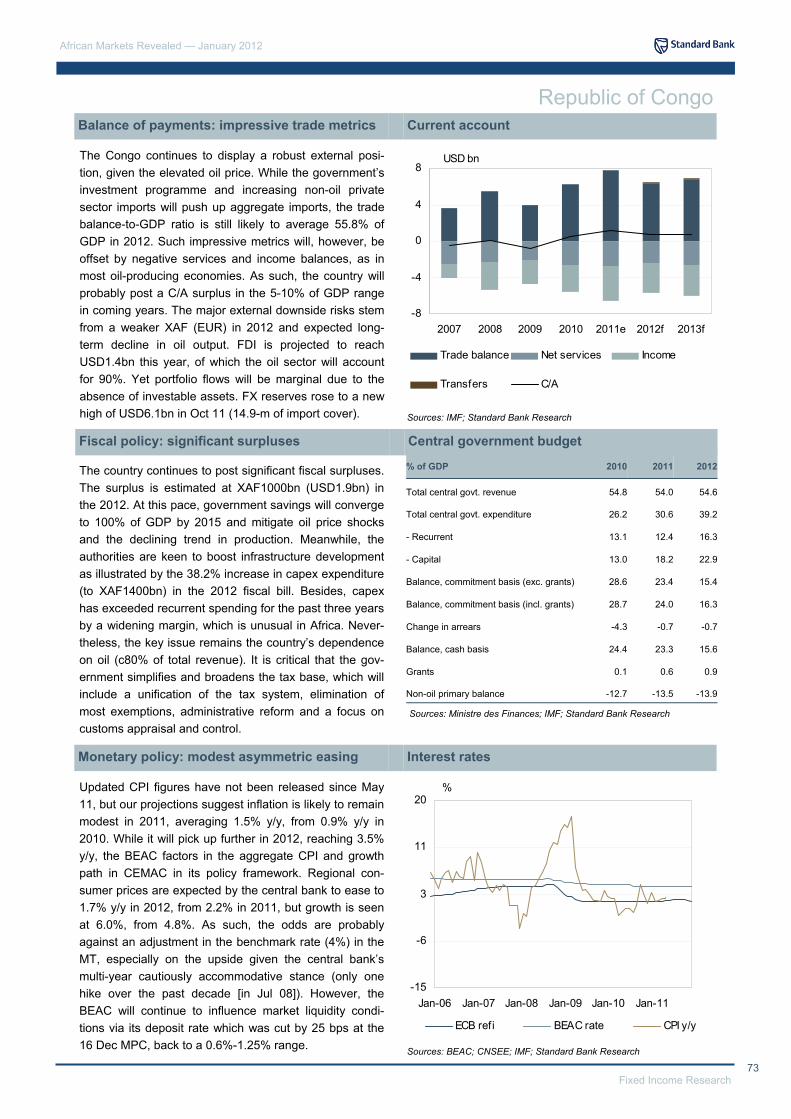
73 Fixed Income Research
African Markets Revealed — January 2012
The Congo continues to display a robust external posi-tion, given the elevated oil price. While the government’s investment programme and increasing non-oil private sector imports will push up aggregate imports, the trade balance-to-GDP ratio is still likely to average 55.8% of GDP in 2012. Such impressive metrics will, however, be offset by negative services and income balances, as in most oil-producing economies. As such, the country will probably post a C/A surplus in the 5-10% of GDP range in coming years. The major external downside risks stem from a weaker XAF (EUR) in 2012 and expected long-term decline in oil output. FDI is projected to reach USD1.4bn this year, of which the oil sector will account for 90%. Yet portfolio flows will be marginal due to the absence of investable assets. FX reserves rose to a new high of USD6.1bn in Oct 11 (14.9-m of import cover).
The country continues to post significant fiscal surpluses. The surplus is estimated at XAF1000bn (USD1.9bn) in the 2012. At this pace, government savings will converge to 100% of GDP by 2015 and mitigate oil price shocks and the declining trend in production. Meanwhile, the authorities are keen to boost infrastructure development as illustrated by the 38.2% increase in capex expenditure (to XAF1400bn) in the 2012 fiscal bill. Besides, capex has exceeded recurrent spending for the past three years by a widening margin, which is unusual in Africa. Never-theless, the key issue remains the country’s dependence on oil (c80% of total revenue). It is critical that the gov-ernment simplifies and broadens the tax base, which will include a unification of the tax system, elimination of most exemptions, administrative reform and a focus on customs appraisal and control.
Balance of payments: impressive trade metrics Current account
Fiscal policy: significant surpluses Central government budget
Monetary policy: modest asymmetric easing Interest rates
Sources: IMF; Standard Bank Research
Sources: BEAC; CNSEE; IMF; Standard Bank Research
Sources: Ministre des Finances; IMF; Standard Bank Research
Updated CPI figures have not been released since May 11, but our projections suggest inflation is likely to remain modest in 2011, averaging 1.5% y/y, from 0.9% y/y in 2010. While it will pick up further in 2012, reaching 3.5% y/y, the BEAC factors in the aggregate CPI and growth path in CEMAC in its policy framework. Regional con-sumer prices are expected by the central bank to ease to 1.7% y/y in 2012, from 2.2% in 2011, but growth is seen at 6.0%, from 4.8%. As such, the odds are probably against an adjustment in the benchmark rate (4%) in the MT, especially on the upside given the central bank’s multi-year cautiously accommodative stance (only one hike over the past decade [in Jul 08]). However, the BEAC will continue to influence market liquidity condi-tions via its deposit rate which was cut by 25 bps at the 16 Dec MPC, back to a 0.6%-1.25% range.
Republic of Congo
% of GDP 2010 2011 2012
Total central govt. revenue 54.8 54.0 54.6
Total central govt. expenditure 26.2 30.6 39.2
- Recurrent 13.1 12.4 16.3
- Capital 13.0 18.2 22.9
Balance, commitment basis (exc. grants) 28.6 23.4 15.4
Balance, commitment basis (incl. grants) 28.7 24.0 16.3
Change in arrears -4.3 -0.7 -0.7
Balance, cash basis 24.4 23.3 15.6
Grants 0.1 0.6 0.9
Non-oil primary balance -12.7 -13.5 -13.9
-8
-4
0
4
8
2007 2008 2009 2010 2011e 2012f 2013f
USD bn
Trade balance Net services Income
Transfers C/A
-15
-6
3
11
20
Jan-06 Jan-07 Jan-08 Jan-09 Jan-10 Jan-11
%
ECB refi BEAC rate CPI y/y

African Markets Revealed — January 2012
74 Fixed Income Research
USD/XAF tracks EUR/USD via the EUR/XAF peg (655.9), a mechanism that has been in place since 1960. The EUR/XAF peg was adjusted only once in 1994, at a time when CFA countries experienced significant fiscal and external distortions. Recent media speculation that XAF (XOF) would be devalued has been denied by the BEAC (BCEAO) as well as CEMAC (WAEMU) finance ministers and senior officials. We also believe that there will be no devaluation: this is after all consistent with rela-tively healthy fundamentals and the zone’s positive bal-ance with its French counterparty (the BEAC [BCEAO] places 50% of its net foreign assets with the French Treasury). A weaker XAF would probably not benefit the Congo which is primarily an oil exporter and net importer of goods and services. We see USD/XAF trending higher to 540 in 6-m, before recovering modestly in late 2012.
Eurobond: supportive balance sheet Eurobond yield
FX outlook: EUR/XAF peg to remain USD/XAF: forwards versus forecast
FX reserves: breaking the USD6bn level Credit market: further public saving Sources: Reuters; Standard Bank Research
Sources: Bloomberg; Standard Bank Research
Sources: BEAC; IMF; Standard Bank Research Sources: BEAC; IMF; Standard Bank Research
The Congolese Eurobond traded flat at 70.5 in Jan 12 (a yield of 8.0%), following a rally that took place after the Oct 11 global sell-off. The differential between the EMBI+ spread (379 bps on 10 Jan) and RepCongo’29s spread (637 bps) has narrowed by 29 bps since Nov 11. Further spread compression would be consistent with the Congo’s impressive external balance sheet, rising FX reserves and accumulation of fiscal savings. Besides, the 29s also remain a good defensive play among Euro-bonds issued by oil-producing countries. That said, the bond is already trading near historical highs, which sug-gests any price upside may be limited. The factors con-straining the instrument include its marginal secondary market liquidity and non-inclusion in the EMBI+ index as well as the low step-up coupon (currently 3%). The ex-pected peak in oil output is also a concern.
Republic of Congo
spread over UST
150
538
925
1,313
1,700
Jan-08 Jan-09 Jan-10 Jan-11 Jan-12
Rep Con EMBI+
0.00
2.00
4.00
6.00
8.00
Jan-06 Jan-07 Jan-08 Jan-09 Jan-10 Jan-11
USDbn
-1,700
-1,150
-600
-50
500
Jan-06 Jan-07 Jan-08 Jan-09 Jan-10 Jan-11
XOFbn
Public sector credit Private sector credit
400
440
480
520
560
Dec-06 Mar-08 Jun-09 Aug-10 Nov-11 Feb-13
USD/XAF
History Forw ards Forecast
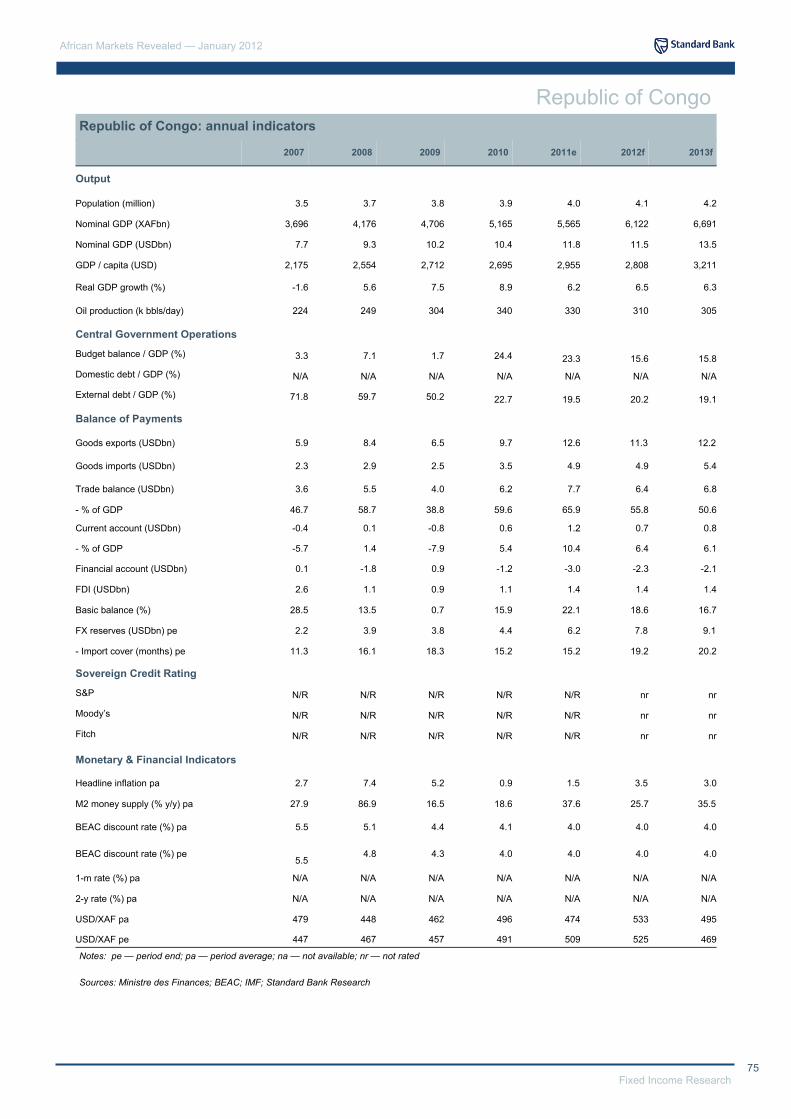
75 Fixed Income Research
African Markets Revealed — January 2012
Republic of Congo: annual indicators
Notes: pe — period end; pa — period average; na — not available; nr — not rated
Sources: Ministre des Finances; BEAC; IMF; Standard Bank Research
Republic of Congo
2007 2008 2009 2010 2011e 2012f 2013f
Output
Population (million) 3.5 3.7 3.8 3.9 4.0 4.1 4.2
Nominal GDP (XAFbn) 3,696 4,176 4,706 5,165 5,565 6,122 6,691
Nominal GDP (USDbn) 7.7 9.3 10.2 10.4 11.8 11.5 13.5
GDP / capita (USD) 2,175 2,554 2,712 2,695 2,955 2,808 3,211
Real GDP growth (%) -1.6 5.6 7.5 8.9 6.2 6.5 6.3
Oil production (k bbls/day) 224 249 304 340 330 310 305
Central Government Operations
Budget balance / GDP (%) 3.3 7.1 1.7 24.4 23.3 15.6 15.8
Domestic debt / GDP (%) N/A N/A N/A N/A N/A N/A N/A
External debt / GDP (%) 71.8 59.7 50.2 22.7 19.5 20.2 19.1
Balance of Payments
Goods exports (USDbn) 5.9 8.4 6.5 9.7 12.6 11.3 12.2
Goods imports (USDbn) 2.3 2.9 2.5 3.5 4.9 4.9 5.4
Trade balance (USDbn) 3.6 5.5 4.0 6.2 7.7 6.4 6.8
Current account (USDbn) -0.4 0.1 -0.8 0.6 1.2 0.7 0.8
- % of GDP -5.7 1.4 -7.9 5.4 10.4 6.4 6.1
Financial account (USDbn) 0.1 -1.8 0.9 -1.2 -3.0 -2.3 -2.1
FDI (USDbn) 2.6 1.1 0.9 1.1 1.4 1.4 1.4
Basic balance (%) 28.5 13.5 0.7 15.9 22.1 18.6 16.7
FX reserves (USDbn) pe 2.2 3.9 3.8 4.4 6.2 7.8 9.1
- Import cover (months) pe 11.3 16.1 18.3 15.2 15.2 19.2 20.2
Sovereign Credit Rating
S&P N/R N/R N/R N/R N/R nr nr
Moody’s N/R N/R N/R N/R N/R nr nr
Fitch N/R N/R N/R N/R N/R nr nr
Monetary & Financial Indicators
Headline inflation pa 2.7 7.4 5.2 0.9 1.5 3.5 3.0
M2 money supply (% y/y) pa 27.9 86.9 16.5 18.6 37.6 25.7 35.5
BEAC discount rate (%) pa 5.5 5.1 4.4 4.1 4.0 4.0 4.0
BEAC discount rate (%) pe
5.5 4.8 4.3 4.0 4.0 4.0 4.0
1-m rate (%) pa N/A N/A N/A N/A N/A N/A N/A
2-y rate (%) pa N/A N/A N/A N/A N/A N/A N/A
USD/XAF pa 479 448 462 496 474 533 495
USD/XAF pe 447 467 457 491 509 525 469
- % of GDP 46.7 58.7 38.8 59.6 65.9 55.8 50.6

African Markets Revealed — January 2012
76 Fixed Income Research
Senegal: decision time
With the 26 Feb presidential election only a few weeks away, we expect the political climate to increasingly heat up. President Abdoulaye Wade has confirmed he will run for a third term, claiming that this will only be his second mandate (if he wins) under the 2007 constitutional amendment. Still, the opposition says the move is illegal. Wade is unlikely to win outright in the first round, given his relative decline in popularity, but the same applies to the divided opposition. The key question is whether the incumbent president’s challenger in the run-off will be able to unify the fragmented opposition. The Bennoo Siggil Senegaal coalition failed to agree on a single can-didate in early Dec 11: both Ousmane Tanor Dieng (PS) and Moustapha Niasse (AFP) will compete in the contest. Two of Wade’s former prime ministers — Idrissa Seck (Rewmi) and Macky Sall (APR) — will also stand.
GDP growth will average 3.9% in 2011, below previous estimates, not least because of the negative impact of persistent power shortages. Additionally, the agriculture sector remained under pressure as output of crops and staples dropped across the board. The overall index of industrial production was only up 1.9% in Jan-Sep 11, with production of phosphate increasing 1.5% and other sub-sectors recording a muted performance. It is prob-able that political uncertainty in late 2011 affected eco-nomic confidence. Besides, the number of tourists de-clined modestly by 2.1% y/y in Jan-Sep 11. We see growth picking up marginally, to 4.1% in 2012, with in-vestment in the energy and transport sectors likely to offset still difficult external conditions. Structural reforms seeking to improve the business climate and governance should also support the outlook.
Quarterly indicators
Political risk: election countdown Election results (2007)
GDP growth: power outages take a toll Contribution to GDP (%)
Notes: pe — period end; pa — period average Sources: IMF; Ministere de l’economie et des finances; Institut National de la Statistiques; Standard Bank Research; Bloomberg
Sources: Senegalese authorities; Standard Bank Research
Source: Senegalese Electoral Commission
Presidential election (25 Feb 07) Party % of votes
Abdoulaye Wade PDS 55.9
Idrissa Seck RP 14.9
Ousemane Tanor Dieng PS 13.5
Parliamentary election (3 Jun 07) Seats % of votes
Parti Democratique Senegalais (PDS) 131 69.2
Takku Defaraat Sénégal coalition 3 5.0
And Defar Sénégal coalition 3 4.9
Others 10 16.5
Moustapha Niasse AFP 5.9
Waar Wi coalition 3 4.4
Total 150 100
Q1:10 Q2:10 Q3:10 Q4:10 Q1:11 Q2:11 Q3:11e Q4:11f Q1:12f Q2:12f Q3:12f Q4:12f
GDP (% y/y) pa 3.7 4 4.4 4.5 4.3 4.0 3.9 3.5 3.2 4.0 4.4 4.6
CPI (% y/y) pa -0.6 0.0 2.5 3.1 3.6 4.5 2.8 2.6 2.9 3.1 3.7 3.6
M2 (% y/y) pa 8.6 12.2 8.7 14.1 12.1 10.7 19.7 16.4 16.8 16.5 10.7 9.8
CA/GDP (%) pa -6.3 -5.9 -6.0 -5.7 -5.9 -5.6 -5.8 -6.0 -8.3 -9.5 -9.9 -9.3
FX reserves (USD bn) pe 2.0 1.9 2.0 2.0 2.2 2.6 2.5 2.6 2.5 2.6 2.6 2.7
Import cover (mths) pe 5.9 5.5 5.8 5.8 5.5 6.4 6.3 6.5 6.5 6.7 6.7 7.0
Marginal lending facility (%) pe 4.25 4.25 4.25 4.25 4.25 4.25 4.25 4.25 4.25 4.25 4.25 4.25
USD/XOF pe 482 537 483 491 466 452 492 509 519 536 548 525
REER (2000=100) pe 103 98 103 102 105 107 104 101 99 99 97 99
NEER (2000=100) pe 104 98 103 102 104 106 103 100 98 98 96 98
2010 2011e 2012f 2013f
Agriculture 0.8 1.1 0.3 0.4 Agriculture 1.1 0.1 0.4 0.5 Livestock and hunting 0.2 0.3 0.2 0.1
Forestry 0.0 0.0 0.0 0.0 Fishing 0.0 0.0 0.1 0.1
Mining 0.6 1.2 1.0 1.1 Fat and oil products 0.0 0.1 0.1 0.1
Utilities -0.1 -0.6 -0.4 -0.3 Construction 0.4 0.1 0.5 0.6
Manufacturing -0.4 0.1 0.0 0.0 Commerce 0.2 0.4 0.3 0.3
Transport & comm 0.8 0.8 0.7 0.7 Education 0.1 0.2 0.1 0.1
Health 0.2 0.1 0.1 0.1
Other services 0.6 0.5 0.5 0.4
Public Administration 0.5 0.6 0.5 0.6 GDP 4.2 3.9 4.1 4.4

77 Fixed Income Research
African Markets Revealed — January 2012
Export volumes rose 20.5% y/y between Jan and Oct 11 based on ANSD figures, driven by the food, semi-finished product, mining and industrial production categories. However, the still narrow export base continued to trans-late into a sizeable trade deficit, especially as imports edged up further on the back of food and manufactured products. Adjusting for the negative income and services balances (and positive current transfers), we expect the C/A deficit to remain in negative territory and even widen to 9.3% of GDP in 2012 due to increased imports of infra-structure goods and a weaker XOF (via EUR/USD). FDI inflows are likely to be modest and portfolio inflows even more marginal, given the limited depth and attractiveness of the local currency debt (equity) market. We see FX reserves reaching USD2.7bn in 2012 (7-m of import cover), from USD2.6bn in 2011.
The fiscal deficit was an estimated 6.5% of GDP (incl. grants) in 2011. With aggregate spending remaining broadly flat in nominal terms in the 2012 budget, the fis-cal deficit-to-GDP ratio is likely to fall to 4.3% (-6.5%, excl. grants). Yet the budget framework allows some adjustment for energy and highway investments. The key issue is now to ensure fiscal sustainability in the long term. This will require a comprehensive tax reform (to be prepared this year), intermediate steps to broaden the tax base and efforts to strengthen revenue collection. The restructuring of the power sector and SENELEC, and even prospective changes to electricity subsidies, are critical to mitigate further budgetary transfers. Finally, a new debt directorate will prepare a MT debt management strategy and release a calendar of domestic bond issu-ance for 2012.
Senegalese inflation, which is 19.6% of the WAEMU CPI basket, eased and subsequently stabilised in H2:11, reaching 2.7% y/y in Nov. It is likely to edge up modestly in the medium term, but will remain in line with traditional inflation rates in WAEMU. The main risk to the CPI path stems from the expected upward trend in USD/XOF and subsequent effect on imported prices. The drop in infla-tion in Côte d’Ivoire (38.1% of the CPI basket) will be sizeable enough to push down regional inflation next year. While economic growth in WAEMU will rebound to c6.4% in 2012 (from c1.2% in 2011), as the Ivorian econ-omy recovers, it remains fragile. We expect the BCEAO to maintain its marginal lending facility and minimum open market rates at 4.25% and 3.25% in the MT, which would be consistent with its focus on interest rate stabil-ity.
Fiscal policy: structural reforms in the pipeline Central government budget
Balance of payments: widening C/A deficit Current account developments
Monetary policy: stable interest rates Inflation and interest rates
Sources: IMF; Standard Bank Research
Sources: Senegalese authorities; Standard Bank Research
Sources: Institut National de la Statistiques; Standard Bank Research
Senegal
% of GDP 2010 2011
Total revenue 19.5 20.3
Total expenditure 27.3 29.2
Current expenditure 15.7 17.5
- interest 0.9 1.2
- subsidies + transfers 3.8 4.9
Capital expenditure 11.6 11.7
Overall balance (- grants) -7.8 -8.9
Overall balance (+ grants) -5.2 -6.5
- wages 6.2 6.1
2012
21.2
27.7
16.4
6.1
1.5
3.4
11.3
-6.5
-4.3
Net domestic borrowing 2.7 2.5 2.3
Net external borrowing 2.5 4.0 1.9
Delays settlement -0.2 -0.1 0.0
Donor support (grants) 2.6 2.4 2.3
-4
-2
0
2
4
2007 2008 2009 2010 2011e 2012f 2013f
USDbn
Trade IncomeServices TransfersCurrent account
-10
-5
0
5
10
Jan-06 Jan-07 Jan-08 Jan-09 Jan-10 Jan-11
%
CPI y/y Money Market rateMarginal lending facility

African Markets Revealed — January 2012
78 Fixed Income Research
The 8.75% USD500m Eurobond (B+ [S&P]; B1 [Moody’s]) has remained under pressure in recent weeks, with its price retreating to 98 (a yield of 9.0%) on 10 Jan. Besides, the spread over UST has continued to increase (709 bps) and the differential with the EMBI+ spread (379 bps) has widened further. At such levels, the 21s offer significant yield pick-up versus comparable issues such as Nigeria 21s, Gabon 17s, Ghana 17s or even Sri Lanka 21s and Vietnam 20s. However, the forthcoming electoral cycle has the potential to weigh negatively on the instru-ment, especially if a run-off adds to political uncertainty. Senegal has incrementally tapped the XOF debt market in recent years and is about to set up a new debt direc-torate which will for the first time release an issuance schedule for 2012. Yet bond rates are not particularly attractive (5.5%-7%) and market liquidity is marginal.
USD/XOF tracks EUR/USD via the EUR/XOF peg (655.9), a mechanism that has been in place since 1960. The EUR/XOF peg was adjusted only once in 1994, at a time when CFA countries experienced significant fiscal and external distortions. Recent media speculation that XOF (XAF) would be devalued has been denied by the BCEAO (BEAC) as well as WAEMU (CEMAC) Finance Ministers and senior officials. We also believe that there will be no devaluation, which is after all consistent with relatively healthy fundamentals and the zone’s positive balance with its French counterparty (the BCEAO [BEAC] places 50% of its net foreign assets with the French Treasury). WAEMU’s external competitiveness is likely to improve further as the EUR weakens amid significant fiscal distortions. We see USD/XOF trending higher to 540 in 6-m, before recovering modestly in late 2012.
Given SONATEL’s c40% weight in the BRVM, its 22.0% decline in 2011 was a major source of the 12.7% drop in BRVM’s main index. SONATEL’s poor performance was due to a 20% drop in profit in H1:11 as the company paid more tax and faced increased competition. A new surtax for international incoming calls also has the potential to affect volumes. Reports of a possible nationalisation by the Senegalese authorities has not helped. SONATEL accounts for a significant share of the (modest) foreign equity participation on the BRVM, which placed down-ward price pressure on the market in 2011. Political un-certainty ahead of the Feb presidential election, coupled with volatile global markets and EUR [XOF weakness], will probably constrain any tangible recovery in SO-NATEL’s stock price in coming months.
Bond outlook: factoring in political risk USD Senegal 8.75% May 2021 bond
FX outlook: unchanged EUR/XOF peg USD/XOF: forwards versus forecast
Equity market: Sonatel stock retreats Bourse Regionale des Valeurs Mobilieres
Sources: Bloomberg; Standard Bank Research
Sources: Reuters; Standard Bank Research
Sources: Bloomberg; Standard Bank Research
Senegal
0
200
400
600
800
Apr-11 Jun-11 Aug-11 Nov-11 Jan-12
spread over UST
Senegal EMBI+
Jan 02= 100
0
275
550
825
1,100
Jan-02 Jan-05 Jan-08 Jan-11
ICX Comp Sonatel
400
440
480
520
560
Dec-06 Mar-08 Jun-09 Aug-10 Nov-11 Feb-13
USD/XOF
History Forw ards Forecast
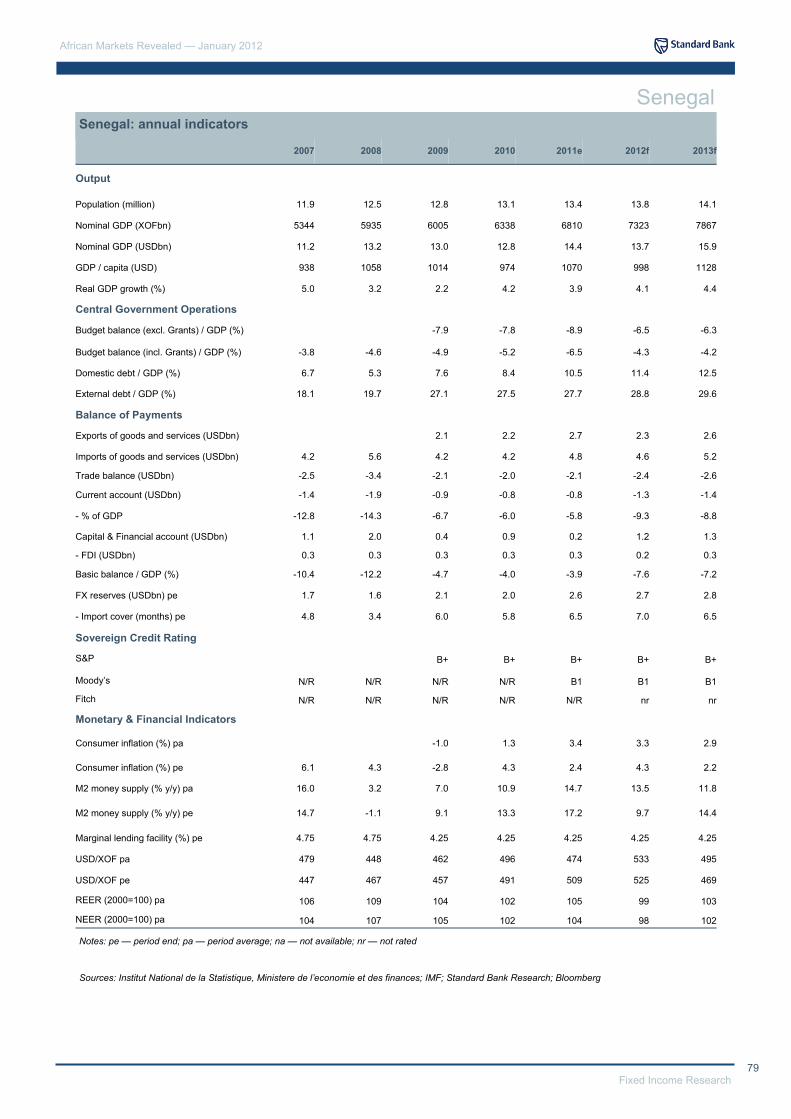
79 Fixed Income Research
African Markets Revealed — January 2012
Senegal: annual indicators
Senegal
Sources: Institut National de la Statistique, Ministere de l’economie et des finances; IMF; Standard Bank Research; Bloomberg
Notes: pe — period end; pa — period average; na — not available; nr — not rated
2007 2008 2009 2010 2011e 2012f 2013f
Output
Population (million) 11.9 12.5 12.8 13.1 13.4 13.8 14.1
Nominal GDP (XOFbn) 5344 5935 6005 6338 6810 7323 7867
Nominal GDP (USDbn) 11.2 13.2 13.0 12.8 14.4 13.7 15.9
GDP / capita (USD) 938 1058 1014 974 1070 998 1128
Real GDP growth (%) 5.0 3.2 2.2 4.2 3.9 4.1 4.4
Central Government Operations
Budget balance (excl. Grants) / GDP (%) -7.9 -7.8 -8.9 -6.5 -6.3
Budget balance (incl. Grants) / GDP (%) -3.8 -4.6 -4.9 -5.2 -6.5 -4.3 -4.2
Domestic debt / GDP (%) 6.7 5.3 7.6 8.4 10.5 11.4 12.5
External debt / GDP (%) 18.1 19.7 27.1 27.5 27.7 28.8 29.6
Balance of Payments
Exports of goods and services (USDbn) 2.1 2.2 2.7 2.3 2.6
Imports of goods and services (USDbn) 4.2 5.6 4.2 4.2 4.8 4.6 5.2
Trade balance (USDbn) -2.5 -3.4 -2.1 -2.0 -2.1 -2.4 -2.6
Current account (USDbn) -1.4 -1.9 -0.9 -0.8 -0.8 -1.3 -1.4
- % of GDP -12.8 -14.3 -6.7 -6.0 -5.8 -9.3 -8.8
Capital & Financial account (USDbn) 1.1 2.0 0.4 0.9 0.2 1.2 1.3
- FDI (USDbn) 0.3 0.3 0.3 0.3 0.3 0.2 0.3
Basic balance / GDP (%) -10.4 -12.2 -4.7 -4.0 -3.9 -7.6 -7.2
FX reserves (USDbn) pe 1.7 1.6 2.1 2.0 2.6 2.7 2.8
- Import cover (months) pe 4.8 3.4 6.0 5.8 6.5 7.0 6.5
Sovereign Credit Rating
S&P B+ B+ B+ B+ B+
Moody’s N/R N/R N/R N/R B1 B1 B1
Fitch N/R N/R N/R N/R N/R nr nr
Monetary & Financial Indicators
Consumer inflation (%) pa -1.0 1.3 3.4 3.3 2.9
Consumer inflation (%) pe 6.1 4.3 -2.8 4.3 2.4 4.3 2.2
M2 money supply (% y/y) pa 16.0 3.2 7.0 10.9 14.7 13.5 11.8
M2 money supply (% y/y) pe 14.7 -1.1 9.1 13.3 17.2 9.7 14.4
Marginal lending facility (%) pe 4.75 4.75 4.25 4.25 4.25 4.25 4.25
USD/XOF pa 479 448 462 496 474 533 495
USD/XOF pe 447 467 457 491 509 525 469
REER (2000=100) pa 106 109 104 102 105 99 103
NEER (2000=100) pa 104 107 105 102 104 98 102

African Markets Revealed — January 2012
80 Fixed Income Research
South Africa: keeping its head above water
Notes: pe — period end; pa — period average; na — not available Sources: South African Reserve Bank; Bloomberg; Standard Bank Research
Politics in 2012 will be dominated by the run-up to the ANC’s end of year conference in Mangaung, where a new leadership will be elected. While there will be consid-erable jockeying between political ANC factions in 2012, the presidential election itself is likely to prove far less important than the inevitably large media reporting and commentary will suggest. We are reasonably comfortable that the president’s job security will not be threatened. Unlike in 2008, when former President Mbeki was effec-tively made a lame duck president, the risks of anyone being prepared to take on Zuma are low. Any such chal-lenge will certainly be seen as a hostile act by the presi-dent and the wider party. Perhaps most importantly, with President Zuma’s tenure secure, the need for him to turn the usual populist election rhetoric into a genuine policy shift is extremely limited.
The slowdown in global economic activity and particularly the fragility in Europe are likely to hold down GDP growth in SA during 2012, and we have revised down our fore-cast to 2.8% y/y, from 3.4% back in Sep 11. Despite poor global conditions, we are not looking for a marked dete-rioration in the net export position. In particular, we are looking for private consumption to slow, which will lower import demand as a result of subdued income growth, poor employment prospects and rising inflation. Although the climate will be difficult (crucially, overall sentiment would have to improve), we remain fairly constructive on the contribution from investment which is being assisted by large cash holdings and low interest rates. Public sec-tor investment is also expected to remain strong, helping to crowd in private investment. Government consumption spending will also remain a robust contributor to overall growth.
Quarterly indicators Q1:10 Q2:10 Q3:10 Q4:10 Q1:11 Q2:11 Q3:11e Q4:11f Q1:12f Q2:12f Q3:12f Q4:12f
GDP (% y/y) pa 1.6 3 3.3 3.6 3.7 3.3 2.9 2.6 2.5 2.8 3.1 2.7
CPI (% y/y) pa 5.7 4.5 3.5 3.5 3.8 4.6 5.4 6.1 6.3 6.1 6.4 6.0
M3 (% y/y) pe 0.9 1.8 4.4 6.8 7.4 6.1 6.2 7.2 7.5 7.9 8.3 8.5
CA/GDP (%) pe -4.0 -2.6 -3.3 -1.5 -2.6 -2.9 -3.8 -4.5 -3.9 -4.3 -3.6 -3.5
FX reserves (USD bn) pe 34.8 34.6 36.0 35.4 40.7 41.1 40.4 40.0 40.1 41.6 42.5 43.5
Import cover (months) pe 5.0 5.3 5.2 5.5 4.7 5.0 4.7 4.3 4.4 4.5 4.5 4.4
3-m rate (%) pe 6.7 6.6 6.0 5.6 5.6 5.6 5.6 5.6 5.6 5.6 5.7 5.8
1-y rate (%) pe 6.6 6.5 6.0 5.5 5.9 5.9 5.4 5.6 5.7 5.8 6.0 6.1
USD/ZAR pe 7.3 7.7 7.0 6.6 6.8 6.8 8.1 8.1 8.2 8.1 7.9 7.8
REER pe 111.3 115.6 117.5 118.9 114.0 114.8 106.8 109.4 110.6 108.0 112.4 116.5
NEER pe 75.4 74.8 77.1 81.3 77.2 76.0 66.5 67.0 65.0 61.0 65.0 68.0
Political developments: the road to Mangaung 2009 general elections
GDP growth: challenged Composition of GDP
Sources: South Africa Reserve Bank; Standard Bank Research
Source: Electoral Commission of South Africa
Presidential election Party % of votes
Jacob Zuma ANC 65.9
Helen Zille DA 16.7
Mvume Dandala Cope 7.4
Mangosuthu Buthelezi IFP 4.5
National election Parliamentary
seats % of votes
African National Congress (ANC) 264 65.9
Democratic Alliance (DA) 67 16.7
Congress of the People (Cope) 30 7.4
Inkatha Freedom Party (IFP) 18 4.5
Other 21 5.5
Total 400 100
-15
0
15
30
2000 2003 2006 2009 2012
% y/y
Netex GFCF GCE PCE GDP
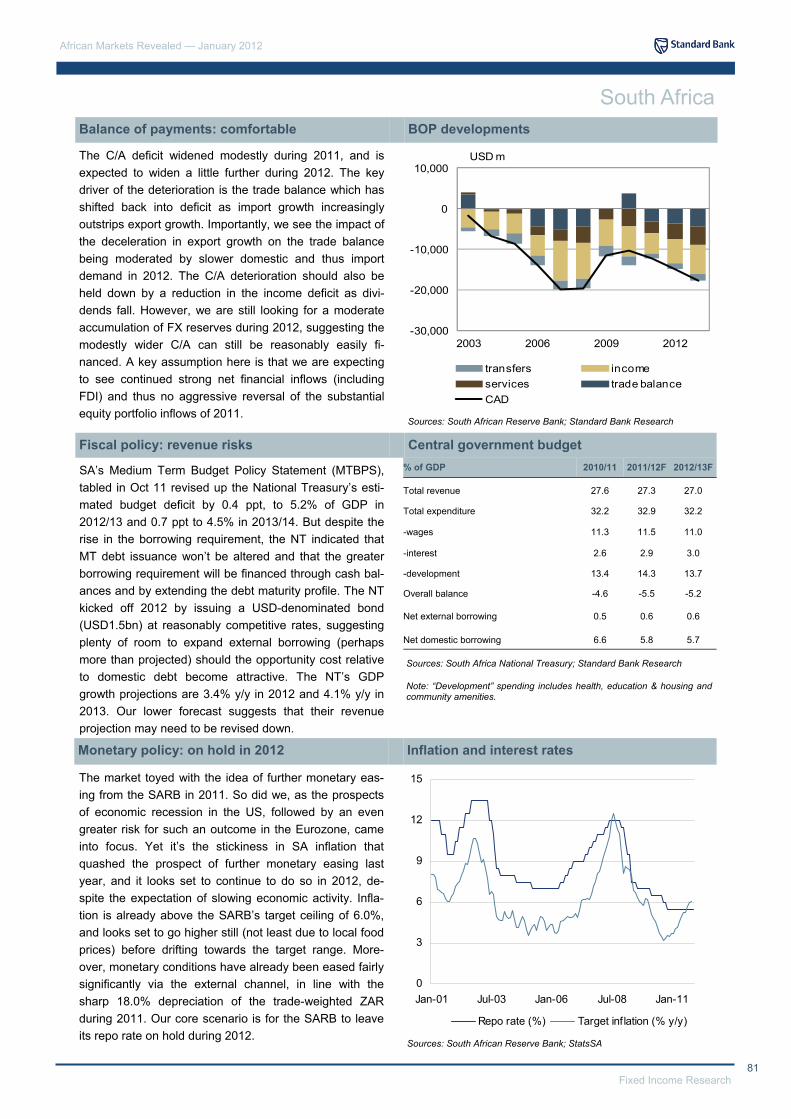
81 Fixed Income Research
African Markets Revealed — January 2012
The C/A deficit widened modestly during 2011, and is expected to widen a little further during 2012. The key driver of the deterioration is the trade balance which has shifted back into deficit as import growth increasingly outstrips export growth. Importantly, we see the impact of the deceleration in export growth on the trade balance being moderated by slower domestic and thus import demand in 2012. The C/A deterioration should also be held down by a reduction in the income deficit as divi-dends fall. However, we are still looking for a moderate accumulation of FX reserves during 2012, suggesting the modestly wider C/A can still be reasonably easily fi-nanced. A key assumption here is that we are expecting to see continued strong net financial inflows (including FDI) and thus no aggressive reversal of the substantial equity portfolio inflows of 2011.
SA’s Medium Term Budget Policy Statement (MTBPS), tabled in Oct 11 revised up the National Treasury’s esti-mated budget deficit by 0.4 ppt, to 5.2% of GDP in 2012/13 and 0.7 ppt to 4.5% in 2013/14. But despite the rise in the borrowing requirement, the NT indicated that MT debt issuance won’t be altered and that the greater borrowing requirement will be financed through cash bal-ances and by extending the debt maturity profile. The NT kicked off 2012 by issuing a USD-denominated bond (USD1.5bn) at reasonably competitive rates, suggesting plenty of room to expand external borrowing (perhaps more than projected) should the opportunity cost relative to domestic debt become attractive. The NT’s GDP growth projections are 3.4% y/y in 2012 and 4.1% y/y in 2013. Our lower forecast suggests that their revenue projection may need to be revised down.
The market toyed with the idea of further monetary eas-ing from the SARB in 2011. So did we, as the prospects of economic recession in the US, followed by an even greater risk for such an outcome in the Eurozone, came into focus. Yet it’s the stickiness in SA inflation that quashed the prospect of further monetary easing last year, and it looks set to continue to do so in 2012, de-spite the expectation of slowing economic activity. Infla-tion is already above the SARB’s target ceiling of 6.0%, and looks set to go higher still (not least due to local food prices) before drifting towards the target range. More-over, monetary conditions have already been eased fairly significantly via the external channel, in line with the sharp 18.0% depreciation of the trade-weighted ZAR during 2011. Our core scenario is for the SARB to leave its repo rate on hold during 2012.
Balance of payments: comfortable BOP developments
Sources: South African Reserve Bank; Standard Bank Research
Monetary policy: on hold in 2012 Inflation and interest rates
South Africa
Fiscal policy: revenue risks Central government budget
Sources: South Africa National Treasury; Standard Bank Research
Sources: South African Reserve Bank; StatsSA
Note: “Development” spending includes health, education & housing and community amenities.
% of GDP 2010/11 2011/12F 2012/13F
Total revenue 27.6 27.3 27.0
Total expenditure 32.2 32.9 32.2
-wages 11.3 11.5 11.0
-interest 2.6 2.9 3.0
-development 13.4 14.3 13.7
Overall balance -4.6 -5.5 -5.2
Net external borrowing 0.5 0.6 0.6
Net domestic borrowing 6.6 5.8 5.7
-30,000
-20,000
-10,000
0
10,000
2003 2006 2009 2012
USD m
transfers incomeservices trade balanceCAD
0
3
6
9
12
15
Jan-01 Jul-03 Jan-06 Jul-08 Jan-11
Repo rate (%) Target inf lation (% y/y)

African Markets Revealed — January 2012
82 Fixed Income Research
Bond yields have been range-bound over the last year, albeit within a relatively broad 110 bps range. With our core scenario for rates to remain on hold again during 2012, we suspect the range will persist in coming months. Within the range, the risks are towards a steep-ening as monetary policy remains on hold, while inflation accelerates and bond issuance might increase. We are looking for inflation to be 6.5% in Q1:12 (from 6.1% y/y in Nov 11) and remain at, or above, the upper end of the SARB’s 6.0% inflation target ceiling throughout 2012. Key to this is the recent spike in local food prices and the ongoing ZAR weakness, which we expect to continue. Indeed, we suspect that SA bonds will generally continue to take their lead from the ZAR. There is also some risk that bond issuance will be increased at the 2012 Budget Review on 22 Feb 12.
USD/ZAR is expected to continue going higher in H1:12, in line with the stronger USD and generally gloomy risk sentiment. However, we are reasonably comfortable there could be a reversal of the trajectory in H2:12. Probably the key driver will be developments in the EZ, now facing its third year of worries about fiscal and debt sustainability. That said, we are not looking for risk senti-ment to turn so bearish that we see a massive reversal of foreign investor equity and bond positions, threatening the funding of the C/A deficit, which will require around USD1.2bn monthly. Moreover, the SARB will be less keen to hold down the value of the ZAR via its usual monthly FX reserve accumulation, which has averaged USD440m per month over the last 10 years. Indeed, the SARB may even get involved in supporting the ZAR if the market becomes disorderly.
Bond curve: weakening bias Changes in yield curve
FX outlook: year of two halves USD/ZAR: forwards versus forecasts
Sources: Bloomberg; Standard Bank Research
Equity market: still tracking the US Johannesburg Stock Exchange vs. Dow
Sources: Bloomberg; Standard Bank Research
South Africa
The JSE All Share was flat in 2011, broadly in line with US equities. However, there was a solid outperformance relative to the MSCI EM index, which fell by 20.4%. The total value of equity capital raised dwindled from R37.9bn in Q1:11 to R11.2bn in Q3:11. Moreover, the poor returns were across most sectors, with construction (down 26% y/y) and platinum (down 28% y/y) faring particularly badly. Oil and gas and food producers fared better, gain-ing 11% y/y and 13% y/y respectively. The JSE’s per-formance was all the more impressive, given the steady outflow of foreign investor equity holdings from SA in H2:11. A reversal of the adverse EM sentiment seen in 2011 is unlikely until we get some form of resolution to the potential liquidity issues facing the EZ banking sys-tem. We are still struggling to see this in H1:12.
Sources: JSE; Standard Bank Research
5.00%
6.25%
7.50%
8.75%
10.00%
1yr 5yr 9yr 13yr 17yr
Dec-10 Dec-11 Dec-12
6,000
8,000
10,000
12,000
14,000
15,000
20,000
25,000
30,000
35,000
Jan 09 Jan 10 Jan 11 Jan 12
Index Index
JSE All Share DJ Industrial Ave. (RHS)
6.0
7.5
9.0
10.5
12.0
Dec-06 Mar-08 Jun-09 Aug-10 Nov-11 Feb-13
USD/ZAR
History Forw ards Forecast

83 Fixed Income Research
African Markets Revealed — January 2012
South Africa: annual indicators
2007 2008 2009 2010 2011e 2012f 2013f
Output
Population (million) 48.5 48.8 49.1 49.1 49.0 50.0 50.5
Nominal GDP (ZARbn) 2,016 2,263 2,398 2,661 2,874 3,133 3,368
Nominal GDP (USDbn) 287.0 274.4 288.6 364.1 354.8 391.6 443.2
GDP / capita (USD) 5,911 5,614 5,809 7,415 7,241 7,833 8,775
Real GDP growth (%) 5.5 3.6 -1.5 2.9 3.2 2.8 2.9
Central Government Operations
Budget balance / GDP (%) 1.7 -1.2 -6.7 -5.3 -4.6 -5.5 -5.2
Domestic debt / GDP (%) 23.4 23.1 27.1 33.0 36.0 39.3 41.1
External debt / GDP (%) 15.5 12.4 9.9 8.7 7.8
Balance Of Payments
Exports of goods (USDbn) 90.35 98.16 79.09 99.57 99.88 101.25 108.55
Imports of goods (USDbn) 98.20 106.54 81.63 100.29 101.85 103.50 111.05
Trade balance (USDbn) -7.85 -8.38 -2.54 -0.72 -1.98 -2.25 -2.50
Current account (USDbn) -20.01 -19.63 -11.68 -10.26 -12.24 -14.88 -17.73
C/A% of GDP -7.0 -7.2 -4.0 -2.8 -3.5 -3.8 -4.0
Financial account (USDbn) 21.85 11.66 13.63 11.08 15.51 15.71 16.54
Net FDI (USDbn) 2.74 12.16 4.30 1.10 1.24 1.88 1.98
Basic balance / GDP (%) -6.02 -2.72 -2.56 -2.51 -3.10 -3.32 -3.55
FX reserves (USDbn) pe 29.63 30.62 32.48 35.43 40.00 43.5 43.5
Import cover (months) pe 5.8 4.7 4.6 4.4 4.4
Sovereign Credit Rating
S&P BBB+ BBB+ BBB+ BBB+ BBB+ BBB+ BBB+
Moody’s Baa1 Baa1 A3 A3 A3 A3 A3
Fitch BBB+ BBB+ BBB+ BBB+ BBB+
Monetary & Financial Indicators Consumer inflation (%) pa 7.1 11.5 7.2 4.1 5.0 6.2 5.4
Consumer inflation (%) pe 8.9 9.5 6.3 3.5 6.3 5.9 5.0
M3 money supply (% y/y) pa 23.2 19.0 6.7 3.5 6.7 8.1 9.0
M3 money supply (% y/y) pe 23.6 14.8 1.8 6.9 7.2 8.5 9.2
SARB policy rate (%) pa 9.7 11.6 8.4 6.4 5.5 5.5 6.3
SARB policy rate (%) pe 11.0 11.5 7.0 5.5 5.5 5.5 7.5
3-m rate (%) pe 11.3 11.4 7.2 5.6 5.6 5.8 7.7
USD/ZAR pe 6.9 9.4 7.4 6.6 8.1 7.8 7.5
REER pa 105.0 94.1 101.4 115.8 111.8 n/a n/a
NEER pa 78.3 65.2 66.8 75.4 71.7 n/a n/a
NEER pa 85.8 78.3 65.2 66.8 75.4 73.8 71.2
USD/ZAR pa 7.0 8.2 8.3 7.3 8.1 8.0 7.6
1-y rate (%) pe 11.2 9.0 7.1 5.5 5.57 6.1 7.9
Notes: pe — period end; pa — period average; na — not available; nr — not rated
Sources: South African Reserve Bank; South Africa National Treasury; Standard Bank Research; Bloomberg
South Africa
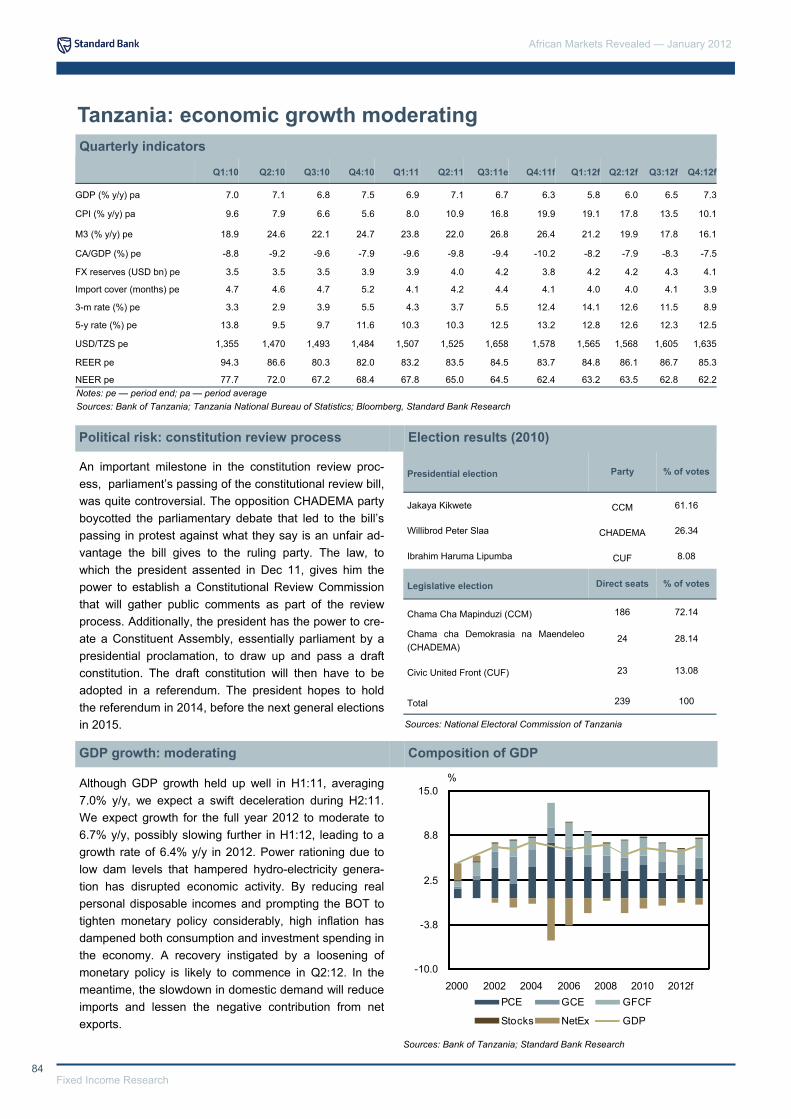
African Markets Revealed — January 2012
84 Fixed Income Research
Tanzania: economic growth moderating
An important milestone in the constitution review proc-ess, parliament’s passing of the constitutional review bill, was quite controversial. The opposition CHADEMA party boycotted the parliamentary debate that led to the bill’s passing in protest against what they say is an unfair ad-vantage the bill gives to the ruling party. The law, to which the president assented in Dec 11, gives him the power to establish a Constitutional Review Commission that will gather public comments as part of the review process. Additionally, the president has the power to cre-ate a Constituent Assembly, essentially parliament by a presidential proclamation, to draw up and pass a draft constitution. The draft constitution will then have to be adopted in a referendum. The president hopes to hold the referendum in 2014, before the next general elections in 2015.
Although GDP growth held up well in H1:11, averaging 7.0% y/y, we expect a swift deceleration during H2:11. We expect growth for the full year 2012 to moderate to 6.7% y/y, possibly slowing further in H1:12, leading to a growth rate of 6.4% y/y in 2012. Power rationing due to low dam levels that hampered hydro-electricity genera-tion has disrupted economic activity. By reducing real personal disposable incomes and prompting the BOT to tighten monetary policy considerably, high inflation has dampened both consumption and investment spending in the economy. A recovery instigated by a loosening of monetary policy is likely to commence in Q2:12. In the meantime, the slowdown in domestic demand will reduce imports and lessen the negative contribution from net exports.
Quarterly indicators
Political risk: constitution review process Election results (2010)
GDP growth: moderating Composition of GDP
Notes: pe — period end; pa — period average Sources: Bank of Tanzania; Tanzania National Bureau of Statistics; Bloomberg, Standard Bank Research
Sources: Bank of Tanzania; Standard Bank Research
Sources: National Electoral Commission of Tanzania
Q1:10 Q2:10 Q3:10 Q4:10 Q1:11 Q2:11 Q3:11e Q4:11f Q1:12f Q2:12f Q3:12f Q4:12f
GDP (% y/y) pa 7.0 7.1 6.8 7.5 6.9 7.1 6.7 6.3 5.8 6.0 6.5 7.3
CPI (% y/y) pa 9.6 7.9 6.6 5.6 8.0 10.9 16.8 19.9 19.1 17.8 13.5 10.1
M3 (% y/y) pe 18.9 24.6 22.1 24.7 23.8 22.0 26.8 26.4 21.2 19.9 17.8 16.1
CA/GDP (%) pe -8.8 -9.2 -9.6 -7.9 -9.6 -9.8 -9.4 -10.2 -8.2 -7.9 -8.3 -7.5
FX reserves (USD bn) pe 3.5 3.5 3.5 3.9 3.9 4.0 4.2 3.8 4.2 4.2 4.3 4.1
Import cover (months) pe 4.7 4.6 4.7 5.2 4.1 4.2 4.4 4.1 4.0 4.0 4.1 3.9
3-m rate (%) pe 3.3 2.9 3.9 5.5 4.3 3.7 5.5 12.4 14.1 12.6 11.5 8.9
5-y rate (%) pe 13.8 9.5 9.7 11.6 10.3 10.3 12.5 13.2 12.8 12.6 12.3 12.5
USD/TZS pe 1,355 1,470 1,493 1,484 1,507 1,525 1,658 1,578 1,565 1,568 1,605 1,635
REER pe 94.3 86.6 80.3 82.0 83.2 83.5 84.5 83.7 84.8 86.1 86.7 85.3
NEER pe 77.7 72.0 67.2 68.4 67.8 65.0 64.5 62.4 63.2 63.5 62.8 62.2
Presidential election Party % of votes
Jakaya Kikwete CCM 61.16
Willibrod Peter Slaa CHADEMA 26.34
Ibrahim Haruma Lipumba CUF 8.08
Legislative election Direct seats % of votes
Chama Cha Mapinduzi (CCM) 186 72.14
Chama cha Demokrasia na Maendeleo (CHADEMA)
24 28.14
Civic United Front (CUF) 23 13.08
Total 239 100
-10.0
-3.8
2.5
8.8
15.0
2000 2002 2004 2006 2008 2010 2012f
%
PCE GCE GFCF
Stocks NetEx GDP
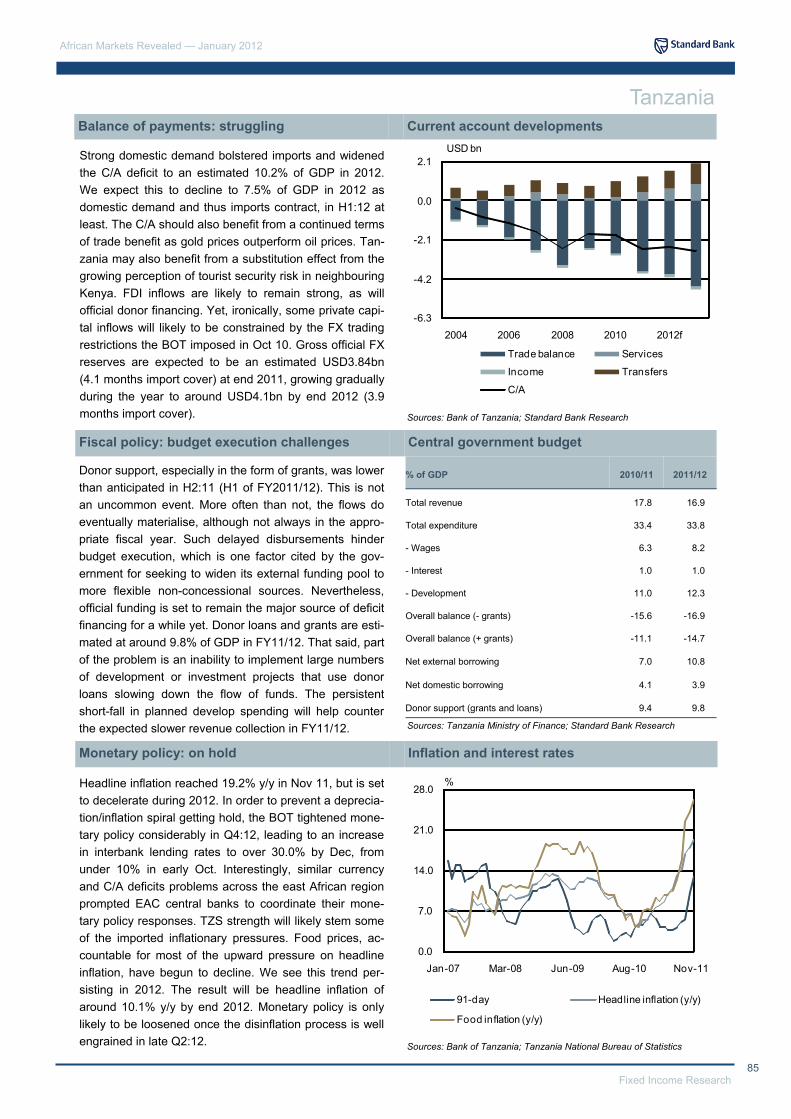
85 Fixed Income Research
African Markets Revealed — January 2012
Strong domestic demand bolstered imports and widened the C/A deficit to an estimated 10.2% of GDP in 2012. We expect this to decline to 7.5% of GDP in 2012 as domestic demand and thus imports contract, in H1:12 at least. The C/A should also benefit from a continued terms of trade benefit as gold prices outperform oil prices. Tan-zania may also benefit from a substitution effect from the growing perception of tourist security risk in neighbouring Kenya. FDI inflows are likely to remain strong, as will official donor financing. Yet, ironically, some private capi-tal inflows will likely to be constrained by the FX trading restrictions the BOT imposed in Oct 10. Gross official FX reserves are expected to be an estimated USD3.84bn (4.1 months import cover) at end 2011, growing gradually during the year to around USD4.1bn by end 2012 (3.9 months import cover).
Donor support, especially in the form of grants, was lower than anticipated in H2:11 (H1 of FY2011/12). This is not an uncommon event. More often than not, the flows do eventually materialise, although not always in the appro-priate fiscal year. Such delayed disbursements hinder budget execution, which is one factor cited by the gov-ernment for seeking to widen its external funding pool to more flexible non-concessional sources. Nevertheless, official funding is set to remain the major source of deficit financing for a while yet. Donor loans and grants are esti-mated at around 9.8% of GDP in FY11/12. That said, part of the problem is an inability to implement large numbers of development or investment projects that use donor loans slowing down the flow of funds. The persistent short-fall in planned develop spending will help counter the expected slower revenue collection in FY11/12.
Headline inflation reached 19.2% y/y in Nov 11, but is set to decelerate during 2012. In order to prevent a deprecia-tion/inflation spiral getting hold, the BOT tightened mone-tary policy considerably in Q4:12, leading to an increase in interbank lending rates to over 30.0% by Dec, from under 10% in early Oct. Interestingly, similar currency and C/A deficits problems across the east African region prompted EAC central banks to coordinate their mone-tary policy responses. TZS strength will likely stem some of the imported inflationary pressures. Food prices, ac-countable for most of the upward pressure on headline inflation, have begun to decline. We see this trend per-sisting in 2012. The result will be headline inflation of around 10.1% y/y by end 2012. Monetary policy is only likely to be loosened once the disinflation process is well engrained in late Q2:12.
Balance of payments: struggling Current account developments
Fiscal policy: budget execution challenges Central government budget
Monetary policy: on hold Inflation and interest rates
Sources: Bank of Tanzania; Standard Bank Research
Sources: Tanzania Ministry of Finance; Standard Bank Research
Sources: Bank of Tanzania; Tanzania National Bureau of Statistics
Tanzania
% of GDP 2010/11 2011/12
Total revenue 17.8 16.9
Total expenditure 33.4 33.8
- Wages 6.3 8.2
- Interest 1.0 1.0
- Development 11.0 12.3
Overall balance (- grants) -15.6 -16.9
Overall balance (+ grants) -11.1 -14.7
Net external borrowing 7.0 10.8
Net domestic borrowing 4.1 3.9
Donor support (grants and loans) 9.4 9.8
-6.3
-4.2
-2.1
0.0
2.1
2004 2006 2008 2010 2012f
USD bn
Trade balance Services
Income Transfers
C/A
0.0
7.0
14.0
21.0
28.0
Jan-07 Mar-08 Jun-09 Aug-10 Nov-11
91-day Headline inflation (y/y)
Food inflation (y/y)
%

African Markets Revealed — January 2012
86 Fixed Income Research
The tightening of liquidity conditions in the money market is likely to push the yield curve higher over the next 6-m. We expect most of the pressure to be concentrated at the short-end of the curve, with the curve remaining inverted beyond the 1-y point for much of this time. Issuance at the longer-end of the curve is unlikely to be consistent, frustrating price discovery. The rejection of all the bids in the 7-y auction on 14 Dec, despite a bid-cover ratio of more than 2, indicates that the BOT is not keen to see long-dated yields push significantly higher. In any event, while inflation is elevated, it is worthwhile postponing issuance of long-dated bonds until inflation peaks and inflation expectations are better anchored. That will probably only occur in Q2:12, when yields are likely to decline on a consistent basis.
The near-term trajectory for USD/TZS is likely to be de-termined by the BOT’s tightening of liquidity conditions in the money market. The BOT has demonstrated its prefer-ence for a stronger TZS by selling USD into the market even when the pair was trading below 1,580. Naturally, the BOT probably considers USD/TZS down-side a key component in the transmission of its tight pol-icy stance to lower inflation. Thus, the near-term bias is towards further TZS appreciation until inflation peaks and the disinflation process becomes engrained. The extent of this downside move is probably limited. Once domestic demand slows and inflation peaks, the BOT is likely to adopt an easing bias, changing the dynamics in the FX market as well. Thus, while a downside bias seems prob-able near term, an upward USD/TZS trajectory is likely to be re-established in H2:12.
Given the regional macro, liquidity and cross-listings problems facing Tanzania’s equity market, it has per-formed reasonably well in 2011 and is likely to continue to do so in 2012. Not least, the cross-listing of African Barrick Gold, with its heavy weight on the market, will mean that gold prices will continue to be a heavy driver of performance. Like in Uganda, interest in the region and perhaps unlisted equities could be a key performance driver. While we accept that it is a longer-term prospect, pension reform and its implementation could present investors with new opportunities in the market. Courtesy of relatively low liquidity, volatility is perhaps the single most important equity market feature in the next 12 months for Tanzania. Even East African Breweries’s sale of its stake in Tanzania Breweries via a placement did not improve the free-float, and is thus unlikely to improve liquidity in the market.
Bond curve outlook: upward pressure Changes in yield curve
FX outlook: further TZS appreciation likely USD/TZS: forwards versus forecasts
Equity market: inching higher Dar es Salaam Stock Exchange
Sources: Bank of Tanzania; Standard Bank Research
Sources: Reuters; Standard Bank Research
Source: Reuters
Tanzania
8.0
11.0
14.0
17.0
20.0
91-d 364-d 5-y 10-y
07-Dec-11 09-Nov-11 6-m forecast
YTM
980
1,070
1,160
1,250
1,340
Jan-07 Apr-08 Jul-09 Oct-10 Dec-11
Index
DSE
1,100
1,288
1,475
1,663
1,850
Dec-06 Mar-08 Jun-09 Aug-10 Nov-11 Feb-13
USD/TZS
History Forw ards Forecast

87 Fixed Income Research
African Markets Revealed — January 2012
Tanzania: annual indicators
Notes: pe — period end; pa — period average, nr — not rated
Sources: Bank of Tanzania; Tanzania National Bureau of Statistics; Bloomberg; Standard Bank Research
Tanzania
2007 2008 2009 2010 2011e 2012f
Output Population (million) 38.3 39.5 40.7 41.9 43.2 44.5
Nominal GDP (TZSbn) 20,914 24,782 28,213 33,937 40,044 51,212
Nominal GDP (USDbn) 16.9 20.7 21.3 23.6 25.3 32.5
GDP / capita (USD) 440 523 523 562 585 730
Real GDP growth (%) 7.1 7.4 6.0 7.1 6.7 6.4
Gold production ('000 Kg) 40.2 36.4 39.1 41.3 44.4 46.7
Tobacco production ('000 MT) 50.8 55.4 60.7 94.4 98.8 99.3
Coffee production ('000 MT) 34.6 56.6 57.3 59.6
Central Government Operations Budget balance (excl. Grants) / GDP (%) -7.1 -10.6 -14.2 -15.6 -16.9 -11.5
Budget balance (incl. Grants) / GDP (%) -0.6 -5.2 -7.0 -11.1 -14.7 -8.3
External debt / GDP (%) 34.7 33.9 36.9 36.8 39.9 41.2
Balance Of Payments Exports of goods and services (USDbn) 4.1 5.6 5.1 6.4 8.0 9.2
Imports of goods and services (USDbn) 6.3 8.7 7.5 9.0 11.4 12.5
Trade balance (USDbn) -2.6 -3.4 -2.5 -2.8 -3.8 -3.9
Current account (USDbn) -1.6 -2.6 -1.8 -1.9 -2.6 -2.4
- % of GDP -9.8 -12.6 -8.3 -7.9 -10.2 -7.5
Financial account (USDbn) 0.9 1.6 1.3 1.6 1.8 2.0
- FDI (USDbn) 0.6 0.4 0.4 0.4 0.5 0.7
Basic balance / GDP (%) -6.3 -10.6 -6.4 -6.0 -8.0 -5.5
FX reserves (USDbn) pe 2.9 2.9 3.5 3.9 3.8 4.1
- Import cover (months) pe 5.5 4.0 5.5 5.2 4.1 3.9
Sovereign Credit Rating S&P nr nr nr nr nr nr
Moody’s nr nr nr nr nr nr
Fitch nr nr nr nr B- B-
Monetary & Financial Indicators Consumer inflation (%) pa 7.0 10.3 12.1 7.2 12.7 16.0
Consumer inflation (%) pe 6.4 13.5 12.5 5.6 19.9 10.1
BOT discount rate (%) pa 19.9 14.1 10.1 7.6 12.1 11.9
BOT discount rate (%) pe 16.4 16.0 3.7 7.6 14.3 10.1
3-m rate (%) pe 10.2 11.3 6.1 5.5 12.4 8.9
1-y rate (%) pe 14.3 13.0 8.9 7.8 19.6 10.7
2-y rate (%) pe 15.0 14.4 10.9 10.4 14.0 12.3 5-y rate (%) pe 17.8 16.4 13.5 11.6 13.2 12.5
USD/TZS pa 1,241 1,199 1,326 1,441 1,585 1,577
USD/TZS pe 1,154 1,318 1,340 1,484 1,578 1,635
REER pa 95.7 97.6 95.0 86.1 83.1 85.8
NEER pa 90.7 89.7 81.2 71.8 64.4 63.0
M3 money supply (% y/y) pe 21.4 27.5 15.7 24.7 26.4 16.1
M3 money supply (% y/y) pa 21.2 27.0 21.1 22.8 24.6 18.8
43.1 68.5
Domestic debt / GDP (%) 10.3 8.4 9.4 9.8 10.9 11.7
2013f
45.8
57,798
33.8
739
7.5
48.6
100.5
60.3
-8.8
-6.2
12.4
43.6
11.3
15.0
-4.6
-2.7
-8.0
2.4
0.7
-5.8
4.5
3.6
nr
nr
B-
6.0
6.5
25.8
33.2
9.3
8.9
7.0
7.4
8.8 9.7
1,708
1,750
82.8
60.3

African Markets Revealed — January 2012
88 Fixed Income Research
Tunisia: delivering a successful transition
The moderate Islamist Ennahda party emerged as the big winner in the 23 Oct Constituent Assembly elections, securing nearly 41% of declared seats. But Ennahda failed to secure an absolute majority and was forced to form a coalition with the secular CPR and Ettakatol. Al-though Ennahda dominates the cabinet of Prime Minister Hamadi Jebali, it does not have full control. For example, Finance Minister Hussein Dimassi is a respected non-partisan economist. Also, CPR leader Moncef Marzouki was elected as President of the country and Mustapha Ben Jaafar (head of Ettakatol) President of the Constitu-ent Assembly. Furthermore, Ennahda’s stance has until now been to reassure secular Tunisians, especially the urban middle-class, that social change will be limited. Still, continued strikes across the country suggest the new authorities will remain under pressure to deliver.
GDP contracted 3.2% in Q1:11 in the immediate after-math of the Jasmine revolution, but gradually rebounded in subsequent quarters, to -0.3% in Q2 and a positive 1.2% in Q3. The Q3:11 performance was driven by agri-culture (9.8%) and manufacturing (1.6%), although the mining sector shrank 45.3% and tourism 20.7%. We ex-pect growth to be virtually flat in 2011 (+0.1%), which is probably not a disastrous outcome, given last year’s diffi-culties. The low GDP base effects, coupled with early signs of economic improvement, will push up output growth to 4.1% in 2012. Downside risks include the slow-down in the EU, the difficult social context in the mining industry as well as domestic and sub-regional political uncertainties that could still weigh negatively on the tour-ism industry. Public and private sector investment is likely to progressively resume and support the recovery.
Quarterly indicators
Political risk: change and continuity Election results (2009)
GDP growth: economic recovery in 2012 Contribution to GDP
Notes: pe — period end; pa — period average Sources: IMF; Ministere de l’Economie et des finances; Institut National de la Statistiques; Standard Bank Research; Bloomberg
Sources: INS; IMF; Standard Bank Research
Source: Ministry of Interior
Q1:10 Q2:10 Q3:10 Q4:10 Q1:11 Q2:11 Q3:11e Q4:11f Q1:12f Q2:12f Q3:12f Q4:12f
GDP (% y/y) pa 2.9 2.8 3.1 3.1 -3.2 -0.3 1.2 2.5 3.7 4.4 4.3 4.0
CPI (% y/y) pa 4.9 4.7 4.1 4.0 3.2 3.1 3.6 4.4 4.7 4.7 4.2 3.2
M2 (% y/y) pa 15.6 15.6 15.8 14.0 20.4 16.3 17.2 14.3 6.3 9.8 8.4 13.6
CA/GDP (%) pa -5.0 -4.6 -4.6 -5.1 -6.3 -6.3 -6.2 -5.9 -5.8 -6.2 -6.2 -5.9
FX reserves (USD bn) pe 9.7 8.7 9.5 9.5 9.2 7.7 7.5 7.0 6.7 6.4 6.4 6.5
Import cover (mths) pe 5.2 4.7 5.1 5.1 4.6 3.9 3.8 3.5 3.4 3.3 3.3 3.3
BCT policy rate (%) pe 4.5 4.5 4.5 4.5 4.5 4.0 3.5 3.5 3.5 3.5 3.5 3.5
USD/TND pe 1.40 1.52 1.42 1.44 1.39 1.37 1.44 1.50 1.53 1.58 1.57 1.53
REER (Q4:05=100) pe 94.2 94.5 92.7 92.9 91.5 91.5 92.0 91.0 91.0 90.5 90.6 90.6
NEER (Q4:05=100) pe 87.6 86.9 85.7 85.1 84.7 84.4 85.0 84.3 84.1 83.3 83.5 83.7
Presidential election Party % of votes
Zine El Abidine Ben Ali RCD 89.6
Ahmed Inoubli UDU 3.8 Ahmed Ibrahim Ettajdid 1.6
Legislative election Direct seats % of votes
Ennahda 89 41.1
Congress for the Republic (CPR) 29 13.4
Popular Petition (PP) 26 12.0 Ettakatol 20 9.2
Mohamed Bouchiha PUP 5.0
Progressive Democratic Party 16 4.4 The Initiative 5 2.3 Democratic Modernist Pole 5 2.3 Others 27 12.4 Total 217 100
-4
-1
2
5
8
2007 2008 2009 2010 2011e 2012f 2013f
%
PCE GCE GFCF Netex GDP
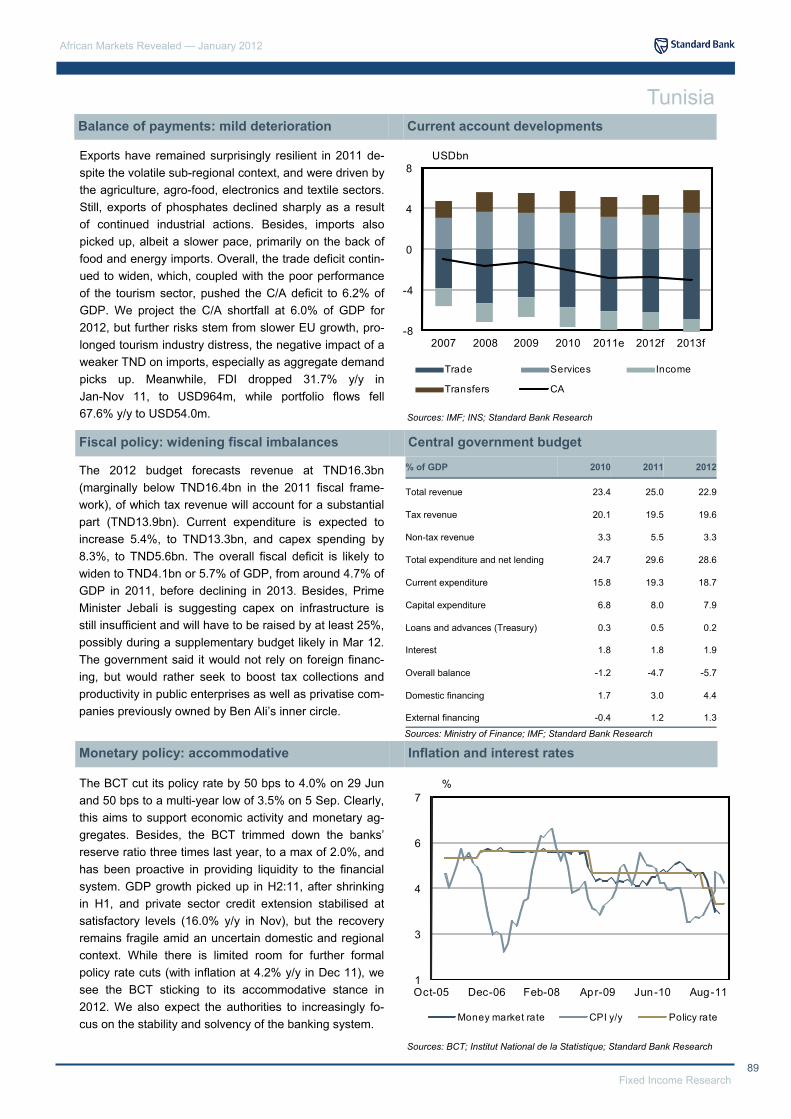
89 Fixed Income Research
African Markets Revealed — January 2012
Exports have remained surprisingly resilient in 2011 de-spite the volatile sub-regional context, and were driven by the agriculture, agro-food, electronics and textile sectors. Still, exports of phosphates declined sharply as a result of continued industrial actions. Besides, imports also picked up, albeit a slower pace, primarily on the back of food and energy imports. Overall, the trade deficit contin-ued to widen, which, coupled with the poor performance of the tourism sector, pushed the C/A deficit to 6.2% of GDP. We project the C/A shortfall at 6.0% of GDP for 2012, but further risks stem from slower EU growth, pro-longed tourism industry distress, the negative impact of a weaker TND on imports, especially as aggregate demand picks up. Meanwhile, FDI dropped 31.7% y/y in Jan-Nov 11, to USD964m, while portfolio flows fell 67.6% y/y to USD54.0m.
The 2012 budget forecasts revenue at TND16.3bn (marginally below TND16.4bn in the 2011 fiscal frame-work), of which tax revenue will account for a substantial part (TND13.9bn). Current expenditure is expected to increase 5.4%, to TND13.3bn, and capex spending by 8.3%, to TND5.6bn. The overall fiscal deficit is likely to widen to TND4.1bn or 5.7% of GDP, from around 4.7% of GDP in 2011, before declining in 2013. Besides, Prime Minister Jebali is suggesting capex on infrastructure is still insufficient and will have to be raised by at least 25%, possibly during a supplementary budget likely in Mar 12. The government said it would not rely on foreign financ-ing, but would rather seek to boost tax collections and productivity in public enterprises as well as privatise com-panies previously owned by Ben Ali’s inner circle.
The BCT cut its policy rate by 50 bps to 4.0% on 29 Jun and 50 bps to a multi-year low of 3.5% on 5 Sep. Clearly, this aims to support economic activity and monetary ag-gregates. Besides, the BCT trimmed down the banks’ reserve ratio three times last year, to a max of 2.0%, and has been proactive in providing liquidity to the financial system. GDP growth picked up in H2:11, after shrinking in H1, and private sector credit extension stabilised at satisfactory levels (16.0% y/y in Nov), but the recovery remains fragile amid an uncertain domestic and regional context. While there is limited room for further formal policy rate cuts (with inflation at 4.2% y/y in Dec 11), we see the BCT sticking to its accommodative stance in 2012. We also expect the authorities to increasingly fo-cus on the stability and solvency of the banking system.
Balance of payments: mild deterioration Current account developments
Fiscal policy: widening fiscal imbalances Central government budget
Monetary policy: accommodative Inflation and interest rates
Sources: IMF; INS; Standard Bank Research
Sources: Ministry of Finance; IMF; Standard Bank Research
Sources: BCT; Institut National de la Statistique; Standard Bank Research
Tunisia
% of GDP 2010 2011
Total revenue 23.4 25.0
Tax revenue 20.1 19.5
Non-tax revenue 3.3 5.5
Total expenditure and net lending 24.7 29.6
Current expenditure 15.8 19.3
Capital expenditure 6.8 8.0
Loans and advances (Treasury) 0.3 0.5
Interest 1.8 1.8
2012
22.9
19.6
3.3
28.6
18.7
7.9
0.2
1.9
Overall balance -1.2 -4.7 -5.7
Domestic financing 1.7 3.0 4.4
External financing -0.4 1.2 1.3
-8
-4
0
4
8
2007 2008 2009 2010 2011e 2012f 2013f
USDbn
Trade Services Income
Transfers CA
1
3
4
6
7
Oct-05 Dec-06 Feb-08 Apr-09 Jun-10 Aug-11
%
Money market rate CPI y/y Policy rate

African Markets Revealed — January 2012
90 Fixed Income Research
The 7.375% USD650m bond (due Apr 12) will soon ma-ture and its price will further converge to par in coming months. Still, the low duration (0.3) can potentially offset the effects of any risk-off episode in Q1:12. The yield on the relatively illiquid 8.25% USD150m bond (due Sep 27) rose to 6.3% on 9 Jan. The spread (425 bps) has wid-ened by 167 bps since Jul 11, modestly in excess of the respective rally in UST, and compares to an average of 330 bps for similar issuers and EMBI+ spread of 376 bps. Tunisia’s peaceful political transition has supported the instruments, but the difficult economic and regional back-drop continue to hold valuations down. The spread of the 4.5% EUR400m bond (due Jun 20) has also widened (404 bps) since late Nov. Foreign interest in TND bonds will continue to be constrained by low interest rates (c5.2%-6.2%) and limited market liquidity.
EUR/TND increased to 1.96-1.98 in Nov, after hitting a low of 1.92 in Oct, but trended downward again in late 2011 (1.94 on 5 Jan 11) amid a new episode of EUR weakness. We suspect further EUR/TND downside may be on the agenda in the ST. It is, however, likely to be modest as the BCT typically allows TND to depreciate in trade-weighted terms to boost external competitiveness. Meanwhile, we see USD/TND (1.52 on 5 Jan) continuing its uptrend in line with EUR/USD downside during 2012. Tunisia’s FX regime is as a heavily managed arrange-ment, with EUR dominant in the composite basket (followed by USD and JPY). TND is determined on the interbank market around the BCT managed float, but the central bank intervenes to address liquidity imbalances. FX reserves reached USD7.0bn in Nov 11 (3.5-m of im-port cover) and will decline to USD6.5bn in 2012.
The BVMT was down 6.6% in 2011, although this was primarily the product of the sell-off that was associated with the Jasmine revolution in early 2011. However, the stock market rallied 11.1% in H2:11, outperforming most developed and emerging stock markets. With a market cap of USD9.8bn in Nov 11 and an average daily traded volume of USD4.5m, the BVMT is probably too small and illiquid for many global equity investors, but has the po-tential to further attract MENA capital inflows as regional investors seek refuge. At this stage, foreign participation is unequally dispersed and ranges from nothing to a high of 64.3% (ATB bank). Looking forward, the ongoing peaceful political transition, as well as Ennahda’s strong emphasis on free markets and the need of new listings on the BVMT, will probably conspire to foster further eq-uity price upside in 2012.
Bond curve outlook: further modest pressure USD Tunisian 7.375% and 8.25% bonds
FX outlook: USD/TND to trend higher USD/TND: forwards versus forecasts
Equity market: global outperformer Bourse des Valeurs Mobilieres de Tunis
Sources: Bloomberg; Standard Bank Research
Sources: Reuters; Standard Bank Research
Sources: Bloomberg; Standard Bank Research
Tunisia
0
200
400
600
800
Oct-06 Sep-07 Sep-08 Aug-09 Aug-10 Jul-11
spread over UST
Tunisia 27s Tunisia 12s
800
2,100
3,400
4,700
6,000
Jan-04 Jan-06 Jan-08 Jan-10 Jan-1
Index
1.1
1.2
1.4
1.5
1.7
Dec-06 Mar-08 Jun-09 Aug-10 Nov-11 Feb-13
USD/TND
History Forw ards Forecast
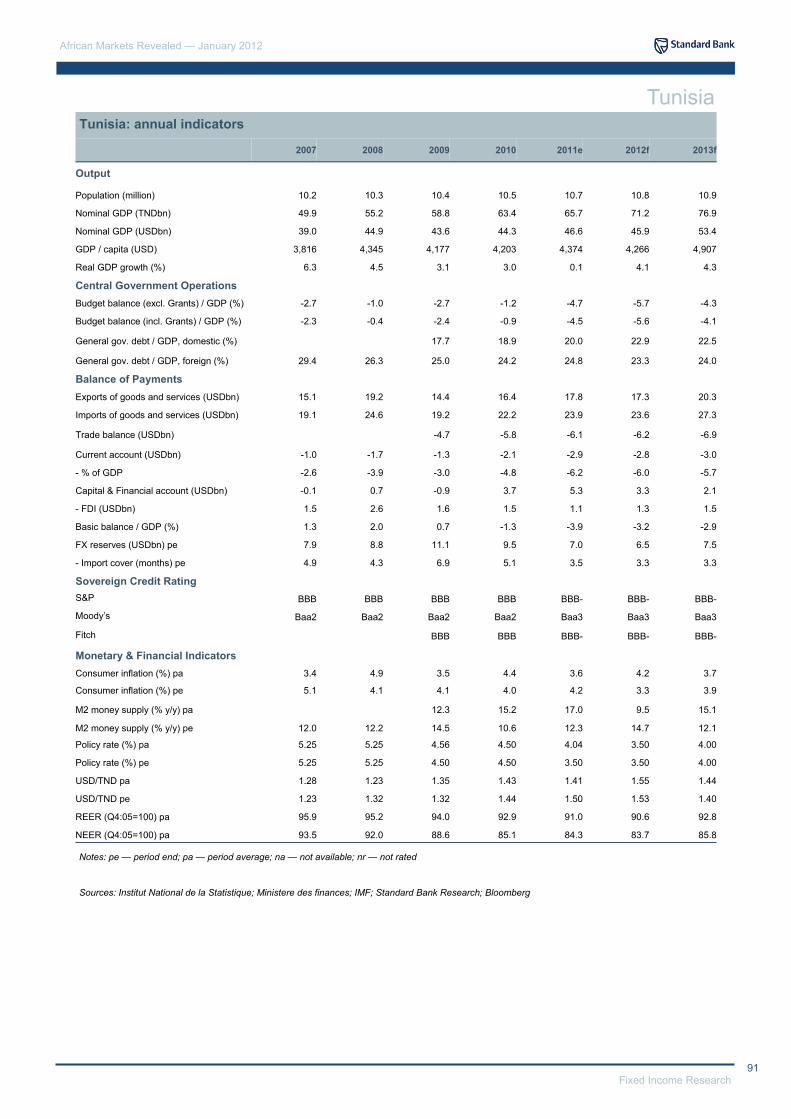
91 Fixed Income Research
African Markets Revealed — January 2012
Tunisia: annual indicators
Tunisia
2007 2008 2009 2010 2011e 2012f 2013f
Output Population (million) 10.2 10.3 10.4 10.5 10.7 10.8 10.9
Nominal GDP (TNDbn) 49.9 55.2 58.8 63.4 65.7 71.2 76.9
Nominal GDP (USDbn) 39.0 44.9 43.6 44.3 46.6 45.9 53.4
GDP / capita (USD) 3,816 4,345 4,177 4,203 4,374 4,266 4,907
Real GDP growth (%) 6.3 4.5 3.1 3.0 0.1 4.1 4.3
Central Government Operations
Budget balance (excl. Grants) / GDP (%) -2.7 -1.0 -2.7 -1.2 -4.7 -5.7 -4.3
Budget balance (incl. Grants) / GDP (%) -2.3 -0.4 -2.4 -0.9 -4.5 -5.6 -4.1
General gov. debt / GDP, domestic (%) 17.7 18.9 20.0 22.9 22.5
General gov. debt / GDP, foreign (%) 29.4 26.3 25.0 24.2 24.8 23.3 24.0
Balance of Payments
Exports of goods and services (USDbn) 15.1 19.2 14.4 16.4 17.8 17.3 20.3
Imports of goods and services (USDbn) 19.1 24.6 19.2 22.2 23.9 23.6 27.3
Trade balance (USDbn) -4.7 -5.8 -6.1 -6.2 -6.9
Current account (USDbn) -1.0 -1.7 -1.3 -2.1 -2.9 -2.8 -3.0
- % of GDP -2.6 -3.9 -3.0 -4.8 -6.2 -6.0 -5.7
Capital & Financial account (USDbn) -0.1 0.7 -0.9 3.7 5.3 3.3 2.1
- FDI (USDbn) 1.5 2.6 1.6 1.5 1.1 1.3 1.5
Basic balance / GDP (%) 1.3 2.0 0.7 -1.3 -3.9 -3.2 -2.9
FX reserves (USDbn) pe 7.9 8.8 11.1 9.5 7.0 6.5 7.5
- Import cover (months) pe 4.9 4.3 6.9 5.1 3.5 3.3 3.3
Sovereign Credit Rating
S&P BBB BBB BBB BBB BBB- BBB- BBB-
Moody’s Baa2 Baa2 Baa2 Baa2 Baa3 Baa3 Baa3
Fitch BBB BBB BBB- BBB- BBB-
Monetary & Financial Indicators Consumer inflation (%) pa 3.4 4.9 3.5 4.4 3.6 4.2 3.7
Consumer inflation (%) pe 5.1 4.1 4.1 4.0 4.2 3.3 3.9
M2 money supply (% y/y) pa 12.3 15.2 17.0 9.5 15.1
M2 money supply (% y/y) pe 12.0 12.2 14.5 10.6 12.3 14.7 12.1
Policy rate (%) pa 5.25 5.25 4.56 4.50 4.04 3.50 4.00
Policy rate (%) pe 5.25 5.25 4.50 4.50 3.50 3.50 4.00
USD/TND pa 1.28 1.23 1.35 1.43 1.41 1.55 1.44
USD/TND pe 1.23 1.32 1.32 1.44 1.50 1.53 1.40
REER (Q4:05=100) pa 95.9 95.2 94.0 92.9 91.0 90.6 92.8
NEER (Q4:05=100) pa 93.5 92.0 88.6 85.1 84.3 83.7 85.8
Sources: Institut National de la Statistique; Ministere des finances; IMF; Standard Bank Research; Bloomberg
Notes: pe — period end; pa — period average; na — not available; nr — not rated

African Markets Revealed — January 2012
92 Fixed Income Research
Uganda: policy focused on macroeconomic stabilisation
Organised mass protests seem to be a growing part of Uganda’s post-election political-economy. The high infla-tion experience of the past year, coupled with frequent power outages, has created an environment conducive to disquiet and protests. The latest protests, this time by market traders and shop-keepers, are over the sharp increase they have seen in the cost of borrowing, ironi-cally designed to pull down inflation. There is also a de-gree of concern around parliament’s unwillingness to allow the executive arm of government to negotiate and conclude more oil deals after the previous deals failed to hold up to extreme scrutiny. Allegations of corruption against cabinet ministers have also tarnished the govern-ment’s image, especially in the donor community. Thus far, the allegations have not threatened funding or dented the NRM’s local political dominance.
GDP growth is likely to slow to 4.9% y/y in 2011, reviving to 5.4% in 2012. Moderate economic growth, slowing to 2.4% y/y in Q3:11, from 10.3% y/y in Q4:10, is likely to last until Q2:12. The weakening of the UGX, coupled with rapidly rising inflation that enforced a significant tighten-ing of monetary policy, is likely to constrain domestic demand. Financial services recorded -21.3% y/y growth in Q3:11, having recorded 47.9% y/y and 38.7% y/y growth in Q3:10 and Q4:10 respectively, illustrating this potential impact. Investment spending is likely to remain robust going into 2012, establishing a base for much stronger overall growth. Declining inflation going into H2:12, and lower interest rates, will likely boost consump-tion spending as well. The slowdown in domestic demand is likely to lead to a smaller trade deficit in 2012, boosting overall growth.
Quarterly indicators
Political risk: simmering discontent Election results (2011)
GDP growth: investment-led revival in H2:12 Composition of GDP
Notes: pe — period end; pa — period average Sources: Bank of Uganda; Uganda Central Statistics Office; Standard Bank Research; Bloomberg
Sources: Bank of Uganda; Standard Bank Research
Presidential election Party % of votes
Yoweri Kaguta Museveni NRM 68.4
Kizza Kifeefe Besigye FDC 26.0
Norbert Mao DP 1.9
Legislative election Seats
National Resistance Movement (NRM) 263
Forum for Democratic Change (FDC) 34
Uganda People’s Congress (UPC) 10
Total 375
Olara Otunnu UPC 1.6
Other 56
Beti Kamya UFA 0.7
Democratic Party (DP) 12
Source: The Electoral Commission of Uganda
Q1:10 Q2:10 Q3:10 Q4:10 Q1:11 Q2:11 Q3:11e Q4:11f Q1:12f Q2:12f Q3:12f Q4:12f
GDP (% y/y) pa -0.3 6.4 4.5 10.3 6.2 5.7 2.4 3.5 3.5 4.5 6.3 7.3
CPI (% y/y) pa 8.2 4.9 1.8 1.5 7.5 15.3 22.9 28.8 22.8 16.4 11.3 7.8
M3 (% y/y) pe 21.5 31.7 37.1 39.8 34.3 24.9 23.4 19.8 20.6 19.2 20.0 22.3
CA/GDP (%) pe -6.8 -7.8 -8.5 -9.2 -9.3 -9.0 -8.9 -9.9 -9.9 -9.0 -8.3 -6.2
FX reserves (USD bn) pe 2.89 2.71 2.77 2.84 2.43 2.27 2.48 2.64 2.76 2.97 3.18 3.38
Import cover (months) pe 5.6 5.3 5.4 5.5 4.1 3.8 4.2 4.4 4.3 4.6 5.0 5.3
3-m rate (%) pe 4.0 4.4 5.2 8.5 9.8 13.3 17.5 22.7 18.8 16.3 13.4 8.3
5-y rate (%) pe 8.9 9.4 9.4 11.9 13.2 12.8 12.8 16.7 15.8 14.5 13.4 12.9
USD/UGX pe 2,080 2,280 2,243 2,310 2,400 2,565 2,845 2,495 2,275 2,175 2,250 2,110
REER pa 98.8 93.3 89.2 86.7 87.6 85.4 81.4 83.5 87.5 91.5 87.1 92.2
NEER pa 86.0 77.5 78.8 76.1 74.6 72.8 68.4 72.5 78.7 82.3 78.3 82.9
-10.0
-3.8
2.5
8.8
15.0
2003 2005 2007 2009 2011f 2013f
%
PCE GCE GFCF
Stocks Netex GDP

93 Fixed Income Research
African Markets Revealed — January 2012
Helped by a resurgence of private capital inflows at-tracted by the high interest rates on offer in T-bills and T-bonds, FX reserves are likely to continue climbing over the course of 2012. A combination of deteriorating C/A deficit and the use of FX reserves by the government for purchasing military equipment caused FX reserves to decline, to USD2.27bn (3.38 months of goods and ser-vices imports) in Jun 11. Having risen to USD2.59bn in Oct 11, we expect FX reserves to continue rising to USD2.64bn by Dec 11 (4.4 months) and USD3.38bn (5.3 months) by Dec 12. The tight monetary policy stance is likely to moderate import demand, leading to lower trade and C/A deficits in Q4:11 and H1:12. Nonetheless, the C/A deficit is likely to be 9.9% of GDP in 2011, before falling to 6.2% in 2012. FDI inflows are likely to remain strong as oil infrastructure development continues.
Execution of the development budget is still constrained by a number of constraints, amongst which delays in donor disbursements are prominent. Donor disburse-ments are typically not timely, forcing the government to seek alternative sources of funding. A key constraint this time seems to have been the decision by the IMF in Feb 11 not to complete the first review of the Policy Support Instrument, largely owing to a pre-election supplementary spending bill that was approved by parliament. But the completion of the second review in Jun, and probably the third review in Dec, will likely prompt donors to disburse committed funds. The country’s capital expenditure pro-gramme over the medium term is quite ambitious, involv-ing the construction of hydro-electric dams, possibly con-tributing towards the construction of an oil refinery and the usual road construction projects.
The monetary policy committee left the CBR unchanged in its Jan meeting, but cut the discount rate by 100 bps. We expect a more substantive easing of monetary policy, leading to a more than 10 pps reduction in the CBR, to commence as early as Mar 12. Inflation is likely to de-cline consistently over the course of 2012, possibly reaching single digits in Q3:12. We anticipate a key driver of this disinflationary trend to be declining food inflation brought about by improving food production. Further-more, UGX appreciation is expected to persist, reducing imported inflation. Food inflation dropped further, to 34.7% y/y in Dec 11, from a peak of 50.4% y/y in Sep 11, while headline inflation fell to 27.0% y/y. Crucially, the MPC’s forecast envisages core inflation at 10.0% y/y in Dec 12, a factor that could convince the MPC to cut its CBR before the end of Q1:12.
Balance of payments: surplus likely in 2012 Current account developments
Fiscal policy: capital spending still constrained Central government budget
Monetary policy: easing bias Inflation and interest rates
Sources: Bank of Uganda; Standard Bank Research
Sources: Bank of Uganda; Uganda Bureau of Statistics
Sources: Ministry of Finance; Standard Bank Research
Uganda
% of GDP 2010/11 2011/12
Total revenue (- grants) 13.2 13.7
Total expenditure 24.0 21.4
- wages 4.2 3.7
- interest 1.1 1.1
- development 8.9 10.5
Overall balance (- grants) -10.9 -7.7
Overall balance (+ grants) -6.6 -3.9
Net external borrowing 2.2 2.0
Net domestic borrowing 4.4 1.9
Donor support (grants and loans) 6.9 6.3
-3,800
-2,300
-800
700
2,200
2000 2002 2004 2006 2008 2010 2012f
USD m
Trade Services Income
Transfers C/A
-12.0
4.0
20.0
36.0
52.0
Jan-06 Jun-07 Dec-08 Jun-10 Dec-11
% y/y
Headline Food Core

African Markets Revealed — January 2012
94 Fixed Income Research
We expect the front-end of the curve to decline rapidly over the coming 6-m, reversing the current inversion of the curve. But 91-d yields, which have held in a 21%-24% range since early Nov 11, are unlikely to fall consistently until they become positive relative to infla-tion, which was 27.0% y/y in Dec 11. It is likely for this to take several months yet. Our core scenario is for inflation to fall below 20.0% y/y by the start of Q2:12. We then see the BOG cutting rates persistently as inflation falls to sin-gle digits by the end of 2012. As rates fall, the BOG will be more willing to extend the duration of the issuance that has been limited to 3-y tenors since the yields be-came elevated. This will reduce funding pressure on the short-end, allowing some further dis-inversion of the curve.
The downtrend in USD/UGX appears intact, with the pair probably testing the 2,300 level in Q1:12. The decline from around 2,900 was remarkable in that there were very few reversals along the way. But what is evident from the recent trend reversals is BOU’s willingness to intervene on both sides of the market to make the USD/UGX move south a slow, durable grind rather than a short sharp move. The tight monetary policy stance is changing BOP dynamics, with capital inflows into the primary market for T-bills and T-bonds complementing FDI inflows in financing a C/A deficit, which is likely to dwindle as import demand contracts. The BOU’s focus is squarely on lowering inflation, and it understands that it needs a stronger UGX to meet its goal.
Uganda’s equity market performance has mirrored that in Kenya, coming off heavily as a result of currency weak-ness, inflation, high interest rates, poor loan growth and slowing economic activity. The All Share index fell 35.5%, to 766 in mid-Dec 11, just 38.4% above the nadir reached in Mar 09 during the global financial crisis. We suspect that any rebound is likely to also be subject to developments in the region. In many ways, equity prices in Kenya will be held back prior to elections, despite an improving picture in terms of currency stability, inflation and an expected slide in interest rates. Uganda's equity story may best be expressed via unlisted companies. Adding to the ubiquitous consumer and construction sto-ries, Uganda has significant opportunities in energy, oil and agriculture.
Bond curve outlook: dis-inversion likely Changes in yield curve
FX outlook: further USD/UGX downside USD/UGX: forwards versus forecasts
Equity market: poised for a rebound Uganda Stock Exchange
Sources: BOU; Standard Bank Research
Sources: Bank of Uganda; Standard Bank Research
Source: Reuters
Uganda
11.0
15.0
19.0
23.0
27.0
91-d 182-d 364-d 2-y 3-y 5-y 10-y
YTM (%)
28-Dec-11 15-Nov-11 6-m forecast
500
713
925
1,138
1,350
Oct-06 Feb-08 May-09 Sep-10 Dec-11
Index
USE
1,500
1,875
2,250
2,625
3,000
Dec-06 Mar-08 Jun-09 Aug-10 Nov-11 Feb-13
USD/UGX
History Forw ards Forecast

95 Fixed Income Research
African Markets Revealed — January 2012
Uganda: annual indicators
Notes: pe — period end; pa — period average; nr — not rated
Sources: Bank of Uganda; Uganda Central Statistical Service; Standard Bank Research; Bloomberg
Uganda
2007 2008 2009 2010 2011e 2012f 2013f
Output
Population (million) 28.25 29.59 30.70 31.80 32.94 34.40 35.20
Nominal GDP (UGXbn) 23,351 28,176 33,545 37,058 44,647 53,887 60,492
Nominal GDP (USDbn) 13.5 16.4 16.5 17.0 17.5 24.2 28.9
GDP / capita (USD) 479 554 538 535 533 703 822
Real GDP growth (%) 8.1 8.7 8.9 5.2 4.8 5.4 6.7
Coffee production ('000 Tonnes) 175.3 211.7 196.2 209.1 191.4 203.7 212.8
Tea production ('000 Tonnes) 44.9 44.5 38.2 49.2 56.3 58.1 60.8
Central Government Operations
Budget balance (excl. Grants) / GDP (%) -4.9 -4.8 -7.2 -10.9 -7.7 -6.6 -6.5
Budget balance (incl. Grants) / GDP (%) -1.9 -1.9 -4.7 -6.6 -3.9 -4.3 -4.1
Domestic debt / GDP (%) 16.0 17.5 17.1 17.7 18.6 19.4 20.1
External debt / GDP (%) 14.6 14.6 14.8 15.3 16.5 17.7 18.1
Balance Of Payments Exports of goods and services (USDbn) 2.37 3.01 3.29 3.52 4.01 4.77 5.82
Imports of goods and services (USDbn) 3.94 5.30 5.21 6.18 7.16 7.68 8.93
Trade balance (USDbn) -1.57 -2.29 -1.92 -2.67 -3.15 -2.91 -3.11
Current account (USDbn) -0.63 -1.27 -1.11 -1.56 -1.73 -1.50 -1.63
- % of GDP -4.7 -7.7 -6.7 -9.2 -9.9 -6.2 -5.6
Financial account (USDbn) 1.40 1.18 1.47 1.40 1.55 2.21 2.27
- FDI (USDbn) 0.79 0.73 0.84 0.88 0.98 1.12 1.27
Basic balance / GDP (%) 1.2 -3.3 -1.6 -4.0 -4.3 -1.6 -1.2
FX reserves (USDbn) pe 2.56 2.30 2.99 2.84 2.64 3.38 3.60
- Import cover (months) pe 7.8 5.2 6.9 5.5 4.4 5.3 4.8
Sovereign Credit Rating
S&P nr nr nr B+ B+ B+ B+ Moody’s nr nr nr nr nr nr nr
Fitch nr nr nr B B B+ B+
Monetary & Financial Indicators Consumer inflation (%) pa 6.1 12.0 13.1 4.1 18.6 14.6 6.1
Consumer inflation (%) pe 5.2 14.3 11.0 3.0 27.0 7.4 7.2
M3 money supply (% y/y) pa 19.7 27.5 22.6 30.4 27.8 20.3 25.0
M3 money supply (% y/y) pe 16.2 40.2 16.6 39.8 19.8 22.3 23.9
BOU policy rate (%) pa 14.8 15.3 11.3 7.8 11.2 15.1 8.3
BOU policy rate (%) pe 14.1 18.4 8.7 11.0 23.0 9.5 8.0
3-m rate (%) pe 8.45 12.50 5.47 8.49 22.72 8.25 7.70
1-y rate (%) pe 13.40 18.45 9.05 10.12 23.34 8.80 8.15
2-y rate (%) pe 12.50 14.78 12.26 10.35 20.90 10.45 9.35
5-y rate (%) pe 13.85 14.07 12.67 11.94 16.74 12.90 11.24
USD/UGX pa 1,724 1,718 2,030 2,177 2,545 2,228 2,090
USD/UGX pe 1,698 1,945 1,900 2,310 2,495 2,110 2,135
REER pa 102.10 104.17 97.80 92.00 84.49 89.58 94.75 NEER pa 98.30 97.61 86.14 79.61 72.08 80.53 85.20

African Markets Revealed — January 2012
96 Fixed Income Research
Zambia: a new day, a new dawn
Michael Sata, leader of the Patriotic Front (PF), won the presidential elections in Sep 11 after running for the fourth time. Zambia was widely commended for the peaceful elections, which were seen to be transparent and credible by election monitors and form the second smooth transfer of power in 20-y. With regard to the leg-islative elections, the PF fell short of achieving a majority in parliament, winning 60 of the 150 seats. This implies that the PF will require support from other parties for leg-islative changes. While the new administration was voted in having promised significant change, the government has demonstrated commitment to prudent economic pol-icy. The macroeconomic framework introduced under the 2012 budget is expansionary. The government will proba-bly face increasing pressure from its supporters to deliver on the promised pro-poor policies.
Economic activity is set to expand further in 2012 on the back of an expansive fiscal budget, strong foreign invest-ment, and private consumption, which will be supported by declining inflation and personal income tax benefits. GDP growth is likely to reach 7.5% in 2012, from an esti-mated 6.4% in 2011. The 2012 budget significantly in-creased the funds for infrastructural development (most notably on power and roads), which will provide a boost to gross fixed capital formation (GFCF). The mining sec-tor is likely to continue to attract considerable FDI, which will continue to positively contribute to GFCF. Private consumption expenditure (PCE) will be boosted by lower inflation. In particular, food prices which are the largest contributor to the CPI basket, will benefit from the food input subsidy programme. This will likely be expanded to other basic commodities in 2012.
Political risk: delivering on promises Election results
GDP growth: larger public sector stimulus Composition of GDP
Quarterly indicators
Notes: pe — period end; pa — period average Sources: Bank of Zambia; Bloomberg; CSO; IMF; Standard Bank Research
Sources: Ministry of Finance; Standard Bank Research
Presidential election 2011 Party % of votes
Michael Sata Patriotic Front 42.9
Rupiah Banda MMD 36.2
Hakainde Hichilema UPND 18.5
Parliamentary election 2006 Seats % of votes
Patriotic Front 60 38.3
MMD 55 33.6
UPND 28 28.0
Total 150 100
Charles Milupi ADD 1.0
ADD 1 1.0
Source: Electoral Commission of Zambia (ECZ)
Q1:10 Q2:10 Q3:10 Q4:10 Q1:11 Q2:11 Q3:11e Q4:11f Q1:12f Q2:12f Q3:12f Q4:12f
GDP (% y/y) pa 7.1 6.9 7.1 9.3 7.1 6.8 7.4 4.7 7.8 7.4 7.2 7.6 CPI (% y/y) pa 9.9 8.7 8.1 7.4 9.1 8.9 8.7 8.0 6.8 6.8 6.7 6.9 M3 (% y/y) pa 8.9 22.8 30.2 30.1 32.9 24.7 24.9 24.8 28.2 28.7 24.8 22.7 CA/GDP (%) pe 4.5 3.2 4.3 4.0 4.4 4.5 5.0 5.2 5.4 4.7 4.0 3.2 FX reserves (USD bn) pe 1.79 1.76 2.12 2.09 2.11 2.59 2.56 2.51 2.59 2.65 2.77 2.85 Import cover (months) pe 3.8 3.8 4.6 4.5 3.5 4.3 4.3 4.2 3.7 3.8 4.0 4.1 3-m rate (%) pe 2.0 4.8 5.7 7.7 6.5 6.7 8.0 7.1 9.4 10.2 9.4 7.9 5-y rate (%) pe 12.3 9.5 13.1 13.0 13.8 16.5 15.9 15.4 14.4 13.7 13.2 11.8 USD/ZMK pe 4,680 5,175 4,845 4,800 4,710 4,835 4,830 5,125 5,109 5,128 5,081 5,000 REER pe 104.4 105.5 110.3 108.3 108.3 114.0 121.7 119.2 113.8 114.2 113.7 109.4 NEER pe 107.6 112.4 112.5 111.7 114.7 118.4 126.7 123.4 116.5 117.8 115.7 114.2
-2.5
0.0
2.5
5.0
7.5
10.0
2007 2009 2011e 2013f
y/y
PCE GCE GFCFStocks Netex GDP

97 Fixed Income Research
African Markets Revealed — January 2012
We envisage a significant decline in the C/A surplus over the forecast period as growth in imports, associated with both public and private investment, is likely to exceed the expansion of exports. We expect the C/A surplus to reach 3.4% of GDP in 2012, from 5.2% in 2011. Exports are also likely to expand as a result of greater minerals export volumes, while we remain relatively constructive on base metal prices. Zambia is likely to continue to face a negative balance on the financial account, despite con-siderable FDI inflows (likely to reach USD1.5bn in 2012) as export earnings are largely held offshore. The in-crease in royalty tax will marginally increase the onshore receipts from export earnings. We expect the financial deficit to moderate allowing further growth in reserves to USD2.9bn by Dec 12, from USD2.5bn at end 2011.
In 2012, the fiscal budget is set to expand to 4.3% of GPD (ZMK5.83tr or USD1.2bn), from a projected deficit of 3.1% (or ZMK3.38tr) in 2011. The deficit will predomi-nantly be financed through external borrowing (3.0% of GDP), which will include the issuance a benchmark size 10-y sovereign Eurobond. Expenditure is set to increase by 17.9% y/y, to ZMK27.7tr (ca. USD5.5bn or 28.2% of GDP) in FY2012. The government has allocated ZMK864bn under the 2012 budget for the construction of the 750 MW) Kafue Gorge power plant. The allocation to the development of roads was increased by 45%, to ZMK4.5tr (USD0.9bn). Estimates of domestic revenue collections in 2012 amount to ZMK19.98tr, similar to pro-jected performance of 2011. Personal income tax collec-tion will increase marginally in 2012, following some sig-nificant tax relief measures.
Although the risks to inflation remain to the downside in Q1:12, we believe that the central bank will attempt to add some protection to the currency by halting the de-cline in domestic rates. This would require tightening of liquidity conditions. The stance of monetary policy be-came markedly looser in Q4:11, with liquidity conditions easing on the back of a reduction in the cash reserve requirement for banks as well as a decline in the use of open market operations and reverse repos by the BOZ. They were clearly encouraged in their policy by the de-cline in inflation from 8.8% y/y in Sep 11, to 7.2% y/y in Dec 11. We expect this to reach 6.7% y/y in coming months. In particular, food prices are likely to remain at benign levels following continued fiscal support to the production of maize and potentially other basic commodi-ties. This season’s food harvests are also expected to be favourable.
Balance of payments: investment spurs imports Current account developments
Fiscal policy: expansionary 2012 budget Central government budget
Monetary policy: benign inflation Inflation and interest rates
Sources: IMF; Standard Bank Research
Sources: IMF; Zambia Ministry of Finance; Standard Bank Research
Sources: CSO; Bank of Zambia; Standard Bank Research
Zambia
% of GDP FY11 FY12
Total revenue 22.5 19.6
Total expenditure 27.9 28.2
- Interest 1.9 2.1
Overall balance (- grants) 4.9 5.9
Overall balance (+ grants) 3.1 4.3
Net external borrowing 0.4 3.0
Net domestic borrowing 2.7 1.3
Donor support (grants) 1.8 1.9
-4400
-2200
0
2200
4400
6600
2005 2007 2009 2011f 2013f
USD m
Trade Services IncomeTransfers C/A
-1
5
11
17
23
Jan-08 Apr-09 Aug-10 Nov-11
%, y/y
Headline inflation Food Non-Food

African Markets Revealed — January 2012
98 Fixed Income Research
We are looking for a rotation of the curve through around the 3-y mark in coming months, with the long-end coming down and the short-end moving up slightly in line with a moderate tightening of liquidity conditions. In many ways, this is a reversal of price action over the last 2-m where money market yields fell, pulling the 91-d yields down 280 bps, while bond yields remained relatively stable. Firstly, a significant increase in net external financing of the expansive fiscal budget has reduced net domestic financing to a modest ZMK1.32tr (1.3% of GDP) in 2012, down from 2.7% of GDP in 2011. Secondly, bond re-demptions are set to remain fairly flat relative to last year, in H1:12, at approximately ZMK400bn. Thirdly, the out-look for inflation remains extremely benign, especially assuming the downward move in ZAR/ZMK.
We believe that the BOZ is in favour of relative stability in USD/ZMK. However, the government also wishes to bring nominal interest rates down. These two policies clearly conflict. A more accommodative monetary policy stance contributed to ZMK weakening against the USD in Q4:11. The local interest rate environment became rela-tively less attractive in Q4:11, offering little protection to the ZMK. The BOZ had to intervene on several occasions to limit USD/ZMK upside. Latest figures for FX reserves show they declined significantly in Nov 11, to USD2.48bn, from 2.64bn 4-m, reflecting FX sales by the BOZ. While FX reserves will be bolstered by constructive external sector developments, which will provide the BOZ with the means to continue to protect the ZMK, we be-lieve that ZMK liquidity will be tighter go forward to assist in keeping the ZMK stable.
While the Lusaka Stock Exchange (LuSE) continued to outperform other African markets as well as emerging markets in the final months of 2011, the LuSE sold off sharply at the onset of 2012, losing over 7% (in local cur-rency terms) YTD, compared to a overall gains of 26.2% in 2011. The stock exchange is likely to remain vulner-able to worsening global risk appetite. Foreign partici-pants were net buyers of Zambian stocks in the final months of 2011 (net purchases worth USD762.7m in Nov 11); however, the sharp decline in the LUSE in Jan 12 probably reflects a reversal of these positions. Various mining companies have suggested a possible cross-listing on the local stock exchange, which is likely to gen-erate greater activity on the LuSE. Turnover remains relatively small, at less than 3.5% of market capitalisa-tion.
Bond curve outlook: bond yields to fall Changes in yield curve
FX outlook: limiting upside USD/ZMK: forwards versus forecasts
Equity market: not immune to global sentiment Lusaka Stock Exchange
Sources: Bank of Zambia; Standard Bank Research
Sources: Reuters; Standard Bank Research
Sources: Bloomberg; Standard Bank Research
Zambia
0.5
5.5
10.5
15.5
20.5
91-d 3-Y 5-Y 8-Y 11-Y 14-Y
YTM (%)
29-Dec-11 18-Aug-11 4-m forecast
0
75
150
225
300
375
Jan-09 Jan-10 Jan-11 Jan-12
Jan 06 = 100
LuSE MSCI EM SB Africa
3,050
3,750
4,450
5,150
5,850
Dec-06 Mar-08 Jun-09 Aug-10 Nov-11 Feb-13
USD/ZMK
History Forw ards Forecast
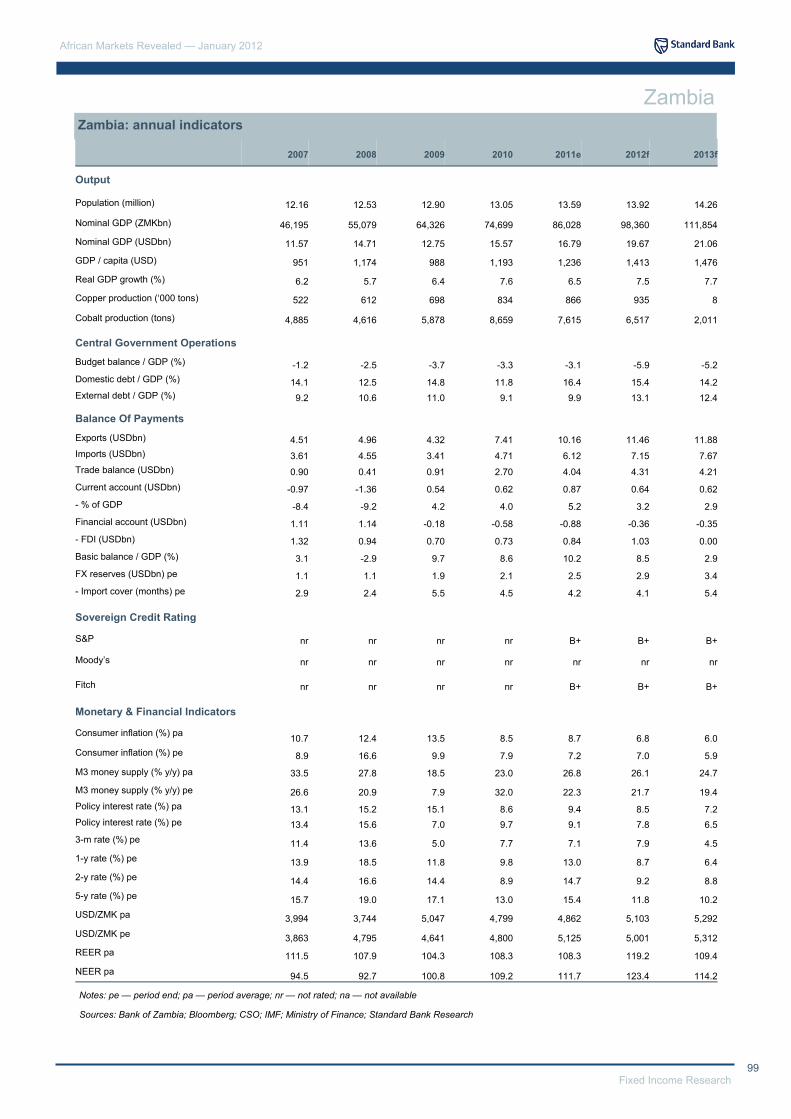
99 Fixed Income Research
African Markets Revealed — January 2012
Zambia: annual indicators
Notes: pe — period end; pa — period average; nr — not rated; na — not available
Sources: Bank of Zambia; Bloomberg; CSO; IMF; Ministry of Finance; Standard Bank Research
Zambia
2007 2008 2009 2010 2011e 2012f
Output
Population (million) 12.16 12.53 12.90 13.05 13.59 13.92
Nominal GDP (ZMKbn) 46,195 55,079 64,326 74,699 86,028 98,360
Nominal GDP (USDbn) 11.57 14.71 12.75 15.57 16.79 19.67
GDP / capita (USD) 951 1,174 988 1,193 1,236 1,413
Real GDP growth (%) 6.2 5.7 6.4 7.6 6.5 7.5
Copper production (‘000 tons) 522 612 698 834 866 935
Cobalt production (tons) 4,885 4,616 5,878 8,659 7,615 6,517
Central Government Operations Budget balance / GDP (%) -1.2 -2.5 -3.7 -3.3 -3.1 -5.9 Domestic debt / GDP (%) 14.1 12.5 14.8 11.8 16.4 15.4 External debt / GDP (%) 9.2 10.6 11.0 9.1 9.9 13.1
Balance Of Payments Exports (USDbn) 4.51 4.96 4.32 7.41 10.16 11.46 Imports (USDbn) 3.61 4.55 3.41 4.71 6.12 7.15 Trade balance (USDbn) 0.90 0.41 0.91 2.70 4.04 4.31 Current account (USDbn) -0.97 -1.36 0.54 0.62 0.87 0.64 - % of GDP -8.4 -9.2 4.2 4.0 5.2 3.2 Financial account (USDbn) 1.11 1.14 -0.18 -0.58 -0.88 -0.36 - FDI (USDbn) 1.32 0.94 0.70 0.73 0.84 1.03 Basic balance / GDP (%) 3.1 -2.9 9.7 8.6 10.2 8.5 FX reserves (USDbn) pe 1.1 1.1 1.9 2.1 2.5 2.9 - Import cover (months) pe 2.9 2.4 5.5 4.5 4.2 4.1
Sovereign Credit Rating
S&P nr nr nr nr B+ B+
Moody’s nr nr nr nr nr nr
Fitch nr nr nr nr B+ B+
Monetary & Financial Indicators
Consumer inflation (%) pa 10.7 12.4 13.5 8.5 8.7 6.8 Consumer inflation (%) pe 8.9 16.6 9.9 7.9 7.2 7.0
M3 money supply (% y/y) pa 33.5 27.8 18.5 23.0 26.8 26.1
M3 money supply (% y/y) pe 26.6 20.9 7.9 32.0 22.3 21.7 Policy interest rate (%) pa 13.1 15.2 15.1 8.6 9.4 8.5 Policy interest rate (%) pe 13.4 15.6 7.0 9.7 9.1 7.8 3-m rate (%) pe 11.4 13.6 5.0 7.7 7.1 7.9 1-y rate (%) pe 13.9 18.5 11.8 9.8 13.0 8.7 2-y rate (%) pe 14.4 16.6 14.4 8.9 14.7 9.2 5-y rate (%) pe 15.7 19.0 17.1 13.0 15.4 11.8 USD/ZMK pa 3,994 3,744 5,047 4,799 4,862 5,103 USD/ZMK pe 3,863 4,795 4,641 4,800 5,125 5,001 REER pa 111.5 107.9 104.3 108.3 108.3 119.2 NEER pa 94.5 92.7 100.8 109.2 111.7 123.4
2013f
14.26
111,854
21.06
1,476
7.7
8
2,011
-5.2
14.2 12.4
11.88
7.67
4.21
0.62
2.9
-0.35
0.00
2.9
3.4
5.4
B+
nr
B+
6.0
5.9
24.7
19.4
7.2 6.5
4.5
6.4
8.8
10.2
5,292
5,312
109.4
114.2
African Markets Revealed — January 2012
100 Fixed Income Research
Disclosure Certification
The analyst(s) who prepared this research report (denoted by an asterisk*) hereby certifies(y) that: (i) all of the views and opinions expressed in this research report accurately reflect the research analyst's(s') personal views about the subject investment(s) and is-suer(s) and (ii) no part of the analyst’s(s’) compensation was, is or will be directly or indirectly related to the specific recommendations or views expressed by the analyst(s) in this research report.
Conflict of Interest
It is the policy of The Standard Bank Group Limited and its worldwide affiliates and subsidiaries (together the “Standard Bank Group”) that research analysts may not be involved in activities in a way that suggests that he or she is representing the interests of any member of the Standard Bank Group or its clients if this is reasonably likely to appear to be inconsistent with providing independent investment research. In addition research analysts’ reporting lines are structured so as to avoid any conflict of interests. For example, research analysts cannot be subject to the supervision or control of anyone in the Standard Bank Group’s investment banking or sales and trading departments. However, such sales and trading departments may trade, as principal, on the basis of the research analyst’s published research. Therefore, the proprietary interests of those sales and trading departments may conflict with your interests. Please note that one or more of the ana-lysts that prepared this report sit on a sales and trading desk of the Standard Bank Group.
Legal Entities
To U. S. Residents
Standard New York Securities, Inc. is registered with the Securities and Exchange Commission as a broker-dealer and is also a mem-ber of the FINRA and SIPC. Standard Americas, Inc is registered as a commodity trading advisor and a commodity pool operator with the CFTC and is also a member of the NFA. Both are affiliates of Standard Bank Plc and Standard Bank of South Africa. Standard New York Securities, Inc is responsible for the dissemination of this research report in the United States. Any recipient of this re-search in the United States wishing to effect a transaction in any security mentioned herein should do so by contacting Standard New York Securities, Inc.
To South African Residents
The Standard Bank of South Africa Limited (Reg.No.1962/000738/06) is regulated by the South African Reserve Bank and is an Authorised Financial Services Provider.
To U.K. Residents
Standard Bank Plc is authorised and regulated by the Financial Services Authority (register number 124823) and is an affiliate of Stan-dard Bank of South Africa. The information contained herein does not apply to, and should not be relied upon by, retail customers.
To Turkey Residents
Standard Unlu Menkul Degerler A.S. and Standard Unlu Portfoy Yonetimi A.S. are regulated by the Turkish Capital Markets Board (“CMB”). Under the CMB’s legislation, the information, comments and recommendations contained in this report fall outside of the definition of invest-ment advisory services. Investment advisory services are provided under an investment advisory agreement between a client and a broker-age house, a portfolio management company, a bank that does not accept deposits or other capital markets professionals. The comments and recommendations contained in this report are based on the personal opinions of the authors. These opinions might not be appropriate for your financial situation and risk and return preferences. For that reason, investment decisions that rely solely on the information con-tained in this presentation might not meet your expectations. You should pay necessary discernment, attention and care in order not to experience losses.
To Singapore Residents
Singapore recipients should contact a Singapore financial adviser for any matters arising from this research report.
Important Regional Disclosures
The analyst(s) involved in the preparation of this report have not visited the material operations of the subject company(ies) within the past 12 months.
Principal is not guaranteed in the case of equities because equity prices are variable.
Commission is the commission rate or the amount agreed with a customer when setting up an account or at any time after that.
To the extent this is a report authored in whole or in part by a non-U.S. analyst and is made available in the U.S., the following are important disclosures regarding any non-U.S. analyst contributors:
The non-U.S. research analysts (denoted by an asterisk*) are not registered/qualified as research analysts with FINRA. The non-U.S. re-

101 Fixed Income Research
African Markets Revealed — January 2012
search analysts (denoted by an asterisk*) may not be associated persons of Standard New York Securities Inc. and therefore may not be subject to the NASD Rule 2711 and NYSE Rule 472 restrictions on communications with a subject company, public appearances and trad-ing securities held by a research analyst account. Each analyst (denoted by an asterisk*) is a Non-U.S. Analyst. The analyst is a research analyst employed by The Standard Bank Group Limited.
General
This research report is based on information from sources that Standard Bank Group believes to be reliable. Whilst every care has been taken in preparing this document, no research analyst or member of the Standard Bank Group gives any representation, warranty or under-taking and accepts no responsibility or liability as to the accuracy or completeness of the information set out in this document (except with respect to any disclosures relative to members of the Standard Bank Group and the research analyst’s involvement with any issuer referred to above). All views, opinions and estimates contained in this document may be changed after publication at any time without notice. Past performance is
not indicative of future results. The investments and strategies discussed here may not be suitable for all investors or any particular class of investors; if you have any doubts you should consult your investment advisor. The investments discussed may fluctuate in price or value. Changes in rates of exchange may have an adverse effect on the value of investments. This material is not intended as an offer or solicita-tion for the purchase or sale of any financial instrument. Members of Standard Bank Group may act as placement agent, advisor or lender, make a market in, or may have been a manager or a co-manager of, the most recent public offering in respect of any investments or issuers referenced in this report. Members of the Standard Bank Group and/or their respective directors and employees may own the investments of any of the issuers discussed herein and may sell them to or buy them from customers on a principal basis. This report is intended solely for clients and prospective clients of members of the Standard Bank Group and is not intended for, and may not be relied on by, retail custom-ers or persons to whom this report may not be provided by law. This report is for information purposes only and may not be reproduced or distributed to any other person without the prior consent of a member of the Standard Bank Group. Unauthorised use or disclosure of this document is strictly prohibited. By accepting this document, you agree to be bound by the foregoing limitations. Copyright 2012 Standard Bank Group. All rights reserved.