a study on recycling of crumb rubber and low density polyethylene
TRANSCRIPT

International Journal of Scientific and Research Publications, Volume 2, Issue 10, October 2012 1 ISSN 2250-3153
www.ijsrp.org
A Study on Recycling Of Crumb Rubber and Low
Density Polyethylene Blend on Stone Matrix Asphalt
Ganapathi Malarvizhi1*
, N.Senthil1 and C.Kamaraj
2
1 Division Of Transportation Engineering, Department of Civil Engineering (CEG), Anna University, Chennai, India.
2 Transportation Planning and Environment Division, CSIR-Central Road Research Institute, New Delhi, India.
Abstract- Stone Matrix Asphalt (SMA) is hot mixture asphalt
consisting of a coarse aggregate skeleton and a higher binder
content mortar. To minimize the pollution from waste tires and to
improve the properties of SMA, Recycled Crumb Rubber (CR)
plus Low Density Polyethylene (LDPE) flakes were used as
additive using dry process as a research study. This research
investigated the feasibility of using 15% and 30% CR+LDPE by
weight of bitumen with 60/70 penetration grade bitumen for
SMA. SMA mixture meeting the desired volumetric properties
could be produced using the combination of 30% (Combined
Combination with 30% CR and 70 % LDPE) by weight of the
bitumen). No fiber was needed to prevent drain down when this
rubber blend was used. Based on results of indirect tensile tests,
unconfined compression test and variance analysis, it was
observed that the addition of recycled CR+ LDPE using dry
process could improve engineering properties of SMA mixtures,
and the rubber content has a significant effect on long term
performance.
Index Terms- Recycled crumb rubber, low density poly-
ethylene flakes, dry process, properties.
I. INTRODUCTION
ith the rapid development of the automobile industry and
higher standard of living of people in India, the quantity of
autos increased sharply, India is facing the environmental
problem related to the disposal of large-scale waste tyres. The
world generates about 1.5 billion waste tyres annually, 40
percent of them in emerging markets such as China, India, South
Africa, South East Asia, South America and Eastern Europe.
With more than 33 million vehicles added to the Indian Roads in
the last three years. Now, In accordance with the statistic data, 80
million scrap tires were produced in 2002, and with 12% of
growth rate every year, the total number of abandoned tires will
be expected to reach 120 million in 2005 and 200 million in
2010[1]. How to deal with the huge number of waste tyres has
become an urgent problem of environment in India.
The disposal of waste tyres in the world primarily has three
ways to deal with such as landfill, burning and recycling.
Recycled tire rubber applied to pavement may be the best way to
reduce waste tyres in large quantities and, at the same time,
improve some engineering properties of asphalt mixtures.
Crumb rubber can be incorporate by a wet process or dry
process. Wet process refers to modification of asphalt
cement binder with 5-25wt% of fine tyre rubber Crumb Modifier
(CRM) at an elevated temperature. The dry process includes
mixing the rubber particles with aggregates prior to addition to
asphalt. The main differences between the two processes consist
in rubber particle size, rubber amount, rubber function, and
incorporation facility [3]. Although the dry process presents
some advantages in relation to the wet process, mainly
concerning the costs involved and to the higher amount of rubber
to be used, the research all over the world have concentrated
mainly on the wet process. This choice may be explained by the
irregular performance of some experiment sections built with the
dry process, unlike the wet process, which has presented more
satisfactory results [4].
Stone Matrix Asphalt (SMA) is hot mixture asphalt
consisting of a coarse aggregate skeleton and a high binder
content mortar. SMA was developed in Germany during the mid-
1960s and it has been used in Europe for more than 20 years to
provide better rutting resistance and to resist studied tyre wear
[1]. Because of its success in Europe, some States, through the
cooperation of the Federal Highway Administration, constructed
SMA pavements in the United States in 1991 [2]. Since that time
the use of SMA in the US has increased significantly. Japan has
also started to use SMA paving mixtures as well with good
success [3]. Recently, the Ministry of Communications in
Saudi Arabia has introduced SMA in its road specifications. In
the year 2006 and 2008, two experimental sections were
constructed using both drum mix plant as well as batch mix plant
in New Delhi, India [4].
SMA is a gap graded aggregate-asphalt hot mixture that
maximizes the asphalt cement content and coarse aggregate
fraction. This provides a stable stone-on-stone skeleton that is
held together by a rich mixture of asphalt cement, filler, and
stabilizing additive. The original purpose of SMA was to provide
a mixture that offered maximum resistance to studded tire wear.
SMA has also shown high resistance to plastic deformation under
heavy traffic loads with high tire pressures, as well as good
low temperature properties [2, 5]. The main concept of having a
gap gradation of 100% crushed aggregates is to increase
pavements through interlock and stone-to-stone contact. This
mixture is designed to have 3-4% air voids, and relatively high
asphalt content due to the high amount of voids in the mineral
aggregate. The mixture contains high filler content (10% passing
the 0.075-mm sieve), and typically contains a polymer in the
asphalt cement, or fiber (cellulose or mineral) in the mixture to
prevent drainage of the asphalt cement. This mixture has a
surface appearance similar to that of an open graded friction
course; however it has low in-place air voids similar to that of a
dense graded HMA.
In this research study, a dry processing of Crumb Rubber
(CR) and Low Density Polyethylene (LDPE) blend were used as
W

International Journal of Scientific and Research Publications, Volume 2, Issue 10, October 2012 2
ISSN 2250-3153
www.ijsrp.org
additive for SMA mixture was investigated. The main purpose of
this research was to determine the effects of incorporating CR +
LDPE waste on the engineering properties of SMA. The
volumetric and mechanical properties of SMA that include
various percentages of CR+LDPE were calculated and assessed
with laboratory tests. The outcomes were statistically analyzed
and determination of the significance at certain confidence limits
was performed with single factor variance analysis (ANOVA).
II. TEST MATERIALS AND TESTING PROGRAM
2.1 Materials
The materials that have been used in this study are crushed
blue granite stone for coarse aggregate and fine aggregate,
hydrated lime as mineral filler with SMA13 grading as per Indian
specification IRC-SP: 79-2008. Table 1 displays the selected
grading of the aggregate and Table 2 shows its properties. The
bitumen used for this study was 60/70 penetration grade. The
physicochemical properties of the used bitumen are available in
Table 3. Table 4 presents the specific gravities of the materials.
In this study, the size of CR was below 30 mesh (0.600 mm) and
LDPE flakes of 16MA400 grade injection molding grade film
was used as additive in SMA mixture, its appearance is shown in
Fig.1a-b.
Fig. 1 a: Appearance of crumb rubber powder
Fig. 1 b: Appearance of LDPE flakes
Table 1 Gradations and Gradation Limits used for the study
Sieve Size (mm) Adopted Gradation Specification Limits
19 100 100
13.2 98 90 -100
9.5 73 50 – 75
4.75 22 20 -28
2.36 20 16 – 24
1.18 18 13 – 21
0.6 15 12 -18
0.3 13 10 – 20
0.075 9 8 – 12

International Journal of Scientific and Research Publications, Volume 2, Issue 10, October 2012 3
ISSN 2250-3153
www.ijsrp.org
Fig.2: Aggregate gradation curves.
Table 2 Physical properties of crushed aggregate
Property Test Method Specification Test results
Cleanliness Grain Size Analysis IS:2386 (P-1) < 2% passing
0.075 mm sieve
1%
Particle Shape Flakiness index
Elongation Index
IS:2386 (P-1) <12%
< 18%
10%
15%
Strength Los Angeles Abrasion
Value
IS:2386 (P-4) < 25% 22%
Aggregate Impact
Value
IS:2386 (P-4) < 18% 14.7%
Water
Absorption
Water Absorption IS:2386 (P-3) < 2% 1.7%
Specific gravity Specific gravity IS:2386 (P-1) - 2.85
Table 3 The results of tests performed on bitumen
S.NO Properties Test Method Units Permissible Values Test Results
1 Specific Gravity test IS 1202 - 1978 - - 1.02
2 Penetration at 25 OC IS 1203 - 1978 0.1mm 60 – 70 64
3 Softening Point IS 1205 - 1978 OC 55 55
4 Ductility IS 1208 - 1978 cm Min. 50 76

International Journal of Scientific and Research Publications, Volume 2, Issue 10, October 2012 4
ISSN 2250-3153
www.ijsrp.org
Table 4 Specific gravities of materials (g/cm3)
S.NO Materials Specific gravity (g/cm3)
1 Coarse aggregate 2.85
2 Fine aggregate 2.7
3 Bitumen 1.02
4 CR 1.25
5 LDPE 0.95
2.2 Marshal Mix Design
The Marshall Mix design procedure as specified in ASTM
D1559 was used in this study. Laboratory mixing and
compaction temperature for all mixtures were selected according
to viscosity criteria. Two rubber contents were considered (15%
and 30% by weight of bitumen) in dry process. In dry process,
the additives were blended with the aggregate before adding
bitumen. In order to fabricate the samples, the stages were
followed:
1) Before adding aggregate to the mixture, it was heated to
200ºC for a period of approximately 2h. The weight of
aggregate for each sample was 1100g.
2) The CR+LDPE blends were introduced at the rate of
15% and 30% respectively.
3) After the addition of additive, the blending time of
aggregate was prolonged 10-20 s to disperse rubber
evenly.
4) The combination of aggregate, bitumen and filler was
mixed at a temperature of 160±5 ºC for about 5 min.
5) The bitumen contents used in the mixture was varied at
the rate of 5.5%, 6% and 6.5% by weight of aggregate.
The selected bitumen was heated to 160 ºC for about 1 h
prior to blending with the aggregate.
6) The Marshall compactor was used for the compaction
stage of the process with 50 blows applied to both the
faces of the sample at 150 ºC.
7) Samples were cooled at room temperature for a period
of 12 h before de-molding.
8) The Optimum bitumen Content (OBC) was estimated at
which the air voids (Va), and the minimum voids in
mineral aggregates (VMA) are 4 and 17 percent
respectively.
2.3 Testing Program
After determining the OBC of each mixture, drain down
tests were performed per AASHTO T 305 determination of drain
down characteristics in uncompacted asphalt mixtures. Drain
down was tested by placing the uncompacted mixture in a basket
in an oven at the mixing temperature of the binder (162 ◦C) and
at 177 ◦C per AASHTO T 305. The drain down was calculated as
the percentage of binder that drained out of the basket compared
to the original weight of the sample. Drain down was also tested
at binder contents exceeding the OBC to determine the
stabilizing capacity of fiber. Most states require that the drain
down of SMA mixtures not exceed 0.3% by weight of the
mixture. The binder contents used in this portion of the study
started at 5.5% (by weight of mixture) and increased by 0.5%
until a draindown of 0.3% was reached. The stabilizing capacity
of fiber was determined as the binder content at which the
draindown reached 0.3%.
Moisture susceptibility was conducted by comparing the
indirect tensile strength (ITS) of three
100mmdiameter×63.5mmtall specimens conditioned in 60±1 ◦C
water for 24 h to the ITS of three specimens, of the same
dimensions, dry conditioned at 25±1 ◦C (modified ASTM D
4867). The ITS specimens were compacted to 6–8% air voids
with a Marshall hammer. Each specimen was loaded to failure
and the following parameters were evaluated:
1. Indirect tensile strength (ITS):
ITS = 2Pmax/π td, (1)
where Pmax is peak load (N), t the average height of specimen
(mm) and d the diameter of specimen (mm).
1. Tensile strength ratio (TSR):
TSR (%) = ITSwet
---------- X 100, (2)
ITSdry
The unconfined compression tests were performed using a
15-ton capacity universal testing machine in a room temperature
of around 25º C. Test specimens 2.5 inches thick and 4 inches
diameter were placed on the lower fixed plate of the testing
machine. Load was applied with a uniform rate of 2 mm/min on
the circular face of the testing samples until failure occurred. The
maximum load to failure was recorded and hence the
compressive strength was calculated.
The compressive strength can be calculated using the
following expression;
1. Unconfined Compressive strength (UCS):
2.
4Pmax
σc = πD2 (3)
where, σc = Unconfined Compressive Strength, Pmax =
Maximum applied compressive load , and D = Diameter of the
specimen.

International Journal of Scientific and Research Publications, Volume 2, Issue 10, October 2012 5
ISSN 2250-3153
www.ijsrp.org
III. RESULTS AND DISCUSSION
3.1 Bulk Specific Gravity
The volumetric properties of the samples were determined
and the test results of the samples with various combinations and
relations were presented below. The Bulk Density for the various
combinations of the Crumb Rubber and LDPE as additive in the
SMA Mix was shown in the Table 5 and Fig.2 (a) and 2(b). The
Bulk Density varies from 2.31 to 2.36 for the various
combinations of the Crumb Rubber and LDPE.
Table 5 Relationship between Bulk Density Vs Binder Content
Additive 15% 30%
Binder Content, % 5.5 6 6.5 5.5 6 6.5
Control 2.341 2.328 2.315 2.341 2.328 2.315
70C+ 30L 2.354 2.341 2.328 2.351 2.337 2.329
50C +50L 2.360 2.345 2.332 2.358 2.346 2.332
30C +70L 2.360 2.346 2.335 2.360 2.347 2.335
Note: 70C = 70% of Crumb Rubber by weight of bitumen in SMA Mix; 30L = 30% of LDPE by weight of bitumen in SMA Mix.
Fig.2(a) : Bulk Density for SMA with 15% Additive
Fig.2(b): Bulk Density for SMA with 30% Additive
International Journal of Scientific and Research Publications, Volume 2, Issue 10, October 2012 6
ISSN 2250-3153
www.ijsrp.org
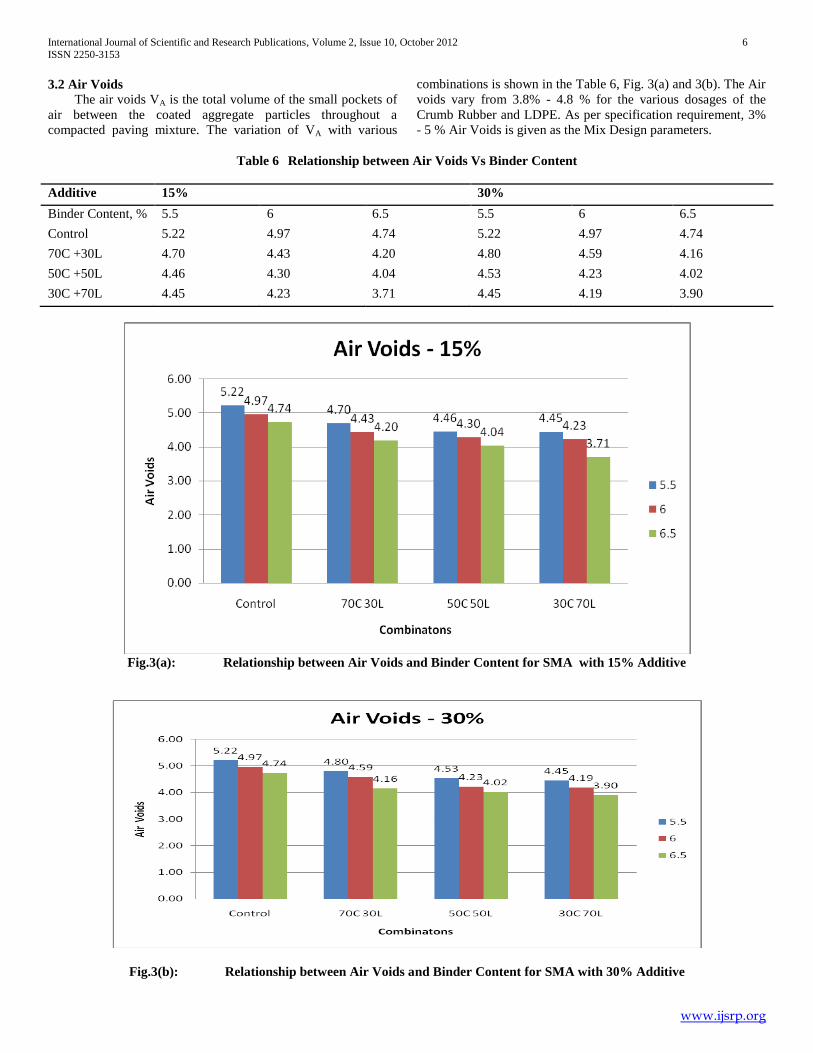
3.2 Air Voids
The air voids VA is the total volume of the small pockets of
air between the coated aggregate particles throughout a
compacted paving mixture. The variation of VA with various
combinations is shown in the Table 6, Fig. 3(a) and 3(b). The Air
voids vary from 3.8% - 4.8 % for the various dosages of the
Crumb Rubber and LDPE. As per specification requirement, 3%
- 5 % Air Voids is given as the Mix Design parameters.
Table 6 Relationship between Air Voids Vs Binder Content
Additive 15% 30%
Binder Content, % 5.5 6 6.5 5.5 6 6.5
Control 5.22 4.97 4.74 5.22 4.97 4.74
70C +30L 4.70 4.43 4.20 4.80 4.59 4.16
50C +50L 4.46 4.30 4.04 4.53 4.23 4.02
30C +70L 4.45 4.23 3.71 4.45 4.19 3.90
Fig.3(a): Relationship between Air Voids and Binder Content for SMA with 15% Additive
Fig.3(b): Relationship between Air Voids and Binder Content for SMA with 30% Additive

International Journal of Scientific and Research Publications, Volume 2, Issue 10, October 2012 7
ISSN 2250-3153
www.ijsrp.org
3.3 Voids in Mineral Aggregates
Voids in Mineral Aggregaes can defined as the intergranular
space occupied by the asphalt and air in a compacted asphalt
mixture. An increase in the dust proportion will generally
decrease the VMA. The variation of VMA for the various
combinations of the Crumb Rubber and LDPE as additive in the
SMA mixes were shown in the Table 7, Fig. 4(a) and 4(b). The
Air voids vary from 17 % to 20 % for the various dosages of the
Crumb Rubber and LDPE. As per specification requirement, a
minimum of 17 % of Voids in Mineral Aggregates has to be
present in the mix as the Mix Design parameters.
Table 7 Relationship between VMA Vs Binder Content
Additive
15%
30%
Bitumen Content, %
5.5
6
6.5
5.5
6
6.5
Control 17.85 18.68 19.53 17.85 18.68 19.53
70C+ 30L 17.40 18.22 19.07 17.48 18.36 19.04
50C+ 50L 17.19 18.10 18.94 17.25 18.04 18.92
30C+ 70L 17.18 18.05 18.66 17.17 18.02 18.82
Fig.4(a): Relationship between VMA and Binder Content for SMA with 15% Additive

International Journal of Scientific and Research Publications, Volume 2, Issue 10, October 2012 8
ISSN 2250-3153
www.ijsrp.org
Fig.4(b): Relationship between VMA and Binder Content for SMA with 30% Additive
3.4 Voids in Coarse Aggregates
The variation of Voids in the Coarse Aggregates for Mix
with different dosgae of additive in the SMA mixes were shown
the Table 8, Figure 5(a) and 5(b). The VCAMIX vary from 34 %
to 36 % for the various dosages of the Crumb Rubber and LDPE.
The Voids in the Coarse Aggregates under Dry Rodded
Condition is found to be 48%. As per specification requirement,
Voids in Mineral Aggregates for Mix is less than the Voids in
Mineral Aggregates under Dry Rodded Condition as the Design
Parameter. This shows the presence of the better Stone on stone
contact in the mix.
Table 8 Relationship between VCA Vs Binder Content
Additive 15% 30%
Binder Content, % 5.5 6 6.5 5.5 6 6.5
Control 35.02 35.37 35.74 35.02 35.37 35.74
70C+ 30L 34.66 35.01 35.38 34.73 35.11 35.35
50C +50L 34.49 34.91 35.27 34.54 34.86 35.26
30C+ 70L 34.49 34.87 35.05 34.48 34.84 35.18

International Journal of Scientific and Research Publications, Volume 2, Issue 10, October 2012 9
ISSN 2250-3153
www.ijsrp.org
Fig 5(a): Relationship between VCAMIX and Binder Content for SMA with 15% Additive
Fig 5(b): Relationship between VCAMIX and Binder Content for SMA with 30% Additive
3.5 Tensile Strength Ratio The variation of Indirect Tensile Strength Ratio for Mix
with different dosgae of the Crumb Rubber and LDPE as additive
in the SMA mixes were shown in the Table 9, Fig.6(a) and 6(b).
The TSR vary from 85% to 94% for the various dosages of the
Crumb Rubber and LDPE. As per specification requirement,
Indirect Tensile Ratio for the Mix should be more than 85% as
the Design parameters. This shows the presence of the resistance
to cracking and moisture damage.

International Journal of Scientific and Research Publications, Volume 2, Issue 10, October 2012 10
ISSN 2250-3153
www.ijsrp.org
Table 9 Tensile Strength Ratio (%)
Additive 15% 30%
Bitumen Content, % 5.5 6 6.5 5.5 6 6.5
Control 85 85 86 85 85 86
70C+ 30L 89 87 90 87 86 90
50C+ 50L 89 90 84 85 92 90
30C+ 70L 89 86 91 88 87 94
Fig. 6(a) : TSR for SMA Mixes with 15% Additive

International Journal of Scientific and Research Publications, Volume 2, Issue 10, October 2012 11
ISSN 2250-3153
www.ijsrp.org
Fig.6(b): TSR for SMA Mixes with 30% Additive
3.6 Drain Down Sensitivity
The variation of Drain down Sensitivity for the sample
under uncontrolled condition is given in the Table 10, Fig. 7(a)
and 7(b). The Drain down values was in the range of 0.04% to
0.17% by weight of the mix. As per specification requirement,
drain down can be Maximum of 0.3% as the Mix Design
parameters. This shows that the Crumb Rubber and LDPE as
additive (Combined) sustains the drain down and stabilizes the
SMA Mix.
Table 10 Drain Down Sensitivity
Additive 15% 30%
Binder Content, % 5.5 6 6.5 5.5 6 6.5
Control 0.13 0.16 0.17 0.13 0.16 0.17
70C+ 30L 0.09 0.10 0.07 0.07 0.09 0.09
50C+ 50L 0.11 0.07 0.06 0.09 0.06 0.04
30C +70L 0.07 0.05 0.07 0.09 0.07 0.05

International Journal of Scientific and Research Publications, Volume 2, Issue 10, October 2012 12
ISSN 2250-3153
www.ijsrp.org
Fig. 7(a):Drain Down for SMA Mixes with 15% Additive
Fig.7(b) :Drain down for SMA Mixes with 30% Additive3.7 Compressive Strength
The variation of Compressive Strength for Mix with
different dosgae of the Crumb Rubber and LDPE as additive in
the SMA mixes were shown in the Table 11, Fig. 8(a) and 8(b).
The Compressive Strength for Mix varies from 410 Kg/cm2 to
860 Kg/cm2 for the various combinations.

International Journal of Scientific and Research Publications, Volume 2, Issue 10, October 2012 13
ISSN 2250-3153
www.ijsrp.org
Table 11 Unconfined Compressive Strength (kg/cm2)
Additive 15% 30%
Binder Content, % 5.5 6 6.5 5.5 6 6.5
Control 1680 1952 2080 1680 1952 2080
70C+ 30L 2160 2800 2240 2080 2800 2720
50C+ 50L 2000 3040 2880 2720 3040 3520
30C+ 70L 3200 2640 2800 2160 2640 4000
Fig.8(a) Relationship between Compressive Strength Vs Binder content for SMA with 15% Additive

International Journal of Scientific and Research Publications, Volume 2, Issue 10, October 2012 14
ISSN 2250-3153
www.ijsrp.org
Fig. 8(b) :Relationship between Compressive Strength Vs Bindedr Content for SMA with 30% Additive
3.8 Properties of SMA Mixture at Optimum Binder Content OBC for SMA Mix has been estimated considering the Air
Voids (Va), Minimum Voids in Mineral Aggregates (VMA) and
Tensile Strength Ratio (TSR) respectively. Volumetric analyses
of SMA mixtures at various binder contents are presented in the
Table 12.
Table 12 Volumetric Properties of SMA Mixtures at OBC
Properties Value Obtained
CR+LDPE Additive by Weight of bitumen, % 30% (30C+ 70L) Combination
Optimum Binder Content by Weight of Aggregate, % 6.50
Optimum Binder Content by Weight of Mix, % 6.10
Bulk Specific Gravity of Compacted Mixture, Gmb 2.34
Air Voids, % 3.90
VMA, % 18.82
VCADRC, % 48
VCAMIX, % 35.18
TSR, % 94
Drain Down, % 0.05
Compressive Strength, kg/cm2
860
IV. ANOVA ANALYSIS
A NOVA analysis was conducted to determine the effect of
CR+LDPE on properties of SMA. In the Single- factor tests of
ANOVA, rubber content was chosen as factor and compressive
strength were response respectively. The results of ANOVA
analysis are summarized in Table 13. It can be seen from Table
13, the case of variance analysis of 15% additive of UCS, value
of F(1.171950) is less than Fcritical (4.256), it can be concluded
that rubber content has no significant effect on the UCS. In case
of variance analysis of 30% additive of UCS, value of
F(8.99116) is bigger than Fcritical (4.256), it can be concluded that
rubber content has significant effect on the UCS. Therefore, the
SMA mixture containing 30% additive has the best performance.

International Journal of Scientific and Research Publications, Volume 2, Issue 10, October 2012 15
ISSN 2250-3153
www.ijsrp.org
Table 13
Results of ANOVA analysis of Unconfined compressive strength test (α=0.05)
SS df MS F F critical p-value
Source of variance (15% additive)
Between 253824 2 126912 1.17194 4.256 0.8824
Within 974624 9 108292
Total 1228448 11
Source of Variance (30% additive)
Between 1693184 2 846592 8.99116 4.256 0.8856
Within 847424 9 94158
Total 2540608 11
V. CONCLUSION AND RECOMMENDATIONS
From the experimental investigations the following
conclusions are drawn.
The Tensile strength Ratio values are found to be in the
range 85 - 94 % which is more than 85 % as specified
for a SMA mixture.
The Compressive strength values are found to be in the
range 1600 kg/cm2
- 4000 kg/cm2. The Compressive
strength of SMA Mix with Crumb Rubber and LDPE
blend as additive improved the longevity from the
Compressive strength value.
The SMA mixes designed with available aggregates
showed good stone on stone contact (VCA DRC< VCA
MIX).
The 17% Voids in Mineral aggregate and 3 - 5% air
voids in the mix were fulfilled as SMA Mix design
criteria.
The Drain down values was in the range of 0.04% to
0.17% by weight of the mix.
Based on the above performance, Combined
Combination of Crumb Rubber and LDPE could be
used as stabilizing additive in the form of dry
processing showed without affecting the design criteria
of SMA mixture.
The optimum dosage of the Additive was found to be 30
% (Combined Combination with 30% Crumb Rubber
and 70 % LDPE) by weight of the bitumen.
From the results of ANOVA analysis of UCS, 30%
rubber content by weight of bitumen has significant
effect on best performance.
The long-term performance of recycled CR+LDPE
blend on SMA mixture using dry process will need to be
further studied.
REFERENCES
[1] Chui-Te Chiu , Li-Cheng Lu (2006), “A laboratory study on stone matrix asphalt using ground tire rubber ” Chung Hua University, Taiwan.
[2] Punith V.S et.al (2004) “Comparative studies on the behaviour of SMA and AC utilizing reclaimed polyethylene” HRB, Pg No 61-76 Volume No 71 Dec 2004
[3] Brown E R, Haddock JE, Mallick RB, Lynn AT,(1977) “Development of a mixture design procedure for stone matrix asphalt (SMA)” , NCAT Report No. 97-3.
[4] Yongjie Xue et al.,(2007) “Utilization of municipal solid waste incineration ash in stone mastic asphalt Mixture” Wuhan University of Technology, China.
[5] Brown ER, Haddock JE, Mallick RB, Bukowski J.(1997) “ Performance of stone matrix asphalt (sma) in the US”, AAPT vol. 66, 1997.
[6] Brown, E.R., Mallick, R.B., Haddock, J.E., and Bukowski, J. 1997. Performance of stone matrix asphalt (SMA) mixtures in the United States. National Center for Asphalt Technology, Auburn University, Auburn, Ala. Report no. 97–1.
[7] Kandhal, P.S., Roberts, F.L., Brown, E.R., Lee, D.-Y., and Kennedy, T.W. 1996. Hot mix asphalt materials mixture design and construction. NAPA Education Foundation, Lanham, Md.
[8] C.Kamaraj, G.Kumar, G.Sharma, P.K.Jain And K.V.Babu “Laboratory Studies On The Behaviour Of Stone Matrix Asphalt Vis-À-Vis Dense Graded Bituminous Mixes Using Natural Rubber Powder (Wet Process)’, Highway Research Bulletin, No 71, December 2004.
[9] C.Kamaraj, P.K.Jain, V.K.Sood And P.K.Sikdar “ Design Of Stone Matrix Asphalt Using Different Stabilizing Additives” Journal of Indian Roads Congress, April 2006, Vol-67(1).
[10] B.M.Sharma and C.Kamaraj, “Construction And Performance Evaluation Of Experimental Sections Laid On Urban Roads Using Stone Matrix Asphalt Mixtures”, 23rd ARRB Conference – Research Partnering with Practitioners, Adelaide Australia, 2008.
[11] Brown ER, Haddock JE et al., J.(1997) “ Performance of stone matrix asphalt (SMA) in the US”, AAPT vol. 66, 1997.
[12] Zhu Horan, Yang Jun, Cong Ling, Cui Juan and Wan Jun (2007) of Southeast University, China “ The influence of polyester fibre on the performance of asphalt mixes”, 26th Southern African Transport Conference (SATC 2007)
[13] Simantini Behera and Narayan Panda, (2010), “ Laboratory investigations on stone matrix asphalt using sisal fibre for Indian roads”, National Institute of Technology Rourkela.
[14] Bukowski J.R (1992),” The Future SMA in America”, The Asphalt Institute, Volume 6, #3, FHWA.
AUTHORS
First Author – Dr. Ganapathi Malarvizhi, M.E,Ph.D Assistant
Professor, Division of Transportation Engineering, Civil
Department, College of Engineering, Anna University, Chennai –
600 025, India., Email: [email protected]
Second Author – N.Senthil , Post Graduate Student in M.E
Transportation Engineering, Civil Engineering Department,
College Of Engineering, Guindy, Anna University, Chennai-25,
India.

International Journal of Scientific and Research Publications, Volume 2, Issue 10, October 2012 16
ISSN 2250-3153
www.ijsrp.org
Third Author – C.Kamaraj, M.E (Civil Engg), Transportation
Planning and Environment Division, CSIR-Central Road
Research Institute, New Delhi, India.
Correspondence Author – Dr.Ganapathi Malarvizhi, M.E,Ph.D
,Assistant Professor, Division of Transportation Engineering,
Civil Department, College of Engineering, Anna University,
Chennai – 600 025,India. Email: [email protected].
Contact no: +91-9840726596, 044-22357516