welcome to asia pacific - aon benfieldthoughtleadership.aonbenfield.com/documents/201503...welcome...
TRANSCRIPT

1Risk. Reinsurance. Human Resources.
Aon Benfield
Welcome to Asia PacificA journey through the region’s insurance and reinsurance markets

2 3
The Asia Pacific region is home to more than half the world’s population, with diverse societies, cultures, economies and regulatory regimes. As rapid economic development, population growth and urbanisation lead to increased insurance penetration, Asia Pacific represents a key area of growth in the global marketplace.
In fact, in Aon Benfield’s 2015 Insurance Risk Study, three Asian markets make the top 3 of the Country Opportunity Index (COI), which identifies the world’s most promising property and casualty markets. They were chosen by analysts owing to their profitability, growth potential and relatively stable political environments. Indonesia, Malaysia, and Singapore tied this year for the number one position in the list of 50 countries. They were also the top quartile performer in both 2013 and 2014.
With many insurance and reinsurance companies already investing in this region and seeking to take advantage of the growth opportunities, an expert insight into these markets is crucial. Aon Benfield’s local teams have produced this guide as both an introduction to and exploration of sixteen key markets in Asia Pacific.
Data has been collated from major rating agencies, industry associations and regulatory bodies, IMF, World Bank, AXCO, Aon Risk Solutions, Aon Hewitt, and Aon Benfield. In addition, we have included our own views of each market’s major risks, regulatory & market updates, and market outlook.
With a global fact base and broad access to local market practitioners, Aon Benfield is equipped to provide insight across a spectrum of lines, products, and geographies. Inpoint, the consulting division of Aon Benfield, helps insurers and reinsurers address these challenges, from sizing market opportunities to identifying distribution channel dynamics, assessing competitor behaviour, and understanding what it takes to compete and win. Our approach leverages Aon Benfield’s 130mn USD annual investment in analytics, data and modelling to help our clients grow profitably.
Combined with Aon Benfield’s expertise and commitment to the region, we hope the guide will boost your understanding of the region and the available growth opportunities.
Wherever available, or unless otherwise stated, premiums include numbers for non-life and personal accident & healthcare business written by non-life companies.
Wherever Incurred Losses were not available, Loss Ratio was calculated on the basis of Paid Losses.
Demographics refer to 2015 estimates.
2014 GDP for Guam was not available, hence, excluded from the APAC insurance penetration calculation.
To calculate Y/Y Growth, restated numbers from prior year are used, wherever available.
The premiums information put together ranges from gross to direct and net basis; depending upon whatever was best available for each of the countries.
Australia
Pakistan
Malaysia
Thailand
Singapore
Indonesia
Brunei
Philippines
New Zealand
China
Hong Kong
Korea (Republic of)
Taiwan
Vietnam
Japan
India
Introduction Markets Topics
• Demographics
• Political & Terror Risk
• Sovereign Rating and Outlook
• Major Risks
• Top 5 Insurers
• Non-life Insurance Penetration Rate
• Industry Premiums Split by Line of Business
• Industry Aggregate Premium and Trends
• Capital Requirements
• Regulatory Updates
• Foreign Ownership
• Aon Benfield Outlook

4 5
AustraliaGold Coast

6 7
20,000
25,000
30,000
35,000
40,000
2010 2011 2012 2013 2014
Total Premiums AUD million Total Premiums USD million
Entity
GEP
USD mn
GEP
AUD mn
Inc claims
AUD mn
UW result
AUD mn
QBE Insurance Group Ltd. 16,606.9 18,423.7 11,515.6 609.5
Insurance Australia
Group Ltd. 8,762.1 9,720.6 6,791.8 1,139.6
Suncorp Insurance
Holdings Ltd. 7,919.7 8,786.1 6,600.9 665.7
Allianz Australia Ltd. 3,533.4 3,920.0 3,090.6 -8.5
Zurich Financial Services
Australia Ltd. 1,140.0 1,264.7 905.8 -115.9
Australia
Capital Requirements
Minimum capital requirement of 5mn AUD is effective from 1 July 2002. Prudential Standards GPS 110 specifies that a regulated institution must ensure that it has a capital base, at all times, in excess of its Prudential Capital Requirement (PCR) which is intended to take account of the full range of risks to which a regulated institution is exposed, including insurance risk, insurance concentration risk, asset risk, asset concentration risk, and operational risk.
Foreign Ownership
There are no material restrictions on foreign ownership. Subject to regulatory approval, foreign companies may acquire any percentage of a domestic company’s equity or may establish wholly owned subsidiaries or branches.
Foreign investments in Australia above a certain size must be approved by the Foreign Investment Review Board (FIRB).
For investors from the US, Chile, Japan, Korea and New Zealand, they need approval from FIRB for acquiring a domestic company with assets in excess of 1.09bn AUD. For investors from other countries, the approval limit is 252mn AUD.
Regulatory Updates
Australian Prudential Regulation Authority (APRA) released a package that harmonizes and enhances its current risk management requirements. The package includes the final cross-industry Prudential Standard CPS 220 Risk Management, a proposed prudential practice guide on risk management, and a response paper that addresses submissions received by APRA on the CPS 220 consultation package released in May 2013. APRA also released an amended Prudential Standard CPA 510 Governance (CPS 510) to ensure that governance requirements related to risk management was aligned with those of CPS 220. The new Prudential Standard CPS 220 Risk Management (CPS 220) and amended Prudential Standard CPS 510 Governance (CPS 510) have been in effect since 1 January 2015.
Major Risks
Underwriting Risk
Given the consolidation of the insurance market in Australia, and a highly competitive environment, most insurers are heavily focused on underwriting and risk selection. Increasingly the market is utilising external data sources to help refine underwriting decisions, with many companies exploring the use of Big Data analytics in their processes.
Regulatory Risk
Since LAGIC was introduced in 2013, the Australian market has quickly adapted to the horizontal as well as vertical requirement of the solvency standard, resulting in the Australian market developing an equitable working relationship with the regulation as it currently stands. In 2016 however, the Reserve Bank of New Zealand will have fully implemented its solvency regime, requiring (at an upper level) a 1 in 1000 year capitalisation for earthquake risk in Wellington. The ramifications of this requirement are already being seen, with some Trans Tasman insurers already setting reinsurance needs based on their New Zealand exposure.
Top 5 Insurers
Industry Premiums Split by Lines of Business
Industry Aggregate Premium 2010 to 2014
Credit Rating and Outlook
Rating Outlook
S&P AAA Stable
Fitch AAA Stable
Moody's Aaa Stable
AM Best CRT-1
Aon Benfield Outlook
Growth in the insurance market is relatively stable and broadly in line with natural inflation. With regards to reinsurance, catastrophe limits are increasing at a low single digit rate each year. Following the 2010/11 events, the market moved away from proportional business, however as reinsurers are searching for growth, there is an increased appetite to move back into proportional solutions.
Reducing premium rates are putting margins under pressure and forcing firms to have a clear focus on expense management going forward. For insurers, the biggest challenge is the static market and the pressure to grow. Exacerbating this pressure, over recent years various international underwriters have entered the Australian market, utilising global balance sheets to make the market even more competitive. These forces have forced many insurers to revisit and (re)define their value proposition and their “reason for being”.
The biggest challenge for reinsurers in Australia is to try and remain relevant to the well capitalised main reinsurance purchasers, as well as keeping their diversifying exposures in Australia aligned to the capacity they are deploying in the peak zone globally. Over recent years, the more successful of these have viewed their insurance clients on a holistic basis, viewing capital needs of their clients in totality rather than trying to underwrite selective placements.
Political Risk
Terror Risk
World Bank relative ease of doing business
GDP – PPP (USD bn)
1,136.9
GDP Per Capita – PPP (USD)
47,318
Population (mn)
24.0
5yr Real GDP Growth (%)
4.4
Unemployment Rate (%)
6.3
Inflation Rate (%)
1.8
Ranking based on Gross Earned Premiums, includes domestic and overseas Non-Life + PA & Healthcare premiums
*Growth % is based on premiums in local currency Break-up by line of business reflects written premiums within this market sector
Lines of
business USD mn AUD mn
Inc claims
AUD mn
Loss
ratio %
Comb
ratio %
*Y/Y
growth %
Property 10,156.3 11,267.0 5,613.0 47.4 68.8 -0.2
Motor 12,235.0 13,573.0 10,388.0 77.1 94.1 1.9
Workers Comp 1,486.4 1,649.0 1,614.0 97.3 112.4 -6.1
Liability 3,411.0 3,784.0 2,561.0 68.2 90.4 2.0
Miscellaneous 4,943.4 5,484.0 2,018.0 39.3 63.7 4.5
Industry-wide
Non-Life 32,232.0 35,757.0 22,194.0 61.9 81.9 1.2
2014 DWPLow High
Easiest Hardest
Data Source: IMF, AXCO, SNL, S&P, Fitch, Moody’s, A.M. Best, Australian Prudential Regulatory Authority, Aon, and Aon Benfield.
2014 GEP
2014 Insurance Penetration - Non-life and PA & Healthcare GWP vs. GDP
Australia Prem: GDP = 2.2%; APAC Prem: GDP = 1.5%
(2015 est.)

8 9
BruneiSultan Omar Ali Saifuddin Mosque in Bandar Seri Begawan

10 11
Brunei
Major Risks
Litigation Risk
The Legal Profession (Contingency Fee) Act 1994 has incentivised law firms to encourage clients to go to court to seek compensation for motor vehicle or occupational injury accidents. A contentious motor liability case is more likely to go to court in Brunei than in any other country in South-East Asia, many of which at grossly inflated compensation demands.
Credit Rating and Outlook
Rating Outlook
S&P NA —
Fitch NA —
Moody's NA —
AM Best CRT-4
Capital Requirements
The Insurance Order 2006 and Insurance Regulations 2006 require life and non-life insurers to keep the minimum paid-up capital of 8mn BND with a minimum deposit set at 1mn BND to be maintained with Monetary Authority of Brunei Darussalem. The capital requirements for Takaful operators are the same. Insurers established or incorporated outside Brunei who do not have local share capital are required to maintain in Brunei a surplus of assets over liabilities of an amount not less than the requirement for the minimum paid-up capital of an insurer incorporated in Brunei.
Foreign Ownership
Foreign ownership is not restricted or discriminated against under The Insurance Order 2006 and Insurance Regulations 2006.
Incorporated foreign companies wishing to establish a place of business in Brunei are required to register under Section 299 of the Companies Act.
Regulatory Updates
The new General Insurance and Takaful Agent Handbook (GAH) was introduced by the Monetary Authority of Brunei Darussalam (MABD) and Brunei Insurance and Takaful Association (BITA) with effect from 1 July 2014. A period of grace of six months was given to agents to implement the new guidelines, which have been in effect from 1 January 2015.
Industry Aggregate Premium 2009 to 2013
Aon Benfield Outlook
The potential for any significant growth in Brunei remains low due to a small economy, a heavy dependency on finite oil and gas reserves, and a small number of insurers in the market. In addition, the Monetary Authority of Brunei Darussalam (AMDB) has introduced new loan requirements including a loan cap aimed at reducing the debt burden among Bruneians. Motor is the main class of business but the outlook in the personal lines sector remains limited. Apart from the compulsory purchase of motor insurance, there is no culture of buying insurance in Brunei.
Demand is driven by bank lending requirements and culture of state welfare and religious concerns have affected the development of the industry. The contingency fee act remains to be an issue which has increased the number of motor third party bodily injury claims going to court, many of which are grossly inflated.
30
40
50
60
70
80
2009 2010 2011 2012 2013
Total Premiums BND million Total Premiums USD million
GDP – PPP (USD bn)
32.9
GDP Per Capita – PPP (USD)
78,475.6
Population (mn)
0.4
5yr Real GDP Growth (%)
1.4
Unemployment Rate (%)
2.7
Inflation Rate (%)
0.0
Entity USD mn BDN mn
Market share
%
National Insurance Co. BHD 20.3 25.5 35.0
Audley Insurance Co. SDN BHD 15.1 18.9 26.0
Standard Insurance SDN BHD 8.9 11.2 15.4
Tokio Marine Insurance
Singapore Ltd. 6.1 7.6 10.5
MBA Insurance Co. SDN BHD 4.4 5.5 7.6
Top 5 Insurers
Industry Premiums Split by Lines of Business
*Growth % is based on premiums in local currency Excludes PA & Healthcare premiums Statistics refer to conventional non-life business and do not include the Takaful business or companies 2014 statistics were not published by the regulator when preparing this report Break-up by line of business reflects written premiums within this market sector
Lines of
business USD mn BND mn
Paid
claims
BND mn
Loss
ratio
%
Comb
ratio
%
*Y/Y
growth
%
Property 9.5 11.9 7.7 64.9 105.7 -0.1
Construction
& Engineering 2.4 3.0 0.1 3.2 8.5 1234.5
Motor 11.2 14.1 4.2 29.5 48.4 15.4
Workers Comp 8.9 11.1 2.8 24.8 65.5 15.3
Liability 6.0 7.6 0.5 7.2 14.5 157.8
Surety, bonds
& credit 0.3 0.4 -0.0 -7.3 3.6 -9.4
Miscellaneous 14.0 17.6 1.0 5.8 16.6 -12.3
MAT 5.7 7.1 0.9 12.6 21.1 -15.9
Industry-wide
Non-Life 58.1 72.7 17.1 23.6 44.6 10.5
2013 GWP
2013 GWP
Political Risk
Terror Risk
World Bank relative ease of doing business
Low High
Easiest Hardest
Data Source: IMF, AXCO, SNL, S&P, Fitch, Moody’s, A.M. Best, the General Insurance Association of Brunei Darussalam, Aon, and Aon Benfield.
2013 Insurance Penetration - Non-life and PA & Healthcare (excl. Takaful) GWP vs. GDP
Brunei Prem: GDP = 0.4%; APAC Prem: GDP = 1.5%
Excludes PA & Healthcare Premiums Statistics refer to conventional non-life business and do not include the Takaful business or companies 2014 statistics were not published by the regulator when preparing this report Ranking based on total premiums written by an insurer within this market sector
(2015 est.)

12 13
ChinaThe Great Wall of China

14 15
Top 5 Insurers
Entity USD mn CNY mn
Market
share %
Loss
ratio %
Comb
ratio %
PICC Property & Casualty
Co. Ltd. 41,087.6 252,419.2 33.5 64.5 95.6
Ping An Property & Casualty
Insurance Co. Ltd. 23,253.7 142,857.3 18.9 57.6 90.6
China Pacific Property
Insurance Co. Ltd. 15,111.6 92,837.3 12.3 68.1 101.2
China Life Property & Casualty
Ins. Co. Ltd. 6,575.7 40,397.4 5.4 61.6 97.3
China United Property
Insurance Co. Ltd. 5,675.2 34,865.2 4.6 61.6 94.0
2014 GWP
Industry Premiums Split by Lines of Business
Lines of
business USD mn CNY mn
Paid claims
CNY mn
Loss
ratio %
*Y/Y
growth %
Property 11,629.6 72,054.0 42,367.4 58.8 15.5
Construction
& Engineering 1,264.0 7,831.6 3,123.6 39.9 24.5
Motor 76,294.6 472,702.8 272,080.4 57.6 17.9
Liability 3,470.5 21,502.1 8,914.8 41.5 18.9
Surety, bonds
& credit 4,384.4 27,164.8 8,515.6 31.4 8.6
Miscellaneous 200.5 1,242.0 817.9 65.9 11.0
MAT 3,106.1 19,244.7 8,872.4 46.1 1.0
Industry-wide
Non-Life 100,349.6 621,742.0 344,692.0 55.4 16.7
PA & Health 4,257.4 26,378.0 11,758.5 44.6 31.5
Grand Total 104,607.1 648,120.0 356,450.5 55.0 17.2
2013 GWP
*Growth % is based on premiums in local currencyBreak-up by line of business reflects premiums written within this market sector 2014 statistics were not published by the regulator when preparing this report
China
Credit Rating and Outlook
Rating Outlook
S&P AA- Stable
Fitch A+ Stable
Moody's Aa3 Stable
AM Best CRT-3
Capital Requirements
Minimum capital required is 200mn CNY and 20mn CNY increment for each new provincial branch, with total capital capped at 500mn CNY. Insurers should keep solvency ratio (actual capital divided by minimum capital) no lower than 100%. Actual capital is insurer’s admitted assets minus admitted liabilities. Minimum capital is the greater of 18% premium last year up to 100mn CNY plus 16% premium last year excess of 100mn CNY (no ceded reinsurance and business tax), or 26% average incurred claims last 3 year up to 70mn CNY plus 23% average incurred claims last 3 year excess of 70mn CNY (no reinsurance recoveries).
Foreign Ownership
If 25% or more of a Chinese insurance company’s shares are held by foreign entities, the firm is considered foreign funded and regulated by the Regulations on the Administration of Foreign-Invested Insurance Companies. Otherwise it is deemed to be domestic. To be eligible for a branch, joint venture, or subsidiary license, foreign insurers must has been in business for over 30 years, set representative office in mainland China for at least 2 years, and has total assets of at least 5bn USD.
Regulatory Updates
China Insurance Regulatory Commission (CIRC) published the final version of China Risk Oriented Solvency System (C-ROSS) in February 2015. The industry is in the transition toward C-ROSS with the formal implementation expected to be in 2016. For non-life insurers, the average solvency ratio under C-ROSS was 282.0% for 1Q 2015 and 286.3% for 2Q 2015.
In March 2015, CIRC formally issued the Notice on Implementing Reinsurance Registration System. Beginning 1 January 2016, all reinsurers (including primary insurers writing inward business) and reinsurance brokers must register on the platform built and maintained by CIRC. Cedants must select reinsurance counterparties from those valid in the registration system. Treaty reinsurers must have secure rating (“A-“ or above for leaders and “BBB” or above for followers). Certain exemptions may apply. In April 2015, China’s Residential EQ Pool was established in Beijing. In June 2015, motor de-tariff began in six provinces/cities. In August 2015, CIRC kicked off the pilot residential earthquake scheme in Da’li prefecture of Yunnan province. In October 2015, the State Council proposed to amend the Insurance Law. The current clause that “a P&C insurer’s net premium cannot exceed 4X its capital” will be removed.
Industry Aggregate Premium 2010 to 2014
Aon Benfield Outlook
The China insurance and reinsurance market potential remains high given low insurance penetration, continued economy growth, and clearly stated government desire for market growth and product diversity. Significant growth has been achieved in recent years in non-life sector such as Agriculture, Liability, and Credit – mostly due to government incentives and guidance. Personal lines continue to be untapped, except Motor. CIRC recently launched a liberalization of motor tariff for selected regions in China, aiming to expand nationwide shortly. Immediate impacts on the market have mainly been centered on reduced written premium with stable loss ratios. As motor contributes more than 70% GWP, the industry will continue to monitor developments closely. Specialty lines performed better than Property and Engineering which continues to be very competitive. The impact of C-ROSS to date has been limited to specific cedants and placements. However, C-ROSS marks a significant change in how regulatory capital is quantified in China and may result in significant changes in the local market in the future. Discussions regarding the upcoming January 1 renewals have centered around the impact of CROSS on signings for offshore reinsurers and the impact of the Tianjin Port Explosion on renewal terms and conditions. Early expectations are for onshore reinsurers to continue enjoying more favourable signings on placements. This trend will likely be accelerated due to the rapid increase in the number of Llyod’s Syndicates writing business via the Chinese Platform. Aon Benfield remains confident however that offshore reinsurers will still play an important role in the market. In the absence of clarity on loss positions for 2015, predictions on renewal conditions remain subject to significant uncertainty. Early expectations are for a moderate impact on renewal terms for the market given favourable loss activity in recent years and the continued strong interest in China from a strategic long term perspective. Corrections on the worst affected programs may be more significant however.
Major Risks
Catastrophe Risk
China is one of the most exposed countries to natural catastrophe perils. Earthquake risk of insurers portfolio is mainly driven by growing exposures in and around the capital of Beijing. Tropical Cyclone exposures are driven by accumulations along the Eastern Coast from Shanghai to Guangdong, which are the manufacturing and trading centers of China. Catastrophe risk continues to be a focus of the Regulator and Industry. Catastrophe risk insurance is still in an embryonic stage. Pilot catastrophe schemes have been launched in Shenzhen, Yunnan and Ningbo, Zhejiang province.
However, at the country level, catastrophe insurance for residential risk is still not in place. Data and modelling continue to improve for these two major perils.
Regulatory Risk
Regulators have introduced many new regulations. The most important ones are China Risk Oriented System (C-ROSS), motor de-tariff pilot programs in six regions, the Agriculture Reinsurance Pool, the Reinsurance Registration System, and amendment of the China Insurance Law. These new regulations may have many implications, e.g. changing the cedant’s retention level, increasing demand of non-proportional reinsurance, pushing reinsurers to get (better) international rating, etc.
Financial Risk
GDP growth rate is slowing down in light of the government’s intention to bring structural changes to the economy. Reform of the financial sector, particularly regulating the “shadow banks”, is increasingly attracting more attention and debate.
40,000
60,000
80,000
100,000
120,000
140,000
350,000
450,000
550,000
650,000
750,000
850,000
2010 2011 2012 2013 2014
Total Premiums CNY million Total Premiums USD million
GDP – PPP (USD bn)
19,510.0
GDP Per Capita – PPP (USD)
14,189.50
Population (mn)
1,375.0
5yr Real GDP Growth (%)
9.6
Unemployment Rate (%)
4.1
Inflation Rate (%)
1.5
Political Risk
Terror Risk
World Bank relative ease of doing business
Low High
Easiest Hardest
Data Source: IMF, SNL, S&P, Fitch, Moody’s, A.M. Best, China Insurance Regulatory Comission, Aon, and Aon Benfield.
2014 Insurance Penetration - Non-life and PA & Healthcare GWP vs. GDP
China Prem: GDP = 1.2%; APAC Prem: GDP = 1.5%
Includes Non-Life + PA & Healthcare premiums Ranking based on total premiums written by an insurer within this market sector
(2015 est.)

16 17
Hong KongSkyline of Hong Kong

18 19
Top 5 Insurers
Entity
USD
mn
HKD
mn
Market
share %
Net
claims
incurred
Underwriting
profit / (Loss)
*Y/Y
growth
%
AXA General 470.8 3,650.9 8.4 1,840.46 187.32 4.3
Zurich Insurance 342.7 2,657.0 6.1 603.75 71.21 1.6
Bupa 303.3 2,351.7 5.4 1,390.86 92.65 12.3
China Taiping (HK) 263.6 2,043.6 4.7 779.30 46.92 14.7
BOC Group Ins. 237.6 1,842.6 4.2 1,041.23 63.46 3.3
2014 GWP
Industry Premiums Split by Lines of Business
Lines of
business USD mn HKD mn
Inc. claims
HKD mn
Loss
ratio %
**Comb
ratio %
*Y/Y
growth %
Motor 624.5 4,842.1 2,296.4 58.0 90.9 6.5
Aircraft 2.1 16.1 8.5 119.7 132.8 -27.1
Ships 260.6 2,020.5 835.7 64.7 82.6 7.7
Goods in Transit 221.9 1,720.5 378.3 43.2 59.4 23.9
Property 1,155.5 8,959.9 1,168.6 29.9 49.0 -0.2
General Liability 1,429.2 11,082.4 5,271.1 62.0 86.7 0.7
Pecuniary Loss 369.2 2,862.9 354.5 24.7 48.2 13.9
Non-Prop Treaty 26.2 202.8 91.8 47.8 58.3 12.1
Prop Treaty 51.6 400.3 190.0 50.5 86.8 -4.4
Industry-Wide
Non-Life 4,140.7 32,107.5 10,594.9 51.6 75.0 3.8
PA & Health 1,487.5 11,534.0 6,090.6 67.5 87.9 6.2
Grand Total 5,628.2 43,641.5 16,685.5 56.4 79.0 4.4
2014 GWP
*Growth % is based on premiums in local currency **Expense ratio computation includes “Net Commissions Payable/Receivable” & “Management Expenses” Break-up by line of business reflects total written premiums (domestic + overseas)
Hong Kong
Capital Requirements
Minimum paid-up capital requirements are 10mn HKD for a non-life company, 20mn HKD for a non-life company writing the statutory class of business, 20mn HKD for a compositive, and 2mn HKD for a captive. Insurance companies must submit a three or five-year plan when they apply for authorisation. The applicant and the regulator agree how much capital they will need based on the business plan. This is normally much higher than the statutory minimum.
An insurer shall maintain an excess of assets over liabilities of not less than a required solvency margin which is the greater of 1/5 of the relevant premium income up to 200mn HKD plus 1/10 of the amount by which the relevant premium income exceeds 200mn HKD, or 1/5 of the relevant claims outstanding up to 200mn HKD, plus 1/10 of the amount by which the relevant claims outstanding exceeds 200mn HKD, subject to the minimum paid-up capital requirements.
Foreign Ownership
There are no restrictions on foreign ownership. Foreign companies may acquire any percentage of the shares in an existing insurance company or establish branches or locally incorporated subsidiaries.
Any person who intends to acquire control of 15% or more of the voting power of a locally incorporated insurer must seek the regulator’s approval before making the acquisition.
Regulatory Updates
The Insurance Authority (IA) conducted a three-month consultation exercise from September to December 2014 to solicit views on the proposed Risk-based Capital (RBC) framework for Hong Kong. In September 2015, IA issued the consultation conclusions. There is general support from the insurance industry for the move towards a risk-sensitive capital framework and the enhancement of risk management. There is general agreement on the high level principles of the conceptual framework, although there are mixed views on some of the technical aspects. IA decided to proceed to the next phase which involves developing the detailed rules and carrying out the QIS. After that, another consultation exercise will be conducted.
Major Risks
Catastrophe Risk
Hong Kong is generally considered as low catastrophe-prone region with no proximity to earthquake fault line. Despite the frequent visit of typhoon, Hong Kong is saved from major losses as a result of strict regulations on building code. Owing to much increase in property value (insured value) as well as the extreme high concentration of risks, we can never underestimate potential major losses arising from those “un-modelled” perils such as landslide, terrorism and other man-made hazards. Insurance coverage for catastrophe perils in Hong Kong is almost free for the time being, something, that needs immediate attention.
Underwriting Risk
There is fierce competition among insurers on all lines particularly for those premium-rich classes such as EC/EL and Motor and unfortunately, there is no sign of possible rebound in the near future.
Market Risk
Hong Kong by all means is closely adhering to the Chinese economy in various arenas – investment, tourism, import/export, etc. Slowing down of the Chinese economy is to drive weaker demand on insurance particular for SME sector and therefore profound impact onto Hong Kong insurance industry.
Industry Aggregate Premium 2010 to 2014
Credit Rating and Outlook
Rating Outlook
S&P AAA Stable
Fitch AA+ Stable
Moody's Aa1 Stable
AM Best CRT-2
Aon Benfield Outlook
Hong Kong insurance industry will also embrace the implementation of Risk-Based Capital regulatory framework in a matter of few years’ time. And insurers would have to prepare for the potential impact arising hereunder: 1) potentially to trigger a wave of consolidation and to drive smaller carriers out of business; 2) more holistic/stringent approach on risk management and capital requirement by direct insurers and reinsurers operating in Hong Kong; 3) Additional burden onto insurers in regard to the compliance of myriad of risks – underwriting risk, credit risk, market risk, operational risk, liquidity risk, counter-party risk plus other non-quantifiable risks.
Voluntary Health Insurance Scheme (VHIS): Hong Kong Government is proposing an alternative to those who are able and willing to use private healthcare services through the collaboration with local insurance industry by providing insurance to general public, with potential key challenges to medical insurance carriers including: 1) Guaranteed renewal for life; 2) Covering pre-existing conditions subject to a waiting period; 3) Accepting high-risk groups through a high-risk pool; 4) Standardization of policy terms/conditions. Medical insurance is an important sector in the Hong Kong insurance industry – for 2014, it captured 20.4% of overall premium income to the non-life market. Yet operating margin was under severe pressure due to escalating insurance payment and ended up being 4%. Challenges emanating from VHIS are to pose major uncertainty onto Hong Kong medical insurance carriers.
GDP – PPP (USD bn)
414.5
GDP Per Capita – PPP (USD)
56,689.1
Population (mn)
7.3
5yr Real GDP Growth (%)
4.6
Unemployment Rate (%)
3.2
Inflation Rate (%)
2.9
Political Risk
Terror Risk
World Bank relative ease of doing business
Low High
Easiest Hardest
Data Source: IMF, SNL, S&P, Fitch, Moody’s, A.M. Best, Office of the Comissioner of Insurance, Aon, and Aon Benfield.
3,500
4,500
5,500
6,500
30,000
35,000
40,000
45,000
2010 2011 2012 2013 2014
Total Premiums HKD million Total Premiums USD million
2014 Insurance Penetration - Non-life and PA & Healthcare GWP vs. GDP
Hong Kong Prem: GDP = 1.9%; APAC Prem: GDP = 1.5%
*Growth % is based on premiums in local currencyIncludes Non-life + PA & Healthcare premiumsRanking based on total premiums written by an insurer (domestic + overseas)
(2015 est.)

20 21
IndiaTaj Mahal in Agra, Uttar Pradesh
22 23
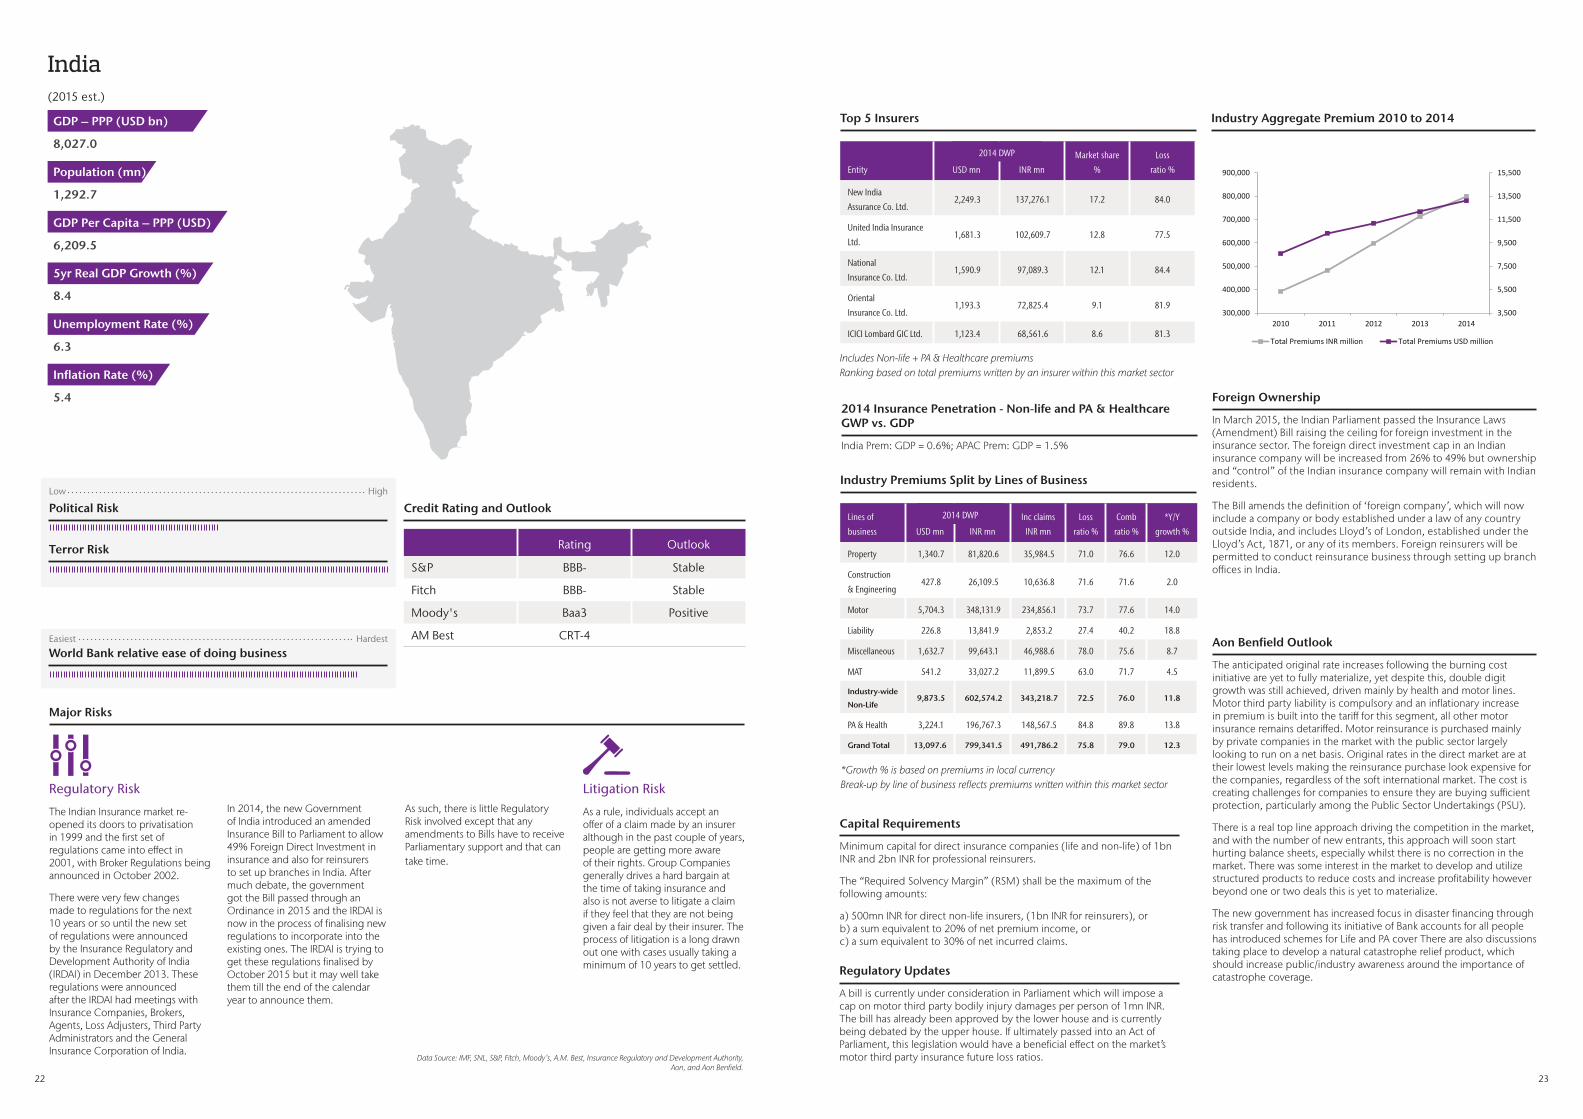
India
Capital Requirements
Minimum capital for direct insurance companies (life and non-life) of 1bn INR and 2bn INR for professional reinsurers.
The “Required Solvency Margin” (RSM) shall be the maximum of the following amounts:
a) 500mn INR for direct non-life insurers, (1bn INR for reinsurers), or b) a sum equivalent to 20% of net premium income, or c) a sum equivalent to 30% of net incurred claims.
Foreign Ownership
In March 2015, the Indian Parliament passed the Insurance Laws (Amendment) Bill raising the ceiling for foreign investment in the insurance sector. The foreign direct investment cap in an Indian insurance company will be increased from 26% to 49% but ownership and “control” of the Indian insurance company will remain with Indian residents.
The Bill amends the definition of ‘foreign company’, which will now include a company or body established under a law of any country outside India, and includes Lloyd’s of London, established under the Lloyd’s Act, 1871, or any of its members. Foreign reinsurers will be permitted to conduct reinsurance business through setting up branch offices in India.
Regulatory Updates
A bill is currently under consideration in Parliament which will impose a cap on motor third party bodily injury damages per person of 1mn INR. The bill has already been approved by the lower house and is currently being debated by the upper house. If ultimately passed into an Act of Parliament, this legislation would have a beneficial effect on the market’s motor third party insurance future loss ratios.
Major Risks
Regulatory Risk
The Indian Insurance market re-opened its doors to privatisation in 1999 and the first set of regulations came into effect in 2001, with Broker Regulations being announced in October 2002.
There were very few changes made to regulations for the next 10 years or so until the new set of regulations were announced by the Insurance Regulatory and Development Authority of India (IRDAI) in December 2013. These regulations were announced after the IRDAI had meetings with Insurance Companies, Brokers, Agents, Loss Adjusters, Third Party Administrators and the General Insurance Corporation of India.
In 2014, the new Government of India introduced an amended Insurance Bill to Parliament to allow 49% Foreign Direct Investment in insurance and also for reinsurers to set up branches in India. After much debate, the government got the Bill passed through an Ordinance in 2015 and the IRDAI is now in the process of finalising new regulations to incorporate into the existing ones. The IRDAI is trying to get these regulations finalised by October 2015 but it may well take them till the end of the calendar year to announce them.
As such, there is little Regulatory Risk involved except that any amendments to Bills have to receive Parliamentary support and that can take time.
Litigation Risk
As a rule, individuals accept an offer of a claim made by an insurer although in the past couple of years, people are getting more aware of their rights. Group Companies generally drives a hard bargain at the time of taking insurance and also is not averse to litigate a claim if they feel that they are not being given a fair deal by their insurer. The process of litigation is a long drawn out one with cases usually taking a minimum of 10 years to get settled.
Industry Aggregate Premium 2010 to 2014
Credit Rating and Outlook
Rating Outlook
S&P BBB- Stable
Fitch BBB- Stable
Moody's Baa3 Positive
AM Best CRT-4 Aon Benfield Outlook
The anticipated original rate increases following the burning cost initiative are yet to fully materialize, yet despite this, double digit growth was still achieved, driven mainly by health and motor lines. Motor third party liability is compulsory and an inflationary increase in premium is built into the tariff for this segment, all other motor insurance remains detariffed. Motor reinsurance is purchased mainly by private companies in the market with the public sector largely looking to run on a net basis. Original rates in the direct market are at their lowest levels making the reinsurance purchase look expensive for the companies, regardless of the soft international market. The cost is creating challenges for companies to ensure they are buying sufficient protection, particularly among the Public Sector Undertakings (PSU).
There is a real top line approach driving the competition in the market, and with the number of new entrants, this approach will soon start hurting balance sheets, especially whilst there is no correction in the market. There was some interest in the market to develop and utilize structured products to reduce costs and increase profitability however beyond one or two deals this is yet to materialize.
The new government has increased focus in disaster financing through risk transfer and following its initiative of Bank accounts for all people has introduced schemes for Life and PA cover There are also discussions taking place to develop a natural catastrophe relief product, which should increase public/industry awareness around the importance of catastrophe coverage.
3,500
5,500
7,500
9,500
11,500
13,500
15,500
300,000
400,000
500,000
600,000
700,000
800,000
900,000
2010 2011 2012 2013 2014
Total Premiums INR million Total Premiums USD million
Top 5 Insurers
Entity USD mn INR mn
Market share
%
Loss
ratio %
New India
Assurance Co. Ltd. 2,249.3 137,276.1 17.2 84.0
United India Insurance
Ltd. 1,681.3 102,609.7 12.8 77.5
National
Insurance Co. Ltd. 1,590.9 97,089.3 12.1 84.4
Oriental
Insurance Co. Ltd. 1,193.3 72,825.4 9.1 81.9
ICICI Lombard GIC Ltd. 1,123.4 68,561.6 8.6 81.3
2014 DWP
Industry Premiums Split by Lines of Business
Lines of
business USD mn INR mn
Inc claims
INR mn
Loss
ratio %
Comb
ratio %
*Y/Y
growth %
Property 1,340.7 81,820.6 35,984.5 71.0 76.6 12.0
Construction
& Engineering 427.8 26,109.5 10,636.8 71.6 71.6 2.0
Motor 5,704.3 348,131.9 234,856.1 73.7 77.6 14.0
Liability 226.8 13,841.9 2,853.2 27.4 40.2 18.8
Miscellaneous 1,632.7 99,643.1 46,988.6 78.0 75.6 8.7
MAT 541.2 33,027.2 11,899.5 63.0 71.7 4.5
Industry-wide
Non-Life 9,873.5 602,574.2 343,218.7 72.5 76.0 11.8
PA & Health 3,224.1 196,767.3 148,567.5 84.8 89.8 13.8
Grand Total 13,097.6 799,341.5 491,786.2 75.8 79.0 12.3
2014 DWP
*Growth % is based on premiums in local currency Break-up by line of business reflects premiums written within this market sector
GDP – PPP (USD bn)
8,027.0
GDP Per Capita – PPP (USD)
6,209.5
Population (mn)
1,292.7
5yr Real GDP Growth (%)
8.4
Unemployment Rate (%)
6.3
Inflation Rate (%)
5.4
Political Risk
Terror Risk
World Bank relative ease of doing business
Low High
Easiest Hardest
Data Source: IMF, SNL, S&P, Fitch, Moody’s, A.M. Best, Insurance Regulatory and Development Authority, Aon, and Aon Benfield.
2014 Insurance Penetration - Non-life and PA & Healthcare GWP vs. GDP
India Prem: GDP = 0.6%; APAC Prem: GDP = 1.5%
Includes Non-life + PA & Healthcare premiums Ranking based on total premiums written by an insurer within this market sector
(2015 est.)

24 25
IndonesiaBorobudur Temple in Yogyakarta, Java

26 27
Indonesia
Capital Requirements
Insurance companies’ minimum capital has to increase to 100bn IDR in 2014. The requirements for reinsurance companies are 200bn IDR in 2014. Both insurers and reinsurers are required to maintain a minimum guarantee funds as policyholder protection in the event of bankruptcy. The requirement is the greater of 20% of paid-up capital or equity benchmark and 1% of net premium plus 0.25% of reinsurance premium.
Foreign Ownership
Foreign ownership in joint ventures are capped at 80%. This level is flexible, however, provided that the Indonesian partner’s aggregated paid-up capital is maintained. Then, the foreign insurer can increase its stake beyond 80%. This is a much higher level than in other countries in the region. Foreign ownership is still lower due to the highly competitive nature of the market.
Regulatory Updates
In October 2015, President Joko Widodo signed a presidential regulation on the formation of PT Reasuransi Indonesia Utama, also known as Indonesia Re. The company is formed through the merger of state-owned PT Asei Reasuransi Indonesia (Persero) and PT Reasuransi Umum Indonesia (Persero). The establishment of Indonesia Re is aimed at creating a large-scale national reinsurance company that can help promote domestic retention.
In September 2015, OJK mentioned that it would temporarily lower insurers’ required solvency margin as part of a stimulus policy package to help local insurance industry weather the impact of volatile currency and capital market by relaxing some criteria for computation of insurers’ risk-based capital requirement, including the evaluation of securities investments, particularly those companies that suffered investment losses as a result of weakening local financial conditions. Overall, the OJK said it will allow insurance companies to meet only 50% of the minimum capital requirement, instead of 100%, until such time the markets have recovered. The new measures are applicable to conventional insurers and reinsurers and Shariah insurance and reinsurance companies.
Major Risks
Catastrophe Risk
Volcanic Eruption and Flood remain the dominant catastrophe risk factors in Indonesia. In 2015 alone, Indonesia experienced eruption of Mt. Sinabung, Mt. Raung and Mt. Gamalama, although for the last two incidents, the social & economic losses are not significant. Floods, in many cities in Indonesia are considered a man-made loss due to poor maintenance of water ways infrastructure.
Regulatory Risk
With enforced regulation systems by OJK, the business operation of insurance & reinsurance companies in Indonesia can be considered improved than in the past. The implementation of Enterprise Risk Management for insurance & reinsurance companies also monitored by OJK with special supervision for the Board of Directors. Failure to maintain level of reporting or implementing risk management could be resulted in penalty not only for the company but also to the Directors.
Financial Risk
The current exchange rate between Indonesia Rupiah (IDR) and United States Dollar (USD) has wider impact in insurance & reinsurance transactions as most of commercial policies in Indonesia are using USD. The Central Bank of Indonesia (Bank Indonesia) this year issued law that minimized transaction in USD and to use IDR as the main currency. Specific for insurance & reinsurance business, OJK has discretion but encourages industry to maximise the use of IDR in making the payment, moreover in direct side.
Litigation Risk
The Indonesia government put special effort to strengthening the litigation system especially in financial sector. The impact of KPK has been significantly changed the way people or industry doing transactions with more clarity on business procedure and optimising electronic or online system for tender, procurement including taxation. If this mechanism has been fully adopted by all industry, the business process would be more productive, transparent and time effective. The litigation risk at this stage can be considered lower than in the past.
Industry Aggregate Premium 2009 to 2013
Credit Rating and Outlook
Rating Outlook
S&P BB+ Positive
Fitch BBB- Stable
Moody's Baa3 Stable
AM Best CRT-4
Aon Benfield Outlook
The insurance market in Indonesia is growing through the increase in the number of automobiles and scooters, micro financing schemes, large scale commercial projects, and infrastructure development. The impact on reinsurance is largely around Commercial lines, specifically the development of infrastructure and public utilities. The new government has assigned the infrastructure and public utilities sector as a key area of focus, after a lack of any significant investment for decades. Insurance rates have been growing to optimum levels since early 2014 with the introduction of the motor tariff which is expected to be maintained for at least the next three years. However it is expected that earthquake and flood rates are likely to be reviewed and changed in the near future due to the recent losses on these programs.
There is over-supply in the reinsurance market as reinsurers look to support the local cedants and benefit from the growth in premiums from the new tariff. Main themes in the market are around consolidation with reinsurers looking to increase scale and establish more flag positions and multinationals looking to set-up joint ventures on the direct side. How the OJK-proposed regulatory change is to impact the reinsurance industry is to be observed.
There is an increased emphasis on developing mobile technology as a distribution for retail products.
Top 5 Insurers
Entity USD mn IDR mn
Market
share %
Loss
ratio %
Comb
ratio %
*Y/Y
growth %
Asuransi Astra
Buana 361.3 3,779,889.0 8.7 49.2 85.1 26.3
Asuransi Sinar
Mas 341.1 3,568,439.0 8.2 60.2 96.9 3.6
Asuransi Jasa
Indonesia 269.7 2,821,370.0 6.5 51.2 71.5 -1.6
Asuransi Central
Asia 220.4 2,305,945.0 5.3 76.0 103.7 14.5
PT. Tugu Pratama
Indonesia 198.4 2,075,843.0 4.8 43.4 70.2 38.3
2013 DWP
Industry Premiums Split by Lines of Business
Lines of
business USD mn IDR mn
Inc claims IDR
mn
Loss
ratio %
*Y/Y
growth %
Property 1,040.4 10,883,507.0 4,759,477.0 56.9 16.8
Construction &
Engineering 132.8 1,388,778.0 675,218.0 59.8 19.9
Motor 1,235.5 12,924,531.0 6,390,310.0 64.9 15.1
Liability 84.2 881,234.0 79,043.0 10.7 34.8
Surety, Bonds &
Credit 300.8 3,146,440.0 967,768.0 50.8 108.0
Miscellaneous 227.0 2,375,072.0 787,885.0 49.8 -1.1
Marine, Aviation
& Transit 608.5 6,365,945.0 380,110,058.0 N/A 12.1
Industry-Wide
Non-Life 3,629.2 37,965,507.0 393,769,759.0 58.0 18.8
Personal
Accident &
Healthcare
503.8 5,270,155.0 3,264,813.0 74.8 14.4
Grand Total 4,132.9 43,235,662.0 397,034,572.0 N/A 18.3
2013 DWP
*Growth % is based on premiums in local currency 2013 information is updated based on the revised numbers now available 2014 statistics were not published by the regulator when preparing this reportBreak-up by line of business reflects premiums written within this market sector
GDP – PPP (USD bn)
2,838.6
GDP Per Capita – PPP (USD)
11,111.8
Population (mn)
255.5
5yr Real GDP Growth (%)
7.2
Unemployment Rate (%)
5.8
Inflation Rate (%)
6.8
Political Risk
Terror Risk
World Bank relative ease of doing business
Low High
Easiest Hardest
Data Source: IMF, SNL, S&P, Fitch, Moody’s, A.M. Best, Otoritas Jasa Keuangan, Aon, and Aon Benfield.
2,000
2,500
3,000
3,500
4,000
4,500
20,000,000
25,000,000
30,000,000
35,000,000
40,000,000
45,000,000
2009 2010 2011 2012 2013
Total Premiums IDR million Total Premiums USD million
2013 Insurance Penetration - Non-life GWP vs. GDP
Indonesia Prem: GDP = 0.3%; APAC Prem: GDP = 1.5%
*Growth % is based on premiums in local currencyIncludes Non-life + PA & Healthcare premiumsRanking based on total premiums written by an insurer within this market sector2013 information is updated based on the revised numbers now available2014 statistics were not published by the regulator when preparing this report
(2015 est.)

28 29
JapanMount Fuji

30 31
Industry Premiums Split by Lines of Business
Lines of
business USD mn JPY mn
Inc claims
JPY mn
Loss ratio
%
*Y/Y
growth %
Property 13,461.1 1,426,141.0 744,307.0 52.2 0.5
Construction
& Engineering 796.1 84,347.0 41,029.0 48.6 9.2
Motor 46,182.9 4,892,843.0 2,910,732.0 59.5 1.2
Workers Comp 531.7 56,330.0 19,299.0 34.3 -45.3
Liability 4,938.6 523,217.0 236,775.0 45.3 -5.5
Surety, bonds,
& credit 401.1 42,493.0 10,478.0 24.7 -7.5
Miscellaneous 7,395.6 783,525.0 200,964.0 25.6 3.0
MAT 2,877.5 304,854.0 145,218.0 47.6 -1.5
Industry-Wide
Non-Life 76,584.6 8,113,750.0 4,308,802.0 53.1 0.1
PA & Health 6,680.9 707,807.0 354,200.0 50.0 -7.9
Grand Total 83,265.4 8,821,557.0 4,663,002.0 52.9 -0.1
2014 DWP
*Growth % is based on premiums in local currencyBreak-up by line of business reflects direct net premiums written (net ofcancellations) within this market sector
Japan
Capital Requirements
The minimum capital requirement for both the stock insurance company and the mutual insurance association is 1bn JPY.
Foreign branches are required to deposit normally minimum 200mn JPY in cash or securities and must hold assets in Japan in equivalence to the total of their underwriting reserves and outstanding loss reserves.
Foreign Ownership
Foreign companies are allowed to establish wholly owned subsidiaries or branches in Japan or to acquire any percentage of a Japanese company’s equity.
Regulatory Updates
In June 2015 the Japan Financial Services Agency (JFSA) disclosed the results of the second field tests which covered all insurance companies with the aim of introducing economic value-based solvency regime. JFSA summarizes the direction of future examinations as follows:
1. A variety of issues and challenges were recognized in the field tests, as in the previous tests. Based on the results, JFSA needs to conduct further examination toward establishing a specific framework.
2. There are ongoing movements in the economic value-based solvency regime and accounting system, such as the IAIS’s ICS field tests, Solvency II in Europe and examination of IFRS 4 “Insurance Contracts”. Under such circumstances, it is considered to be important to establish a regulatory framework suitable to Japan, paying attention to the nature of the Japanese insurance market.
3. Introducing the economic value-based solvency regime requires some revisions to the business management and risk management methods used by insurance companies. Therefore, the JFSA will make steady efforts to establish a new framework through dialogue with relevant parties in various situations, so as to ensure a smooth introduction.
Major Risks
Catastrophe Risk
Japan is exposed to multiple catastrophe risks including earthquake and weather related events which are a significant challenge to insureds and insurers alike. For insurers both frequency and severity must be carefully managed in accordance with heightened ERM governance requirements. Profitability is heavily dependent on frequency and severity of natural catastrophe losses in any given year.
Regulatory Risk
In March 2015, Japan FSA requested all the insurance companies to submit an ORSA report on an annual basis. The aim is to enhance and speed implementation of ERM within Japanese insurers. There are potential implications for how insurers view and therefore purchase reinsurance with an increased focus and accountability on decision-making for the reinsurance purchase.
Underwriting Risk
Revised fire base rates will be introduced in October 2015 reflecting recent loss experience due to weather related exposures (e.g. snow, freeze). On average the rates are increased by 3.5% although there is variation across the different rating zones depending on loss experience. As part of this base rate change, the maximum duration of the long-term dwelling policies will be capped at 10 years.
Market Risk
Japanese insurers typically hold a relatively high percentage of assets in equity. While this has led significant increases in financial strength over the past couple of years driven by the NIKKEI, it was also a major challenge during the Global Financial Crisis. Volatile financial market therefore remains a risk factor. A number of companies have active strategies to change the shift in their asset bases within their published mid-term plans.
Industry Aggregate Premium 2010 to 2014
Credit Rating and Outlook
Rating Outlook
S&P A+ Stable
Fitch A Stable
Moody's A1 Stable
AM Best CRT-2
Aon Benfield Outlook
With a challenging growth environment in Japan for a number of years the merger activity of the mega insurance groups looks almost complete on the domestic front. Once all the mega-mergers are completed in 2015 the three largest insurance groups will have a combined market share of over 90%, with concentration being close to 100% in certain specialist lines. Published mid-term plans point to further M&A activity outside of Japan as insurers look to reduce exposure to the Japanese equity market and use the proceeds to build on the successful strategy of M&A driven growth outside of Japan in both life and non-life lines of business.
Domestically, profitability has rebounded following the recent revision of Motor rates which has led to improved underwriting performance in the dominant Motor line of business. However, some concern remains over the impact of the consumption tax rate increase to 8% and how it will affect both claims and acquisition costs. Japan is exposed to multiple catastrophe risks include earthquake and weather related events. These remain a significant challenge to insured’s and insurers alike. Profitability of domestic insurance remains heavily dependent on frequency and severity of natural catastrophe losses in any given year.
Reinsurance rates have reduced towards the pre-Tohoku levels follow a combination of softening market conditions and in some cases payback being achieved from the events of 2011. Barring a significant shock the softening market looks set to continue.
40,000
50,000
60,000
70,000
80,000
90,000
100,000
110,000
7,600,000
7,800,000
8,000,000
8,200,000
8,400,000
8,600,000
8,800,000
9,000,000
2010 2011 2012 2013 2014
Total Premiums JPY million Total Premiums USD million
GDP – PPP (USD bn)
4,842.4
GDP Per Capita – PPP (USD)
38,210.6
Population (mn)
126.7
5yr Real GDP Growth (%)
2.3
Unemployment Rate (%)
3.5
Inflation Rate (%)
0.7
Top 5 Insurers
Entity USD mn JPY mn
Market
share %
Loss
ratio %
Comb
ratio %
Sompo Japan Insurance
+ NIPPONKOA Insurance 20,589.0 2,181,300.0 27.0 65.6 97.4
Tokio Marine & Nichido
Fire Insurance Co. Ltd. 19,225.0 2,036,790.0 25.2 61.3 91.5
Mitsui Sumitomo
Insurance Co. Ltd. 13,646.9 1,445,819.0 17.9 62.2 94.0
Aioi Nissay Dowa
Insurance Co. Ltd. 10,957.3 1,160,867.0 14.4 63.2 96.9
The Fuji Fire & Marine
Insurance Co. Ltd.2,632.5 278,898 3.5 54.8 92.4
2014 NWP
Political Risk
Terror Risk
World Bank relative ease of doing business
Low High
Easiest Hardest
Data Source: IMF, SNL, S&P, Fitch, Moody’s, A.M. Best, Financial Services Agency, Aon, and Aon Benfield.
2014 Insurance Penetration - Non-life and PA & Healthcare GWP vs. GDP
Japan Prem: GDP = 1.8%; APAC Prem: GDP = 1.5%
Includes Non-life + PA & Healthcare premiums Excludes Zenkyoren, that has a significant market share and other cooperative mutual insurers e.g., KyosaiRanking based on total premiums written by an insurer within this market sector
(2015 est.)

32 33
Korea (Republic of)Boats at Haeundae in Busan

34 35
Korea (Republic of)
Capital Requirements
Minimum capital requirements have been set by line of business.
For insurance companies, minimum capital requirements depend on the complexity of their business portfolio. The minimum capital for a mono-line insurer writing only engineering or title insurance is 5bn KRW. The minimum capital for a multiline insurer is the sum total of the capital requirements applicable to each of its authorized business lines, subject to a maximum of 30bn KRW. For application of a reinsurance license, the minimum capital is at 30bn KRW.
The RBC ratio is based on available capital divided by the required capital. The ratio which has to be maintained by all insurers is to be more than 100%.
Foreign Ownership
Foreign insurers are allowed to establish branches or wholly owned subsidiaries in Korea or to buy any percentage of a domestic company’s equity.
Foreign insurers must hold an investment grade rating from an international rating agency.
Regulatory Updates
FSS is moving towards a more evolved version of the RBC with strengthening of the confidence level of capital sufficiency for all risk factors from 95% to 99% and this is being implemented at different times for different risk factors.
Insurers will be required to prepare and implement an Own Risk and Solvency Assessment (ORSA) policy in 2017, based on 2016 financial data. ORSA guidelines, a manual to the guidelines and an FSS reporting template will be published towards the end of 2015.
Major Risks
Catastrophe Risk
Typhoon season in Korea is normally during summer which is May to September and looks like typhoon season is mostly over now. That means it will be another clean cat year and we will be able to expect modest rate deduction continuously.
Underwriting Risk
2015 has proved to be a challenging year for Korean risk programmes with sizeable property losses emanating from the Middle East and China in addition to Korean domestic risk losses. We expect certain pro-rata treaties to be adversely affected and reinsurers would be looking for improved terms and/or limiting the coverage of certain overseas property types.
Regulatory Risk
With regards to reinsurers’ visit to Korea, overseas Reinsurers’ visit to Korean clients in Korea has been proceeding smoothly through the past year. We strongly recommend Reinsurers to arrange their meetings through a registered broker for their meetings with Korean cedants. Being one of the top reinsurance brokers in Korea, Aon Benfield is ready to assist all reinsurers to arrange for clients’ meeting in Korea.
Industry Aggregate Premium 2010 to 2014
Credit Rating and Outlook
Rating Outlook
S&P AA- Stable
Fitch AA- Stable
Moody's Aa3 Positive
AM Best CRT-2
Aon Benfield Outlook
There are currently no major changes occurring in the Korean market as direct rates remain flat and stable. There is excess capacity in the market and despite high loss ratios, reinsurance rates have not seen much increases. Most primary companies are focussed on increasing their market share in long-term A&H policy, as the majority of their portfolio is driven by this class of business. A large proportion of the A&H portfolios are reinsured through quota share directly with Korean Re and very little Excess of Loss (XOL) coverage is purchased. The development of new products has focussed on increasing coverage as opposed to investment products due to the low interest rate environment. Alternative capital is beginning to gain some real traction, causing insurers to think about consolidation in order to increase scale and competitive advantage. KB Financial Group has recently signed a contract with LIG to take control of the controlling stake of LIG insurance, stating the need for diversification as the main driver for the investment.
Following a change in the Insurance Business Law, the common fiscal year-end for the insurance industry has been changed from 31 March to 31 December, effective from 2013. Most major reinsurance programme renewal dates have been changed to 1 January.
GDP – PPP (USD bn)
1,894.4
GDP Per Capita – PPP (USD)
36,528.4
Population (mn)
50.6
5yr Real GDP Growth (%)
4.6
Unemployment Rate (%)
3.7
Inflation Rate (%)
0.7
Industry Premiums Split by Lines of Business
Break-up by line of business reflects premiums written within this market sector
Top 5 Insurers
Entity USD mn KRW mn
Market
share %
Loss
ratio %
Comb
ratio %
Samsung Fire & Marine
Insurance Co. Ltd. 18,850.0 19,848,346.3 26.2 85.5 103.7
Hyundai Marine & Fire
Insurance Co. Ltd. 11,588.2 12,201,961.9 16.1 85.2 102.5
Dongbu Insurance
Co. Ltd 10,363.4 10,912,234.2 14.4 86.8 105.0
*KB Insurance Co. Ltd. 9,245.2 9,734,845.8 12.9 87.5 106.7
Meritz Fire & Marine
Insurance Co. Ltd. 4,904.9 5,164,677.2 6.8 84.9 106.6
2014 DWP
Political Risk
Terror Risk
World Bank relative ease of doing business
Low High
Easiest Hardest
Data Source: IMF, SNL, S&P, Fitch, Moody’s, A.M. Best, Financial Services Commission, Aon, and Aon Benfield.
40,000
45,000
50,000
55,000
60,000
65,000
70,000
75,000
45,000,000
50,000,000
55,000,000
60,000,000
65,000,000
70,000,000
75,000,000
80,000,000
2010 2011 2012 2013 2014
Total Premiums KRW million Total Premiums USD million
2014 Insurance Penetration - Non-life and PA & Healthcare GWP vs. GDP
Korea Prem: GDP = 5.1%; APAC Prem: GDP = 1.5%
Excluding PA & Healthcare premiumsA dip in 2013 industry premiums is a result of financial year-end change in Korea (nine-month period from 1 April to 31 December 2013)
Lines of
business USD mn KRW mn
Inc claims
KRW mn
Loss ratio
%
Property 1,681.8 1,770,822.5 855,646.5 49.3
Construction
& Engineering 291.5 306,925.9 96,507.1 30.8
Motor 12,301.0 12,952,448.6 10,347,520.7 82.5
Workers Comp 100.0 105,344.4 80,637.5 77.0
Liability 598.9 630,650.4 360,038.8 58.0
Surety, bonds, & credit 1,207.4 1,271,352.8 588,524.9 46.1
Miscellaneous 53,558.1 56,394,574.7 48,622,978.9 86.4
MAT 711.3 749,006.2 604,235.6 78.4
Industry-Wide Non-Life 70,450.0 74,181,125.5 61,556,090.0 83.6
PA & Health 1,400.6 1,474,824.7 1,134,223.9 77.3
Grand Total 71,850.7 75,655,950.2 62,690,313.9 83.5
2014 DWP
*KB Insurance Co. Ltd. was previously LIG Insurance Co. Ltd.Includes Non-life + PA & Healthcare premiumsRanking based on total premiums written by an insurer within this market sector
(2015 est.)

36 37
MalaysiaKuala Lumpur is the capital and the largest city of Malaysia

38 39
Malaysia
Capital Requirements
Minimum paid-up capital for insurers / reinsurers since 1996 and Takaful operators since 2004 is 100mn MYR. For a life or general insurer operating as a Labuan company, the requirements are at least 7.5mn MYR or its equivalent in any foreign currency in the company’s first year of operation. In subsequent years, the requirement is the greater of 7.5mn MYR and 20 percent of net premium income. For a reinsurer operating as a Labuan company, the requirement is at least 10mn MYR in the first year, and the greater of 10mn MYR and the sum of 20 percent non-life net premiums and 3 percent of actuarial valuation of life liabilities in subsequent years.
Foreign Ownership
Foreign investment of up to 70% is permitted in insurance companies and Takaful operators. On a case-by-case basis, 100% foreign equity for insurance companies can be considered. If a foreign company plans to enter negotiations for 5+% of a Malaysian conventional insurer / Takaful operator, it must receive consent and approvals from the central bank, Malaysian minister of finance, government of BNM as a director general of Takaful, and the Foreign Investment Committee for proposed acquisitions of 15+% voting rights or with valuation of 10m MYR. A foreign insurer who acquires 33+% of a conventional insurer / Takaful operator or holds 33-50% of the voting shares of conventional insurer / Takaful operator and acquires or plans to acquire 2+% of voting shares of the company, must extend an MGO for the remaining shares.
Since 2009, locally incorporated foreign-owned insurance companies / Takaful operators can establish branches without restriction throughout Malaysia as well as enter into bancassurance arrangements. Greater flexibility with regards to hiring expatriates has also been employed, which has contributed to industry development and local talent / training improvement.
Regulatory Updates
The Malaysian market is moving towards the abolition of all rating tariffs, which is now expected to happen from 3rd Quarter 2016 or 1 January 2017.
Major Risks
Underwriting Risk
Malaysia has been experiencing favourable claim experience in most lines, except for Motor. An insurance pool (MMIP) for high-risk drivers was created that equally shares premium and losses among all licensed general and Takaful operators, putting added pressure on insurers’ operating results.
Regulatory Risk
The impending market liberalization which is now slated for 3rd Quarter 2016 or 1st January 2017 is a cause for concern among carriers as the additional competition expected from new market entrants would lead to a softening market. The regulator’s drive for financial liberalisation and detariffication has put an increased focus on profitability and cost management.
Catastrophe Risk
In 2014, Malaysia experienced the worst flood in 30 years. However, all the major reinsurance brokers are able to model this flood risk probabilistically resulting in greater confidence in the adequacy of the catastrophe cover being purchased.
Industry Aggregate Premium 2010 to 2014
Credit Rating and Outlook
Rating Outlook
S&P A- Stable
Fitch A- Stable
Moody's A3 Positive
AM Best CRT-3
Aon Benfield Outlook
The general insurance industry grew at a slower pace for 1st half 2015. General Insurance Association of Malaysia (PIAM) attributed the lower growth rate to a challenging business and operating environment. Contributing factors include a cautious outlook and a moderation in consumer spending as a result of the heightened economic uncertainties coupled with the rising cost of living which mainly affected the motor class being the dominant line of business overall. The reinsurance market remains relatively stable with excess capacity in the market but there is uncertainty around the prospect of detariffication slated for mid-2016. Bank Negara will most definitely incorporate premium bands to prevent the risk of under-pricing. In addition, detariffication will be a partial and gradual one and there could be slight margin erosion, although the risk of severe erosion in the industry due to irrational competition is eliminated. Pricing adequacy, segmentation analysis, product innovation, capital efficiency and cost management are key differentiators with firms fighting to gain market share.
With the recent memories of Sabah earthquake and 2014 Flood (the worst flooding in more than 30 years), market participants are more concerned with the impact of a natural catastrophe resulting in an increased interest in structured reinsurance solutions. Actuarial services, talent development and localisation of management remain high on the agenda for insurance firms. Above all, they are cautiously optimistic that the general insurance industry growth rates will go back to normality as it has proven its resilience and robust nature over time.
2,500
3,000
3,500
4,000
4,500
5,000
5,500
12,000
13,000
14,000
15,000
16,000
17,000
18,000
2010 2011 2012 2013 2014
Total Premiums MYR million Total Premiums USD million
GDP – PPP (USD bn)
813.5
GDP Per Capita – PPP (USD)
26,141.1
Population (mn)
31.1
5yr Real GDP Growth (%)
7.0
Unemployment Rate (%)
3.0
Inflation Rate (%)
2.4
Industry Premiums Split by Lines of Business
Lines of
business USD mn MYR mn
Inc claims
MYR mn
Loss
ratio %
Comb
ratio %
*Y/Y
growth %
Property 902.6 2,954.3 436.9 28.8 53.8 5.8
Construction &
Engineering 205.6 672.8 75.1 44.6 58.9 4.4
Motor 2,423.7 7,932.4 5,035.0 71.5 102.3 5.4
Workers Comp 73.5 240.6 21.5 9.6 46.0 3.2
Liability 167.4 548.0 45.9 20.1 54.6 10.5
Surety, bonds,
& credit 15.6 51.1 2.6 9.9 35.1 -3.7
Miscellaneous 237.1 776.0 227.1 49.8 91.3 6.1
MAT 504.5 1,651.2 123.7 33.9 54.8 8.7
Industry-Wide
Non-Life 4,530.0 14,826.2 5,967.8 59.5 89.5 5.9
PA & Health 693.8 2,270.8 822.2 42.0 77.8 5.3
Grand Total 5,223.8 17,097.0 6,790.0 56.7 78.3 5.9
2014 GWP
*Growth % is based on premiums in local currency Non-life premiums exclude General Takaful businessBreak-up by line of business reflects premiums written within this market sector
Top 5 Insurers
Entity USD mn MYR mn
Market
share %
Loss
ratio %
Comb
ratio %
Allianz General
Insurance Co. (MY) Bhd 650.1 2,127.8 11.8 59.3 86.6
AmGeneral Insurance
Bhd 620.4 2,030.4 11.3 N/A N/A
MSIG Insurance (MY)
Bhd 454.2 1,486.4 8.3 56.0 75.6
Etiga Insurance Bhd 425.2 1,391.6 7.7 54.4 88.6
AXA Affin General
Insurance Bhd 346.7 1,134.7 6.3 60.4 79.7
2014 GWP
Political Risk
Terror Risk
World Bank relative ease of doing business
Low High
Easiest Hardest
Data Source: IMF, SNL, S&P, Fitch, Moody’s, A.M. Best, Bank Negara Malaysia, Aon, and Aon Benfield.
2014 Insurance Penetration - Non-life and PA & Healthcare GWP vs. GDP
Malaysia Prem: GDP = 1.6%; APAC Prem: GDP = 1.5%
Includes Non-Life + PA & Healthcare premiums Ranking based on total premiums written by an insurer within this market sector
(2015 est.)

40 41
New ZealandMitre Peak in Fiordland National Park, South Island

42 43
New Zealand
Capital Requirements
An insurer must at all times maintain actual solvency capital in excess of minimum solvency capital (MSC) to the extent laid down by the solvency standard. Actual solvency capital is the difference between capital (as defined) and deductions from capital (as defined). Solvency capital for a licensed foreign insurer in New Zealand is the excess of the branch’s assets over its liabilities. The minimum amount of the MSC is 1mn NZD for a captive and 3mn NZD for any other type of insurer.
An insurer’s MSC is the sum of the capital charges appropriate for its insurance risk, catastrophe risk, asset risk, and reinsurance recovery risk.
Foreign Ownership
Foreign companies may acquire any percentage of a domestic insurer’s equity or may establish wholly owned subsidiaries or branches, subject to prudential approval. Foreign companies which are allowed to operate as branches should obtain a credit rating from an international rating agency.
Regulatory Updates
In December 2014 the Reserve Bank issued a set of Insurance Solvency Standards. The new standards commence on 1 January 2015, except for certain provisions relating to reinsurance within the Solvency Standard for Life Insurance Business 2014. The standards are reissued mainly for updated treatment of guarantees and enhanced disclosure of solvency margin information.
Beginning 8 September 2015, in the RBC model, the catastrophe risk capital charge on earthquake losses is calibrated at 1 in 750 years for insurance losses from earthquake. This will change to 1 in 1000 years starting 8 September 2016.
Major Risks
Catastrophe Risk
Exposure to earthquake continues to dominate private insurers catastrophe protection, particularly with the high earthquake insurance penetration rate for commercial and domestic (excess EQC) risk and the major fault lines running through the central region of New Zealand.
Regulatory Risk
The New Zealand Government has proposed changes to the EQC Act which are aimed at improving the claims management experience for EQC claimants and ensuring continued access to affordable, effective natural disaster insurance. Key proposed changes are earthquake claims being lodged and to a degree managed by private insurers, changes to land coverage and the current monetary cap on EQC building cover doubled to 200,000 NZD (plus GST). Any change to the EQC Act is not expected to come into effect before 2017, but if implemented in the current form may lead to EQC assuming a larger part of the exposure and therefore premium of the domestic natural perils market.
Underwriting Risk
While the number of outstanding Christchurch earthquake claims is decreasing, claims movement due to delayed settlements and increasing claims costs above current reserves will increase earnings risk for insurers as upper catastrophe limits have been tested during 2015.
Industry Aggregate Premium 2010 to 2014
Credit Rating and Outlook
Rating Outlook
S&P AA Stable
Fitch AA Positive
Moody's Aaa Stable
AM Best CRT-2
Aon Benfield Outlook
After expanding at a robust pace over 2014, the New Zealand economy is showing signs of coming off the boil in 2015. A dramatic downturn in dairy export markets is expected to result in export revenue declining by 3.5bn NZD (about 1.5% of annual GDP). Combined with an earlier than expected peak in Canterbury earthquake rebuild work, currently underpinning New Zealand construction activity, may result in annual GDP growth dropping below 2%. Some drivers of economic growth remain strong with the rapidly expanding population of Auckland propelling residential and infrastructure construction and a lower exchange rate boosting expansion of tourism and foreign education. Bodily injury risks (CTP, W/C, Med Mal) continue to be publically insured via a no-fault accident scheme (ACC) and domestic earthquake risk is largely insured with the EQC.
Private sector insurers are facing increased competition due to new entrants, market wide growth aspirations fuelled by a plentiful supply of (re)insurance capacity. Market consolidation should assist some players in maintaining current margins if efficiency gains can be achieved, however frequent weather related events continue to impact results (2015 to date reached 100mn NZD in insured losses). Favourable reinsurance market conditions continue to offer further expense savings or the opportunity to expand protection levels.
2,000
2,500
3,000
3,500
4,000
4,500
5,000
5,500
2010 2011 2012 2013 2014
Total Premiums NZD million Total Premiums USD million
GDP – PPP (USD bn)
166.0
GDP Per Capita – PPP (USD)
35,966.1
Population (mn)
4.6
5yr Real GDP Growth (%)
4.1
Unemployment Rate (%)
5.8
Inflation Rate (%)
0.2
Industry Premiums Split by Lines of Business
Lines of business USD mn NZD mn
Inc claims
NZD mn
Loss
ratio %
*Y/Y
growth %
Property 2,309.9 2,784.3 3,416.8 122.7 5.1
Motor 1,261.9 1,521.1 1,018.5 68.7 5.8
Workers’ Compensation 31.7 38.3 8.5 22.3 15.4
Liability 349.2 420.9 260.8 64.3 17.3
Surety, bonds, & credit 6.5 7.8 6.6 82.3 16.0
Miscellaneous 100.8 121.5 65.4 53.9 6.0
MAT 117.7 141.9 59.2 41.8 2.2
Industry-Wide Non-Life 4,177.7 5,035.8 4,835.8 97.1 6.3
PA & Health 190.5 229.7 107.7 48.3 18.3
Grand Total 4,368.3 5,265.5 4,943.6 95.0 6.7
2014 GWP
*Growth % is based on premiums in local currencyBreak-up by line of business reflects premiums written within this market sector
Top 5 Insurers
Entity USD mn NZD mn
Market
share %
Loss
ratio %
Comb
ratio %
IAG New Zealand 1,650.8 2,013.0 40.8 73.9 105.6
Vero Insurance 806.2 983.0 19.9 55.0 92.0
Lumley General
Insurance (NZ) 382.8 466.8 9.5 68.1 101.3
AA Insurance 201.9 246.2 5.0 67.4 100.6
Tower Insurance 187.5 228.7 4.6 70.6 102.8
2013 GWP
Political Risk
Terror Risk
World Bank relative ease of doing business
Low High
Easiest Hardest
Data Source: IMF, SNL, S&P, Fitch, Moody’s, A.M. Best, Financial Markets Authority, The Reserve Bank, Aon, and Aon Benfield.
2014 Insurance Penetration - Non-life and PA & Healthcare GWP vs. GDP
New Zealand Prem: GDP = 2.2%; APAC Prem: GDP = 1.5%
IAG completed acquisition of Wesfarmers/Lumley on July 30, 2014Ranking based on premiums written by an insurer within this market sector Includes Non-life + PA & Healthcare premiums 2014 statistics were not published by the regulator when preparing this report
(2015 est.)

44 45
PakistanBadshahi Mosque in Lahore

46 47
Pakistan
Capital Requirements
The minimum capital requirement is 300mn PKR for non-life companies and general Takaful operators. Each insurer shall make and maintain a deposit with the State Bank of Pakistan a specified minimum amount either in cash or approved securities, or a hybrid. Currently this specified amount is the higher of 10mn PKR and 10% of the insurer’s paid up capital or, such amount as may be prescribed by the regulator SECP.
The regulator has announced a planned increase in the minimum paid-up capital requirements which will take place incrementally in six-monthly intervals until December 2017. For non-life insurers and Takaful operators, the minimum paid-up capital has to be 300mn PKR by 31 December 2015, increasing by 50mn PKR at six-monthly intervals until it reaches 500mn PKR by 31 December 2017.
Non-life insurers are required to have admissible assets in excess of their liabilities of an amount greater than or equal to the minimum solvency requirement. The minimum solvency requirement is the greatest of the following: 150mn PKR in excess of liabilities, 20% of the net premium, subject to a maximum deduction of 50% reinsurance share, and 20% of the sum of unexpired risks plus outstanding claims.
Regulatory Updates
SECP began to allow conventional companies to underwrite Takaful products after obtaining authorization as “Window Takaful Operator” under the Takaful Rules 2012, which is expected to heat up competition.
Major Risks
Catastrophe Risk
Flooding caused by the monsoon rains has been the most frequent natural catastrophe event over the last few years. Some of the larger insurers have been purchasing catastrophe reinsurances covers; however the lack of any sophisticated pricing tools or adequate risk assessment in the market has made estimating the maximum probable loss very difficult.
Underwriting Risk
The insurance industry has been consistently reporting combined ratios above 100% since 2006. Expenses growth has outpaced nominal growth in GWP due to limited economies of scale. Intense competition in the market and low demand has put pressure on premium pricing resulting in margin pressure and losses across the core underwriting function. Things have however started to improve over the past couple of years.
Regulatory Risk
The Regulator has imposed strict “Fit and Proper” Criteria for the appointment of CEO’s of Insurance Companies. This along with the introduction of a new solvency scheme would ensure the insurers will remain solid and respond to the needs of insurance buyer.
Industry Aggregate Premium 2010 to 2014
Credit Rating and Outlook
Rating Outlook
S&P B- Positive
Fitch B Stable
Moody's B3 Stable
AM Best CRT-5
Aon Benfield Outlook
Growth in the insurance market is driven by foreign direct investment (FDI), infrastructure construction and an increased use of bancassurance as an effective distribution channel. The industry is faced with several challenges most notably original pricing, effective law and order enforcement and frequent energy outages. Covers for large scale construction and operational projects are placed outside the country on a facultative or fronting basis. Intense competition has ensured rates have remained stable, if slightly down in 2014.
The increased FDI and infrastructure development should lead to economic growth and an increase in aggregates and exposures leading to an increase in the volatility of losses, which in turn should lead to an increase in reinsurance prices in the mid-term. As insurance firms search for growth and develop new initiatives, such as Takaful windows, the roles brokers play has been widening, to provide support and expertise on innovation and product development.
Foreign Ownership
100% foreign equity in the insurance business is allowed, subject to certain conditions. The most important condition is the minimum capital brought in by foreign companies i.e., foreign companies must have minimum capital of 4mn USD, but no less than 2mn USD may come from abroad.
450
475
500
525
550
575
600
30,000
35,000
40,000
45,000
50,000
55,000
60,000
2010 2011 2012 2013 2014
Total Premiums PKR million Total Premiums USD million
GDP – PPP (USD bn)
930.8
GDP Per Capita – PPP (USD)
4,902.1
Population (mn)
189.9
5yr Real GDP Growth (%)
5.6
Unemployment Rate (%)
6.5
Inflation Rate (%)
4.5
Industry Premiums Split by Lines of Business
Lines of
business USD mn PKR mn
Inc claims
PKR mn
*Y/Y growth
%
Property 220.8 22,320.1 7,503.0 4.3
MAT 71.2 7,195.1 5,048.9 10.4
Motor 131.6 13,299.7 7,432.9 9.1
Miscellaneous 128.0 12,943.8 6,192.0 14.2
Industry-Wide Non-Life 551.5 55,758.7 26,176.8 8.4
2014 GWP
*Growth % is based on premiums in local currencyBreak-up by line of business reflects total premiums written by an insurer (domestic + overseas)
Top 5 Insurers
Entity USD mn PKR mn
Market
share
%
Loss
ratio
%
Comb
ratio
%
*Y/Y
growth
%
EFU General
Insurance Ltd. 143.6 14,514.1 26.4 40.2 N/A 4.6
Adamjee Insurance
Co. Ltd. 98.2 9,928.3 18.1 64.9 90.5 25.6
Jubilee General
Insurance Co. Ltd. 68.9 6,961.2 12.7 57.1 92.1 6.0
The United
Insurance Co. of
Pakistan Ltd.
24.5 2,474.7 4.5 26.5 69.0 43.6
IGI Insurance Ltd. 21.2 2,139.7 3.9 56.9 95.8 5.1
2014 GWP
Political Risk
Terror Risk
World Bank relative ease of doing business
Low High
Easiest Hardest
Data Source: IMF, SNL, S&P, Fitch, Moody’s, A.M. Best, the Securities and Exchange Comission of Pakistan, Aon, and Aon Benfield.
2014 Insurance Penetration - Non-life and PA & Healthcare GWP vs. GDP
Pakistan Prem: GDP = 0.2%; APAC Prem: GDP = 1.5%
*Growth % is based on premiums in local currencyExcludes PA & Healthcare premiums Ranking based on total premiums written by an insurer within this market sector
(2015 est.)

48 49
PhilippinesWorld heritage rice terraces in Batad, northern Luzon, Infugao province

50 51
Philippines
Capital Requirements
New net worth requirements for current insurers are 550mn PHP by 31 December 2016, 900mn PHP by 31 December 2019, and 1.3bn PHP by 31 December 2022.
For new non-life insurers planning to engage in business in Philippines, the minimum paid-up capital of 1bn PHP applies.
For insurers engaging in solely reinsurance business, the capitalisation is at a minimum of 3bn PHP paid in cash, where at least 50 percent is paid up capital and the remaining portion of at least 400mn PHP from contributed surplus.
RBC requirements were introduced in 2006 and are complementary to the minimum capital requirements. The RBC requirements include capital required for fixed income securities, equities, credit risk, loss reserves and net premiums written.
Regulatory Updates
As per the circular issued in June 2015, pursuant to Section 194 of the Amended Insurance Code, the IC is conducting a review of the current RBC framework contained in Insurance Memorandum Circulars numbered 6-2006 and T-2006 both dated 5 October 2006. Hence, all life and non-life insurance and professional reinsurance companies are required to participate in parallel runs for the RBC 2-QIS that starting with financials as of 31 December 2014. This will allow the IC an opportunity to engage the industry in a meaningful dialogue and obtain feedback prior to the full implementation date on 30 June 2016.
Major Risks
Catastrophe Risk
All insurance companies writing fire and allied perils insurance are required to secure catastrophe XOL reinsurance cover of at least 5% of their aggregate net retained insured values against earthquake, typhoon and flood in either Zone A or B, whichever is higher. However, given the frequency of natural catastrophes in Philippines, insurance companies will need to integrate catastrophe risk management into their underwriting processes to safeguard their capital position.
Underwriting Risk
The insurance market in the Philippines is extremely fragmented and competitive, and certain under capitalised insurance companies may need more capital to withstand potential impacts from unprofitable insurance operations.
Industry Aggregate Premium 2010 to 2014
Credit Rating and Outlook
Rating Outlook
S&P BBB Stable
Fitch BBB- Positive
Moody's Baa2 Stable
AM Best CRT-4
Aon Benfield Outlook
The insurance penetration rate in the Philippines is relatively low at 1.8% with the Non-Life insurance penetration rate even lower at 0.5% but it hopes to achieve the 2.5% target penetration rate by the end of 2015 due to the expected increase in contributions from the micro-insurance sector. This will bring the Philippines closer to the 3.0% average penetration rate in ASEAN.
Infrastructure Projects from both the government and private sector continue to drive growth in Property and Engineering lines while increase in consumer spending due to the growing middle class sustains the development in Marine & Motor lines.
Due to the absence of major natural calamities in 2014, XOL program pricing continue to face downward pressure, resulting in risk adjusted reduction of around 10% to 20%.
High taxes are still a major concern for non-life insurers as the government imposes a combination of the different taxes averaging around 26-27% of premium. The Philippine Insurers and Reinsurers Association (PIRA) has been calling on Congress to pass House Bill (HB) number 3235 or “An Act Rationalizing the Taxes Imposed on Non-Life Insurance Policies” which seeks to reduce the current taxes on non-life insurance premiums to 5.5% to be at par with ASEAN countries in time for the ASEAN Economic Integration (AEI).
Market consolidation is expected to continue in the market because of increased capitalization / net equity requirements being phased in over the next few years. This should lead to fewer players in the market discouraging excessive price competition and releasing pressure on original rates.
Through the joint initiatives of IC, PIRA & IFC/WB, the Philippine Catastrophe Insurance Pool (PCIP) has been proposed. Described as an integrated mechanism to reduce poverty through disaster risk finance and insurance for homeowners and SMEs, a PCIP presentation was submitted to the National Treasurer / Secretary of Finance awaiting response from President Benigno Aquino III.
Foreign Ownership
Foreign ownership is permitted, of up to 100% ownership.
GDP – PPP (USD bn)
742.3
GDP Per Capita – PPP (USD)
7,318.4
Population (mn)
101.4
5yr Real GDP Growth (%)
7.6
Unemployment Rate (%)
6.3
Inflation Rate (%)
1.9
Industry Premiums Split by Lines of Business
Lines of business USD mn PHP mn
Inc claims
PHP mm
Loss ratio
%
*Y/Y
growth %
Property 382.2 16,226.4 4,168.9 102.6 4.4
Motor 377.8 16,036.5 6,529.8 44.2 9.7
Workers' Compensation 21.5 914.4 176.2 71.1 532.4
Surety, Bonds & Credit 48.7 2,068.2 307.4 16.5 4.3
Miscellaneous 6.4 273.8 78.2 36.0 22.0
Marine, Aviation & Transit 121.6 5,163.1 588.5 34.6 12.8
Industry-Wide Non-Life 958.4 40,682.4 11,849.0 51.9 9.7
PA & Healthcare 244.3 10,370.6 2,275.3 45.4 -2.1
Grand Total 1,202.7 51,053.0 14,124.3 50.7 7.1
2013 GWP
*Growth % is based on premiums in local currency Break-up by line of business reflects premiums written within this market sector2013 information is updated based on the revised numbers now available 2014 statistics were not published by the regulator when preparing this report
Top 5 Insurers
Entity USD mn PHP mn
Market
share %
*Y/Y
growth %
Malayan Insurance Co. 156.3 6,937.0 11.3 -6.1
Prudential Guarantee &
Assurance, Inc. 138.8 6,161.4 10.0 6.1
BPI/IMS Insurance Corp. 117.8 5,229.1 8.5 2.4
Pioneer Insurance & Surety Corp. 113.4 5,034.7 8.2 4.9
Charter Ping An Insurance Corp. 90.2 4,002.5 6.5 13.9
2014 GWP
Political Risk
Terror Risk
World Bank relative ease of doing business
Low High
Easiest Hardest
Data Source: IMF, SNL, S&P, Fitch, Moody’s, A.M. Best, the Insurance Comission, Aon, and Aon Benfield.
550
700
850
1,000
1,150
1,300
1,450
35,000
40,000
45,000
50,000
55,000
60,000
65,000
2010 2011 2012 2013 2014
Total Premiums PHP million Total Premiums USD million
2014 Insurance Penetration - Non-life and PA & Healthcare GWP vs. GDP
Phillipines Prem: GDP = 0.5%; APAC Prem: GDP = 1.5%
*Growth % is based on premiums in local currency Excludes PA & Healthcare premiums Ranking based on total premiums written by an insurer within this market sector
Excluding PA & Healthcare premiums.
(2015 est.)

52 53
SingaporePanorama of Singapore from Marina Bay

54 55
Singapore
Capital Requirements
The paid up capital requirement for direct insurers concerned with investment-linked policies only or short-term Accident and Health policies only is 5mn SGD. For any other type of direct insurer the requirement is 10mn SGD. For reinsurers, the requirement is 25mn SGD.
These amounts apply to both domestic and foreign companies. For a captive insurer, the minimum capital requirement is 0.4mn SGD.
The capital adequacy requirement of a registered insurer shall at all times be such that the financial resources of the insurer are not less than whichever is the higher of: 1) The sum of the aggregate of the total risk requirement of all insurance funds established and maintained by the insurer under the Act, and where the insurer is incorporated in Singapore, the total risk requirement arising from the assets and liabilities of the insurer that do not belong to any insurance fund established and maintained under the Act, or 2) A minimum amount of 5mn SGD.
Regulatory Updates
The second consultation on RBC 2 review was closed in June 2014. MAS expects to finalize the calibration factors with implementation from 1 January 2017.
Major Risks
Nil
Industry Aggregate Premium 2010 to 2014
Credit Rating and Outlook
Rating Outlook
S&P AAA Stable
Fitch AAA Stable
Moody's Aaa Stable
AM Best CRT-1
Aon Benfield Outlook
The current challenge that the insurers are facing is the highly competitive insurance market in Singapore which has held premiums down. The General Insurance (GI) industry performed well in 2014 and went on to deliver 391.7mn SGD in underwriting profit, a robust year-on-year (yoy) increase of 37.4%. This represented a strong trend turnaround from the slight yoy decrease seen in 2013, thanks in large part to the 90mn SGD or 153% surge in underwriting profit of motor insurance.
The various initiatives adopted by our industry working closely with key stakeholders to control and manage motor claims have made significant progress in lowering its loss ratio with 4.8% yoy improvement in 2014.
MAS will also seek to increase breadth in the industry by promoting growth in emerging business lines, such as cyber risks. Lack of data is a key hurdle for cyber insurance in Asia. MAS is working with industry to create a test-bed for cyber risks where insurers and potential clients can come together to simulate loss events. 1) cyber insurers will be able to generate sets of valuable loss data and raise awareness about the value of specialty cyber insurance cover; 2)clients will get the opportunity to stress-test their systems, assess the responsiveness of existing coverage to losses, and gain an appreciation of potential losses and the need for cyber insurance cover.
Foreign Ownership
Foreign ownership is permitted in the form of wholly owned subsidiaries or branches. There are no restrictions on the level of foreign ownership. The Singapore government offers tax incentives for regional insurers to establish operational headquarters in Singapore.
2,000
2,250
2,500
2,750
3,000
3,250
3,500
3,750
4,000
2010 2011 2012 2013 2014
Total Premiums SGD million Total Premiums USD million
GDP – PPP (USD bn)
468.9
GDP Per Capita – PPP (USD)
84,900.8
Population (mn)
5.5
5yr Real GDP Growth (%)
5.5
Unemployment Rate (%)
2.0
Inflation Rate (%)
0.0
Industry Premiums Split by Lines of Business (SIF basis)
Lines of
business USD mn SGD mn
Inc claims
SGD mn
Loss
ratio %
*Y/Y
growth %
Property 345.5 437.8 107.4 24.5 5.4
Construction &
Engineering 82.1 104.1 -23.4 -22.5 -22.3
Motor 933.5 1,182.8 639.5 54.1 -2.9
Workers Comp 317.1 401.8 244.7 60.9 7.5
Liability 197.4 250.1 57.8 23.1 2.5
Surety, bonds, & credit 194.1 246.0 140.0 56.9 1.4
Miscellaneous 98.3 124.6 22.9 18.4 2.7
MAT 326.2 413.3 268.6 65.0 8.5
Industry-Wide Non-Life 2,494.2 3,160.4 1,457.5 46.1 1.0
PA & Health 544.6 690.1 343.2 49.7 13.6
Grand Total 3,038.8 3,850.5 1,800.7 46.8 3.0
2014 GWP
Top 5 Insurers (SIF basis)
Entity USD mn SGD mn
Market
share %
Loss
ratio %
Comb
ratio %
*Y/Y
growth %
AIG Asia Pacific
Insurance Pte. Ltd. 369.7 468.5 12.2 47.5 90.6 1.3
AXA Insurance
(SG) Pte. Ltd. 328.1 415.7 10.8 54.1 89.5 -0.5
MSIG Insurance
(SG) Pte. Ltd. 261.5 331.3 8.6 39.4 85.0 1.6
First Capital 228.8 289.9 7.5 76.4 73.6 -0.1
NTUC Income 223.5 283.1 7.4 35.6 68.7 -5.5
2014 GWP
Political Risk
Terror Risk
World Bank relative ease of doing business
Low High
Easiest Hardest
Data Source: IMF, SNL, S&P, Fitch, Moody’s, A.M. Best, Monetary Authority of Singapore, Aon, and Aon Benfield.
2014 Insurance Penetration - Non-life and PA & Healthcare GWP vs. GDP
Singapore Prem: GDP = 1.0%; APAC Prem: GDP = 1.5%
*Growth % is based on premiums in local currency Ranking based on total premiums written by an insurer within this market sector Includes Non-life + PA & Healthcare premiums
*Growth % is based on premiums in local currency Break-up by line of business reflects premiums written within this market sector
(2015 est.)

56 57
TaiwanHillside teahouses in Jiufen

58 59
Taiwan
Capital Requirements
The minimum capital requirements in establishing an insurance company is 2bn TWD. The capital requirement is on cash basis only. A bond equal to 15% of the total amount of its paid in capital or paid in fund must be posted with the national treasury.Branches of foreign companies require paid-up capital of not less than 1bn TWD, and need to maintain minimum working capital of 50mn TWD.
Article 143-4 of the insurance law covers solvency calculated as a percentage of risk-based capital. It states that a company’s ratio of total adjusted net capital to risk based capital shall not be lower than 200%.
Risk-based capital is defined as such capital that is calculated based on the risks that an insurance company may incur from the actual operation of insurance business. The scope of such risks includes asset risks, credit risks, underwriting risks, asset-liability matching risks, and other risks.
Regulatory Updates
In May 2015, the regulator amended the insurer solvency management method. Main changes include reclassification of solvency adequacy status requirement of disclosure of exact solvency ratio (previously ranges were used). These amendments take effect on 1 January 2016. The regulator also amended the insurer internal control and auditing method. Multiple clauses were affected. These changes are made to keep aligned with the most recent COSO report.
Major Risks
Underwriting Risk
The development of general and high tech industries in concentrated commercial areas has led to highly volatile underwriting risks for commercial and industrial property insurers.
Regulatory Risk
An amendment to the Insurance Act that targets insurers’ minimum risk-based capital ratio has been approved by a government authority. The new regulation means that insurance companies with a RBC ratio lower than 50% would be acquired by the government.
Investment Risk
Due to the lack of long-term investment instruments in the domestic market, long-term liabilities’ share of total liabilities is persistently higher than long-term assets’ share of total assets, leading to a duration mismatch. The assumed interest rates of life insurance policies in earlier periods are still higher than current investment return rate, resulting in a negative interest rate spread.
Catastrophe Risk
World Bank report in 2005 assessed that “Taiwan may be the place on Earth most vulnerable to natural hazards, with 73% of its land and population exposed to three or more hazards”. Frequent earthquake, typhoon, flood and landslides are the major treats to Taiwan.
Industry Aggregate Premium 2010 to 2014
Credit Rating and Outlook
Rating Outlook
S&P AA- Stable
Fitch A+ Stable
Moody's Aa3 Stable
AM Best CRT-2
Aon Benfield Outlook
Growth in the Taiwan insurance market is driven by economic expansion and manufacturing, particularly in the electrical industry. The largest growth has focused on the major lines; Motor, Commercial Property and Marine. The local insurance market relies heavily on reinsurance capacity both through facultative and treaty placements, particularly on Commercial Property. There is a high level of retention and therefore reducing demand for reinsurance for Motor due to the limited level of natural peril covers on the policies. Price competition is the biggest challenge facing the direct market, with commercial property rates reducing by 10% to 20% for medium and large accounts in first half of 2015 renewals. Some extreme cases dropped to near 30%.
Despite the regulator implementing a number of price stabilisation policies, such as reforming the natural perils reference rate and setting a ceiling for commissions on Motor policies, the excess capacity in the market and the softening facultative market is resulting in some price reductions. Typhoon Soudelor hit Taiwan in August and insurance loss is estimated to reach 2bn TWD (67mn USD). It is noted only a limited figure of TIA exposures been involved in Tianjin explosion.
Nevertheless, the way how major reinsurers response to this event will be an uncertainty to the coming renewal of Taiwan marketplace.
Foreign Ownership
Branches of foreign companies require paid-up capital of not less than 1bn TWD, and need to maintain minimum working capital of 50mn TWD. In addition, the parent company must have met certain qualitative requirements. Such branches are also required to post a bond with the treasury.
3,000
3,250
3,500
3,750
4,000
4,250
4,500
4,750
110,000
115,000
120,000
125,000
130,000
135,000
140,000
145,000
2010 2011 2012 2013 2014
Total Premiums TWD million Total Premiums USD million
GDP – PPP (USD bn)
1,113.8
GDP Per Capita – PPP (USD)
47,407.2
Population (mn)
23.5
5yr Real GDP Growth (%)
4.5
Unemployment Rate (%)
4.0
Inflation Rate (%)
-0.1
Industry Premiums Split by Lines of Business
Lines of
business USD mn TWD mn
Paid claims
TWD mn
Loss
ratio %
*Y/Y
growth %
Property 817.1 24,808.1 4,795.7 19.3 3.5
Construction &
Engineering 140.5 4,266.7 2,064.1 48.4 -11.4
Motor 2,402.4 72,936.1 44,841.9 61.5 8.7
Liability 310.6 9,430.1 3,392.5 36.0 5.8
Surety, bonds, & credit 37.2 1,130.0 253.3 22.4 10.9
Miscellaneous 63.6 1,932.3 680.5 35.2 2.4
MAT 290.2 8,811.8 6,710.6 76.2 -1.1
Industry-Wide Non-Life 4,061.8 123,315.1 62,738.6 50.9 5.8
PA & Health 512.6 15,562.4 6,695.7 43.0 5.3
Grand Total 4,574.4 138,877.5 69,434.2 50.0 5.7
2014 GWP
*Growth % is based on premiums in local currencyBreak-up by line of business reflects premiums written within this market sector
Top 5 Insurers
Entity USD mn TWD mn
Market
share %
Loss
ratio %
Comb
ratio %
*Y/Y
growth %
Fubon Insurance
Co. Ltd. 1,004.5 30,498.1 22.0 55.1 92.1 6.6
Cathay Century
Insurance Co. Ltd. 607.8 18,454.2 13.3 63.4 99.3 8.1
Shinkong
Insurance Co. Ltd. 458.5 13,920.8 10.0 54.8 93.3 5.2
MSIG Mingtai
Insurance Co. Ltd. 361.5 10,974.4 7.9 50.0 92.6 4.2
Tokio Marine
Newa Insurance
Co. Ltd.
351.5 10,671.6 7.7 54.8 90.3 11.1
2014 GWP
Political Risk
Terror Risk
World Bank relative ease of doing business
Low High
Easiest Hardest
Data Source: IMF, SNL, S&P, Fitch, Moody’s, A.M. Best, the Financial Supervisory Commission, Aon, and Aon Benfield.
2014 Insurance Penetration - Non-life and PA & Healthcare GWP vs. GDP
Taiwan Prem: GDP = 0.9%; APAC Prem: GDP = 1.5%
*Growth % is based on premiums in local currency Ranking based on total premiums written by an insurer within this market sector Includes Non-life + PA & Healthcare premiums
(2015 est.)

60 61
ThailandDamnoensaduak Floating Market

62 63
Thailand
Capital Requirements
Non-life insurers in Thailand are required to hold a minimum capital requirement of 30mn THB in accordance to Non- Life Insurance Act 1992. This is subsequently revised to 300mn THB for companies established after 1997.
RBC has been fully implemented, from 1 September 2011, with an initial minimum Capital Adequacy Ratio (CAR) of 125%. With effect from 1 January 2013, the minimum CAR is increased to 140%. The Capital Adequacy Ratio measures the adequacy of the capital available to the insurer to support the total capital required under various circumstances.
Regulatory Updates
The Non-life Insurance Act No. 3 of 2015 came into force on 6 March 2015. The new Act contains the third set of amendments to the 1992 legislation, including changes to the allowable shareholding structure of insurance companies, the sources and management of insurance funds and the process to be followed in respect of the liquidation of an insurance company.
Major Risks
Catastrophe Risk
Flood is the major natural hazard exposure in Thailand, with large areas of the country subject to regular flooding as a result of the monsoon rains. Thailand experienced its worst flooding in 2011, which caused about 1.4tr THB economic loss and resulted in the fifth costliest insured loss event since 1980. Following the 2011 floods, many insurers and reinsurers have withdrawn, increased their premiums or refused to renew contracts. This year has seen the worst drought in decades to affect Thailand. In the past Flood has been the main loss driver, but this year has not seen much flooding.
Regulatory Risk
The Office of Insurance Commission (OIC) had the intention to raise the minimum capital for all non-life insurers to 500mn THB by 2017. This may affect insurers with relatively smaller size.
For RBC phase II, cat risk charge might be developed.
Thailand Money Laundry Bureau has started auditing the insurance companies.
Investment Risk
Some companies are very conservative while others have said that a drop in the Thailand stock market will probably cause unrealized loss in their book.
Underwriting Risk
Direct premium rate has dropped almost to the same level as pre-flood 2011. As a result, the Loss Ratio is expected to increase while the premium may not be sufficient.
Industry Aggregate Premium 2010 to 2014
Credit Rating and Outlook
Rating Outlook
S&P BBB+ Stable
Fitch BBB+ Stable
Moody's Baa1 Stable
AM Best CRT-3
Aon Benfield Outlook
The current political situation and its implications is still the main concern in Thailand. Adding to this was the blast that shook Bangkok on 17th August 2015. The economy is under recession and this has affected the insurance industry, which means there is almost no growth. The direct market competition is very fierce. The Direct Premium rate has dropped close to the pre-2011 flood levels. Thus, most of the insurance companies have shifted focus to more on personal lines or individual lines. For Motor sector, as the motor sales have dropped, motor insurance book has not grown as targeted. Reinsurance capacity is still available in the market. Insurance company can take advantage of the prevailing low reinsurance costs. However, the reinsurers in the region may be affected from Tianjin loss, leading to the increase in rates.
Foreign Ownership
Foreign ownership is allowed. The law limits foreign ownership to 25% but some foreign companies have overcome this restriction through the use of nominees. When deemed “appropriate”, the regulator (OIC) may permit up to 49% foreign ownership. However, in November 2012, Finance Minister Kittiratt Na-Ranong said that the government has ruled out any liberalisation of the banking and insurance sectors for at least the next five years, adding that any liberalisation of the financial sector will be outlined by the central bank.
4,000
4,500
5,000
5,500
6,000
6,500
7,000
100,000
120,000
140,000
160,000
180,000
200,000
220,000
2010 2011 2012 2013 2014
Total Premiums THB million Total Premiums USD million
GDP – PPP (USD bn)
1,107.0
GDP Per Capita – PPP (USD)
16,081.2
Population (mn)
68.8
5yr Real GDP Growth (%)
4.5
Unemployment Rate (%)
0.8
Inflation Rate (%)
-0.9
Industry Premiums Split by Lines of Business
Lines of
business USD mn THB mn
Inc claims
THB mn
Loss
ratio %
Comb
ratio %
*Y/Y growth
%
Property 1,261.2 40,962.2 33,030.4 82.1 112.1 0.6
Construction &
Engineering 106.5 3,459.5 964.9 28.7 53.7 1.1
Motor 3,636.9 118,124.2 71,801.3 61.1 100.4 -0.4
Liability 64.7 2,101.2 486.9 23.6 51.3 10.7
Miscellaneous 240.9 7,825.6 3,388.9 41.6 78.4 -0.9
MAT 209.8 6,813.5 3,887.4 57.1 85.9 0.5
Industry-
Wide Non-Life 5,519.9 179,286.2 113,559.8 63.8 100.1 0.0
PA & Health 1,035.9 33,645.2 13,421.6 41.5 81.0 7.6
Grand Total 6,555.8 212,931.4 126,981.4 60.3 96.7 1.1
2014 GWP
*Growth % is based on premiums in local currency Break-up by line of business reflects premiums written within this market sector
Top 5 Insurers
Entity USD mn THB mn
Market
share %
Loss
ratio %
Comb
ratio %
*Y/Y
growth %
Viriyah Insurance
Co. Ltd. 1,027.6 33,376.2 16.3 N/A N/A -1.8
Dhipaya Insurance
Public Co. Ltd. 741.8 24,092.0 11.7 42.4 75.9 2.0
Bangkok Insurance
Public Co. Ltd. 466.6 15,155.4 7.4 53.3 85.5 0.6
Muang Thai Insurance
Public Co. Ltd. 308.7 10,028.1 4.9 N/A N/A 15.8
Syn Mun Kong
Insurance Public
Co. Ltd.
295.7 9,603.8 4.7 N/A N/A 8.4
2014 DWP
Political Risk
Terror Risk
World Bank relative ease of doing business
Low High
Easiest Hardest
Data Source: IMF, SNL, S&P, Fitch, Moody’s, A.M. Best, Office of the Insurance Commission, Aon, and Aon Benfield.
2014 Insurance Penetration - Non-life and PA & Healthcare GWP vs. GDP
Thailand Prem: GDP = 1.8%; APAC Prem: GDP = 1.5%
*Growth % is based on premiums in local currency Ranking based on total premiums written by an insurer within this market sector Includes Non-life + PA & Healthcare premiums
(2015 est.)

64 65
VietnamTerraced fields in Mu Cang Chai district, Yen Bai province

66 67
Vietnam
Capital Requirements
Decree 46-2007-ND-CP sets the legal capital of non-life insurance businesses at 300bn VND and the legal capital of insurance brokers at 4bn VND.
Decree 123/2011/ND-CP of December 2011 supplemented on other capital requirements as follow:1) a branch of a foreign non-life insurance business: 200bn VND. 2) reinsurance businesses: 400bn VND, for non-life reinsurance or health reinsurance business or non-life reinsurance and health reinsurance business and 1.1tr VND, for life, non-life and health reinsurance business.
Circular 125/2012/TT-BTC issued in July 2012 has further supplemented on the capital requirements as follow: Insurers writing aviation or satellite insurances is required to have an additional 50b VND. Legal capital for every branch or representative office open is to be increased by 10bn VND.
Regulatory Updates
The MOF issued Decree 195/2014/TT-BTC in December 2014 specifying methods to assess and rank insurers. According to this regulation, insurers shall assess and take appropriate measures to enhance effectiveness, financial capacity, quality of business management and risk management. The MOF will take appropriate measures to ensure the insurers and the insurance market operate safely, effectively and stably.
Industry Aggregate Premium 2010 to 2014
Credit Rating and Outlook
Rating Outlook
S&P BB- Stable
Fitch BB- Stable
Moody's B1 Stable
AM Best CRT-4
Aon Benfield Outlook
The overall insurance premium, including both life and non-life industry, has increased by close to 15% for the first half of 2015, which is a significantly higher compared to GDP growth of around 6%. Whilst the general outlook for insurance industry could be promising, most classes of business are still expecting continued downwards pressure on premium rates considering the significant capacity available in both insurance and reinsurance markets. In the absence of a fixed tariff for natural catastrophe risks, and a lack of consolidation in the market, most insurers could face challenges in maintaining underwriting profitability in the coming years.
For XOL reinsurance, increasing capacity from international reinsurers and softening market conditions globally have maintained downward pressure on reinsurance rates. However, this pressure could be balanced by strong growth in insurance premiums and recent spate of Property losses which affected a few insurers.
Although Vietnam is generally viewed as a country with low natural catastrophe exposures, there have been increased interests in the development of fully probabilistic natural catastrophe models to address unmodelled perils such as potential floods affecting peak accumulation of exposures in Ho Chi Minh City.
Foreign Ownership
Restrictions placed on foreign-invested insurers are being removed in accordance with commitments assumed under bilateral trade agreements and with the WTO.
Major Risks
Catastrophe Risk
Vietnam is generally not viewed as a catastrophe prone country despite the high frequency of typhoon passing through the country. The major natural peril in the country is usually flood caused by typhoons and tropical storms.
Underwriting Risk
Strong competition in the market has led to gradual reduction in premium rates and wider terms and conditions over recent years. While reduction in rates may have softened for certain business occupancies, there is continued emphasis on prudent risk selection and technical underwriting to maintain underwriting profitability.
Financial Risk
The increased volatility in the currency market can significantly impact the returns on some of the treaties that are written in foreign currencies, especially in US dollars.
900
1,000
1,100
1,200
1,300
10,000,000
15,000,000
20,000,000
25,000,000
30,000,000
2010 2011 2012 2013 2014
Total Premiums VND million Total Premiums USD million
GDP – PPP (USD bn)
551.3
GDP Per Capita – PPP (USD)
6,019.5
Population (mn)
91.6
5yr Real GDP Growth (%)
7.6
Unemployment Rate (%)
2.5
Inflation Rate (%)
2.2
Industry Premiums Split by Lines of Business
Lines of
business USD mn VND mn
Paid claims
VND mn
Loss
ratio %
Property 369.1 8,000,908.0 3,228,674.0 40.4
Motor 357.5 7,749,443.0 3,505,238.0 45.2
Liability 29.3 634,894.0 77,822.0 12.3
Surety, Bonds & Credit 4.7 102,050.0 15,610.0 15.3
Marine, Aviation & Transit 224.3 4,861,847.0 1,597,774.0 32.9
Miscellaneous 7.7 166,026.0 100,762.0 60.7
Industry-Wide Non-Life 992.4 21,515,168.0 8,525,880.0 39.6
PA & Health 276.4 5,991,527.0 2,361,233.0 39.4
Grand Total 1,268.8 27,506,695.0 10,887,113.0 39.6
2014 DWP
Top 5 Insurers
Entity USD mn VND mn
Market
share %
Loss
ratio %
*Y/Y
growth %
PetroVietnam
Insurance Corp. (PVI) 267.8 5,805,743.0 21.1 29.7 13.8
Bao Viet Insurance
Corp. 262.8 5,697,986.0 20.7 52.3 0.4
Bao Minh
Insurance Corp. 120.0 2,601,107.0 9.5 42.6 13.1
Petrolimex
Joint-stock Insurance
Corp. (PJICO)
98.5 2,134,412.0 7.8 38.4 7.6
Post &
Telecommunication
(PTI)
79.3 1,718,207.0 6.2 35.5 16.2
2014 DWP
Political Risk
Terror Risk
World Bank relative ease of doing business
Low High
Easiest Hardest
Data Source: IMF, SNL, S&P, Fitch, Moody’s, A.M. Best, the Association of Vietnamese Insurers, the Ministry of Finance, Aon, and Aon Benfield.
2014 Insurance Penetration - Non-life and PA & Healthcare GWP vs. GDP
Vietnam Prem: GDP = 0.7%; APAC Prem: GDP = 1.5%
*Growth % is based on premiums in local currency Ranking based on total premiums written by an insurer (domestic + overseas) Includes Non-life + PA & Healthcare premiums
Break-up by line of business reflects total premiums written (domestic + overseas)
(2015 est.)

68 69
www.aonbenfield.com Copyright Aon Benfield Inc. 2015 | #ab195ab30102015
Contacts
Malcolm Steingold, CEO APAC [email protected] +61 2 9650 0379
George Attard, CEO Analytics APAC [email protected] +65 6239 8739
Andrew Hare, Principal, Inpoint [email protected] +65 6512 0263
Robert De Souza, CEO Australia and New Zealand [email protected] +61 2 9650 0444
Katsuya Tanimizu, CEO Japan [email protected] +81 3 4589 4260
David Vernon, Executive Chairman Japan [email protected] +44 20 7522 3905
Vinod Krishnan, CEO Asia [email protected] +65 6512 0210
Tao Han, Executive Director, Greater China [email protected] +86 10 5632 8683
This summary is produced solely for brevity and convenience. This summary does not constitute advice of any kind. You should obtain and consider all information relating to the insurance industry before making a decision based on any information in this document.
While Aon has exercised all reasonable care in the preparation of the information contained in this document, it does not, either expressly or impliedly, warrant that such information is error or omission free, complete or current. To the extent permitted by law, Aon, its officers, employees and agents will not accept responsibility for any loss, damage or other liability arising in connection with such information. Aon reserves its right to amend this document at any time although it is under no obligation to do so. Neither the issue of this document, nor any of the information presented in it, should be regarded as a commitment or representation on the part of Aon (or any other person) to enter into a contractual arrangement.
Front Cover Image: Marina Bay Sands, Singapore

About Aon Aon plc (NYSE:AON) is the leading global provider of risk management, insurance and reinsurance brokerage, and human resources solutions and outsourcing services. Through its more than 69,000 colleagues worldwide, Aon unites to empower results for clients in over 120 countries via innovative and effective risk and people solutions and through industry-leading global resources and technical expertise. Aon has been named repeatedly as the world’s best broker, best insurance intermediary, reinsurance intermediary, captives manager and best employee benefits consulting firm by multiple industry sources. Visit www.aon.com for more information on Aon and www.aon.com/manchesterunited to learn about Aon’s global partnership and shirt sponsorship with Manchester United.
© Aon plc 2015. All rights reserved.The information contained herein and the statements expressed are of a general nature and are not intended to address the circumstances of any particular individual or entity. Although we endeavor to provide accurate and timely information and use sources we consider reliable, there can be no guarantee that such information is accurate as of the date it is received or that it will continue to be accurate in the future. No one should act on such information without appropriate profes-sional advice after a thorough examination of the particular situation.
www.aon.com
Risk. Reinsurance. Human Resources.