weir mountain, atlin mining district british columbia
TRANSCRIPT

WEIR MOUNTAIN REPORT NO. 3
GEOLOGY AND GEOCHEMISTRY
CY1 to 8, ENG 1-3 CLAIMS
RECORD NUMBERS 224 to 231 and 221 to 223
WEIR MOUNTAIN, ATLIN MINING DISTRICT
BRITISH COLUMBIA
NTS 104N
59'39 I N, 132O59 N
Owner Mattagami Lake Mines Ltd. Exploration Di vi sion
Author F. Morra, M.Sc.

SUMMARY
1. An anomalously radioactive area has been delineated by Mattagami
during the 1977 reconnaissance helicopter borne radiometric survey.
The area is located approximately 41 km N60°E of Atlin, B.C., within
the Surprise Lake batholith.
2. As a result of the reconnaissance survey, Mattagami staked 11
claims (187 units) in the area, during the 1977 field season, and
carried out a detail geochemical sampling within the area (see
Weir Mountain, Report No. 2, F. Morra, October 1977).
3. Detailed geochemical sampling, both soil sampling and stream sediment
sampling, was carried out within Mattagami's property during the
1978 field season.
In addition, a CEM survey was completed in one area of particular
interest.
Ground and helicopter borne radiometric survey, radon-in-soil survey
and geological traverses were also completed during the 1978 field
season.
4. The area presents radioactive anomalies o f interest and other mineral
occurrences (in particular Zn and Pb) which deserves further work.
None of the presently found anomalies approaches economic grade
and/or tonnage.

CONTENTS
Chapter One: Introduction ................................ 1
1-1 Property and Ownership ........................... 1
1-2 Location and Access .............................. 1
1-3 Physiography ..................................... 1
1-4 Climate .......................................... 4
1-5 Work Program. June. 1978 ......................... 4
Chapter Two: Geological Setting .......................... 7
Chapter Three: Mineralization ............................ 8
3-1 Introduction .................................... -8
3-2 Detailed Description o f Anomalies ................ 9 Anomaly A ....................................... 9
Anomaly B & D .................................. 12
Anomaly C ...................................... 13
Anomaly E ...................................... 16
Chapter Four: Geochemical Survey ........................ 19
4-1 Methods ......................................... 19
4-2 Results .......................................... 19
Chapter Five: Radon in Soil Surveys ..................... 2Q
5-1 Field Method .................................... 20
5-2 Results ......................................... 20
Chapter Six: Conclusions ................................ 24
Breakdown of Man-days Spent on Mattagami's Property ............................................ 26
Certificate. Franco Morra ................................ 27
Certificate. William Mercer .............................. 28
Appendix 1 ............................................... 2.
Appendix 2 ............................................... 32

FIGURES
1 .
2.
3.
4.
5.
6.
7.
8.
9.
10.
11.
12.
13.
Location Map
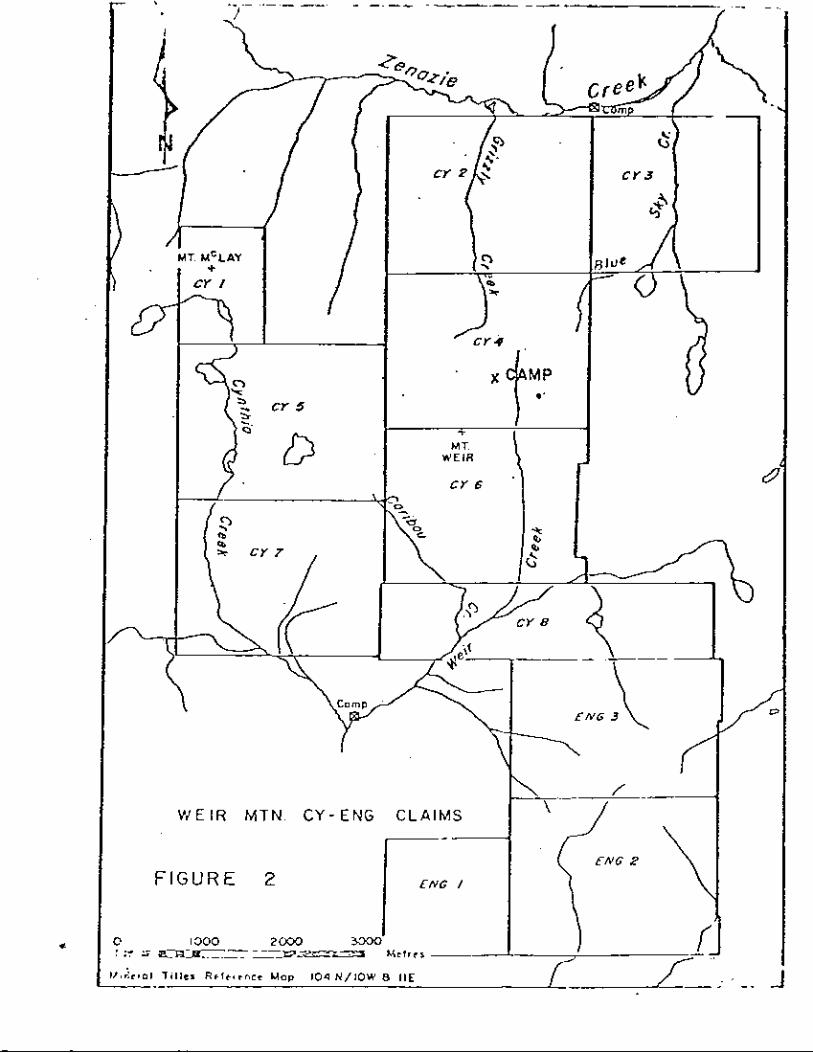
Claim Map and camp l o c a t i o n
Mineral occur rences
Location o f Main g r i d - CY6 Claim
S o i l Sample Survey - Blue Sky Creek g r i d - sample l o c a t i o n s and results
Radiometric Results - Blue Sky Creek g r i d
S c i n t i l l o m e t e r Survey - Anomaly "C"
So i l Sample Survey - Anomaly "C"
Uranium i n Stream Sediments - Sample Locat ions and Results
Rock Samples - Locat ion Map
Rock Samples - Uranium Results
Radon i n S o i l Survey - Location Map and Results
Radon i n S o i l Survey - Main g r i d - CY6 Claim
TABLES
Table 1 . S o i l Samples - Main g r i d
Table 2 . Sediment Samples Results
Table 3. S o i l Samples Results
Table 4. Rock Samples Resu l t s
Page
. 2
3
10
6
i n pocket
i n pocket
14
15
i n pocket
17
1 8
21
22
Appendix 1.
Appendix 2.
Appendix 2.
Appendix 2.

1.
CHAPTER ONE
INTRODUCTION
1-1 Property and Ownership
Mattagami Lake Mines Limited i s the owner of mineral claims CY1 t o
C Y 8 and Eng 1 , 2 and 3, Record Numbers 224 t o 231 and 221 t o 223 respec-
t i v e l y .
W. Howard and were recorded i n At l in , B . C . on 26 Ju ly 1977.
The claims staked over 187 uni t s o r 4675 hectares (11,553 ac res ) .
These claims were staked f o r the Company by F. Morra and
1-2 Location and Access
The property acquired by Plattagami i s located in the Weir Mountain
area (Figures 1 and 2 , northern B . C . , NTS 104N, approximately 41 KM N60°E
of the community of At l in , and i t s geographical location i s 59'39" and
132'59 W.
No roads lead t o the property. Access i t possible via hel icopter
from Atl in . A gravel road connects Atlin t o the e a s t shore of Surprise
Lake, 15 km west o f Weir Mountain.
1-3 Physiography
T h e area i s mountainous, with gently sloping, vegetation covered,
SE f lanks and precipi tous c l i f f s on the NW f lanks.
has l e f t wide U-shaped valleys and rounded mountain tops , a s well a s
c i rques and hanging val leys .
sea l eve l .
Recent g lac ia t ion
The elevation i s 1000 t o over 2000 m above
Vegetation i s a dense short willow bush u p t o 1300 m . Above this
elevat ion there i s a very immature alpine-type o f s o i l , 10 t o 50 cm

\ . -
--:. -... 4
Y
0 25 50 kilornelcrs v = 3
c
FIGURE I
LOCATION MAP
c" c > m OC 0
I
,i I - ;="p' .- COLUMBIA --I___ . -.. - .
i t
M T.
FIGURE 2
C Y J
.
VfE IR .MTN. C Y - E N G CLAIMS
€NG I

4.
thick, and vegetation consti tutes grass and lichens. Moraine and f luvial
deposits cover extensive areas a t valley bottoms.
1-4 Climate
The CY and Eng claims are almost completely f r ee of snow towards
the middle of July t o the end of August.
The area i s characterized by strong winds, prevalent from SW. Summer
temperatures average +4OC and snow storms a re common d u r i n g the summer
months , especially i n June and A u g u s t .
1-5 Work Program, June 1978
The personnel during the 1978 f i e l d season consisted of:
F. Morra - party chief
J . Biczok - senior ass i s tan t
N. Ball - junior ass i s tan t
L . Ball - j u n i o r ass i s tan t
The exploration approach used during the 1977 f i e l d season is
presented i n Weir Mountain Report No. 2 .
During the 1978 f i e l d season, the crew completed a geochemical and
geophysical (radiometric and CEM) survey i n areas not covered by the 1977
survey, and i n areas where a more detailed type of survey was required.
The work on the claims was carried o u t from May 29 unt i l June 26,
1978. I n 1978, f i e l d work carried over the claims included:
1 ) Geological , ground and he1 icopter borne
radiometric traverses over a l l claims.
2 ) Approximately 100 geochemical stream
sediment, 200 soi l sampling, and 100

5.
rock samples collected for analysis.
3) Radon-in-soil survey over 92 sample sites.
4) Grid line chaining on CY 3, 4, 6 and 8
claims.
5) CEM survey.
6) Hand-trenching.
A base camp was established at the headwaters of Weir Creek (Figure 2).
One fly-camp was established in CY 3 claim, along Blue Sky Creek.
The main grid on CY 6 claim is seen in Figure 4.

+ . CY 1
. . . . . _ ..-
FIGURE 4.
LOCATION OF MAIN GRID - CY 6 CLAIM
u n - I . . - 1 M e t r e s
l inero l T l t l e r R e f e r e n c e M o p l O 4 N / I O W 8 IIE

7.
CHAPTER TWO
GEOLOGICAL SETTING
The c la ims ( CYL - 8, ENG 1,2 and 3) a re l o c a t e d w i t h i n a l a r g e
b a t h o l i t h o f a l a s k i t e Cretaceous age, t h a t extends eastward f rom
A tT in Lake, n o r t h e r n B. C., as a l obe o f t h e Coast Range B a t h o l i t h .
St rong t e x t u r a l d i f f e r e n c e s a re present w i t h i n t h e a l a s k i t e ,
f rom f i ne -g ra ined t o ve ry coarse-grained, t o p o r p h y r i t i c , suggest ing
t h e presence o f d i f f e r e n t phases o f t h e same i n t r u s i o n , o r perhaps
separate i n t r u s i o n s .
The southernmost p a r t o f Mat tagami 's p roper ty , ENG 1 and 2
c la ims, covers t h e c o n t a c t between t h e a l a s k i t e and t h e Cache Creek
Group, ma in ly composed o f c h e r t , a r g i l l i t e and q u a r t z i t e .
Th i s con tac t i s o f t e n marked by gossan zones, w i t h p y r i t e
m i n e r a l i z a t i o n and hemat i te s t a i n i n g , extending l a t e r a l l y w i t h i n t h e
a l a s k i t e and t h e Cache Creek Group f o r severa l tens o f metres.
a l a s k i t e found i n t h e p r o p e r t y i s o therw ise almost f r e e o f v i s i b l e
a l t e r a t i o n zones except a t t h e Weir Mountain summit where one ou t -
The
c rop o f very a1 t e r e d and weathered f i ne -g ra ined a l a s k i t e occurs
(U, Pb, Zn m i n e r a l i z a t i o n present ) , and a long f a u l t zones, where t h e
K- fe ldspar i s o f t e n a l t e r e d and Fe-oxides are present .

8.
CHAPTER T H R E E
MINERALIZATION
3-1 Introduction
The claims owned by Mattagami in this area cover pa r t of the
Cretaceous Surprise Lake bathol i th .
anomalous r ad ioac t iv i ty , w i t h a U3O8 average content of 8 ppm, which
is approximately 3 times higher than the average U308 content detected
i n s imi la r rock types elsewhere
The e n t i r e ba thol i th presents
Metall iferous mineralization within the area includes zeuneri te
and o ther non-identified uranium minerals, molybdenite, galena, spha le r i t e ,
hematite, magnetite, py r i t e , f l u o r i t e , wolframite and beryl.
All the above-listed minerals were found i n outcrop a s well as on
t a lus slopes and along creek beds;with the exception of magnetite and
spha le r i t e which occur i n mafic dykes, a l l the o ther minerals mainly
occur within the a l a s k i t e , in f rac tures evident by hydrothermal a l t e r a t i o n .
Strong hydrothermal a l t e r a t ion i s lacking within the a l a s k i t e ,
although kaol inizat ion of the feldspars , ch lo r i t i za t ion and epidote
a1 t e r a t ion occur loca l ly .
Supergene a l t e r a t i o n is evidenced by a surface zone of oxidation
on the north s ide of Weir Mountain, and by the presence of a zone of
Kasolite and wulfenite s ta ining present on the SN f lank of Weir
Mountain.
The only type of mineralization of some i n t e r e s t observed on outcrop
seems t o be always associated t o local f rac tures o r assumed f a u l t s .
Structural lineaments i n the map area have a constant N50°E trend
Due t o the paucity of outcrops none of the f r ac tu res o r and 600NW d i p .

9.
assumed f a u l t s were investigated nor followed f o r more than few meters
a t the most.
Five radiometric anomalies have been found w i t h i n Mattagami's property,
namely (Figure 3 ) :
- Anomaly "A", a mineral occurrence i n outcrop located on top
of Weir Mountain (unident i f ied uranium mineral galena, s p h a l e r i t e and
s i 1 ver val ues ) . - Anomaly t l B l l , i n s o i l , on a swampy area along Blue Sky Creek
(uranium i n s o i l anomaly).
- Anomaly "C", a secondary mineral occurrence on t a l u s boulders,
on the SW flank of Weir Mountain (kaso l i te - Pb(UOz)(Si03)(0H)~ and
w u l feni t e - PbMoOq) . - Anomaly " D " , i n s o i l , located on Blue Sky va l ley (uranium
i n s o i l anomaly).
- Anomaly 'IE", mineral occurrence in outcrop, located w i t h i n
CY 8 claim ( spha le r i t e , galena). ,
All these anomalies, w i t h the exception of Anomaly E , have a l imited
l a t e r a l ex ten t , and Anomalies B y C , and D a r e probably r e l a t ed t o secondary
enrichment processes due t o leaching and supergene a l t e r a t i o n .
3-2 Detailed Description of Anomalies
Anomaly A
The or iginal "discovery zone", Anomaly A , was found on the s u m m i t
of Weir Mountain, i n 1977 as a r e s u l t of ground followup o f hel icopter
borne radiometrics.
Between the summit and an area immediately t o the west of the base
camp, along the c r e s t , three phases of a lask i te -grani te were found.

FIGURE 3 \
M I N E R A L - -- O C C U R R E N C E S --_

11.
Phase 1 is a fine-grained a l a s k i t e w i t h a saccharoidal , equigranular
tex ture , containing 3-5% b i o t i t e , 25-30% quartz and approximately 70%
fe ldspar , l a rge ly potassium feldspar .
Phase 1 is probably the youngest. Phase 2 has approximately the same
modal composition b u t i s coarser-grained and loca l ly porphyri t ic . I t i s
the dominant type along the N-S crest o f Weir Mountain.
i n the v i c i n i t y of the summit.
higher quartz content ( 40%) and i s strongly porphyri t ic w i t h euhedral
K-feldspar phenocrysts averaging 1.5 cm i n length.
Phase 1 and 3 found i n a t a lus block suggests t h a t Phase 1 i n t r u d e d Phase 3.
Phase 3 occurs
I t i s s imi la r t o Phase 2 b u t i t has a
A contact between
A small (11 cm wide) quartz vein was found intruding Phase 2 , west
of camp.
sc in t i l lometer ) and a sample (115 R 528) has been sent f o r analysis .
Results ind ica te 4.5 lb/ton u308, 0.017% Mo and 0.27% Pb.
T h i s vein i s s l i gh t ly radioact ive (500 cps on a GRS 101
Several magnetic dykes 1 t o 2 m across were a l s o found intruding
Phase 2.
On the s u m m i t of Meir Mountain a mineralized quartz vein crops o u t .
The vein i s approximately 20 cm wide and exposed f o r approximately 40 cm.
I t i s radioact ive ( u p t o 4000 cps on a GRS 101 sc in t i l l ome te r ) and
contains u p t o 4 lb/ton U3O8, 1.65% Pb and 4.0% Zn (from Weir Mountain
Report No. 2 ) . Several smaller veins (1-4 cm wide) a r e found nearby.
The euhedral nature of the quartz c rys t a l s ( u p t o 3 cm long) and
the vuggy nature of the veins suggest t h a t they a r e f i l l i n g tension f rac tures .
The outcrop i n which the vein occurs
and have abundant hematite s ta ining.
present: 160°, 75OW and 50°, 650 N W ,
heaviest hematite s ta in ing and local
and those nearby, a r e strongly sheared
There a re two major shear d i rec t ions
the l a t t e r being associated w i t h the
y massive magnetite and specular hema-

12.
t i t e veins.
c r e s t , possibly due t o the paucity of outcrops.
Shearing of this magnitude i s not found elsewhere along the
I t i s suggested t h a t the quartz and meta l l ic minerals f i l l e d open
tension f r a c t u r e s produced by the intense shearing/faul t i n g i n this a rea .
This mineralization may be of s imi la r or ig in a s t h a t found by Johns-Manville
t o the e a s t of Mattagami's property, where quartz and molybdenite have f i l l e d
tension f r a c t u r e s i n a 100 m wide zone associated w i t h a major f a u l t .
Anomalies B and D ( J . Biczok, w r i t e r )
From June 12 t o 14, 1978 s o i l samples and radiometric readings were
taken along a g r i d i n the Blue Sky Creek area
i n i t i a t e d as a r e s u l t of three anomalous s o i l
d u r i n g 1977.
Soil samples were taken a t 25 meter spac
( see Figures 5 & 6 ) . T h i s
samples taken i n the area
ngs along 5 north-south 1 . and a t 100 m spacings on several iines outs ide the area. Radiometric
was
nes
readings were taken w i t h a TV-1A.at each sample locat ion and ex t ra samples
were taken along the l i n e s wherever radiometric response was h i g h .
The highest radiometric readings were found a t coordinates BLOO + 00.
T h i s proved t o be the r e s u l t of a grey clay bed a t l e a s t 10 m x 10 m.
T h i s l ayer was overlain by 10 cm of non-radioatt ive organic s o i l and was
exposed i n the t e s t p i t f o r a 40 cm d e p t h ( t h e lower l i m i t of the c lay i s
unknown). TV-1A readings were: T 1 100,000 cpm, T2 = 4600 cpm, T3 = 600
cpm. T h i s anomaly is presumed t o be the r e s u l t of the adsorption of uranium
by the clay and i s therefore thought t o have l i t t l e economic s igni f icance .
A more i n t e r e s t i n g anomaly was found i n the southeastern area of the g r i d .
Anomalous radiometric readings occur i n a NE-SW l i n e 200 m long and 10-20 m
wide. The highest reading was T i = 65,000 cprn, T2 = 2400 cprn, T3 = 500 cprn
a t coordinates 250E 315s. Average T i l e v e l s i n this area a r e 15,000 cprn.

13.
Other T 1 readings i n t h e anomaly range f rom 25 t o 47,000 cpm.
i s thought t o be r e l a t e d t o some under l y ing geo log ic f e a t u r e s ince i t
cross cu ts the l o c a l dra inage p a t t e r n and inc ludes a v a r i e t y o f s o i l s , ma in l y
brown sandy s o i l , b u t a l s o b lack organic s o i l .
Th is anomaly
Two o the r r e s t r i c t e d anomalies were found a t lOOW 300s ( T i = 37,000)
and a t 00 + 175s (TI = 25,000).
organ ic conten t o f t h e s o i l ; however, t h e former appears t o be a s i g n i f i c a n t
anomaly.
f o l l owup i s recommended.
a radon- in -so i l survey and an EM survey be done over t h e l i n e a r anomaly
(Anomaly D ) .
The l a t t e r anomaly may be due t o t h e h igh
A stream sediment sample (115s 517) was taken nearby and f u r t h e r
I t i s a l s o recommended t h a t f u r t h e r work, p o s s i b l y
Anomaly C (F igures 3 , 7 and 8)
Th is r a d i o a c t i v e anomaly i s l oca ted w i t h i n C Y 6 c la im, and occupies
an area o f 10 m by 40 m. M i n e r a l i z a t i o n i s p resent as y e l l o w and orange
s t a i n on sur face boulders (kasol I t e ) and cubic brown c r y s t a l s (wul f e n i t e ) . One t rench, 1.50 m by 1.20 m by 1.0 m deep was dug down t o bedrock,
b u t revea led unmineral ized, i n t e n s e l y weathered a l a s k i t e .
The anomaly has been probably produced by supergene a1 t e r a t i o n processes.
Th is i s suggested by t h e f a c t t h a t t he h i g h e s t r a d i o a c t i v e count r a t e s
(F igu re 7 ) were obta ined on t h e upslope end o f t h e anomaly, where t h e
t r e n c h was dug.
an a l i g n e d fashion, l ong axes p o i n t i n g downh i l l , i n a s l i g h t depression
The secondary m ine . ra l i za t i on coats boulders t h a t l i e i n
t h a t may be an i n t e r m i t t e n t stream bed.
I n a d d i t i o n t o t h e above f a c t o r s i t should be noted t h a t t h e rad iomet r i c
counts obta ined a t t he h ighes t r a d i o a c t i v i t y spot were T 1 = 90,000 cpm,
T2 = 300 cpm, T3 = 55 cpm (McPhar T V l A ) . For t h e uranium t o be a t

'671(760)
- 672(700)
* 683 (32)
*682(3501
I I I I I I 1 1 1
s o w 570 W 560W 550W 540W 530w 5 2 0 W 510W 5 0 0 W
720 SAMPLE LOCATION FIGURE 8
(123) URANIUM (ppm)
LOCATIONS BY PACE AND COMPASS SOIL SAMPLE SURVEY - ANOMALY I' C "
7 0 10 M
260s
270 S
280 S
290 S
300 s
310 S
3205
330 S
340 S
350 S

6
READINGS TVI A , T, ,cpm - 1000
LOCATIONS BY PACE AND COMPASS
9 I6
9 17 44
0 27 I8
6 . I I
6
12
20 10 40 I I 24 II 9 9
24
19 7 14 12
14 13 9
9 9
I 1 1 I I . I I I I
58OW 570W 560W 550W 546W 530W 520W 5lOW 500W - 0 10 M
FIGURE 7
SC I N TI b L0M.E T E R SU R V E Y A NO M A LY " C I'
260s
270s
280 S
290s '
300 s
31 0s
320 S

16.
radioactive equilibrium, a count of T 1 = 90,000, should have been combined
with T2 i n the thousands. This a l so implies t h a t the secondary uranium ' minerals a r e n o t accompanied by primary uranium mineralization.
Final ly , i t should be noted t h a t secondary uranium minerals, t h o u g h
not of economic importance and n o t giving a s t r o n g B i 2 1 4 response w i t h a
spectrometer, will give a strong radon-in-soil response.
Soil sampling was performed over t h i s locat ion in d e t a i l (Figure 8) .
T h i s i s discussed further in the sect ion on geochemistry below.
Anomaly E
Numerous spha le r i t e and galena-rich boulders were f o u n d along the
Caribou Creek and on a terminal g lac ia l deposit on CY 8 claim i n 1977.
The thick snow cover present on t he area i n June 1978 did not allow
any followup of the boulder anomaly, un t i l the very l a s t day of the 1978
exploration a c t i v i t y .
The geological t raverse was completed a t the base of the NW-SE ridge,
on the W side o f Caribou Creek.
intruding a l a s k i t e , with a h i g h content of spha le r i t e and galena was
encountered.
During the t raverse one 4 m wide mafic dyke,
The dyke s t r i k e s N48OE and d i p s 62ONW.
I t s cont inui ty was not ascer ta ined, due. t o the lack of outcrop.
Other s imi la r dykes, b u t containing l e s s v i s ib l e mineral izat ion, were
encountered during the t raverse . They a l l have s imi la r s t r i k e and d i p .
Quartz veins with h i g h content o f f l u o r i t e and beryl were a l so found
in the a l a s k i t e nearby the mafic dykes.
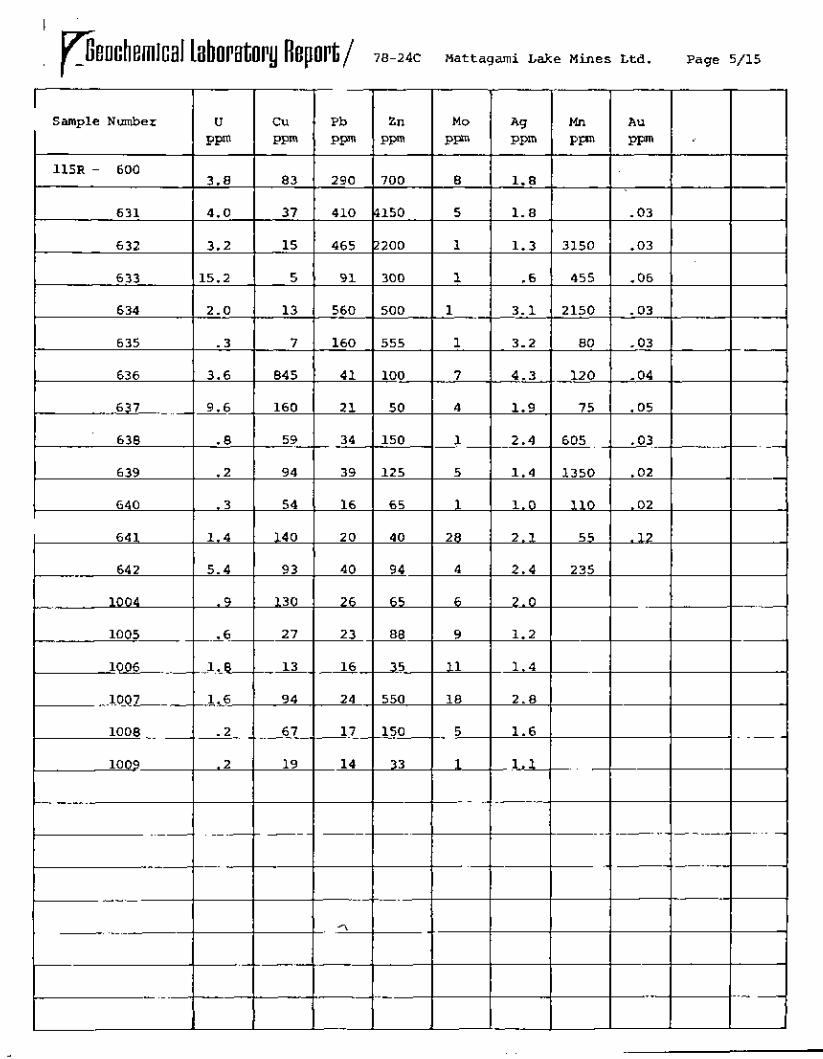
(Conclusions based on assay r e s u l t s o f rock samples; r e f e r t o
Figures 10 & 1 1 ) .

FIGURE 10
ROCK SAMPI FS - LOCATIO-NAAP

5 3 URANIUM ( p p m )
4 .O 3.2 15.2 2.0 0.3 3.6 9.6 0.8 0.2 0.3 1.4
.5.4
FIGURE I I \ R O C K S A M P L E S - U R A N I U M RESULTS

19.
CHAPTER FOUR
GEOCHEMICAL SURVEY
4-1 Methods
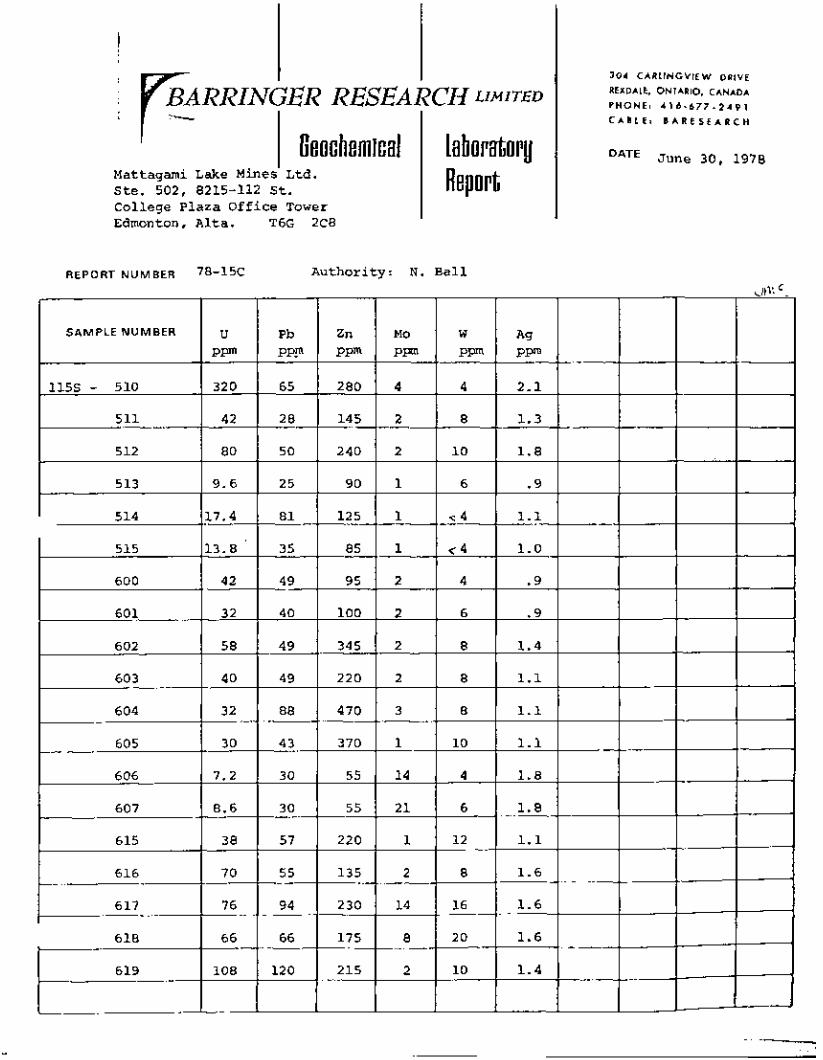
A s e t o f about 100 s t ream sediment samples a l o n g t h e main c reeks
and o v e r 200 s o i l samples i n areas o f uranium p o t e n t i a l were c o l l e c t e d .
A l l t h e s e samples were analysed f o r U, and many a l s o f o r Mo, Pb,
Zn, and Ag.
4-2 R e s u l t s
R e s u l t s a r e shown i n Appendices 1 & 2.
Sample l o c a t i o n and r e l a t e d uranium r e s u l t s a r e shown i n F i g u r e s
5, 8, and 9 .
S o i l sample l o c a t i o n r e s u l t s and r e l a t e d r a d i o m e t r i c ( s c i n t i l l o m e t e r )
r e a d i n g s on anomal ies B and D (B lue Sky Creek, CY 3 c l a i m ) a r e presented
i n F i g u r e 5 and F i g u r e 6.
S o i l sampl ing was a l s o completed on anonaly C, CY 6 c l a i m . R e s u l t s
a r e p resented i n F i g u r e 8.
The B lue Sky Creek g r i d was i n v e s t i g a t e d i n terms o f p o s s i b i l i t i e s
f o r economic c o n c e n t r a t i o n s o f uranium. However, t h e r e s u l t s i n t h e
two r a d i m e t r i c a l l y anomalous areas, anomal ies B and D, a r e o f t h e o r d e r
o f 100 ppm o r l e s s .
p o r t e d o r s o i l anomalies.
I t has t o be cons idered whether these a r e t r a n s -
S o i l sampl ing on anomaly C shows a zone o f s o i l w i t h 700 ppm
uranium,' c o n f i r m i n g t h e e f f e c t i v e n e s s o f s o i l sampl ing t o d e t e c t zones
o f uranium enr ichment . A narrow zone o f anomalous s o i l r e s u l t s i s
p r e s e n t , b u t a g a i n t h e problem i s whether t h e s o i l uran ium and r a d i o -
m e t r i c anomal ies a r e i n s i t u o r t r a n s p o r t e d anomal ies.

20.
CHAPTER FIVE
RADON I N SOIL SURVEYS
5-1 F i e l d Method
The radon con ten t o f s o i l s was measured by means o f a EDA RD 200
radon de tec to r . A h o l e i s made by means o f a s o i l auger. The d e t e c t o r
probe i s i n s e r t e d and s o i l gas pumped i n t o t h e d e t e c t o r . Three suc-
cess ive counts a r e taken t o a s c e r t a i n r e l a t i v e tho ron and radon 222
l e v e l s .
5-2 Resu l ts
Genera l l y success ive t h r e e minute counts gave r i s i n g count r a t e s
i n d i c a t i n g predominance'of uranium de r i ved radon 222.
Resu l ts a r e g iven i n F igures 12 and 13 f o r f i r s t one minu te count .
92 sample s i t e s were tes ted .
Reconnaissance r e s u l t s (F igu re 12) a re g e n e r a l l y s p o t t y w i t h
i n s u f f i c i e n t da ta t o determine zones. However a p a r t i c u l a r l y h i g h area *
e x i s t s on t h e eas t s i d e o f t h e C Y 2 c l a i m and should be f u r t h e r i n v e s t i -
gated.
The radon i n s o i l on t h e main g r i d , C Y 6 (F igu re 13) suggests t h e
p , o s s i b i l i t y o f a zone between 300 S and 400S, 500 S and 600 14, w i t h
i n excess o f 2000 counts pe r minute. Fu r the r da ta i n between would
he lp t o c o n f i r m whether t h i s zone i s present o r n o t .

.. I___-
AND --- RESULTS -
F I G I I R F : I 2
500 - 1000 cpm 6 > I O O O c p m .
- - --

B A S E L I N E
N 800
0 527(240) 700
0 528 (621) 600
0 575 (1996)
0 5 74 (749 1 0 5 73 1335)
5 71 1656) 0 00 570(4277) ' 572 (675)
569 12665) 0
0568 (919)
567 566(999)Q565 (a/)( I I 96281 Q
0 0 0 N
0 0 0
0 0 0 r[, 8 t rr,
0 0 PC
300
200
100
00
I00
2 00
300C
564 (25491 0 400
I 500 S
0 0
meters - 0 50 100
SAMPLES Q A r I BECOR DE R
5 2 7 - 5 3 2 JUNE OR8 J.B.
552-575 (E-E' TRAVERSE) JUNE 23/78 J. 0.
0 SAMPLE LOCATION
562 SAMPLE NUMBER
14/61 RADON COUNTS PER MINUTE FIRST R Z A D I N G
552 (112)
0 5531834)
5 5 5 (183)
0 55411347)
5561212) 0
0557(1531
05581636)
0559(51/)
0 560(2841
0 561 (7991
0 562(9801
.563(2159)
FIGURE 13
RADON IN SOIL
SURVEY
M A I N GRID
C Y 6 CLAIM

2 3 .
Stream sediments surveys over the whole property (Figure 9) give
the following anomalous values that require additional investigation:
551 0 320 ppm U 5792 420 pprn U 5793 180 pprn U 5796 200 pprn U 5798 340 ppm U 5621 , 622, 623 480, 480, 440 ppm U
The valves should be investigated by detailed stream sediment,
soil, radon and prospecting.

24.
CHAPTER 6
CONCLUSIONS
U , Zn and Pb anomalies were found in the Mattagami's property
in the Meir Mountain area, B. C., during the 1978 exploration program.
Uranium was found in the form of kasolite as surface staining
in an area of limited size.
One hand-made trench did not reveal any primary uranium
mineralization immediately below the uranium occurrence.
Selected samples from the occurrence, weighing from 0.5 kg to
1.5 kg, assayed up to lOlb./ton U308.
Detailed soil sampling was performed on the uranium anomaly
found in CY 3 during a radiometric traverse conducted in 1977 by
Mattagami. The survey revealed other anomalous uranium occurences in
the area, possibly related to a fault zone.
Zinc mineralization (sphalerite) was found in three separate
mafic dykes, within the alaskite, on CY 6 and CY 8 claims, with assays
up to 15% Zn.
Highly uranium anomalous stream sediment and water samples were
collected in CY 1 claim.
The CEM survey did not reveal the presence of any conductors
near the surface (see separate report: Report on the Electromagnetic
Survey, CY Claims, Weir Mountain Area; Atlin Mining District, B. C.;
Gledhill and Sutherland, 1978).
After the first phase of the 1978 exploration program, it is
recommended that the whole area be more completely prospected by ground
geological and radiometric traverses. In addition, magnetometer,
VLF and I . P. surveys are recommended to be carried over known Pb,

Zn and U occurrences within the property, on a test basis.
Trenching of anomaly "A" is also recommended.

26.
Breakdown o f Man-days Spent on Mattagami's Property,
During the 1978 Field Season up to the 25th o f June 1978
CY 1 claim
2
3
4
5
6
7
8
(9) not registerd yet
Eng 1
2
3
(LY 1) not registerd yet
(SAL 1 ) not registerd yet
(2) not registerd yet
Man - days
1%
6
14
15
1
29

27.
CERTIFICATION
I , Franco Morra, res iding a t 11234 - 72 Avenue, Edmonton, Alberta, do hereby c e r t i f y t h a t :
1.
2.
3.
I graduated w i t h a degree i n geology from the University o f Milan, I t a l y (BSc, Hon., 1972) and from the U n i v - e r s i t y of Alberta, Edmonton (MSc, 1977).
I have practiced my profession s ince 1972 and I am present ly employedby Mattagami Lake Mines Limited as an exploration geologis t .
To the best of my knowledge and experience a l l informa- t i o n contained w i t h i n the scope of this r e p o r t i s believed t o be accurate.
d& F . ' o r r a , B.Sc. , M.Sc. Expl orat ion Geoi ogi s t

28.
CERTIFICATE
I , William Mercer, of the City of Edmonton, Province of
Alberta, do hereby c e r t i f y t h a t :
1.
2 .
4.
5.
6.
I am a geologis t r i s i d i n g a t 11515 - 75 Avenue, Edmonton.
I am a graduate of E d i n b u r g h University, Scotland, w i t h a
BSc Hons (1968) i n geology.
I have been pract ic ing my profession f o r 4 years and am
a t present D i s t r i c t Geologist for Mattagami Lake Mines L t d .
i n Edmonton.
I am a fellow o f the Geological Association of Canada
and a member of the Society of Economic Geologists and
the Canadian I n s t i t u t e of M i n i n g and Metallurgy.
I supervised the work t h a t i s described i n this repor t .
Dated th i s 978

29.
APPENDIX 1

T A B L E 1
SOIL SAMPLES - MAIN G R I D
LOCAT I ON Pb PPm
68
56
52
;52
44
55
48
55
37
62
89
140
120
435
170
62
40
Mo PPm
W PPm
SAMPLE NO. U PPm 62.0
28
34
37
26
64
17
48
14
20
9.0
48
9.7
12.0
31
8.2
6.8
Zn PPm
280
2 90
265
230
290
41 0
800
375
240
390
245
1000
285
950
650
650
240
1000 N. B.L. (Weir Mtn. grid)
900 N. B.L. (Weir Mtn. g r i d )
800 N. B.L. (Weir Mtn. g r i d )
700 N. B.L. (Weir Mtn. g r i d )
600 N. B.L.
500 N. B.L.
400 N. B.L.
300 N. B.L.
200 N. B.L.
100 N. B.L.
00 N. OOW. B.L.
199 S. B.L.
200 S. B.L.
300 S. B.L.
300 S. B.L. + 50w
300 S. B.L. + l O O w
300 S. B.L. + 150w
7.2 2 628
629
630
631
632
633
634
635
636
637
638
639
640
64 1
642
643
644
6
1.2 2 4
1.3 1 4
1.5 3 14
1.5 4
1.7
1.5
1.2
1.2
1.2
1.1
1.4
1.5
1.8
1.4
1.3
1 .o
4
80
2
2
4
4
3 4
2 8
2 6
8
4
12
4
1 4

645
646
647
648
649
660
66 1
662
663
664
665
666
667
668
669
670
300 S. B.L. f 200w
300 S. B.L. f 250w
300 S. B.L. f 300w
300 S. B.L. f 350w
300 S. B.L. f 400w
300 S. B.L. f 450w
300 S. B.L. f 500w
300 S. B.L. f 525w
300 S. B.L. f 537w
300 S. B.L. f 550w
300 S. B.L. f 575w
300 S. B.L. f 600w
300 S. B.L. f 625w
300 S. B.L. f 650w
300 S. B.L. f 675w
300 S. B.L. + 700w
5.1
31
60
32
8.0
19
92
120
460
68
52
42
28
41
68
42
29
60
82
130
63
92
89
290
1550
245
31 0
44
52
35
91
33
225
255
445
405
165
335
465
1050
1125
875
1150
2550
3800
450
650
350
1.1 2
1.1 2
1.4 3
1.2 2
1.1 1
1 .o 1
1.2 2
1.1 1
1 .o 195
1 .o 5
1.2 2
1.5 1
2.3 1
1.1 1
1.4 2
1 .o 1
6
4
8
6
4
4
6
4
20
4
6
4
6
4
6
4

32.
APPENDIX 2
33.
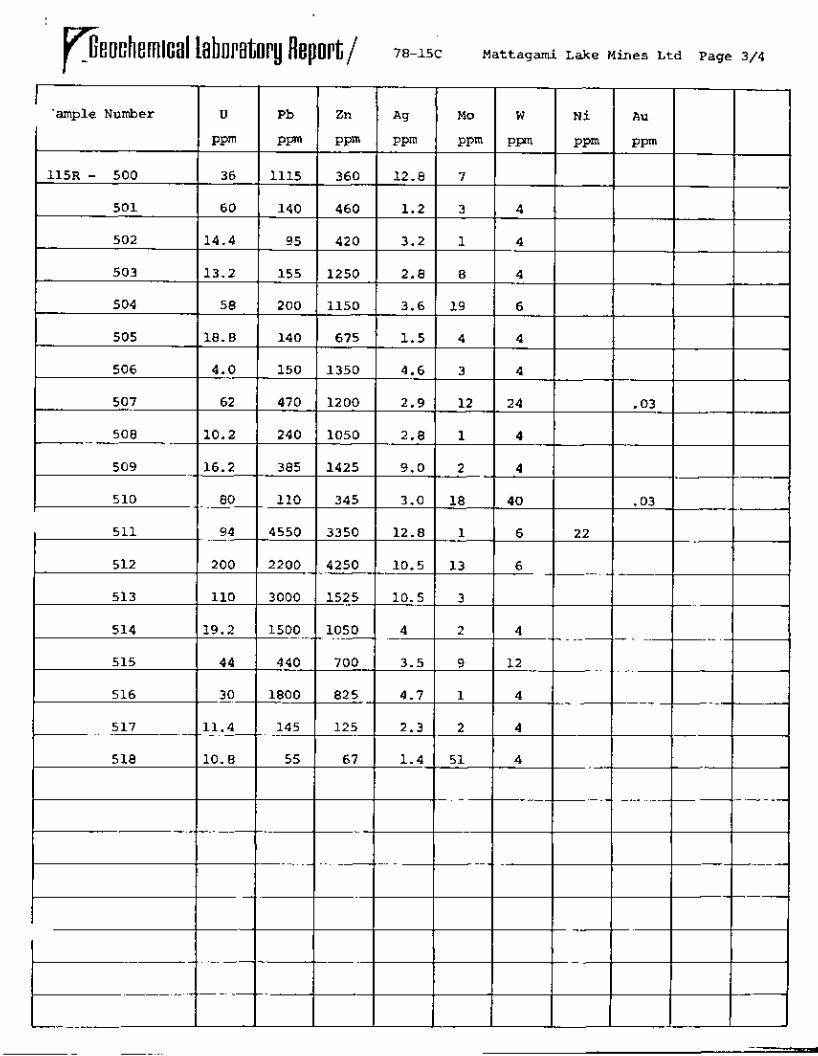
TABLE 2 SEDIMENT SAMPLES RESULTS
:- I .-- Geochemical I
Mattagami Lake Mines Ltd . S te . 502, 8215-112 S t . College P laza Of f i ce T o w e r Edmonton, A l t a. T6G 2C8
laboratory 1 Report
REPORT N U M B E R 78-15c Authority: N . B a l l
I
3 0 4 C A R L I N G V I E W DRIVE
REXDALE, ONTARIO, CANADA
P H O N E : 4 1 6 - 6 7 7 - 2 4 9 1 C A B 1 E: B A R E S E A R C H
DATE June 30, 1978

cal laboratory Report/ 78-15C M a t t a g a m i Lake M i n e s Ltd. Page 2/4


I
p o c h e m i c a l Lahoratory Report/ 78-24C M a t t a g a m i L a k e M i n e s Page 8/15
i
Sample N u m b e r U Pb Zn M o A53 W
Ppm PFpn Ppm ppm Ppm PW
b - I 115s- 1019 7.4 58 14 5 .7 28
102 0 6.2 51 12 5 .6 4 -

I ’
.

Mattagami Lake Mines Page l o l l 5

I
p o c h e m i c a l laboratory Report / 78-24C M a t t a g m i Lake M i n e s Page 11/15

U cu Pb Zn Mo A g Ni co Sample N u m b e r SOILS P P PPm PPm PPm PPm P W PPm. Ppm
115s- 755 24.0 57 725 1.7
W PPm
6

I '

. Y leochemica l _- laboratory Report / 78-24C Mattagami Lake Mines Page 14/15

SAMPLE NO.
115s 516
51 7
625
62 6
URANIUM (ppm)
46.0
54.0
320.0
440.0
' ..

45.
T A B L E 3 S O I L SAMPLES RESULTS


. r ~ e o c h e m i c a l laboratory Report/ 78-19C Mattagmi Lake Mines L t d . Page 215

I
, pmchemical laboratory Report / 78-19(3 att tag mi Mines Ltd* Page 3/5
mple Number: U Pb Zn Ag MO W PPm PPm PPm PPm PPm Ppm
115s- 676 22 315 455 .9 3 16
677 54 925 2100 1.5 86 40
678 240 1800 1100 1.6 330 200
67 9 140 780 1300 .9 115 40
680 110 745 1100 1.3 71 28
681 43 315 405 1.2 6 8
682 350 745 1325 2.3 6 8
683 32 69 355 1.2 1 4
685 700 2000 1475 1.4 180 4
6 86 12 0 800 900 2.4 58 80
687 30 935 950 1.8 130 60
688 200 1950 1625 2.5 89 40
689 96 760 1000 1.5 28 12
691 5.4 64 2 2 5 1.0 2 4
692 9.5 72 465 1.2 2 4
69 3 60 765 1850 1.9 27 12
694 43 395 1225 1.6 7 10
695 70 2 10 775 1.8 3 8
700 650 1400 1000 1.8 34 24
-

v geochemical Report/ 78-19C M a t t a g a m i Lake M i n e s Page 4/5

Page 5/5
d

SAMPLE NO.
115P 500
501
502
503
504
505
506
507
508
509
51 0
51 1
51 2
51 3
514
51 5
51 6
51 7
51 8
51 9
520
52 1
522
523
524
52 5
URANIUM (ppm)
176.0
6.4
2.4
1.6
52.0
52.0
178.0
240.0
58.0
52.0
58.0
1.8
98.0
38.0
3.6
1 .o 9.6
19.6
7.2
4.4
4.2
6.0
3.6
1.8
44.0
40.0
SAMPLE NO.
115P 526
527
528
529'
530
531
532
533
534 -
535
536
537
538
539
5 40
541
542
543
544
545
546
547
548
549
5 50
551
URANIUM (pprn)
52.0
42.0
70.0
36.0
56.0
138.0
116.0
118.0
144.0
62.0
17.0
54.0
80.0
172.0
13.2
82.0
64.0
50.0
110.0
10.0
19.2
2.6
7.4
106.0
94.0
34.0

SAMPLE NO.
115P 552
553
554
555
556
557
5 58
559
560
561
562
563
5 64
565
566
567
5 68
569
570
571
572
573
574
575
576
577
URAN I UM ( ppm)
28.0
13.8
36; 0
5.2
5.0
7.2
164.0
104.0
106.0
32.0
22.0
5.8
28.0
8.4
28.0
3.2
116.0
5.4
1.3
0.9
96.0
8.0
5.0
7.6
4.8
4 98
SAMPLE NO.
115P 578
579
580
581
582
583
84
585
586
587
588
589
590
591
592
593
594
595
596
597
598
599
600A
601 A
602A
603A
604A
605A
URANIUM ( ppm)
48.0
9.2
3.6
7.2
38.0
4.4
2.4
102.0
5.2
9.6
20.0
14.4
4.0
48.0
5.8
4.0
3.6
13.2
84.0
80.0
5.8
200.0
40.0
4.8
36.0
7.0
4.8
9.0

53.
TABLE 4 ROCK SAMPLES RESULTS
I
W
Ppm
4
4
4
6
4
4
24
4
4
40
6
6
4
12
4
4
4
p n c h e r n i c a l labora tory Report /
Ni
PPm
22
78-15C M a t t a g d Lake Mines L t d Page 3/4
115R - 500 36 1115
501 60 140
503
504
505
506
507
508
13.2 155
58 2 00
18.8 140
4.0 150
62 470
10.2 240
5 09
5 10
16.2 385
80 110
'ample Number
I Zn
PPm
Mo
PPm
Au U Pb
PPm
360 12.8 7
460 3 1.2
I 502 114.4 I 95 420
1250
3.2 1
8 2.8
1150 3.6 1 9
675 4 1.5
1350 4.6 3
1200 2.9 1 2
1
2
1050 2 .8
9.0 1425
345
3350
4250
3.0
12 .8
10.5
18
1
1 3
3
2
9
-03
1525
1050
700
4
3.5
82 5
125
67
4.7 1
2
5 1
2.3
1 .4

rEeochemica l - Laboratoryhport /
unple N u m b e r
115R - 500
501
502
503
504
505
506
507
508
5 09
5 10
511
512
513
5 14
5 15
516
517
518
U
PPm
60
14.4
13.2
58
18.8
4.0
62
10.2
16.2
80
94
200
110
19.2
44
30
11.4
10.8
78-15C M a t t a g a m i Lake M i n e s L t d Page 3/4

p o c h e m i c a l Laboratory Report / 78-15C Mattagmi Lake Mines L t d . Page 4/4
ample N u m b e r
- 19
520
521
522
523
524 - 527
U
DDm
4.4
96
10.4
13.0
80
1480
m m

t
I I I EARRINGER RESEARCH LIMITED
SAMPLE N U M B E R
ROCKS
115R- 643
304 CARLINGVIEW DRIVE REXDALE, ONTARIO, CANADA
P H O N E : 4 1 6 - 6 7 7 - 2 4 9 1 C A B L E : B A R E S E A R C H
U P W
649
650
93
15
652 23
654 . 2
1016
1013A
1014A
8.6
5.4 20
3.8 12
. :I-
i . I .. labor ator! Report
DATE J u l y 12, 1978
Mattagami Lake Mines Ltd. S t e . 502, 8215-112St. Edmonton, A l t a . T2G 2C8
REPORT NUMBER 78-24C Authori ty: N . B a l l
W P P
cu PPm
Mn Ppm
Ni co PPm PPm
63 43
73 5 1
37 27
62 43
2 1 1 4
38 27
12 5 49
. 60 60
100
60
644 I I 78
145
20
100
560
646A I I 15
64 7 I I 13
648 36
505
50
235
850
56 37
24 16
20 14
31 22 4
12 0
110
205
657 I 8.4 875
658 I - 2 760
4
4

t
p o c h e m i c a l laboratory Report / -- - -- - - . . . _ _ ... IU-L4C Mattagmi L a k e s Mmes Ltd Pg. 2/15
Sample N u m b e r U I ROCKS I PPm cu PPm
Pb Pw
4000 115R- 1015A 4.2
1016A 19.0
13
19
17
5150
5050
6900
1017 I *5
13 1018 .2
1019 1.9
1020 1.5
102 1 .2
1022 1.2
8 1550
10 1550
12 3400
11 3800
4400
450
26 1023 3.2
175
76 I 1026
13 3400
9 3200
81
75 165 1800 1 1.7

I
. Feuchemical Laboratory Report/ 78-24c Mattagami Lake Mines L t d . Page 3/15
ROCKS I 115R- 658
102 8
1029
1030
1031
1032
103 3
1034
1035
1036
r 1037
1038
1039
1040
1041
1042
1043
1044
1045

M a t t a g a m i Lake M i n e s Page 4/15
I ' 1 p n c h e m i c a l Laboratorg Report / 78-24C M a t t a g a m i Lake M i n e s L td . Page 5/15
Sample N u m b e r U cu Pb
I PPm PPm P P
03 290
631 4.0 37 410
632 3.2 15 465
115R - 600 3.8

i
peochemlcal laboratory Report / 78-24C M a t t a g a m i Lake M i n e s Page 6/15

--
-
MT. M C U Y * ..
27 +
CY I
FIGURE

