water pollution unit 14. pollution water pollution: change in water quality that makes it unsuitable...
TRANSCRIPT
Water Pollution
Unit 14

Pollution
Water pollution: change in water quality thatmakes it unsuitable for use:• chemical, biological, or physical
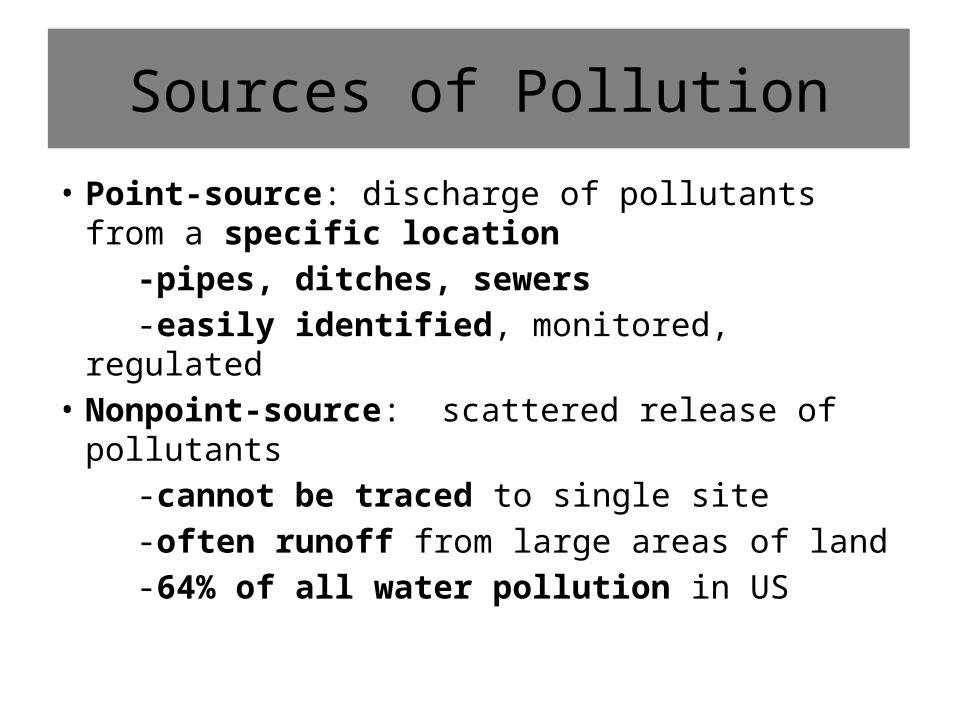
Sources of Pollution
• Point-source: discharge of pollutants from a specific location
-pipes, ditches, sewers -easily identified, monitored, regulated• Nonpoint-source: scattered release of pollutants -cannot be traced to single site -often runoff from large areas of land -64% of all water pollution in US
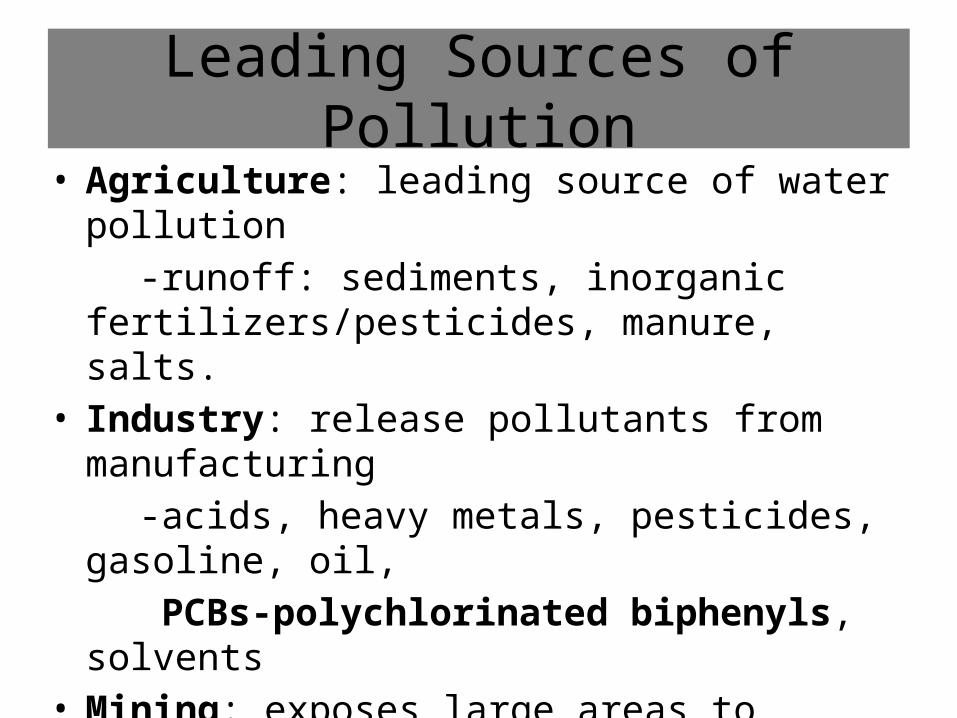
Leading Sources of Pollution• Agriculture: leading source of water pollution -runoff: sediments, inorganic fertilizers/pesticides,
manure, salts.• Industry: release pollutants from manufacturing -acids, heavy metals, pesticides, gasoline, oil, PCBs-polychlorinated biphenyls, solvents• Mining: exposes large areas to erosion -runoff carries sulfuric acid, arsenic, cyanide (gold), heavy metals from rock layers
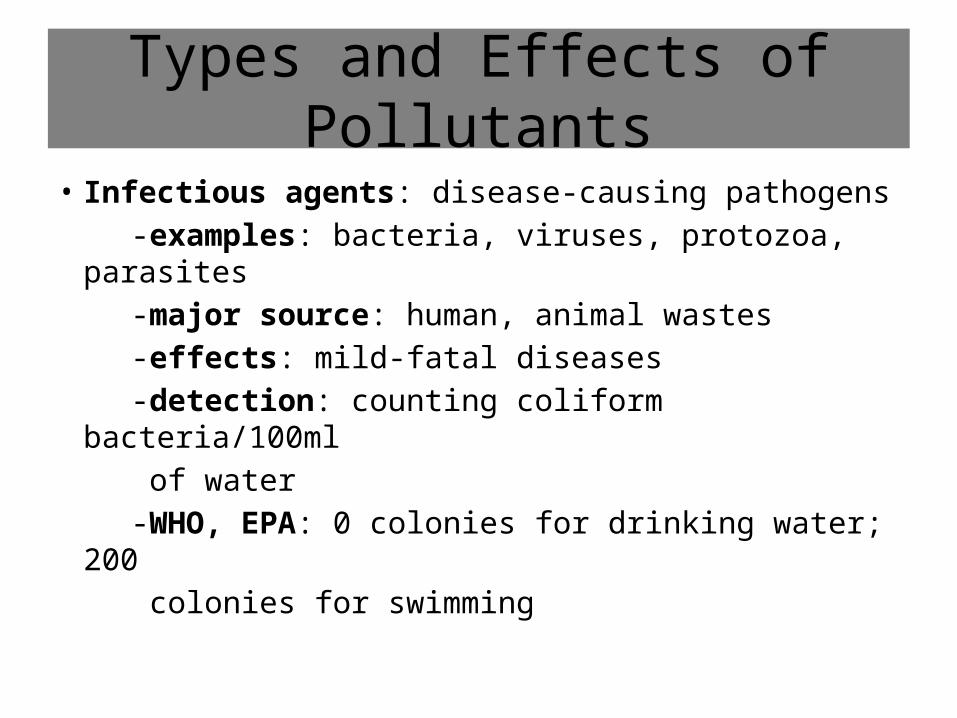
Types and Effects of Pollutants
• Infectious agents: disease-causing pathogens -examples: bacteria, viruses, protozoa, parasites -major source: human, animal wastes -effects: mild-fatal diseases -detection: counting coliform bacteria/100ml of water -WHO, EPA: 0 colonies for drinking water; 200 colonies for swimming

Table 21-2, p. 495

Coliform Count
A fecal coliform bacteriatest is used to indicatethe likely presence ofdisease-causing bacteriain water.
Figure 21-2
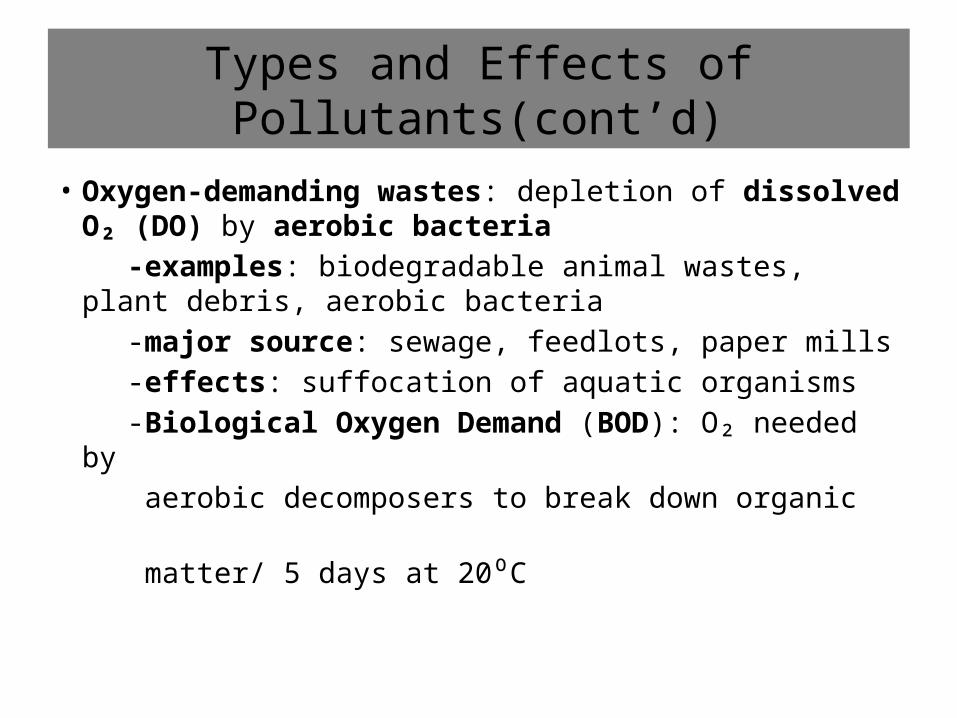
Types and Effects of Pollutants(cont’d)
• Oxygen-demanding wastes: depletion of dissolved O₂ (DO) by aerobic bacteria
-examples: biodegradable animal wastes, plant debris, aerobic bacteria
-major source: sewage, feedlots, paper mills -effects: suffocation of aquatic organisms -Biological Oxygen Demand (BOD): O₂ needed by aerobic decomposers to break down organic matter/ 5 days at 20⁰C

Types and Effects of Pollutants(cont’d)
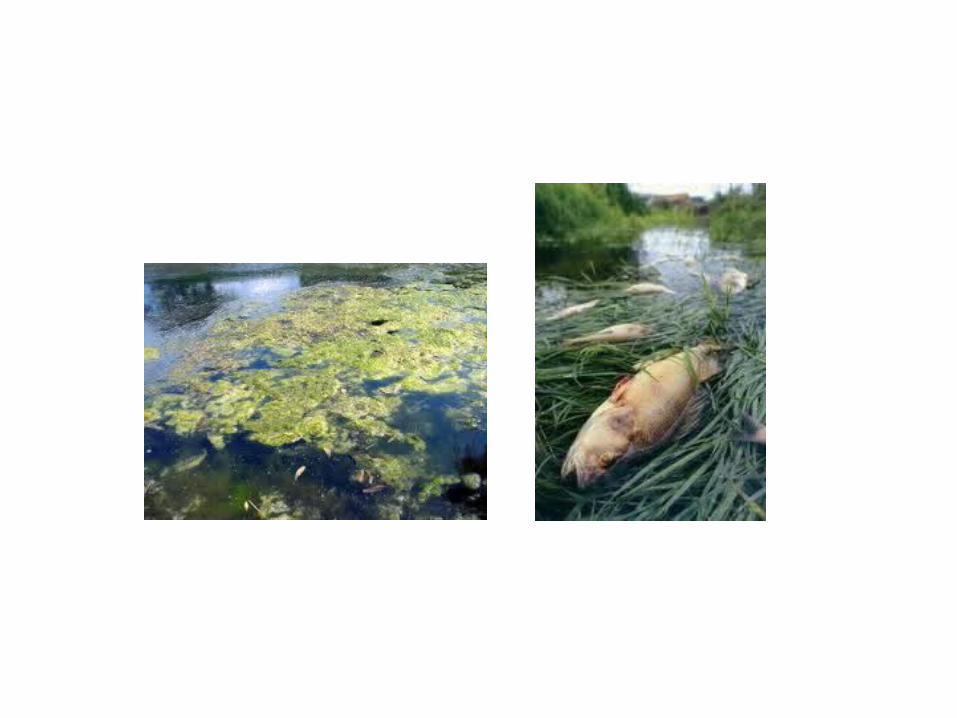
• Plant nutrients: cause excessive growth of algae.
-examples: nitrates (NO₃), phosphates (PO₄) -major sources: sewage, animal feedlots, inorganic fertilizers -effects: O₂ depletion/animal suffocation
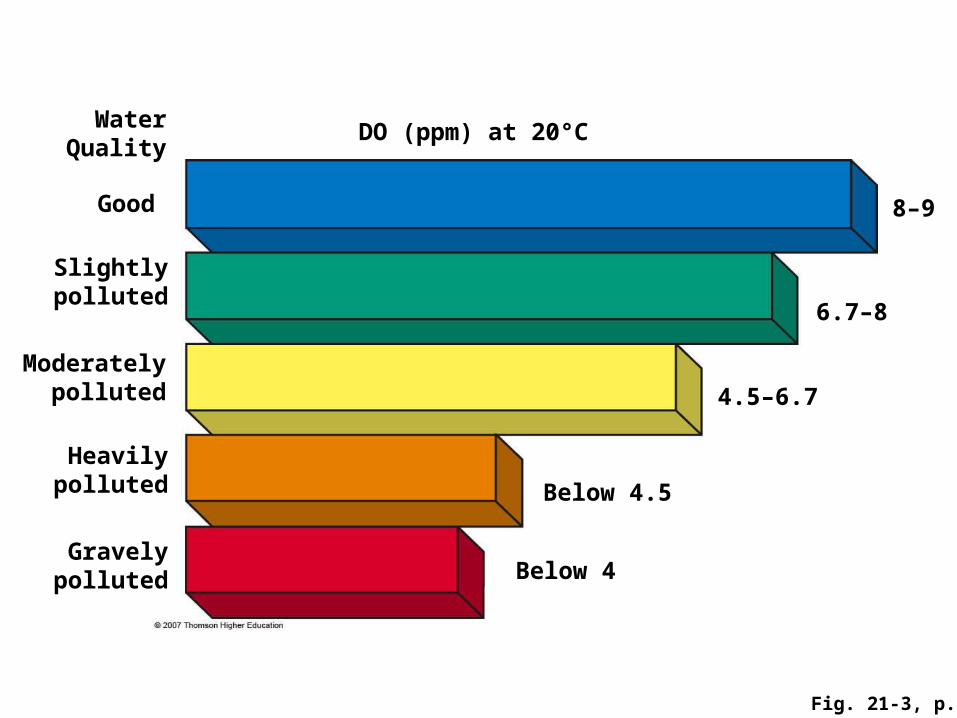
Fig. 21-3, p. 496
WaterQuality
Below 4
Below 4.5
DO (ppm) at 20°C
4.5–6.7
6.7–8
8–9
Gravelypolluted
Heavilypolluted
Moderatelypolluted
Slightlypolluted
Good

Types and Effects of Pollutants(cont’d)
• Inorganic and organic chemicals: add toxins to aquatic systems -examples: inorganic- acids, bases, salts, metals organic- oil, gasoline, plastic, cleaners -major sources: inorganic organic -effects: damaging to human health, wildlife -detection: chemical water analysis; indicator species presence (organic)
industry, households, farms
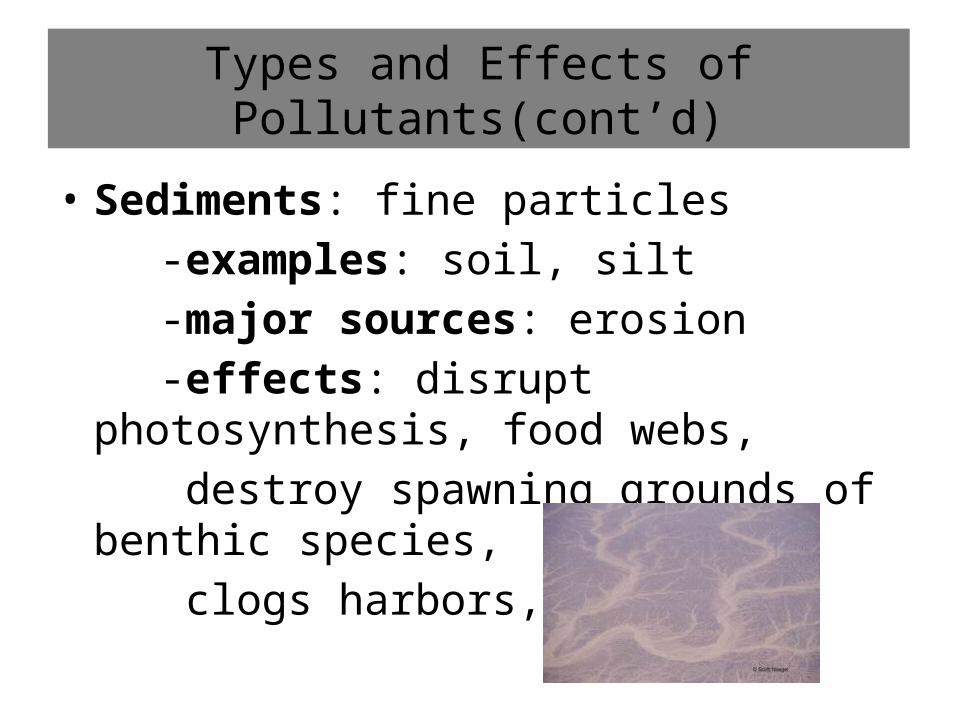
Types and Effects of Pollutants(cont’d)
• Sediments: fine particles -examples: soil, silt -major sources: erosion -effects: disrupt photosynthesis, food webs, destroy spawning grounds of benthic species,
clogs harbors, lakes
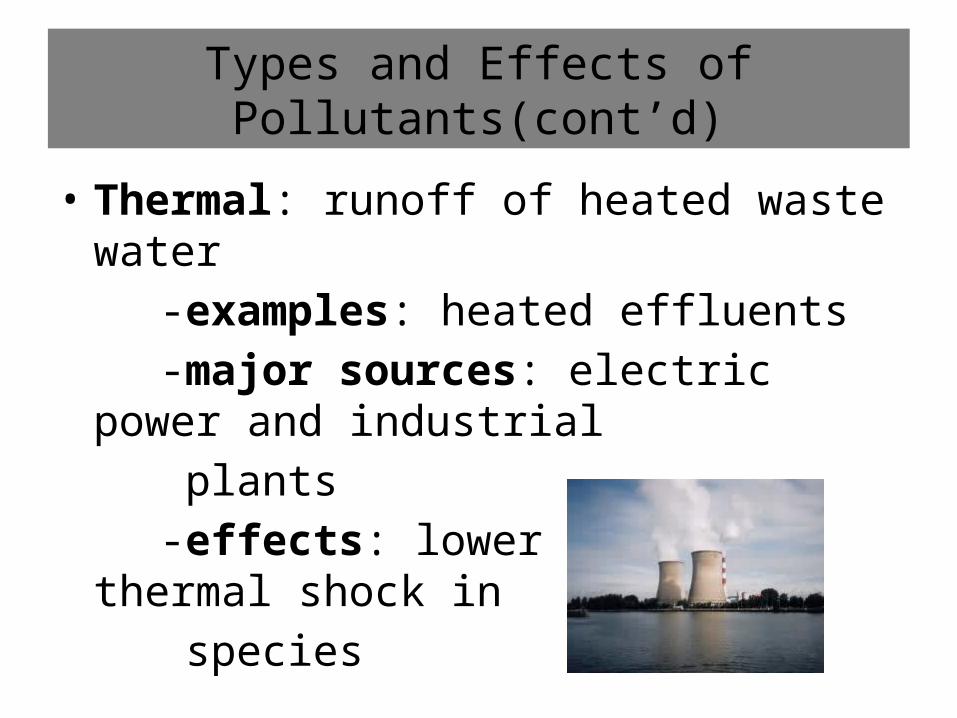
Types and Effects of Pollutants(cont’d)
• Thermal: runoff of heated waste water -examples: heated effluents -major sources: electric power and industrial plants -effects: lower DO levels, thermal shock in species
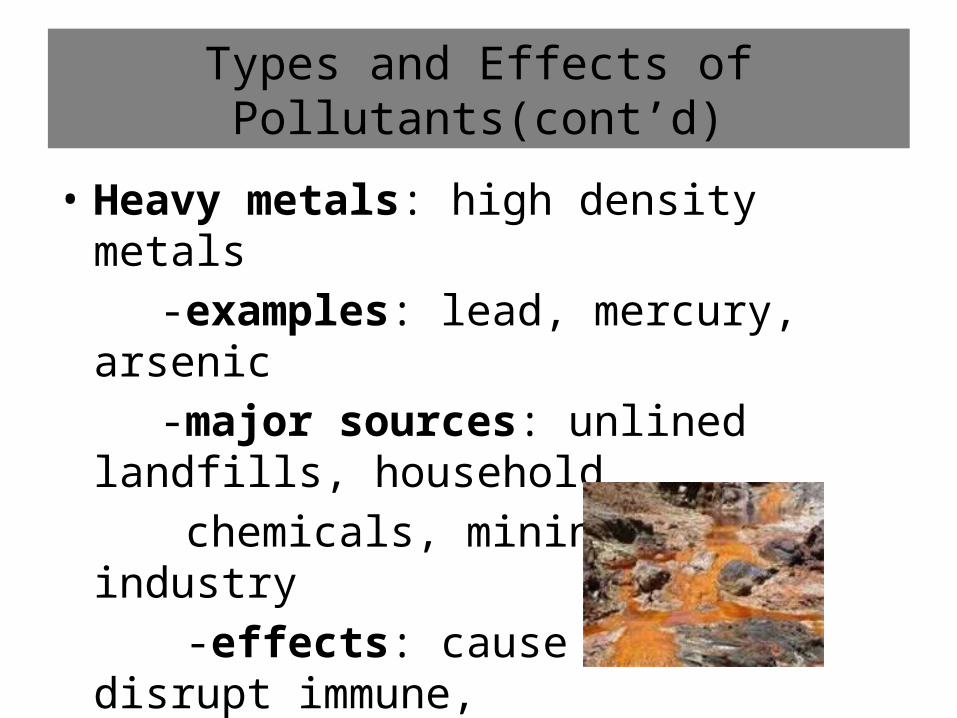
Types and Effects of Pollutants(cont’d)
• Heavy metals: high density metals -examples: lead, mercury, arsenic -major sources: unlined landfills, household chemicals, mining refuse, industry -effects: cause cancer, disrupt immune, endocrine systems

Pollution of Rivers and Streams
• O₂-demanding wastes (sewage, feedlot runoff) create an oxygen sag curve: occurs when
bacteria break down wastes, depleting O₂ • Fast moving water recovers from moderate
levels of degradable wastes via dilution• Slow moving water (drought, damming) cannot
recover from high concentrations of wastes• No water can dilute PCBs, pesticides, non-
degradable wastes (heavy metals)
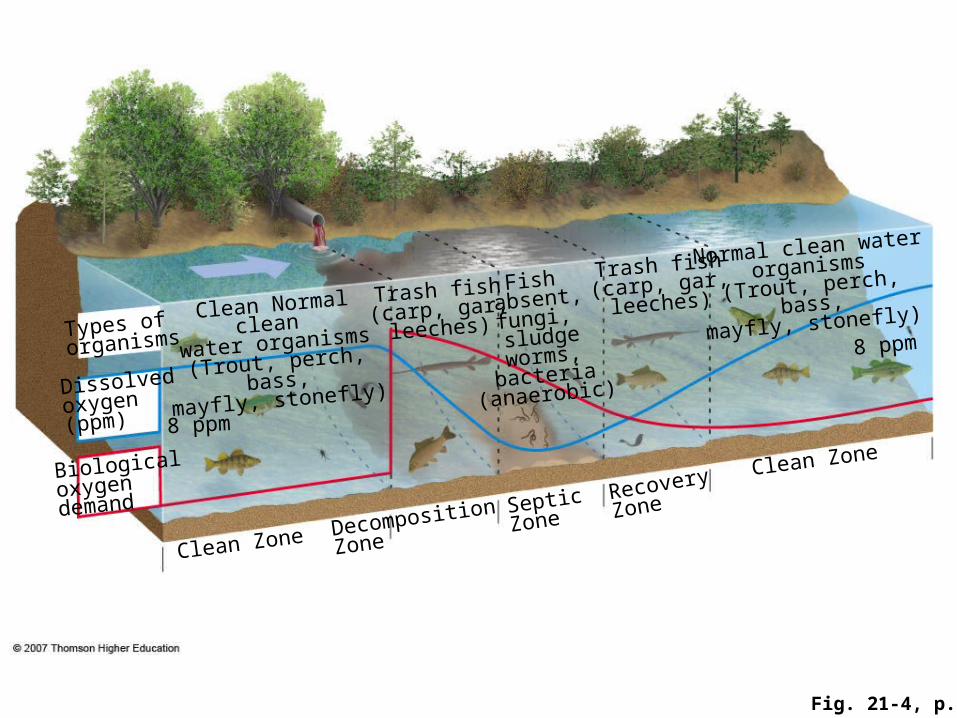
Fig. 21-4, p. 497
8 ppm
Biologicaloxygendemand
Dissolvedoxygen(ppm)
Types oforganisms
8 ppm
RecoveryZoneSeptic
ZoneDecomposition
ZoneClean Zone
Fish absent,fungi, sludgeworms,bacteria
(anaerobic)
Trash fish(carp, gar,leeches)
Clean Normal clean water organisms
(Trout, perch, bass,mayfly, stonefly)
Normal clean water organisms
(Trout, perch, bass,mayfly, stonefly)
Clean Zone
Trash fish(carp, gar,leeches)
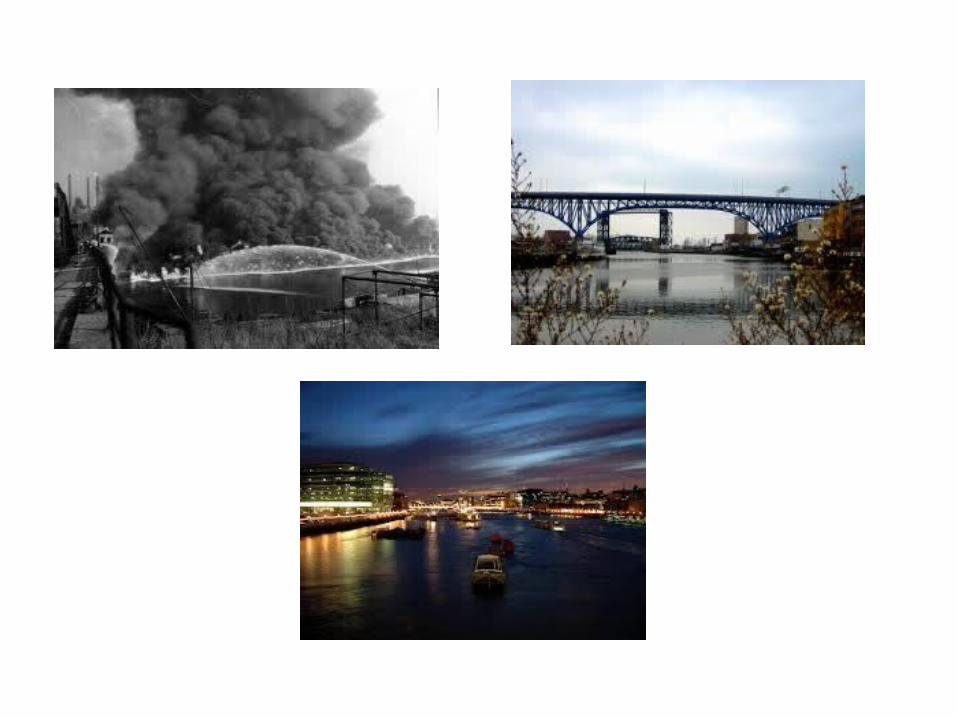
Developed Countries
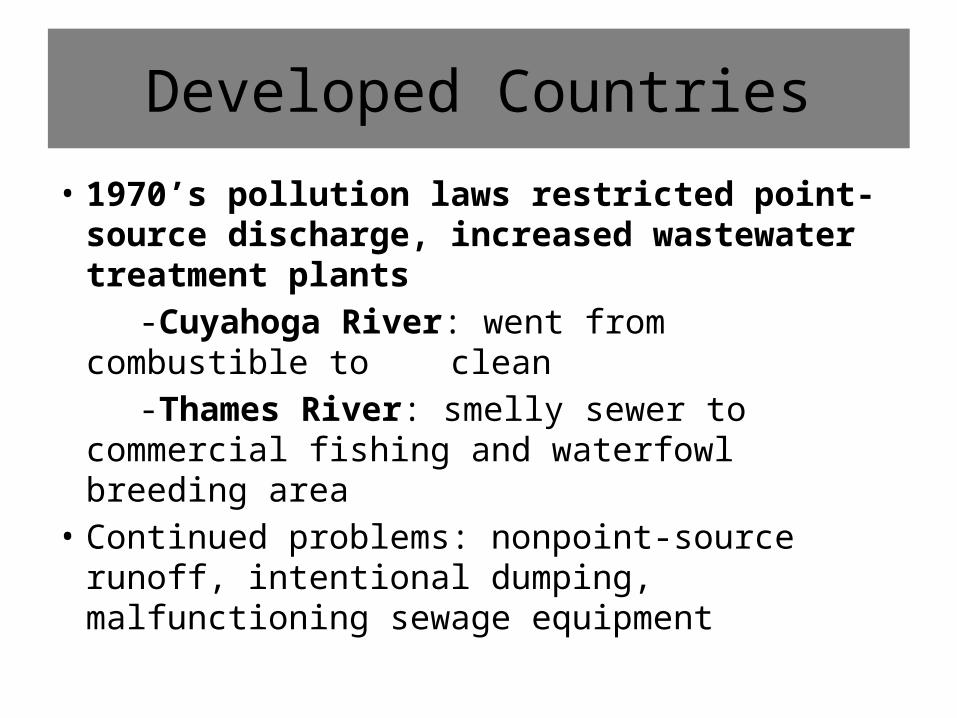
• 1970’s pollution laws restricted point-source discharge, increased wastewater treatment plants
-Cuyahoga River: went from combustible to clean -Thames River: smelly sewer to commercial fishing
and waterfowl breeding area• Continued problems: nonpoint-source runoff,
intentional dumping, malfunctioning sewage equipment
Developing Countries
• Half of globe’s 500 rivers are heavily polluted: -cannot afford wastewater treatment (raw
sewage dumped directly in water) -lack/do not enforce laws restricting toxic
discharging• China: 300 million people lack clean water (liver,
stomach cancers leading causes of death)• Latin America, Africa: most urban surface water
is severely polluted with toxins, garbage
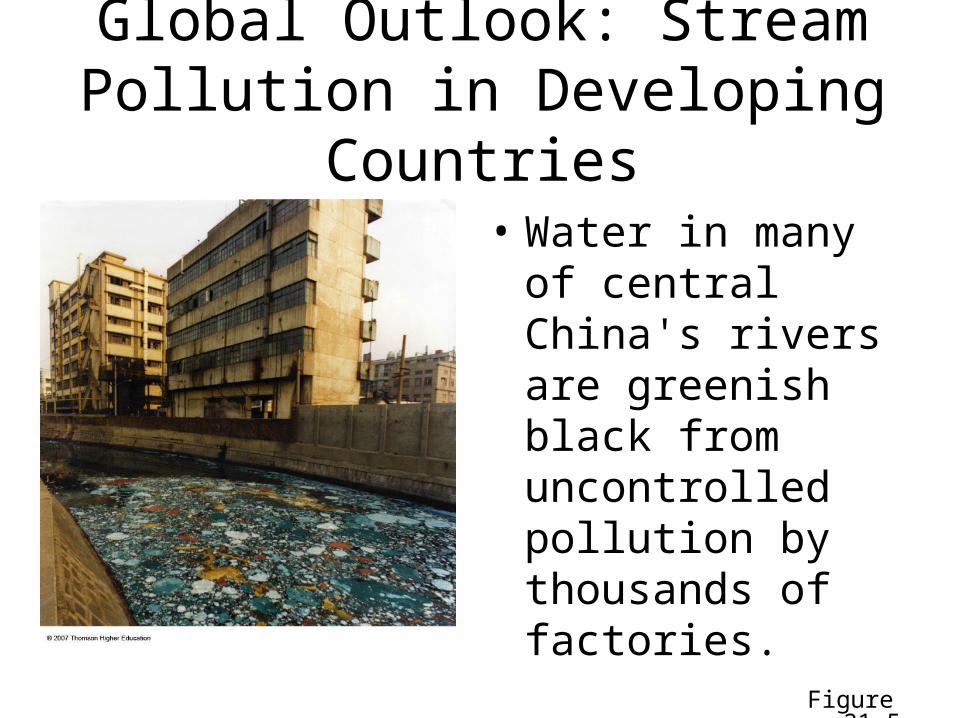
Global Outlook: Stream Pollution in Developing Countries
• Water in many of central China's rivers are greenish black from uncontrolled pollution by thousands of factories.
Figure 21-5

Case Study: India’s Ganges River
• Religious beliefs, cultural traditions, poverty, and a large population cause severe pollution of the Ganges River in India.– Very little of the sewage is treated.– Hindu believe in cremating the dead to free the soul
and throwing the ashes in the holy Ganges.• Some are too poor to afford the wood to fully
cremate.• Decomposing bodies promote disease and
depletes DO.

Case Study: India’s Ganges River
(Daily, more than 1million Hindus in Indiabathe, drink from, orcarry out religiousceremonies in the highlypolluted Ganges River)
Figure 21-6
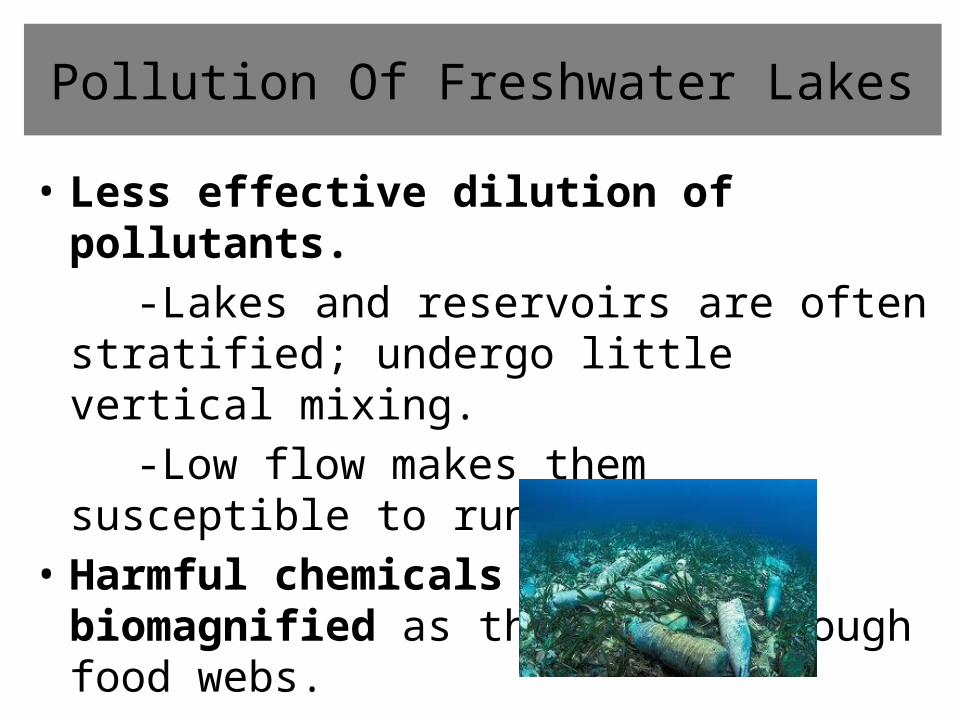
Pollution Of Freshwater Lakes
• Less effective dilution of pollutants. -Lakes and reservoirs are often stratified;
undergo little vertical mixing. -Low flow makes them susceptible to runoff.• Harmful chemicals are biomagnified as they pass
through food webs.
FYI:Cultural Eutrophication
• Unnatural input of plant nutrients in lakes -excess phosphates, nitrates runoff from cropland, lawns,
feedlots, untreated sewage• Nutrients create algal blooms -block solar radiation needed for photosynthesis -encourage growth of aerobic bacteria -leads to decreased DO; leads to decreased biodiversity(EPA: 85% of large US lakes are at some level of
eutrophication)

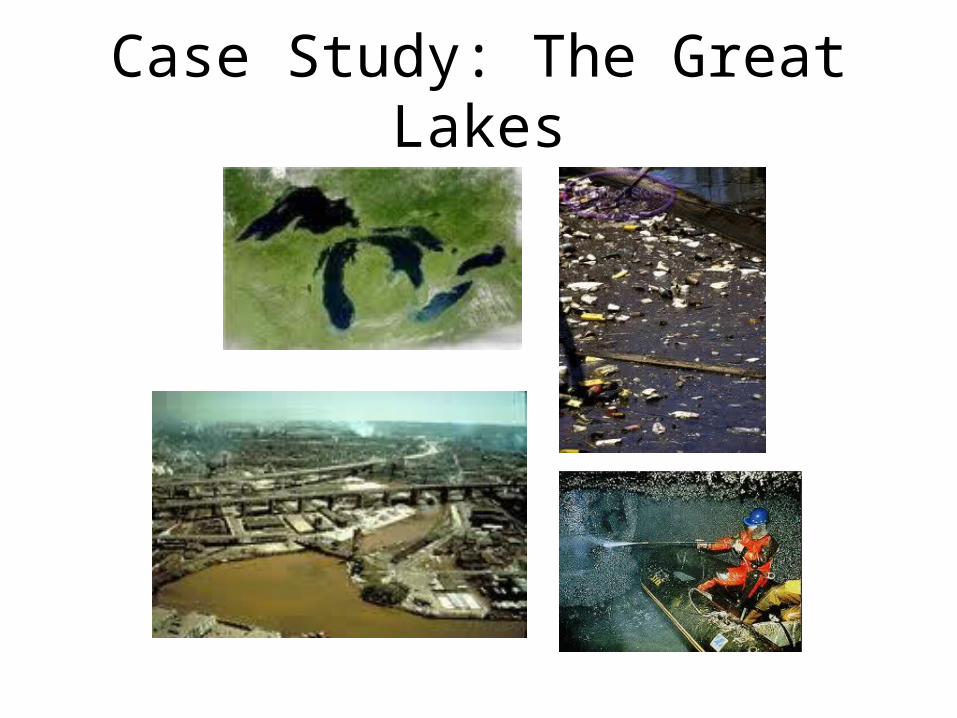
Case Study: The Great Lakes
• Cultural eutrophication: sewage (point source), fertilizers and detergents (nonpoint source)
• Industrial pollution: PCB’s, mercury (coal-burning plants), pesticides
• Removal of riparian (river) buffer vegetation• Biological pollution: Zebra mussels,(1972: Great Lakes Water Quality Agree-Ment- $20 billion to restore GreatLakes basin ecosystem)
Case Study: The Great Lakes

Case Study: Lake Washington
• Cultural eutrophication: pollutants from Seattle wastewater
• Community succeeded in diverting wastewater into Puget Sound
• 10 years later, water clarity improved, fish populations rebounded

Remediation/Prevention of Cultural Eutrophication
• Mechanical removal of lake weeds• Pumping O₂ into water to decrease depletion• Increasing riparian zones to prevent excess
nutrients from entering water• Removal of PO₄ and NO₃ from wastewater in
advanced treatment plants(all remediation measures are more expensivethan prevention)

Groundwater Pollution
(remember, groundwater is source of drinkingwater for 50% of US; 70% or more for globe)• Pollution sources: solvents, pesticides,
fertilizers, leaking fuel tanks• Few methods of naturally degrading/diluting
pollutants due to slow flow, low pop.s of aerobic bacteria
• Nondegradable wastes may remain in water for decades or permanently

Fig. 21-7, p. 501
Coal strip mine runoff
Polluted air
Deicing road salt
Pesticidesand fertilizers
Hazardous waste
injection well
Pumping well
Gasoline station
Water pumping well
LandfillSewer
Buried gasoline and solvent tanks
Cesspool, septic tank
Groundwater flow
Confined aquifer
Confined freshwater aquifer
Unconfined freshwater aquifer
Accidentalspills
Waste lagoonLeakage from faulty casing
Discharge
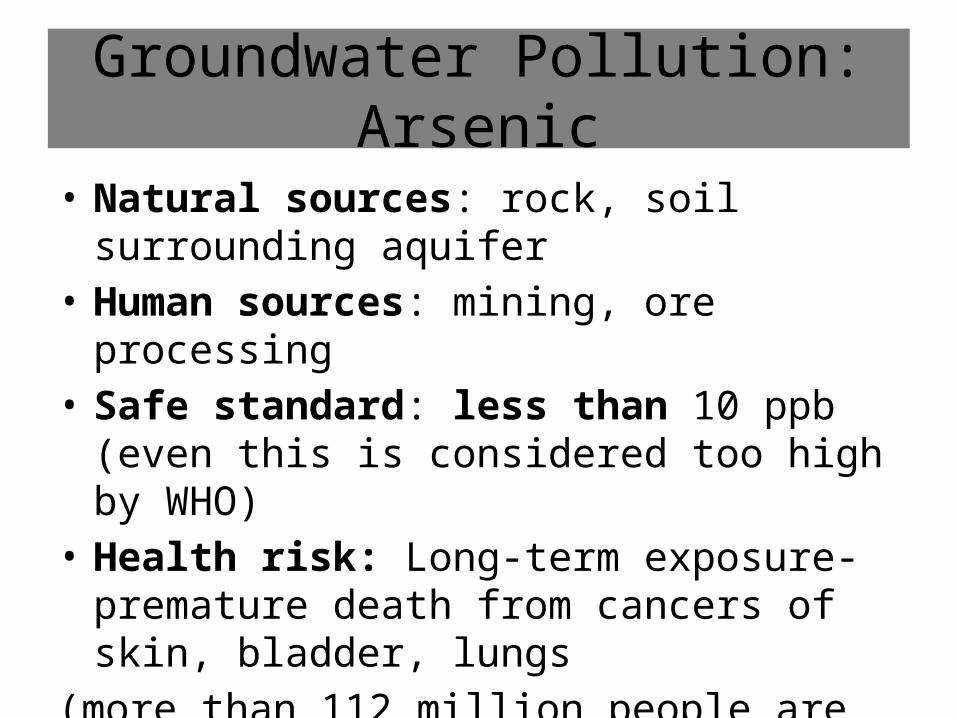
Groundwater Pollution: Arsenic
• Natural sources: rock, soil surrounding aquifer• Human sources: mining, ore processing• Safe standard: less than 10 ppb (even this is
considered too high by WHO)• Health risk: Long-term exposure-premature death
from cancers of skin, bladder, lungs(more than 112 million people are drinking waterwith As levels 5-100 times the 10 ppb standard-mostly in Bangladesh, China, and West Bengal, India)
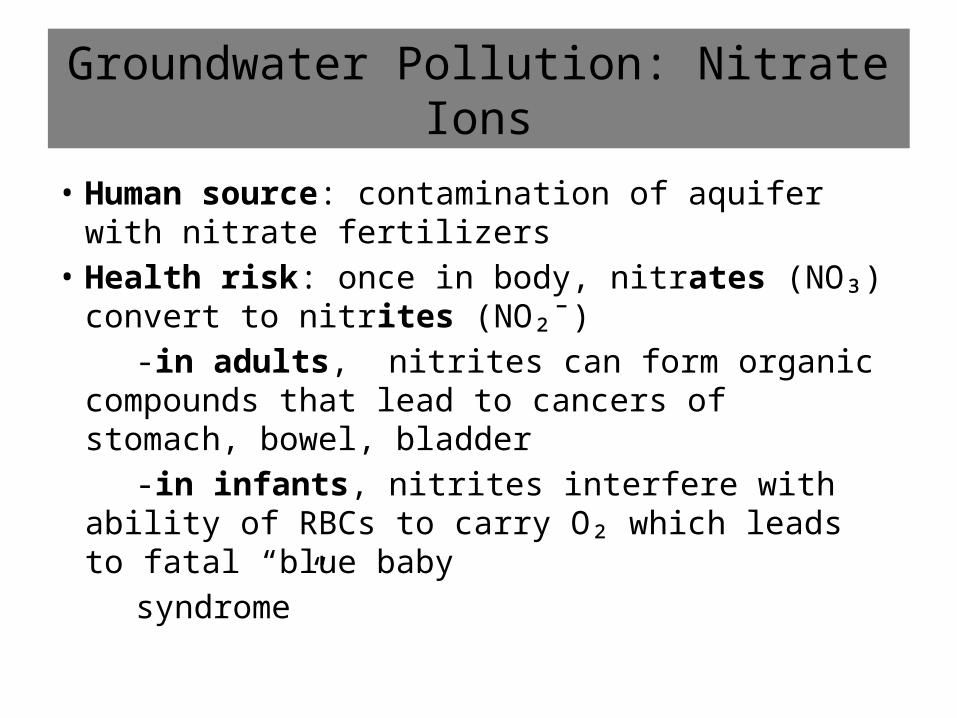
Groundwater Pollution: Nitrate Ions
• Human source: contamination of aquifer with nitrate fertilizers
• Health risk: once in body, nitrates (NO₃) convert to nitrites (NO₂¯)
-in adults, nitrites can form organic compounds that lead to cancers of stomach, bowel, bladder
-in infants, nitrites interfere with ability of RBCs to carry O₂ which leads to fatal “blue baby
syndrome”
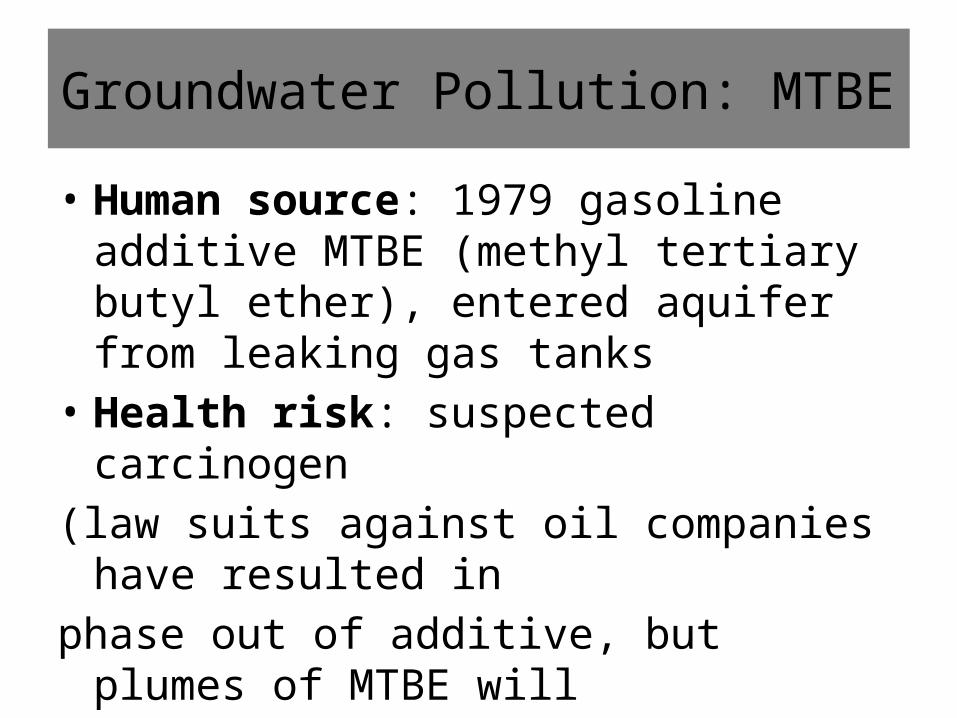
Groundwater Pollution: MTBE
• Human source: 1979 gasoline additive MTBE (methyl tertiary butyl ether), entered aquifer from leaking gas tanks
• Health risk: suspected carcinogen (law suits against oil companies have resulted inphase out of additive, but plumes of MTBE willstay in groundwater for decades)
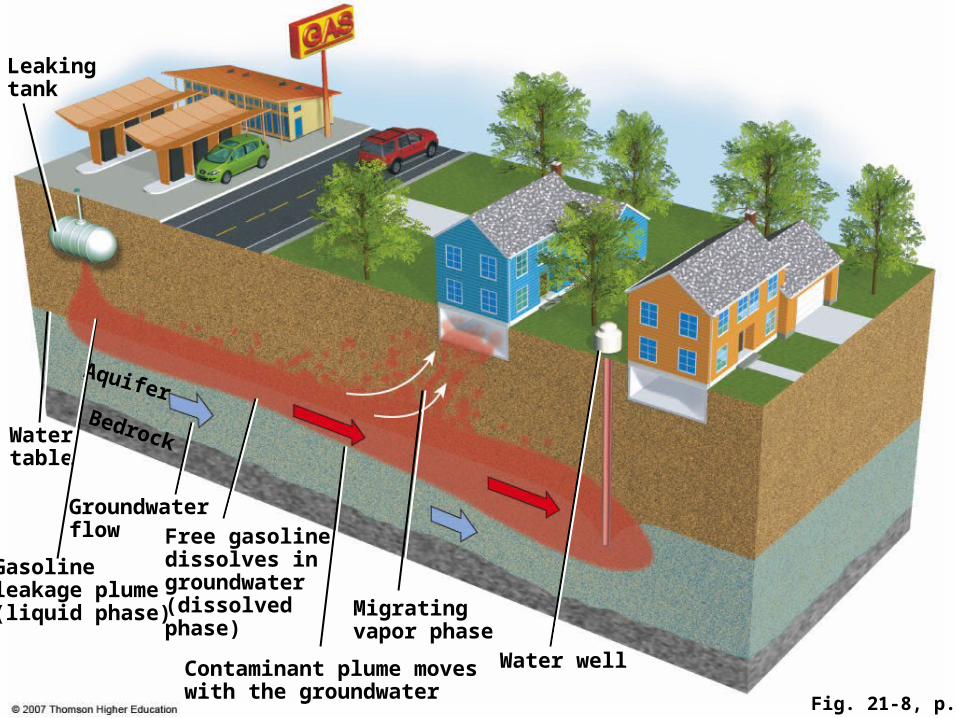
Fig. 21-8, p. 502
Aquifer
Water well
Migrating vapor phase
Contaminant plume moveswith the groundwater
Free gasolinedissolves ingroundwater(dissolved phase)
Groundwaterflow
Watertable
Gasolineleakage plume(liquid phase)
Leakingtank
Bedrock
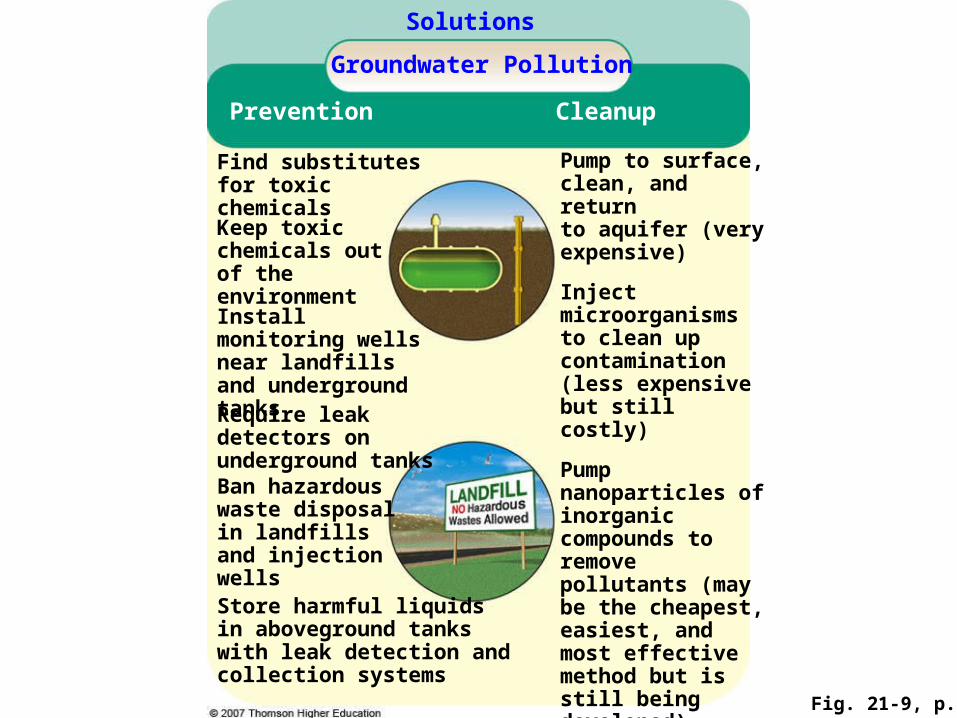
Fig. 21-9, p. 504
Solutions
Groundwater Pollution
CleanupPrevention
Find substitutes for toxic chemicals
Install monitoring wells near landfills and underground tanks
Require leak detectors on underground tanks
Ban hazardous waste disposal in landfills and injection wells
Store harmful liquids in aboveground tanks with leak detection and collection systems
Pump to surface, clean, and return to aquifer (very expensive)
Pump nanoparticles of inorganic compounds to remove pollutants (may be the cheapest, easiest, and most effective method but is still being developed)
Keep toxic chemicals out of the environment
Inject microorganisms to clean up contamination (less expensive but still costly)
Preventing Groundwater Pollution
• Find substitutes for toxic chemicals• Keep toxic chemicals out of environment• Install monitoring wells near landfills and
underground tanks• Require leak detectors on underground tanks• Store harmful liquids in aboveground tanks
with leak detection and collection systems

Clean Up of Groundwater
• Pump to surface, clean, and return to aquifer (very expensive)
• Inject microorganisms to clean up contamination (less expensive but still costly) Pump
• Pump nanoparticles of inorganic compounds to remove pollutants (may be the cheapest, easiest, and most effective method but is still being developed)
Rates of Waste Dilution
Freshwater’s ability to cleanse degradablewaste (fastest to slowest):1. River2. Lakes, ponds3. Aquifers

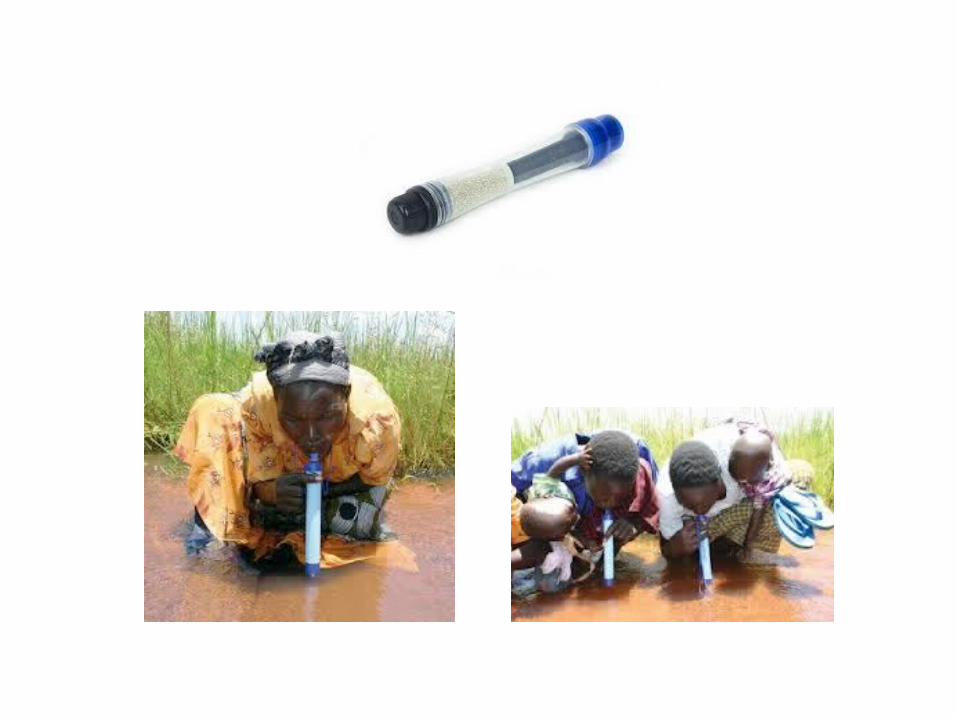
Providing Clean Drinking Water
• Laws that regulate, monitor drinking water• Recycling, purifying wastewater (Ca, Texas)• Collecting water in clear containers, allowing
UV radiation from sun to kill pathogens• Nanofilters for water bottles or plastic straws• Use of forests, wetlands for natural filtration

Water Quality Legislation
• 1977 Clean Water Act (Federal Water Pollution Act) -regulates point-source pollution from municipal sewage plants, industries
-1987 Water Quality Act- amended Clean Water Act to separate storm water/sewage lines
• 1974 US Safe Drinking Water Act- requires EPA to set standards of max containment levels for health harming pollutants
• 2002 Public Health Security and Bioterrorism Preparedness and Response Act- assess water supply’s vulnerability to intentional attack
Water Quality Testing Techniques
Physical Tests:• Temperature: impacts solubility of O₂, less DO
is found in hot water -most fish kills occur in summer -removal of riparian areas increases temp -coal-burning, nuclear plant create thermal pollution
Water Quality Testing Techniques (cont’d)
• River/Stream Flow Velocity: -fast-flowing water diffuses O₂ faster than
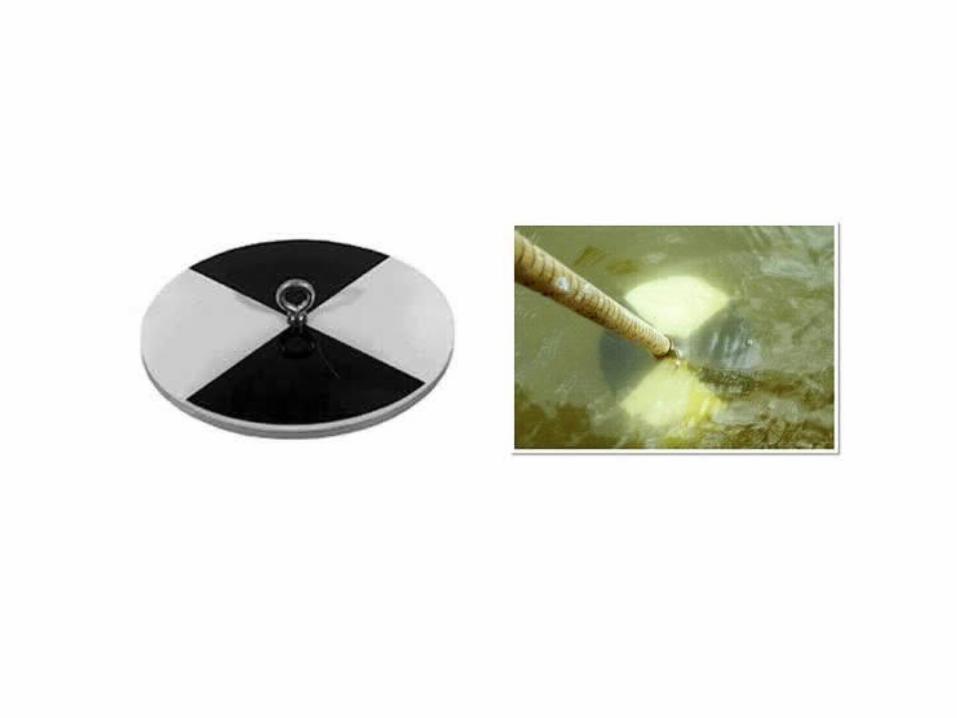
slow-moving water• Turbidity: measure of cloudiness by
suspended solids in a water column -sedimentation, algal blooms prevent
photosynthesis at base of food chain. -measured by Secchi disk

Water Quality Testing Technique (cont’d)
Chemical Tests: • pH: measures hydrogen ion concentration to
determine acidity/alkalinity -most organisms are best in pH btw 6-9• Dissolved Oxygen (DO): amount of available O₂
(regulates aquatic biodiversity) -most organisms are stressed if DO falls below 5ppm -highest in cold, fast moving water with lots of
phytoplankton
Water Quality Testing Technique (cont’d)
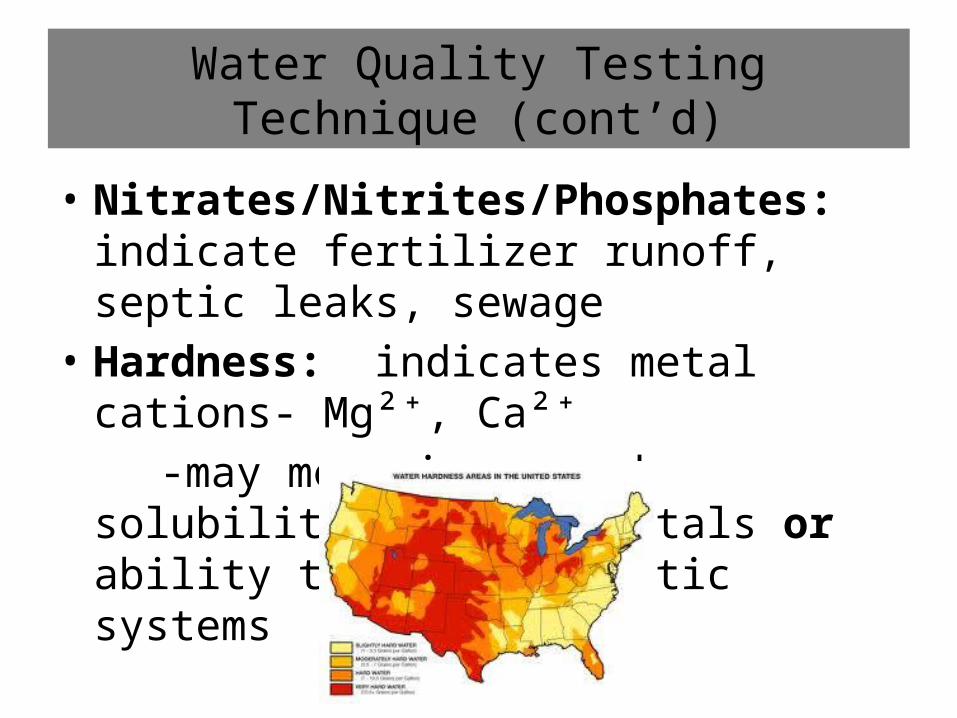
• Nitrates/Nitrites/Phosphates: indicate fertilizer runoff, septic leaks, sewage
• Hardness: indicates metal cations- Mg²⁺, Ca²⁺ -may mean increased solubility of heavy
metals or ability to buffer aquatic systems
Water Quality Testing Technique (cont’d)
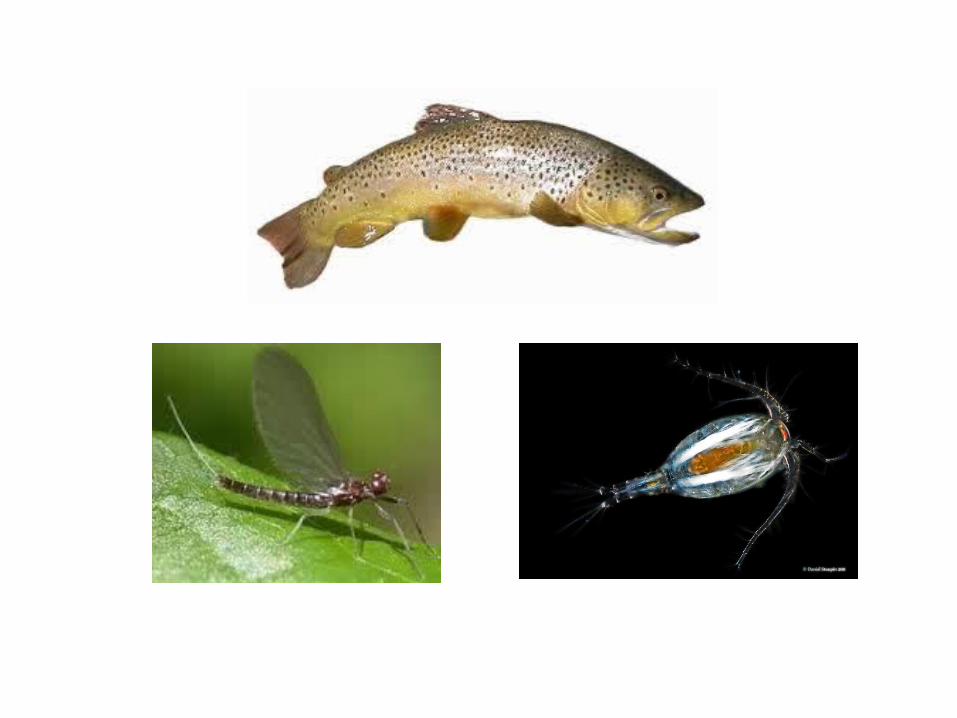
Biological Tests:• Fecal coliform: indicates septic tank leaks,
animal waste runoff• Biological Assessment: populations of specific
organisms are monitored for water health -benthic microinvertebrates- mayflies,
caddisflies, copepods (small crustaceans) -fish species- some species are sensitive to DO
levels (trout)
Ocean Pollution
• Oceans can dilute, disperse, degrade large amounts of degradable wastes.
• Coastal areas (mangroves, estuaries, and coral reefs) have greatest impact from dumped wastes.
-extensive colonies of viruses (ear, eye, throat infections)
-”floatables” (plastics) injure animals, leach harmful chemicals into water
-Agricultural runoff can create red tides- toxin secreting diatoms
Ocean Pollution -hypoxia: lower DO due to eutrophic coastal
conditions; “dead zones” (decomposing bacteria love these);
• Oil pollution: leaks of crude oil (from ground) or refined petroleum (gasoline)
-largest source: urban, industrial runoff -VOCs: volatile organic compounds kill larval forms
of ocean organisms -oil reduces buoyancy, insulation of marine
mammals, birds (results in heat loss, drowning) (study Sources of Ocean Pollution diagram)
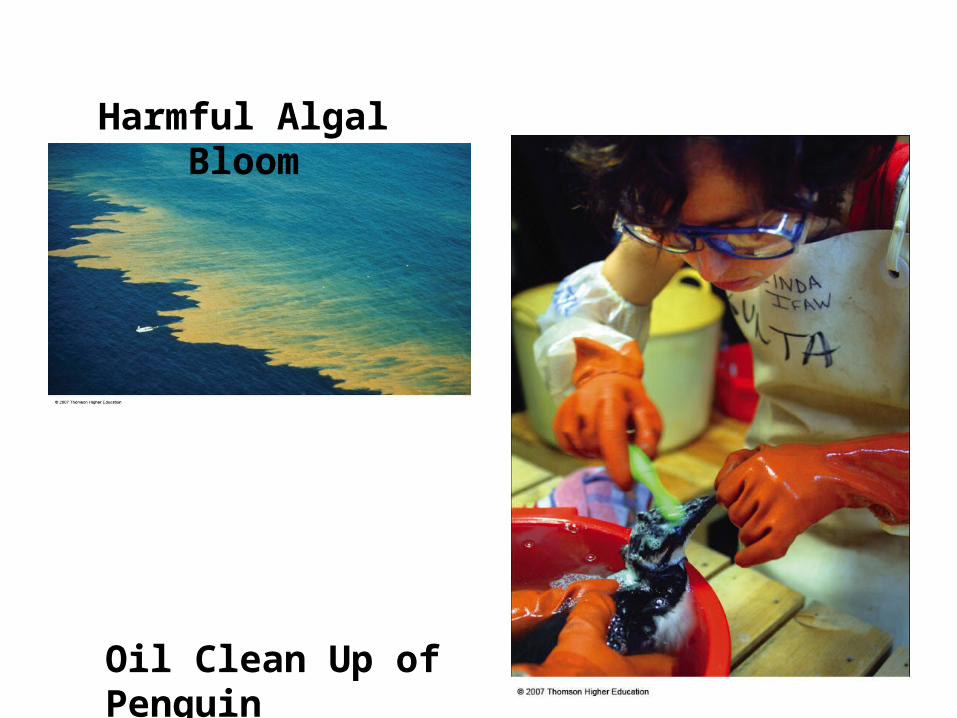
Harmful Algal Bloom
Oil Clean Up of Penguin
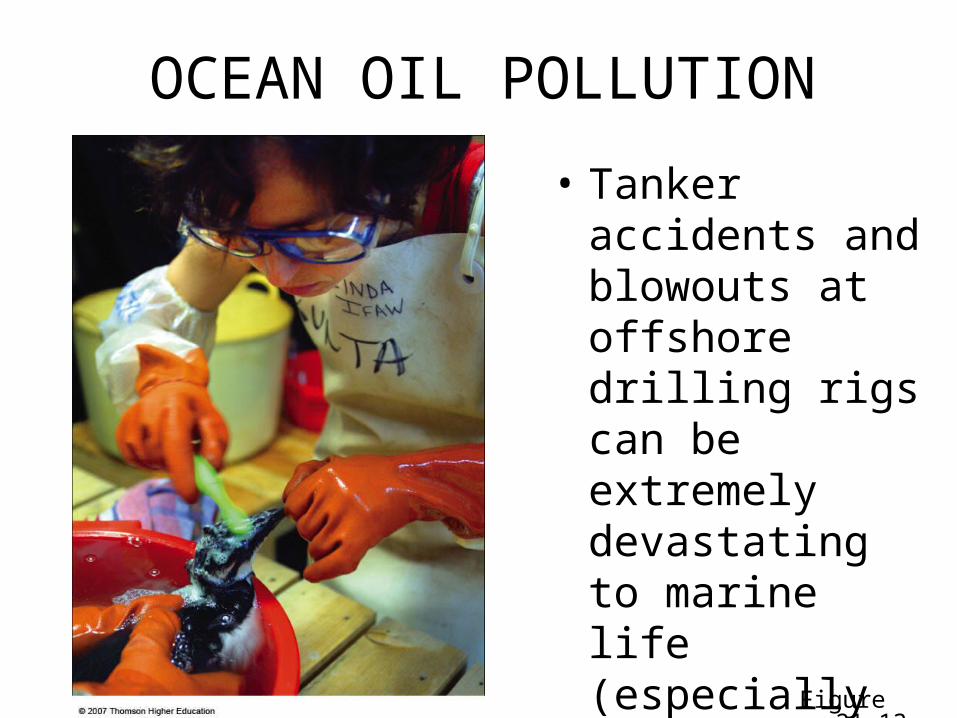
OCEAN OIL POLLUTION
• Tanker accidents and blowouts at offshore drilling rigs can be extremely devastating to marine life (especially diving birds, left).
Figure 21-13

Fig. 21-A, p. 507
Mississippi River
MississippiRiver Basin
Gulf of Mexico
Ohio River
Mississippi River
Missouri River
TX
MSLA
Depleted oxygen
LOUISIANA
Gulf of Mexico
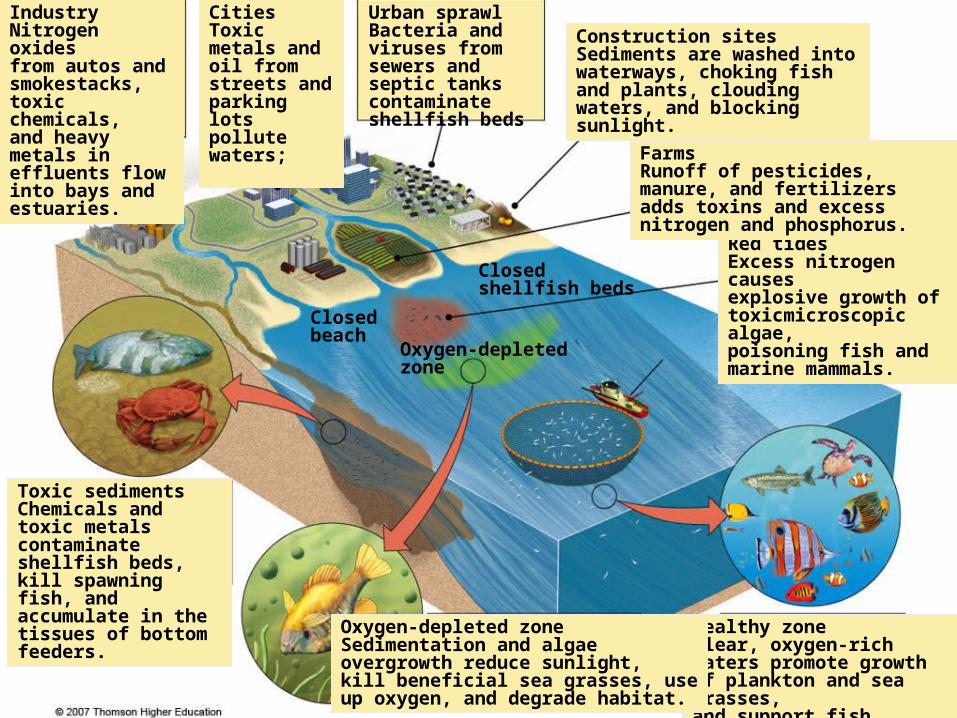
Fig. 21-10, p. 505
Healthy zoneClear, oxygen-richwaters promote growthof plankton and sea grasses,and support fish.
Oxygen-depleted zoneSedimentation and algaeovergrowth reduce sunlight,kill beneficial sea grasses, useup oxygen, and degrade habitat.
Red tidesExcess nitrogen causesexplosive growth of toxicmicroscopic algae,poisoning fish andmarine mammals.
FarmsRunoff of pesticides, manure, and fertilizers adds toxins and excess nitrogen and phosphorus.
Toxic sedimentsChemicals and toxic metals contaminate shellfish beds, kill spawning fish, andaccumulate in the tissues of bottom feeders.
Construction sitesSediments are washed intowaterways, choking fish and plants, clouding waters, and blocking sunlight.
Urban sprawlBacteria and viruses fromsewers and septic tanks contaminate shellfish beds
Oxygen-depletedzone
Closedbeach
CitiesToxic metals and oil from streets and parking lots pollute waters;
IndustryNitrogen oxidesfrom autos andsmokestacks,toxic chemicals,and heavy metals in effluents flow into bays and estuaries.
Closedshellfish beds
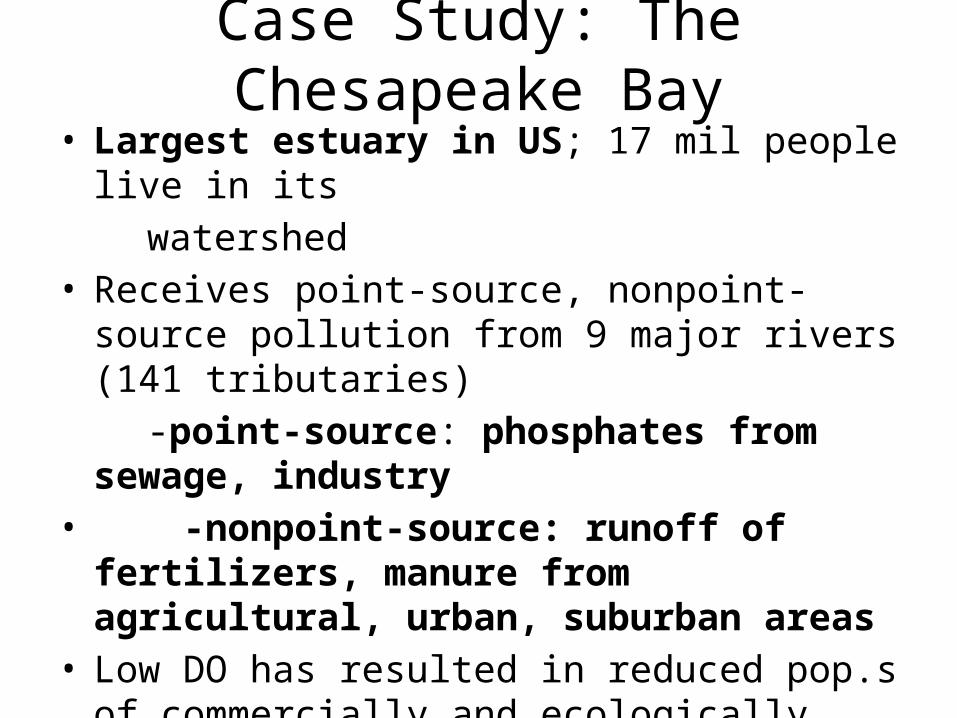
Case Study: The Chesapeake Bay• Largest estuary in US; 17 mil people live in its watershed• Receives point-source, nonpoint-source pollution
from 9 major rivers (141 tributaries) -point-source: phosphates from sewage, industry• -nonpoint-source: runoff of fertilizers, manure
from agricultural, urban, suburban areas• Low DO has resulted in reduced pop.s of
commercially and ecologically valuable species (oysters, crabs, fish)

Chesapeake Bay (cont’d)
• Remediation: banning phosphate detergents, upgrading sewage treatment plants, wetlands restoration (which do you think should come first?)

Fig. 21-14, p. 509
Reduce input of toxic pollutants
SolutionsCoastal Water Pollution
Prevention Cleanup
Use wetlands, solar-aquatic, or other methods to treat sewage
Require at least secondary treatment of coastal sewage
Sprinkle nanoparticles over an oil or sewage spill to dissolve the oil or sewage without creating harmful by-products(still under development)
Improve oil-spill cleanup capabilities
Recycle used oil
Regulate coastal development
Protect sensitive areas from development, oil drilling, and oil shipping
Ban ocean dumping of sludge and hazardous dredged material
Ban dumping of wastes and sewage by maritime and cruise ships in coastal waters
Separate sewage and storm lines
Require double hulls for oil tankers
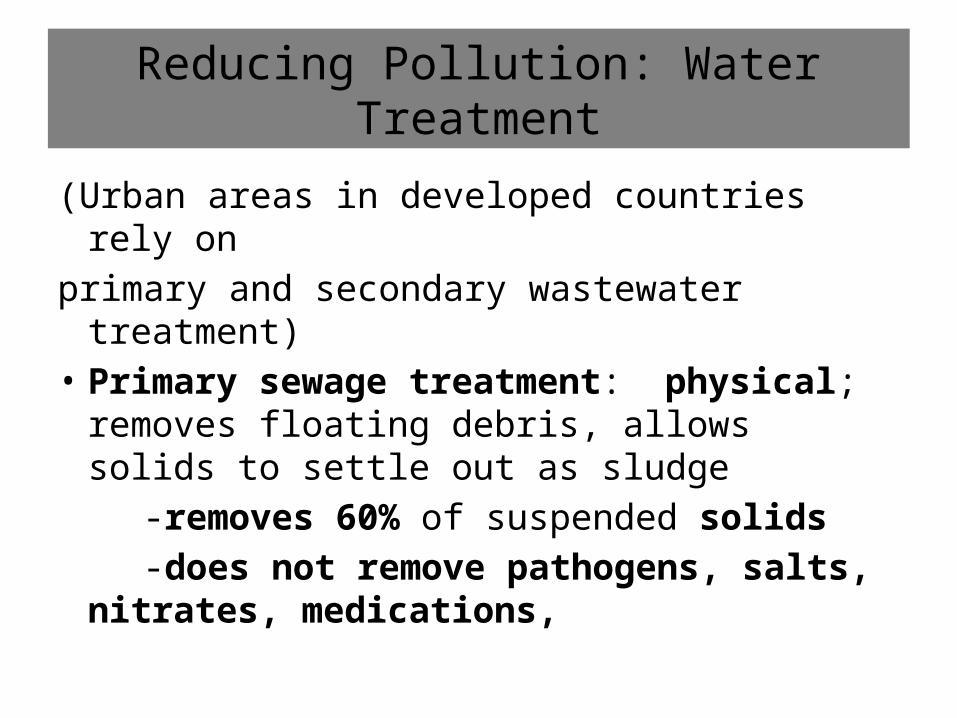
Reducing Pollution: Water Treatment
(Urban areas in developed countries rely onprimary and secondary wastewater treatment)• Primary sewage treatment: physical;
removes floating debris, allows solids to settle out as sludge
-removes 60% of suspended solids -does not remove pathogens, salts, nitrates,
medications,

Reducing Pollution: Water Treatment
• Secondary sewage treatment: biological; aerobic bacteria remove dissolved, biodegradable O₂-demanding waste
-water is bleached to remove infectious agents
-since chlorination can be harmful to health, ozone, UV light is sometimes used
-does not remove pesticides, medications
Reducing Pollution: Water Treatment
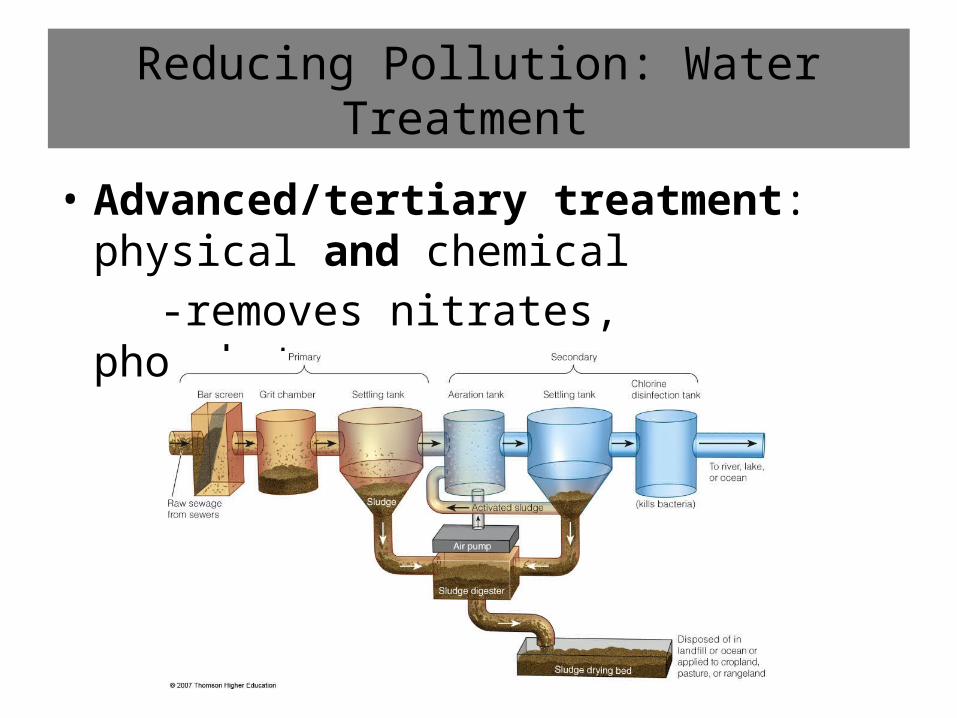
• Advanced/tertiary treatment: physical and chemical
-removes nitrates, phosphates
Further Treatment
1. Separate pipes for runoff of storm water and sewage 2. Treat sludge for toxins (organic/inorganic), use as
fertilizer 3. Require industry to remove waste before it reaches
municipal sewage line 4. Use natural, artificial wetlands to degrade, filter
sewage5. Use septic tank with large drainage field to degrade,
filter rural sewage
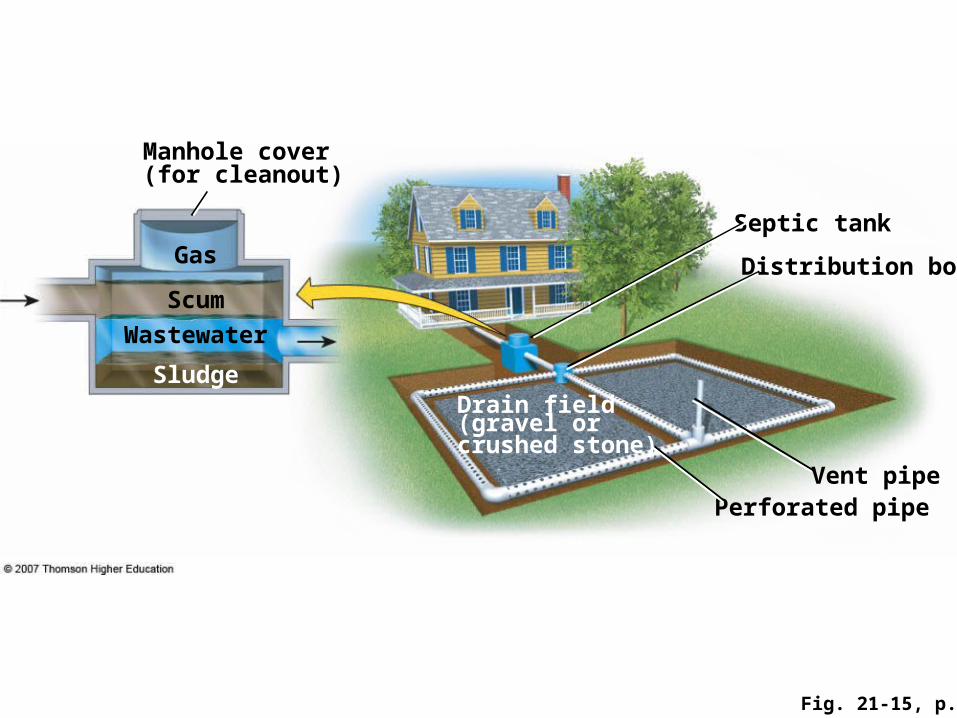
Fig. 21-15, p. 510
Distribution box
Manhole cover(for cleanout)
Vent pipePerforated pipe
Drain field(gravel orcrushed stone)
Septic tank
Sludge
Wastewater
Gas
Scum

Fig. 21-18, p. 517
• Prevent groundwater contamination
Solutions
Water Pollution
• Reduce birth rates
• Reduce poverty
• Reduce air pollution
• Practice four R's of resource use (refuse, reduce, recycle, reuse)
• Work with nature to treat sewage
• Find substitutes for toxic pollutants
• Reuse treated wastewater for irrigation
• Reduce nonpoint runoff
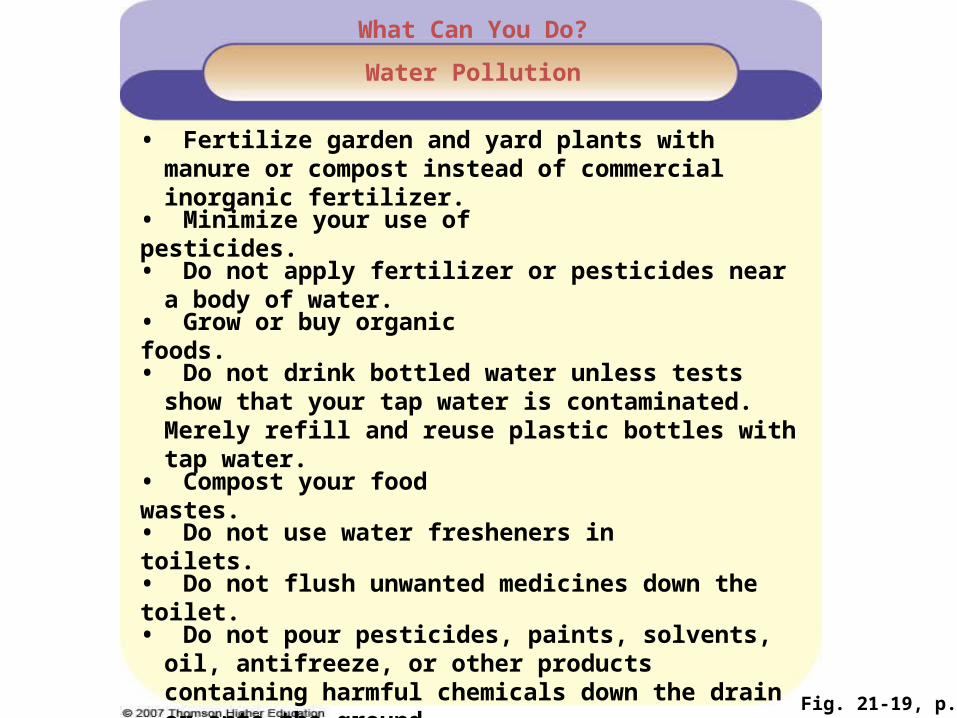
Fig. 21-19, p. 517
What Can You Do?
Water Pollution
• Fertilize garden and yard plants with manure or compost instead of commercial inorganic fertilizer.
• Minimize your use of pesticides.
• Do not apply fertilizer or pesticides near a body of water.
• Grow or buy organic foods.
• Do not drink bottled water unless tests show that your tap water is contaminated. Merely refill and reuse plastic bottles with tap water.
• Compost your food wastes.
• Do not use water fresheners in toilets.
• Do not flush unwanted medicines down the toilet.
• Do not pour pesticides, paints, solvents, oil, antifreeze, or other products containing harmful chemicals down the drain or onto the ground.
Exam Focus
• Sources of water pollution -which is largest, most difficult to treat?• Types of pollution, sources• Water-bourne diseases• Major human activities responsible for pollution• Measure that tells most about water health• Oxygen sag curve; know diagram• What Biological Oxygen Demand (BOD) measures
Exam Focus (cont’d)
• Cultural eutrophication• Natural sources of groundwater pollution;
manmade sources of groundwater pollution• Why groundwater pollution is difficult to
remediate (why doesn’t biodegradation happen)
• Ways to prevent groundwater pollution• Order (rates) in which surface, groundwater
clean themselves
Exam Focus
• Purpose of sewage treatment -primary (physical…) -secondary (biological…)• Affect of nitrates, phosphates on DO, “dead
zones”• Water quality laws (focus on Clean Water Act)• From Unit 4: oligotrophic lake traits (clear, but
low in nutrients)