water pollution. water pollution overview types, sources, effects, management
TRANSCRIPT
Water Pollution
Water Pollution Overview
Types, Sources, Effects, Management
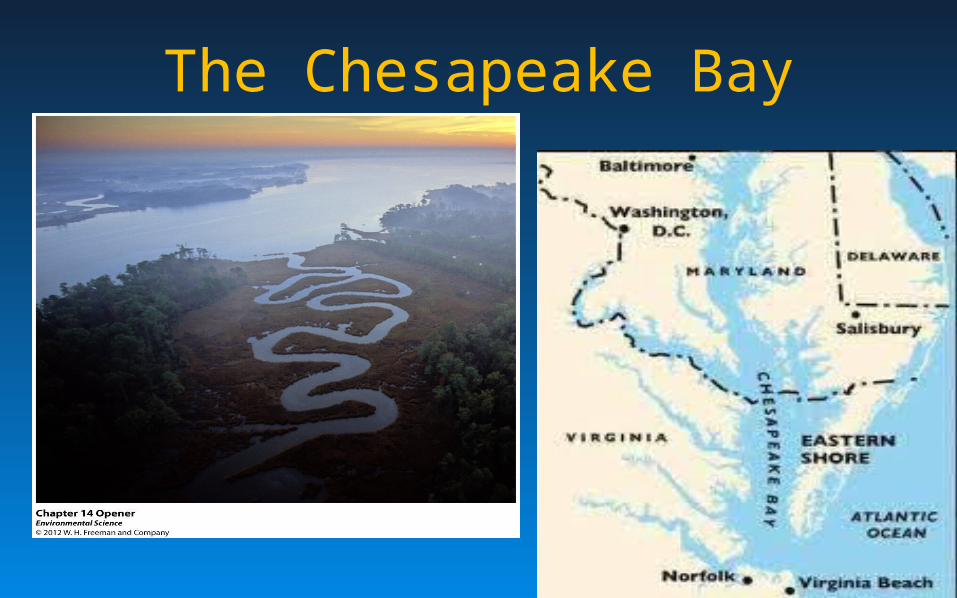
The Chesapeake Bay
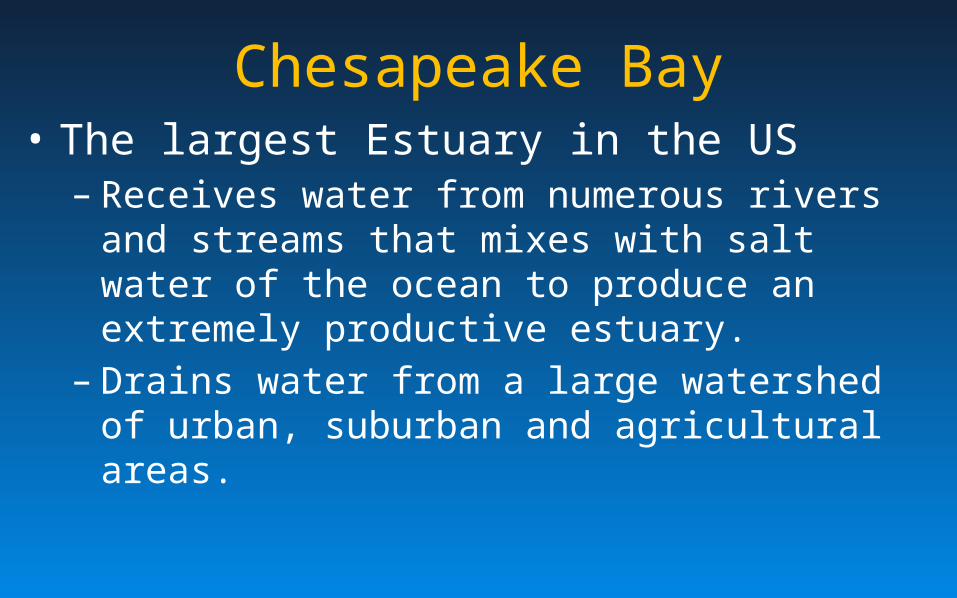
Chesapeake Bay• The largest Estuary in the US
– Receives water from numerous rivers and streams that mixes with salt water of the ocean to produce an extremely productive estuary.
– Drains water from a large watershed of urban, suburban and agricultural areas.
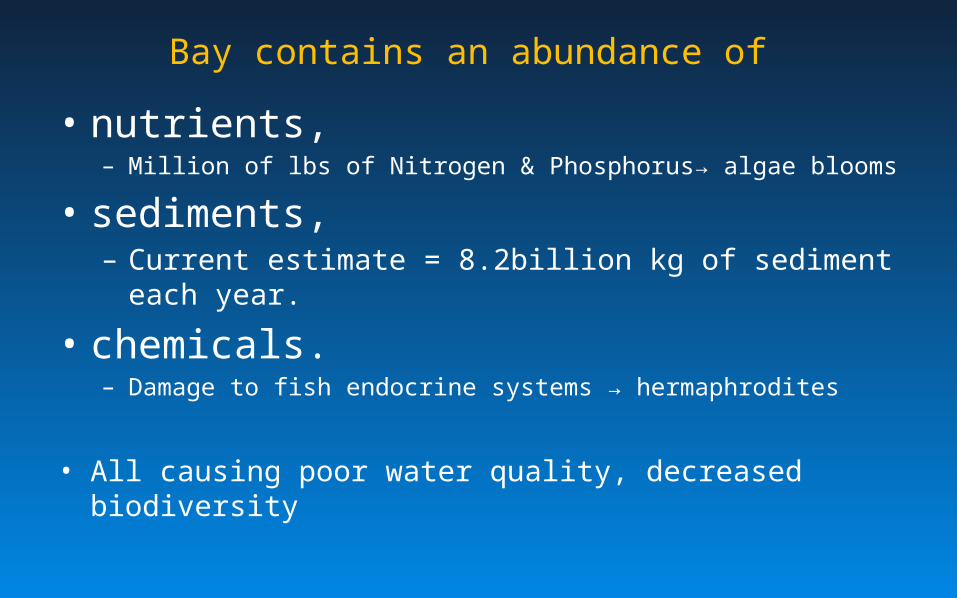
Bay contains an abundance of
• nutrients, – Million of lbs of Nitrogen & Phosphorus→ algae blooms
• sediments, – Current estimate = 8.2billion kg of sediment each year.
• chemicals.– Damage to fish endocrine systems → hermaphrodites
• All causing poor water quality, decreased biodiversity
Chesapeake Bay
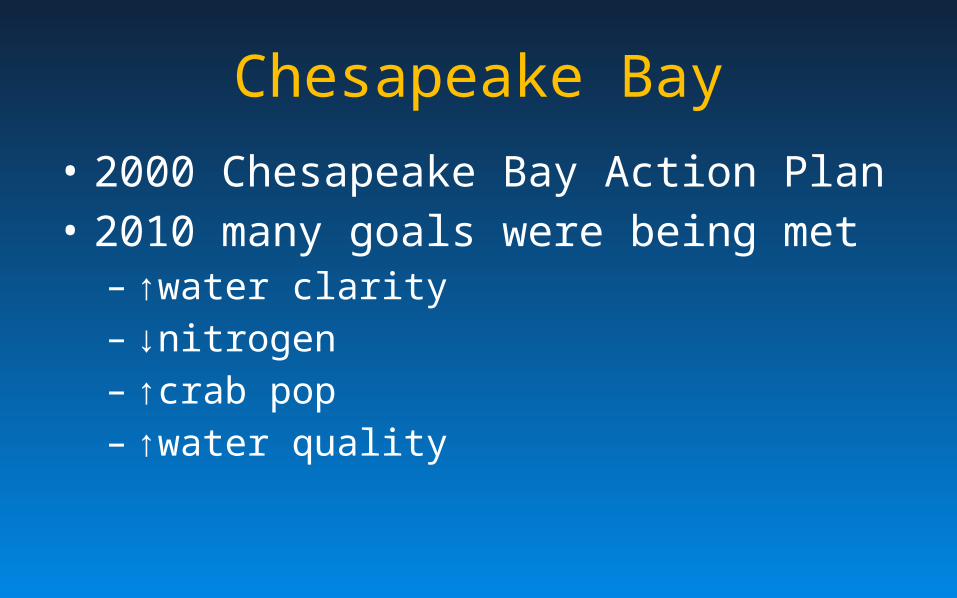
• 2000 Chesapeake Bay Action Plan• 2010 many goals were being met
– ↑water clarity– ↓nitrogen– ↑crab pop– ↑water quality
The Basics
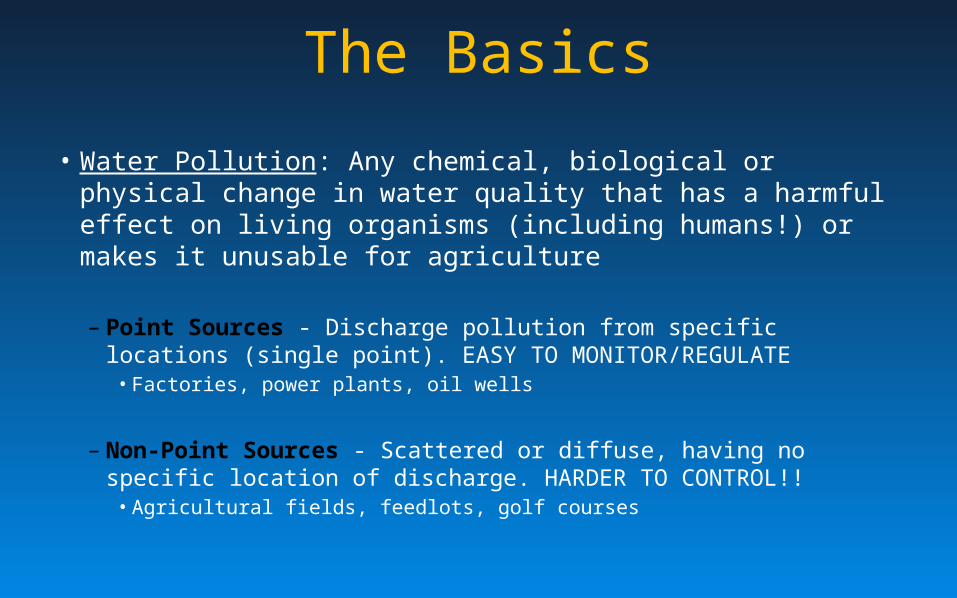
• Water Pollution: Any chemical, biological or physical change in water quality that has a harmful effect on living organisms (including humans!) or makes it unusable for agriculture
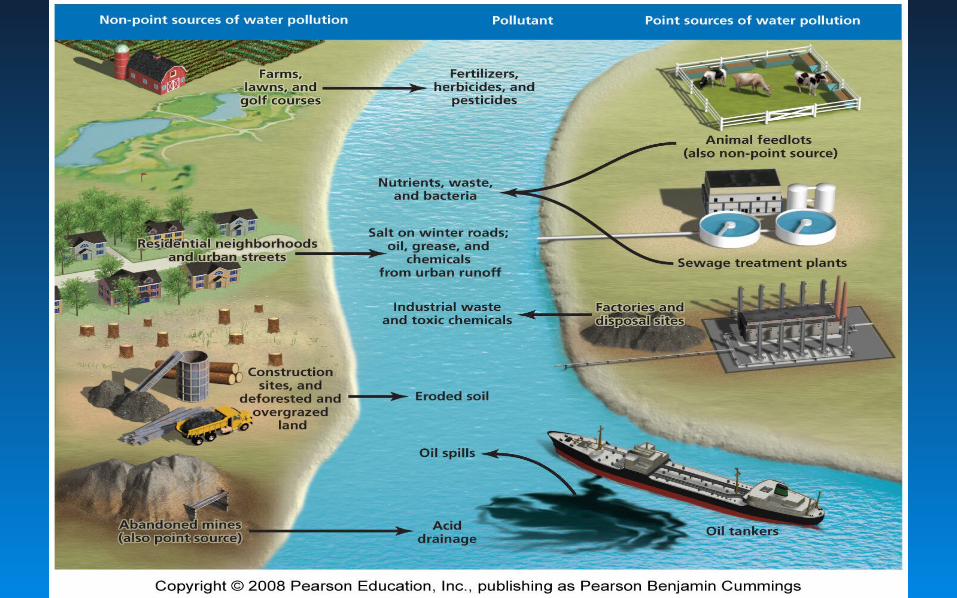
– Point Sources - Discharge pollution from specific locations (single point). EASY TO MONITOR/REGULATE
• Factories, power plants, oil wells
– Non-Point Sources - Scattered or diffuse, having no specific location of discharge. HARDER TO CONTROL!!
• Agricultural fields, feedlots, golf courses
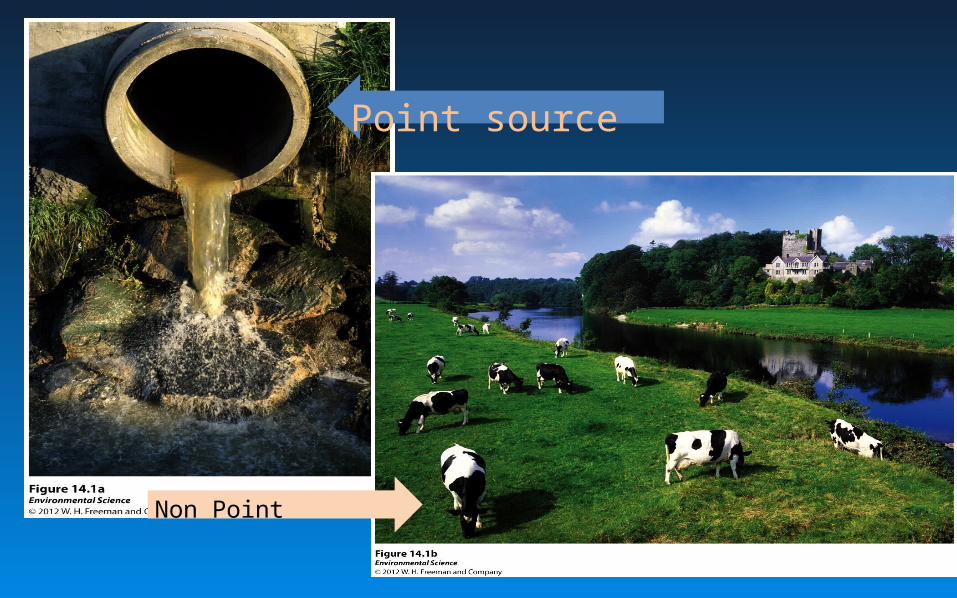
Point source
Non Point
15_21.JPG
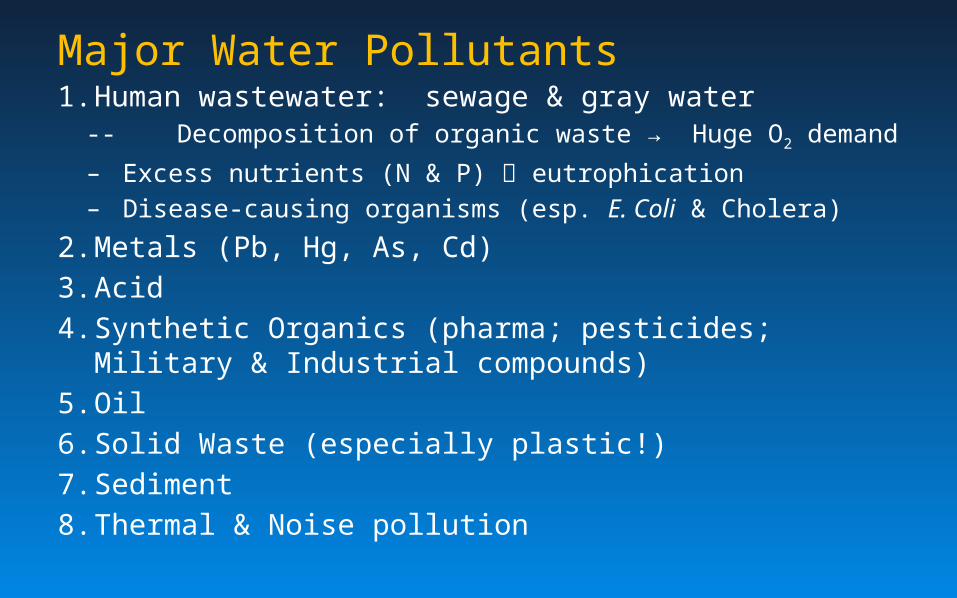
Major Water Pollutants1. Human wastewater: sewage & gray water
-- Decomposition of organic waste → Huge O2 demand– Excess nutrients (N & P) eutrophication– Disease-causing organisms (esp. E. Coli & Cholera)
2. Metals (Pb, Hg, As, Cd)3. Acid4. Synthetic Organics (pharma; pesticides; Military & Industrial
compounds)5. Oil6. Solid Waste (especially plastic!)7. Sediment8. Thermal & Noise pollution
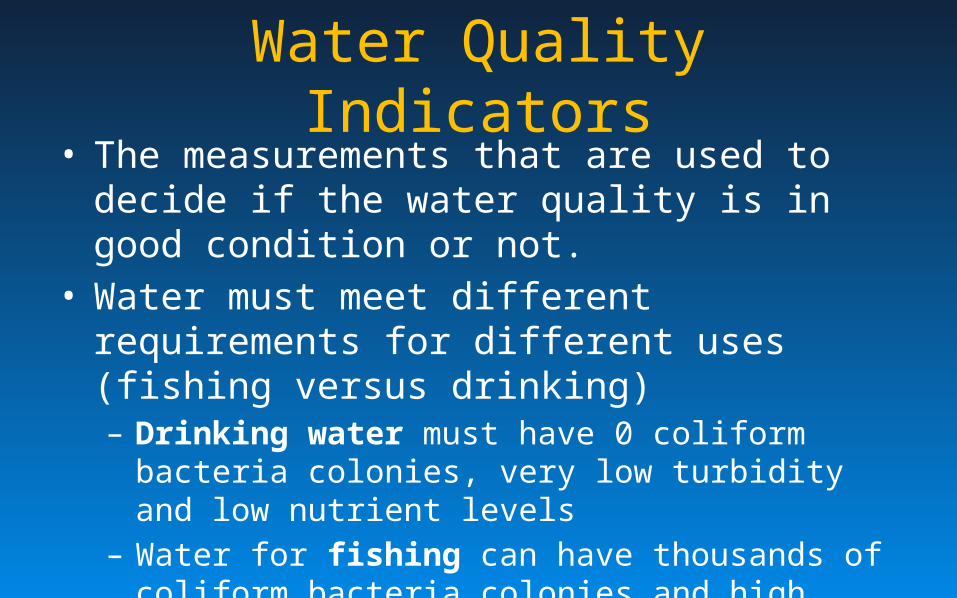
Water Quality Indicators• The measurements that are used to decide if the
water quality is in good condition or not.• Water must meet different requirements for different
uses (fishing versus drinking)– Drinking water must have 0 coliform bacteria colonies,
very low turbidity and low nutrient levels– Water for fishing can have thousands of coliform bacteria
colonies and high turbidity, but must have at dissolved oxygen levels of at least 6 ppm to support life.
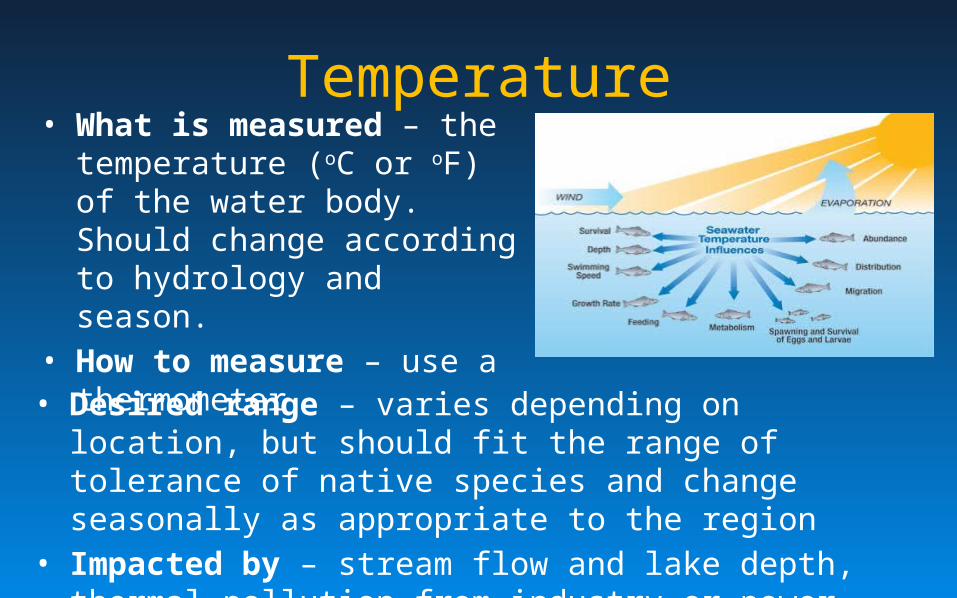
Temperature• What is measured – the
temperature (oC or oF) of the water body. Should change according to hydrology and season.
• How to measure – use a thermometer
• Desired range – varies depending on location, but should fit the range of tolerance of native species and change seasonally as appropriate to the region
• Impacted by – stream flow and lake depth, thermal pollution from industry or power plants, turbidity level
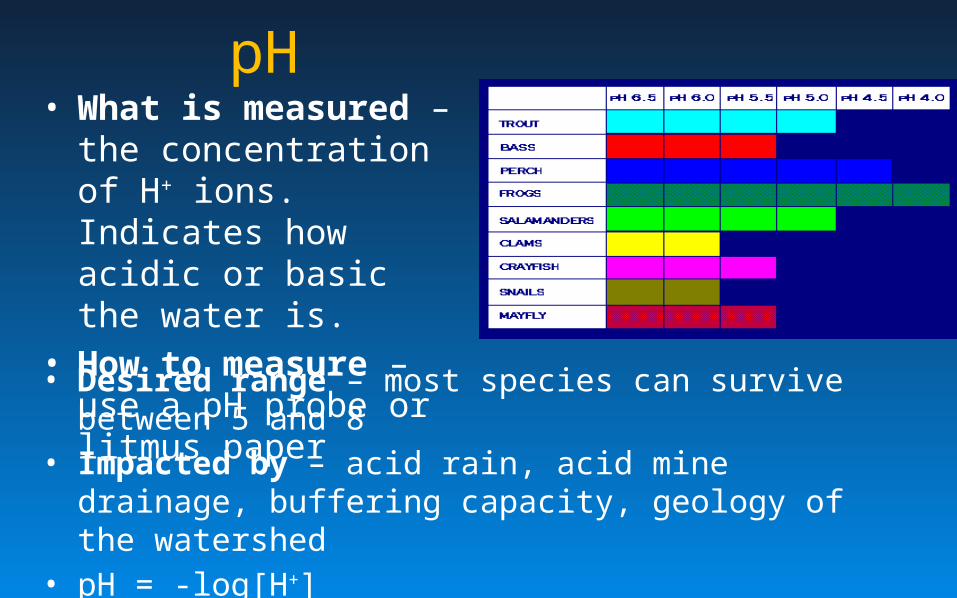
pH• What is measured – the
concentration of H+ ions. Indicates how acidic or basic the water is.
• How to measure – use a pH probe or litmus paper
• Desired range – most species can survive between 5 and 8• Impacted by – acid rain, acid mine drainage, buffering
capacity, geology of the watershed• pH = -log[H+]
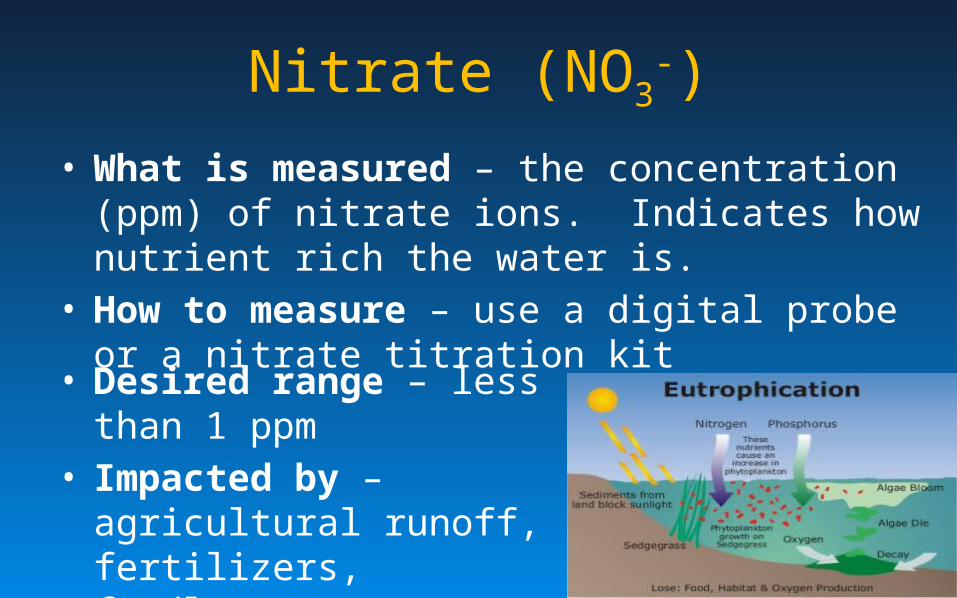
Nitrate (NO3-)
• What is measured – the concentration (ppm) of nitrate ions. Indicates how nutrient rich the water is.
• How to measure – use a digital probe or a nitrate titration kit
• Desired range – less than 1 ppm
• Impacted by – agricultural runoff, fertilizers, feedlots, sewage treatment plants
Phosphate (PO43-)
• What is measured – the concentration (ppm) of phosphate ions. Indicates how nutrient rich the water is.
• How to measure – use a digital probe or a phosphate test kit
• Desired range – less than 0.1 ppm• Impacted by – agricultural runoff, fertilizers,
detergents
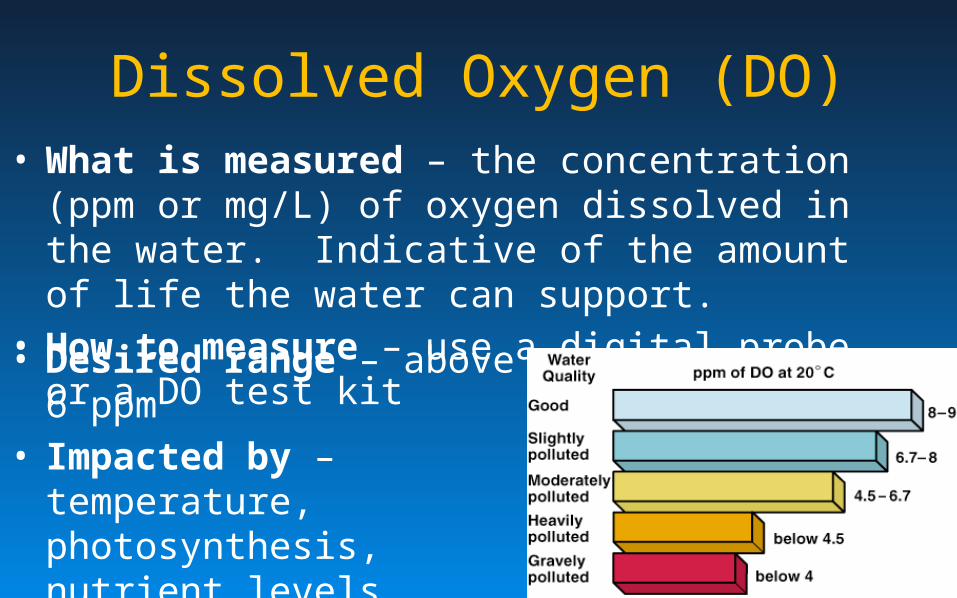
Dissolved Oxygen (DO)• What is measured – the concentration (ppm or mg/L) of
oxygen dissolved in the water. Indicative of the amount of life the water can support.
• How to measure – use a digital probe or a DO test kit • Desired range – above 6 ppm • Impacted by – temperature,
photosynthesis, nutrient levels, turbidity, organic wastes
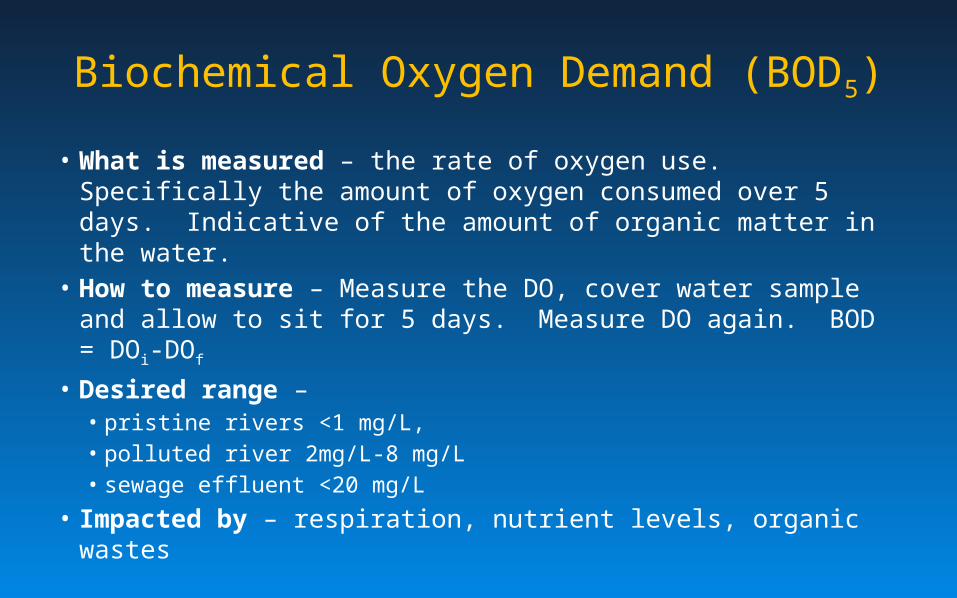
Biochemical Oxygen Demand (BOD5)
• What is measured – the rate of oxygen use. Specifically the amount of oxygen consumed over 5 days. Indicative of the amount of organic matter in the water.
• How to measure – Measure the DO, cover water sample and allow to sit for 5 days. Measure DO again. BOD = DOi-DOf
• Desired range – • pristine rivers <1 mg/L,• polluted river 2mg/L-8 mg/L• sewage effluent <20 mg/L
• Impacted by – respiration, nutrient levels, organic wastes
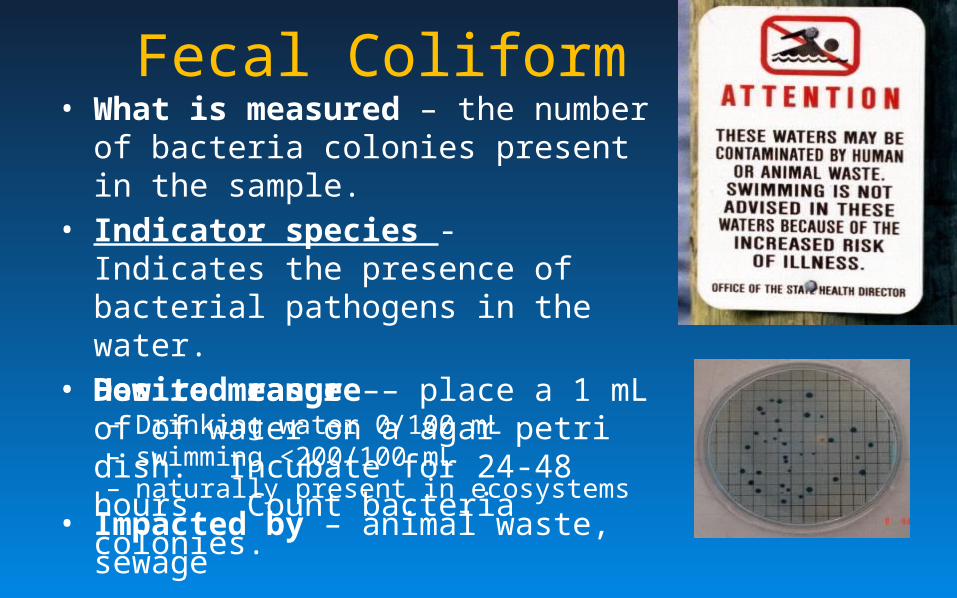
Fecal Coliform • What is measured – the number of
bacteria colonies present in the sample. • Indicator species - Indicates the presence
of bacterial pathogens in the water.• How to measure – place a 1 mL of of water
on a agar petri dish. Incubate for 24-48 hours. Count bacteria colonies.
• Desired range – – Drinking water 0/100 mL– swimming <200/100 mL – naturally present in ecosystems
• Impacted by – animal waste, sewage
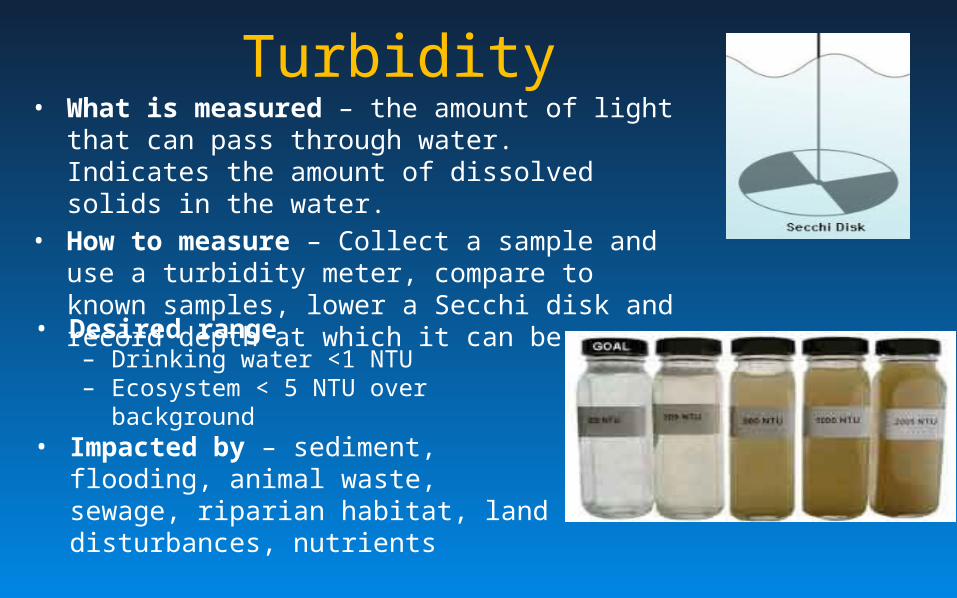
Turbidity• What is measured – the amount of light that can pass
through water. Indicates the amount of dissolved solids in the water.
• How to measure – Collect a sample and use a turbidity meter, compare to known samples, lower a Secchi disk and record depth at which it can be seen.
• Desired range – Drinking water <1 NTU– Ecosystem < 5 NTU over background
• Impacted by – sediment, flooding, animal waste, sewage, riparian habitat, land disturbances, nutrients
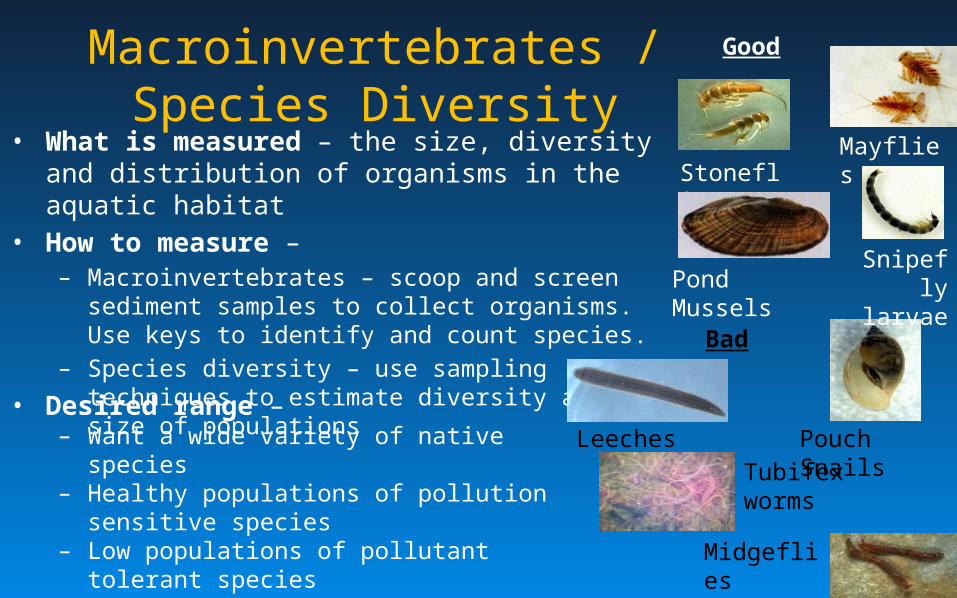
Macroinvertebrates / Species Diversity
• What is measured – the size, diversity and distribution of organisms in the aquatic habitat
• How to measure – – Macroinvertebrates – scoop and screen sediment samples
to collect organisms. Use keys to identify and count species.
– Species diversity – use sampling techniques to estimate diversity and size of populations
• Desired range – – Want a wide variety of native species– Healthy populations of pollution sensitive species– Low populations of pollutant tolerant species
• Impacted by – all of the previously discussed indicators, but mostly DO
Leeches Pouch Snails
Bad
Good
Tubifex worms
Midgeflies larvae
MayfliesStoneflies
Snipefly larvaePond Mussels
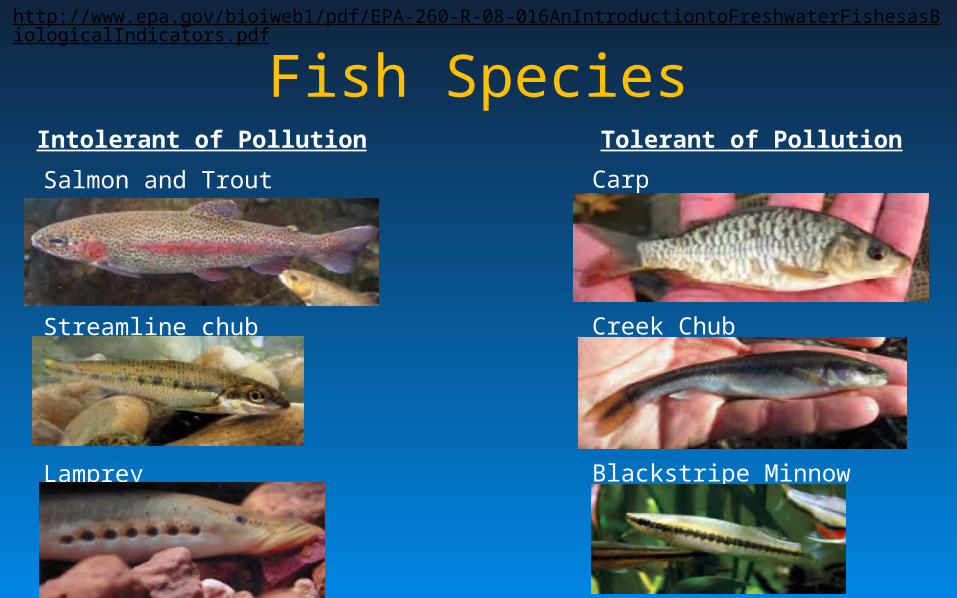
Fish SpeciesIntolerant of Pollution Tolerant of Pollution
Salmon and Trout
Streamline chub
Lamprey
Carp
Creek Chub
Blackstripe Minnow
http://www.epa.gov/bioiweb1/pdf/EPA-260-R-08-016AnIntroductiontoFreshwaterFishesasBiologicalIndicators.pdf
Emerging Contaminants• http://www.teachersdomain.org/asset/frntc10_vid_water/ • Sources of emerging contaminates
– Excess drug concentrations are urinated out and end up in waste water.
– Improper disposal of medication (i.e. flushing medication down the toilet)
– Excess antibiotics and hormones fed to cattle enter the water cycle via waste lagoons
– Chemicals in everyday products like stabilizers, humectants and fragrances
Types of Water Pollution
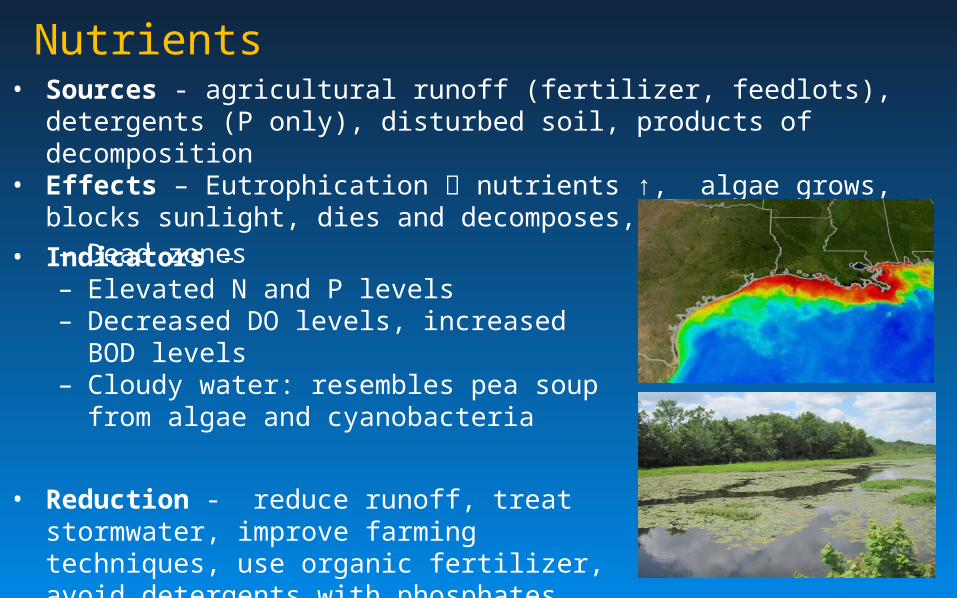
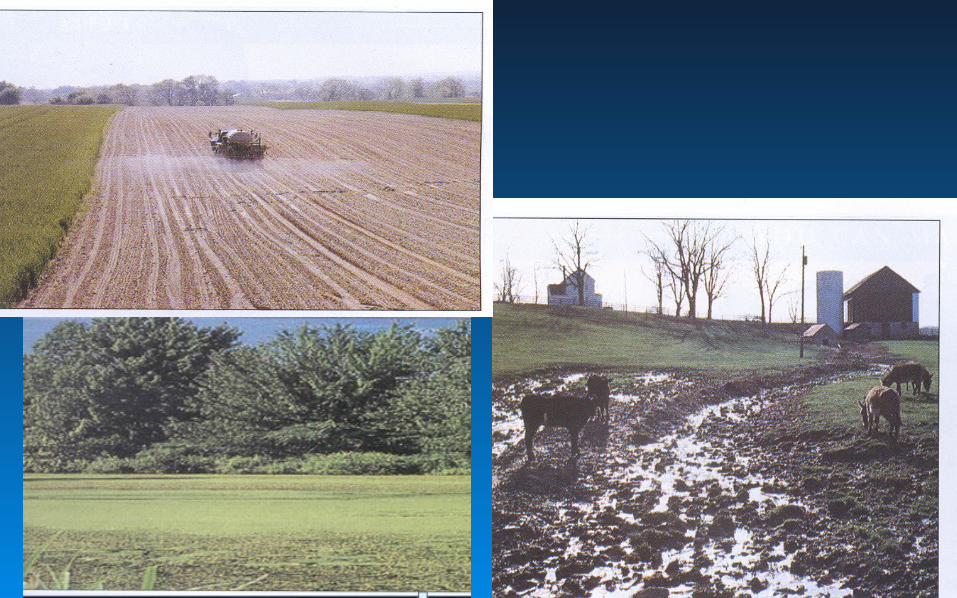
Nutrients • Sources - agricultural runoff (fertilizer, feedlots), detergents (P only), disturbed
soil, products of decomposition• Effects – Eutrophication nutrients ↑, algae grows, blocks sunlight, dies and
decomposes, O2 ↓ – Dead zones
• Indicators - – Elevated N and P levels– Decreased DO levels, increased BOD levels– Cloudy water: resembles pea soup from algae and
cyanobacteria
• Reduction - reduce runoff, treat stormwater, improve farming techniques, use organic fertilizer, avoid detergents with phosphates
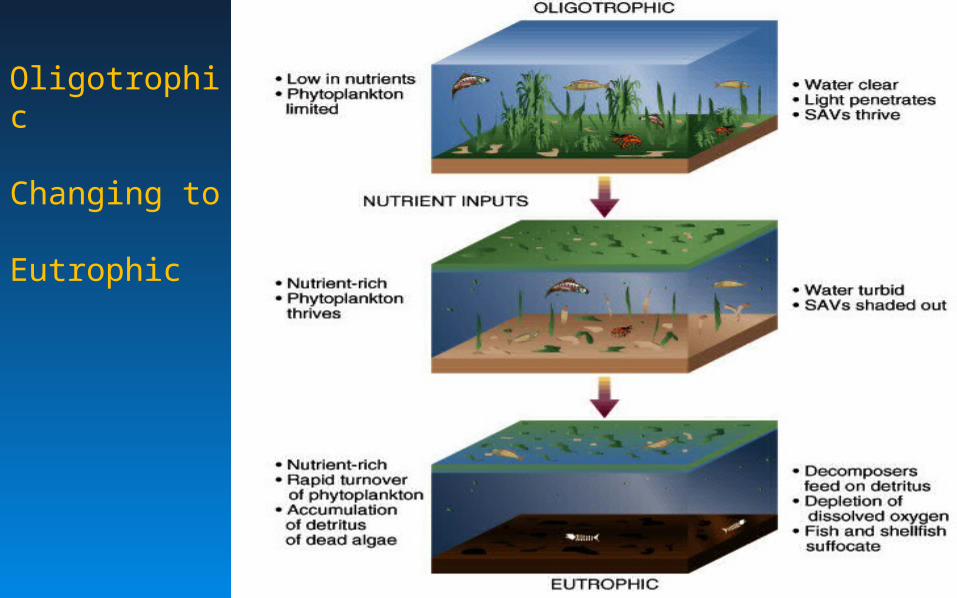
Oligotrophic
Changing to
Eutrophic
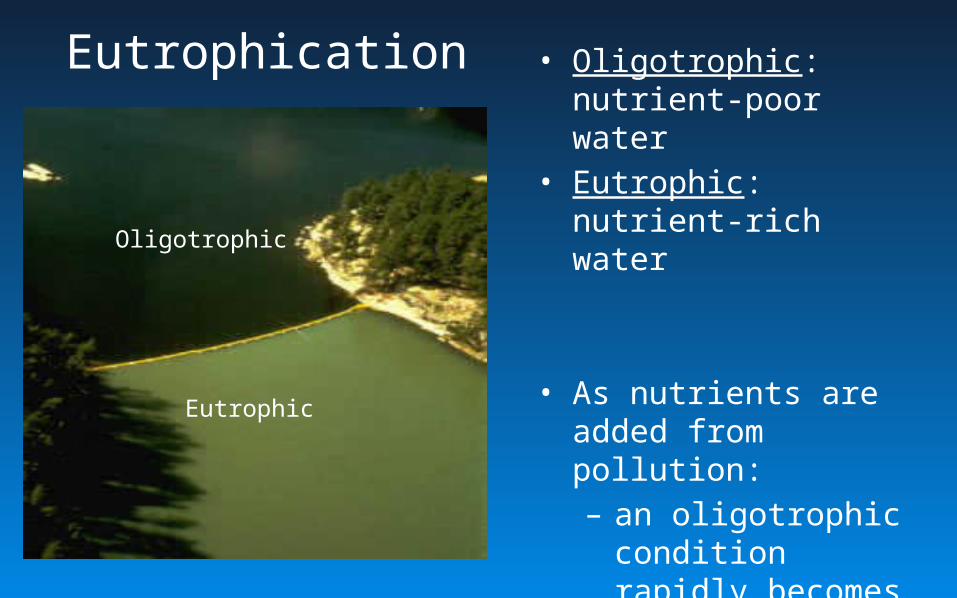
Eutrophication • Oligotrophic: nutrient-poor water
• Eutrophic: nutrient-rich water
• As nutrients are added from pollution:– an oligotrophic
condition rapidly becomes eutrophic.
Oligotrophic
Eutrophic
Natural Vs. Cultural Eutrophication• Natural eutrophication
– aquatic succession– occurs over several hundreds of years– mostly from runoff of plant nutrients from the surrounding
land• Cultural eutrophication
– driven by human activities– occurs rapidly– mostly nitrate- and phosphate-containing effluents– 85% of large lakes near major population centers in the
U.S. have some degree of cultural eutrophication.
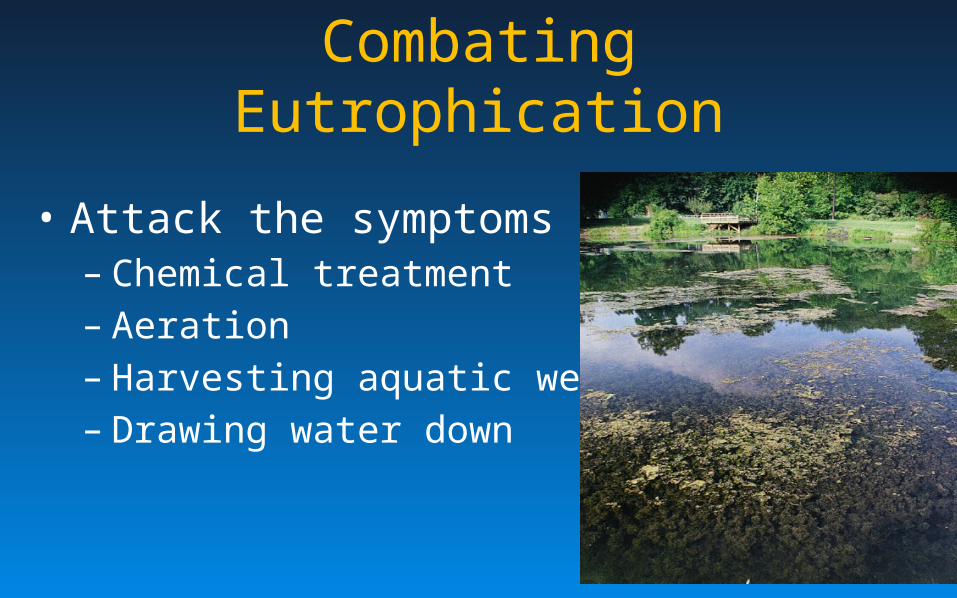
Combating Eutrophication
• Attack the symptoms– Chemical treatment– Aeration– Harvesting aquatic weeds– Drawing water down
Combating EutrophicationGetting at root cause
• Controlling point sources• Ban phosphate detergents• Sewage-treatment improvements• Reduce /control runoff from
– Controlling nonpoint sources: Difficult to address runoff• Urban• Agricultural fields• Deforested woodlands• Overgrazed pastures
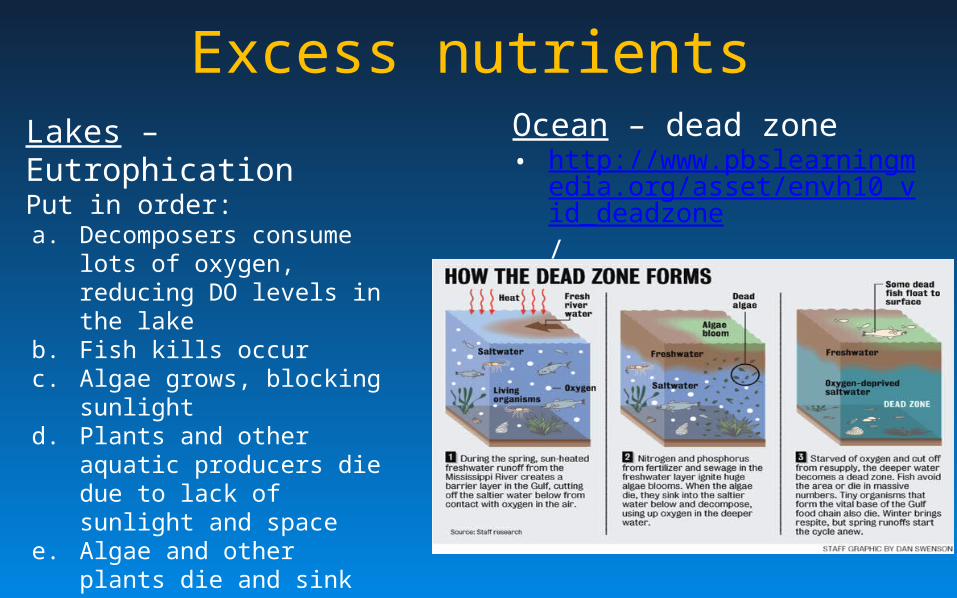
Excess nutrientsLakes – EutrophicationPut in order:a. Decomposers consume lots of
oxygen, reducing DO levels in the lake
b. Fish kills occurc. Algae grows, blocking sunlightd. Plants and other aquatic
producers die due to lack of sunlight and space
e. Algae and other plants die and sink to the bottom of the lake
f. Fertilizer or animal waste runs off into the lake
Ocean – dead zone• http://www.pbslearningmedia.or
g/asset/envh10_vid_deadzone/
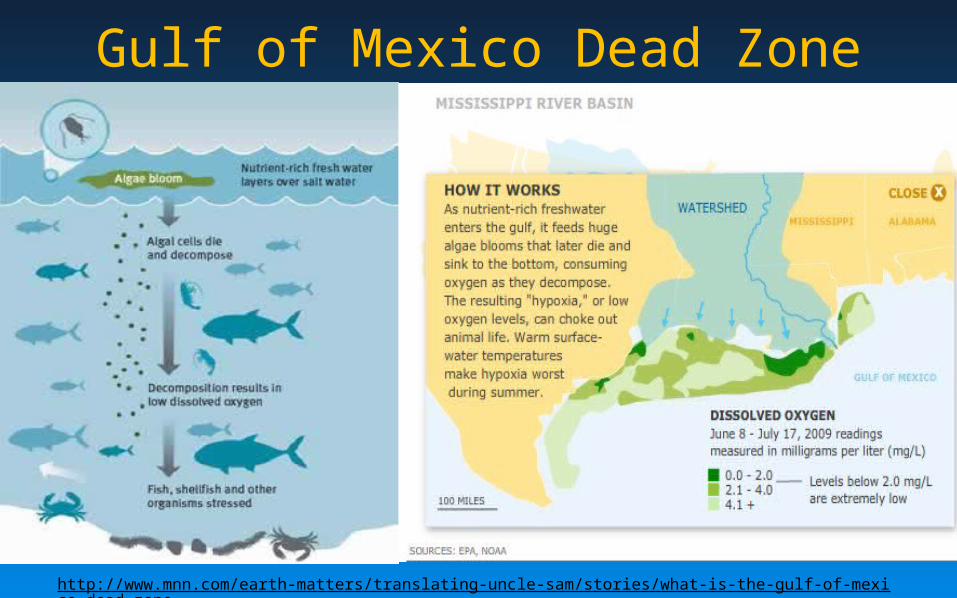
Gulf of Mexico Dead Zone
http://www.mnn.com/earth-matters/translating-uncle-sam/stories/what-is-the-gulf-of-mexico-dead-zone
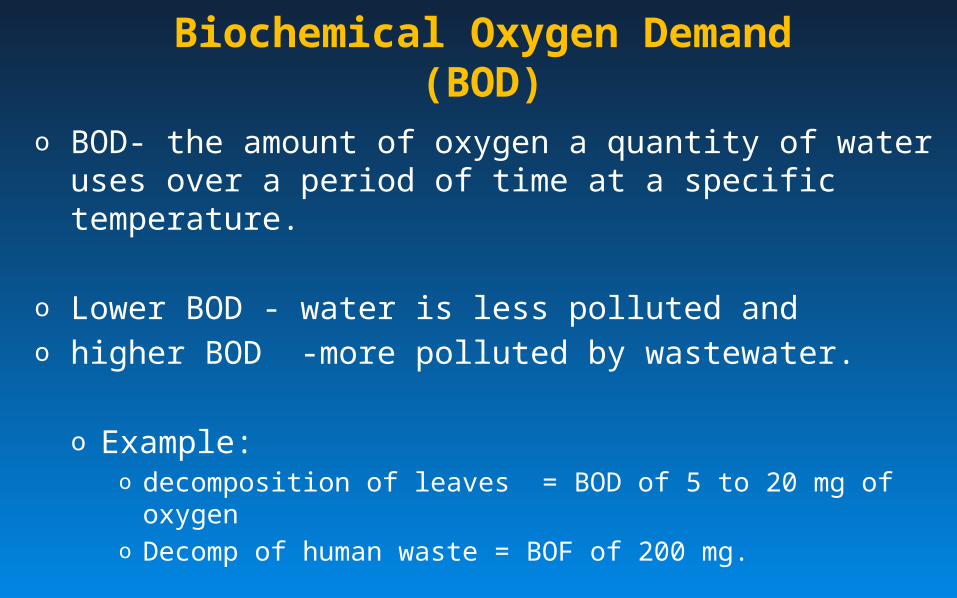
Biochemical Oxygen Demand (BOD)
o BOD- the amount of oxygen a quantity of water uses over a period of time at a specific temperature.
o Lower BOD - water is less polluted and o higher BOD -more polluted by wastewater.
o Example: o decomposition of leaves = BOD of 5 to 20 mg of oxygeno Decomp of human waste = BOF of 200 mg.
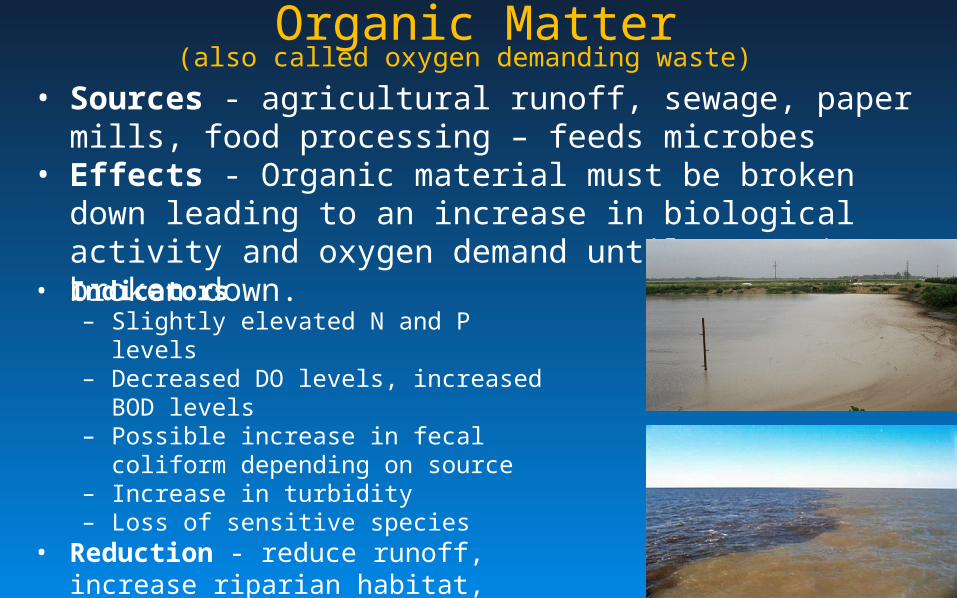
Organic Matter
(also called oxygen demanding waste) • Sources - agricultural runoff, sewage, paper mills, food
processing – feeds microbes• Effects - Organic material must be broken down leading to an
increase in biological activity and oxygen demand until waste is broken down.
• Indicators– Slightly elevated N and P levels– Decreased DO levels, increased BOD levels– Possible increase in fecal coliform depending
on source– Increase in turbidity– Loss of sensitive species
• Reduction - reduce runoff, increase riparian habitat, treat sewage, improve farming techniques
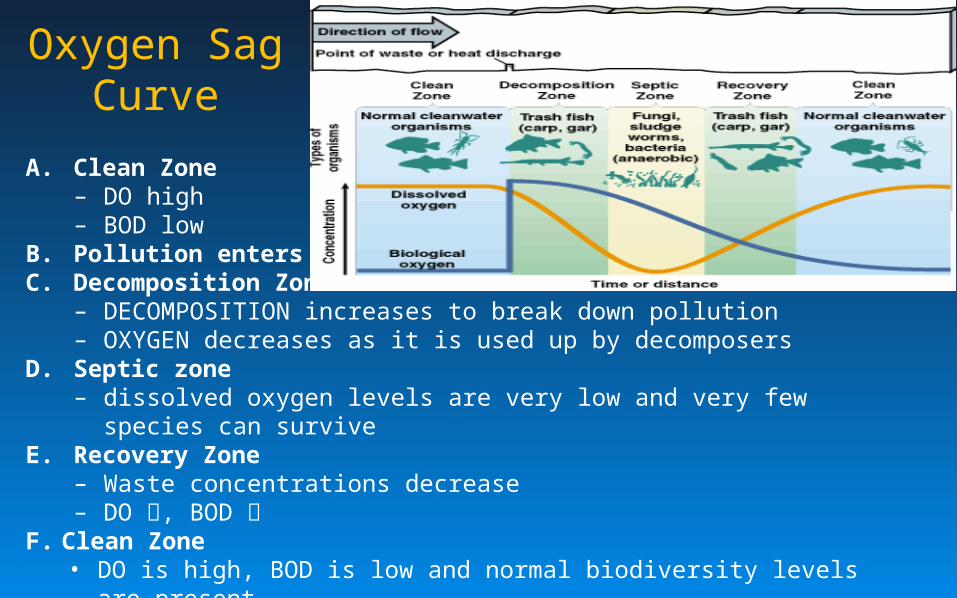
Oxygen Sag Curve
A. Clean Zone– DO high– BOD low
B. Pollution enters streamC. Decomposition Zone
– DECOMPOSITION increases to break down pollution– OXYGEN decreases as it is used up by decomposers
D. Septic zone– dissolved oxygen levels are very low and very few species can survive
E. Recovery Zone– Waste concentrations decrease– DO , BOD
F. Clean Zone• DO is high, BOD is low and normal biodiversity levels are present.
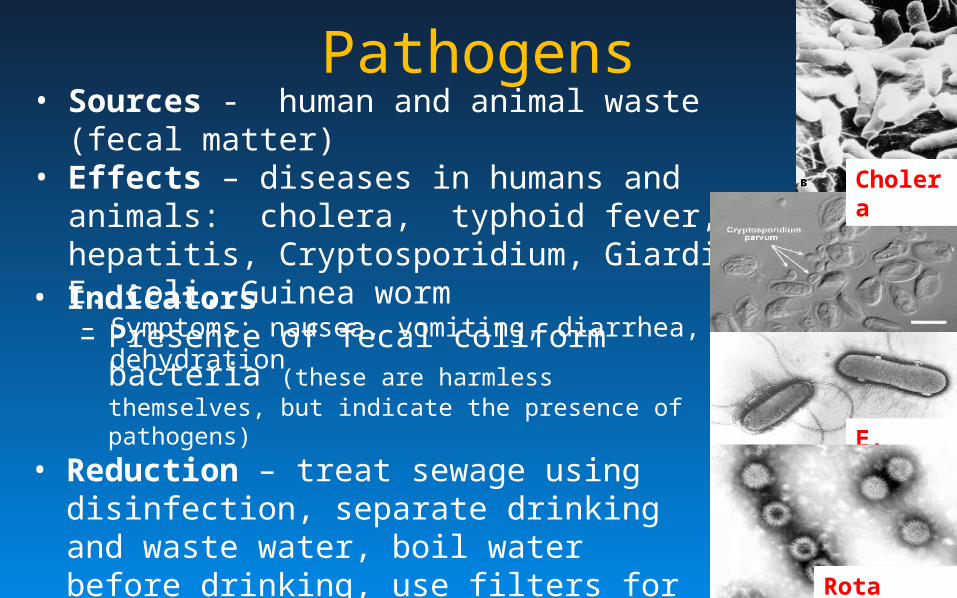
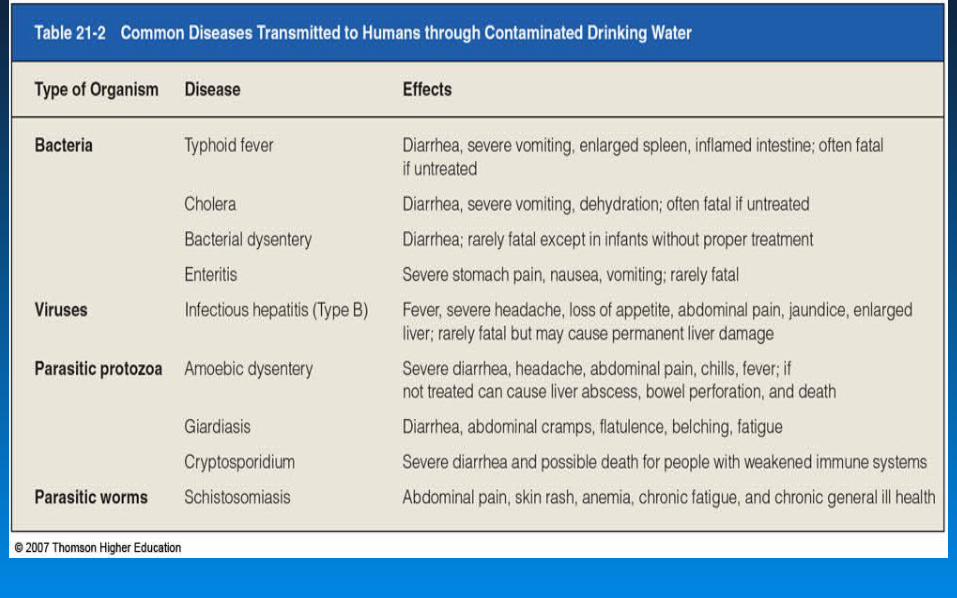
Pathogens• Sources - human and animal waste (fecal matter) • Effects – diseases in humans and animals: cholera,
typhoid fever, hepatitis, Cryptosporidium, Giardia, E. coli, Guinea worm– Symptoms: nausea, vomiting, diarrhea, dehydration
• Indicators– Presence of fecal coliform bacteria (these are
harmless themselves, but indicate the presence of pathogens)
• Reduction – treat sewage using disinfection, separate drinking and waste water, boil water before drinking, use filters for parasites
• Guinea Worm• Cryptosporidium
Cholera
E. Coli
Rota Virus
Global Problems
• According to the World Health Organization, an estimated 1.1 billion people (1/6 of pop) do not have access to safe drinking water
• Diarrheal diseases kill around 3.1 million people globally each year, – mostly children in developing countries.
•
Heavy Metals• Sources - natural deposits (arsenic, mercury, etc)
– mining (all)– coal burning (mercury)– e-waste (cadmium, mercury, lead)– industrial processes like smelting (lead, mercury, arsenic, etc)
• High salinity, low pHs and O2 deficiencies increase metal concentrations in water
• Effects – heavy metals bioaccumulate and biomagnify– Often have the largest impacts at the top of the food chain– Most are toxic at low doses and nuerotoxins
• Indicators - Positive tests for metals• Reduction
– minimize mining and perform effective remediation– burn coal in larger coal plants with advanced air pollution control devices– recycle e-waste– regulate industry and require the use of advanced air pollution control devices
• Arsenic (natural) http://ca.pbslearningmedia.org/resource/envh10.sci.life.nathis.arsenic/in-small-doses-arsenic/
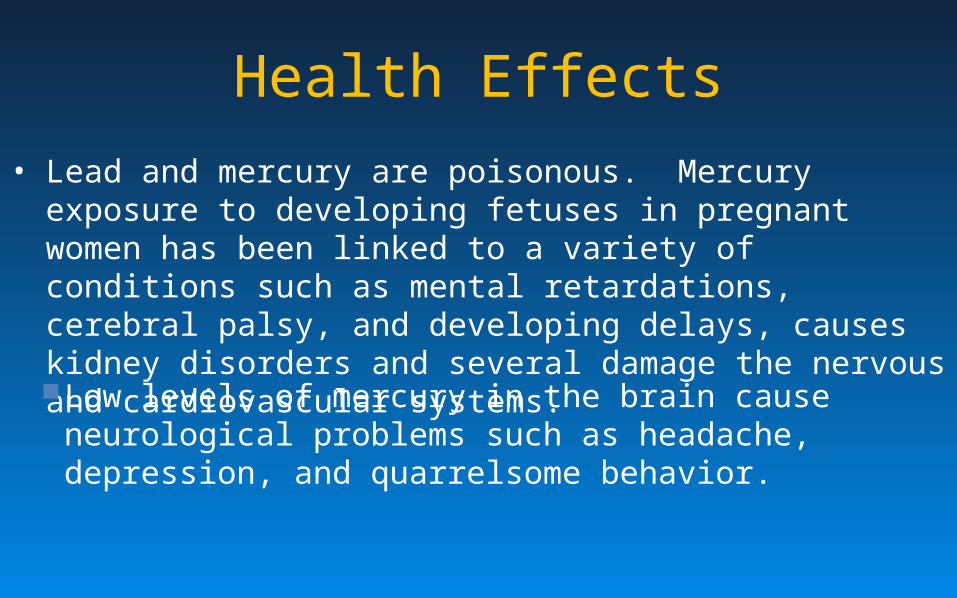
Health Effects• Lead and mercury are poisonous. Mercury exposure to developing
fetuses in pregnant women has been linked to a variety of conditions such as mental retardations, cerebral palsy, and developing delays, causes kidney disorders and several damage the nervous and cardiovascular systems.
Low levels of mercury in the brain cause neurological problems such as headache, depression, and quarrelsome behavior.
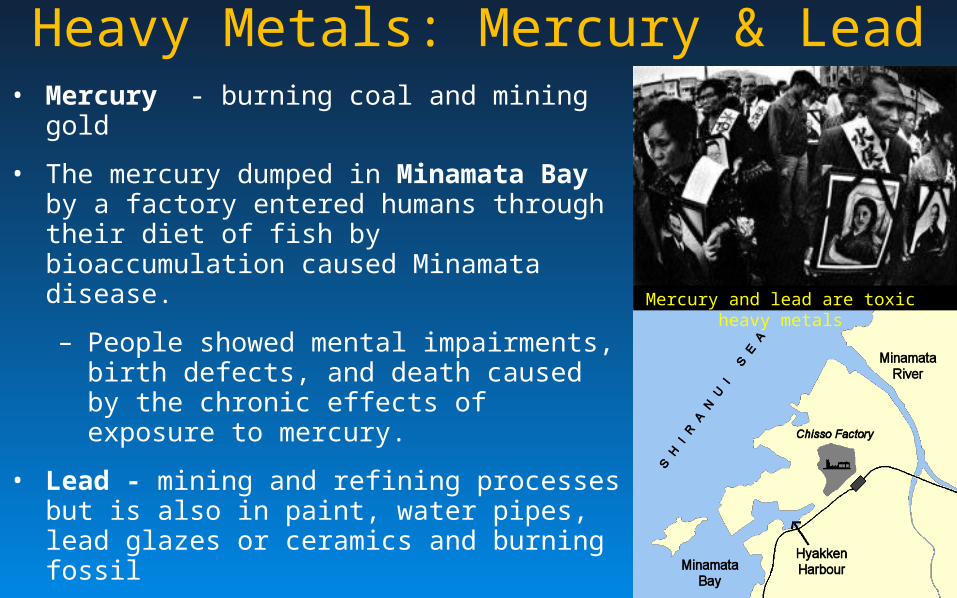
Mercury and lead are toxic heavy metals
• Mercury - burning coal and mining gold
• The mercury dumped in Minamata Bay by a factory entered humans through their diet of fish by bioaccumulation caused Minamata disease.
– People showed mental impairments, birth defects, and death caused by the chronic effects of exposure to mercury.
• Lead - mining and refining processes but is also in paint, water pipes, lead glazes or ceramics and burning fossil
Heavy Metals: Mercury & Lead
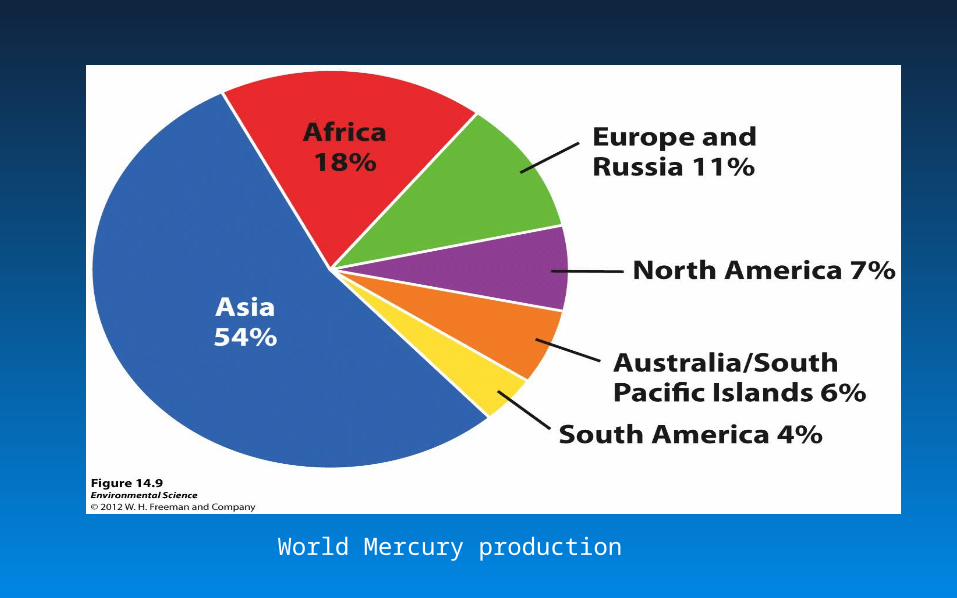
World Mercury production
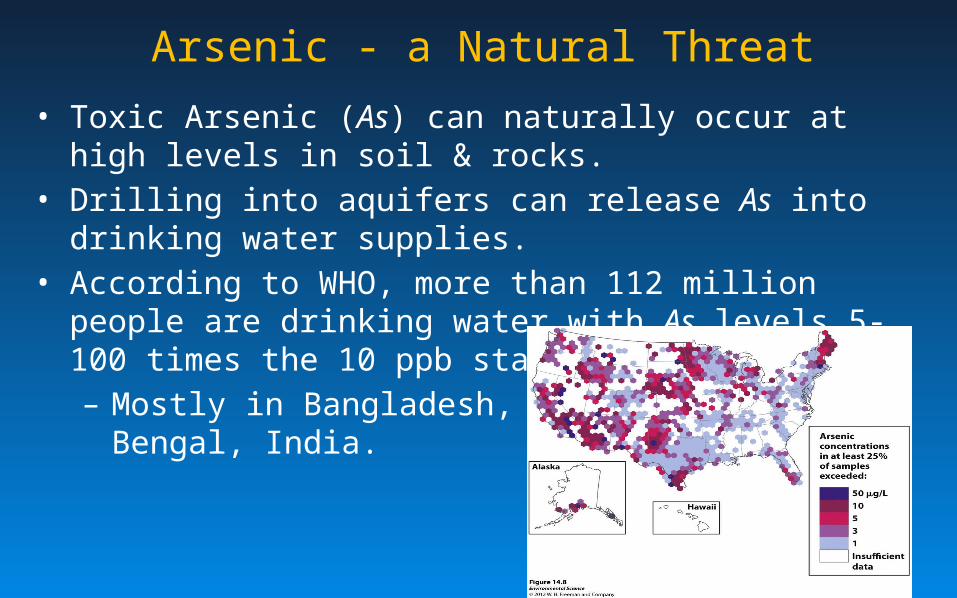
Arsenic - a Natural Threat
• Toxic Arsenic (As) can naturally occur at high levels in soil & rocks.• Drilling into aquifers can release As into drinking water supplies.• According to WHO, more than 112 million people are drinking
water with As levels 5-100 times the 10 ppb standard.– Mostly in Bangladesh, China, and West Bengal, India.
• Chemicals that contain carbon atoms. • Most of the thousands of organic compounds found in water are
synthetic chemicals that are produced by human activities; • these included pesticides, solvents, industrial chemicals and
plastics, and seepage from landfills.• Wide variety of affects
– Toxic– Cancers– Genetic defects– Interfers w/ hormones
• Growth & sexual development• Gender benders
Synthetic Organic Compounds
• Pesticides– Developed during WWII
• Herbicides, fungicides, insecticides– Unintended effects
• Kill not just intended target, but wide variety – Mosquito insecticide kills amphibians
• Alter other physiological functions– DDT: target insect nervous system – accumulates in food chain
and thins eggshells
• Inert ingredients– Additives aren’t necessarily harmless
» Roundup additive to penetrate waxy leaves – ruptures tadpole gills
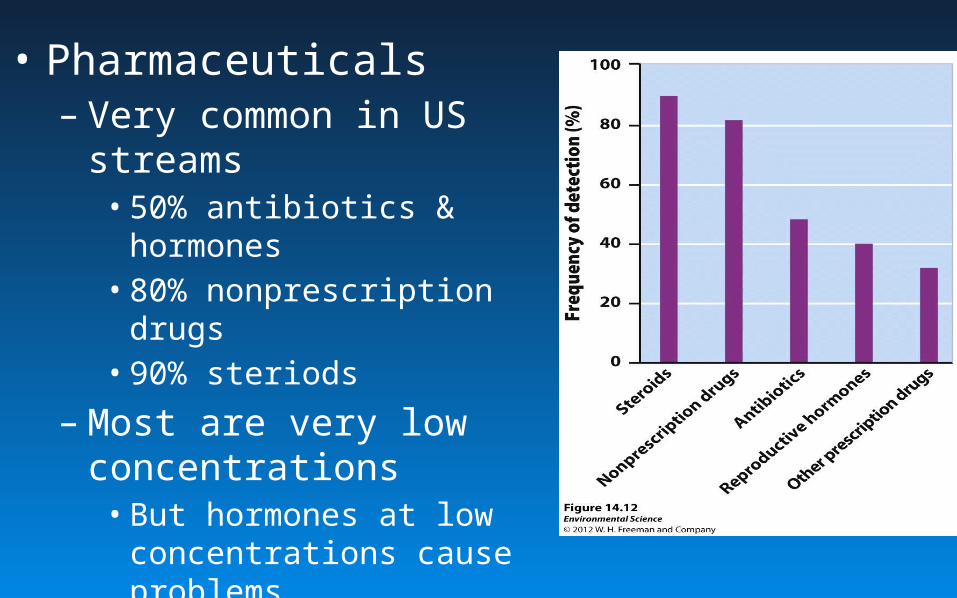
• Pharmaceuticals– Very common in US streams
• 50% antibiotics & hormones• 80% nonprescription drugs• 90% steriods
– Most are very low concentrations
• But hormones at low concentrations cause problems
• Antibiotics – contributing to resistance issues
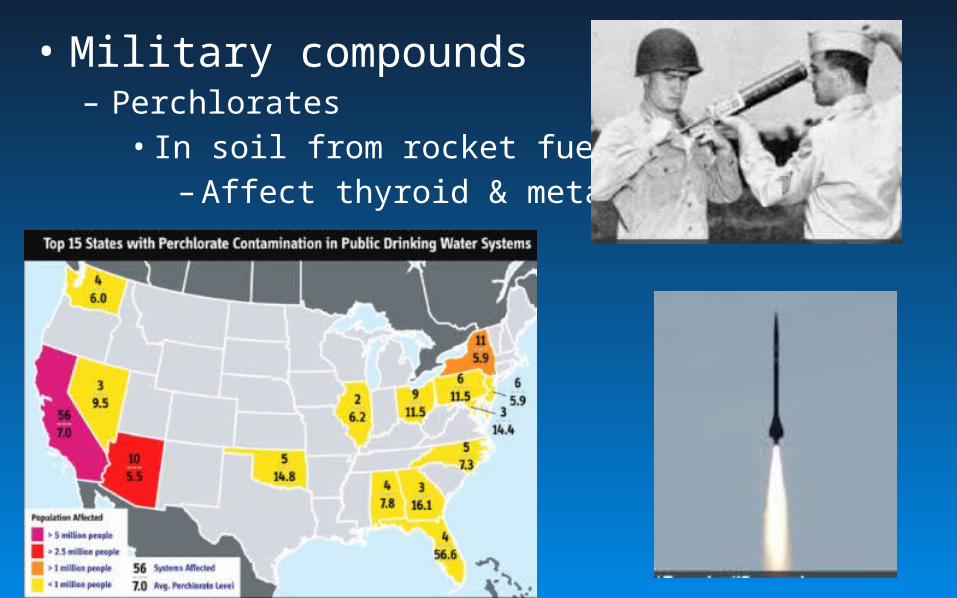
• Military compounds– Perchlorates
• In soil from rocket fuel– Affect thyroid & metabolism
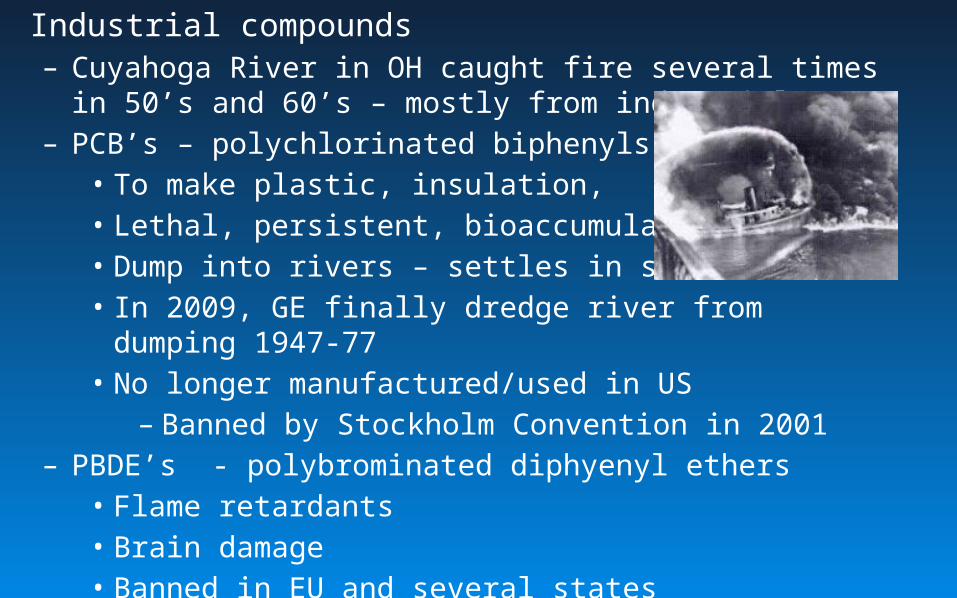
Industrial compounds– Cuyahoga River in OH caught fire several times in 50’s and 60’s –
mostly from industrial waste – PCB’s – polychlorinated biphenyls
• To make plastic, insulation,• Lethal, persistent, bioaccumulates• Dump into rivers – settles in sediments• In 2009, GE finally dredge river from dumping 1947-77• No longer manufactured/used in US
– Banned by Stockholm Convention in 2001– PBDE’s - polybrominated diphyenyl ethers
• Flame retardants• Brain damage• Banned in EU and several states
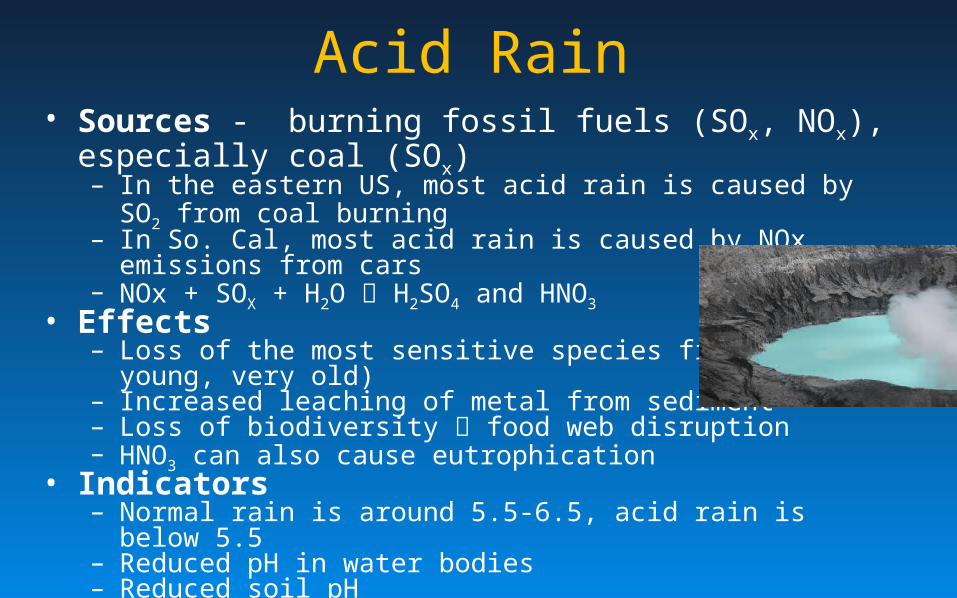
Acid Rain• Sources - burning fossil fuels (SOx, NOx), especially coal (SOx)
– In the eastern US, most acid rain is caused by SO2 from coal burning– In So. Cal, most acid rain is caused by NOx emissions from cars– NOx + SOX + H2O H2SO4 and HNO3
• Effects– Loss of the most sensitive species first (very young, very old)– Increased leaching of metal from sediment– Loss of biodiversity food web disruption– HNO3 can also cause eutrophication
• Indicators– Normal rain is around 5.5-6.5, acid rain is below 5.5– Reduced pH in water bodies– Reduced soil pH
• Reduction– Remove SO2 and NOx from emissions before release (install scrubbers on
power plants)– Switching to less polluting alternative fuels– Add lime to aquatic ecosystems to absorb H+ ions (expensive)
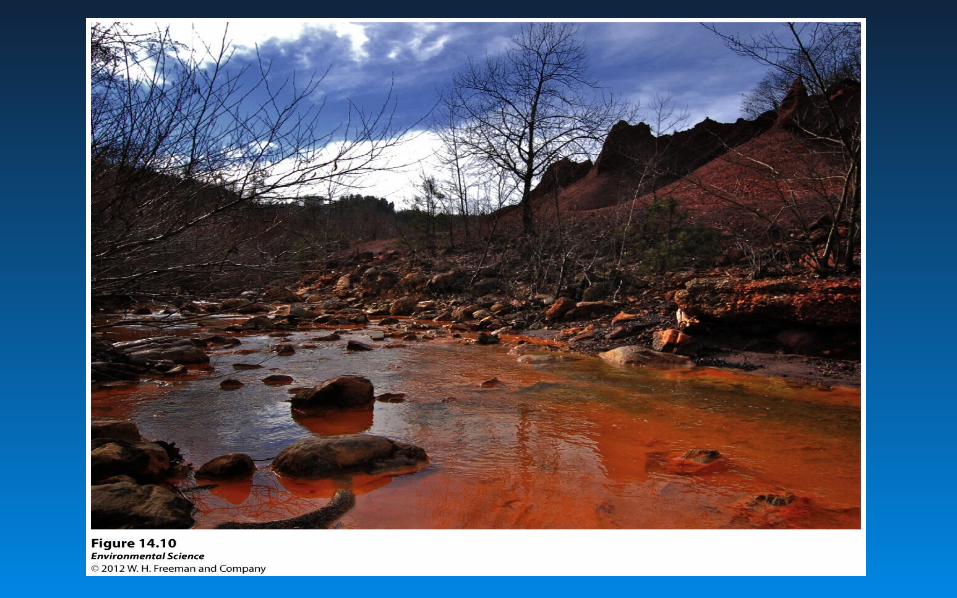
Acid Mine Drainage
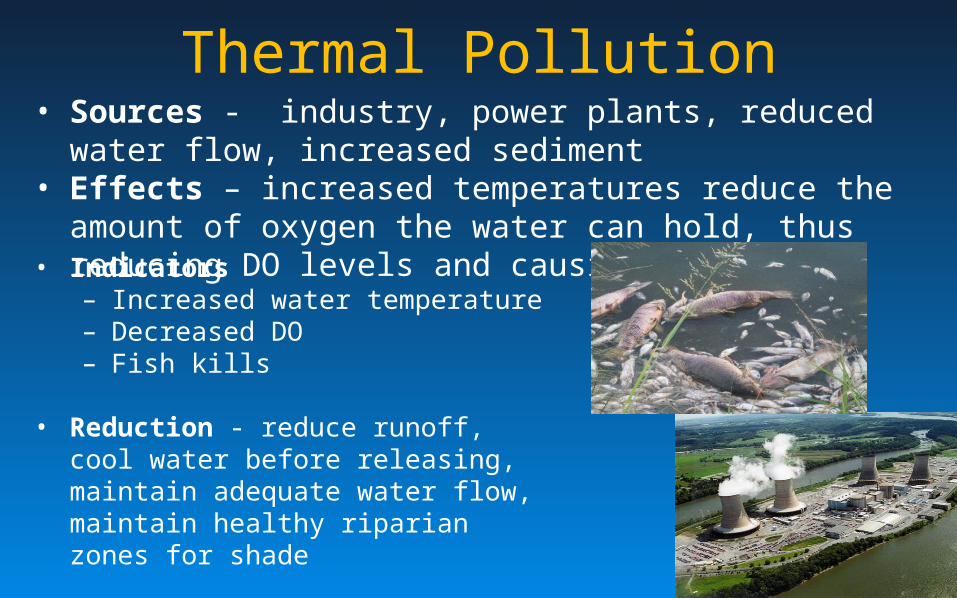
Thermal Pollution• Sources - industry, power plants, reduced water flow, increased
sediment• Effects – increased temperatures reduce the amount of oxygen
the water can hold, thus reducing DO levels and causing fish kills• Indicators
– Increased water temperature– Decreased DO– Fish kills
• Reduction - reduce runoff, cool water before releasing, maintain adequate water flow, maintain healthy riparian zones for shade
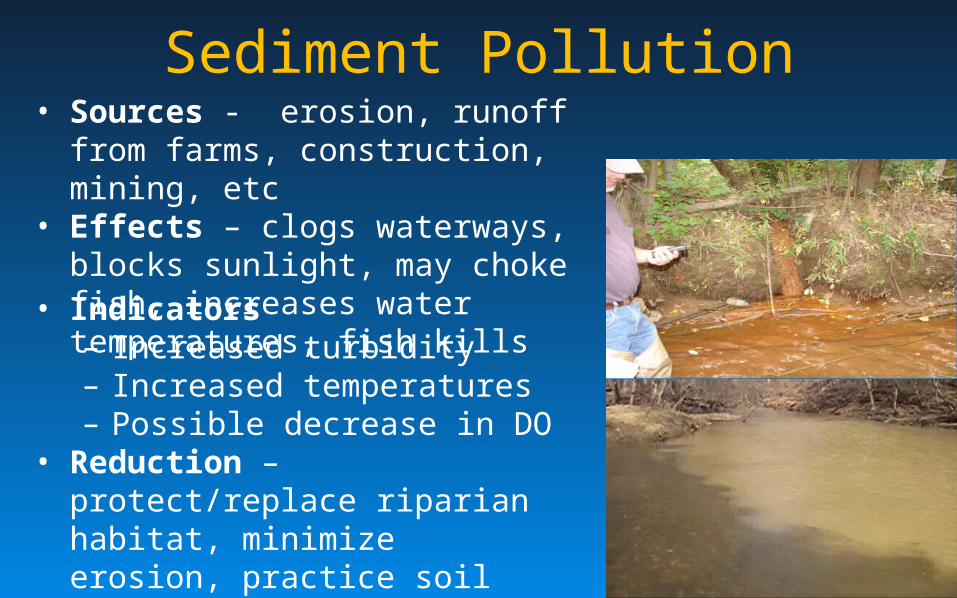
Sediment Pollution• Sources - erosion, runoff from farms,
construction, mining, etc• Effects – clogs waterways, blocks
sunlight, may choke fish, increases water temperatures, fish kills
• Indicators– Increased turbidity– Increased temperatures– Possible decrease in DO
• Reduction – protect/replace riparian habitat, minimize erosion, practice soil conservation strategies, maintain wetlands around water bodies
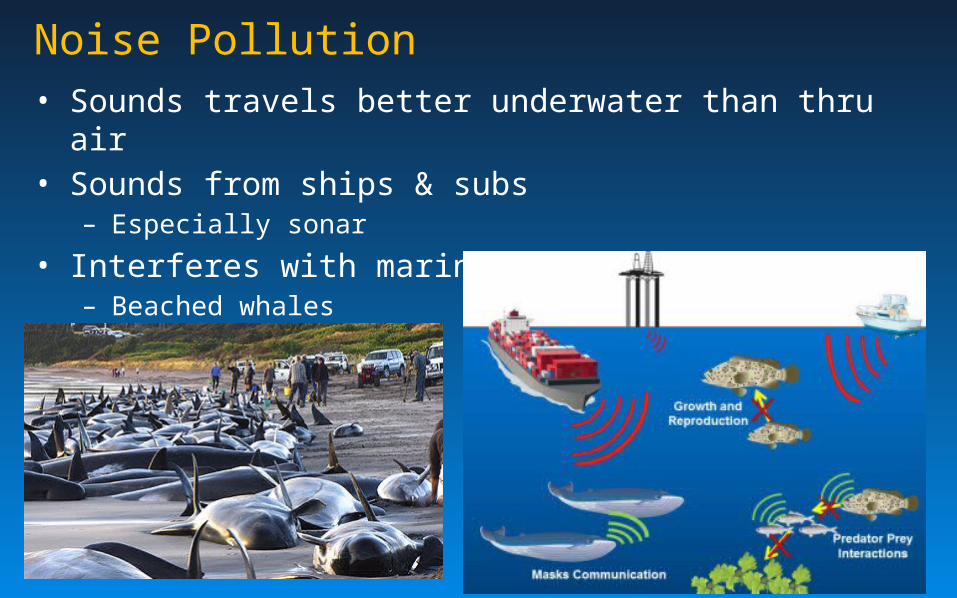
Noise Pollution• Sounds travels better underwater than thru air• Sounds from ships & subs
– Especially sonar
• Interferes with marine animal communication– Beached whales
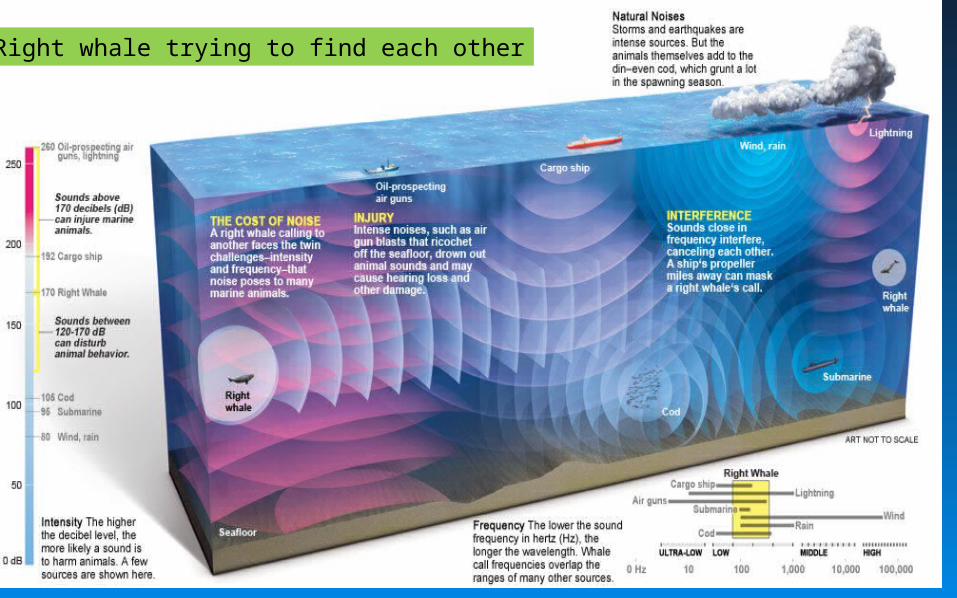
2 Right whale trying to find each other
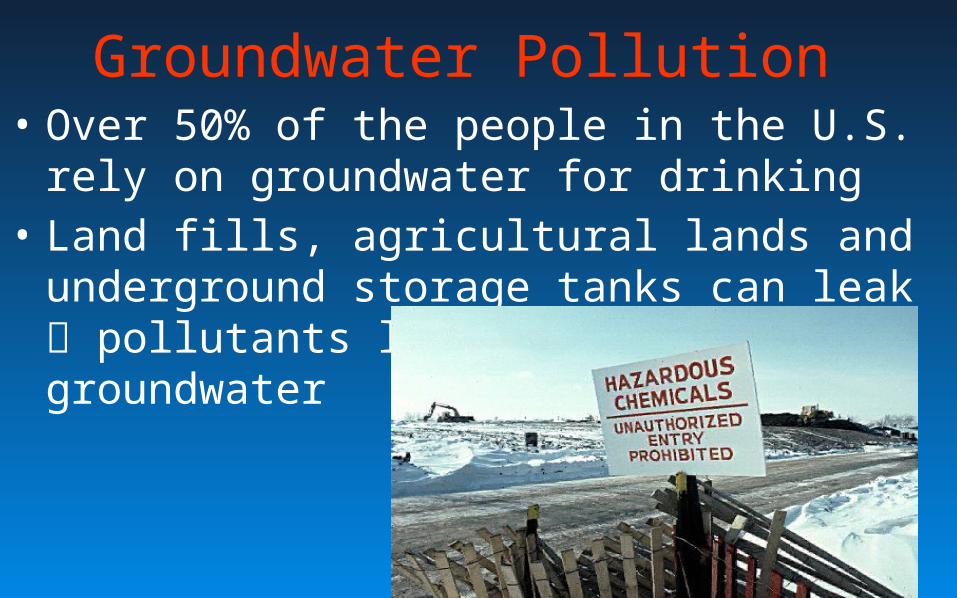
Groundwater Pollution • Over 50% of the people in the U.S. rely on
groundwater for drinking• Land fills, agricultural lands and underground
storage tanks can leak pollutants leech into groundwater
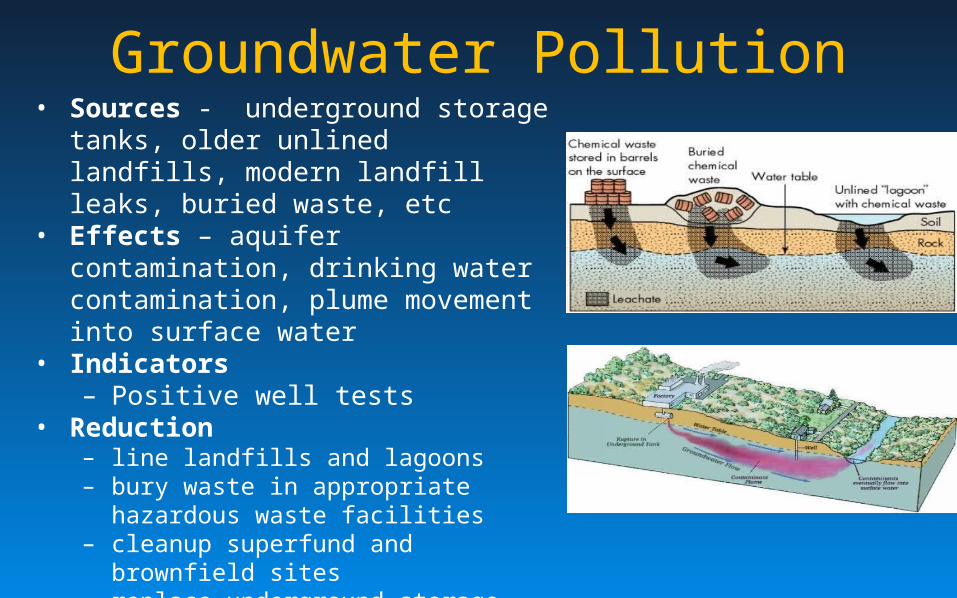
Groundwater Pollution• Sources - underground storage tanks, older
unlined landfills, modern landfill leaks, buried waste, etc
• Effects – aquifer contamination, drinking water contamination, plume movement into surface water
• Indicators– Positive well tests
• Reduction– line landfills and lagoons– bury waste in appropriate hazardous waste
facilities– cleanup superfund and brownfield sites– replace underground storage tanks before
leaks occur.
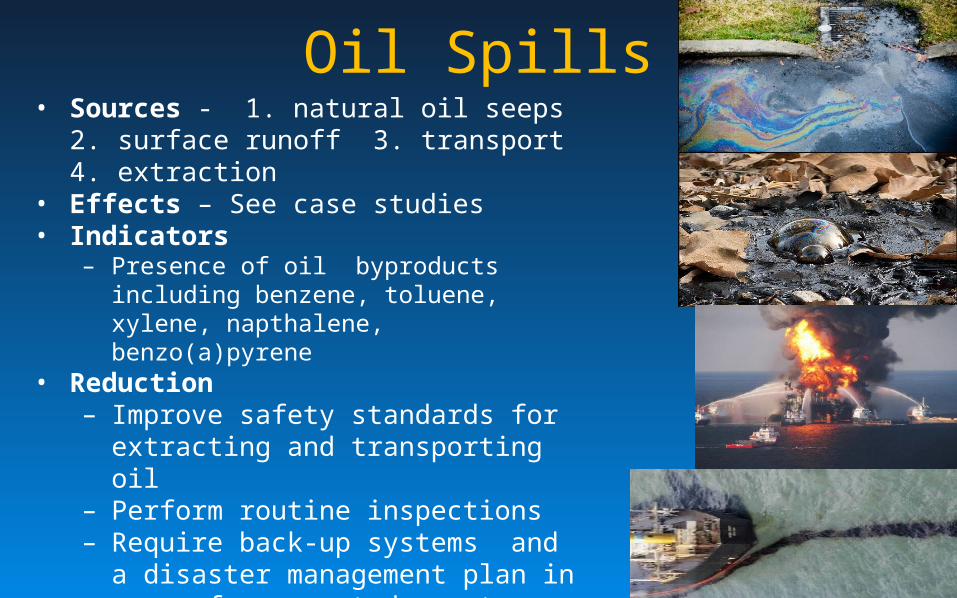
Oil Spills• Sources - 1. natural oil seeps 2. surface runoff
3. transport 4. extraction• Effects – See case studies• Indicators
– Presence of oil byproducts including benzene, toluene, xylene, napthalene, benzo(a)pyrene
• Reduction– Improve safety standards for extracting and
transporting oil– Perform routine inspections– Require back-up systems and a disaster
management plan in case of unexpected event
– Research oil spill cleanup techniques prior to a spill
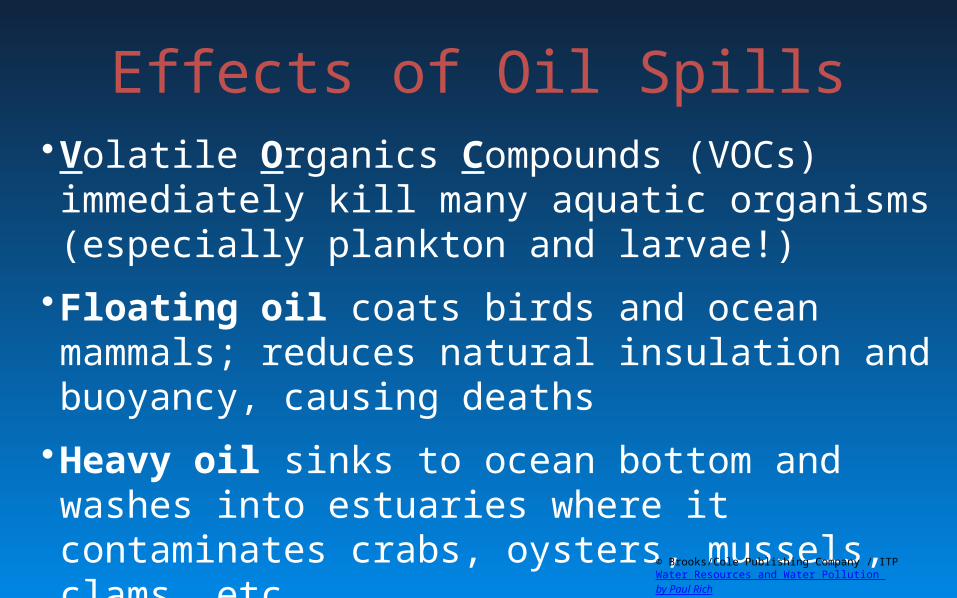
•Volatile Organics Compounds (VOCs) immediately kill many aquatic organisms (especially plankton and larvae!)
•Floating oil coats birds and ocean mammals; reduces natural insulation and buoyancy, causing deaths
•Heavy oil sinks to ocean bottom and washes into estuaries where it contaminates crabs, oysters, mussels, clams, etc.
•Oil slicks on beaches harm intertidal life and cause economic losses to tourism and fishing industries
Effects of Oil Spills
© Brooks/Cole Publishing Company / ITP Water Resources and Water Pollution by Paul Rich

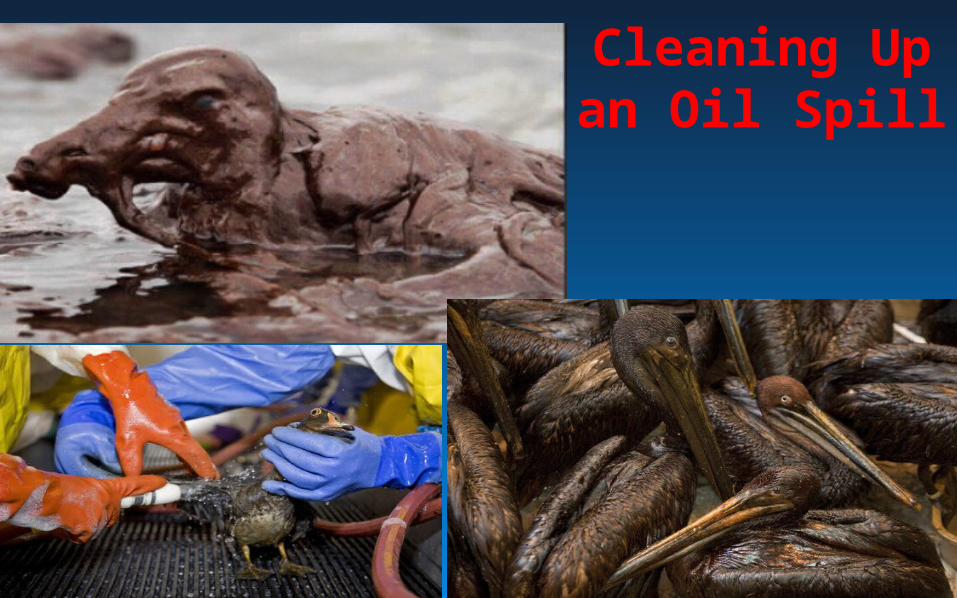
Cleaning Up an Oil Spill
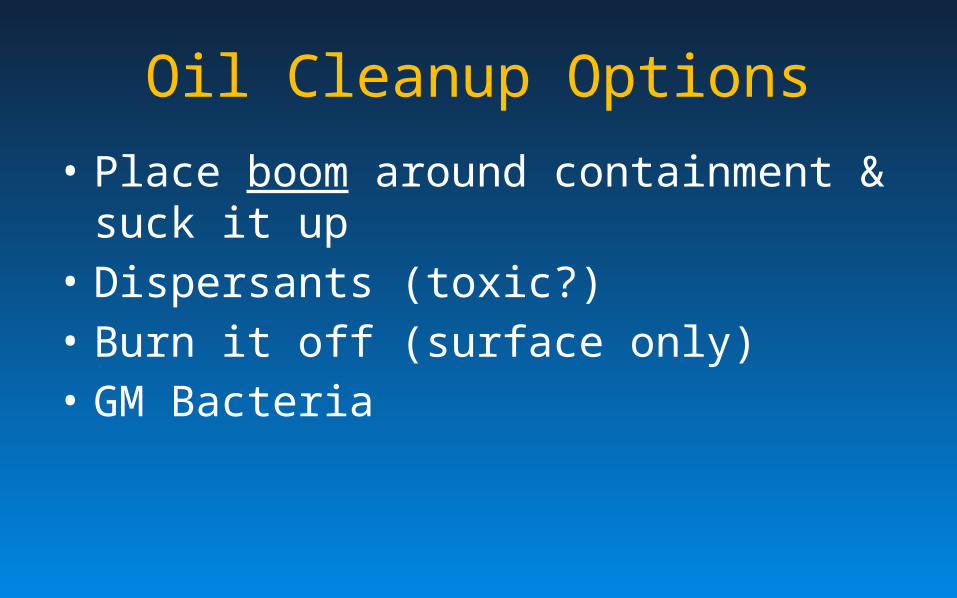
Oil Cleanup Options
• Place boom around containment & suck it up• Dispersants (toxic?)• Burn it off (surface only)• GM Bacteria
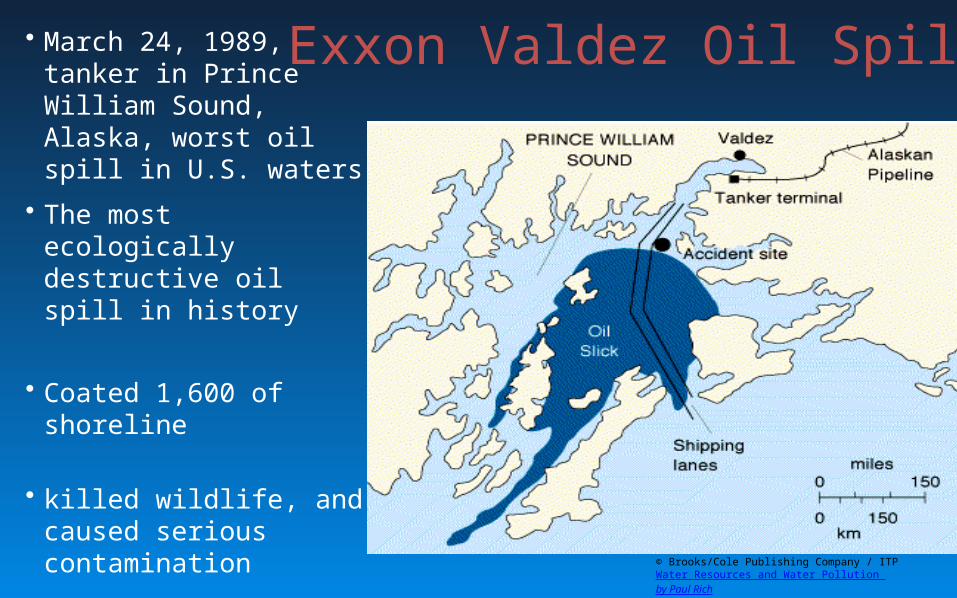
• March 24, 1989, tanker in Prince William Sound, Alaska, worst oil spill in U.S. waters
• The most ecologically destructive oil spill in history
• Coated 1,600 of shoreline
• killed wildlife, and caused serious contamination
• Exxon spent billions for clean up and fines
Exxon Valdez Oil Spill
© Brooks/Cole Publishing Company / ITP Water Resources and Water Pollution by Paul Rich
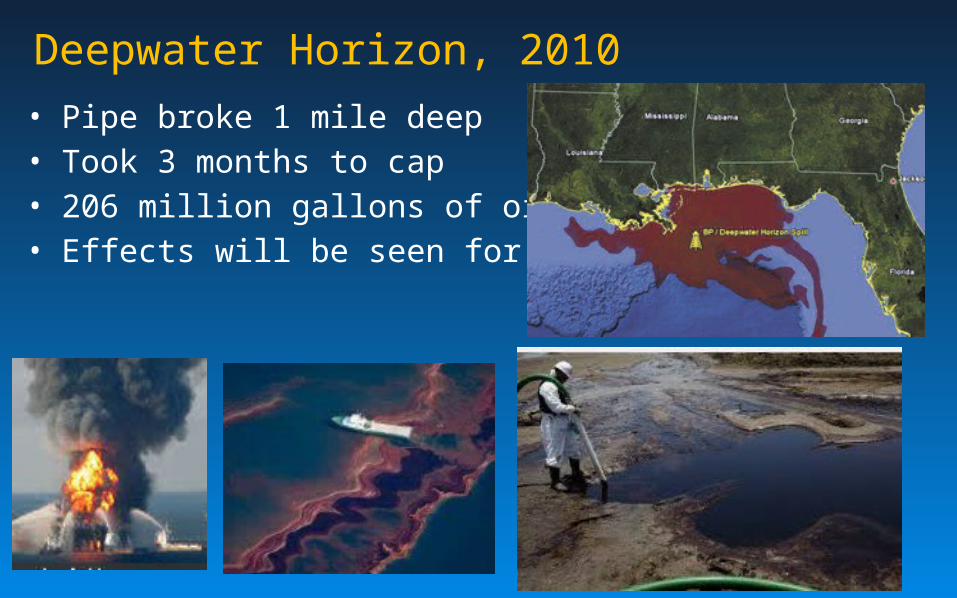
Deepwater Horizon, 2010• Pipe broke 1 mile deep• Took 3 months to cap• 206 million gallons of oil• Effects will be seen for decades
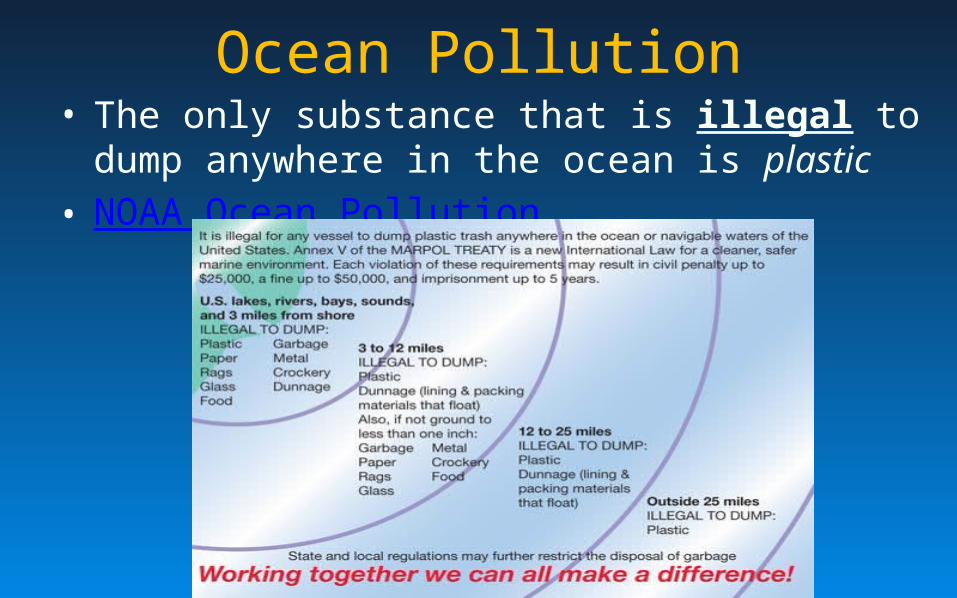
Ocean Pollution• The only substance that is illegal to dump anywhere in
the ocean is plastic • NOAA Ocean Pollution
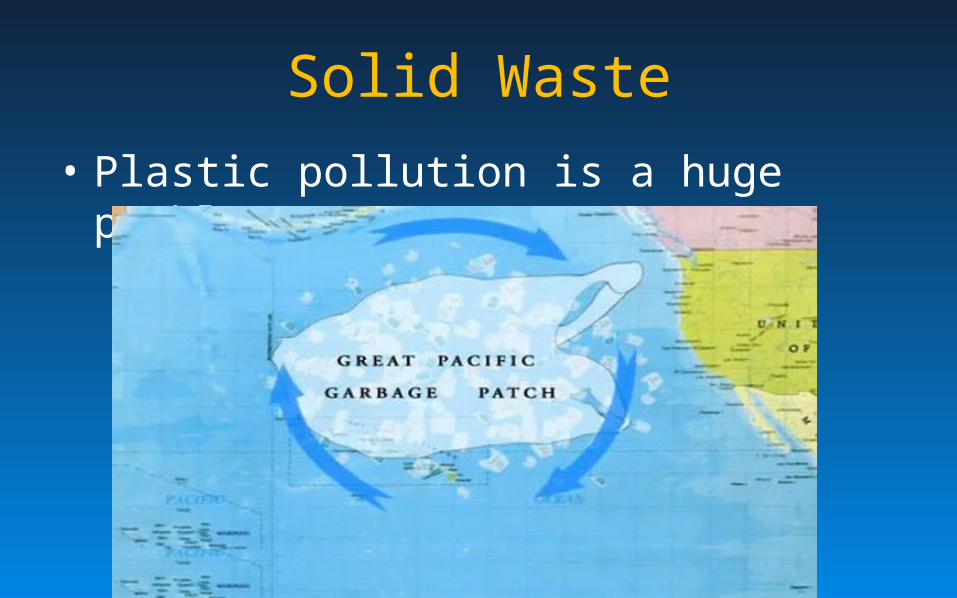
Solid Waste
• Plastic pollution is a huge problem!
Preventing Water Pollution• Protect wetland and riparian habitat• Use less chemicals, energy, and manufactured products that
contain plastic or metal• Minimize the use of agricultural chemicals (inorganic fertilizer,
pesticide, soil stabilizers, etc)• Develop effective storm water runoff systems• Develop and enforce strict safety requirements for oil drilling
and transport• Minimize runoff from all sources• Treat contaminated water prior to release into the
environment (waste water treatment)
Cleaning Up Polluted Water
• Immediately reduce or eliminate pollution discharges into the water body
• Bacteria can be used to clean up organic or oil pollution
• Dredge contaminated soil out of the water body – will temporarily increase water pollution
70
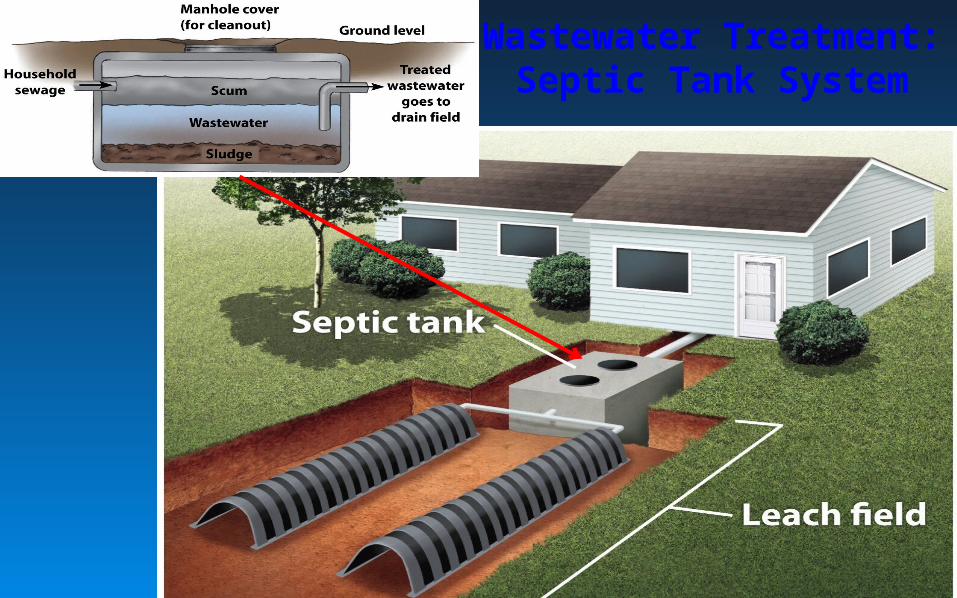
Wastewater Treatment:Septic Tank System
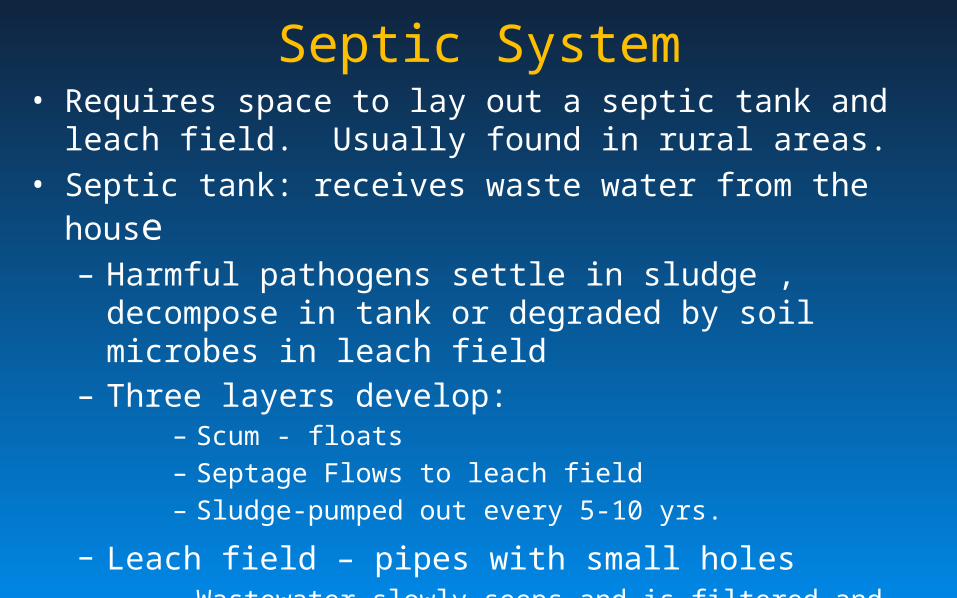
Septic System• Requires space to lay out a septic tank and leach field. Usually
found in rural areas.• Septic tank: receives waste water from the house
– Harmful pathogens settle in sludge , decompose in tank or degraded by soil microbes in leach field
– Three layers develop:– Scum - floats– Septage Flows to leach field– Sludge-pumped out every 5-10 yrs.
– Leach field – pipes with small holes – Wastewater slowly seeps and is filtered and decomposed– Nutrients are recycled by other plants / organisms
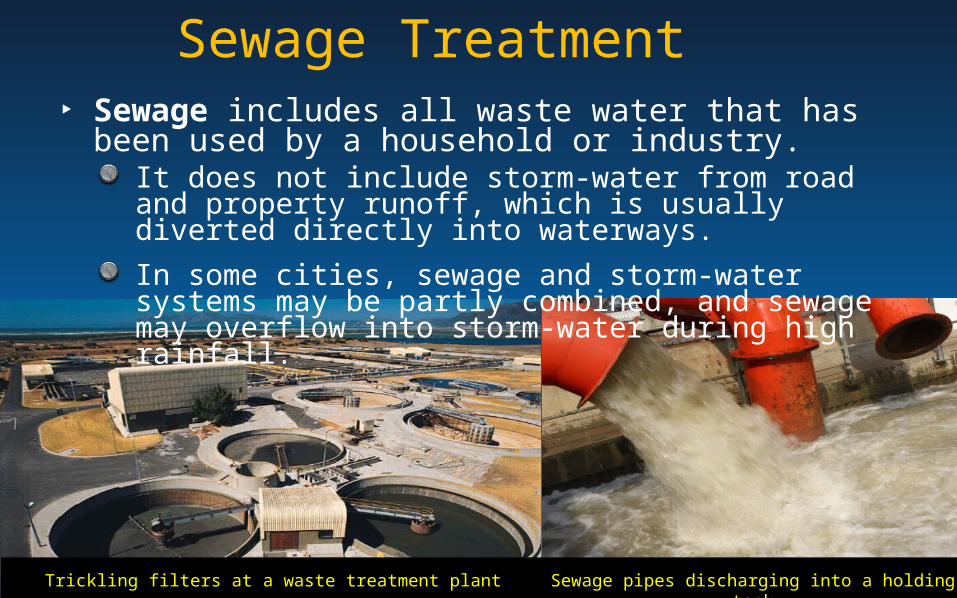
‣ Sewage includes all waste water that has been used by a household or industry.
It does not include storm-water from road and property runoff, which is usually diverted directly into waterways.
In some cities, sewage and storm-water systems may be partly combined, and sewage may overflow into storm-water during high rainfall.
Sewage Treatment
Trickling filters at a waste treatment plant Sewage pipes discharging into a holding tank
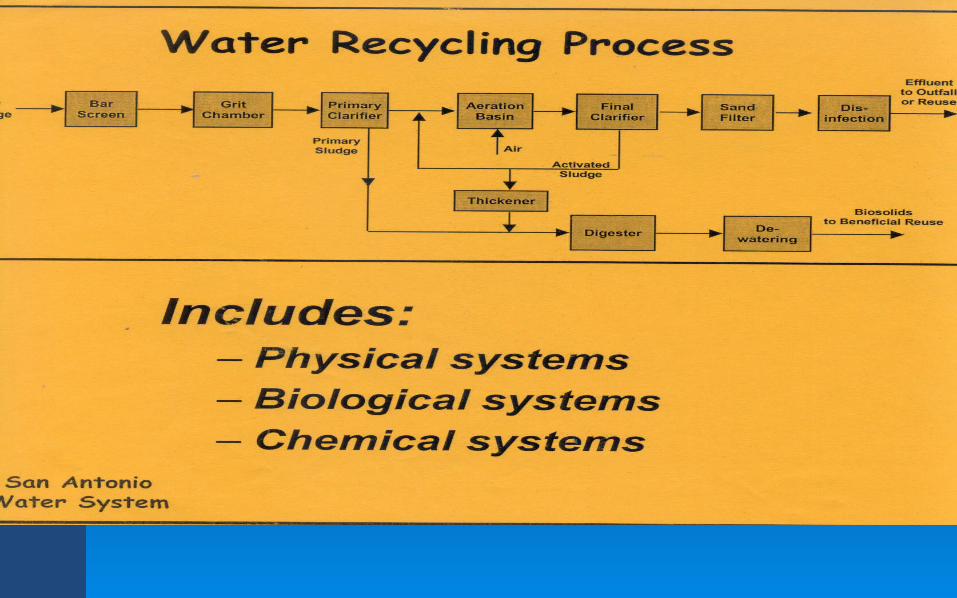
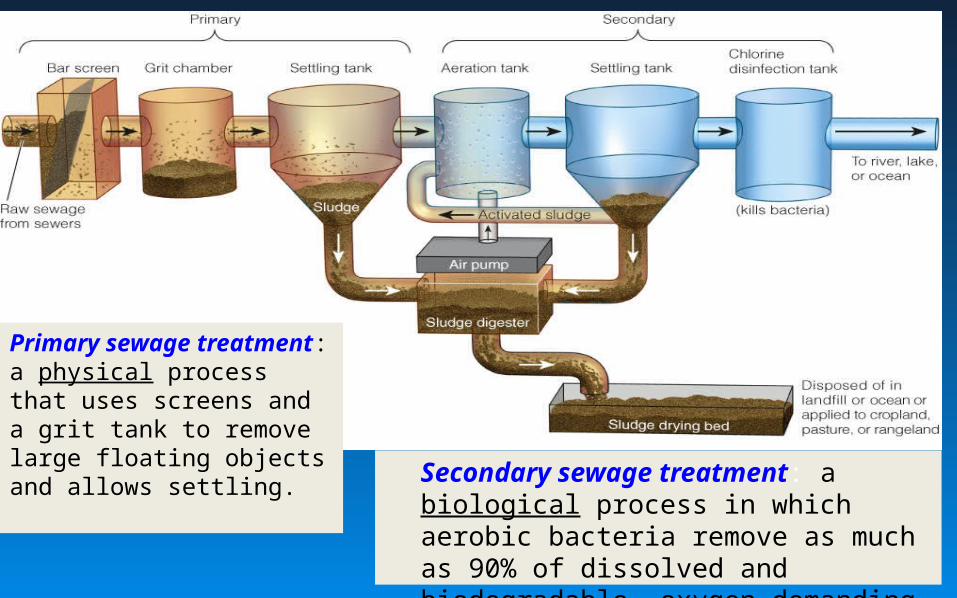
Secondary sewage treatment: a biological process in which aerobic bacteria remove as much as 90% of dissolved and biodegradable, oxygen demanding organic wastes.
• .
Primary sewage treatment: a physical process that uses screens and a grit tank to remove large floating objects and allows settling.
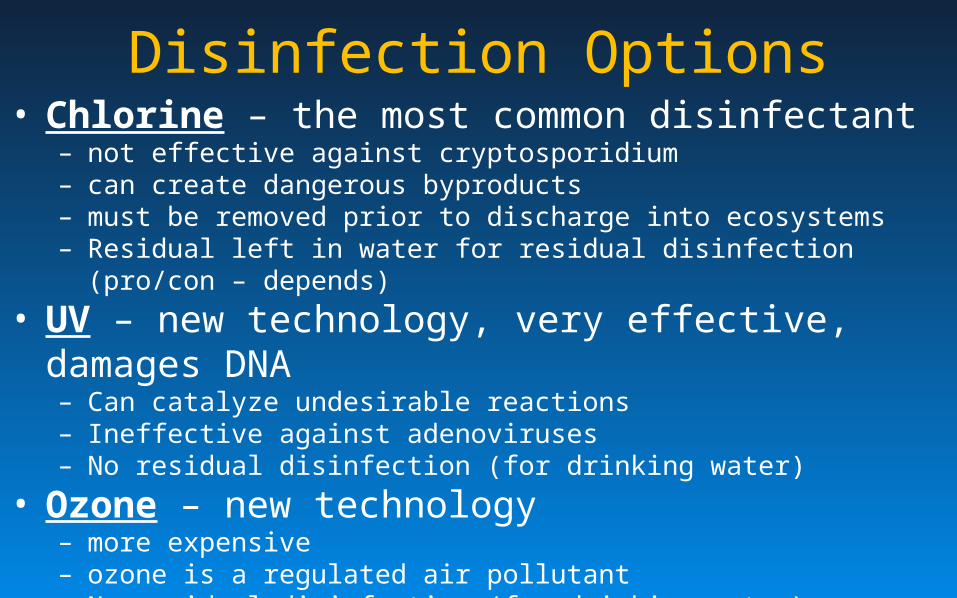
Disinfection Options• Chlorine – the most common disinfectant
– not effective against cryptosporidium– can create dangerous byproducts– must be removed prior to discharge into ecosystems– Residual left in water for residual disinfection (pro/con – depends)
• UV – new technology, very effective, damages DNA– Can catalyze undesirable reactions– Ineffective against adenoviruses – No residual disinfection (for drinking water)
• Ozone – new technology – more expensive– ozone is a regulated air pollutant– No residual disinfection (for drinking water)– Can form unintended byproducts
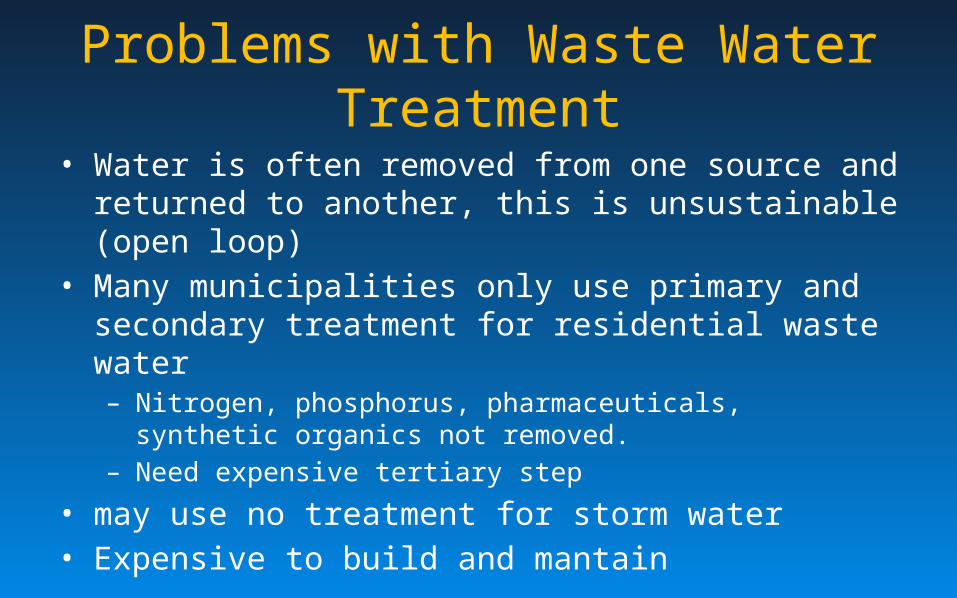
Problems with Waste Water Treatment
• Water is often removed from one source and returned to another, this is unsustainable (open loop)
• Many municipalities only use primary and secondary treatment for residential waste water – Nitrogen, phosphorus, pharmaceuticals, synthetic organics not
removed.– Need expensive tertiary step
• may use no treatment for storm water• Expensive to build and mantain
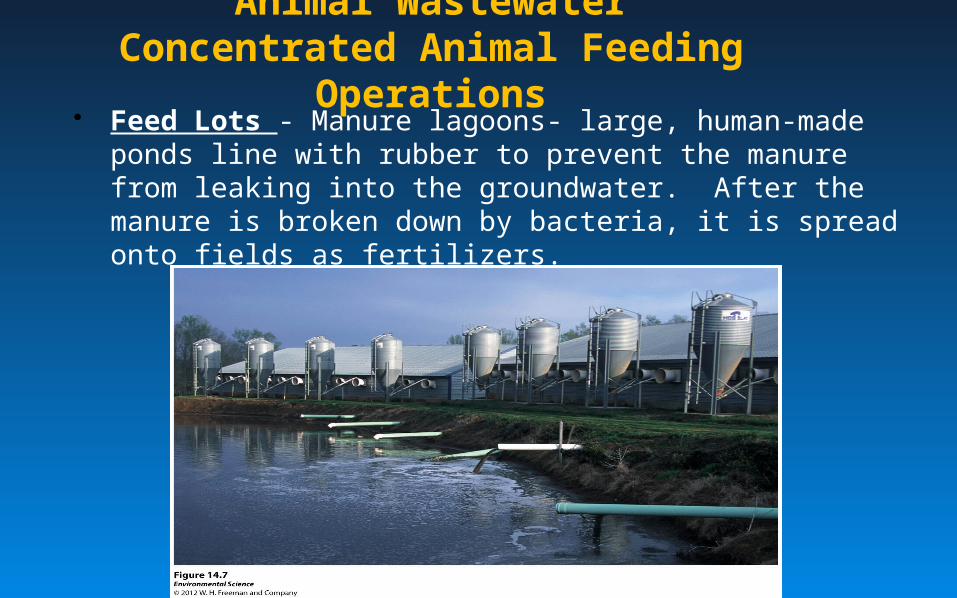
Animal WastewaterConcentrated Animal Feeding
Operations Feed Lots - Manure lagoons- large, human-made ponds
line with rubber to prevent the manure from leaking into the groundwater. After the manure is broken down by bacteria, it is spread onto fields as fertilizers.
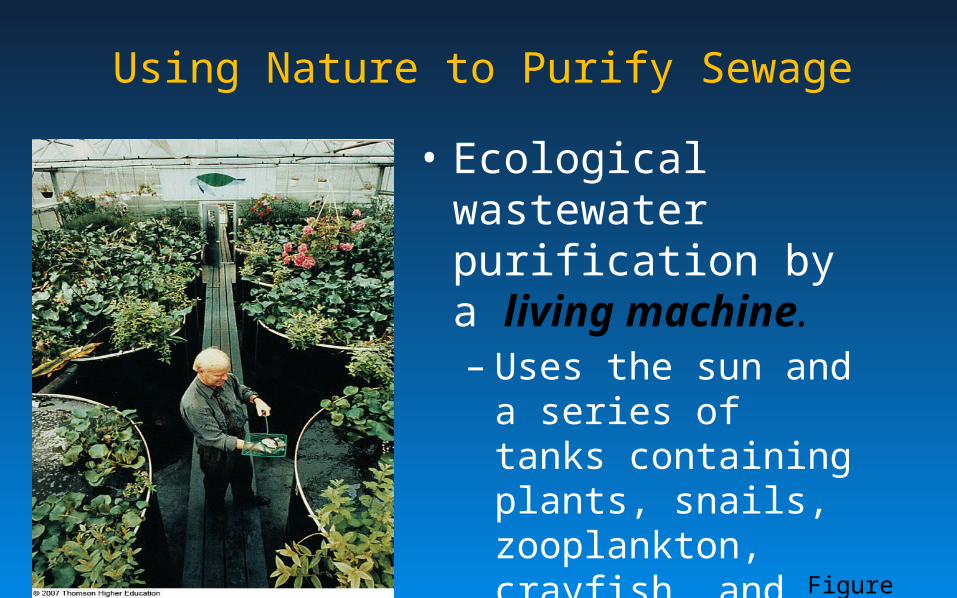
Using Nature to Purify Sewage
• Ecological wastewater purification by a living machine.– Uses the sun and a
series of tanks containing plants, snails, zooplankton, crayfish, and fish (that can be eaten or sold for bait).
Figure 21-1
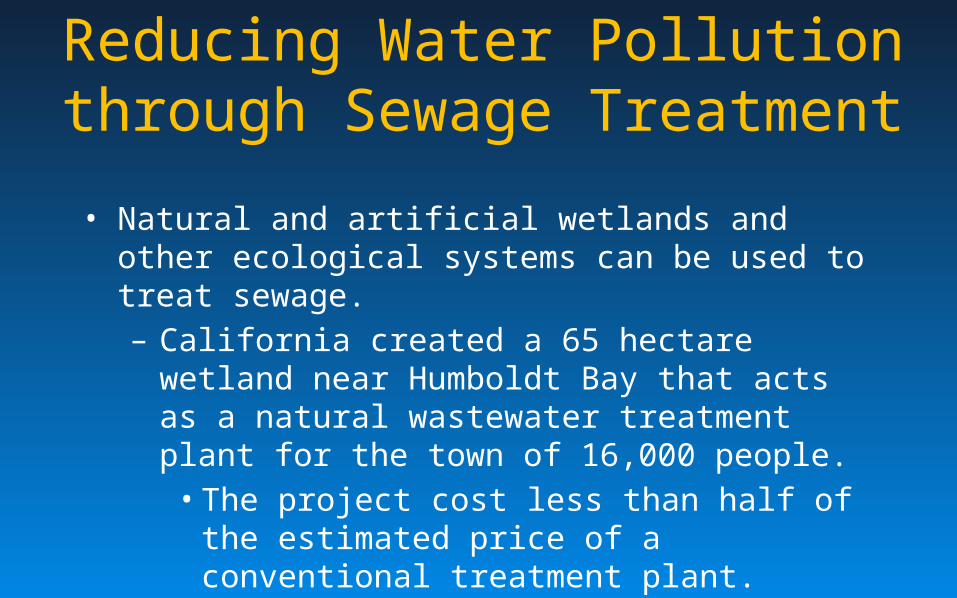
Reducing Water Pollution through Sewage Treatment
• Natural and artificial wetlands and other ecological systems can be used to treat sewage.– California created a 65 hectare wetland near Humboldt
Bay that acts as a natural wastewater treatment plant for the town of 16,000 people.
• The project cost less than half of the estimated price of a conventional treatment plant.
Green Waste Water• Modern waste water treatment plants expensive• Use a series of greenhouses & wetlands - Purify water: effective & affordable
– Aesthetically pleasing – no odor– Many of the same processes of traditional treatment plants
• Waste water flows into holding tanks• Pumped into series of transparent tanks• Microbes, snails algae, plants – grow & consume nutrients• Air is bubbled thru to get aerobic decomp - Anaerobic decomp = smell• Liquid coming out held – solids settle• Water is filtered thru sand then artificial wetlands• Denitrifying bacteria removes Nitrogen• Water is exposed to UV light to kill viruses & bacteria• Released to leach field to by filtered by soil
Water Quality Laws
Clean Water Act
• The Clean Water Act is a 1977 amendment to the Federal Water Pollution Control Act of 1972– Set the basic structure for regulating discharges of
pollutants in the US– The law gave EPA the authority to set water quality
standards for industry and for all contaminants in surface waters
• Designed to protect fishing, swimming and the ecosystem health
• Goal: Make lakes & streams fishable & swimmable
Clean Water Act• Sets up the National Pollutant Discharge Elimination
System (NPDES)– Regulates point sources of pollution by requiring a permit to discharge
any pollutant into a navigable waterway.
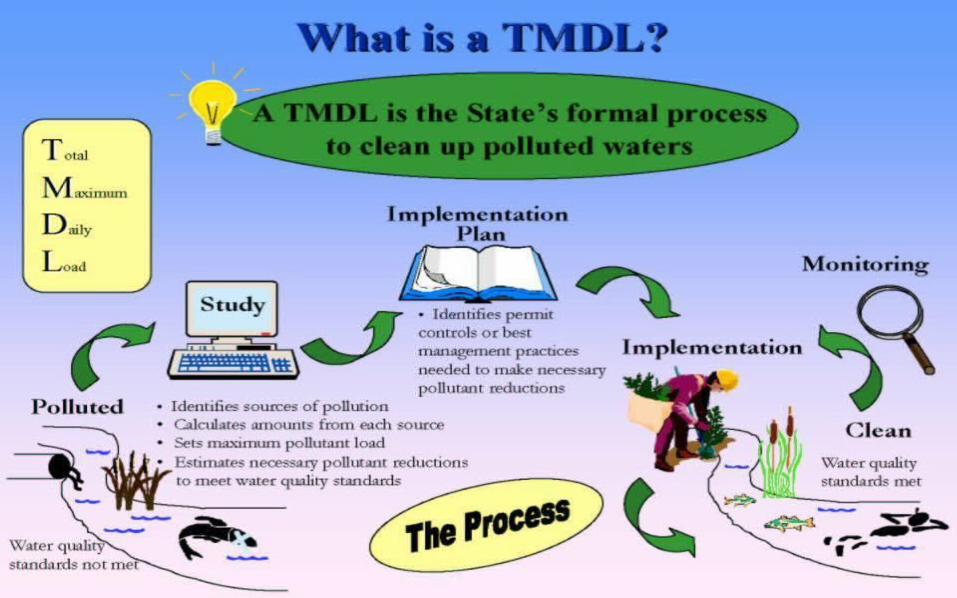
• Total Maximum Daily Load (TMDL)– sets daily limits for total pollutant discharges into impaired
water bodies (on 303d list)– Set based on the maximum pollution levels the water body
can receive and still meet water quality standards
Safe Drinking Water Act
• The Safe Drinking Water Act (1974) was established to protect the quality of drinking water in the U.S
• This law focuses on all waters actually or potentially designed for drinking use, whether from above ground or underground sources
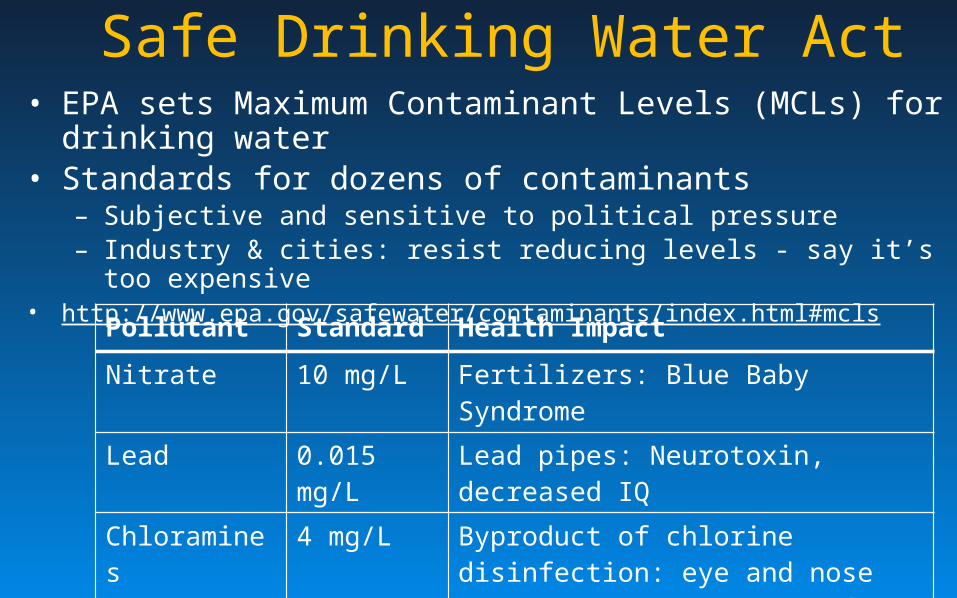
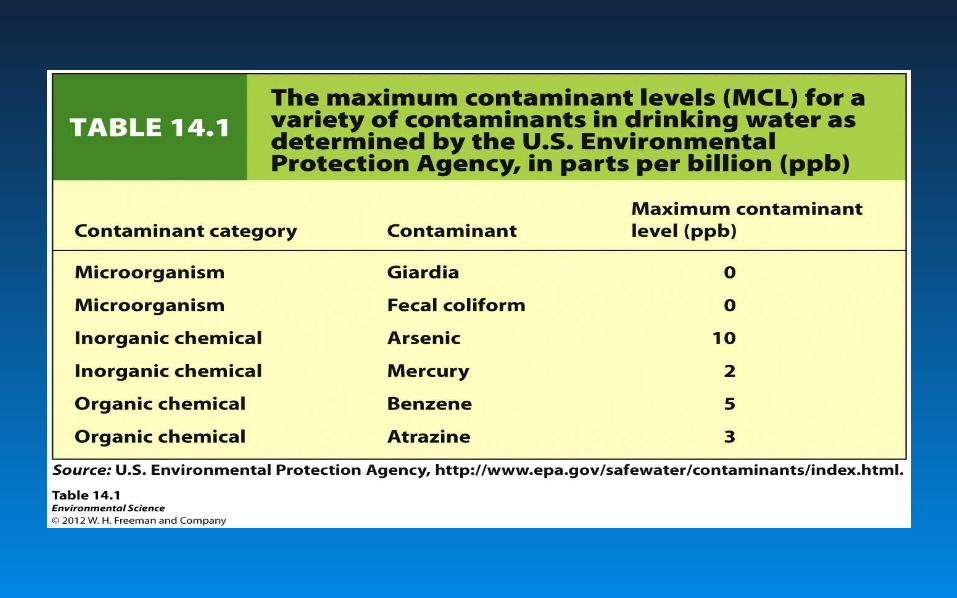
Safe Drinking Water Act• EPA sets Maximum Contaminant Levels (MCLs) for drinking water• Standards for dozens of contaminants
– Subjective and sensitive to political pressure– Industry & cities: resist reducing levels - say it’s too expensive
• http://www.epa.gov/safewater/contaminants/index.html#mcls
Pollutant Standard Health Impact
Nitrate 10 mg/L Fertilizers: Blue Baby Syndrome
Lead 0.015 mg/L Lead pipes: Neurotoxin, decreased IQChloramines 4 mg/L Byproduct of chlorine disinfection: eye and
nose irritant, stomach discomfort
PCBs 0.0005 mg/L Industrial processes: increased cancer risk, reproductive issues
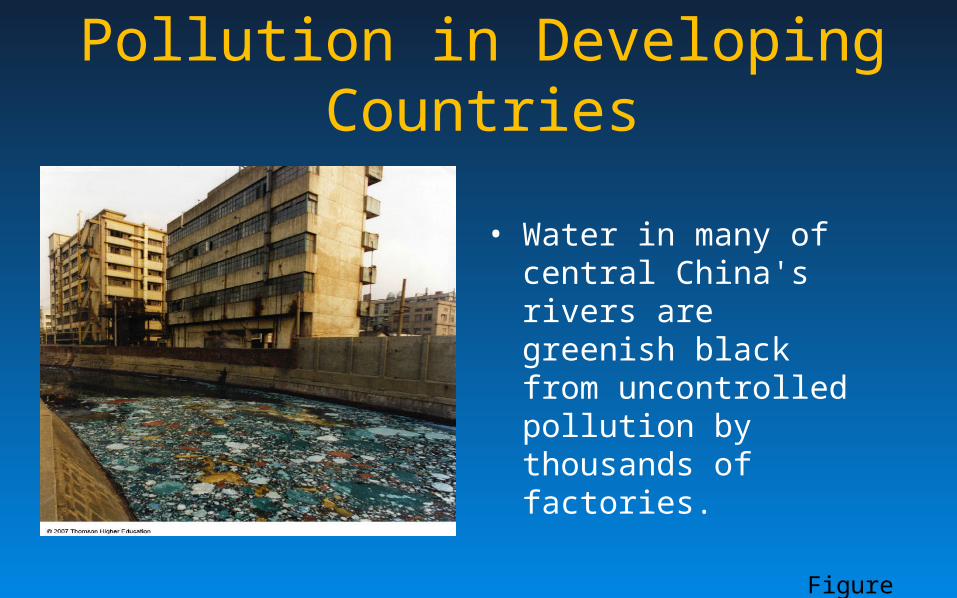
Pollution in Developing Countries
• Water in many of central China's rivers are greenish black from uncontrolled pollution by thousands of factories.
Figure 21-5
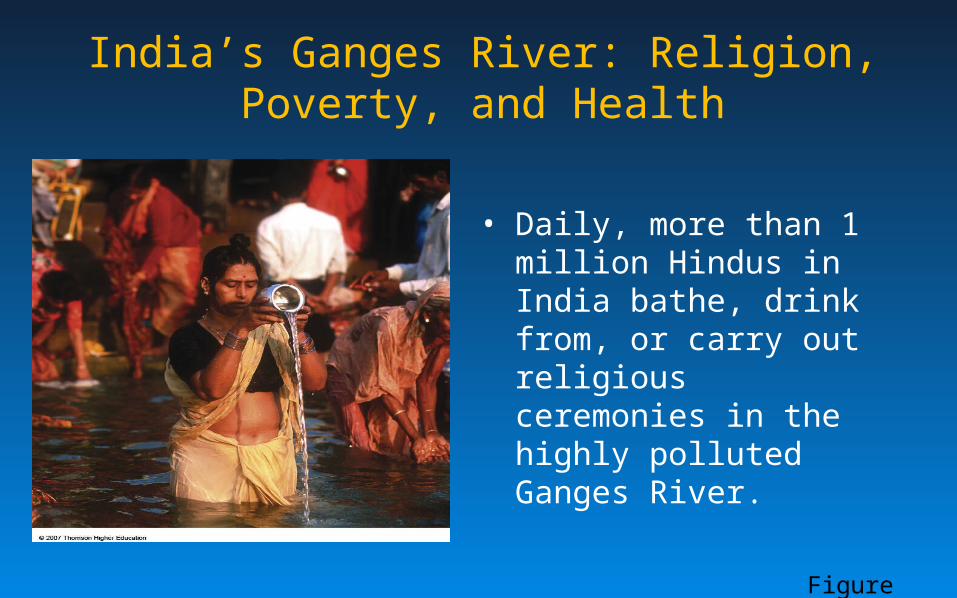
India’s Ganges River: Religion, Poverty, and Health
• Daily, more than 1 million Hindus in India bathe, drink from, or carry out religious ceremonies in the highly polluted Ganges River.
Figure 21-6
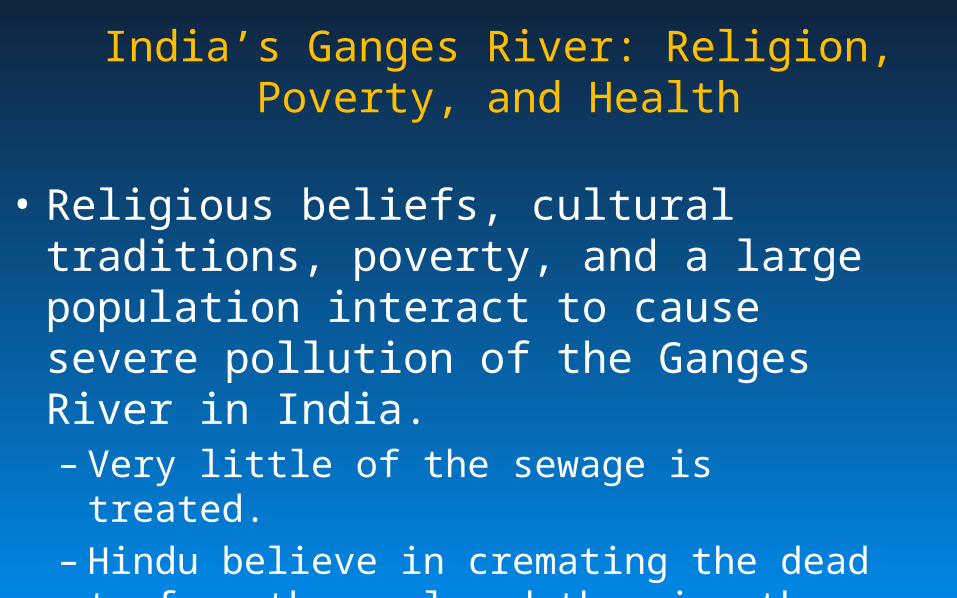
India’s Ganges River: Religion, Poverty, and Health
• Religious beliefs, cultural traditions, poverty, and a large population interact to cause severe pollution of the Ganges River in India.– Very little of the sewage is treated.– Hindu believe in cremating the dead to free the soul
and throwing the ashes in the holy Ganges.• Some are too poor to afford the wood to fully cremate.• Decomposing bodies promote disease and depletes DO.