water pollution and monitoring of water quality - cffet.netcffet.net/envan/3_water_test.pdf ·...
TRANSCRIPT
Chapter 3
22
Water Pollution and Monitoring of Water Quality In this chapter the important water pollutants, the major sources of water pollution and
methods for reliable sampling and evaluation of water will be studied.
A clean and plentiful water supply is one of the essential components of an advanced society.
Much of the illness and disease that have afflicted the human population throughout history
(and even today) are water borne. Currently, and in the future, we face a new menace in that
our industrial activities are now adding to normal domestic refuse (such as solid and liquid
waste and faecal matter) in polluting our water supplies. In this chapter we will examine
important water pollutants and highlight major sources of water pollution.
The hydrosphere is a dynamic system. The following processes and concepts play an
important part in water chemistry:
• Equilibrium: Le Chatelier’s Principle is important in understanding water chemistry
as many stresses are placed on the solution process.
• Acid/Base: often referred to as alkalinity ie the ability to neutralise added hydrogen
ions and is expressed as an equivalent amount of CaCO3 in mg/ and acidity or the
ability of the water to neutralise hydroxyl ions.
• Redox: in the environment many redox reactions are carried out with the assistance
of bacteria.
• Complexation and Chelation: metal ions are complexed to water molecules as
hydrated ions ie M(H2O)xn+
.
• Colloids: have an extremely large surface area on which chemical reactions may
occur.
Pure water does not exist in the environment. Reasons for this include:
• Rain water dissolves gases as it falls
• Rain water on the surface can dissolve rocks and minerals
• Groundwater contains dilute solutions of many inorganic and organic compounds
Anything that changes water from its original natural condition is defined as pollution.
Major sources of pollution of surface water include sewage and domestic waste, waste runoff
from agriculture, mining activities, building and construction and many others. Countless
potentially harmful substances generated by industrial activity are passed in wastewater
discharge to surface waters. Other activities such as clearing of vegetation, and application of
impermeable surface coatings (such as roads and pavements) dramatically alters the way
runoff occurs from heavy rain – often leading to erosion of surface materials which block off
or alter waterways – a process known as siltation. Heavy rain may also penetrate waste
disposal sites and carry associated liquid waste into surface water.
Water underground is also affected by pollution. As it arrives in the aquifer by percolation
through layers of soil and rock, it can leach out any materials including toxic substances, and
carry these down into the underground storage system.
It must be stressed that not all pollution is man made. Natural “pollution” is also a substantial
contributor to degradation of water quality. Processes such as erosion and siltation and oil
pollution are found on enormous scale throughout the entire Earth. In fact from a global
Chapter 3
23
perspective the pollution caused by nature is greater than that caused by man – the difference
is that man made pollution tends to be concentrated into smaller areas. This often overloads
the natural cleansing properties of the environment leading to the undesirable effects that
most call “water pollution”.
Water pollutants have been classified into 8 categories although as with any dynamic system
there will be some overlap. You need to be able to:
• identify the 8 categories
• explain the effects of these on the environment,
• explain the testing for pollutants that fit into each category
• know how to take a reliable sample
Categories of Water Pollutants
1. Oxygen-demanding wastes
2. Infectious agents
3. Plant nutrients
4. Organic chemicals
5. Inorganic elements and compounds
6. Sediments
7. Radioactive materials
8. Heat
Oxygen Demanding Wastes
This refers to wastes that are responsible for the consumption of oxygen in the marine
environment. It includes both
• biological (BOD) factors
• chemical (COD) factors
Essentially depletion of oxygen levels in the aqueous environment leads to death of most
species. Cold water fish for example require at least 5ppm of dissolved oxygen to survive.
Saturated fresh water contains about 9ppm so there is little tolerance for contamination of
waterways with oxygen demanding wastes. One species that does not require oxygen to
survive is the anaerobic bacteria. These do not need oxygen to carry out their metabolic
processes and so thrive in stagnant waters.
Without an appreciable level of dissolved oxygen, many kinds of aquatic organisms cannot
exist in water. Dissolved oxygen is consumed by the degradation of organic matter in water.
Many fish kills result not from the direct toxicity of pollutants, but from oxygen deficiency as
a result of its consumption in the biodegradation of pollutants.
Class Exercise
What processes can result in an increase of the oxygen level dissolved in water
Chapter 3
24
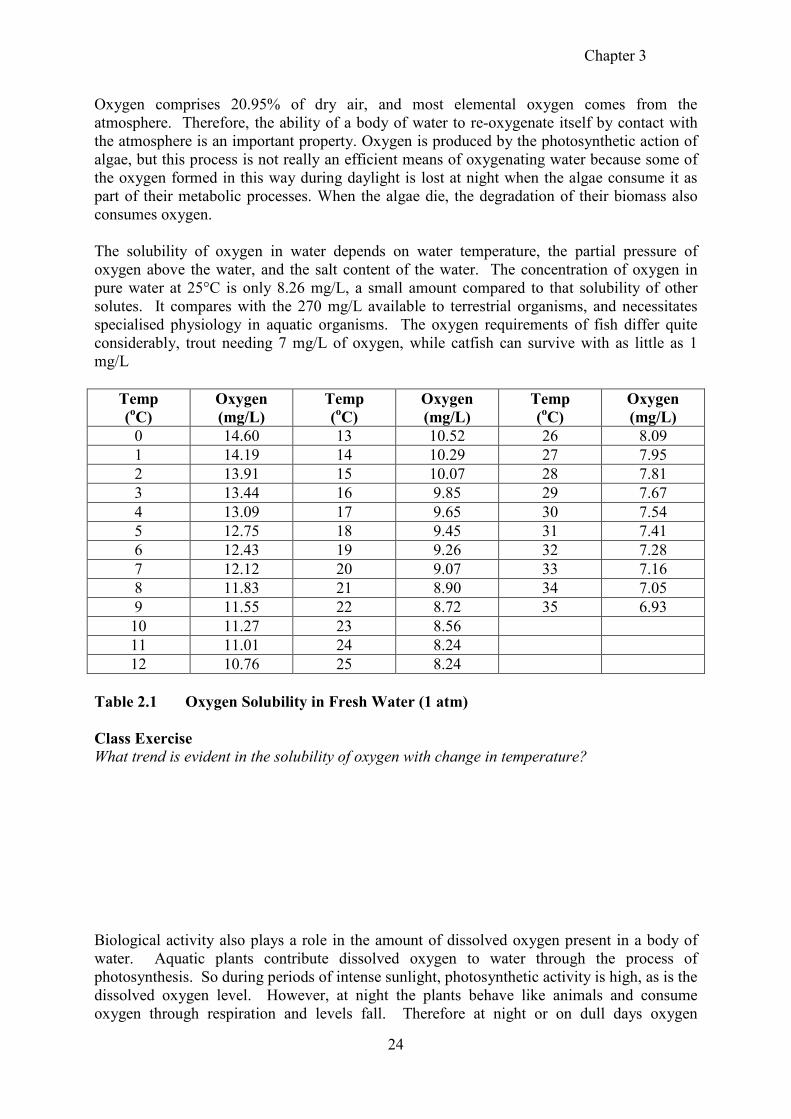
Oxygen comprises 20.95% of dry air, and most elemental oxygen comes from the
atmosphere. Therefore, the ability of a body of water to re-oxygenate itself by contact with
the atmosphere is an important property. Oxygen is produced by the photosynthetic action of
algae, but this process is not really an efficient means of oxygenating water because some of
the oxygen formed in this way during daylight is lost at night when the algae consume it as
part of their metabolic processes. When the algae die, the degradation of their biomass also
consumes oxygen.
The solubility of oxygen in water depends on water temperature, the partial pressure of
oxygen above the water, and the salt content of the water. The concentration of oxygen in
pure water at 25°C is only 8.26 mg/L, a small amount compared to that solubility of other
solutes. It compares with the 270 mg/L available to terrestrial organisms, and necessitates
specialised physiology in aquatic organisms. The oxygen requirements of fish differ quite
considerably, trout needing 7 mg/L of oxygen, while catfish can survive with as little as 1
mg/L
Temp
(oC)
Oxygen
(mg/L)
Temp
(oC)
Oxygen
(mg/L)
Temp
(oC)
Oxygen
(mg/L)
0 14.60 13 10.52 26 8.09
1 14.19 14 10.29 27 7.95
2 13.91 15 10.07 28 7.81
3 13.44 16 9.85 29 7.67
4 13.09 17 9.65 30 7.54
5 12.75 18 9.45 31 7.41
6 12.43 19 9.26 32 7.28
7 12.12 20 9.07 33 7.16
8 11.83 21 8.90 34 7.05
9 11.55 22 8.72 35 6.93
10 11.27 23 8.56
11 11.01 24 8.24
12 10.76 25 8.24
Table 2.1 Oxygen Solubility in Fresh Water (1 atm)
Class Exercise
What trend is evident in the solubility of oxygen with change in temperature?
Biological activity also plays a role in the amount of dissolved oxygen present in a body of
water. Aquatic plants contribute dissolved oxygen to water through the process of
photosynthesis. So during periods of intense sunlight, photosynthetic activity is high, as is the
dissolved oxygen level. However, at night the plants behave like animals and consume
oxygen through respiration and levels fall. Therefore at night or on dull days oxygen
Chapter 3
25
depletion is greater than oxygen replenishment resulting in an overall reduction in dissolved
oxygen. This is particularly evident during periods of algal blooms when the levels may be as
high as 150 to 200 per cent saturation during the day and drop overnight to 0 to 5 per cent
saturation. Such occurrences have occurred from time to time in the rivers throughout
western NSW and even in the Hawkesbury-Nepean and Paramatta Rivers.
If oxygen-consuming processes are occurring in the water, the dissolved oxygen level may
rapidly approach zero unless some efficient mechanism for the re-aeration of water is
operative, such as turbulent flow in a shallow stream or air pumped into the aeration tank of
waste treatment facility. The problem becomes one of kinetics, in which there is a limit to the
transport of oxygen across the air-water interface.
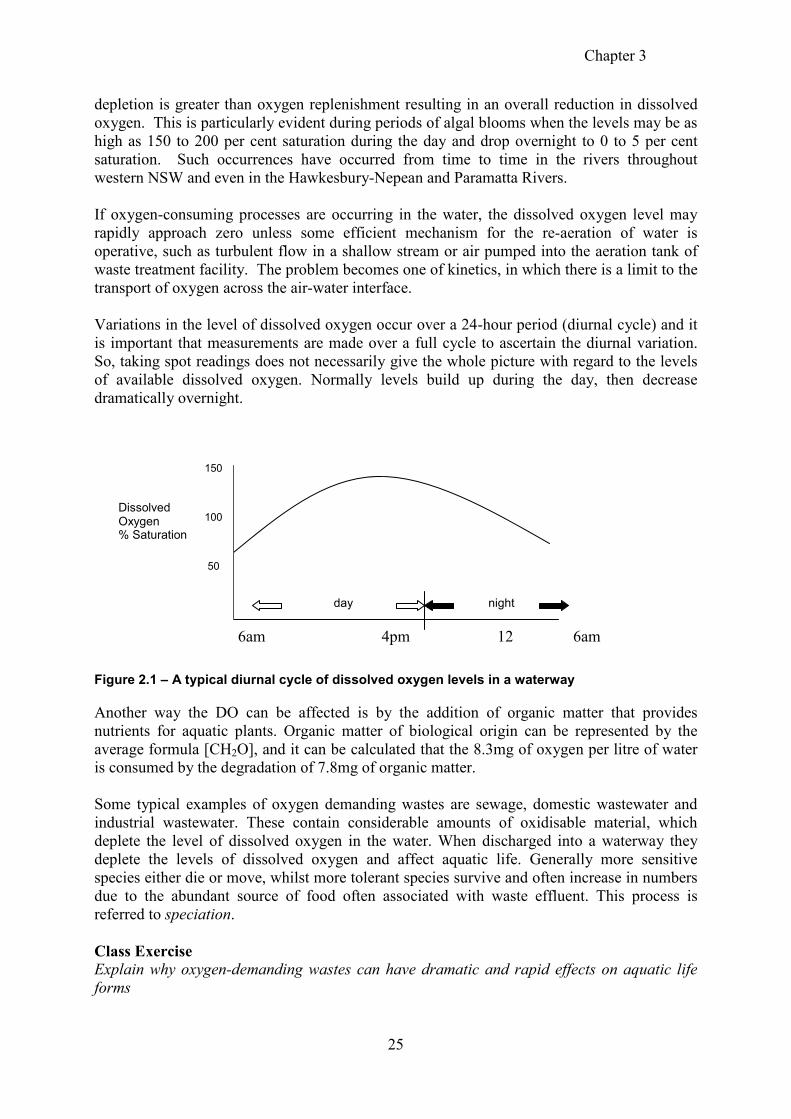
Variations in the level of dissolved oxygen occur over a 24-hour period (diurnal cycle) and it
is important that measurements are made over a full cycle to ascertain the diurnal variation.
So, taking spot readings does not necessarily give the whole picture with regard to the levels
of available dissolved oxygen. Normally levels build up during the day, then decrease
dramatically overnight.
6am 4pm 12 6am
Figure 2.1 – A typical diurnal cycle of dissolved oxygen levels in a waterway
Another way the DO can be affected is by the addition of organic matter that provides
nutrients for aquatic plants. Organic matter of biological origin can be represented by the
average formula [CH2O], and it can be calculated that the 8.3mg of oxygen per litre of water
is consumed by the degradation of 7.8mg of organic matter.
Some typical examples of oxygen demanding wastes are sewage, domestic wastewater and
industrial wastewater. These contain considerable amounts of oxidisable material, which
deplete the level of dissolved oxygen in the water. When discharged into a waterway they
deplete the levels of dissolved oxygen and affect aquatic life. Generally more sensitive
species either die or move, whilst more tolerant species survive and often increase in numbers
due to the abundant source of food often associated with waste effluent. This process is
referred to speciation.
Class Exercise
Explain why oxygen-demanding wastes can have dramatic and rapid effects on aquatic life
forms
night day
Dissolved Oxygen % Saturation
150 100 50

Chapter 3
26
Infectious Agents
This refers to any biohazardous material that is released into waterways. Generally these are
the result of pollution from sources such as sewage, but occasionally other sources such as
hospital waste are uncovered. Infectious agents which are commonly found include bacteria
such as:
• coliform (tests for both total and faecal are carried out)
• faecal streptococci
• salmonella
• sphacrotilus
• crenothrix (iron bacteria)
• intestinal viruses
Biohazardous material is unlike other water pollutants in that the cause of the pollution (the
infectious agent) is able to replicate (and therefore greatly increase the level of pollution)
given appropriate conditions, and it is also transmissible. For these reasons this is a very
dangerous form of water pollution.
The diseases that are spread by infectious agents through water include:
• cholera
• typhoid
• gastroenteritis
• shigella
• tuberculosis
• hepatitis
• viral infections
• giardiasis
Diseases may be transmitted by either endogenous or exogenous infection. The former refers
to diseases that occur by the infectious agent entering the body. Exogenous agents refer to
those that originate outside the body by contact with another being or object. Four factors are
required for transmission of infection:
• a suitable host
• an organism capable of invading the body
• an environment for replication and support of the organism
• a means of transferring the organism to the host
Measures to control infectious agents generally revolve around prevention of transfer. This
may be achieved through measures such as sterilisation of public water supplies by
chlorination. This prevents the transfer of infectious material by water to the host – in this
case human beings.
It is very difficult to rapidly identify all of the possible disease causing species in water. For
this reason scientists have developed testing procedures which indicate the likely presence of
disease causing agents. The test revolves around the bacterium Escherichia Coli or E.Coli for
short. This is a fairly harmless bacterium found in abundance in faecal material. As faecal
material is by far the most important source of E.Coli it may be concluded that water which
contains large amounts of this bacterium may also contain other far more dangerous
biohazardous material also associated with sewage. Whilst this has not been found to be
Chapter 3
27
completely true it is still the most effective method for rapidly establishing the bacterial
quality of water.
The levels of infectious agents in water supplies and bodies of water are normally followed by
colony counts (such as total coliform). These monitor the levels of coliform bacilli, especially
E.Coli, by counting the number of colonies that form on a nutrient plate from a standard sized
sample of water after incubation.
In 1998 the parasitic protozoa Giardia lamblia and Cryptosporidium infected Sydney’s water
supply, with substantial economic consequences associated wit the need to boil water before
use. Giardia lamblia can survive in water for periods of up to 3 months. Ingestion of this
parasite in contaminated drinking water, exposure from person to person contact, or other
exposure routes can lead to Giardiasis – a gastrointestinal disease which may cause fatigue,
abdominal cramps and diarrhoea for several months after infection. Cryptosporidium causes
the disease cryptosporosis, which has similar symptoms to giardiasis except that they may be
more pronounced. They generally last for only 1 – 2 weeks. Deaths have occurred from
cryptosporosis. Cryptosporidium is transmitted in similar fashion to Giardia lamblia.
Class Exercise
Cholera and typhoid frequently are found in the days/weeks following natural disasters
particularly in the developing countries. Why do you think this is the case?
Plant nutrients
This refers to phosphates, nitrates and fertiliser decomposition products. These often end up
in our waterways through run off from urban areas, industrial activities or agricultural
enterprise. The main sources contributing to the nutrient load of our waterways are:
• sewage
• agricultural run-off
• animal waste
• detergents (other than in sewage).
Not all nutrients reaching aquatic plants come from human sources. Natural processes
involving eroded soils and dissolved nutrients supply nutrients, including carbon, nitrogen,
phosphorus, sulfur, potassium and trace minerals to estuaries, lakes and other waterways.
Atmospheric processes also contribute to this pool of nutrients. This process of natural
enrichment is referred to as eutrophication, that is the state of being well nourished.
On the other hand the excessive release of nutrients to the aquatic environment from human
activities described above, accelerates the normal process of eutrophication and is referred to
as cultural eutrophication.
Chapter 3
28
Lakes and slow-moving streams tend to trap these nutrient materials. High levels in the water
lead to the growth of "algal blooms". These are simply areas of waterways where algae have
multiplied out of control choking the waterway and totally depleting the system of oxygen.
When all of the dissolved oxygen is consumed the algae then die off leaving a putrid smelling
mass.
Class Exercise
What effect would removal of the dissolved oxygen have on a waterway
Another term, oligotrophic, refers to the normal condition of a waterway, where the nutrient
concentrations, biomass of living plants and dead plant matter are low, the water is clear and
the dissolved oxygen levels high. These conditions suit the majority of aquatic species.
The main causes of accelerated eutrophication include:
• sewage
• detergents
• fertilisers
Sewage
The discharge of untreated or primary sewage into an aquatic area causes de-oxygenation (as
the microbes use it to break down the organic matter) and during this process nutrient salts,
such as NH4
+, NO
3
- and PO
4
3- are released.
Detergents
The builders used in detergents to enhance the activity of the surfactant are usually
polyphosphates. These are not removed in primary or secondary treatment of sewage.
The search for replacement builders came up with the non-toxic compound nitriloethanoic
acid (NTA). By 1970, up to 15% of detergents sold contained NTA. However, after some
months of use, it was discovered that NTA formed stable complexes with heavy metals, and
prevented them from being removed in sewage treatment, and further, readily allowed the
metals to taken up by some animals. It was withdrawn from use.
Argument continues as to whether removing phosphates from detergents will decrease the
amount of eutrophication in our waterways – as substantial phosphates are produced from
other man made and natural sources. It is estimated however, that as much as 30% of the
phosphate in sewage comes from detergents.
Fertilisers
Ammonium and phosphate salts are intensively used as fertilisers. It has been considered that
their overuse was contributing to nutrient build-up in lakes, which received the run off from
farms nearby.
Chapter 3
29
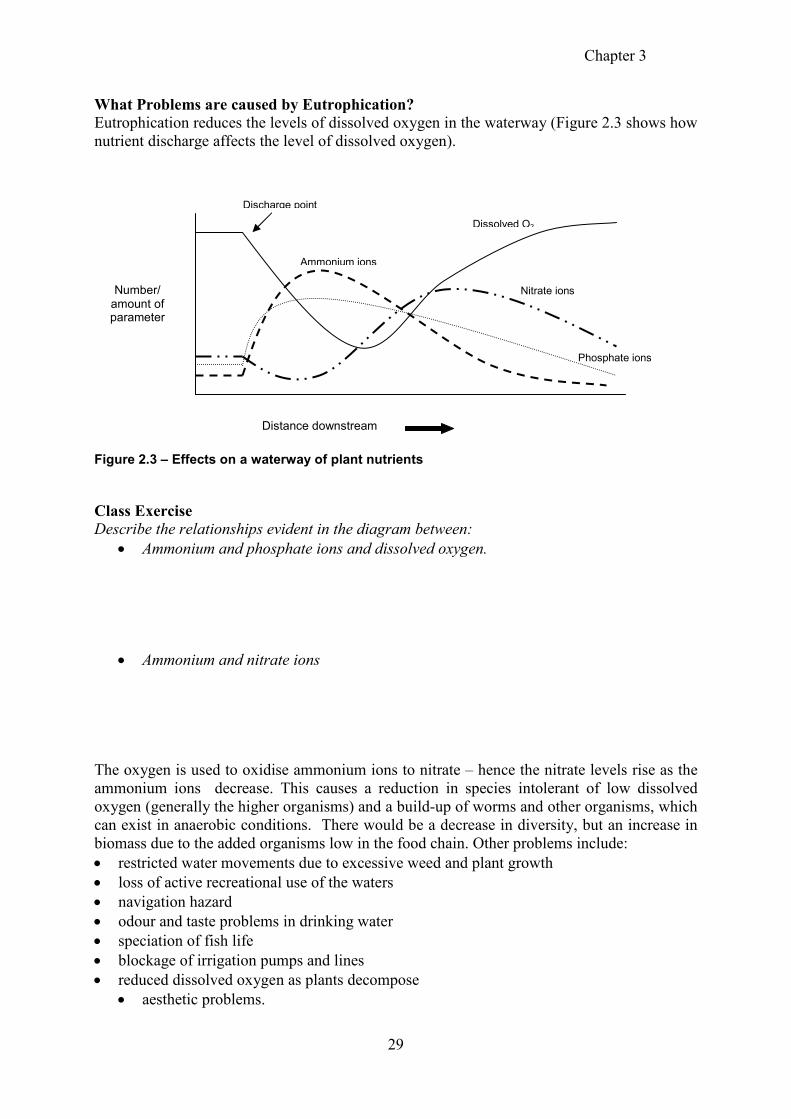
What Problems are caused by Eutrophication?
Eutrophication reduces the levels of dissolved oxygen in the waterway (Figure 2.3 shows how
nutrient discharge affects the level of dissolved oxygen).
Figure 2.3 – Effects on a waterway of plant nutrients
Class Exercise
Describe the relationships evident in the diagram between:
• Ammonium and phosphate ions and dissolved oxygen.
• Ammonium and nitrate ions
The oxygen is used to oxidise ammonium ions to nitrate – hence the nitrate levels rise as the
ammonium ions decrease. This causes a reduction in species intolerant of low dissolved
oxygen (generally the higher organisms) and a build-up of worms and other organisms, which
can exist in anaerobic conditions. There would be a decrease in diversity, but an increase in
biomass due to the added organisms low in the food chain. Other problems include:
• restricted water movements due to excessive weed and plant growth
• loss of active recreational use of the waters
• navigation hazard
• odour and taste problems in drinking water
• speciation of fish life
• blockage of irrigation pumps and lines
• reduced dissolved oxygen as plants decompose
• aesthetic problems.
Nitrate ions
Phosphate ions
Ammonium ions
Dissolved O2
Number/ amount of parameter
Distance downstream
Discharge point
Chapter 3
30
Although accelerated eutrophication can be seen in many areas throughout the world, the
most spectacular examples are probably in the Great Lakes of North America. The vast
urbanisation around the Lakes has meant that huge quantities of untreated sewage, fertilisers,
detergents and other sources of nitrogen and phosphorous have poured into them for many
years. Since 1920, the number of phytoplankton have increased threefold, many species of
fish are no longer available in commercial quantities, and bottom waters contain zero oxygen
over hundreds of square kilometres.
Many waterways (especially lakes and lagoons) in Australia have shown eutrophication.
Aerial photography has shown that the Tuggerah Lakes on the NSW Central Coast have
experienced increased plant growth. Excessive algal growth has occurred near treated sewage
outlets in the Georges River upstream of Liverpool weir, and in the Gulf of St Vincent in
South Australia. Excessive algal growths have occurred in Port Phillip Bay due to nitrogen
and phosphorus present in the effluent from nearby sewage treatment works.
Studies of the Hawkesbury-Nepean River by the NSW EPA indicated large growths of
aquatic plants and fish kills in parts of the river system. The major source of nutrients is from
point source discharges from sewage treatment works at Camden and Penrith. Since treated
sewage effluent is predicted to increase greatly, control measures have been introduced to
limit the phosphorus levels in sewage to prevent undesirable algal types such as blue-green
algae from growing. To balance the system, the removal of some nitrogen, especially
ammonia, is also necessary.
Organic Chemicals
This category includes:
• synthetic organic compounds such as pesticides and herbicides
• organic industrial effluent and petroleum products.
Class exercise
Why is the breakdown of many of today’s synthesised organic compounds a problem in the
environment?
It is estimated that 6 million tonnes of petroleum is put into the oceans each year. Of this the
great majority comes from industrial sources of one form or another.
Herbicide and pesticide residues are a product of agricultural enterprise in most cases. They
drain from the land through normal run off patterns. The residual nature of most of these
species and their high levels of toxicity make them very undesirable pollutants.
Compounds that are not biodegradable cause the most concern. Many of these are common
industrial products, such as benzene and its derivatives, and chlorinated hydrocarbons, such as
tetrachloromethane (old name carbon tetrachloride) and trichloromethane (old name
chloroform). In 1976, the US Environmental Protection Agency set up a list of 115 priority
organic pollutants, the presence of which are to be routinely monitored.
Chapter 3
31
These pollutants have been divided into four groups:
• phenolic acids (e.g. phenol, 2-chlorophenol),
• base/neutrals (e.g. anthracene, benzidine, N-nitrosodimethylamine),
• pesticides (e.g. aldrin, chlordane, heptachlor, TCDD, PCB's, DDT),
• volatile compounds (e.g. benzene, tetrachloromethane, chloroethene)
A major problem associated with some organic compounds, particularly the chlorinated
hydrocarbons is that they are insoluble in water, and also more dense. Thus they will form
layers at the bottom of bodies of water, and will cause considerable damage to sediment
ecosystems.
Plastics, whilst not in themselves toxic materials, are another major environmental problem,
because of their biorefractory nature. It is estimated that up to one million animals per year
die as a result of being strangled, choked or exhausted, as well as other reasons, after being
entangled in or attempting to eat plastic materials discarded into the environment.
Inorganic Elements and Compounds
Because water is such a good solvent for inorganic species it almost always carries many
different inorganic ions in solution at low (background) levels. Effluent from activities such
as mining and smelting can however, lead to extremely high levels of these species. For
example, dissolution of acidic gases such as SO2 from acid rain and acid mine water.
Other inorganic pollutants include high levels of chloride ions (referred to as salinity) which
often arises from soil leaching in areas of excessive erosion caused by land clearing.
Excessive levels of divalent cations such as Ca2+
, Mg2+
etc. (referred to as water hardness) is
another form of pollution, although these ions occur at relatively high background levels in
many waterways.
Fluoride is a pollutant generally added by man to his water supplies. It is beneficial at low
doses (around 1 mg/L), but becomes quite harmful to bones and teeth at levels above 10
mg/L.
Heavy Metal Pollutants
These are a special category of inorganic pollutants. Generally the term heavy metals refers to
Hg, Cd, Pb, Zn, Fe and Cu.
The three most important elements are lead, cadmium and mercury, small amounts of which
are added into the environment from natural sources, but most comes from mining wastes and
manufacturing industries. In the environment, the metals exist as free cations or in various
inorganic and organic complexes. However, since they are elemental, they cannot be
destroyed, only changed from one compound to another.
The biomagnification of heavy metals by aquatic organisms allows high concentrations of
lead, mercury and cadmium to be found in oysters, mussels and fish. Filter feeders
(organisms that obtain nutrients by filtering water through their gills) are extremely successful
at concentrating sub-lethal levels of heavy metals in their tissues. Scallops are capable of
supporting tissue concentrations of cadmium that are more than two million times higher than
those in the waters they inhabit. The particular ability of cadmium to be biomagnified has
Chapter 3
32
been attributed to its ready complexation with organic ligands, which are relatively soluble in
fatty tissues.
Ecological effects of heavy metals
While mercury, cadmium and lead are the most toxic of the heavy metals, other metals, some
essential to life such as zinc, iron and copper, can cause considerable damage to aquatic
ecosystems. A major study of the Molonglo River, which flows into Lake Burley Griffin in
Canberra, has shown the dangers of these "essential" metals. The river is polluted by mine
drainage water and other waste from a copper-lead-zinc mine at Captain's Flat, approximately
50 kilometres south of Canberra. Pollution occurred from 1882 to 1962 when mining was
carried out periodically, and has continued due to drainage from waste stacks on the
riverbanks. In addition, finely crushed waste ore has contaminated the river for a distance of
60 kilometres downstream. Of the metal pollutants, zinc is by far the most serious, at levels
up to 35ppm.
Upstream of the mine, the river contains around 30-45 species of animals. Immediately
below the mine, the number of species is reduced to 4, and a slow recovery to normal species
numbers is apparent over the next 70 kilometres downstream. The river also shows a
corresponding pattern of depression of numbers of animals.
Cadmium
Cadmium is widely used in electroplating as a pigment in some plastics and in rechargeable
batteries. It has been detected in Australian waters at levels well in excess of the 0.01ppm
level recommended for drinking water. The LC50 (lethal concentration for 50% of the
sample) for certain fish and crabs is around 10ppm, unfortunately well above the
recommended level for food of 2ppm. Tasmanian oysters and Victorian mussels have shown
levels of 32 and 8.8 ppm, respectively.
The effects of acute cadmium poisoning in humans are very serious. Among them are high
blood pressure, kidney damage, and destruction of testicular tissue and red blood cells.
Cadmium poisoning causes the malady known in Japan as "itai, itai" ("ouch, ouch"). Bone
fracture and intense pain manifest this condition. It is believed that much of the physiological
action of cadmium arises from its chemical similarity to zinc. Specifically, cadmium may
replace zinc in some enzymes, thereby altering its structure and impairing its catalytic
activity.
Lead
The problems surrounding the environmental pollution by lead emitted in car exhausts have
already been described. Lead can enter the water system as aerial fallout, or directly in the
form of liquid wastes and leachates from mining and refining operations. It is, however, not
considered to be a pollution problem of the same scale as mercury and cadmium. Its
biomagnification by filter feeders is considerably less than for the other heavy metals, and
with decreasing levels of lead in the atmosphere, its presence in water should continue to
decrease.
Mercury
Mercury generates the most concern of any of the heavy metal pollutants. It is found as a trace
component of many minerals, with continental rocks containing an average of 80ppb, and
coals can contain up to 100ppb. Elemental mercury is used in a vast number of applications:
electrodes in the production of chlorine, as pesticides, and from the various human uses
Chapter 3
33
(dental amalgams, thermometers, batteries). While the latter may individually contribute
little, but the total effect can be substantial.
The toxicity of mercury was first illustrated in the Minamata Bay area of Japan in the 1950's.
It was evidenced by an unusual epidemic of neurological disorders. This was eventually
traced to mercury in the victims' diet of fish and shellfish taken from Minamata Bay. Further
investigation revealed that a local plant manufacturing plastics was discharging mercury-
containing wastes into the bay. A public health problem developed from the accumulation of
mercury in marine food organisms. Fish caught in the bay were found to contain 10-20ppm
of mercury (the current recommended limit for food is 0.5ppm, and 0.001ppm for drinking
water). The records show that 121 cases of mercury poisoning from consumption of
contaminated fish were reported by the beginning of 1972, and of these, 63 had died. In 22
cases, the children of poisoned parents also exhibited symptoms of mercury poisoning.
In 1976 a similar Japanese plastics manufacturing plant caused a repetition of this incident,
resulting in 5 deaths from 120 cases. During the period of these Japanese incidents,
conservationists felt that mercury pollution was an environmental problem in Sweden. In this
case it was used a seed dressing (a fungicide) and ultimately found its way into birds and
birds' eggs. A number of facts indicated that these residues had caused a drastic reduction in
bird populations.
In the early months of 1970, Canadian scientists found alarming levels of mercury in fish
caught in the Great Lakes as a result of industrial wastes. Ultimately, the local authorities
confirmed this and commercial fishing was banned in Lake St Clair. The United States
authorities realised that the problem extended into the connecting lakes, Erie and Ontario, and
similar action was taken for the former. Problems continued to surface around the world,
quantities of canned tuna were withdrawn from the market in Britain and the United States,
after Hg levels up to 1 ppm were found in these deep ocean fish! While the chemical forms
of mercury pollution vary widely, it is the organometallic cation, methyl mercury (CH3Hg+)
that is the primary form in animal tissues. It is considered that anaerobic bacteria in
sediments convert insoluble mercury compounds to the soluble methyl mercury.
In humans, mercury primarily attacks the central nervous system, causing headaches, coma,
dementia and death. The expression "Mad as a hatter" derives from the use of mercury (I)
nitrate in the production of felt hats.
Sediments
This generally refers to particulate matter carried into the water system from land erosion.
Often these will be in the form of sludges which may carry other pollutants such as heavy
metal wastes (e.g. if they are residues released from mine tailings ponds). In the city, storm
water systems carry many tonnes of sediment into waterways, whilst the primary source in
country regions is through erosion.
High levels of sediment in a waterway lead to decreased clarity that in turn will depress the
photosynthetic activity of marine flora. Additionally it covers marine life with debris that may
lead to death in the case of some organisms (through burial).
Chapter 3
34
Radioactive Material
This type of pollution is a low incidence problem in most areas where there are no nuclear
power stations or nuclear facilities, but in Australia sand mining activity is another source of
radioactive waste.
Radioactive materials generally enter our waterways through accidental release from nuclear
facilities, but contamination can also arise through the water table where seepage from
incorrectly disposed radioactive wastes from hospitals and factories occurs.
Heat
This is one of the least obvious forms of pollution. Heated discharges can however, drastically
alter the ecology of a stream or lake. Increasing the temperature of a body of water can
produce some beneficial effects such as better fishing. In the long term however, the level of
dissolved oxygen will decrease, as the solubility of oxygen in water drops dramatically when
the temperature rises (the solubility of oxygen in water decreases from 14.74 mg/L at 0°C to
7.03 mg/L at 35oC). Additionally the increased rate of metabolic activity of aquatic
communities further depletes oxygen levels.
The changes in dissolved oxygen brought about by increased temperatures can lead to
speciation in the aquatic community. Those species which thrive in lower dissolved oxygen
levels proliferate (such as catfish) whilst those that require higher levels die out or move to
areas which are cooler and have higher levels of dissolved oxygen.
Classification based on the effect
1. Substances that deplete oxygen in the water - this category includes oxygen demanding
wastes, plant nutrients, heat and some organic chemicals.
2. Nutrients that aid plant growth - this category includes plant nutrients, organic
chemicals, heat and inorganic elements and compounds.
3. Pollutants that kill or mutate organisms - here we would include infectious agents,
organic chemicals, radioactive materials, heat and possibly sediments.
4. Sediments
Chapter 3
35
ASSESSMENT OF WATER QUALITY
The measurement of pollutants in water is fraught with difficulty. This is because the level of
pollutants in many cases is very low (often in mg/L - hence very sensitive methods of analysis
need to be used) and also because the specific material responsible for the pollution is often
not known.
Classification of Water
There are different quality parameters attached to water systems depending on how they are
used. Water for human consumption for example needs to be far more pure than that which
we might find in a mine tailings dam. Because of the many different types of water and water
systems which are found in our environment, chemists have broadly classified them into
categories. The category in which a certain type of water is placed influences how it is
assessed for water quality, and how it is sampled for quality assessment. Broadly speaking
water may be classified as;
• ground water
• surface water
• waste water and
• drinking water
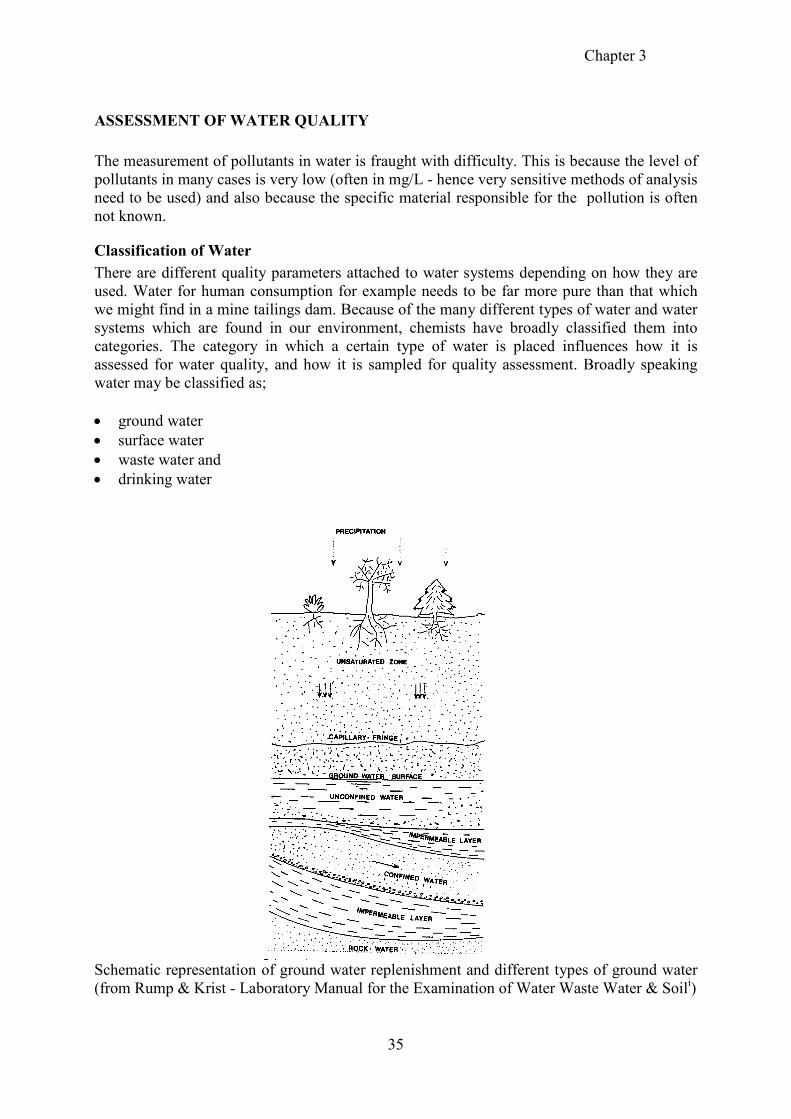
Schematic representation of ground water replenishment and different types of ground water
(from Rump & Krist - Laboratory Manual for the Examination of Water Waste Water & Soili)

Chapter 3
36
Ground Water
Ground water occupies permeable subterranean layers. Its source is rain which percolates
down through the permeable layers of soil till it reaches an impervious layer. The quality of
ground water is generally determined by the soil (and soluble substances in it) through which
it percolates, the rate of percolation and the depth of confinement Due to the diverse nature of
subsoils and rocks, the quality of ground water varies considerably.
Pollution sources such as refuse dumps, mine seepage and chemical spillages can cause high
levels of contamination in ground waters.
Ground water finds applications mostly in agriculture, and as industrial cooling water, but is
occasionally used for human consumption (this is referred to as bore water).
Surface Water
This refers to fresh water on the earths surface, either flowing or still. It is probably the most
affected by normal types of pollution. Whilst most surface waters are capable of some degree
of self purification, environmental pollution sources are often exceeding the capacity of these
systems to accomplish this.
When judging the quality of this type of water it is important to consider the dynamic
properties of the waterway, as still water is far more affected by pollution than flowing water.
Processes such as eutrophication generally occur in dams and lakes and are rare in faster
flowing rivers.
Drinking Water
This is water used for human consumption, and so it must be rigorously scrutinised for any
factors which might be deleterious to human health. The most important parameters to
monitor are biological contamination as many diseases such as cholera, typhoid, hepatitis and
many others are spread through drinking water. Additionally materials such as heavy metals,
pesticides and other chemicals must be continuously monitored.
Normally drinking water is prepared from ground water, or surface water by treatment
procedures. There are strict legal parameters set in place in this country to ensure the quality
of drinking water.
Waste Water
Any water which has had its composition changed by intensive human usage (such as
industrial applications) is referred to as waste water. It varies enormously in components and
character and so this classification will fit the water in many systems. This is the source of the
greatest amount of pollution in our aquatic systems, with most being released as drain water
from cities, industrial areas and agricultural zones.
Sampling Techniques
It is necessary to recognise that analysis is only as accurate as the sample, and so regardless of
the precision of the analytical procedure a poor sample will produce an inaccurate analysis.
When testing water quality it is always best to test the body of water at the site. Indeed some
tests such as pH and dissolved oxygen may be carried out this way. Often however, this is not
possible for a variety of reasons. Most tests can be performed on a sample taken directly from
Chapter 3
37
the water source. The process by which a sample is obtained however, can greatly influence a
result.
The main aim of any sampling program is to obtain a sample which is a direct reflection of
the body of water from which it is derived. This means that the collection and storage of
samples must maintain the physical and chemical parameters which the water possessed at
the time of collection. Additionally it is important to sample at a time and place that give a
reflection of how the body of water changed during the time of investigation. Key factors in
this regard are;
• rate of flow
• lack of homogeneity in the water body and
• positions of pollution sources.
In reality all samples carry error in that any sampling procedure depends to some extent on
chance (an indiscrete animal may allow a waste water flow near your sampling site!), but in
general it can be said that the larger the sample the better a reflection it will be of the original
body of water. In many cases we can not take a water tanker back to the lab, so we have
developed standard procedures which are designed to overcome the limitations of sampling as
best as is possible with a realistically sized sample.
Before you carry out any sampling program you MUST consult the relevant standard
for sampling. In this state Australian Standards and the EPA are the key sources of
information.
There are basically three types of samples.
• Grab
• Composite
• Flow weighed composite
To choose which of these are appropriate you must first examine the body of water and
examine its flow characteristics and also the type of information you wish to obtain.
Grab (random) Samples
Measures a point source and only represents the water quality at that point at the moment of
sampling. It says nothing of the quality before or after the sample was taken. They are
generally collected from sources such as pipes, reservoirs, drains, rivers and streams.
Composite (pooling) Samples
Refers to a series of grab samples mixed together. These enable some conclusions to be drawn
about the quality of water over a longer period of time, but they cannot give information
about peaks or troughs in the level of pollutants, only average data. This may not be suitable
if contaminants reach a dangerously high level (enough to kill organisms) for short periods
after occasional release from a drainage pipe etc., but on the whole are low.
When samples are drawn from the water at specified time intervals this is known as time
weighted composite sampling.
Chapter 3
38
Flow Weighed Composite (quantity proportional sampling)
Is obtained by taking each sample so that the volume of the sample is proportional to the flow
rate at the time. These can even be manually prepared if the flow rate over time is known by
mixing different quantities of samples obtained on a time weighted basis.
Sampling Networks
These are systems set up to assess a body of water or water catchment area as fully as possible
and to relate variations in the network to pollution sources, and changes in aquatic species.
Ideally they should obtain samples which are representative of the whole body of water, but in
reality most sampling networks contain many sub-systems which differ greatly in water
quality, and so each of these must be characterised separately.
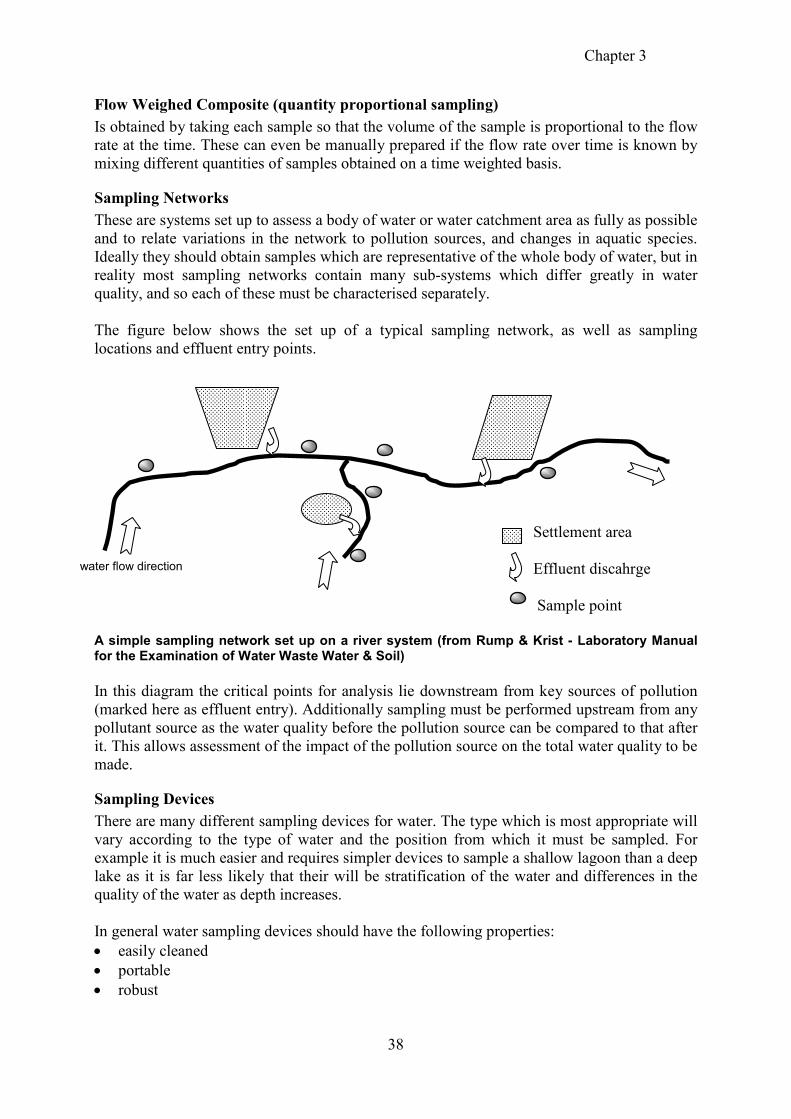
The figure below shows the set up of a typical sampling network, as well as sampling
locations and effluent entry points.
Settlement area
Effluent discahrge
Sample point
A simple sampling network set up on a river system (from Rump & Krist - Laboratory Manual for the Examination of Water Waste Water & Soil)
In this diagram the critical points for analysis lie downstream from key sources of pollution
(marked here as effluent entry). Additionally sampling must be performed upstream from any
pollutant source as the water quality before the pollution source can be compared to that after
it. This allows assessment of the impact of the pollution source on the total water quality to be
made.
Sampling Devices
There are many different sampling devices for water. The type which is most appropriate will
vary according to the type of water and the position from which it must be sampled. For
example it is much easier and requires simpler devices to sample a shallow lagoon than a deep
lake as it is far less likely that their will be stratification of the water and differences in the
quality of the water as depth increases.
In general water sampling devices should have the following properties:
• easily cleaned
• portable
• robust
water flow direction
Chapter 3
39
• made from materials which do not alter the chemical composition of the sample (this may
vary according to the pollutant source)
Typical sampling devices include ladles, suction pumps, sample thiefs, automatic sampling
devices and dipsticks.
Ladles
These are very simple devices which are used for preliminary examinations. They are
normally constructed of a simple cylindrical container. Some ladles are fitted with seals and a
valve which allows them to be closed at a certain depth or time. This is generally effected
through use of a drop weight. This type of device is sometimes called a sample thief. It is
ideal for sampling from specific depths to examine stratification of water bodies.
Suction Pumps
These are just small pumps which are connected to the water body by a sampling tube. The
maximum depth to which these can operate is about 9-10m as beyond these depths breaks up
in the sampling tube. They are ideal for sampling shallow rivers and springs.
Underwater Pumps
These are just special pumps which are designed to operate underwater. They are used when
the depth of sampling is beyond 9m. These are used in areas such as wells.
Automatic Sampling Devices These are generally used for surface and waste waters. There are many different types and
design, but all have some sort of delivery system, control mechanism, sample apportionment
and measurement system and sample storage system.
The most common materials for construction of sampling devices are polyethene and glass,
but each of these have their limitations. For example glass containers are unsuitable for
samples containing heavy metals, sodium, potassium, or silicic acid, whilst samples
containing oils, pesticides and other non-polar organic substances should not be sampled in
plastics. Sometimes if a complete profile is to be obtained both types of container may have to
be used and multiple samples provided.
Detergents should never be used for cleaning of sampling containers as these are nutrient
sources which cannot be easily removed. In the case of glass treatment with chromic acid is
used to remove stubborn contaminants, whilst plastic containers are normally discarded.
Sample containers for biological materials should also be sterile. This is normally achieved
through autoclaving, or heating to 180°C. Both the bottle and the stopper should be heated.
Preservation, Transport and Storage of Samples
As very few water quality parameters can be tested on site, it is essential to perform
preliminary treatment to stabilise the sample before transport to the laboratory. This should
allow tests to be successfully carried out several hours or more after obtaining the sample.
Most preservation steps are aimed at delaying the onset of biochemical processes as most of
the inorganic components of water are so stable that they need little preservation.
Cooling of samples during transportation, prevention of oxygenation, and exclusion of light
are key means of preservation of samples. This greatly lowers microbiological activity, which
Chapter 3
40
in turn might change other parameters such as pH, dissolved O2, BOD, COD, TOC, CO2, and
trace organic materials. Cooling to 4°C is generally accepted as a standard storage condition,
although in some special cases freezing is suggested (only for some BOD and COD analysis).
Light is excluded to prevent photosynthesis by blue green algae.
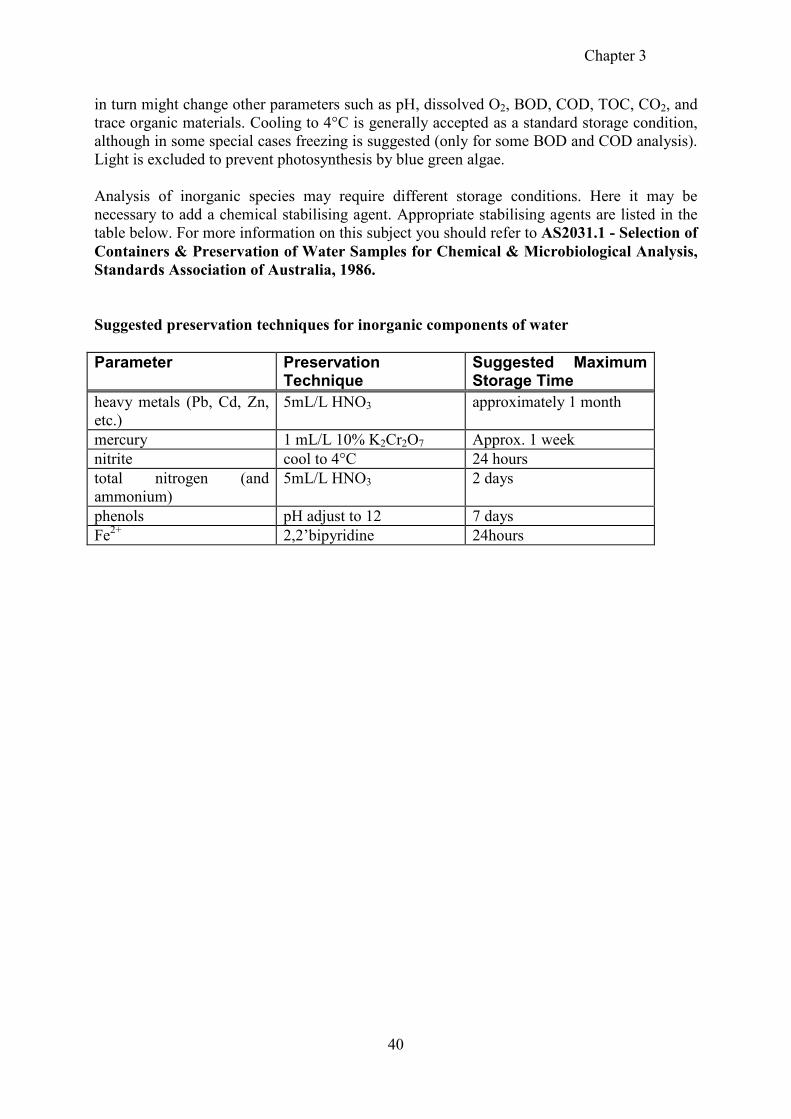
Analysis of inorganic species may require different storage conditions. Here it may be
necessary to add a chemical stabilising agent. Appropriate stabilising agents are listed in the
table below. For more information on this subject you should refer to AS2031.1 - Selection of
Containers & Preservation of Water Samples for Chemical & Microbiological Analysis,
Standards Association of Australia, 1986.
Suggested preservation techniques for inorganic components of water
Parameter Preservation Technique
Suggested Maximum Storage Time
heavy metals (Pb, Cd, Zn,
etc.)
5mL/L HNO3 approximately 1 month
mercury 1 mL/L 10% K2Cr2O7 Approx. 1 week
nitrite cool to 4°C 24 hours
total nitrogen (and
ammonium)
5mL/L HNO3 2 days
phenols pH adjust to 12 7 days
Fe2+
2,2’bipyridine 24hours
Chapter 3
41
IMPORTANT ANALYTICAL PROCEDURES FOR MONITORING
WATER QUALITY.
1. On Site (Field) Tests for Water
These include the following:
• sensory examination for colour, odour, taste, clarity, and turbidity
• pH
• temperature
• dissolved oxygen
• electrical conductivity
• settleable matter
Sensory Examination Tests
Tests such as (odour, colour, taste) must take place on site as transport can rapidly change
these. Colour and odour are highly descriptive, and taste may not be appropriate (especially
for sewage samples).
Odour tests must be performed extremely rapidly as some odours (e.g. H2S) rapidly
dissipate. Odours are normally categorised according to strength (i.e. strong, very strong,
weak) and type (musty, fishy, aromatic, swampy).
Colour tests are normally carried out by simple inspection and terms such as colourless,
weakly coloured, brownish, green etc. are used. If more precise definition of colour is
required then colourimeter tubes and a comparator may be used.
Taste tests are normally only carried out on drinking waters. Words such as tasteless, bitter,
salty, metallic, repulsive (Oops! Forgot that one was sewage!) and astringent are often used as
descriptors. Other words such as weak and strong may be included.
Clarity is normally tested by lowering a white disc into the water until it is just visible. The
length to which it has been lowered are read off a rope or pole and this is quoted as clarity or
visibility.
Turbidity is conducted by filling a clear glass container to approximately 2/3 full, shaking
thoroughly, then comparing against a black then white background. More precise definitions
are obtained by comparison to a series of SiO2 suspensions between 1 and 0.1 g/L with the aid
of photometric equipment. Descriptors used include clear, turbid, opaque, etc..
Settleable matter refers to sedimentable components. This test should be carried out as soon
as possible after sampling to avoid errors due to flocculation.. Typically it is measured by
obtaining 1L of sample in a device called an Imhoff sedimentation glass. The container is
sealed and rotated at intervals of 50 and 110 minutes, then the amount of sediment read off
after 2 hours of standing.
Chapter 3
42
pH
pH is important in almost all phases of water and wastewater treatment. Marine organisms are
sensitive to pH changes, and biological control requires either pH control or monitoring. In
water treatment pH is important in ensuring proper chemical treatment as well as in
disinfectant and corrosion control. Mine drainage often involves the formation of sulfuric acid
which is extremely detrimental to marine life.
The measurement of pH is now carried out almost universally by a pH electrode. Typical
values for clean neutral waters are 6.5 to 7.5 although these may be changed by other factors
such as carbonate content (more alkaline - up to 9.5).
Electrical Conductivity
This is a measure of the total amount of conductive species in solution, in particular ions. This
parameter is normally only used to monitor waste waters from power stations, mine tailings
and desalination plants. it is also used in chemical laboratories to monitor the purity of
distilled water.
Measurement is carried out using a standard conductivity meter (see Electroanalytical
Techniques Notes).
Dissolved Oxygen.
In many instances this is probably the most important test of water quality, as all marine
organisms depend on oxygen for survival. Saturation level for oxygen is only 9mg/L (at
20°C) and decreases rapidly with increasing temperature, hence thermal pollution can quickly
deplete dissolved oxygen reserves. Oxygen normally reaches water via diffusion from the
atmosphere, or is produced in situ by photosynthetic marine species such as algae.
This analysis is normally carried out using a dissolved oxygen probe, or the Winkler
Dissolved Oxygen Test which is a wet chemical method (see following practical section)
The dissolved oxygen probe is essentially a miniature polarograph whose potential is fixed to
measure only oxygen half waves in water. It contains a special gas permeable membrane
through which the oxygen permeates and a tiny gold electrode for the reduction process.
The Winkler method relies on the combination of Mn2+
ions with available oxygen to form
manganese hydroxides. These react with added iodide ions which are oxidised to iodine and
finally a thiosulfate titration completes the iodometric analysis. It has the disadvantages of
being affected by interferents such as Fe3+
and nitrite ions (although the latter is controlled by
the azide modification method and the former by H3PO4), and also requires the sample being
brought to the laboratory (unlike the O2 probe method which may be carried out by a portable
probe on site in many cases). This may change the nature of the sample and drastically alter
the dissolved oxygen level if preservation techniques are not adequate.
Biochemical Oxygen Demand (BOD)
This is essentially a test to determine the rate of use of oxygen by marine species. It is not a
specific measure of pollution, but rather shows the oxygen drain on the aquatic system due to
consumption by bacteria and other micro-organisms of decaying organic matter. If the level of
Chapter 3
43
BOD becomes too high than dissolved O2 will be depleted and aquatic life will be drastically
affected.
The test involves collection of a sample of water in a BOD bottle (see practical section) and
storing this bottle in the dark at 20°C for five days. After this the dissolved oxygen is tested
and compared to the dissolved oxygen level of the water at the time of sampling. The
difference is referred to as the BOD. A series of dilutions may need to be performed and
several samples run concurrently if the approximate BOD is not known. Suggested dilution
schemes are available in several texts such as Laboratory Manual for the Examination of
Water Waste Water & Soil - Rump & Krist. The dilutions should be carried out so as to leave
at least 2mg/L dissolved oxygen after the 5 day incubation period, but there must be at least
2mg/l of dissipation in the dissolved oxygen value. Hence if we assume that the starting value
is 9mg/L then allowable values for this BOD determination would be between 7 and 2mg/L.
In most instances a seed of marine organisms is added to ensure that there are adequate living
bacteria in the solution. If this is not added then depletion of the dissolved oxygen may not
take place as their may be no species to consume the material in the water and use the oxygen.
BOD is not a precise test and parameters normally vary by as much as 15% between two
identical samples. Test should always be conducted with a known standard (such as
glucose/glutamic acid) to ensure validity. Most trade discharge licences require waste water
to be maintained below a BOD of 20mg/L. A typical value for raw sewage is 300mg/L, whilst
some waste waters may have BOD’s of over 1000mg/L, hence when analysing these large
dilutions should be employed.
Chemical Oxygen Demand (COD)
In this test all organic matter is oxidised chemically using reagents such as potassium
dichromate. It is a measure of the oxidisable organic content of the sample.
The test involves adding a known amount of potassium dichromate to the sample and boiling
the mixture with sulfuric acid. The excess dichromate is then measured by titration with a
reducing agent such as ferrous ammonium sulfate. The more dichromate that is used the more
organic compounds were present in the initial sample and hence the higher the COD.
High chloride concentrations (>300mg/L) interfere with the analysis, and these are generally
masked by the addition of mercury or silver ions. Silver ions also accelerate the oxidation
process.
Total Organic Carbon (TOC)
This test has been developed as methods such as COD do not give an indication of the total
amount of organic material in a water sample, but rather reflect the levels of chemically
oxidisable species in solution. The total organic carbon (TOC) test measures the total level of
organic species in solution. Any carbonaceous material is oxidised to CO2, and the volume
evolved taken as a measure of the TOC.
The current accepted method for determination of TOC involves the use of dissolved
oxidising agent K2S2O8 (potassium peroxydisulfate) which is irradiated with UV light to
enhance its action. The sample is firstly sparged with nitrogen to drive off any dissolved gases
Chapter 3
44
such as CO2 (which can also be formed from CO32- and HCO3
- ions in solution). After
sparging the sample is pumped into a chamber containing a lamp emitting light at 184.9nm
which produces reactive free radical species, such as OH• . These active species bring about
the rapid oxidation of dissolved organic compounds as described in the following general
reaction;
K2S2O8
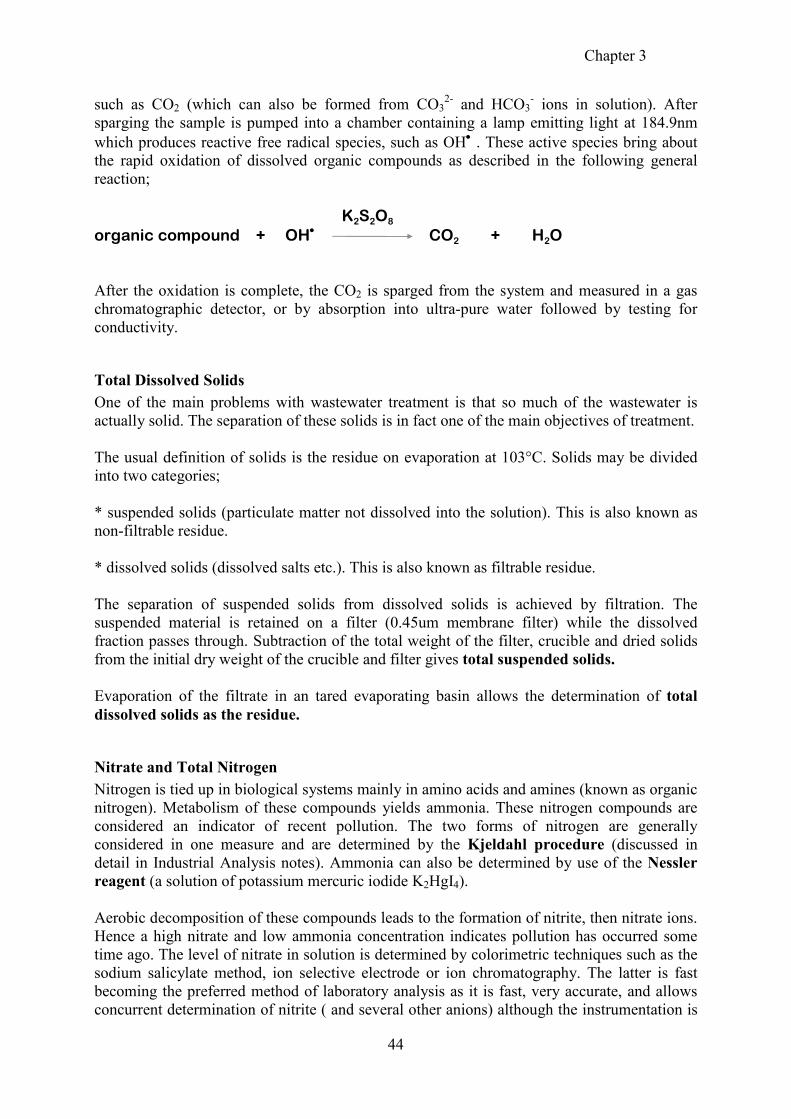
organic compound + OH• CO2 + H2O After the oxidation is complete, the CO2 is sparged from the system and measured in a gas
chromatographic detector, or by absorption into ultra-pure water followed by testing for
conductivity.
Total Dissolved Solids
One of the main problems with wastewater treatment is that so much of the wastewater is
actually solid. The separation of these solids is in fact one of the main objectives of treatment.
The usual definition of solids is the residue on evaporation at 103°C. Solids may be divided
into two categories;
* suspended solids (particulate matter not dissolved into the solution). This is also known as
non-filtrable residue.
* dissolved solids (dissolved salts etc.). This is also known as filtrable residue.
The separation of suspended solids from dissolved solids is achieved by filtration. The
suspended material is retained on a filter (0.45um membrane filter) while the dissolved
fraction passes through. Subtraction of the total weight of the filter, crucible and dried solids
from the initial dry weight of the crucible and filter gives total suspended solids.
Evaporation of the filtrate in an tared evaporating basin allows the determination of total
dissolved solids as the residue.
Nitrate and Total Nitrogen
Nitrogen is tied up in biological systems mainly in amino acids and amines (known as organic
nitrogen). Metabolism of these compounds yields ammonia. These nitrogen compounds are
considered an indicator of recent pollution. The two forms of nitrogen are generally
considered in one measure and are determined by the Kjeldahl procedure (discussed in
detail in Industrial Analysis notes). Ammonia can also be determined by use of the Nessler
reagent (a solution of potassium mercuric iodide K2HgI4).
Aerobic decomposition of these compounds leads to the formation of nitrite, then nitrate ions.
Hence a high nitrate and low ammonia concentration indicates pollution has occurred some
time ago. The level of nitrate in solution is determined by colorimetric techniques such as the
sodium salicylate method, ion selective electrode or ion chromatography. The latter is fast
becoming the preferred method of laboratory analysis as it is fast, very accurate, and allows
concurrent determination of nitrite ( and several other anions) although the instrumentation is
Chapter 3
45
expensive. The nitrate ion selective electrode has the distinct advantage of allowing
determination on site, which may provide more reliable results (although a knowledge of
interferent species in solution is required).
Normal levels of nitrate in natural waters vary between 1-10mg/L
Phosphates
Phosphorus in water can be either inorganic or organic. Methods used for analysis depend on
the type of phosphorus being examined.
The greatest source of inorganic phosphorus is synthetic detergent, whilst organic phosphorus
is derived from food and human waste. All forms of phosphorus in nature eventually revert to
inorganic phosphorus which can be used again by plants to make new high energy
compounds.
Natural waters normally contain phosphorus compounds at levels below 0.1mg/L. Factors
such as soil erosion and effluent discharge raise these levels significantly.
Because phosphates have been implicated as the main culprit in lake eutrophication,
measurement of total phosphate has become an important measure of water quality. Total
phosphate can be measured by first boiling the sample in acidic solution to convert all the
phosphate to the inorganic form. Then the phosphate level is gauged by colorimetric
determination using colourimetric methods such as the vanadomolybdophosphoric acid
colourimetric method (most suited to concentrations in the range 1-20mg/L).
Phosphorus can now also be detected by ion chromatography (see Advanced Spectroscopy
practicals) and ion selective electrodes. The former is likely to become the standard method of
choice in the near future.
Fats and Oils
It is common to see small layers of hydrocarbon material on the surface of bodies of water as
oils and water are not generally miscible. These emanate from many different sources. They
are undesirable as they degrade the taste and odour of the water. They are normally
determined gravimetrically by extraction with an organic solvent such as trichloromethane,
hexane or petroleum ether, but newer methods use trichlorotrifluoroethane as the extractant.
For more quantitative precision (particularly when the sample contains significant amounts of
volatile organic substances) a newer Fourier transform infrared method has been developed.
It is now the method of choice where affordable.
Heavy Metals
In general this refers to metals such as lead, mercury and cadmium which accumulate in the
body and are quite toxic.
The usual procedure for the determination of these substances involve use of graphite furnace
AAS, cold vapour methods (for mercury), anodic stripping voltammetry, ion chromatography,
colourimetric determination (e.g. dithizone determination of lead) and conventional AAS
using pre-concentration and extraction procedures. Typically standards are prepared using
Chapter 3
46
similar matrices for calibration, or standard addition methods are employed where the matrix
is totally unknown.
Detergents (anionic surfactants)
These are determined using the methylene blue active substances method (MBAS). Here,
methylene blue reacts with anionic surfactants such as alkyl sulfates and alkyl polyethoxyl
sulfates to form a blue salt. This salt is dissolved up in chloroform and the absorbance (which
is directly proportional to surfactant concentration) measured in a visible spectrometer at
652nm.
Chloride
This is often referred to as salinity, and is an important parameter as to suitability of water for
irrigation and drinking. Levels of chloride which are too high result in water having a salty
taste (.250mg/L), whilst higher levels kill plants when used for irrigation purposes.
Chloride levels are normally determined by ion chromatography (using similar methods to
those used in Advanced Chromatography practical work), or titrimetry (using similar
techniques to those studied in Non-Instrumental Analysis) which involves the precipitation of
Cl- as with Ag
+ ions using a chromate indicator. On site testing is achieved through use of ion
selective electrodes.
Water Hardness
This refers to the level of divalent cations in solution (principally Ca2+
and Mg2+
). It has been
covered in several other modules so will not be covered in great detail here. Essentially high
levels of water hardness prevent soaps from lathering properly and so inhibit the washing
process.
Common methods of analysis include titrimetry (done in Non-Instrumental Analysis), ion
chromatography, and inductively coupled plasma spectroscopy. There are also ion selective
electrodes available which allow on site testing. Other spectroscopic methods such as atomic
absorption spectroscopy and inductively coupled plasma spectroscopy are also used.
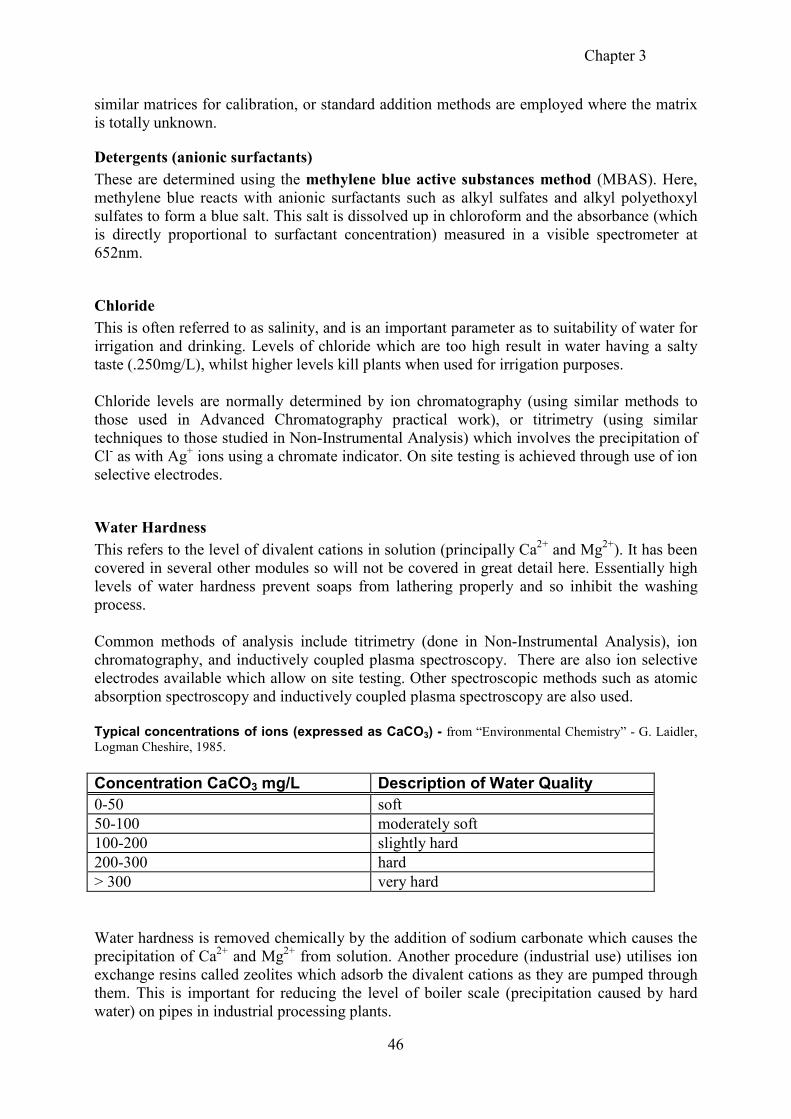
Typical concentrations of ions (expressed as CaCO3) - from “Environmental Chemistry” - G. Laidler,
Logman Cheshire, 1985.
Concentration CaCO3 mg/L Description of Water Quality
0-50 soft
50-100 moderately soft
100-200 slightly hard
200-300 hard
> 300 very hard
Water hardness is removed chemically by the addition of sodium carbonate which causes the
precipitation of Ca2+
and Mg2+
from solution. Another procedure (industrial use) utilises ion
exchange resins called zeolites which adsorb the divalent cations as they are pumped through
them. This is important for reducing the level of boiler scale (precipitation caused by hard
water) on pipes in industrial processing plants.
Chapter 3
47
Toxic Organic Compounds
These include species such as pesticides, herbicides and other highly toxic organic
compounds discharged into the environment in small amounts through our water ways. The
best methods for determination of these substances are chromatographic. Gas
chromatography is applicable for the species which are volatile, whilst high performance
liquid chromatography is appropriate for non-volatile substances.
As the levels of these substances are generally very small (although they are so toxic that this
may often still be significant) special methods of detection may need to be utilised. Detectors
such as the mass selective detector or FTIR detector for gas chromatographs allow
determination at ultra trace levels as well as positive methods of identification, whilst electron
capture detectors allow detection of halogen containing species (many pesticides) at even
lower levels. Special columns are also available for these species, and are specified in some
US EPA methods as mandatory.
The advanced instrumentation practical on identification of pesticides in a pesticide mixture
outlines some of the methodology used.
New extraction procedures such as supercritical fluid analysis (generally more appropriate
to soils) are also replacing older and often less efficient solvent extraction techniques.
Supercritical fluid analysis relies on the use of a solvent at its critical point (under pressure)
where its properties are on the boundaries between a liquid and a gas. This is a sophisticated
procedure which allows a much more efficient extraction as the surface area of the extracting
agent which is exposed to the sample is much greater.
Microbiological Testing of Water
Waters can carry many different biological organisms, some of which are harmless whilst
others are pathogenic. In order to ensure that diseases are not transferred through bodies of
water microbiological analysis are routinely carried out on drinking waters, bathing waters
and some other critical areas (such as cooling towers which may contain legionella bacteria -
responsible for Legionnaire’s Disease). Most procedures involve the identification and the
determination of total count of specific organisms which are indicative of contamination such
as Escherichia Coli (often shortened to E.Coli)and coliform bacteria. Not all organisms are
tested in a typical screening procedure. Other important organisms which are tested include
Salmonella and Shigella.
Carrying Out Microbiological Tests on Water
All tests must be carried out under scrupulously sterile conditions, with all containers being
autoclaved, and any solutions used being sterile (by either filtration through filters less than
0.2µm in pore size or exposure to UV light).
Two basic procedures are normally utilised.
• total count in 1mL (or larger) of water sample
• E.Coli and total coliform in 100mL of water sample
Chapter 3
48
Total Bacterial Count
This refers to the number of colonies of bacteria which develop and are visible under a
magnification of 10-15X using standard conditions. This method is most used for sudden
bacterial infestations.
The method involves pipetting 1mL of water sample onto a sterile petri dish containing 10mL
of sterile nutrient agar. The culture plates are then inverted, and incubated at 20°C or 37.5°C
for 44 ± 4hrs. Visible colonies are then counted using a magnifying glass, and the count
reported as the number of colonies per mL of sample.
An alternative method (suitable for waters with lower biological activity) involves filtering
the water sample through a grided filter paper which is then placed on a nutrient medium and
incubated for a standard time period. The number of so called colonies is then counted using
a microscope.
E.Coli and Total Coliform
These are generally carried out using manufacturers pre-prepared kits which consist of
prepared culture media which are treated with the sample and then incubated. The number of
colonies are counted after incubation and species identified by changes in colour of the area
on the plate where they occur.