vancouver best places to work roadshow | earls kitchen + bar
TRANSCRIPT

Mo Jessa President
Earls Kitchen + Bar
Mobilizing Leadership + Engagement

#TalentConnect
file:///Users/sutran/Downloads/image1.JPG
Mo Jessa President Earls Kitchen + Bar

3
About Us • Family-run business • Launched by father and son, Leroy Earl “Bus”
Fuller and Stanley Earl Fuller • One of North America’s most successful
independent restaurant groups
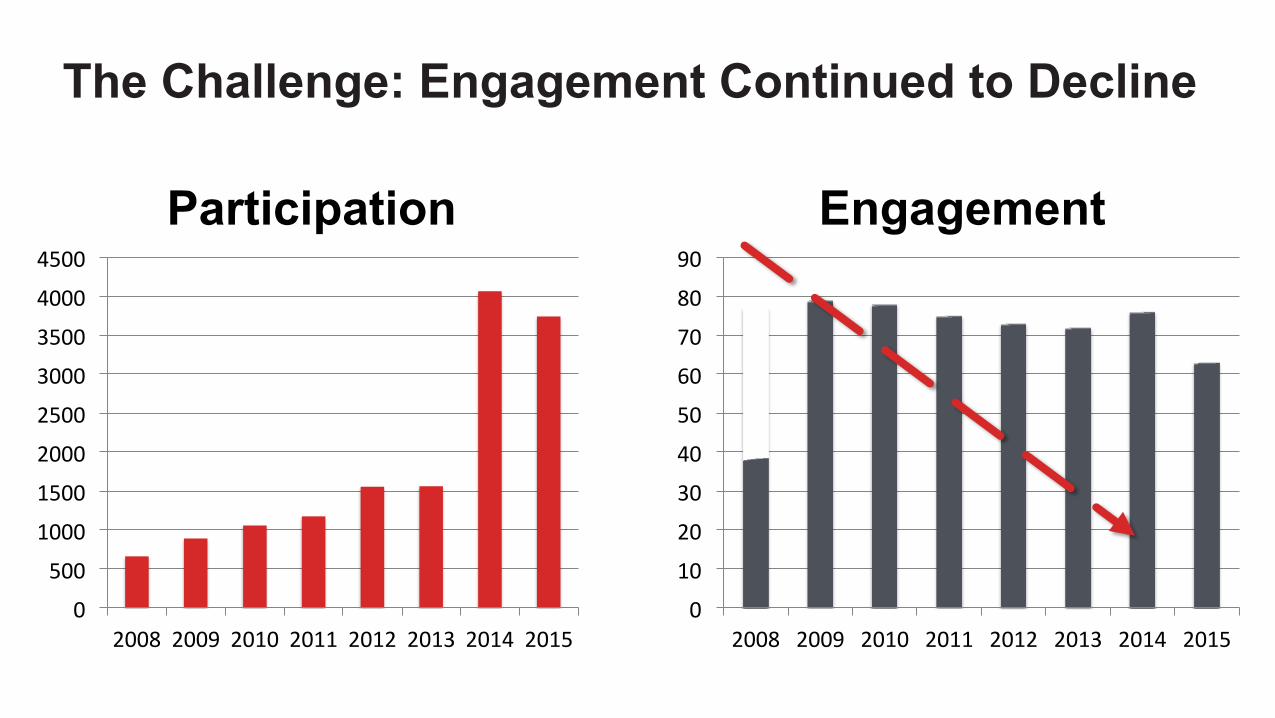
Low Engagement The Challenge: Engagement Continued to Decline
0
10
20
30
40
50
60
70
80
90
2008 2009 2010 2011 2012 2013 2014 2015
Engagement
0
500
1000
1500
2000
2500
3000
3500
4000
4500
2008 2009 2010 2011 2012 2013 2014 2015
Participation

#TalentConnect
Average Guest Count Per Corporate Store
15,000
16,000
17,000
18,000
19,000
20,000
21,000
22,000
P1 P3 P5 P7 P9 P11
P13 P2 P4 P6 P8 P10
P12 P1 P3 P5 P7 P9 P11
P13 P2 P4 P6 P8 P10
P12 P1 P3 P5 P7 P9 P11
P13
Average Guest Count Per Corporate Store
FY2012 FY2013 FY2014 FY2015 FY2016
The Challenge: Guest Count Declines

The 3-Prong Approach
Marketing Products People The Earls Experience

How We Did It
1
2
3 4
5
Operationalize the Earls
Experience
Mobilize Our Leadership
Commitments
Measure Engagement Frequently
Promote Employer Brand
Source Hospitality Leaders

1 Operationalize The Earls Experience
Tabletop Display Creative Posters
Intranet

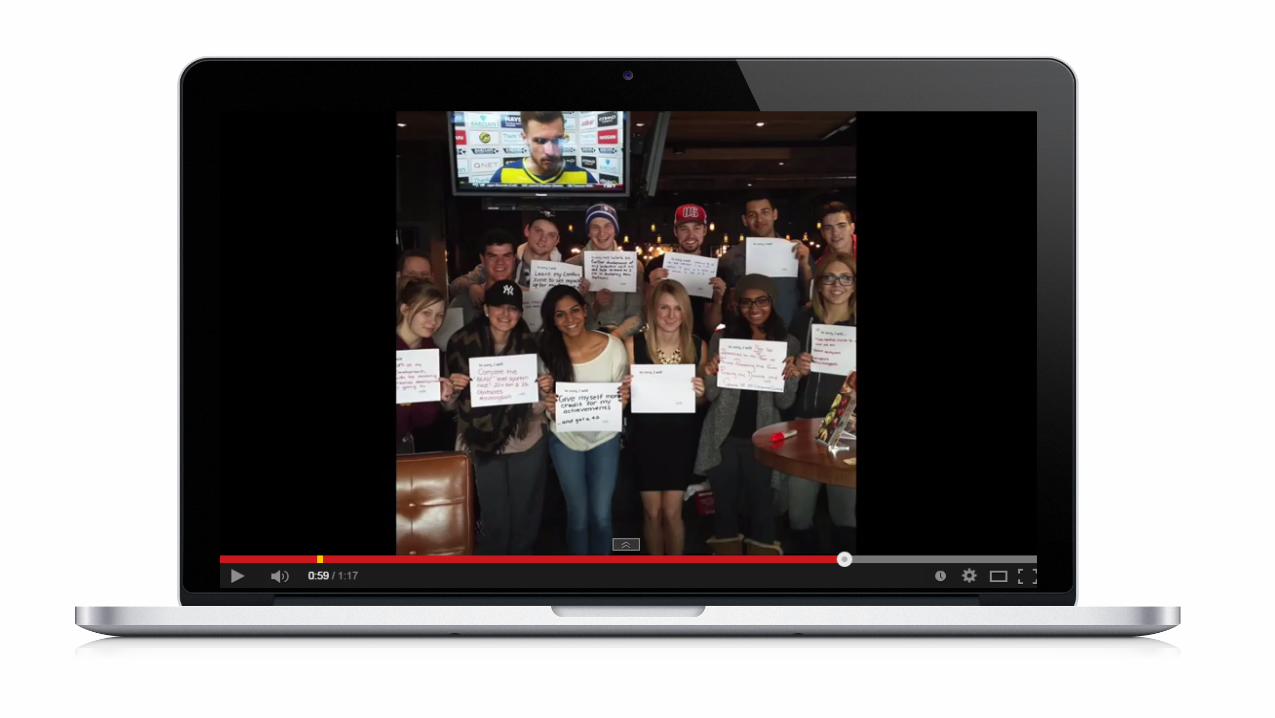
Creative Video Series 2 Mobilize The Leadership Experience
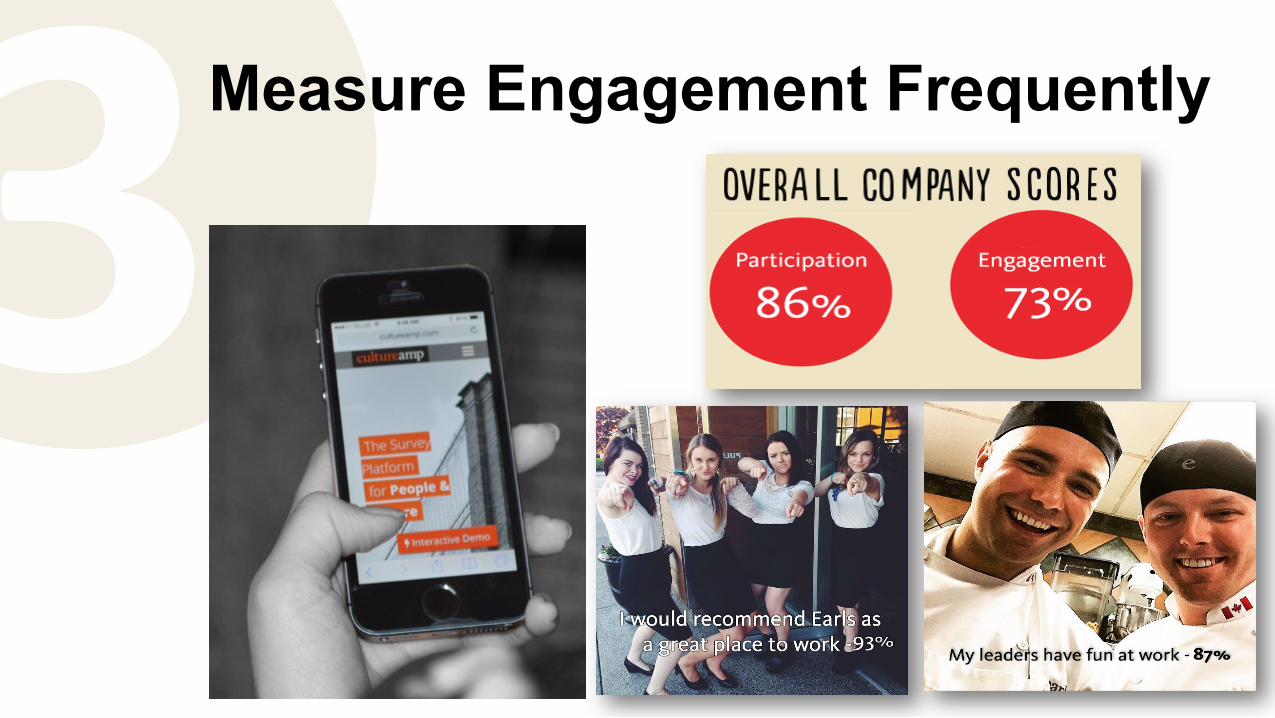
Measure Engagement Frequently 3 Measure Engagement Frequently

4 Promote Employer Brand

#TalentConnect
We believe in People living large purposeful lives filled with fun

5 Source Hospitality Leaders

The Results
Reduced hiring costs by $1M
Reduced legal costs by 90%
Achieved 85% satisfaction with training + development programs
Achieved +20K of social media advocacy from partners
Increased retention from 28% to 43%
Achieved 87% alignment towards our culture & strategies

Our Recommendations Align your company on its mission, vision and values
Invest in leadership development at all levels of your company
Be clear about accountabilities and responsibilities. Measure people against them.
Lead with Employee Advocacy vs. Employee Branding

Where Are We Going?
✪
Improving Financial Performance
✪ ✪ ✪ ✪ ✪
✪ ✪ ✪
✪ ✪ ✪ ✪ ✪ ✪ ✪ ✪ ✪
✪ ✪
✪
✪ ✪
✪ ✪ ✪ ✪ ✪ ✪ ✪ ✪
✪ ✪ ✪ ✪ ✪
✪ ✪ ✪ ✪ ✪
✪
✪ ✪
✪
✪
✪ ✪
Edmonton
BC Calgary
Regina Winnipeg
Toronto Bellevue
Denver
Boston
DC
Miami
Chicago
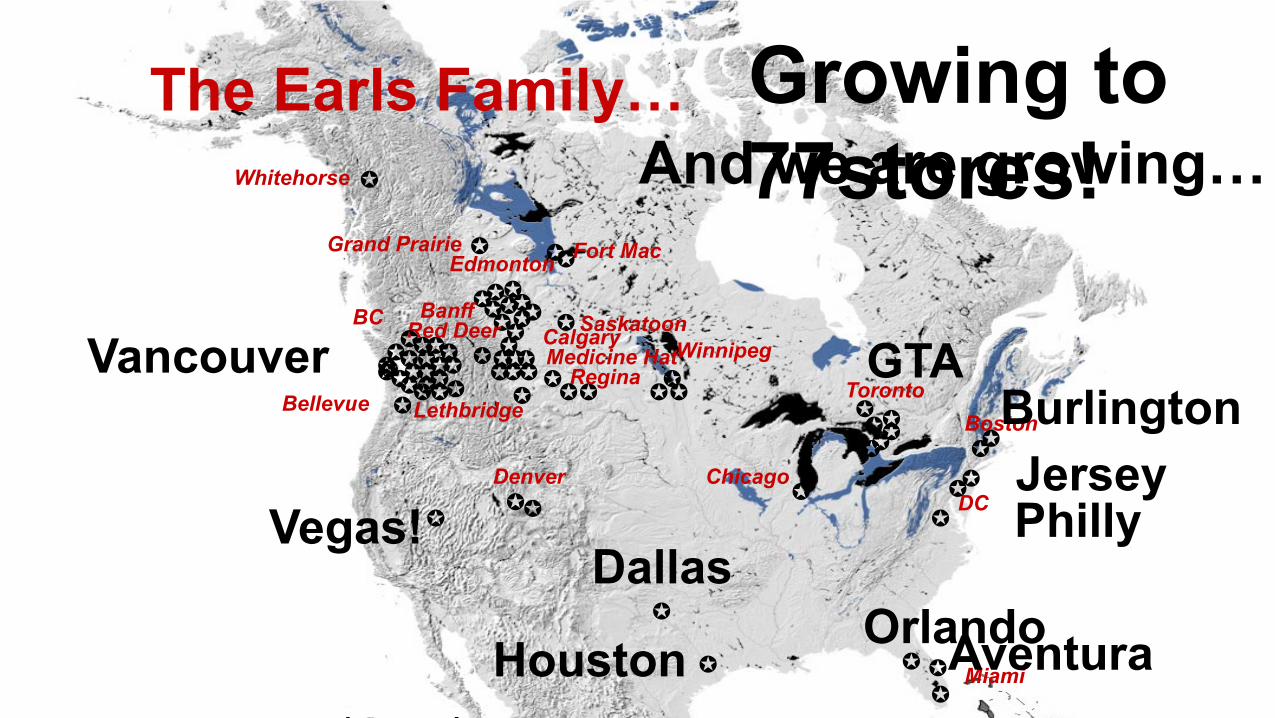
The Earls Family… Whitehorse
Fort Mac Grand Prairie
Medicine Hat
Lethbridge
Red Deer Banff Saskatoon
✪
✪
✪ ✪ ✪
✪
✪
✪
✪
✪
✪ ✪ ✪
And we are growing…
✪ Orlando
Dallas ✪
Jersey ✪
Vegas! ✪
Burlington ✪
GTA ✪
Vancouver ✪ ✪
✪
Houston ✪ Aventura ✪
Philly ✪
Growing to 77stores!
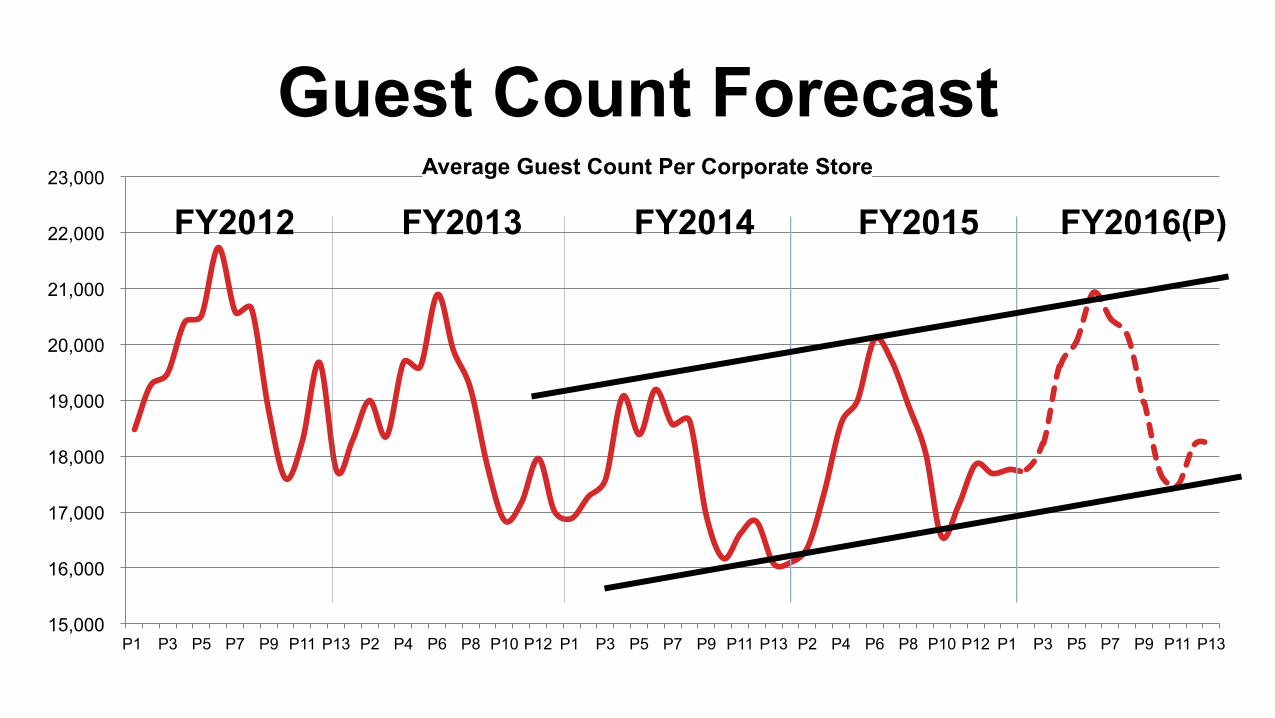
Guest Count Forecast
15,000
16,000
17,000
18,000
19,000
20,000
21,000
22,000
23,000
P1 P3 P5 P7 P9 P11 P13 P2 P4 P6 P8 P10 P12 P1 P3 P5 P7 P9 P11 P13 P2 P4 P6 P8 P10 P12 P1 P3 P5 P7 P9 P11 P13
FY2012 FY2013 FY2014 FY2015 FY2016(P) Average Guest Count Per Corporate Store

Summary
1
2
3 4
5
Operationalize the Earls
Experience
Mobilize Our Leadership
Commitments
Measure Engagement Frequently
Source Hospitality
Leaders
Promote Employer
Brand
file:///Users/sutran/Downloads/image1.JPG
Questions?
Mo Jessa President Earls Kitchen + Bar

The Earls Experience
Earls Kitchen + Bar