usdoe's submittal of references requested for study plan 8
TRANSCRIPT

Department of EnergyWashington, DC 20585
OCT 5 1992
Mr. Joseph J. Holonich, DirectorRepository Licensing & Quality Assurance
Project DirectorateDivision of High-Level Waste ManagementOffice of Nuclear Material Safety
and SafeguardsU.S. Nuclear Regulatory CommissionWashington, D.C. 20555
Dear Mr. Holonich:
In its Phase I review of the U.S. Department of Energy's (DOE)Study Plan 8.3.1.2.2.3, "Characterization of the Percolation inthe Unsaturated Zone-Surface-Based Study," the U.S. NuclearRegulatory Commission (NRC) requested that DOE provide referencescited in the study plan that are not readily available in thepublic domain (enclosure 1). Enclosure 2 contains the referencesrequested for Study Plan 8.3.1.2.2.3.
If you have any questions, please contact Mr. Chris Einberg of myoffice at 202-586-8869.
Sincerely,
John P. RobertsActing Associate Director for
Systems and ComplianceOffice of Civilian RadioactiveWaste Management
Enclosures:1. Ltr, 3/26/92, Holonich to Roberts,
w/encl2.References for Study 4
Plan 8.3.1.2.2.3(Not Record Material)
I6OCG232 921005ITE PDR
1/l
92121701PDR WASWm-II 6 4 ' - 6 & /
I I
oue-.Zv

cc: w\enclosuresAlice Cortinas, CNWRA, San Antonio, TX
cc: w\enclosuresC. Gertz, YMPOR. Loux, State of NevadaT. Hickey, Nevada Legislative CommissionM. Baughman, Lincoln County, NVJ. Bingham, Clark County, NVB. Raper, Nye County, NVP. Niedzielski-Eichner, Nye County, NVG. Derby, Lander County, NVP. Goicoechea, Eureka, NVC. Schank, Churchill County, NVF. Mariani, White Pine County, NVV. Poe, Mineral County, NVE. Wright, Lincoln County, NVJ. Pitts, Lincoln County, NVR. Williams, Lander County, NVJ. Hayes, Esmeralda County, NVM. Hayes, Esmeralda County, NVB. Mettam, Inyo County, CAC. Abrams, NRC

K>
0A UNITED STATESt })2{ o NUCLEAR REGULATORY COMMISSION
WASHINGTON. 0. C. 20555
MAR 2 6 ;
Mr. John P. Roberts, Acting Associate Directorfor Systems and Compliance
Office of Civilian Radioactive Waste ManagementU.S. Department of EnergyWashington, DC 20585
Dear Mr. Roberts:
SUBJECT: PHASE I REVIEW OF U.S. DEPARTMENT OF ENERGY (DOE) STUDY PLAN FORCHARACTERIZATION OF THE PERCOLATION IN THE UNSATURATED-ZONE -SURFACE-BASED STUDY
On May 10, 1991, DOE transmitted the study plan, "Characterization of thePercolation in the Unsaturated Zone - Surface-Based Study" (Study Plan8.3.1.2.2.3) to the U.S. Nuclear Regulatory Commission (NRC) for review andcomment. NRC has completed its Phase I Review of this document using theReview Plan for NRC Staff Review of DOE Study Plans, Revision 1 (December6, 1990).
The material submitted in the study plan was considered to be consistent, tothe extent possible at this time, with the NRC-DOE agreement on content ofstudy plans made at the May 7-8, 1986, meeting on Level of Detail for SiteCharacterization Plans and Study Plans. The NRC staff recognizes that some ofthe information required in the agreement, especially many of the technicalprocedures for field and laboratory tests, cannot be provided until theprototype testing described in the study plan is completed. The staff did notconsider that the absence of such information compromised its ability toconduct its Phase I Review of the material provided. However, the NRC staffrequests that the procedures, methods, and other relevant details be providedto NRC for its review as soon as that information is available.
Among the references listed for this study plan are several which have not been:provided to NRC and are not readily available in the public domain. Wetherefore request that DOE provide the NRC with the documents which are listedin the Enclosure.
A major purpose of the Phase I Review is to identify concerns with studies,tests, or analyses that, if started, could cause significant and irreparableadverse effects on the site, the site characterization program, or the eventualusability of the data for licensing. Such concerns would constitute objections,as that term has been used in earlier NRC staff reviews of DOE's documentsrelated to site characterization (Consultation Draft Site Characterization Planand the Site Characterization Plan for the Yucca Mountain site).
It does not appear that the conduct of the activities described in this study-plan will have. significant adverse impacts on repository performance and thePhase I Review of this study plan identified no objections with any of-the
it ~~~~ENCUSU 1

Mr. John P. Roberts - 2 -
activities proposed. This decision was influenced by the followingconsiderations: 1) the information from this study plan is important to sitecharacterization; 2) there does not appear to be a noninvasive method ofcollecting the data; 3) the study plan commits to sealing each unsaturated zoneborehole within the Conceptual Perimeter Drift Boundary; and 4) the study planhas outlined a process to develop acceptable borehole sealing requirements andapproaches. The NRC staff expects that proper sealing of boreholes will beperformed consistent with 10 CFR 60.134 (a) which states, OSeals for shafts andboreholes shall be designed so that following permanent closure they do notbecome pathways that compromise the geologic repository's ability to meetthe performance objectives for the period following permanent closure. Theseconclusions regarding boreholes described in this study plan should not beconstrued to mean that the NRC has reached the same conclusions with respect toadditional or other boreholes not identified in this study plan (i.e.,study plan 8.3.1.2.2.3, Revision 0).
After completion of the Phase I Review, selected study plans are to receive asecond level of review, called a Detailed Technical Review, based on therelationship of a given study plan to key site-specific issues or NRC openitems, or its reliance on unique, state-of-the-art test or analysis methods.We have decided not to proceed with a Detailed Technical Review of this studyplan at this time, in part because the technical details required for such areview will not be available until the prototype studies are completed.
If you have any questions concerning this letter, please contact CharlotteAbrams (301)504-3403/FTS964-3403 of my staff.
Sincerely,
Joseph J. Holonich, DirectorRepository Licensing and Quality
Assurance Project DirectorateDivision of High-Level Waste ManagementOffice of Nuclear Material Safety
and Safeguards
Enclosure: As stated
cc: R. Loux, State of NevadaC. Gertz, DOE/NVS. Bradhurst, Nye County, NVM. Baughman, Lincoln County, NVD. Bechtel, Clark County, NVD. Weigel, GAOP. Niedzielski-Eichner, Nye County, NVC. Thistlethwaite, Inyo County, CAV. Poe, Mineral County, NVF. Sperry, White Pine County, NYR. Williams, Lander County, NYP. Goicoechea, Eureka County, NVL. Vaughan"II, Esmeralda County, NVC. Shank-, Churchill County, NVT. J. Hickey, Nevada Legislative Committee

References for Study Plan 8.3.1.2.2.3Requested by NRC
/Agarwal, R. G., 1979, Real gas pseudotime - a new function for pressurebuildup analysis of MHF gas wells: Paper SPE 8279 presented at the 1979SPE Annual Technical Conference and Exhibition, Las Vegas, Nevada,September 23-26.
VgCunningham, D. A., 1988, Computer and physical VSP modeling of Yucca Mountain,Nevada: Master of Science Thesis #T-3637, Colorado School of Mines,Golden, Colorado.
J. P., and Gaiser, S. E., 1983, Three-component vertical seismic 2files, an application of Gal'perin's polarization position correlation
J R P technique: 53rd Annual SEG Extended Abstracts, Los Angeles.
v'Flint, A. L., and Flint, L. E., in progress, Preliminary permeability and waterretention data for nonwelded and bedded tuff samples, Yucca Mountain area,Nye County, Nevada: U.S. Geological Survey Open-File Report 90-XXX.
Vkl Gal'perin, 1980, Results of using the polarization method of vertical seismic#-profiling in the territory of Krasnodar Region: Express Informatzia,Ministry of Geology, Moscow, no. 16, p. 27.
..... 1984, The polarization method of seismic exploration: Boston, D. Reidel APublishing Co., Esp. Chapter 5, "Polarization Position Correlation (PPC)'Iof Seismic Waves, pp. 158-202, (trans. from the Russian, Nedro Moscow),268 p.
/ ~Karus, E. V., and others, 1975, Detailed investigation of geologic structuresby seismic well surveys: Ninth World Petroleum Congress PD, 9(4), v. 25,p. 247.
vz Montazer, P. and Wilson, W. E., 1985, Hydrogeology of the unsaturated zone,Yucca Mountain, Nevada, in NWWA Conference on Characterization andMonitoring of the Vadose (Unsaturated) Zone, Proceedings: Dublin, Ohio,National Water Well Association, p. 396-412.
v Skuse, B., 1984, Capillary pressure measurement in reservoir rock cores usingthe centrifuge: Applications Data, Beckman Institute, Inc., Palo Alto,California, 4 p.
/ Snow, D. T., January 1965, A parallel plate model of fractured permeablemedia: Ph.D. dissertation, University of California, Berkeley, California.
..... 1966, Three-hole pressure tests for anisotropic foundation permeability:Fels. U. Ing. Geology, v. 4, p. 298.
-,~ + m a Z9CC
ENCLOSURE

ae%{Ykea.' -
&C.A' MOUNT/SiTE CHARA&4v;; :Ar ¶- ___
r
::;
A. St b VE L A F 4 & ti''' . Al.- 4"
14, I
f"l-

SPEK>~SPE 8279
"REAL GAS PSEUDO-TIM" - A E FUNCTIGI FRt PRESSUREBUILDUP ANALYSIS F GAS WELLS
by hm 6. Agal lembr SPEE,Zoo Productfon (o.
tgamew~~int~~u~iin~~UiMIU.UIifin ftowSaPs"".Uf
slo. Omens QMW6".*Na %oi
* seen A~~~~~~~~~~~~~~~~ I-~~~~~R-LuIMU
A new time function has been defined hich con-siders variations of gas VISCosity and compressi-bility as a function of pressure, which La tur Ls afunction of time. This function appears to besimilar to the real Ras gseudo-2ressure. *Op).ofAl-Russainy et &I*, which takes into account thevaristions oCT ji.viscosity and a-factor as a func-tion of pressure. However this Ls en approxlatefunction as opposed to m this tin functionrill be referd tofathiS pa per reale l apseudotme. tt(p). This fuction has aideipost-treatment pressure buildup analysis of frac-tured (including M) Sas wells by type carv as-sis. Results of computer simulated pressure
buildup analysi Indicate that the use of t (p) pro-vides satisfactory values of computed fractirelengths in fractured gas veils.
In this paper the real Rs pseudo-time isdescribed and its applicltion is temonstrated bymeans of example problems. Although the discussionin this paper Is limited to pressure buildup anal-ysis of vertically fractured gas wvlls, the utilityof this function Ls not eant to be restricted tosuch velsa only.
ATIRODUCSTON
In recent Tears, type curve analysis methodsthave become well known In the petroleut industry foranalyzing both pressure drawdown and buildup data inoil and gas rells. These methods are meant to beused In conjunction with the conventional methodswhenever possible. Exceptions appear to be WT gswells with finite f1ow capacity fractures where con-ventional methods are not readily applicable and, atleast to date, only type cUrve methods appear prac-tical to determine fracture Ieugth and fracture flowcapacity. Although the majority of published typecurves.' including those for WIT wells,'13 are basedoan the pressure drawdown solutions for liquid sys-tems, they can be used in an approximate fashion toanalyze pressure data from real gas wels. Thefirst requirement is that the dimensionless pressure
and time variables art appropriately defined for gaswells. For example, to wse the liquid system typecurves for an WfT as wll, dimensionless vartablesare defined as follows:5
Dimensionless pressure,
th 'lac~ (I)Pw Ci) q
(In SI units, the nuerical constant is 1iZxlO 3 )
Dimensionless pressure, fgr a gas well, may also beexpressed In terms of M(pg) or 4p.
Dimensionless time,
tDX a2.634 x10-4 kt (2)
(In SI units, the numerical constant is 3.6xl 409)
The definition of dimensionless fracturecapacity remains the same.
£C x fV (3)
Vote that in Eq. (1), the real gaspseudo-pressure, 1(p) of Al-aussainy et a1.4'shas been used to take into account thi variations ogas viscosity and &-factor as a function ofpressure. In Eq. (2), viscosity-coepressibility(Pc ) is shown to be evaluated at the initialresirgoir pressure.
In analyzina pressure deawdown datf from realgas wells using a liquid system type curve, it isrecommended that the real gas pseudo-pressure isReferences and illustrations at end of paper.
E~v~cA L

'REAL GAM PSEUDO-TM' -- A NEW FUNCTION FORMSSM R!UITIOIP ANAtVTST Or KW? GAS WML!-2 - _ SW R2774
Iused and Alt(p)| to be lsed in Eq. tt) is defined asfollows:
TYPE CURVES FOR VERTICALL FRACTURED WELS
AImCp)I a *, - ecu,, 1) C')
It has been also established thrt In analyzingpressure drawdown data from gas wells by tpe curvematching, reasonable answers are obtained lf th*(Pe ) product Lu Eq. Z Is evaluated at the initialresirvoir prssure.4
In analyzing dressure bulduptas usin draw-down type curves, the 1a atio l restriction whichshould be Imposed is that the producing time, tprior to shut-iL is significantly seater than Ptheshut-Li tie, At that is (t * AQ/At 1). ?hIsshould apply to both oil andgss vells. In the caseof as well buildup analysis, Alzmp)I is defined asfollow:
af.(p)I a m~pat) - epio (5)
lowever, in using type curves for analyzingpressure buildup data especially from fractured gaswells (even if the effect of producing time isinsignificant), it is not clear as to which pressurelevel the (yc ) product in the dinensionole. termshould be avalted. The question arises whetherthe (pec) product should be evaluated at (1) theLaitialtreservoLr pressure, (2) the final flowingpressure prior to shut-in, or (3) some average pres-sure. Results of this study indicate that the useof any one of the above three pressure levels isless than satisfactory. In general, the use of theinitial ceservoletpressure resulted in a.;frscturelength valutegreater-than the-actual; theause of thefinal flowing Fressure provided a computed fracturelength vhich was smaller than the actual; and theuse of an average pressure provided a fracturelength value which was different than that used inthe computer model.
To overcome the above difficulty, a new timefunction has been studied. This has aided us iapost-treatment pressure buildup analysis of frac-tured (including F) gas Wells. Ibis functioancon-siders variations of gas viscosity and compressibil-ity as a function of pressure, which in turn is afunction of lie. This function is named real -aspseudo-tilse, ta(p), in this paper. This Tunctlons ana ogous to the real gas pseudo-pressure, m(p)of Al-Hussainy et al.,'4 which includes theeffects of pressure dependent gas viscosity andz-factor. It should be emphasized that t (p) Is anapproximate function as opposed to utp). Uovwevr,it provides reasonable values of fracture lengths inpressure buildup analysis of vertically fracturedgas wells and should be most useful for I1U gasvels.
The discussion in this paper will deal with theapplicability and limitations of liquid system draw-down type curves in analyzing pressure buildup datafroo Sas vells. However, type curves for only ver-tically fractured vells will be considered.
The discussion will also include a descriptionof the new time function, its computational proce-duir.ro 1"A Arnli40atl hiP *"rA Af AWSM"10 "pVNIm.
During the past few years, type curves haveappeared in the petroleut literature which cam beused to analyze pressure data from vertically frc-tured wells. Gringarten et *.l presented typecurves for Infinite flow Nias ity fractures. Sincetheir type curves could not be used for 1W wellswith finite capacity fractures, Cinco et l1.3 adA4arwal et al. published amw sets of tcurves(flnite 1Wiiture flow capacity) for WD wells. Con-stant wellbore rate type cpveas of Criagartentfl:6. and Aarswal * 1.a re shown in figs. I*a 2,respectively. aIce all these type curvesare based on the pressure drawdown data in liqaidsystems, It may fist appear that they may not beused to analyze (l) pressre buildup data in oilneils, and (2) o d ovo and buildtm dbt2 inns wellj. Reslts of this stddy indicate that theabove type curves can be wsed, ae least in a*approximate fashioa, to analyze a variety of draw-down and buildup problem prided certain restaic-tions are realized and a few modifications ace =de.These resticetLons will be esmined next.
1. Use of Drawdown TYPe Curves for -uildup
Let us first enamine the validity and lImita-tions of liquid system drawdown type curves (seeFigs. 1 and 2) to analyze pressure bUldp data inoil wells. Before these type cuvs mybe used,-itLs Important to note the duration of Producint tise.t compared to shut-in tine, ast
a) Snall producini time
If the producing time, t , prior to shut-ia isrelatively short such that itdoes affect the pres-sure transients due to the subsequent buildup, draw-down type curves should not be used. In this case,pressure buildup type curves need to be generated toinclude the effect of producing time. This aspeatof producing time and Its effect oan type curve anal-ysis has been discussed recently by Raghavan. 1
Fig. 3, taken from his paper, presents buildup typecurves for a vertically fractured well with infiniteflow capacity fracture (forM a Of * ). Dimension-less pressure rise i has ble plotted as a une-tion of dimenstiolesilsbut-it time, -aDx A f£ailyof typf curves ls shown with dimenstoni; prod cingtime, Dif as a parameter. this figure clearlyshows the limitations of drawdown type curmes foranalyzing pressure buildup-dats collected aftersmall producing times. The effect of mall pro-ducing time will not be considered In the subjectstudy. However, a future paper is planned to coverthis aspect.
b) Long producing time
If the producing time prior to shut-in is sig-nificantly long (that is (t + At)/Att 1) sothat it does not affect tbePtransients due to pres-sure buildup, drawdown type curves say be used toanalyze pressure buildup data. This should beobvious from Fig. 3. The basis for this is depictedschematically in Fig. 4 in which the pressurebehavior is shown during both constant rate drawdownand pressure buildup periods. According to thepressure transient theory Ap during pressure draw-down should be equal to that during the pressurebuildup (for t.uA) provided they are defined as lol-I._ -

SPE $279 RAN C. AGARWAL 3SPE 627 RA~l . ACRA
K 1I(AP)drawdown * PiPvf
initial rcservoir pressure)-(vellbore flowing pressure)
(aP)buildup t +At
(6a)
(6b)
a (shut-in pressure)-(vellbore flowing pressureIn absence of shut-io)
However, since It #At is not readily avail-able, (Ap)buildup Is mooaily defined as equal to
(Pat - AtX4)-Thus there is a difference between the (ap)tswdow
and the way (4p)buildup are calculated. This dif-
ference is equal to (pAtaO - 't G+a) and is shown asthe cross hatched area In Fig. 4R
To further investigate this difference, an WHFsimulators vas used to simulate pressure buildup Lnan WN gas well, using the liquid system analogy(PC = Constant). Reservoir a*d fracture data areshola Ln Table 1. The well was allowed to produceat a constant rate for 180 days followed by a pres-sure buildup test for 14 days. Pressure drawdownand buildup data expressed as atm(p)I/q as functionof time (t or A) Ln days are plotted on coordinategraph paper and are shown Lu Fig. S. Alm(p)) Lsdefined as follows:
-'I~~~~~~~~~~~~~~~~~~~~~
a) Gas well draydown data
To use the liquid system type curves for gaswell drawdown data, It is recomended that real gaspseudo-pressure, m(p) is used in the dimensionlesspressure (pV ) term and (Ic ) evaluated at the ini-tial reservwoqr pressure is ttilined in the dimen-sioaless time (ttx) term. fig. 6 shows thecomparison between the drawdown type curve forliquid and real gas systems. Drawdown data weregenerated using the INF simulator and reservoir datashown ia Table I and gas properties data shown inTable 2. Results Indicate that the use of a liquidsystt type curve for gas well drawdown data La rea-sonable provided that the above mentioned conditionsare met.
If one questions the applicability of thesetype curves for a particular gas reservoir becauseof unusual ps properties and/tr reservoir pressure,as suggested La a recent paper", type cuwves couldbe generated using an appropriate Cpc ) function,temperature, and pressure angses specific to thereservoir under study. These type curves shouldthen be used for pressure transient analysis of datafrom that reservoir.
b) gas vell buildup data
To use the drawdown type curves for gas wellbuildup data, considerations regarding the durationof producing time, as discussed earlier, should alsoapply. Consequently, in this study it will beassumed that the effect of producing time on pres-sure buildup data is insignificant. the effect ofthe (pc ) product on pressute buildup data will bemainly lonsidered. As mentioned earlier, for pres-sure buildup analysis it is not clear as to thepressure level at vhich the (pc ) product In thedimensionless time term should le evaluated.
To study this problem, the tf( simulator wasutilized to generate pressure buildup data on an WKHgas well using real gas properties. Reservoir dataand gas properties used are shown in Tables 1 and 2.As was done for the liquid case, the well was pro-duced at a constant rate for 180 days followed by apressure buildup for about 14 days. Pressure draw-down and buildup data expressed as Ajm-p)3Jq asfunction of time in days are plotted and shown onFig. 7. Note that this figure is similar to Fig. Spresented earlier for the liquid case. .lm(p)J hasbeen appropriately defined. Also shown on Fig. 7,
as the cross hatched area, is Ia(PaIO) - m(Pt P+Atad.
Notice that there is a marked difference between.thedrawdown and buildup type curve. Tkis difference ismuch greater than that shown by the cross hatched
area, mentioned above and discussed earlier.
The big difference in the drawdown and buildupcurves for gas wells Is due to large variations of(Mc ) or (Mc ) product aS'a function of pressure.
Forgas well 1 (pc ) is approximately equal toS (pc ). Fit. S ihows the graph of (Pc ) vs pres-stre fir the simulated gas vell buIldup tcase. Sotethat the variations in (pC ) are much larger inthe low pressure range (sHAbelov 2000 psi) thanthose in the high pressure range (say above 3000psi). This indicates that during the pressurebuildup, changes in the value of the (pc ) product
S
"(p)ldrawdow mc M(Pi) - M(pwi) (a)
and
&1m(P))buiLdup a1 m(p~d - (~t (7b) '
Note that there is virtually no difference betweenthe drawdown and buildup data at early times. How-ever, the difference gets bigger as time Increases.This difference Is due to the way Al(p)3 Licalculated. Also shown oan Fig. S as the M 1up
hatched area iLs 'M(Atii4) - SPt 6At)', which is
equal to the above difference. Thus there is abasic difference between the drawdown and builduptype curves. However, La many cases this differencels not significant. This fact should also beapparent from Fig. 3 where the difference betweenthe drawdown and buildup curve fat long producingtimes is shown to be small. This indicates that inliquid systems, for large producing tines, pressurebuildup data can be analyzed using drawdown typecurves to obtain reasonable answers.
2. Use of Liguid System Type Curves for Gas Wells
Next, we will examine the applicability ofliquid system type curves for analyzing pressuredrawdown and pressure buildup data obtained fromreal gas wells.
'REAL GMS PSEUDO-TIME" - A NEW FUNCTION FOR&uwce~mt i 01TIHm *V*?VCC ftr WuT r-ie UTftA Cor Rile
vill be more severe at a lower pressure than at ahigher pressure. In the absence of the effect ofproducing time, this should explain the large dif-ference between the drawdown and buildup curves.
The effects of variations of (pct) product as afunction of pressure on drawdown data are well knownin the petroleum Industry. As early as 1962,Carters proposed a method to find formation flowcapacity based on dimensionless time correlationwherein viscosity and compressibility were pointtime functiows. Al-Hussainy et a1.4 establishedthat solutions for the flow of real gases shouldcorrelate as functions of dimensionless time basedon initial values of viscosity and compressibility.Unfortunately, there Is only limited work dons toInvestigate the effect of (Pe ) variations on pres-sure buildup data In gas velli. Recently, Scottsuggested consideration of the variations of (pe )as point time functions In pressure buildup analuiksof ?t Os wells.
During the course of this study, a new tioefunction tas been developed which takes into accountthe variations of (pe ) product as a function oftime and pressure. Thts function appears to provideexcellent engineering answers when applied to gaswell buildup data. This function will be discussednext.
REAL CAS PSuDO-TIIE, ta(p)
where p and c are fnActions of pressure. Thisfunction is rIferted to as real xas'pseudo-time,ta(P), In this paper.
If time and pressure are assumed to varylinearly with each other, over small time Incre-ments, Eq. 10 can be approximated as
t (p) es (j' 1t j a s1a Julj ( PJ P.1 -I) Ppc(p)
Note that in Eq. 11, t represents flowing time fora drawdown test and silt-La time for a buildup test.Eq. It may be rewrit'en as
a (t � t .1)
ta(p) V82: I 3Jul (Pi , Pi-dMy 0 I(Piol)l (12)
Al-Kussanty et a1. 4 definedpressure.
real *5ssosendo-
K>_p0Po (a)
whbre an integral
I(p) * r' tU(13)
can be evaluated beforehand using p and c as func-tions of pressure. In Eq. (13), p 'is a low basepressure and p Ls the maximtu presture of Interest.The above Integral, expressed ia graphical ortabular form, can be used In conjunction with Eq. 12to compute real gas pseudo time, t (p). Since crather than ct is normally avaliabli as a functiontof pressure, the following relationships may beutilized.
c a m S c * S ~ c * S e c , , * c f C 1 4 )et- a Sa ca + So Co + SW ew * cf (4
For a gas well, Eq. 14 Is usually approximated as
eft S& cg (IS)
Going back to Eq. 11. it should be noted thatduring the tine interval, At a t - t and thepressure change. p p Jp J tbe;lscosity-compressbtillty prodact PICt)jJiJ defined by
which takes Into account the variations of gas vis-cosity and x-factor as a function of pressure withP0 as a low bare pressure.
In this paper an analogous function Ls definedas follows:
Ca(t) of dt
to pRt)tY tC9)
where a and e are used to denote viscosity andsystem comprelsibility as a function of tine ratherthan p and c which are usually expressed as func-tions of prelsure. If £ Ct) is redefined as afunction of pressure, a Rev function is obtained as
PI u WIJ de
TPCLTJ Pi.1 PON(p)(16)
ta(P) = 1j7 4Lc P dpJf p ct~P 0
(10) where, j a 1, 2, ... , a

SPl 8279 RAN C. AGARVAL SY
II This definition ia Eq. 11 gives
a a (17)
Eq. 17 clearly indicates that the units Lat (p) consist not only of tile but a combination oft&e, viscosity, and compressibility.
CO1PUATAICO OF REAL GAS PSEUDO-T12, tCp)
Eq. 19 appears very similar to Eq. I where time(t) has been replaced by RPC ) *t C 1 . This Sir-gests a correspondence betvee& theareal time and CMpseudo-tUne. This also implies some correspondeacebetween the flowing time for a drawdown test and theshut-in time for a buildup test as well be shownnext.
Correslondence between flovint and shut-in times
The subject correspondence is being establishedbased on certain observations rather thus rigorousmathsmatical solutions.
Although the use of the real gas pseudo-time.t (p) is not meant to be restricted, this studyilints out that the dimensionless time (see Eq. USor 19) for gas well buildup data correlates muchbetter as a function of tatp).
Based oa the earlier work of Al-Russaliy et a1.4.it appears reasonable to &ssm_ that the aiesioS-less time for pressure drawdown data should corre-late as & function of the (pc ) product evaluatedat the initial reservoir preslute as shown in Eq. 2.
A comparison between Eq. 2 and Eq. t8 or 19imply the following correspondence between theflowing time, t, and the shut-Ln time. At:
Since Eq. 12 for t (p) contains an Integral,X(p), given by Eq. 13, tcputation can be performedusing either graphical or tabular data. Simply, Itcan be accomplished by means of a computer or a deskcalculator. Trapezoidal or Simpson's rule can beused. Integration can be performed by reading mid-point values of Cl/pc ) from the table or graph andmultiplying by Ap. Ciputations of H(p) uttliuinggas properties In Table I are outlined In Table 3.Frg. 9 shows a graph of Cl/pc ) and 1(p) as a func-tion of pressure. Although sit shown, It Ls 12souseful to prepare a similar graph for real gas pseu-do-pressure, m(p). Thus 1(p) and m(p) curves pre-pared for the gas in a specific reservoir can beused as master graphs for future wells In that res-ervoir. The 1(p) curve Is used in conjunction withEq. UI to convert real times to corresponding pseu-do-times for the specific application. t .t p
P Ue-t 5 Cv (20)
CERTAIN MSE ASPECTS OF t (p)
Before discussing the application, let us con-Sider certain aspects of teal gas pesudo-tlme,ta ():
Definition of dimensionless time
or,
t -B(PC t)I a~ (21).
If ts(p) is used to express
time term, tDax, then I
the dimensionless
t~alf a2.634 x1O'4k %tOf(p
(18)
Since the viscosity-compressibility product lsalready Included in te(p), it does sot appear inEq. (18). To express an analogy between Eq. 18 andEq. 2, the above equation can be multiplied anddivided by (ye ) evaluated at the initial reservoirpressure. Ti IrovLdes
It should be noted that the shut-in tine, At.Is already Included in t ap). The use of the aboveconcept appears to provide a number of practicalbenefits.
t. This allows us to use the same definition ofthe dimensionless time (see Eqs. 2 and 19) istype curve analysis for both pressure drawdownand buildup data.
2. In performing type curve analysis of the combined pressure drawdown and buildup data fromthe same well, It ls possible to plot drawdowndata as a function of time (t) and buildup dataas a function of [(sC ) -t (p)| using the samegraph or tracing paper. iTts concept, alongvith the superposition principle, was utilizedin a companion paper by Bostic et aj.'
3. This also permits us to compare dravdown andbuildup data from the same gas well, as shownin fig. 10. This will be discussed nextshowing the application of ta(p).
APPLICATION OF REAL GAS PSEUDO-TIME. t tp)
t~sif a2.634 x10 4kf #PC x2 UesCdL i ta(p)J
I- t I 'c )i f(19)
It should be noted that in Eqs. 18 anO 19. ageneral definition of dimensionless time 'Dax Lasbeen used. Accordingly, it may represent dimelsion-less drawdown time or dimensionless buildup timedepending on whether t (p) in Eq. 12 has been calcu-lated using the flowing time, t, or shut-in time,at.
To Illustrate the application of real gas pseu-do-time, let us consider the pressure drawdown andbuildup data, shown in Fig. 7, for the gas vell

0 ,CA&J4WAP. 4DAOA&40WC AAA&40A.4 VZ iWU �A� Wf.A.A�? -* -
0 gA�..).�&.4LL a�.&J.&flJc � Ut � � �
I>
case. These data have been replotted In Fig. 10 andare shown as lm(p)j/q as a function of time tt orat) in days. In this figure, solid line with cir-cles represent the drawdown data whereas the solidline with triangles is for the buildup data. Asmentioned earlier, there is a considerable differ-ence between the two curves. These buildup data,being so much on the right side of the drawdowncurve, imply that the use of (pc ) at the initialreservoir pressure will result A computed fracturelength which is much greater than the actual. Thisaspect will be investigated later by means of typecurve analysis.
To use the concept of ranl gas pseudo-timeEq. 12 was tsed in conjunction with Fig. 9 to con-vert shut-In time, At, to ta(p). Eq. 21 was *tL-lized to express these data In terms of equivalentflowing time, t or (PC ) *t (p). It enable Us tocompare drawdown and buil&udata on an equivalenttime basis. Pressure buildup data plotted as afunction of (pc ) *t (p) are shown as the dottedline with trilnalJI.C Vote that the result was tomove the buildup data (shown as triangles) horizon-tally from the solid line on the right to the dottedline on the left. Also the modified buildup curvecame very close to the drawdown curve. This figurealso indicates that real shut-in times, At, areequivalent to only about 60$ of the equivalentflowing times, t. for example, the real shut-intime of 6 days Is equal to only about 3.75 days ofthe equivalent flowing time. It is possible to plotshut-in time, At as a function of equivalent flowingtime, (pc ) et (p). This is shown In Fft. It. Thesolid lifa Ieptesents the ins case and the dottedline is for liquid case. This figure clearly showsthat shut-in times for liquid case are equal to theequivalent flowing times, whereas they are much lessfor the Sas case. This indicates that a graphsimilar to Fig. 11 should also prove useful in thedesign of a pressure buildup test on an WT gaswell. For example, if a pressure buildup test Isrequired to be run for an equivalent flowing time of6 days to obtain the desired information, it may benecessary to run the test for about 10 days, whichis almost twice as long.
Let us next consider the effect of (hPaC) pro-duct evaluated at different pressure levels on thetype curve analysis of gas well buildup data. Thevalues of computed fracture lengths will be comparedagainst the actual total fracture length of 1000feet used in the simulator. Pressure drawdown andbuildup data presented in the preceding example willbe utilized for this purpose. fig. 12 shows a sms-Llog graph of pressure buildup and drawdown dataexpressed in dimensionless quantities. Dimension-less pressure, PvD` has teen plotted as a functionof dimensionless time, Dx . For drawdown data,(Pc ) product in the dimenlionless time was evalu-ated at the initcil reservoir pressure. This curvewill be considered as the reference type curve.
Data curves for buildup data have been plottedusing the (lict) product at the initial reservoirpressure, p , and the final vellbore flowing pres-sure prior 10 shut-in, p . Since the data curveusing (cet) Ls on the x 9-bhand side of the draw-down type crve, matching will provide computedfracture length which is greater than the actual.On the other band, the data curve using Pc atpat_, being on the left-hand side of the leference
type curve, provided a computed fracture length Iwhich Is smaller than the actual. A third datacurve Is also shown which utilized Eq. 18 to incor-porate the concept of real gas pseudo-time function.Results of curve matching, using the new time func-tlon, gave results which are close to the actualfracture length.
Table 4 provides a comparison of fracturelengths, computed by type curve analysis, using the(Cc ) product La the dliensionless time term at var-Loua pressure levels. Results of four sets of slmu-Iated gas weil buildup data are shown, where boththe value of fracture length and the level of finalflowing pressure p were varied. Inspection ofTable 4 reveals tHt M ults are affected by the(pc ) product used and the level of the finalflo~ig pressure at the instant of shat-L. The useof (51cc) provided values of computed fracturelengthM Wch are too optimistic. The effect lsfurther exaggeratcd at a lower value of the flowingpressure. The use of the (pc J product at pprovides a low but reasonabletvalua if p Ift elu-Lively high, otherwise it provides pessi*tsticvalues of fracture length. The use of real gaspseudo-tlie provided computed fracture length valuessimilar to those entered in the simulator. Based ona aumber of computer runs, it appears that the con-cept of real gas pseudo-time function Is useful inanalyzing pest-treatment buildup data from fractured(including UHF) gas wells.
Steus Used in Applyain Real Gas Pseudo-Time Functionfor Type Curve K tchian
Th following step-by-step procedure should beuseful in applying the concept of real gas pseudo-time to gas well buildup data for type curvematching purposes.
Step I
Prepare a table of gas properties as shown inTable 2. Compute real gas pseudo-pressure, m(p) andintegral, 1(p) as a function of pressure and plotthem on coordinate graph paper.
Step 2
Tabulate pressure buildup data, pt vs At.
Uaing the above figure, convert pAt to (pat) and
compute Afm(p)3 a a(p 6 ) - m(PAt.).
SW 3
Using the figure for I(p) andto t (p). It should be noted thatcontiins the (pCt) product.
Eq. 12 convert atta(p) already
Step 4
Plot ga(p), vs t a(P) on a tracing paper uti-lizing the appropriate type curve. Type curvematching should be done In the usual manner. For &aWIT well, if formation flow capacity is known apriori, the vertical position of the data plot maybe fixed on the y-axis of the type curve. Otherwisethe matching should be done by sliding the tracingpaper parallel to both x and y axes.

SPE 979 RAM c. AGAWA I
S?� 8279 IAfl 6. AGARVAL 1I I
I
I
# ~~step SOnce a match is obtained and a match point Ls
elected, the fracture length is calculated as
f Naxtiatj (22)
In regard to the # term La the above equation, thefolloving should be pointed outs
it the (pe ) product in the real gas pseudo-time, t (p), lst ased on the system compressibility,e . 8 *e I8 cc, thena sh'uld be theiltal joilsldr he WsyiLt
If gas compressibility, c has been usedinstead of c , then $ should begreplaced by hydro-carbon porosity, 459 0
pressure ranges and then used for the spe-eific application.
b) ror as well buildup data, the use of (pet)product at the initial reservoir pressureprovides optimistic values for fracturelengths whereas the (sic ) at the finalflowing pressure provides pessimisticvalues for fracture length. She use of thereal Sas pseudo-time provides satisfactoryvalues of fracture length..
6. Due to the effect of variations of Oc )on gas well buildup data, It my be neci-Bary to rm a buildup test twice as long asit Ls norma crn. is aspect should beconsidered in the design of pressurebuildup tests Go W gas wells.
7. Although the discussion In this paper islited to pressure buildup analysis ofvertically fractured gas wells, the utiltyof the real gas pseudo-time is not meant tobe restricted to such wells only. Torqxample, this function was also found veryuseful for gas wells In analyzing wellborestorage data, linear flow data, etc.. toname a few.
Once the value of i Ls determined, the feac-ture flow capacity can bi determined by Eq. 3 as
(kfw) a (FCD)(kx) md-ft
CONCLDING REMARXS
As a result of this study, the followingremarks appear warranted:
(23)
d
I. A new time function (teal gas pseudo-time,t (p)J has been developed which has aided inpost-treatment pressure buildup analysis offractured (including WIT) gas vells.
2. This function is analogous to the real gaspseudo-pressure, a(p) of Al-Hussainy et sl14Although It is aOt a rigorous function, it pro-vides excellent engineering answers for verti-cally fractured gas well buildup analysis.
3. There is a basic difference between the draw-down type curve and the buildup type curvebecause of the different ways Alm(p)l or Ap arecalculated for pressure drawdown and buildup.Novever, drawdown type curves may be used forbuildup data provided the producing time priorto shut-in is long (that is (tp + At)/At*a I).
4. For small producing time prior to shut-in,buildup data should not be analyzed by drawdowntype curves.
S. To use liquid system type curves for gas wells,the following points should be noted:
a) For analyzing gas well drawdown data, theuse of liquid system type curves appearsreasonable provided that the real gas pseu-do-pressure is used in the dimensionlesspressure term and the (Vc,) product in thedimensionless time is evalated at the lni-tial reservoir pressure. However in cer-taLn cases, because of unusual gasproperties or reservoir pressure, typecurves should be Senerated using the appro-priate (Cpt) function, temperature, and
NOIIKNC
Cf
C.
"CD
b.
3(p)
k
kf
SWp
TATURE
* formation compressibility, psnlt
* Sas compressibility, psi'1 (Pa;1)
a oil compressibility, prl )
a system compressibility, psial (Pa1)
a system compressibility as a func-
tion of time, psC (Pa l)
a water compressibility, psi l(pa t
a dimensionless fracture flowcapacity (see Eq. 3)
a formation thickness, ft (a)
a integral La-Eq. 13, psi IAp (P 2is)
a formation permeability. ad
(o0 3 Ps2)
* fracture permeability, ad (10& 602)
a real gas pseudo-pressure, pSI 2/cp(PtIP Ipas-) (see Eq. 1)
At.(p)I a difference in real gas pseudo-
pressures psi2 /cp (MPa 2 /?ba&)
p
Pat
a pressure, psi (HPa)
a initial pressure, psi (HPa)
a shut-in pressure, psi (liP&)

S - PRESSURE RUILDUP ANALYSIS OF Wff GAS WELLS $PE $219
I- PBLSSURE BUILDUP AI�ALTSLS OF WG� GAS WELLS Sfl 8Z19I
p6 ~~ * shut-La pressurC at the instant ofshut-ia, psi (Hpa)
= dimensionless shut-L pressureP S Ds rise (see Ref. 7)
NyO a dImensionless pressure or pressuredrop (see Eq. 1)
Fwf a vellbore floning pressure, psl(Ma)
ap * pressure change, psi (MPa)
a pressure change p P psi(MP.) (see Eq..II
U(p) a differeacl in squares of pressures,psi' (PA')
q * flao rate, NCF/D ("standard *3'd)
3 a saturation, fraction
S8 a gas saturation, fraction
SO a oil saturation, fraction
SW a water saturation, fraction
t a flowing time, hours
t (p) * real gas pseudo-time, hours-ps icp(hours-Ps/Pao~s) (see Eq. 11)
It (P)WI real gas pseudo-time for matchpoint, hours-psLi/cp (hours-Pa/Pa S)
1C(t) a a function defined by Eq. 9
tox m dimensionless time based on xf (seeEq. 2)
Atdxf = dimensionless shut-in time (seeRef. J)
"Doxf = dimensionless time based on t&(p)(see Eqs. 15 and 19)
"DaZ A| dimensionless time based on t (p)for match point (see Eq. 22)
Itp producing time prior to buildup,hours
at n shut-in time, hours
atJ time Interval, tj - tj.-. hours
T v reservoir texperdii.'R (K)
Xe v distance from vell to the reservoirboundary, ft (m)
i if fracture half length, ft (o)
! s real gas deviation factor
1j sviscosity, ep (Pa.$)
9 p s ~~viscosity as a function of etse,ep (PA-S)
cpct) v £iscoslty-coarpressibility product,cp/ps( VP's/Pa)
a viscosity-coepressiblIty productat initial reservoLr pressure,cpJpsL(P&*S/P&)
a vLscosLIty-compressibilfty productIn a given interval,cplpsi(PsI/Pa) (see Eq. 16)
* delta or difference
a formation porosity, fraction
a sigm or suimation
A
I
Subs crip!
CD
Daf
t:5
a dimensionless flow Cal
a dimensionless
a dimensionless based oI
a dimensionless based o0do-time
pacity
12
12
x£ and time
Sf and pseu-
I
a a apparent or pseudo
e m external boundary
f a fracture or formation
g sgas
I a Initial
J a index for suumation
ni a match point values
a a index for sumnation
o a all
p * producing
t a total
V a vater
vf a wellbore flowing
REFEWICES
1. Earlougher, R. C., Jr.: Advances in Wellest Analysis Honograph Series, Societyof Petroleui £ngineers of AIME, Dallas(1977) 1, 264.
2. Agarval, R. C., Carter, R. D., and Pol-lock C. A.: 'Evaluation and PerformancePrediction of Lov-Permeability Gas WellsStimulated by nassive Hydraulic Frac-turipg, J. Pet. Tech. (March, 1979)36;-372.
3. Cinco-L., R., Samaniego-V., F., and Domin-guez-A., K.: "Transient Pressure Behaviorfor a Well With a Finite ConductivityVertical Fracture," Soc. Pet. Enx. J.(Autost, 1978) 25i-264.

SP 9279 RA C. AGAWo
SPE 8279 RAM C. AGARVAL
4. Al-Hussainy, R., Raney, U. J. Jr.. andCrawford, P. 3.: 'The flow of Real CasesThrough Porous Ideia*" J. Pet. Tech. (may,1966) 624-636; tians., AIME, 237.
S. Al-Eussainy, R. and Ramey, B. J. Jr.t"Application of Real Gas Flow Theory toWell Testing and Deliverabilfty Fore-casting," J. Pet. Tech. (May, 1966)637-642; Tans.. IME, -23?.
6. Cringarten, A. C.. Ramey, H. J. Jr., andRathavan, L.s *Unsteady-State PressureDistribution Created by a Vell Vith aSingle 1nfinlte-Conductltwty VerticalFracture," Soc. Pet. En . J. (August 1974)347-360 T .IME. 257.
7. Raghavan. .: 'the Effect of ProducingTSwe on Type Curve Analysis." subsitted toSPE of AIME.
X. Carter, R. D.: "Solutions of Unsteady-State Radial Gas Flow," J. Pet. Tech.(Kay, 1962) 559-554; T LIns., E. 225.
9. Scott, J. O.: *Application of a NevMethod for Determining flow Characteris-tics of Fractured Gas Vells in TightSands," paper presented at 1979 SPE Sympo-SIu oan Low Permeability Gas Reservoirs,
Denver, Colo., May 20-22. 199.
30. Bostic, J. ., Agarwal, 3. C., andCarter, I. D.s "Combined Analysis ofPost-FracturLg: Performance and PressureBuildup Data for Evaluattng an KF Cas
a Vell," paper SPE 8280 presented at SPE54th Annual Fal feeting, Las Vegas, &v.*Sept. 23-26, 1979.
I.
TABLE 1
-Reservoir and Fraure Data for Simulated MHF Well
K-Reservoir Data
Reservoir pressure, piReservoir temperature, TFormation thickness, hFormation permeability, kFormation porosity, *Initial gas saturation, SgProduction Rate, q
Fracture DataTotal fracture length, Z fFracture flow capacity, kiwDimensionless fracture
capacity, FCD
5000 psi (34.5 MPa)720 OR (4000K)50 ft (15. 2m) 2
.01 md (9.9 x 10'61m )
.07 fraction
.50 fraction500 McfID (14, 158m3 D)
100050
ft (3m)md-ft (15 x 103 mm)
10
K>~

Gas Properties for Simulated MHF Gas Well
Pressure(psn
0600
1M002400
36004200400
5400
Viscosity
kp)
.014
.OMS
.0166
.01W0
*.0197
.0216
.0236
.025
.02?S
z-factor
(fraction)
LOOO
.971
.951
.940
.93
.94
.986
L014
L045
Cg
1J06 x 10-5
86.0: 104SC ox 10-S
M.9x 10-53Llx 10424.3x O S19.5 10io16.0 x 1U3 x .3:
M10
IpsI2 Icp)
2.5 1 Ic
10.Ox 10?218x1037.3 x 10,55.6 x 10,75.6 : 10t96M x I0,
IM9 x 1014L3x 10x
CommiWln at#1.4 v4 gI w *ei5M dog , Inc Cn Propetes
K>/'
q1' wof_ 0
0W ILM a l0-200 L4. a 104
Iwo 4.1r 1 .o
no LaE IO~3600 W2 Jz 104
LOS a 0A= L30 * 104
M Led I 10.6
Man
pslt, IWtV
MOD it W110a
ZL29 aU 16IL saUid
VT. I?uIt042t VI.2leX641 04 2tg.91ale
4 Iimcz:v, AL241e
3.4 7 V' J a lea90Zz10 IZas1O{Si.aXt 5L.Ua0X
AP WOIt XMeM
S S
ao 239 aleW a I le,
Om I0.uiz IO'GM 1&5 I od6M 17.95 I £0IM 2LZ I 0 I
GM 244 I zleaG 2V.fla ICOao 31.1 I 107
lips*
Lu . dtW9a 1 l,
xn5 :rc'
WSLO a WV12109 i l157. 20 I7le
* It prowmu Is Shouwn In f. IRwuts Wu ls pstWo prssum, tp can of CopAd usinng . 12 am
lI In conjunction ltwh th dunld pressn vs. Ues *1L
ITA Ij Z
Ccarlsa dCu'-eiec faewrW W..*s ts@ Te Cunit 1Mo.rf_ Cmi~t, * 1;iul u: ~au ljgun; 'u1 ' AP~ sa: varIs a s~ u..,s
1oaI Fea cljre LI- f ofIntUAI Final Flotifnc
Rvn flak Itie Pressure Pressure @ 4U) } U h
,o. ftCF'' 10sI, slIS Sirulstv I . * 0 a .m i
Is Me xm MAF z- n I sm W. W.
. A 5W SM INS 1 am lex jar23 ism 5C 1103 iw 2S M 1-.3 151:

I-ItU,
St
10
.2VI10.lI
I 1001AUDIONLESS TM %xi
IFig. I1- Contatnt rato & ft tMp cuve for idliots fk
"of wikalfubn-llqddotoataf1 Grlagh.tu Fig. 2 -C*natamt rate ie6~ type curvs for flot to noawCa l etical fracturs - liquid Spine (aftr A2e-.I
1104
5 104
*1AM l0NlESS SMAm11 TIM Aox
Fig. 3 - Uffect of produinga tin on kdl*ip data for ld lollflow cap I ty vertical fractin - liquid systme (if ter
Fig. 4 - Schematic of pewsw beaiorduri ng astemt ratoi MM W but 169 porlods.
& a.
-
5.011
II
A:!
, I
LOt
- . I
ORAWOM
I
.ML.6 I a m'em?w1a .,, t AIJ W WMA1+44-uhrd w immow
OIFMD=:�11
4
.4
010
I
Le
I I10 .2, , ,LI I * -- - _ .: J~~~~~~~-l0' la -L M-6
LO'
-La
ImadGIONULSS TiME
Fig. 6I- Cowpaison botwemitmd *2~t ly to- sws for I iqid andps Systeme (Constant Veill rtet).
I i * 3 .4 5 0 . ITIME (DAYS)
Fig. 5 - PreSsw' &Viim VWd buildup data v seti (I 1qdSystem - C * et ) Is constant).

a a" . ~ -W.
s.o'
, 2~-S ~-
'S. I
Le0
I I I
DRA
-A! -,p mWV.* IV t m-npapu t&j 0 Oen"
404-06. a A, 6110 0...
I
liffEltm,44,
211 .--
t
*41
.I"6F
Lo U'-.
LO I
I. "i"iii/f77
-La. I I---I I *
A
a I, -- - - - - - -- -
I I I 3 4 s 11 Itot IDAYSIFig. I. a m *dmmzw aM t0114 daba vs tin (gus gpita -C s et ) is Wfamfo ef pimnw.u
o mm~ am - -= NPRESSURE, WI51
Fig. I - Varatimn Of ps v~smoity- ,,ulilty Ito j mtraftt as a fwmtlmon f pasm.
s-I
5.0
I2.U
00a1
U9
4.0
3.o
to~
LO
S.0
.5 11
I I IPO �,-
ICRAW
ultpu�gBjiiol;
LOW .
Awo ?1KMINI -0 IV. I eg oft 1
a I W*4
uva-4&4 %-svao %,"" %,p
1+64-sk-~aat
OIFFERENCJE.I _ _ _ _ _ _ _ _~ npr7%
- -- 1 - I --- I - I-be w_ !
0 1 2 3 4 5 6
Ft l0 - *cpltcatton Of ml Ps Psmxb-tim b Ps well WMtl
III
E6
0.3
CL:WV
I 0.1
a
0.0
.. I... I -...,..., . - ., / '
a /- IWLD@UP USI y,
DRWONCURVEBUILDUP USING Ialpl
BUILDUP USING 11zCIi
. .. . - ..
I
* JI
L2 4 6 I WO PEOUIVAIEN FLOWING TIME, t or 4zct 1towp (DAYS)Fig. 11 - 90-It-i tin vs squtwv1etht flowing time.
DIMENSIONLESS TIMEFlo. 12 - &aw~ WL Buildu data plotted usinig (9 et) at diffesrintpresit i levih (P s u3:9.(v et) is a Fj. of r s# u)

r,
U.S.GENMT 3
NNWSI PROJECT CtLOIMMOU1
UNITED STATES GEOLOGICAL SURVEY
DENVER, COLORADO
DETAILED PROTOTYPE TEST PLAN
CROSS-HOLE PNEUMATIC AND HYDRAULIC TESTINGIN SUPPORT OF EXPLORATORY SHAFT HYDROLOGIC TESTING
WBS 1.2.6.9.4.2.4
Principal Investlgatory - Robert C. Triutz'
Co-Investigator - Robert W. Craig
I~EV. 2
IRESOURCES DIVISIONMDO WATERRCES LIBRARY
I>
,.I- . -
I " '
PrInc PaIRobert C.
InvestigatorTraut2
Date
:';'. t.; ' ' '.
Co-Investtgator ,*.*,Robert W. Craig. ,,-,
Date
I . -1 . -.
-
ReviewerTechnical ISandli Doty
Date Chief. Branch of NNWSILarry R. Hayes ... .
Date
I
U.S. GEOLOGICAL SURVEYWATER RESOURCES ODI'SIONCCLORAf) WATERRESOURCES LIBRARY
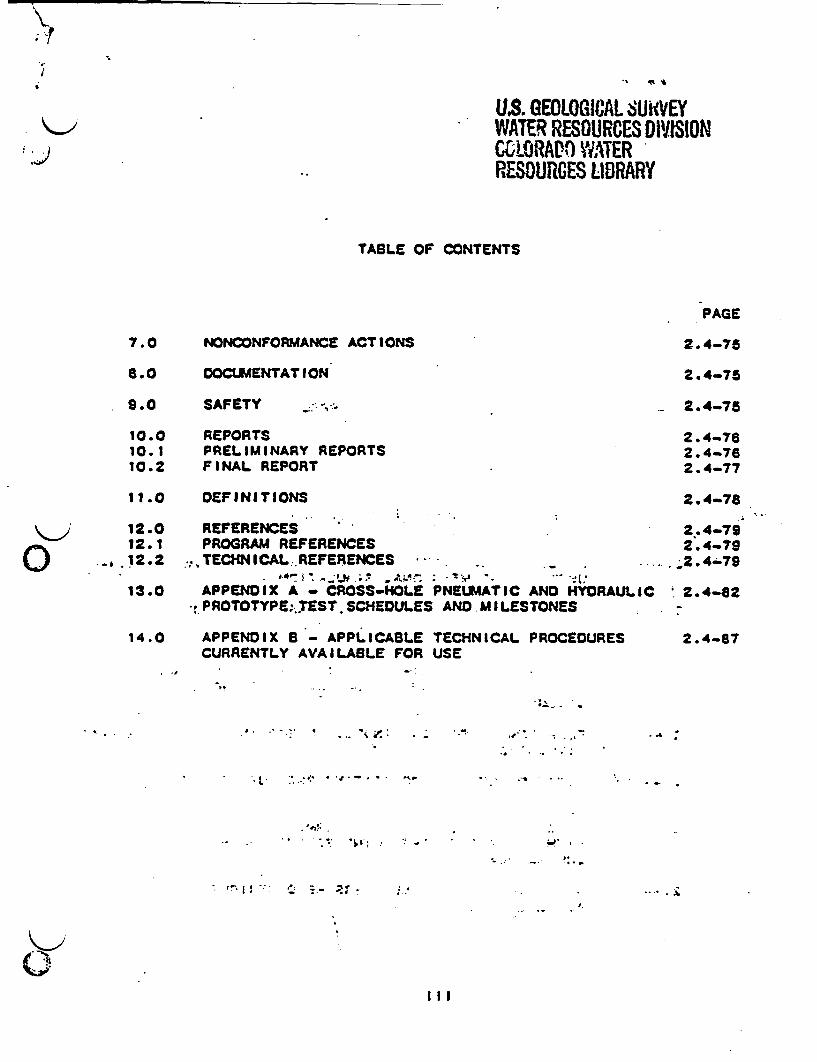
TABLE OF CONTENTS
7.0 NONCONFORMANCE ACTIONS
8.0 OOCUMENTATION
9.0 SAFETY
10.0 REPORTS10.1 PRELIMINARY REPORTS10.2 FINAL REPORT
11.0 DEFINITIONS
12.0 REFERENCES12.1 PROGRAM REFERENCES.12.2 ..,TECHNICAL.REFERENCES
13.0 APPENDIX A CROSS-HOLE PNEUMATIC AND HYDRAULIC*,PROTOTYPE; TEST.SCHEDULES AND MILESTONES
14.0 APPENDIX B- APPLICABLE TECHNICAL PROCEDURESCURRENTLY AVAILABLE FOR USE
, , .. , . j, . . _. , . _ ^~~~~~~~~~~~~~~~~~~~~~~~~~~~~~~~~~~~~~~~~~~.-..
PAGE
2.4-75
2.4-75
2.4-75
2.4-782.4-762.4-77
2.4-78.2 4
2.4-792.4-79
.;2.4-679
'.2.4-82
2.4-87
-. . .. - - -- . .. N
* .T -' * * - - ' .
.3 a Z- m,. ..
I II

LEST OF FIGURES (CONTINUED)
FIGURE PAGE
2.4-14 VERTICAL CROSS-SECTION THROUGH AXIS OF FLOW 2.4-63DOMAIN SHOWING MESH SIZE OF LARGE AND SMALLGRIDS AND LOCATION OF LINE SEGMENT AB
2.4-16 NUMERICALLY DERIVED PRESSURE DISTRIBUTIONS 2.4-64ALONG LINE SEGMENT AS
2.4-16 RELATIVE ERROR BETWEEN THE ANALYTICAL AND 2.4-65NUMERICALLY COMPUTED PRESSURES ALONG THELINE SEGMENT AB
2.4-17 FLOW CHART ILLUSTRATING SEQUENCE OF 2.4-68ACTIVITIES FOR THE CROSS-HOLE PNEUMATICAND HYDRAULIC PROTOTYPE TEST
2.4-18 DIAGRAM OF USGS DATA-ACQUISITION SYSTEM 2.4-71.
v

1.0 INTRODUCTION
Fluid Injection or withdrawl (production) field tests are
used to evaluate the In situ permeability of a geologIc formation
subjected to natural overburden and confining stresses. Labora-
tory testing of core Is another method commonly used to evaluate
formation permeability. Unfortunately, laboratory permeability
tests require subjecting the drlIl core to stress conditions
expected In the field In order-to accurately determine In situ
permeabliitles; this requires prior knowledge of the stress con-
ditlons Including stress directions and magnitudes. In addition.
the In situ permeability of fractured formations with high frac-
ture permeability would be roassly underestimated if laboratory
dx> test results on core, which usually. represent matrix permeabill-
ties, are used exclusively...- .* - -
Another alternative to measuring permeabililty directly. from
cores or in situ field tests Is to use a fracture model to
estimate permeability Indirectly (Van Golf-Racht. 1982; Rissler,
1978g; Snow. 1985). Fracture.v.data,.Including-fracture-orlenta-
tions, lengths. surface roughness., densities and, apertures, are
collected from drlII hole vIdoo . ealIpor. core and geophysIcal
logs and then used directly In a fracture model to compute forma-
tion permeability. This method Is somewhat restrictive because a
large fracture database Is required to characterize the forma-
tion and determine permeability; there Is a great deal of uncer-
tainty associated with measuring In situ fracture aperture
2.4-1

Analysis of the test results is dependent upon flow domain
boundary conditions, the type of fluid Injected Into the forma-
tion (I.e.. water or gas), the saturation state of the formation,
and the type of test conducted (e.g.. steady state, transient, or
Instantaneous Injection).
SIngle-hole fluid Injection or production flaid tests are
also commonly used to evaluate reservoir or aquifer parameters.
These tests, utilize only one active well and no observation
wells. Formation parameters are evaluated from data (flow rates,
pressures. and temperatures) collected from the single borehole.
Single-well tests are often preferred over multiple-well tests
because of the obvious cost-savings of drilling one hole over
drLliing multiPle holes. From a technical standpoint, however.
Xlngle-woeIl *tests cannot be -used to identify flow, domain. ., . , ., _ . . . . ~~~. /
boundaries or. InvestIgate anisotropy, In addition. cross-hole
testing has the advantage of generally Investigating more reser-
voir volume than a single-hole test (Earlougher. 1977).
Several exploratory shaft (ES) tests will utilize cross-hole
tests as shownlIn ;tabe 2.t4-b. 4h es ES tests are designed to
satisfy Oepartment of Energy (DOE). Nuclear Regulatory Comlassion
(NRC) and Environmental Protection Agency (EPA) regulatory
Issues, guidelines and technical posltions; and address Issues,
programs, and Information needs put forth In the Nevada Nuclear
Waste Storage Investigations (NNWSI) Project Issues Hierarchy.
The NNWSI hierarchy Issues or programs pertaining to the use of
cros3-hole tests In the ES are aiso listed In table 2.4-1, and
2.4-3

briefly described below along with a short description on how
cross-hole testing will be utIlized during each ES test. Note.
that only hierarchy Issues applIcable to cross-hole testing are
described; however. other Issues and Information needs not
addressed by cross-hole testing, but addressed by other aspects
of each ES test. may apply. The NNWSI hierarchy Issuesahereln-
after referenced In this test plan Is the version dated June 23.
1987. A detailed written description, purpose and rationale for
each ES test can be found In Part 11. Chapter 4.0 of the NNWSI
Exploratory Shaft Test Plan (ESTP).
1. RadIal boreholes test: Cross-hole water Injection
test I ng will be conducted across four hydroge logIc contacts..
F5~> These tests will be used to determine-whether the contacts act as
barriers to~flow al'owing perched water-conditions tb"fo;rm The
barriers- may be created- by capillary actIon 4(a fine-gralned
layer overlying a coarse-gralned layer) or by high percolation
rates causing pending an top of a low permeability layer.
Lateral flow of perched water along dipping contacts could result
In a preferential pathway for radlonuc6ldelmlgratIon and-- water
flow (Montazer and Wilson. 1984). -4&Sil `hlerarchy berformance
Issues 1.6.1 and 1.6.3 address the need for site Information and
design concepts to Identify the fastest paths of likely radio-
nuclIde travel and to calcuiate the ground-water travel time
along these paths.
2. "ccal' - 13t ti Cros ho toa will sed to
deotermlno e Dera i th to
2.4-6

effects. The excavation effects test addresses NNWSI hierarchy
Issue 1.7.2; determination that the subsurface conditions
encountered and the changes In those conditions during construc-
tion and waste emplacement operations, are within the limits
assumed In the licensing review.
5. Infiltration test: The ES Infiltration test Is designed
to study water flow through a fracture network and Imbibition of
water Into matrix blocks. Cross-hole gas Injection testing will
be used to characterize the fracture network (i.e., establish
continuity between boreholes, and determine fracture permeabill-
tIes and apertures) before and after the Introduction of water
Into the system. NNWSI hierarchy site program 1.13.2. descrip-
tion of the unsaturated zone hydrologic system at the site, also
O app I I es..AI rectIy to this test.
1'.1 PURPOSE
The purpose of this prototype test Is to develop a standard
cross-hole pneumatic and hydraulic test system that can be used
In the fo.lowing- ES hydrologic tests proposed. by the. U.S.
GeologIca Survey I). radlIa boreholes test; 2) Cal ico HIlIls
test: 3)ribulk permeability.testg 4) excavation effects testj and
5) ..infiltration test. The test system Is made up of several
components Including test hardware, software, technical proce-
dures, -data analyses,.:and field test conflguration.. Developing,
testIng,- ,. and refining each of these components during prototype
testing will Increase the likelihood that ES tests that utilize
2.4-7

(9 1.3 OBJECTIVES
The primary objective of the pneumatic and hydraulic cross-
hole prototype test Is to develop and/or refine field equipment
(hardware), software, technical procedures, analyses, and field
test configuration. A summary of specific objectives follows:
A. Design, fabricate and test a straddle packer system for
measuring In situ permeabilitles as small as 1.OE-17 m 2 (0.01
mdarcy) with a confidence level of 96% (2 standard deviations).
S. Develop a field test configuration for testing a hydro-
geologic contact In order to detect lateral flow along the
contact. Develop methods of analyzing cross-contact tests,
conduct cross-contact tests In G-tunnel, and prepare final proce-
dures for ES contact testing.
0 C. Develop a field test configuration for determining thes _ *; E .- . . ,..- ** _ - , *i *:.-n o.
permeability of a known fault, develop methods of analyzing fault,, ~~ .. ,, . . F.- *j
tests, conduct tests along a known fault In 6-tunnel, and prepare
final procedures for ES fault testing.
0. Develop analytical method of Interpreting cross-hole gas,, ; . _ , ..;-- ^ .^, . .. _, ,sftan .
Injection tests for determination of the 3-dimensional gas per--~~~~ , *. * , . .-..:...... ;
meabillty tensor, conduct crOss-hole anisotropy tests In G-tunnel* . .... .... a...-as~ * * * . , * * e. -
in support of the bulk permeability prototype test, and prepare
final procedures for ES testing.
.2.0 DESCRIPTION OF WORK - . - -
-Prototype cross-hole pneumatic and hydraulic testing con-
sists- of three activities Including 1) laboratory -testing,
2.4-9

LI -ItF z
69,
C , 4 .. ,
i : , . : - �
. - ;� . III
C4zS
A4 .
Ca
-UIn
0
.z
z04
.4
_ -- , - A;
I
9.
0/11�
5 * ,1K>

communications with Roger Zimmerman).
Upon leaving the flow regulating and monitoring manifold,
the fluid will flow through a flexible hose to the fluid Injec-
tion (withdrawl) line. The Injection line consists of a high-
pressure, 1.27 cm (O.S Inch) inside diameter, thick-walled, nylon
tube. The Injection line extends from the collar of the hole
through the packers to the test Interval underground. Fluid is
removed from or Injected into the test Interval and geologic
formation via the fluid Injection line.
A straddle packer system, consisting of at most four Inflat-
able packers placed In series and separated from one another by
spacer rods or well screens, will be placed In the active bore-
hole (Figure 2.4-2). Gas or water will be Injected Into the test
0 Interval Isolated between the second and third packers In the
Injection borehole. I In the case of gas withdrawal, gas will be
pumped from the test Interval using a vacuum pump. In both
- cases, the pressure response caused by Injection or pumping will
be monitored In the test hole and In the adjacent observation
borehole(s). The observation borehole(s) will also contain a
straddle-packer system thus. providing up to three observations
zones.-per hole where the response from fluid Injection can also
be monitored. In addition to the test Interval, the test bore-
hole contains two guard zones which straddle the test Interval.
These zones willbe used to monitor fluid leakage from the test
Interval past the packers straddling the test zone (past the
second or third packers In Figure 2.4-2). It should be noted
2.4-13

that the straddle-oacker system is constructed so that Individual
packers can be removed from the system thus making the string
shorter. A shorter string may be required if the desired test
Interval lies close to the collar or bottom of the hole, however,
It may result In the loss of one or more guard zones. Three
types of sensors will be utilized for monitoring in situ fluid
pressure, fluid temperature, and relative humidity In the guard
and test Intervals. They Include strain guage pressure
transducers for measuring absolute pressures, resistance temaera-
ture devices (RTOs) for measuring temperature and thermocouple
psychrometers for measuring relative humidity. Electrical leads
for the sensors will be routed through the packers using gas and
0 water tight connectors to the collar of the drill hole.---
Three hydrogeologlc conditions have been selected In G-.. I ,. , , * : . , . * "
Tunnel for the activities described In this prototype test
orogram: 1) cross-contact testing will be performed between the
welded unit and underlying transition unit both belonging to the
Grouse Canyon members 2) fault testing will be conducted along a_ _) . , . ;t5, *. .FrH-,. ,, ,,,
known fault Intersecting the zeolitized nonwelded Tunnel Bed 4
. units and 3) fracture/matrix permeability.testing will be per-
formed on Unit B. the densely welded unit of the Grouse Canyon
member. These activities simulate testing conditions to be en-
countered during the radial boreholes. Calico Hills, and bulk
permeability ES hydrologic tests, respectively; and are described
In greater detail below. These tests will be used to evaluate
ils h+ the performance of the experimental equIpment described above and
2.4-15

lying layer.
Lateral flow may occur along a dipping hydrogeologic contact
when a capillary barrier Is present or when a coarse-gralned
layer overlies a fine-grained layer and the flow rate Is
relatively high creating perched water conditions. Lateral flow
conditions may exist at Yucca Mountain or could exist If climatic
conditions change. Lateral flow along a contact to a fault, such
as the Ghost Dance fault, could result In a Preferential pathway
for water and contaminant migration.
Cross-contact testing In G-tunnel will allow examination of
the concept of capillary barriers and lateral flow along contacts
prior to ES testing. The test configuration and local geologic
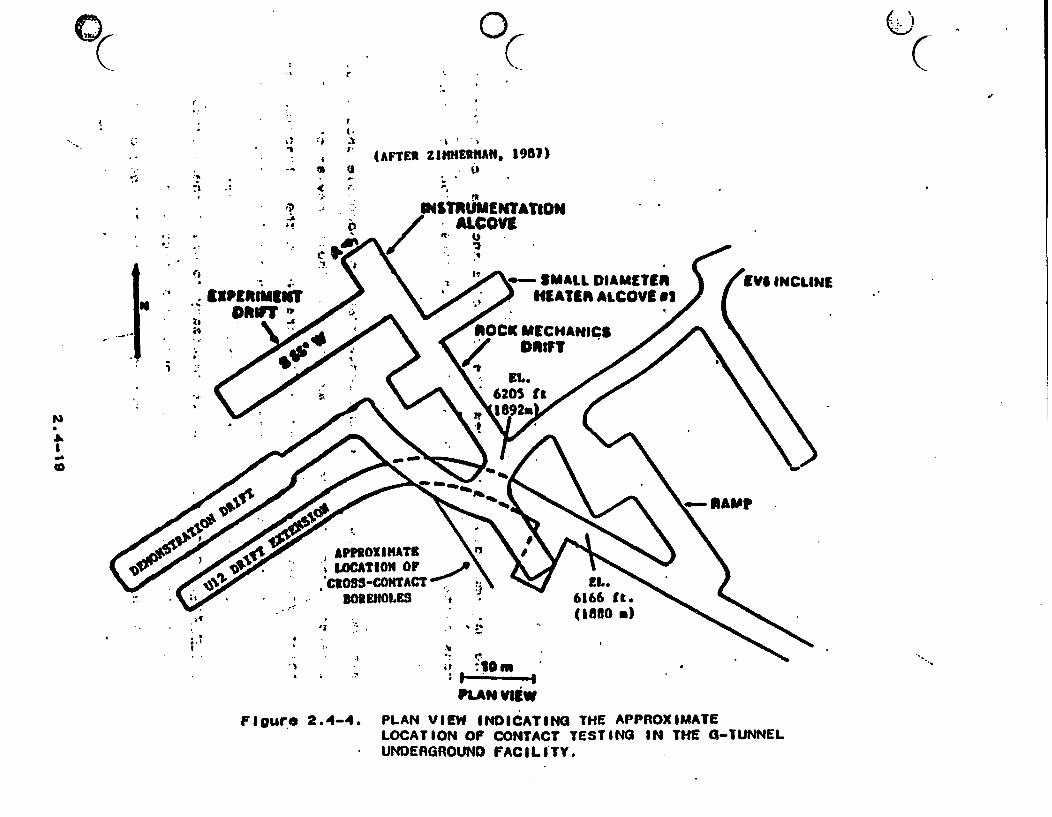
X> conditions at G-tunnel are Illustrated In Figure 2.4-3 and the
0. location of the proposed test is shown In Figure 2.4-4. Similar
conditions, a welded unit overlying a rubble zone and partially
welded to nonwelded zeolitized tuff, are expected to exist In the
ES at the contact between the Topopah Springs welded unit and
Calico Hills nonwelded unit. The contrast In pore size between
Unit *B (the densely welded, vitrified, fractured unit of the
Grouse Canyon Member) and underlying rubble zone. of Unit A
(transition zone between -Unit 8 and nonwelded funnel Bed 5),
should provide an opportunity to test the concept of capillary
barriers and lateral flow caused..by-these ponditions. The con-
trast In pore size between the coarse-grained-rubble zone (top of
Unit A, Grouse Canyon member) and underlying fine-grained,
partially welded tuff (middle of unit A) should provide an opPor-
2.4-17
.
r
0
I(T I N.
(AFTER ZI22HAN, 1957)I:i
L I
(
t f
'i
* t -
* I-- ;a i
I ,
A.
. _.0
;.
f7 .: ::
N
S6-a
S
.. .1'S :10.
a -lo
FIgure 2.4-4.
tA" VliW
PLAN VIEW INDICATING THE APPROXIMATELOCATION OF CONTACT TESTING IN THE 0-TUNNELUNDERGROUND FACILITY.
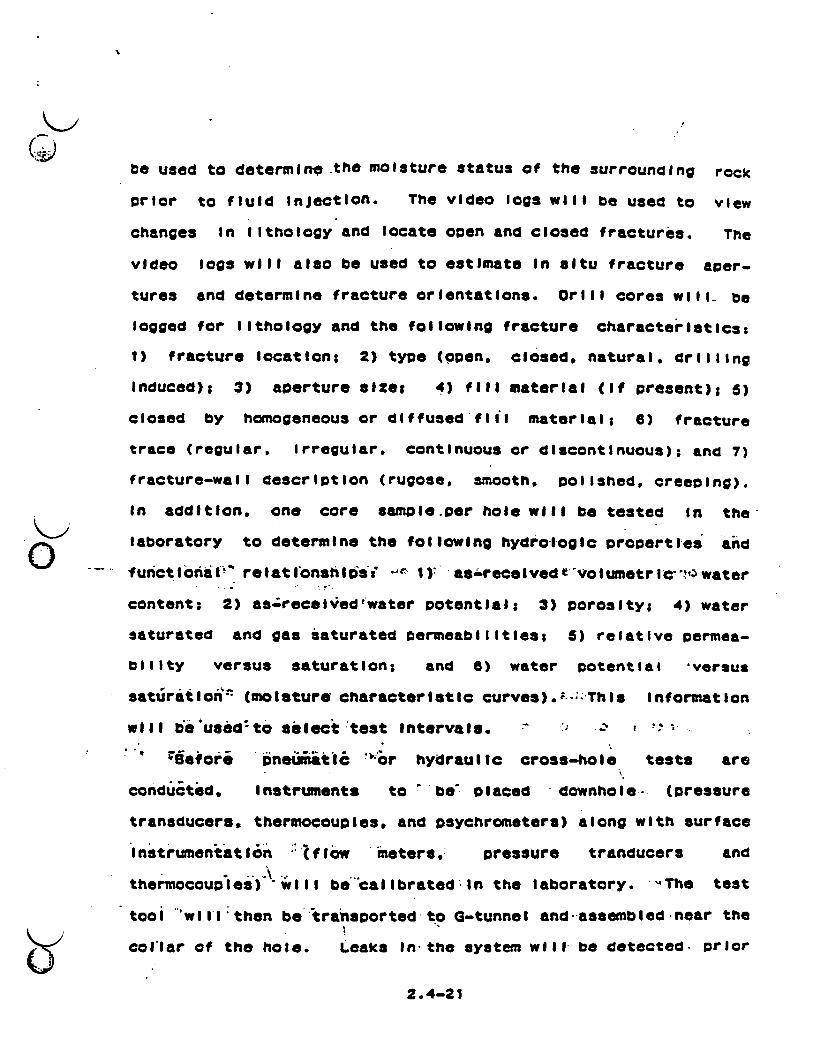
be used to determnn the moisture status of the surrounding rock
prlor to fluid Injection. The video logs will be used to view
changes In lithology and locate oPen and closed fractures. The
video logs will also be used to estimate In situ fracture aoer-
tures and determine fracture orientatIons. Drill cores will, be
logged for tlthology and the following fracture characteristicst
1) fracture location: 2) type (opon. closed, natural, drilling
Induced); 3) aperture size2 4) fill material (If present); 5)
closed by homogeneous or diffused'flll material; 6) fracture
trace (regular, irregular, continuous or discontinuous); and 7)
fracture-wall descrlptlon (rugose, smooth, polished, creeping).
In addition, one core sampoieoer hole will be tested In the
laboratory to determine the following hydrologic properties and
f'u bctiontV relatiaonshipsi J 1)' as-received tVoIumetric'"r water
content; 2) anzrecevoediwater potential; 3) porosity; 4) water
saturated and gas saturated permeabilltless 5) relative poermea-
billity versus saturation; and 8) water potential versus
saturation' (moisture characteristic cur .- This information
wil 1 bused' to select test Intervals. ; e
! * W8efore pneumatI ";Or hydraulic cross-hole tests are
conducted. Instruments to t-be placed downhole- (pressure
transducers, thermocouples, and psychrometers) along with surface
Instrumentat ion Itflow meters, pressure tranducers and
thermocouples) will be callbratediln the laboratory. "The test
tooi w In then be transported to Q-tunnel and -assembled near the
collar of the hote. Leaks In- the system will be detected- prior
2.4-21
Observed. The packers will then be reinflated and the observa-
tion zones monitored for an Increase In pressure. In the event
that no pressure response Is observed, an observation zone wuil
be positioned below and slightly down dip from the overlying
injection Interval. The gas will be shut-off and the Injection
tool pulled from'the hole so the Psychrometers can be removed
from the system prior to water Injection. The pyschrometers will
also be removed from- the observation tool If a pneumatic
connection was found.
The second stage of the second test series begins by placing
the tool(a) back In the borehole($), Inflating the packers and
monitoring any Increase In pressure due to Previous stress
periods (gas Injection episodes). If the pressure begins to
climb the packers will be deflated and the hole will stand open
until atmospheric equllibrium Is reached. Again. the holes will
be sealed and water Injection will proceed. Water, containing a
tracer, will be Injected into the upper hole and the pressure
response will be monitored In both the upper and lower boreholes., . - : ................,*..-.*,*.c.f:c. . .: S. - .- .-
The reason for drilling the holes Up dip parallel to the direc-
tion of dip now becomes apparent. Flow from the Injection.~ ~ r * r ; W * >t: * ? ~ " t ;
borehole to the rubble zone and along the contact Is essentially
a 3-dimensional problem; however, there are only two observation* - . - . ;_..
points, the Injection and observation boreholes, which only.. .. .-.F ~S ... ,,,*,. .
provide a 2-dImenslonal look at the 3-dimensional problem.
.Therefore, the third observation point becomes the drift Itself.
Water flowing down dip from the Injection borehole should Inter-
2.4-23

4(3Or
I.
II
.f;
� I
.1
v3. 4.
'.3
N
INJECTION BOREHIOLE
-.7
OBSERVATION BOREHfOLE
I
FAULTPLANE
Figure 2.4-6... ;
BOREHOLE CONFIGURATION FOR TESTIS A FAULT.I e

Za~~~~~~~~~~ * 11
* ) f .*
(AFTER ZINEISNAN, 1987)
SThUW1ENTAT8OldALCOVtE
; \SMALL DIAMETIA gVS INCLINE
$s tCOOT"l E Cg*| (
N a.~~~~~~~~~~~~~~~L
* ~~~~~~~~~~~~259
FAULT
/- 20 4 2~~~~o .T OF FA ULTy\
,, ,- # Z \ );Y ' UrnlPLAN VIEW
figure 2.4-6. PLAN VIEW INDICATING THE APPROXIMATELOCATION Of FAULT TESTING IN 0-TUNNELUNDERGROUND FACILITY.

between gas-phase end IlquldpohaeO permeabilItles measured for
the same volume of rock can be obtaIned.
2.1.3 Fracture/Matrix Testing
This work Is Intended to support croes-hole testing needs of
the Bulk Permeability prototype test. This section will describe
In general terms why cross-hole testing between boreholes la
Important. For a detailed description of why and how cross-hole
testing will be utilized In the BUIk Permeabilt Iy prototype test.
the reader should refer to the Bulk Permeability Oetalled Test
Plan.
Cross-hole tests are used to determine the radius of
Influence of a single-hole test. The hydrologic parameters
measured using a cross-hole test are representative of a much__i , !P; r . 5;- 7:. - :- 'I: :eti ; - .- '.s .1 _. -A Tie
larger volume of rock than Is sampled during a single-hole test.
Another very Important feature of this method to It allows one to
evaluate the concept of representing a fractured rock mass as an
anlaotropic porous medium (Hsleh and others. 19868 Snow. 1986).
Cross-hole tests can be used to Identify features such as faults
and large conducting fractures which otherwise might go
undetected using a single-hole test (Hsieh and Neuman, 1985).
Cross-hole testing will be conducted between three boreholes
In GTUF during the Bulk Permeability prototype test to
Investigate the conceopt of replacing a fractured rock medium by: . r . -l,
an equivalent anisotropic porous medIum. Three holes drilled
parallel to the axis of the Bulk Permeability drIft will be
2.4-29

2.2 EXPERIMENT PARAMETERS
2.2.1 Control Parameters
The control system for this prototype test consists of a
low-pressure/flow regulator Used to regulate the flow of gas from
a high pressure gas cylinder. in addition. the flew regulating
and monitoring system described In section 2.1 will be used to
control the rate of flow. The pressure transducer located In the
Injection zone will be used to trigger the closure of a solenoid
valve on the fluid Injection line when pressure-pulse testing
(Instead of constant flow testing) Is desired.
Coarse-pressure/flow adjustments are to be set manually
using a pressure regulator located on the high pressure gas
cylinder. A flow control needle valve, located upstream from the
flow motors,'-'lill aIsolbe operated manuallyto provide fIne flow
control. The output from the flow meters will allow the operator
to monitor and adjust the flow rate when desired. The control
parameter Is flow rate.
Pressure-pulsoe testing may, be conducted as part.-of the
- 4 vevral litestliig- programi.'- A :pressure-pulse test- consists of
*~+ .njectIna' situa! (puts.) ofgas!lnto the--test Interval as quickly
as possible and then monitoring the decay in pressure with time.
In this case, a solenoid valve located near the Injection
-; interval"'would r be opened and closed by- the data acquisition
system. The valve would open when prompted by the operator and
ccloseo when the pressure- In the test Interval reached a user
specl^f led lImit. The pressure transducer located In the test
2.4-31
time in hours. minutes. and seconds.
voltages are measured for two purposes. First most,
Instruments must be energized In order to work. Previous G-
Tunnel testing has shown that It tS Important to monitor and
record excitation voltages so that strange output behavior from
sensors can be compared-with-spurlous. excitation voltages (R.
Zivmermann. Sandia National Laboratories. 1987 0-Tunnel Facility
tour). It Is also important to store output voltages from
sensors so that post-test recallbrations can be used to re-
evaluate the data If necessary. Also, these measurements provide
backups to converted measurements In case algorithms need to be
chocked and provide a vital backup In case the converted data are
not properly recorded In the DAS.
.... ~~ 'kO : r. ^;-.: ,. ., -. ......... ) uo. t* t . ; : r-gJa
2.3 OPERATIONAL AND MEASUREMENT EQUIPMENT .
2.3.1 Operational Eculpment
(a) Inflatable packers - Pneumatic type Inflatable packers
are to be used In the straddle-packer tool. Maximum recovivended
packer Inflatlofl'pressures rangeofrom 1.7 to-2.0 WPa.-
- Cb) Low-pressure flow-regulators - A low pressure regulator
(pressures -less than 1.0 MPa)'willbe used-as a.coarse flow rate
regulator.
(c) Pressure ouls- cylinder -'This cylinder will-be located
down hole near 'the- test interval. oeIt will be ,,%used;:durlng
pressure-pulse testing asetheosource-for the slug or pulseoof gas
Injected Into the tesitlnterval.- It-has a maximum, rating Of
2.4-33

Pressures..
(C) Maximum masa-flow rates for Cases - Equipment Is
currently designed to handle flow rates of 60,000 SCCM (Standard
Cubic Centimeters per Minute).
(d) Maximum volumetric flow rates of water - May exceed 40
ilterasminute depending upon test-lnterval length and-nuwter of
open fractures Intersecting the Interval.
(6) Maximum relative humidity - High humidities are only a
problem Insofar an the proper operation of the Oata Acquisition
System (OAS) Is concerned.
2.3.2.2 Sensors Required
(a) Temperature Resistance temperature detector (RTOs)
Or.. wiii be used to measure fluid temperature during testing. These
devices operate on the simple principle that a change in- - , . : ; . 4 X g. . :. t.
electrical resistance of a wire Is a function of temperature.
RTOs are more accurate than thermocouples (+/-0.3' C versus .1-
1.0 * C. respectively) but are also somewhat fragile. Therefore.
Type-T Copper-Constantan thermocouples will also be considered.
(b) Pressure Pressure transducers are needed to operatep.
at ambient temperatures (approx. 20 * C) up to pressures of 0.7~~~~. ,*_*,* *-
MP& In the test Interval. 2.0 MPa for monitoring packer
Inflation, and 20.7 MPa for monitoring filling of the pressureX? - * - -*
pulse cylinder. AccuracIes are dependent upon the operating
range of the transducer, but readings will not vary from the true
value by more than +/0 0.25 % of full scale.
2.4-38

Assurance (QA) Level III, calibration requirements listed In
Chapter 12 of the Quality Assurance Manual (NNWSI-USGS-QMP-12.01)
do not apply. Guidelines listed In Chapter 12 only apply to QA
Level I and 11 activities. Instead, accepted industry standards
or procedures will be adopted and used to calibrate prototype
test Instrumentation.
2.4 FIELD OPERATIONS
Field preparations for each experiment discussed In section
2.1 are described below.
(a) Four diamond-drilled holes of specified depths,
locations, and orientations are required for cross-hole testing
(REECO). The dimensions of the holes have been-specified as HQ
and the length of the contact-test holes are 60 feet. The lehgth
of the ;fault-test holes ls dependent-upon the location of -the
driling alcove. Holes-wlllvbe located and oriented by the -,Pl'
and should be drilled to within +/- 0.5 degrees of the specified
directions. Three additional holes drilled parallel to the
proposed bulk.Permeab! !ty room will also be cross-hole tested.
Funding and drillIng-speelficatIons for these holes will -come
from the bulk permeability prototype-test. . -
* (b) Water. must be-avaliable at the test locatIons for
Injection Into the formation.
(c) Hlgh. pressuregas cyllnders containing nitrogen. gas
should be located at the test holes during cross-hole testing.
They shall be secured so that accidental puncture or valve stem
2.4-37

2.6.2 Analyses
Scoping caluculations and data analyses are two very
Important components of this prototype test. Scoping
calculations will be used to design or select equlpment, design
test configurations, and predict test performance prior to
conducting the field test. Data analyses consist of Interpreting
the test data after It has been collected. Analytical and
numerical techniques will be developed and used In scopIng and
data analysis work. These techniques will also be directly
applicable to ES hydrologic tests that utilize cross-hole
pneumatic and hydraulic testing.
2.5.2.1 Scoping Calculations
Scoping simulations are being performed to determine the
maximum distance the upper borehole could lie above the densely
welded unit B/rubble zone contact (Figure 2.4-3) so that lateral
flow conditions will develop within 6 to 12 months after start of
the water Injection cross-contact test. In addition, numerical
simulations are being used to predict the Injection flow rates
and pressures required to establish the capillary barrier.
Preliminary results from 1-dimensional simulations using the. , . ? L ' -
finite element, unsaturated flow code UNSAT2 (Davis and Neuman.
1983), are described below. The Investigators would like to
gratefully acknowledge Mr. Edward Kwickils efforts, which
Included conducting the capillary barrier simulations and
preparing the text provided herewith.
2.4-39

.-- K
Iba
IIoK>0
-10 -4 .4
UARIoCrfiL Wo TOfr + MB
Figure 2.4-7. EFFECTIVE CONDUCTIV1TY/PRESSURE HEAD CURVESUSED IN I-DIMENSIONAL SIMULATION.
k If -Al,,/k.0,17
Z .4-41

than the saturated conductivity of the upper unit, thereby
eliminating any chance of the capillary barrier forming; 2) when
the effective conductivity In the lower layer becomes higher than
the effective- conductivity In the upper layer, the capii-ary
barrier will have failed as a mechanism for retarding downward
f Iow and' Inducing I ateraP flowtva rong an 4 Interface. Therefoi'&&ne-
will want to keep the pressure heads along the-Interface viiow
the across over point on the oeffective- conductivity-pres3Jre
head curves. 3) Because the test-must be conducted within a time
frame of 6 to 12 months, the wetting front must reach the contact
from the borehole (36 cm In this case), the capillary barrier
must be established, and the formations response to the slowing
of the wetting front must be observed at the injection borehoie.-
-*The; thIrd constraInt 'i I- :Vrobab'f not 'be con'istent' WIth- ithe
s -Second constraint.-' :-:- .; i. -
In, the 1-dimensional sImulatIons the prescribed pressure
head at the upper boundary surface was Increased from 0.0 to '1.0
z~tt 10.0 meters In separate simulations. This was done (nWorder
s-to rdetermIne; both the- Ieth`W f"gt imwe nrequired for ?the wo g
--front to dropgajte; fefnothe `upp'r srface to the t'nief ace-uncer
dif ferent head conditIon-,, as well as 'how the value chosen as the
prescribed pressure affected the length of time the capliliry
*barrIer maIntaIned Its effectiveneis in retarding downward flow.
.-For the materials used In these sImuruatlons, 'the time at which
.the caplIlary barrier ,loses Its effectivenesslIs the tIm eat
which the matric potential at the node along the Interface
2.4-43

achieves- a value greater than -1.57 moters. The changea,,. In
matric potential versus time are shown for the Interface nodes In
Figure 2.4-8 for each of the three cases.- Note. the capillary
barrier 1i sustained for shorter periods of time the larger the
pressure head becomes at the Injection boundary. Ths,. Is
evidenced- by the- tiwmItntakes -the Pressur-uk head-vaI. ues.; ktofV b
from their Initial values of -11.38 moters to the cross overo
point of -1.57 meters-in Figure 2.4-8. . -. -. _ -,
In 1-dimenslonal simulations It- <-seems- pos3blt.e-Ato
demonstrate the presence of a capillary barrIor by monitorIng. how
the surface-flux rate decreases with time. Figure 2.4-9 shows
the decrease In the flux at one of tho-twonodes along the upper
boundary (the locatlon of the borehole) for-two cases. -ln the
fIrst case tethe colul -cons3tstsntiroty _fi~w-Ldechtuff - Inuthoee ~~eiio- ,- >
second case. the tuff overlies the rubble zone.. A-The-a-;.1nterface
lles at a depth of 35.0 cm (-1. ft.). --For, the homogeneous
materlIaI the flux declIned smoothly. For-the two layer case.
the Initi 8al decliIno In flux follows the qveyo for&-the.homogoneou3
case: however., l4rom approximatel y4 304 days to,3 80,days.:1nto the
s1MUlatloq.:,.thero Is a,.sharp de*A-Ine,.nrtho h Ur 4p -1x7j ter
180 da s the .flux appears to ha6 I eveIaed t9ff. at.e a, .constant
value. - ; - - ' -
Under- a constant positive pressuro the surface,,J ux. ! InC a
homogeneous mater IaLtgradually declinea and approaches .' a' value
equal to the hydraulic conductlyvtyeof the maatrIaI.as ~tho total
O head gradIent approaches unity, that Is ,-.. the gradIent of the
2.4-44

PRESSURE HEA CHAGE WiHTMENAI. PMI DW CK eoW
M2a
-4a
104
-11
-t2
+ o
. +
a,4
a
a CM a b"Wov~~~~~~~~~~~~~~~~~~~~.
+ 1.0onbmq-
* 10aa w"
0, ~. + .~4s
.. _ . ... 1. -... - .,
° +0a
assommost",~~~~~~~
C ' -04.~.- s-+.; . Az>
. _ _ - -.. -. .. ... .... . ...... . - _ ,\
, J
0 tOO)8 2aO
zro a
8 I0
. :.. 4 '.. . . .
. o.; - - . e. / .. - ,. .ji: - " '. " , -,-. '; V- ~.. '-_
'A.. .... _
Figure 2.4-8. CHANGE IN MATRIC POTENTIAL VERSUS TIME FORrTHE O.O M, 1.0 M. AND tO.O M PRESSURE HEAOINJECSION SIMWULATIONS.
2.4-46
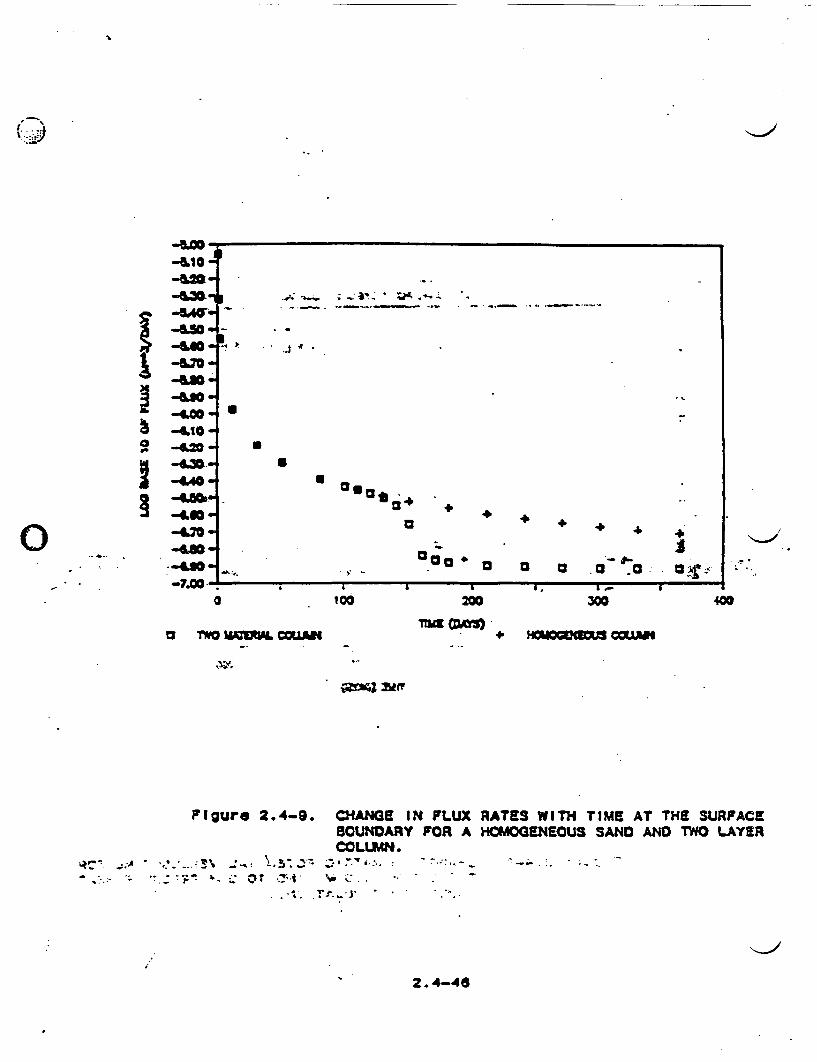
-am."-GAOV
V- .ama
b -4.10 -
I,
I
I-
II >j
a
a
a
acoolb .
Cs -64
00t.a a .a I0.a r,
a6
too aa.r= a,"
I.-a
300a
400
U rhO V~O COUAI
tarx4 31ffl
Figure 2.4-9.
4_- .. -: , . .~ -. -,A .-;-~~~ : .:, ;- 0 T Pi z-
CHANGE IN FLUX RATES WITH TIME AT THE SURFACEBOUNDARY FOR A HOMOGENEOUS SAND AND TWO LAYERCOLUMN.
.In 6i-", .- ~:,- -- - .- - .. -
,vi : . . - - - - a-. , _. . ** .. ,. ;.
. . 4. vp� -J, , , ,
2.4-46

zi) matric potential becomes zero. In the two layer case the lower
material Is unable to transmit water away from the Interface--as
fast as It can be delivered to the Interface when the Interface
matric potential In less than the Ocross over'potentlal. Hence,
the moisture content and matric potential In the upper layer
Increase at-; a rate greiter'1thatn that- wtchW; occurs wHiMUtheh
material Is homogeneous. This causes the total gradient neal t ithe
upper surface to approach- unity much quicker than In"'Iffhe
homogeneous-case resulting In a reduced flux rate-as-indicat-'in
FIgure 2.4-9. SImilar results were obtained for the cases In
which the pressure was maintained at 0.0 and 10.0 meters at the
upper nodes.
Based on the 1-dimenslonal simulations presented above," It
--appears' tuiatb' a bo6reho lo locaited'approxtimatily 36 cm& asbovd 'Ehe
contact' In QZTunne I-and a constant prisurez transaeni'test
analysis' could be used to characterize a hydrogeologic contact.
It remains to be-demonstrated, however, that a similar decline In
fluxes-can becobsetved when flow- s2Z or 3-dimensfiIi I In''whfch
"'case 'a14ir 'rMio fwzabovf the -I nterfac; and awiy -rom ttio' Inj "tfaon
pointliV0oasiblbeo! -' 2-diminslongiltsimuitationsw Il f i t' ln o-au ed
In futuro scopind work'-ln aniiattempt to address this-concrn and
to determine the range of flow'rates that-might be encountered-in
'the *fleld.E:& Thist- concludes :the sco inon work performed on
capiIiary'barrlers to dati' I'Jbas fiow*-sco-png - simulatlons
conducted thus far are described ln detall'Lbelow.'' -7r
Another'numerical model, DGAS2, coded and validated by R.W.
2.4-47

Healy of tho USGS centrali region research branch. Is being used
for gas. flow simulations. DGAS2 1s an undocumented, block cen-
tered, finite., difference, linear and axisyMMetric flow code
developed especIally For 3lmulatdng isothermal gas flow through
porous- medIa. It Is beIng. used for scoping and data analysis
..purposes f °h ,thls.-.UamJ .v Wft1H~pr qtvItypa testInj& activity oVy.
Tho code's use, In support of QK-ievet- I and II NNWS.I-USGS worlk 1s
strictly prohlbitad..by,Nt4VSI-USGS.-MP-2a.03,, Rev 0..; Inn.theeO t
that. It becomes desireableoto usteoGAS2. durulng, ES hydrologIc
testing, the code will be documented and verified according .to
NNWSI-USGS-CMP-3.03. Rev 0.
In any event,, OGAS2was~verifled by comparingOGAS2 output.
results to, experimental. and numer leal results obtained. frof -a-
,4tudy(,presronted.IQ a, iasscas.paper byaB-uce snd othersI4a^.* r
Bruce. and others (19J3). developed a finite difference, lsothermal
gas flow code. They compared theIr numerical solutions with the
results from a ,laboratory study (gas depIetIon In a lInear
.. system) tSPecIf iLcaly; -des&-grnqd to ,veartfycthemnodeI..- ,Theyikfound-
lthat. ;theo dtiffroncSaotweeoa ,.;tho numerica 1 - so.1 u,,t ion And
ex~pSrLontAllytdotorm neddata as Lwl th Ihe gcoxper lmntaaI
_,orror^ ,,..Ltkewlsemat.chtp.Stween.rtheOnumerlcas.-3olutlon from
OQA52, and Bruceoandnother's(.iS'3) experlmentai data- was also
vo ~oodz kAIto , 2rpGA sojqut tonafpt,_radlat gas.f lo-w;were"lIn
very good fgeement,,jwlvth. ,Anumer ical solutions presented;^ln
graphical form In ,BruceLand othecs(1953) . i -.
Preliminary-scoping. calculations were performed using OGAS2.
2.4-48
The objective of the simulation was to determine the location of
the 0 over-pressure Isobar (radius of Influence) with time given
an Injection Interval of 61 cm (2 ft.). InjectIon pressure of 304
kPa absolute (-203 kPa over-pressure), and formation gas
permeability and porosity of 6.OE-16 m 2 and 0.17, respectively.
The permeabIlIIty and porosity values speclfled above are basedson
2a range of values (t.lE-13 to 6.9E-19 m2 and 0.34 to 0.09)
determined from laboratory ...analyses of Topapah Sprlngs-4.. _ _. , ; c
unfractured drill core. Gas permeabillty values (1.OE-17 to
5.OE-17 m ) for the Grouse Canyon densely welded matrix also lie
In this range. The Grouse Canyon permeability values were not
known by the Investigators during the time period In which these
simulations were conducted.
ODue to symmetrygE~onIy.CtheVupper halfriof -the test Interval
was simulated as shown In Flure 2.4-10. The 3.7 meter wide by
2.5 meter high axisymmetric flow domaIn was simulated using a
3600 nodal point mesh. Gas was Injected Into the flow domain via
10 constant pressure nodes evenly spaced over a 30.6 cm (1 foot)
Interval located on-the axis of the radial domain. Figure 2.4-11
Indicates the horizontal locatlon (radial direction only) of the
0 over-pressure Isobar with time as the pressure front propagates
away from the Injection point. The pressure front reached the
outer boundary of the reservoir. li: the horizontal direction (3.7
meters) In 1 day. This Indicates that the proposed gas Injection
tests can be conducted In a reasonable time frame given the
conditions described above and test configurations presented In
2.4-49
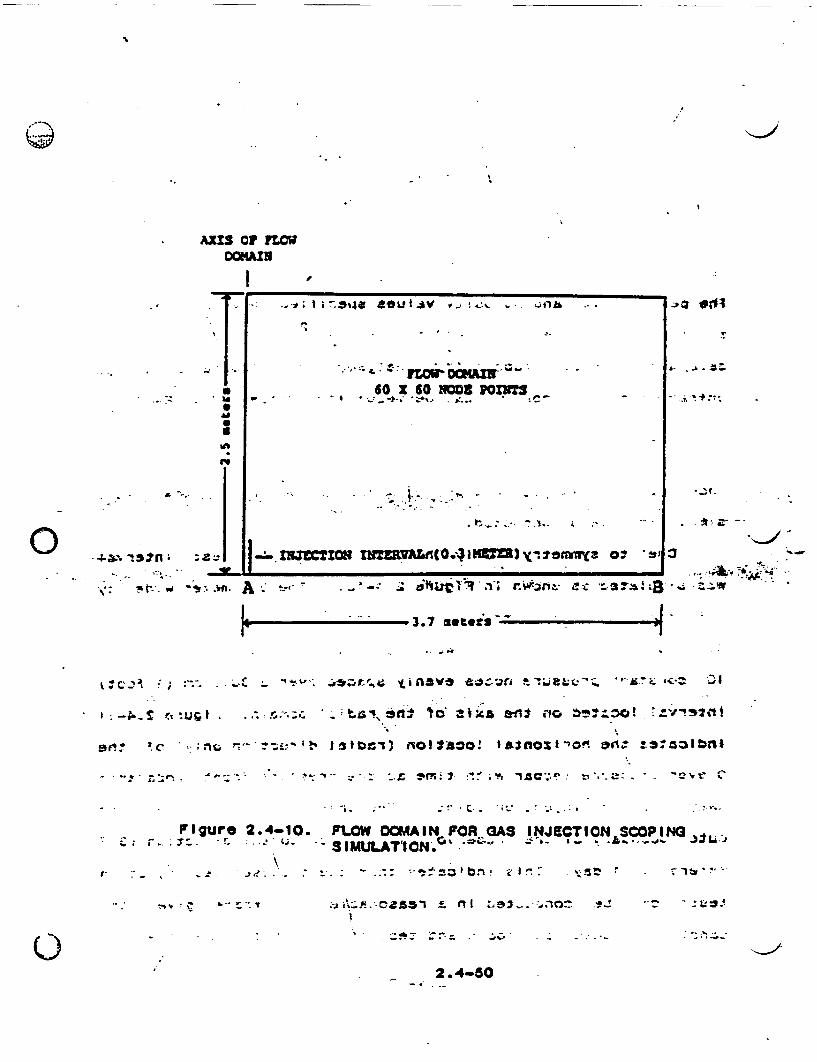
-
AXSS or newDXS0fOWNOOIMN
-
a
a
i4.
I-
I . .,...; t n-St>J SOU t.A " ; '. :. %. - J -nl
. I , :.
'0 ' 60 , - '- i,. C
. -1, *~ +- *. _\ L, , - * , _ - ..i;
,.. ;I. . II., , .. -.. . - .
. t._-: -- -. I,. ; :' .
.zf.
.
-. 4 - :.;. S r. . id I-sI
-*° Ill -|< > 3 :* J.
wa.A~ . -~ .~ _ Z1|-Yq -.z r~io -*rt+$uB t -
I.- 3.7 et.?s~~ .. A-w-..
~~ .ui.. ~ -~ ~ ca~seurc ::Q!'vt
Figure 2.4-10. FLOW DOMAIN FOR GAS INJECTION SCOPING
_ , , _* _,,- , , , . _ . .*::..
a 2.4-80

0..a
.LOCATION OF 0. PRESSURE ISOBAR .WrTH TIME..,,of_ 0'clcwAw* .ftCW -)4 @ - . - ' .o A' 3 s ' .-A /*
I
I
-t.
0.7
I CA
... I 0. _0
Li
1. I-, _.�,. . .V
.Z.. .
? - 'm �?
.. - . .. - - -f 'i. . i
C4 01 12 1A 2 24 21
.e - .
<'~~~~~~~P! .' AI .:01-We . aae ':o y4., d A
3.2 3
: . :,1AV
M.?' . .; e ; ' . . .- * . -, ;..
-Figure 2.4-11. ..LOCATION.OF THE PROPAGATING PRESSURE FRONT-s -^ '. WITH TIME.
*: ^ . . - -, ; - . -
2.4-61

sectIon 2.0.
2.5.2.2 Data Analyses
Analysis of test data Is complicated b; several factors
Including complex boundary conditions such as layered media,
unsaturated fluld flow (two phase flow), transient gas flow, and
fracture-matrix interactons. in each caose aisted above, the
nonlinear form of the governing partial differential equations
(POEs) and complex boundary conditions make these" equations
extremely difficult or Impossible to solve analytically. At
present, few analytical solutions to unsaturated flow POEs exist.
Oftentimes, simplifying assumptions are made In order to solve
these equations (Hillel. 1971) which can result In transforming
them Into problems which may no longer represent true flow
., conditions.-- The same 1s true for the-treatment of-transient gas
flow. Due to the nonlinear form of the gas flow POE, It has not
been possible to derive explicit solutions for general boundary
and initlal conditlons. However, Steady_ state analytical
o 1soutIons can be readiy*-deroVved for gas flow problems having
various flow domain boundary configuratlons (see Muskat, 1937 for
greater detail on this subject). Approximate'. methods of
transient gas flow analysis have also been presented by several
authors Including Muskat (1937), Katz and others (1959). Rowen
* rand Clegg~( 962). @AIl-7iussa Iny- and others (1968)'. and Earloujher
(1977). An example of developmental work underway at the USGS for
analyzing cross-hole gas Injectlon tests using an approximate
2.4-52

K>method of analysis Is described below. Numerical models such as
TOUGH (Pruess, 1985). which can handle water. water vapor, and
gas.transport, or UNSAT2 (Davis and Neuman, 1983), whIh Is an
unsaturated flow model, will also be utilized extensively for
data analyses.
Hsleh and Neuman (1985), and Hsleh and others (1985)
developed a field method for determining the 3-dimensionalA, - Z1. ., . I'- 1 . --
hydraulic conductivity tensor and specific storage of an*:^-. ; -.-. s~w -
anisotropic porous or fractured medium. Their method utilizes
cross-hole testing, that Is, Injecting water Into (or withdrawing
fluid from) packed-off sectIons of the active borehole and
monitoring the transient response In nearby observation
borehole3. An Important feature of their method Is It allows the
. Investigator to determine the anisotropic nature of the medium
without prior knowledge of. principal, hydraulic conductivity
directions or magnitudes. Virtually all of the previously
proposed methods required that one or more principal directions
tr.: be known, pr lor ,to thefictest- (Papadopu losP*t9865 p Hantush, 196BS and
Al Snow,9 6):.: C Pz It a as $Z ,I - i - r . ' '
'^ '¢~ In W'Js ehl and' Neumaf.?"198ST*. theya-present-. theoretical
expresslons -describrng translentVfandtsteady state head response
In monitoring Intervalszof arbltrary'lengths and- orientations,
r caused by-cdhstant.rateilnJectfon-nto (ortwithdrawl from) test
Intervals -having simi!'ar-or-different lengths and orientations.
Hsieh and-Neuman's (t986) 'theoreticai development begins with the
e&+ continuity equation for-in-incompressible fluld flowing through a
2.4-53

fractured. rock mass treated as an equlivaent homogeneous.
anlsotropic porous medium. The governing POS i3
z Vh ,Sa <Zt- -. J~~S a ;^, it:
- . w , s i * - 51
where V* and 7 are the divergence and gradient operators.
respectively; K is the hydraulic conductivity tonsors sr is
specific storage: t is time; and h is hydraulic head. Hsieh and
Neuman solve this ecuation for the Point source/point observation
case. then express the analytical solution In terms of the
directional hydraulic conductivity as follows:
* ~ ~~~~~~ CSBdctET
* - : ; **. z : ., - * .1. . .x
eis ;where.4;aunisethetheasdncre so~t. th~observat long Olltw.¢Q 4$ the
volumetric injectlon rate at tne point sourceviKd..4.ae the
:soDJdlrectionahkhydrau~l@ conductivtty..e r rIe the~tZdius,' rru the
* ~-point^' sources to.-thtnor servatlon polnt~- erf~ct )..la...- the
* complementary error,-function (see Car~slaw~qn4 Joaegr, 1959g for a
-- , thoroughw~reat I seon the 'camp temntafyerJ~rs~unctlion) .*s,&O is1
e**. the-o determinant-of!K. -r'A'typevcur~e was peoduCod *°, tiaotf the
- ** ~*f leidbda~ts could be..aaalYzed~grawPhICaLiYv 2 n.Ut-:.;Ut
type > eurveo matcth I ng- eoulId;.. e us ... to . -define tne, hydrau Iyl
2.4-54

-K>(c.)J
conductivity . ellipsoid frcm Which the principal hydraulic
conductivitifs and their directions could be computed. A siml lar
analytical technique Is being developed as part of this
prototype test for the case of compressible gas flow. Data
collected durIng the thbird phase of prototype testing desctobed;
earlier In section 2.1.3 Fracture/Matrix Testing, will be
analyzed using these techniques. Preliminary work In this area
has begun for Isothermal gas flow and-.su stumarIzed'beIowi*
One maJor problem with applying H310Oh and Neuman*s (1988)
analysis to Isothermal gas flow -through a homogeneous,
anlsotroPlc medium, Is the nonlinear form of the gas flow
continuity equation as shown belowg
V-(itVP2)u a~ 0 l --1p ot
Is. ::(3) .. .
where k Is the gas permeability tensor, p Is the absolute
pressure of the gas., 0 Is the porosity of the medium, and p Is
-absolute-visCosity of the.gas.n.- Not"'thatiEquatlon (3) is In the
same form as the Sousalnesq Equation (if h- replaced p) which
describes flow In a phreatle aquifer with a horizontal impervious
base (Bear, p. 113, eq. 6-76. 1979). Equat.lon (3) would be
IlInear wIth respect to the dependent--varlabilo.Pt iIf the term 1/p
did not appear on the right-hand-side of the. POE. One method of
linearizing equatlon.(3) ls-to assumeothpt;P-.Pav 0*P where
Pave (xaP) Is the average pressure In the reservoir and p Is
2.4-65
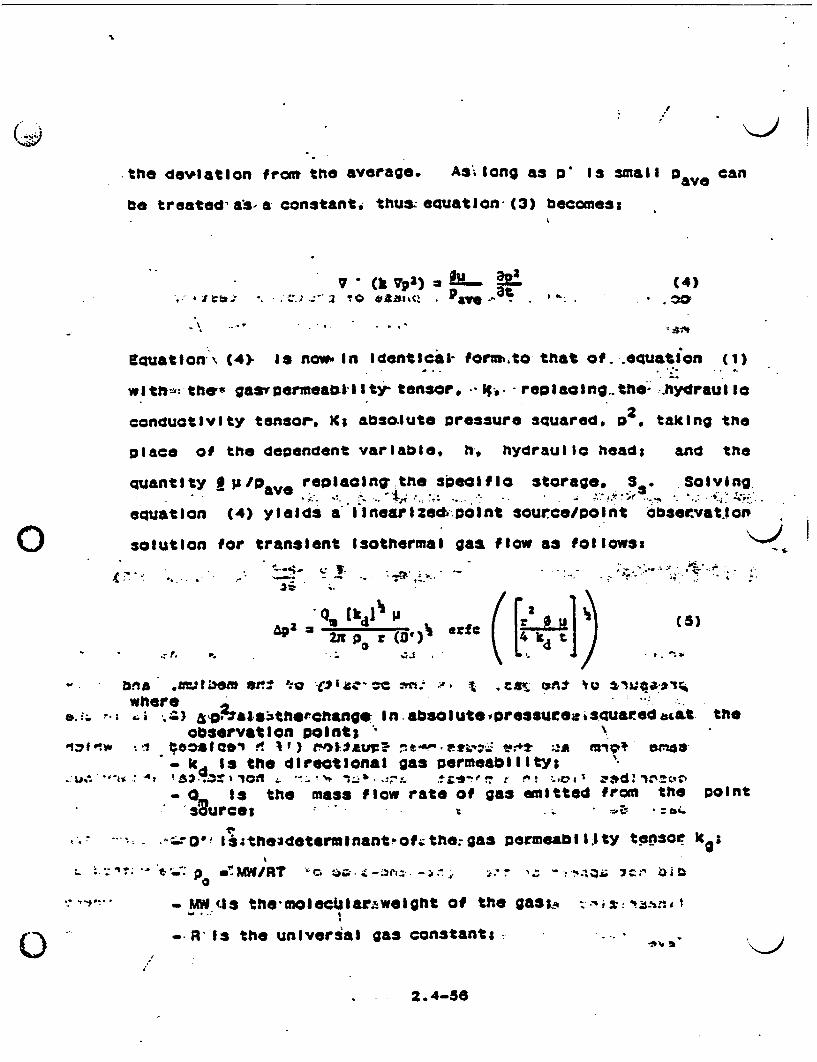
.the devlation fron tho average. As'long as p 13 small naI can
be treated a"-a constant, thus: euatlon (3) becomes:
v (V3) fLX S (4)
-\ ,- .^ *, Xt,
Equation' (4) is now- In Identical- faorto that of. .equation (1)
wItft': thee gasvpermeabW-II ty tensor. 1;- repIacIng.the hydraulIc
conductivity tensor, Ks abso-luto pressure squared, p2 taking the
place of the dependent variable, h-, hydraulic heads and the
quantIty f yipy reolacing- tne specific storage, 35. Solving.*~ .. *. I -. . .. - .e ..;
equation (4) yIelds a IInearize1d point source/point observaticoi
solution for transient Isothermal gas flow as follows: ~"'
=t .. ,
apt Qkajj G I Jfe ( (5)2Mp ~4 k~i tj
betA *=j I Dem oSI* ':Q Z'C~m:~ vcs cott ~znua .v
where-.Q) -- i-&1 *s!thetchang In .absoJutoeoressure squar.e da t the
observation paint; \
- Is 1 the directional gas poermeabilItys-, ---,> ~ 2 "It4:s on '. * !!. -'a.., *_,t ^*eC 1a| we
- 03 Is the mass flow rate of gas emitted from the point*surces -
- * -- -0"! I theadetermtnantbofvth ;gas permeabli.ty taEO S ICE;
L . .t,-_'.-_' p . p *-t yin '+C Jh .- Mr - - -- '.3 -r O
M- P cis themolectiaartweight of the gas:- i-. R Is the universal gas constants - - <2
2.4-58

- T Is the absolute temperature of the gas:
- r is -the radial distance from the point source to theobservation point:
- t Is elapsed time:
- P is the average gas pressure of the reservoir;Ave- # equals formation porosityl
- and P equals the absolute viscosity of the gas.
Equation (6)-can be used to analyz.egas Injection test data
to determine the direction and magnitude of the principal gas
poermeabilitles and porosity of the fissured medium, In the same
manner that Hsieh and others (1985) analyzed water Injection test
data using Equation (2) to determine the direction and magnitude,
K of the principal hydraulic conductlvitles and specific storage.
-However' first tt Is necessary to determine whether the
assumption that 1/p can be treated as a constant holds before
applying EquatIon (6). A test problem was set up to compare the
pressure values obtained from the linearized analytical solution
given by Equation (6) against pressure values obtained
Independently using the numerical model 0GAS2.
A fleticious flow domain was created with two of the
principal pOermeabilitles directions lying In the horizontal plane
* and.the third being normal to the horizontal piano or parallel to
the vertIcal axls (FIgure' 2.4-12). The two principal
pOermeabilltles lying In the horizontal plane (ki and k 2 ) were
given the same permeability values of 10.OE-18 m2 thus
permeability Is Isotropic with respect to the horizontal plane.
2.4-67

-0Q
. 3I r
0~~~~~~~ IC
, 3
- * /
I A- ~~9 . -.
a-Ro d : -; . 4*.
0.. .!
%s _ _. .t. t. t IZ*
.-t. t- le . :-. o
,3a . ,, tP-oD
t ,_^' ' \ ;te "^"' : 4 ttt,;.j
* i.
.- 9
x22 .,%
i .i*A
. W.- I- . - -. # i
4'*..* &*:V -& *j.
A* , :, '': C.? ' '~1 ,
*. I :
Flgure 2.4
, ;. .. . s. -- j :. v
. I
I * * -.
'.<.^r I i -^ - a.- -. O M; w i. --e wn
r,~~~~~~~~ ~ -. -, w* .. .
-12. ORIENTAT1ON OF PRINCiPAL PERASBILITY AXESW I T RESPESCTO THE PO I NT SOURCE AND OR I-WZCNTAL PLANS.
4. 01 -,L - - . . ...
YI02.4-88

The third principal permeability (k 3 ) was assigned a value of
5.OE-16 m 2 or half that of the other principal permeability
values. The value of the directional gas permeability (kd) was
determined In the direction parallel to the line segment AB shown
In Figure 2.4-12 using a graphical technique. The line AS
begins at the origin of the axis where the point source- is
located and lies at an angle of 46' with the horizontal planeo.
Due to the fact that permeability is Isotropic In the horizontal
plane, the directional permeabil ty In a direction parallel to
any line making a%46 angle with the horizontal plane will always
be the same. For Instance, line AB could be rotated 180- around
the vertical axis X3., or opposite Its present location In Figure
2.4-12, and the directional permeabillty parallel, to the
direction of this new line would have the same value as the old
kC.
Pressure values at various distances along the line AS were
calculated using Equation (5), a kd value of 6.46E-16 m2, and
parameter values given In Table 2.4-2. The pressure distribution
Is shown In Figure 2.4-13 at 600 seconds,(4O mlnutes) after start
of gas Injection. P g was set,-equal to 101,000\Pascals (C1
atm.) which was the InItlalpre~sureof thereservoIr prior to
Injection rather than the average reservoir pressure at 600
seconds.
Two numerical simulations having different size flow domains
and grid spacings were conducted using DGAS2 which was modified
to handle anisotropic flow. Input parameters Into the model were
2.4-69

fI
TABLE 2.4-2.numerical and
.. .> , .'? .
List of parameters used to generateanalytical oressure distributions.. .;;
;'. ;. 'A V, *'P ' * .. :~ '" ! ' ,; 8'. a : tji. _ -. : Z 1
..
Om 3.948-03 kg/s *2000 SCCU (S10. co/min)
- * oabsolute vIscos Ity t 1.785-i05s I 79 Pa-e
k d u directional permeabl'IIty a 6.48-616 m2
PO MW/RT 1 .'167505 8 g/rn
Mt a molecular weight of N2 - 28.01
R * uni versa i gas consita't'
- 8.3145+03 N-/(tcgmoie- )
T. * absolutetemperature. 28.7 *K (60)IC IC I O."offa~.
- 85.05.16 2
* 0. 11 k Cl 3 S*095-46 Me .
-- - fJ '5m Ptinqu|u~eCOfl7 rst "-- 5 ato
^* ^^' ~ '¢' ~t 't I- * ; *.decnd -. -- .; *" ¢ ;". ' -.' a[
* -3 xt ;
\~i
.. - : * ; IL. .. ' ! I 'A -.-A w I t* t --ar - 14 S I# I I-- v Of # V ". ;" !� .9.1 , 0'.qi A 0'4"- . I . 1.030St
* - .. D.t r.. w i..d, -z *1- I*
.7 6 % . -. 1 to , .. iv, ~~ ~,; .*-'**
.0. Pt
2.4-60
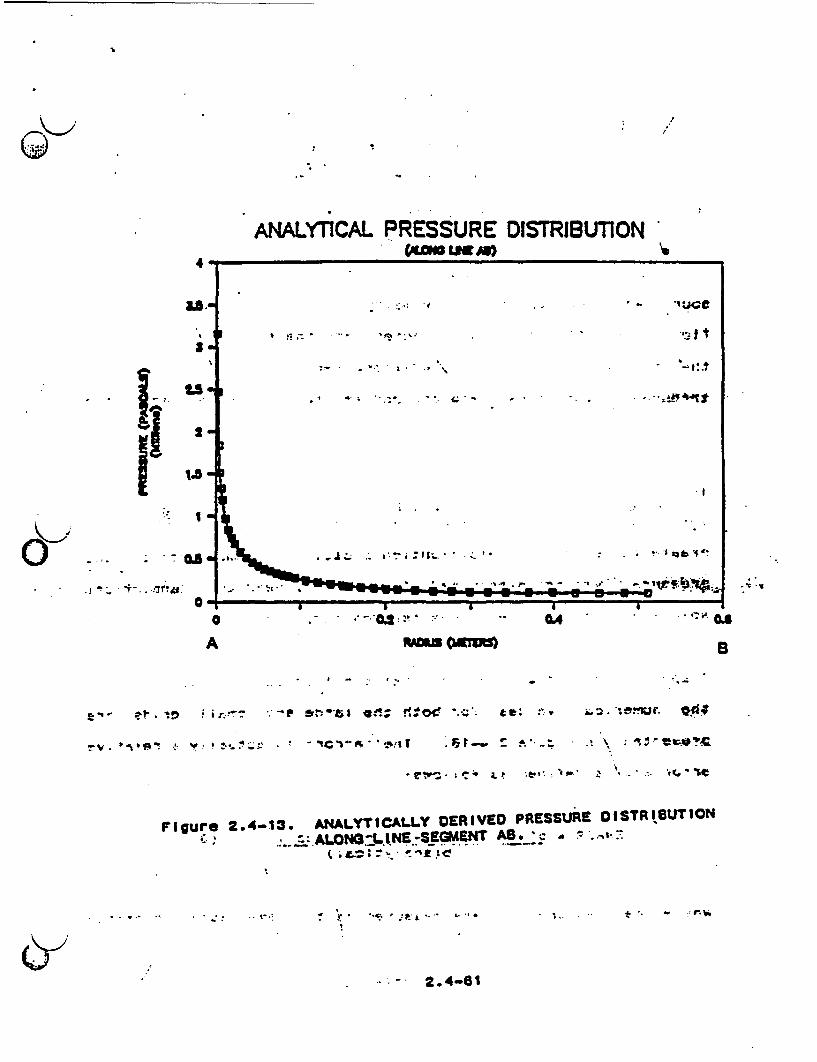
G%,
ANALYTICAL PRESSURE DISTR8BUTION_ g"e IM AlI
4
aS.
I
1..I.
I'LS
2
1A
IU
..';.'
A .- '0.*4
A A du B
I. * -- - I v ;
em >*Iso :sr'~ **0 *ctZ1 aid: r~o( '._' se: :1 .^. :e iQ4$#
-v. >,o' w *a:?_ ~ er I o.s .e_ v . : .} * s.;t.
Figure 2.4-13. AnALYICALLY OERIVEO PRESSURE OISTRIGUTION'- ' :. -:AU LN I3jLN.5"E-lE e.I. a; -. ah
t $_ -_ ^ it ,le~~~~~~~~041
f * ** C. .'S E i'- - t --. _ e' al
-- 2.4-61

(4:4 Identical to those used In the linearized analytical solution
(Table 2.4-2). The point source was simulated using a single
constant flow node located along the axis of the *axlsyMn :ric
flow domaIn as shown In the vertical cross-section of Figure 2.4-
14. Only the upper half of the flow domain surrounding the Point
source was simulated due to symmetry -ln turn, onIy- hea f thiemass.
flow rato (1000 SCOA) was Injected Into the flow domain during
the simulations. Initial conditions were set at 101,000 Pascals
throuhout the flow flaid and gas was then Injected lntt the
simulated formation. Figure 2.4-15 shows the pressure
distribution that had developed after 00 seconds of gas
Injection for both the large and small grids. Pressure values
for grid points lying on the line AB descrIbed above were used to.
O i create these pressure distribution plots. Compailson of. the
iapressuret 4aisslues determInedf. cmtheo -vnarlzed analyt'ic6al7-- -. ._ __
solution with pressure values derived numerically should Indicate
whether treating lIp as a constant was a valid assumptIon.
Graphical comparisons of the analytical pressure values versus
the numerical values for both the large and small grids are
presented In Figure 2.4-18.' The meoror 1s actually a relative
error and 13 defined as follows:
- - . .- * , .;,
ERROR * p(numericar;-ra(analytical) (8)p(analytical)
where the pressures (p) are measured at the same radial dlstance
... 2.4-62

a
Gj� �x 3
Z
I'.4
0
a
LAAGE FLOW COMAIN (LARO ORI0)60 x 60 NODAL POINTS3.7 METERS x 3.7 METERS
SMALL LOW DOMAIN (SMALL GRID)60 x 60 NODAL POINTS
/ .O0.74.METERS..x O.74-METERS
* r ..
e Sw-*._ __. - 4
45*
/fi~~~~~~~~
6r-
A
I
1.0 II 0 1.0 OI I
1*- ~-*
tI -
Rt a Xt a Xz
Flours.2. -- 14 VERTICAL.CROSS-SECTION THROUGH AXIS OF FLOWOMA I N SHOW I NG .MES. S I ZE OF. LARGE AND SMALL
GRIDS AND LOCATION OF LINE SEGMENT AB.* - p, *[* -s .,I
* * .. . ~~~~~~~~. -. .- . - -
2.4-83

NUMERICAL PRESS. DISTRIBUTION (LG GRID)C" t Ane
4 -
33 -
I a
U a
S
. . .. -4 0* a:
aI -- - -,--- p
S of *A.
BA CBobn"
NUMERIAL PRESS DISTIBUTION (SM GRID)I.1. Z. 0
U.I~
A . RAOwvI a
Figure 2.4-18. NUMERICALLY DERIVED PRHSSURB OI3TRIBUTIOP'4)ALONG LINE SEGMENT AS3.
2.4-64

RADIAL DISTANCE VERSUS ERRORWm Cow
I
GM0+oo LOC-OS 4M0-01
A C 4o
LCI-01
a
0I . c
0.23
0.4
0.2
Oma
RADLAL DISTANCE VERSUS ERRORSov cmb
lv' ~ t11 a. 1 ;.
I 0.14 .0.12'
: ~: 1 - 1 ;-!04kcm 1
am -V ll� Z t " "II 0.
A . .. . b
FIgure 2.4-16. RELATIVE ERROR BETWEEN THE ANALYTICAL ANDNUMERICALLY COMPUTED PRESSURES ALONG THELINE SEGMENT AS.
2.4-65

from the point source. Intultivoly, one would expect the largest
errors to occur very near the point source (radius - 0 m) and
become smaller further away. This Is-because high pressures and
steep gradients near the source would easily violate the
linearization assumption that the deviation In the average reser-
voir pressure must be small (which was setvequal to the Initial
reservolr; pressure of 101.000 Pa). Referring to Figure 2.4-18,
one can see that this does Indeed happen near the source,
however, the errors do not drop off monotonical-lyas expected,
but rises again to another maximum at about 20 cm. This second
rise In the error Is believed to be-a function of the grid
spacing used to obtain the numerically derived pressures. This
1s substantiated by the fact that large changes (usually
Increases) In-the error occur at locations-where the grid spacing
chanbi37. ~~rfi.o caNTon-o'f these china i arol 3dlcated by the
arrows In FIgure 2.4-18. In addition, the error drops from 0.23
to 0.17 for the second maximum when the small flow domain (small
grid) Is used Instead of the large flow domain (large grid); this
Is! another strong Indication that th eorror Is-40iifitive to the
numerical pressures. ' * 1..
In conolusion, the error (Equation is 'Jo i3hsitive to the
grid spacing used in hese simulations that It :3 ImpossiblO to
determine whether the linearization assumption -IsAvalid for the
parameters.'jehosent_._ More simul1atlons nbed toeb conducted using
variou grid conflgurations before definitive co-nclu3Ions can be
reached. In the event that the linearization assumption is
* -*.* P ~q....2,- ' ;. - - ~'4A-2.-8

Invalid. the steady state form of Equation (5) given below
.~ ~ ~ ~~ 3 -
*~~~~2 (W) ( 7)~
can be used-to determine theo3-dimenslonal permeability tensor
without Imposing any limiting assumptions. Kowever, a steady
state test cannot be used to determine the porosity of the
fracture system, so Information would be lost as a result of
conducting steady state toets.
b) ~3 . C A LEVEL
This work has been approved as QualIty Assurance (CA) level
I I In accordance wIth NNWSIUSGS-OMP-3.02 Rev(1);
4.0 OPERATIONS
4.1 SEQUENCE Of ACTIVITIES -
figure 2.4-17'showsa.&fiow chart IIlustrating the Intended
sequence of *actlvItlis.- ActivitIes for fY 87 and FY 88 aro
shown. A detailed time line gantt chart Is presented In
appendix A along with a short description of each activity. The.. J ._ ..'. . -..... . ..
- time IIno e-can be used to determino activity durations,
interrelationships between test activities, and approximate dates
defining start and end times for activities.
Prorequisites that need to be fulfilled prior to testing
Includet
2.4-67

INiT'IATC MOCILING PROCURs rasr gcutPAVr
I,(3SNERATlr CR I TER I A LETTERS
& WORK altOltRSI ~~~~I
'j I
p
CALCULATIONSI
CAL.I IRATE! I NSTRUMJENTATION
.. 'PAGICA9 TRAOOLLt PIACKEMaTOOL,
-.. I...... ww lw ~
AltASSVALt* TOOL IN GTUF SUP polt BUtKI PERMEA I L.I TY
BEGIN CONTAC7?4ESTING PROTOTYPE TEST
FRACTUREr; LOATION TEST 1NG~t
coN4ThJITY TESTINM
WATER INJECTIONH A MONITORING
~~ ~* BEGIN PAULT.TESING
FRACTURE LOCATION TESTINGI
GIAS INJECTION
WATEA INJECTIOll & MON3TONNG-1-'
-**. I. ~ ~ ~ ~ ~ . I. 4-f---
I
Figure 2.4-17. FLOW CH4ART ILLUSTRATING SEQUENCE OF;~~~~~i -c' <'- ho?!aa' :ACTIV T I ItS FOR-THE -CROSS-HOLS -PNEUMAT IC
ANO HYDRAULIC PROTOTYPE TEST.a r - ,.. w as C. .*-\ . . f ¢ * -: ., _ e .... ; e . .
.. " .. '!.;4
I
.I *- '-!§o'
02.4-68

(a) Complete scoping simulations;(b) Ordering and purchasing equipment;(c) Generating criteria letters and work orders;(d) Calibrating Instrumentation In the laboratory;(e) Assembly and testing of the straddle packer tool In the
laboratory;(f) Partial disassembly of the tool for shipment to the NTS
G-Tunnol facilIty;(g) Reassembly of the tool underground In G-Tunnel;(e) Leak-detection field testing of the tool.
4.2 TECHNICAL PROCEDURES
Formal' technical procedures are not required for QA level
III activItIes. However, formal technical procedures will be
written as a result of activities performed during this prototype
test. Oata collected during prototype testing will not be used
for site characterization.
Technical procedures to be developed for use In the
0> exploratoryceshaft Include:
(a) .Underground of packer systems In InclInedborehol.es3~,,.. - .L*r P .**- * ^ -t 't
(b) 'Oepth measurements from collar of borehole to straddle-packer components In InclIned borehole3.
(c) Cross-hole and sIngle-hole water-injection testprocedures.
Cd) Cross-hole and single-hole gas-injection testprocedures. n-d, c"'
(e) Gas flow meter calibratlon and useMf Water flow meter calibration and use.(g) In sItu gasstracer4;test Procedures. S. . a(h) In sItu"'water-tracer test procedures.(I) Procedure.,for testing a hydrogeologIc contact.,.
r o iJ Pi6ce~dure f or 'test Ing a known f au It.(k) Procedure for conducting a ..cross-hole. test for
determining the anisotropic permeability tensor., ~ ~ ~ ~ ~ ~ ~ . ,; `- Sp.^p e^2 rs ttt r- . *- F w fit .- Jr-^,
Procedures that are applicable to this prototype test and
xcurrently available for use are listed In Appendix B:
2.4-89
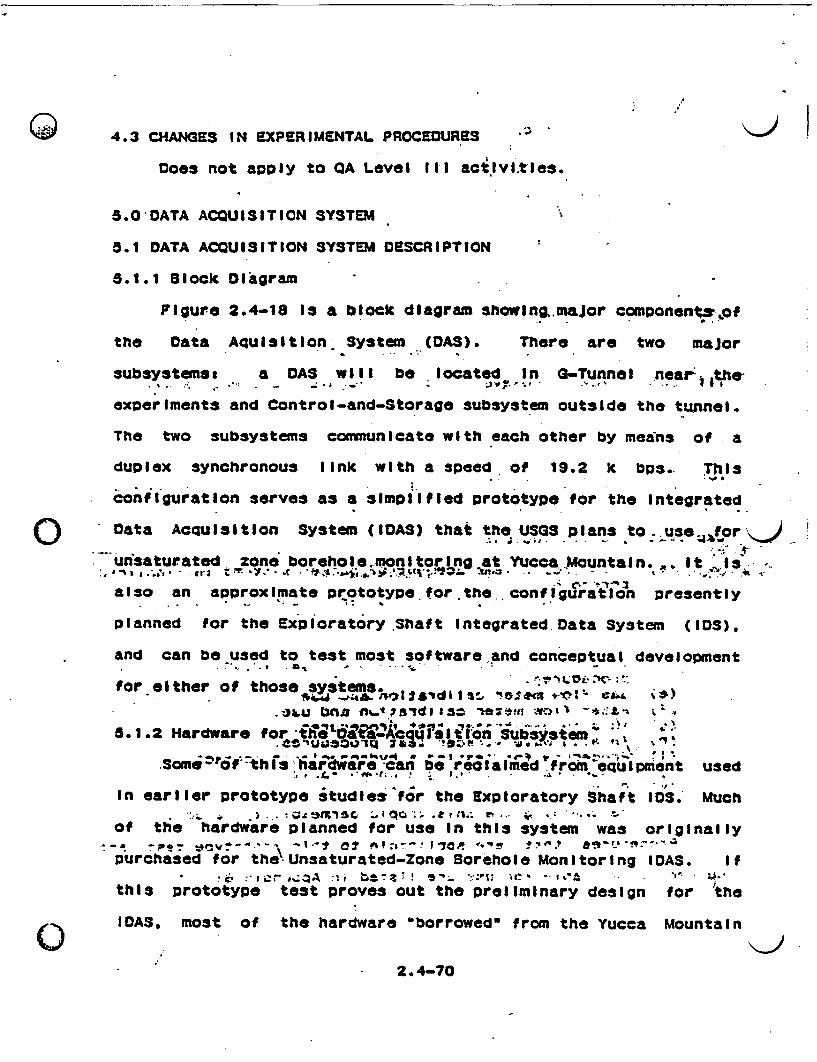
.1s. 4.3 CHANGES IN EXPERIMENTAL PROCEDURES
Does not apply to CA Level Ill actIvl.tles.
5.O OATA ACQUISITION SYSTEM
5.1 DATA ACQUISITION SYSTEM DESCRIPTION
5.1.1 Block Diagram
Figure 2.4-18 Is a block diagram 3howing..major components-f
the Data AqulI3tlon System (DAS). There are two major
subsystems: a DAS will be located In G-Tunnel ne&, tle.- . - ; ; .i - r s .. . . . t Ah'
experIments and Control-and-Storage subsystem outsIde the tunnel.
The two subsystems communicate with each other by means of. a
duplex synchronous link with a speed. of 19.2 k bps.. ThIs
configuration serves as a simpllfled prototype for the Integrated
Data AcIulsltion System (IDAS) that the USGS plans to use
unsaturated zone borehole.-monltorlng at Yucca .Mountain.,. It 'ls
also an approximate prototype, for. the. config aulhn presently
planned for the Exploratory.Shaft IntegratedData System (IDS).
and can be used to test most softwareand conceptual development
for either of thosesystems.*~~-t Dn norIwsid~l s 'o:. frsis. -*:. thj ; .
5.1.2 Hardware f or the ',lAi. ,IubS4ytem .1 i I
Scme i'-6f~t ~l i"~a be' reclaimed from equIpment usedS~~~~~~~~~ -1ofh *'a~^ ^ ;;*il.d.-'- ~
In earlier prototype studles'for the Exploratory Shaft 10S. Much: _ , X~~ .. ennt w;,.n.; r ... *,! .* ..-
of the hardware planned for use In thIs system was originally-~~~ -. ~~~, v~~~~~
4'~~~ ~ ~ o~~~ ~~9:i~~~ h7C ~ ~ ~ ." --.d'*,~~~~~~~~ IX . 'v Is0 : 140 P~ q-.% ff - '-
purchased for the Unsaturated-Zone Borehole Monitoring IDAS. if
this prototype test proves out the preliminary design for 'the
IWAS, most of the hardware borrowedO from the Yucca Mountain
o . 't
2. 4-70

l:J
- .. . .
,. . -r
C i -re*1'' -E . 1-8'* '
I 'p x ' VsD ~ 4'I
,b. *a To^ .' < .4
0 -',.B
*'; . { }
s 5. t 11l
>. . . -; ~~~~Ad
-. 4 :
l'!1t ' > , , n_0
0 t,-;W<It r
.1
a _e
t.1i 4

IOAS will have to be replaced with new equipment. The following
equipment is planned for use In the DASs
(a) Micro POP-11/73 controller with CRT console, GMV-11
synchronous- Interface, I EER-488 bus- nterface, and non-volatile
CaNOS memoryj
(b) .H"37477A*dIaltai muIllmetert.~~- __ * _I-
(c) HP"3497A scanner with.integral DVM and several HP 3498A
expanders ',
(d) Quarogy OS-201 (or-equIvalent) sealed cartridge-tape
drive for on-site data backup; -
(C).Cabinet with fans, filters, UPS power conditioning and
wiring panels. .. ; '
5.1.3 Hardware for the Control-and-Storage Subsystem 2,-AIi -of. th ehaidware-plang fer-Uso In the. Control and.
Storagexvu.bsxystem was originaly-' purchased for use In the_ . * .j. .. - _ v. ,i ,*
Unsaturated-Zone Borehole Monitoring IDAS. It 1s planned that
this %equipment. be-lnItiallyI!ocated In a protected environment
outside the porta:br- A Tunnol. . fore beginning Yucca Mountain
experIments, this subsystem I ibemoved to a USGS facilty near
Yucca Mountain, but IDWI continue to service tHe prototype
studies in G-Tunnel by'means of a longer datalInk between this
subsys;tem and the OAS. The followingbequlpment 1i planned for
use In thIs system:
Ca) MlcroPDP-11/73 computer with console and OMV-11
synchronous Interface;
2.4-72

(3- ___11(b)
(C)
(d)
archiving
(e)
Oual floppy disk drive-and two RD52A hard disk drives;
TSVO5 1600 bpi ANSI tape drive;
Cartridge tape drives for reading backup tapes and
data;
WWV standard time receiver.
5.1.4 Software
The programning language for this system will be transpapent
to the experimenter. A series of menu driven -routInesoopePattng
on the Control-and-Storage computer, will guide the experimenter
through assignment of AID and excitation channels. cholqea; of
signal conditioning, timing, and excitation parameters. The
software will assign labels to all readinas to avold' conflicts
with labels for other experiments. The labels will Include cross
references to appropriate calibration data, according .to
information supplied by the experimenter. The software will
force a simulated run for each new test before the test
parameters can be down-line loaded to the OAS.* # t ;~~~~,-*.. [* I .e , -
Terminals at the experiment sites In G-Tunnel will permit, , ., .. . . . * -3. _.-T : P.: t
real-time displays and Interactive experiment management, but all
commands for modifying an experiment are routed through the
Control-and-Storage computer, which checks for authorizatlon and
confictsabefore passinng the. commands to the OAS.
5.1.6 Software Validation
Software for this- system Is validated by
programming approach. Logical requirements for
a structured
software are
2.4-73
structured and tested before code Is writtenrl code, when wrl''en,
Is then tested against the predefined logic.
Software Implementation Is tested by simulated. ata-
acquisition experiments that run on the Control-and .orige
system. A sof~tware routine for hardware set-up allows tt :Ing of
sensor wirlng before data acquisition.
5.2 DATA COLLECTION-
*5.2.1 Data Collection Rate-9*- *4 *42
The maximum rate at which this system can collect. process,
and store readings is approximately 7000 readings per hour, where
an average reading consists of about 5 subsamples. Each
Individual *test collects data at a rate appropriate to the-scale
of-measurement, subject to this overall system-constraint. '.23.2;2 Data Conversion
Data are stored In both raw form as output by the digital
multimeter and In scaled and coverted form. The scaling factors
and. equations are referenced In the data labels. Menu-driven
routines assist the experimenter In selecting conversionj a.)o : .^ ' .. b.
equations appropriate to each sensor.
.0.0 PERSONNEL QUALIFICATIONS - --
Quality level III worktdoessnot-require-formal certification
of proJect personnel; nevertheless, the personnel Involved In
this testing activity could be shown to have the appropriate
technical expertise.
2.4-74

C» 7.0 NONCONFORMANCE ACTIONS
Nonconformance of Quality Level I11 Items or processes will
be documented per the requirements of NNWSI-USGS-QMP-j0.0i.
Rev(1). Corrective action will be documented per- the
requirements of NNWSI-USGS-QMP-18.01, Rev(l).
*~~~~~~~~ - _ - *-_ ;4 za B
8.0 DOCLUENTATION
As described In NNWSI-USGS-QMP.-3.02. Rev(1), existing USGS
good scientific practice requirements shall apply to Quality.. .* .. . . . . -
Level Ill work. Therefore, field notes, log books, and data
records (computerized or otherwise) will be maintained wIth the
utmost of care and precision. All manual data entries are to be
recorded In permanent Ink, and are to be signed and dated by the
person responsible for the data collected. Computer-stored data
are to be tagged. as described in Section 6.1.4 and 6.2.2. All> ; ;- S-* . _t.Ss - ............. :. r. .$N. rS.. * . ;-S
log books and records are to be permanently maintained and
archived In the USGS Denver offices. A USGS data-records
management system will be maintained In Denver for support of all
data collection activities assoclated with the USGS prototype
testing program.ec . : I v. I & . .* - .. ;. n C,
9.0 SAFETY,- .- , - --
There are three potential hazards associated wlth cross-hole
pneumatic testing. They Include the use of hIgh-pressure gas; <%;_kZ . . ._ . . ; 4
cylinders, high-pressure Inflatable gas packers and tracers.* c *. . .^ ; :.. , -, .. . w... . ..
Hazards associated wlth transporting and storIng gas cylinders
,. . .,,; r-e.t .r of th t n r 'l sz ~Include accidental rupture of the metal cylinder or valve stem
2.4-76

breakage . in order to minimize this hazard the cylinders should
be secured to a wall or other heavy object out of the way
operating machinery. The cylInders shouId be capped at all times
except. when utilizzed for testing.
The second hazard may result from exceeding the reccamended
Inflation pressure of the pneumatli packers or from a rupture. .*'A'. L4;;- 09 a
resulting from a damaged packer gland. Frequent Inspection of
the packer glands after each test and making sure that field~~~~. U I I -I to At -- v**4: f * ;. - ; `@ , | a -,j & q; JSo- -i -4
Ln' - . ~ . #0
crews are familiar with the manufacturer*s safe operating range
of the packers should help eliminate these health hazards.
A third hazard may result from the Improper use of tracers.
The tracers that will be used during this prototype test wills ... N -
consist of nonvolatile chemicals that will be added to the test
water. Taking the solution orally, absorption through the skin
or splashing the tracer Into the eyes present the most llkely -,T t I- > jo-0 I I. .
hazards. The use of proper Clothing (rubber gloves and goggles)
and Instruction on tracer use should minimize these hazards to
field personnel.
.In addition, safety requirements and regulations establIshed
by Reeco and Sandia NatIonal Laboratories for 6-Tunnel will be
adhered to by all personnel while working In the facI I Ity. O. e
10.0 REPORTSc r.3 4 @ e *e p * ;' '' - *-z *- - - '4-r.:- f * -e-~
10.1 PRELIMINARY REPORTS- * t ̂ L f :.*t5^' * :* :; ~ .; *' ~~ :? -¶ t . .
There will be a series of adminlstrative reports of
prelIminary results prepared as soon as possible after completion
2.4-76
of portions of the test. These administrative reports will be
provided - to the Department of Energy (DOE) and other related
Principal Investigators from Los Alamos National Labortory. The
cross-hole pneumatic and hydraullc-test, system consisting of
hardware, software, technical procedures, methods of data
analyses, and final field testoconftgurationswJwLtI. betreadyKftr
use In the Exploratory Shaft on or prlor to the current expected
shaft start In earlyspr ng:ofP. 189. - iThe tl me tablIal-for
delI verIng rthe test system and prelIminary reports, whicttals
considered a milestone, Is shown on the Gantt chart In Appendix A
and designated by the task code DREPORT.
1O.2'FINAL REPORT
('V The final report, to be prepared as soon as possible after1Jisc C, 1: * - :-pE .completion of the test, will consist of complete data analyses
., ... ,,, . . ... ; -- ' -- -- !c -tt ^' - > * I' . ' .. ."b . r .- A
and Interpretation of data collected during G-Tunnel testing. It
will be In the form of a paper published by the Water Resources
Olvision of the U.S. Geological Survey. In addition, a manual or., n. -- - i .- * I,' rf ,; .* :. .I ._; s . , *, , ,
series of manuals on techniques describing procedures for: i .. _*z £_fr.; -'." -- *C ' ftr 9 - .VCVB . Vplanning and executing specialized work In water-resources
' . u >* '* 4 i *tr gI.tOSaxfsi fgl c$eS 01 ZJo
Investigations, will hopefully be published as Techniques of*- * *- f -r. O l q>* .- XSO : ?^-V % @ 4>t *. -
Water-Resources Investigations of the USGS. The time table for
delivering these final reports, which is considered a milestone,
Is shown on the Gantt chart In Appendix A and designated by the-. p '' t * . t. A ;, -_*-'- - t ''t .I .: .a.. I
task code OFRPT. This milestone Is scheduled to be reached nolar .: -t- e Alater than April of 1990".
2.4-77

11.O CEFINILTIONS
A. Prototype testing -- Exploratory-shaft preparation work
conducted under WBSW 1.2.8.9.4. Prototypew testing- involves
preparInq and conducting experiments,. tests and felId trIatl+sof
proposed ES tests to validate concepts. equipment, and designs.
and to, dveLop.techalcah.p1rocedures. ; .
B. Cross-hole pneumatic test - A gas Injection or wlthdawal
test conducted between -two or more adjacent. boreholose usedw.to
eva luate rocl f.format Ion- parameters such-as gas permeab I I I ty'.-
C. Cross-hole hydraulic test - A water Injection test
conducted between two or more adjacent boreholes used to evaluate
rock formation parameters such:as water permeabillty or hydraulic: L . . .......... ; . i. . w * .-...............7
conductivity. -.
D. Measurement Equipment - Sensors and related data,__ - ez, :n.5fsJti* :s~5 I $tarn:.o.# ' w -t. Q qD ccacqulsItiqn -system used to measure and record the physIcal. state'
of a substance (e.g. temperature of a gas)
E. Operational Equipment - Control/feedback system used to
regulate the operation of an Instrument or entire experiment.^ . CS1Lt^b5s:(VC inz'tF igwb ' ''t !O -N-. . m.II4 Un .to z o
. * Experiment - Performance of operations that are carried
out to establish characteristics or values not known.previously.;,. s'otn~o.T i. baonrIcQ FO y¢;. e.- **i ,no^Q2a~wevA.B. Test - Process of exposing an Item of hardware or physcial
.~* *' .,. ;X' _.' '; ,- ' * . .. S W _e -_;W:- ,zissystem to a given stimulus or operational sequence to determine
.~~' .. *-^ * . . . ;.. . . * _;; :.
Its acceptability or response, respectively.
H. Analyses' - calculations or other evaluations needed to.- --- :f .; ; :> ;". t o ..L * _4- G iq-u- .. h'd
assess site characterlstics, support design activities, or to¶upport experiment designs an v . .avnt
support experiment designs and evaluations.
2.4-78

12.0 REFERENCES
12.1 PROGRAM REFERENCES
Quality Assurance Manual, U.S. Geological Survey,. NevadaNuclear Waste Storage Investigations, Oct. 27,1986:
I) NNWSI-USGS-QMP-3.02 Chapter 3 - DesalInvestigation Control), Section 2 - USGS QA Levels J(QALA).
2) tNWS1-USGS-OUP-t0.Q1. Chapter. 10. -I(Surveillance), Section I - Surveillance Procedure.
3) NNWSI-USGS-OMP-12.01 Chapter 12.- Control ofand Test EquIpment. Section 1 - Instrument CalIIbratIon;.
;n (SiteA8sslgnment
Inspectbon
MeasurIng-~brT
4) NNWSI-USGS-CMP-16.O1 Chapter I6 - Corrective action,Section 1 - Control for Corrective Action Procedure.
Nevada Nuclear Waste Storage Investigation, Issues. InformationNeeds, Studies, and Activities, unpublished document, revisiondate June 23, 1987.
';7 - S.
NNWSI Exploratory Shaft Test Plan, revisIon 1, August 1985.edited-January 1986, document control No. 28.
~~~~-.'. ' t ; o--,- - .;-i.. E _ '.- .,..-.C !
12.2 TECHNICAL REFERENCES* , > -, -* g ;.- c J J w % ~~~~~~~~~~~~~S-.- ' . * : * a.;4
Al-Hussalny, R., and Ramey, H.J., Jr., May 1968, The Flow of RealGases Through Porous Media, Journal of Petroleum Technology, p.624-636.
Bear, J.,J.. 97. HydraulIcs-of.Groundwater, McGraw-Hi II Series- InWater Resources and Env i romenta VEng I near I nglMcGraw;Hll Inc"'
..Brooks, -R.H.. and Corey, -A.T.,vJun^1986 ,.PtopertIesls'ofwPofous.,MedlaecAffect.ingIFluld Flow;.ttJournal 'of. ;theJ@-Irrlgati6n"'and.,OraInage&OlvIsIon ASCE, 92(1R2), p. 61-88 -O^n Ec~vC" ')
.s ,.. j . ~~~~~- ; ; . .*^_ S
Bruce, G.H.. Peaceman. D.W.. Rachford. H.H.. Jr., and Rice, J.O..1983, CalculatIons of Unsteady-State Gas Flow Through PorousMedia, Trans., AIME. 198, p..79-92. .
Carslaw, H.S. and Jaeger., J.C., 1959, Conduction of Heat InSo.lids,..Oxford Unriverslty Press, second edI t I on. - k
. ., t; f - - .; . . .* I -_ _
Davis, L.A. and Neumant S.P., 1983, Documentation and User'sGuide 2 UNSAT2 - Variably Saturated-Flow Model, Final Recort,prepared for U.S. Nuclear Regulatory Comuission, NUREG/CR-3390,
2.4-79

WWL/TM-1791-1.
Earlougher, R.C.. Jr., 1977, Advances In Well Test Analy Is,Society of Petroleum Engineers of AIME. Monograph vol. 5 o0 theHenry L. Doherty serles, second printing.
Hantush, M.S.. 1966, Analysis of Data from Pumping Tests InAnlsotropa-- Aqulfers. Journal of- Geophysical-Research, 71(2) p.421-426.
.~~~~~~~~~~~~~~~~~~~~~~~~~~~~~~~~~. ..
Hillel. D., 1971. Soll and Waters Physclal Princlples' andProcessesp Physliolorcb11 3 EcoIodscerI-6;-^- Acadawic Press. NewYork, NY.
-Hsieh. P.A.. anct;Neuman*-SP I. l985; Field Oetermtnatlon of theThree-Dimenslonal; HydrauAta-t.Conduct tvityTensor- 0*^ AnIsditikepoiMedla 1. Theory, Water Resource Research, Vol. 21, No. 11, Nov.1988, p. 1685-165.
Hsleh. P.A., Neuman S.P.. Stiles, G.K. and Simpson, E.S., 1985,Field Determination of the Three-Dimensional HydraulicConductivity Tensor of Anisotroplo Medlas 2. Methodology andApplication of Fractured Rocksi Water Resource Research, Vol. 21. ,-No.-.11. Nov 19858 p. 1687-1876..
; -t . .- J -
Katz,. D.L. Cornell. D;. Kobayashl,-R.L., Poettmann, F.H., Vary, K_,J.A.. Elenbaas, J.R.. and Weinaug, C.F., Handbook of Natura.1 GasEngineering, McGraw-HIII Book Co., In*., New York. 1959..
Montazer, P., and Wilson, W.E., 1984, Conceptual Hydrologic Modelof Flow In the Unsaturated Zone. -Yucca Mountain, Nevada, U.S.Geological Survey Water-Resources Investigations Report 84-4345,55 p.
Muskat, M....1937 .FIowrof; Homogeneous FluIds Through -PorousMedactaMc~raW°KHil BIook~eCo.,.nlnc.tveec-,, vre .. !i.*$~aa
PapadopulossI.tS;..aNonsteady..flow toa-woll ln,~-an .lnfinrternanlsotropIocaquIfer.1In Proceedingstof theo0ubrovnlcrSymposIat~bon
Hydrology of fracture Rocks..cp.t2l-31; InternationaKiAssoclatronof Scientifl1 Hydrology. Debrovnlk Yugoslavia. 1968.
Pruess, K.. TOUGH User's Guide. Earth Science DIVIsIon, LawrenceBerkeley Laboratory, University of California, Berkeley, CA,;Nov1985.
M -J ^ V#.t'tsftVV- se}§ -, 1 dt;e V P we ItnaSnow. D.T., 19B&; A.Para lelo-ModeI of-Fractured Permeable Media,Ph.D. thesis, University of California, Berkeley, CA.
* St. -ow^^;o -^- - -.- , b;
Snow. D.T7., 1968; Three-Hole.-Pressure 'Test For AnisofropicFoundation Permeability.:-Felsmech. Ingenleurgeol., 4(4), p. 298-
2.4-80

314.
Rissler, P., 1978, Determination of Water Permeability of JointedRock, Publications of the Institute for Foundation Engineering.Soll Mechanics, Rock Mechanics. and Water Way Construction, RWTH(university) Aachen, Federal Republic of Germany, English editionof voilume 6, ISSN 0341-7972.
Rowan, G., and Clegg, M.W., Sept. 1982. An Approximate Method forTransient Radial Flow, Society of Petroleum Engineers Journal,p. 226-266.
Van Genuchten, M. Th., 1980; A Closed Form Equation forPredicting the Hydraulic Conductivity of Unsaturated Solls, SoilSclenc Soc. of America Journal, Vol. 44, No. 6. P. 892-898
Van Golf-Racht, T.D., 1982, Fundamentals of Fractured ReservoirEngineering, Developments In Petroleum ScIence, 12, ElsevierScientific Publishing Co.. New York, NY.
Zimmerman. R., Sandia National Laboratories, 1987 G-TunnelUnderground Facility Tour, handouts and personal communications.
2.4-81

J I
!S.. -s .Q
APPENDIX A
'- .4...
*- . .1 .;.: .." . .. 1
.- ..! '- 7
CROSS-HOLE PNELFAATIC AND HYDRAULIC PROTOTYPE TESTSCHEDULES AND MILESTONES
* _ -.; .-. I
-
0- 2.4-82

I
G.t___1 Table 2.4-3. Time line task table report
Task Code Task Oescriptlon
DAPPROVAL WMPO technical and QA approval of SIP
OCALIB Calibration of sensors for Cross-hole fleldtesting
ODTP Oetalled., Test.Plan.-wrtteup for pneumati%&hydraull' cross-hole tosting
DDTPM Completion of. DTP for cross-hole testing,.,,
OFRPT " : Completlon of final, reports Including.Interpretive and technical documents
OLOG&TVC Log cross-contact boreholes; TV, neutronprobe and fracture logs
OLOG&TVF Log fault Intersection borehole; TV, neutEon
probe,..and fracture logs
OL3G&TVG Log Bulk Permeability prototype testboreholesl _TV;- neutron probe, and fracturelogs -
-OMONITORC MonqI torwatecr.,lnJection cross-contact test.-Inorder tocharacterize capillary barrier
oMONITORF Monitor water Injection fault test In orderto characterize known fault
DMONITORG Monitor.gas Injection fracture/matrix testto determine 3-dimenslonal permeabilitytonsor of Grouse Canyon member
OPO Prepare purchase orders for equipment
OPROC Prepare preliminary procedures for testing
DREPORT Prepare preliminary administrative reportsand deliver cross-hole pneumatic & hydraulictest system for use In the ES
OSEQEQUIP Secure test equipment from vendor
OSIP Prep~re Scientific Investigation Plan (SIP)
2.4,-83

/1
~,J - 1
TABLE 2.4-3. Time line task table (continued)
Task Code Task Description
OTESTC Conduct short term gas Injection tests acrosshydrogeologic contact
OTKStP' . Cog~dEucuisiout terigas.lInJectlon testsIknown fdult ,',
OTESTG Conduct fracture location tests In borehoresparallel to ,saxls., of proposedPermeability prototype'test room
~.I. ,, ., *
WUSGSREV USGS technical and QA review/approval ofS P
OWMPOREV WMPO technical and QA review/approval of SIP
OWO Prepare work orders for NTS contractors '
uDDRILLC NTS contractor drills cross-contact boreholes,~~~~ .. , s. jG w
uDORILLF?, . .NTS3jcontractoro.*drIhLis fault intersection
* * .. boreholes
uOORILLB I' NTS contr! aiot' 'dr,*l 'oreho es parallel toaxis of -proposed-Bulk Permeability prototypetest room
\,J-
†1~.~ ~ *~n~:L-~. bA~SnotO
- I .. : * r-2a l ! z
~.:e -Z "Z- -: z
O"
�0>
I . . .:,a :- -� .
-I: 4b -.. .9 - . - 1. ,..,
2.4-84

IiI II
ttilf it
_ T,i.s .*
1'Ifi 4I
I -
*1311ppean an Xlll 22 aal
t~~.~a **EW W S.
00 ........... .... ........................
.......................................
~~~. . . . . . . . . . ..... .............. ,. . || - - * * -. * -. * . * .
.. ... ... ... ... . ........ t
...... .........- -.-*.--. . * . - . * - . S - - * - * -* * . - -* . .
*. . S . * *- * - - S * - .
* .... *......*... ... **.. ... . . . .. . .1 .
...... ****** ..... ..,e
*5* * . .* . S S~ * S . ...
. ....
* ..
. ..
. .
. .
. .
. .
I
I
I
*. . . . ...
. . . . . . . . . . . . . . ...............*@.
. . . . . *. W .
. . . . . . . . . .. . . *- .
..... ..... . . . . . .
. . . . . . . . az'. .
. .. ... .. . . . . . . . . .
I: .... '| ~~~~* ..; ........
* . .........
.. S* -- * *S
S*.............* ~~ SS
.: .......... ~......
,-. .S...
* .
a S
a .
I
sipa3.
'Ua
;
a tar$
vs
of3
ml
a
ar't
p
.Jr
2f
at
3.
NVa
;I
;reOF2at
5
as
2fWVT'
a Fa*
a'
a .I !4b
ta
I
fvS
Li- I
I IIt
! I
<'-9
I
(j)

a
A-~I
(rE
I;
* A.
.4
v. -1%
.-1
.'A
i
* a.. a.
* a. a * a
* a. a a *
* a.. a *
* a a *. .
* . . a a a
* a * a a *
* . a a aS
a. a a * * .
.* a a a a a
* *S *.a 0 S
* a....
S.3
* S * * S a *
555** aS
a a S * a
* a. a * a a
* a a a a a 4.
a. .* a. S
* S �*a . * a
* a . a a a*.* a a a * a S
* S * * * * *
* a a a a..
* a a S a .a .
*.*. *. a
* a a a a a a* a
* a. a a a aa a a
* a
a
. . a a.. a
* a.. * . *
* a a a.. a
* . a a � a *
. . . . . . . . . . . . .
.................
. . . . . . . . . . .- a . . .
.. . . . . . a. .. .
. . . . . . . .. . ... .
... ... * .. . . -.
, .... . . . . a . ..
.. . . . . . *.. . .a . ...
............ a.....
. . ...........
. . ...... .........
. . . ...... .........
a . . . . . . . a . .a. . . . . . .
. . .. . . ....... .... .
. .. . . . ........... ..
. . .. .a. . . . .. . ...a.a.a. .
* a a a . a a.. a. . .
. . a . . . . a. . . . . . . . . . .
* .a. . . .. . a..
* . . . . . . .*.a .*. * ...
a . a . . . . . . . . . . . . . . .
. . . . . . . . . . . . . . . ..
- . . . . . . . . . _ ,
. . . . . . . . . . . . . . . . . .
......... . . . . . . . . . . . . . . ..... . .
.. ..... ....... . ..
. . ... .. ... ... . . . .
. . ..
srSor
*'U;
-fk
Pt
*1A
Sre
St
St
-II
0
1. - . .
0
(rN

.~~~~~~ li
APPENDIX B
APPLICABLE TECHNICAL PROCEDURESCURRENTLY AVAILABLE FOR USE
.... .. . .6. I
.I.
2.4-87

T2 e 2.4-4. Appl ICabI e technical
…------------Technical Procedure--
Number Title(NWM-USGS- )
procedures.
._______________
Oate
HP-12. RI(underrevision)
HP-74, RO
HP-32, RO
Procedures for handling andfield testing of the corefrom unsaturated boreholes
Use of the Stabil-Thermminature batch ovbn
Method for monitoring mols-content of drill-bitcuttings from the unsatu-rated zone
08-14-86
10-28-85
05-16-88
HP-73, RO Calibration and use of theSartorlus electronic top-loader (balance) Model1507MPS
03-29-86
..HP-65, RO Hydrologic-laboratory. teat 01-16-88,o*0 d R--Ing'-of cor. and drill-cut- _
.4 -- ~~~~~~~~~~~E~~~~n-sm Ir' 3. ;s.f§ti.>n~ l'r~om:'unsa:tEirat d0;^w8-&-,
HP-ls, RO Frequency of equipment call- 07-24-84bratlon for unsaturated-zone -
testing, Nevada Test Site
R?.Laboratory. proceduesr l-forz' 05he"etermfhat ion of :~mois-
turw ;*g- -t Wture-retensIon, curves *of<;*>J4 , * -r,-- -&....rock cores' *¢ q , * r .. .
)?PiiP6 R.; ethod r measuring mota-- ' 10-28-88' t.7>.;<esg.pz. -r.t. ture content using.a neutron,.
moisture meter . ...\ .>: .......-. g ..... .... , . -. s...
-
>Generai procedure"for gas,= (no a'te) -4S-,.sampling from unsaturated . W. * -; * -* .
S..zone test: hOle ; 4 .. .-
Laboratory procedure fOr ; 08-i4-84calibration of pressure-transducers . ... . ..:
2.4-88

I I
.' , , . . .
Table 2.4-4. Applicable technical Procedures (continued)
_______ca_----Techn I Procedure --
Number(NWM-USGS- )
Title Date
.... -;C.
HP-14. RO(underrevision)
GP-10, RO
GP-t1. RO
Laboratory procedure forcalibratIon of thermocouplepsychrometers
eorehole video fracturelogging
LeggingU fractures In core
07-09-84
04-12-86
06-16-86
MOP-O1, RO Identification, handling,storage and dIsposItion ofdrill-hole core and samples
*.* .~..% -e4
. i'*' 4 j 3 0 . -i - 'e
- ., , 4. -, -.1j. ;IV -. . ." I , :- -: -;J. :. ", �-`, -
.1�C -I
- ¶
� S
* I � .%-�
Ye
4 .. p
.4 . �8
.., $ -. �- .;§
*�,...
A ..� ��**- � � *4JI��.
- *a�z�' ..*.� 1
.jj*
* *�- . .-..
3.jE
S.A
* 3 i. *
:-17 : I" , , - ..
2.4-89

.2-. 9 -r,.�.�'&' 7�'.A.* . i *4*�fl
I P
C
--4..tS GEOLOGICAL SUiVEYWATER RESOURCES DIVISIONCGLORADOWATERRESOURCES UBRARY
* .4. .#I,.
. 0A
p,.
Vif,
II
uj