upper cohansey river watershed restoration and protection...
TRANSCRIPT

Upper Cohansey River Watershed Restoration and Protection Plan April 5, 2011
1
UPPER COHANSEY RIVER WATERSHED
RESTORATION AND PROTECTION PLAN
Developed by the Rutgers Cooperative Extension Water Resources Program
Funded by the New Jersey Department of Environmental Protection and
the New Jersey Agricultural Experiment Station
April 5, 2011

Upper Cohansey River Watershed Restoration and Protection Plan April 5, 2011
2
Table of Contents INTRODUCTION .......................................................................................................................................................6
PROJECT BACKGROUND AND THE TMDL DEVELOPMENT PROCESS ..........................................................................6WATERSHED DESCRIPTION........................................................................................................................................8
PROBLEM IDENTIFICATION AND ANALYSIS ...............................................................................................21STREAM VISUAL ASSESSMENT PROTOCOL (SVAP ) DATA......................................................................................21
Upper Cohansey River (Subwatersheds C1 – C6) .............................................................................................21Clarks Run (Subwatersheds CL1 and CL2) .......................................................................................................22Foster Run (FR1) ...............................................................................................................................................23Harrow Run (Subwatershed HR1) .....................................................................................................................23
BENTHIC MACROINVERTEBRATES ...........................................................................................................................25WATER QUALITY PARAMETERS ..............................................................................................................................27
Nitrate ................................................................................................................................................................28pH.......................................................................................................................................................................32Total Phosphorus (TP).......................................................................................................................................33Fecal Coliform ...................................................................................................................................................37
SOURCE IDENTIFICATION OF POLLUTANTS OF CONCERN ...................................................................39TOTAL PHOSPHORUS (TP) .......................................................................................................................................40FECAL COLIFORM....................................................................................................................................................43
ADDRESSING POLLUTANTS OF CONCERN ...................................................................................................46IDENTIFICATION OF PRIORITY IMPLEMENTATION EFFORTS .....................................................................................46SCHEDULE FOR IMPLEMENTATION OF MANAGEMENT MEASURES ...........................................................................47
INFORMATION AND EDUCATION COMPONENT .........................................................................................50STORMWATER MANAGEMENT IN YOUR BACKYARD ...............................................................................................50ENVIRONMENTAL STEWARDS PROGRAM.................................................................................................................51NEW JERSEY WATERSHED STEWARDS PROGRAM....................................................................................................52ADDITIONAL EDUCATION PROGRAMS .....................................................................................................................53
Decentralized Wastewater Treatment Outreach and Education........................................................................53Nursery Operations Outreach and Education....................................................................................................54
INTERIM MEASURABLE MILESTONES...........................................................................................................54MONITORING COMPONENT ..............................................................................................................................55REFERENCES ..........................................................................................................................................................56APPENDIX A: PRESENTATION OF PH IN-STREAM CONCENTRATIONS IN GRAPHS ........................58APPENDIX B: IMPLEMENTATION PROJECTS TO ADDRESS KNOWN WATER QUALITY IMPAIRMENTS IN THE UPPER COHANSEY RIVER......................................................................................62APPENDIX C: ENGINEERING PLANS FOR IMPLEMENTATION PROJECTS TO ADDRESS KNOWN WATER QUALITY IMPAIRMENTS IN THE UPPER COHANSEY RIVER ..................................................99APPENDIX D: SOIL, WATER, NUTRIENT AND PESTICIDE AGRICULTURAL MANAGEMENT PRACTICES FOR FIELD NURSERIES IN THE UPPER COHANSEY RIVER WATERSHED.................100APPENDIX E: SOIL, WATER, NUTRIENT AND PESTICIDE AGRICULTURAL MANAGEMENT PRACTICES FOR CONTAINER NURSERIES IN THE UPPER COHANSEY RIVER WATERSHED.....129

Upper Cohansey River Watershed Restoration and Protection Plan April 5, 2011
3
List of Figures Figure 1: The Upper Cohansey River Watershed. ...................................................................................................9
Figure 2: Aerial photographs of Bostwick Lake from 1995 to 2006 showing its conversion to a wetland
(USGS, 1995; NJDEP, 2002b; USDA, 2006)............................................................................................................10
Figure 3: Land uses in the Upper Cohansey River Watershed. ............................................................................12
Figure 4: Land cover types and agricultural land uses in the Upper Cohansey River Watershed. ...................13
Figure 5: Delineated subwatersheds in the Upper Cohansey River Watershed...................................................14
Figure 6: Sewer service areas in the Upper Cohansey River Watershed (Fralinger Engineering, 2007). .........15
Figure 7: River discharge measurements at USGS gauge 01412800.....................................................................16
Figure 8: NJDEP stream classifications for Upper Cohansey River Watershed. ................................................19
Figure 9: Surface water and groundwater dischargers in the Upper Cohansey River Watershed....................20
Figure 10a: Turbid water along Beals Road in subwatershed C5. (Photo: RCE Water Resources Program) .22
Figure 10b: Cloudy water along Seeley Road in subwatershed C1. (Photo: RCE Water Resources Program)22
Figure 10c: Exposed roots showing unstable banks along the Cohansey River...................................................22
(Photo: RCE Water Resources Program)................................................................................................................22
Figure 10d: Leaning and fallen trees indicative of unstable banks in subwatershed C1.....................................22
(Photo: RCE Water Resources Program)................................................................................................................22
Figure 11a: Outfall pipes with turbid water along the Clarks Run. .....................................................................23
(Photo: RCE Water Resources Program)................................................................................................................23
Figure 11b: Exposed stream banks indicative of instability along Clarks Run. ..................................................23
(Photo: RCE Water Resources Program)................................................................................................................23
Figure 12: Benthic macroinvertebrate stations in Upper Cohansey River Watershed. ......................................26
Figure 13: Location of groundwater monitoring wells within the Upper Cohansey River Watershed. ............30
Figure 14: Mean pH levels for RCE monitored stations in Upper Cohansey River Watershed. (Error bars
indicate standard error of the mean.) ......................................................................................................................33
Figure 15: Mean total phosphorus (TP) concentrations for RCE monitored stations in Upper Cohansey River
Watershed. (Error bars indicate standard error of the mean.) ............................................................................34
Figure 16: Comparison of daily total phosphorus (TP) loads per subwatershed under dry and wet conditions.
.....................................................................................................................................................................................35
Figure 17: Geometric mean fecal coliform (FC) concentrations for RCE monitored stations in Upper
Cohansey River Watershed. (Error bars indicate standard error of the mean.) ................................................38
Figure 18: Comparison of daily fecal coliform load by subwatershed under dry and wet conditions. ..............39
Figure 19: Plot of TP versus TSS concentrations at station C1 for wet and dry events. .....................................41
Figure 20: Plot of TP vs. TSS concentrations at station C5 for wet and dry events. ...........................................42
Figure 21: Percent occurrence of human (HuBac) and bovine (BoBac) Bacteroides by subwatershed over 10
sampling events. .........................................................................................................................................................45

Upper Cohansey River Watershed Restoration and Protection Plan April 5, 2011
4
List of TablesTable 1: Percent of land use by subwatershed. .......................................................................................................11
Table 2: SVAP assessment scores for the Upper Cohnsey River Watershed. ......................................................24
Table 3: Benthic macroinvertebrate results for Upper Cohansey River Watershed...........................................27
Table 4: Water quality standards for Upper Cohansey River Watershed (NJDEP, 2009b). Bold items are new
as of publication of the Upper Cohansey River Watershed Restoration and Protection Plan: Data Report (RCE
Water Resources Program, 2009a)...........................................................................................................................31
Table 5: Number of samples that exceed state water quality standards...............................................................32
Table 6: Estimated subwatershed TP loadings from Cohansey SWAT model. ...................................................36
Table 7: Pollutants of concern (marked with an ) for each subwatershed in the Upper Cohansey River
Watershed. .................................................................................................................................................................40
Table 8: Correlation between TP and TSS by monitoring station. .......................................................................41
Table 9: Implementation strategy for water quality improvement projects in the Upper Cohansey River
Watershed. .................................................................................................................................................................48
Table 10: Estimated annual reductions (in kilograms per year; kg/yr) of select pollutants for each
recommended water quality improvement project.................................................................................................49

Upper Cohansey River Watershed Restoration and Protection Plan April 5, 2011
5
AcknowledgementsDevelopment of the Upper Cohansey River Watershed Restoration and Protection Plan
was funded in 2005 by the New Jersey Department of Environmental Protection (NJDEP) (RP
05-079) and in part by the New Jersey Agricultural Experiment Station through the U.S.
Department of Agriculture (USDA).
This document has been produced by the Rutgers Cooperative Extension Water
Resources Program (http://www.water.rutgers.edu/). Principal authors were Steven Yergeau,
Ph.D., Post-Doctoral Associate; Katie A. Giacalone, Program Associate; Christopher C.
Obropta, Ph.D., P.E., Associate Extension Specialist/Associate Professor, Department of
Environmental Sciences; Craig Phelps, Ph.D., Instructor, Department of Environmental
Sciences; Lisa Galloway Evrard, Senior Program Coordinator; Robert J. Miskewitz, Ph.D.,
Assistant Research Professor, Department of Environmental Sciences; and Sean Walsh,
Program Associate.
The Rutgers Cooperative Extension Water Resources Program would also like to thank
Mike Bonham, Watershed Specialist, Cumberland-Salem Conservation District, for his help in
the field and with sampling coordination; and Salvatore Mangiafico, Environmental and
Resource Management Agent, Cumberland and Salem Counties and James R. Johnson,
Cumberland County Agricultural Agent for their assistance with field work and development of
the implementation strategies to improve watershed health.
Upper Cohansey River Watershed Restoration and Protection Plan April 5, 2011
6
Introduction
Project Background and the TMDL Development Process
The purpose of creating this Watershed Restoration and Protection Plan for the Upper
Cohansey River Watershed is to ensure that the valuable uses that this freshwater system has
provided the area in the past continue into the future. These uses include recreational activities
and irrigation for agriculture, along with the ability of the river to provide a healthy ecosystem
for aquatic species and surrounding wildlife. The Rutgers Cooperative Extension (RCE) Water
Resources Program has undertaken the task of performing water quality testing, land
surveillance, geographic information systems (GIS) analyses, and watershed modeling to provide
stakeholders within the Upper Cohansey River Watershed with a Watershed Restoration and
Protection Plan to ensure the quality of the watershed for the future.
To properly manage water quality, a total maximum daily load (TMDL) was developed
based on data collected in the Cohansey River at U.S. Geological Survey (USGS) monitoring
station 01412800 at Seeley Lake (NJDEP, 2003a) to address fecal coliform impairment. TMDLs
are developed by the New Jersey Department of Environmental Protection (NJDEP), and
approval is given by the U.S. Environmental Protection Agency (USEPA). In accordance with
Section 305(b) of the Clean Water Act, New Jersey addresses the overall water quality of the
state’s waters and identifies impaired waterbodies every two years through the development of a
document referred to as the New Jersey Integrated Water Quality Monitoring and Assessment
Report, a.k.a. the “Integrated List” (NJDEP, 2009a). Within this document are sublists that
indicate the presence and level of impairment for each waterbody monitored. The lists are
defined as follows:
Sublist 1 – “Full Attainment” waterbodies are meeting water quality standards and
attaining their designated uses.
Sublist 2 – “Attained” states that a waterbody is attaining some of the designated uses,
and no use is threatened. Furthermore, sublist 2 suggests that data are insufficient to
declare if other uses are being met.
Sublist 3 – “Not Assessed” waterbodies have insufficient data or information available
to support an attainment determination.

Upper Cohansey River Watershed Restoration and Protection Plan April 5, 2011
7
Sublist 4 – “Not Attained” listings are waterbodies where use attainment is threatened
and/or a waterbody is impaired. However, a TMDL will not be required to restore the
waterbody to meet its use designation.
Sublist 4a includes waterbodies that have a TMDL developed and approved by
the USEPA.
Sublist 4b establishes that impaired waters will require pollutant control
measurements taken by local, state, or federal authorities that will result in full
attainment of designated uses.
Sublist 4c states that impairment is not caused by pollutants, but is due to
factors such as in-stream channel condition, flow alteration, or habitat
degradation.
Sublist 5 – “Not Attained” clearly states that water quality standards are not being
attained and a TMDL is required.
According to the 2002 Integrated List (NJDEP, 2002a), the Upper Cohansey River at
Seeley Lake did not attain its designated uses and was therefore listed on Sublist 5 for fecal
coliform and total phosphorus, requiring development of TMDLs. The TMDL for fecal coliform
determined that a 66% reduction in fecal coliform loading to the Cohansey River is needed to
achieve water quality standards (NJDEP, 2003a). The TMDL was developed based on summer
monitoring results (May through September) from 1994-2000. The TMDL further states that the
load duration curve is consistent with storm-driven values of fecal coliform (NJDEP, 2003a).
The TMDL developed for total phosphorus (TP) at this location calls for a relatively high
reduction in phosphorus loading. Using the TP standard for freshwater rivers (0.1 milligrams per
liter, or mg/L), phosphorus reduction is mandated at 52%. However, since the Cohansey River
drains to Sunset Lake, which also has a TP TMDL (NJDEP, 2003b), the applicable lake criterion
of 0.05 mg/L has been used for the TP TMDL, requiring a load reduction of 92% (NJDEP,
2009b). This higher reduction of 92% must be met for the entire lakeshed, which includes
portions of the Upper Cohansey River Watershed that this study is addressing.
The purpose of this plan is to synthesize available data on the Upper Cohansey River
Watershed, including previous studies and the work of the RCE Water Resources Program, and
determine the potential sources and extent of any water quality problems in the Upper Cohansey

Upper Cohansey River Watershed Restoration and Protection Plan April 5, 2011
8
River Watershed. Solutions to these problems will also be discussed with examples of such
solutions for specific areas within the watershed.
Watershed Description
The Cohansey River Watershed above USGS gauge 01412800 (henceforth, the Upper
Cohansey River Watershed) is 31 square miles, includes 32 miles of river and streams, and is
located in Watershed Management Area (WMA) 17 (Figure 1). The Upper Cohansey River
Watershed is comprised of sections of Hopewell, Stow Creek, and Upper Deerfield Townships in
Cumberland County, and Alloway and Upper Pittsgrove Townships in Salem County (Figure 1).
The largest portion of the Upper Cohansey River Watershed is located within Upper Deerfield
Township. Tributaries to the Upper Cohansey River include Clarks Run, Harrow Run,
Parsonage Run and Foster Run and one major surface waterbody, Seeley Lake, is located on the
border of Hopewell and Upper Deerfield Townships (Figure 1). A smaller pond, North Pond, is
located on Parsonage Run. Previously Bostwick Lake was another large surface waterbody
within the watershed until dam failure occurred in 1999. Bostwick Lake, a large man-made lake
used for recreation and irrigation storage, evolved into a wetland after a dam breach (Figure 2).
In 2009, the dam was rebuilt and Bostwick Lake is currently once again a shallow lake (personal
communication with J. Johnson, 3/24/2010).

Upper Cohansey River Watershed Restoration and Protection Plan April 5, 2011
9
Figure 1: The Upper Cohansey River Watershed.

Upper Cohansey River Watershed Restoration and Protection Plan April 5, 2011
10
1995 2002 20061995 2002 2006
Figure 2: Aerial photographs of Bostwick Lake from 1995 to 2006 showing its conversion to a wetland (USGS, 1995; NJDEP, 2002b; USDA, 2006).
The watershed is dominated by agricultural land uses (Figure 3; Figure 4; Table 1).
Based on aerial mapping and visual watershed surveys completed by the RCE Water Resources
Program, agricultural land uses include row crops, field nurseries, sod farms, and container
nurseries. NJDEP land use data (NJDEP, 2007) categorizes agricultural land uses as cropland
and pastureland, orchards/vineyards/nurseries/horticultural areas, confined animal feed
operations, and other agriculture (Figure 4). Forests, urban land uses, and wetlands comprise the
majority of remaining land cover within the Upper Cohansey River Watershed (Figure 3; Figure
4).
Subwatersheds were delineated, based on the ten stations identified for monitoring, using
ESRI ArcHydro (Version 1.1, August 2004) and the 10-meter digital elevation model available
from the NJDEP (Figure 5). The largest of the subwatersheds is FR1 covering 3,708 acres,
which is approximately 60% agriculture and has the highest percent of urban area (14.1%) when
compared to the other subwatersheds (Table 1). FR1 is also one of only three subwatersheds
with industrial land use, stormwater infrastructure, and stormwater detention basins. Also, 17%
(317 acres) of the subwatershed area is serviced by Cumberland County Utilities Authority
(CCUA). This is the largest subwatershed with centralized wastewater treatment in the Upper
Cohansey River Watershed. Watershed-wide, less than 4% of households have centralized
wastewater treatment (Figure 6). According to sewer service area plans, 8% of the Upper
Cohansey River Watershed could be added to centralized sewer systems in the future.

Upper Cohansey River Watershed Restoration and Protection Plan April 5, 2011
11
Table 1: Percent of land use by subwatershed.
Subwatershed
TotalArea
(acres) %
Agriculture% Barren
Land%
Forest%
Urban%
Water%
WetlandC1 1,834 54.9% 0.3% 22.1% 7.9% 2.1% 12.8% C2 1,658 86.7% 0.0% 4.4% 5.9% 0.1% 3.0% C3 1,376 74.9% 0.2% 13.3% 3.2% 0.2% 8.2% C4 2,740 80.3% 1.2% 6.3% 5.8% 0.4% 6.0% C5 2,564 73.5% 0.1% 11.7% 5.1% 0.6% 8.9% C6 1,344 65.3% 0.0% 15.0% 5.6% 0.7% 13.4%
CL1 793 86.3% 0.0% 4.2% 2.1% 0.7% 6.6% CL2 593 83.3% 0.0% 0.6% 3.3% 0.4% 12.4% FR1 3,708 59.6% 2.8% 17.5% 14.1% 0.1% 5.8% HR1 1,187 76.8% 0.5% 6.0% 12.8% 0.1% 3.8%

Upper Cohansey River Watershed Restoration and Protection Plan April 5, 2011
12
Figure 3: Land uses in the Upper Cohansey River Watershed.

Upper Cohansey River Watershed Restoration and Protection Plan April 5, 2011
13
Agriculture Land Uses
72.1%
25.8%
0.2%
1.9%
Cropland andPastureland
Orchards/ Vineyards/Nurseries/ HorticulturalAreas
Confined FeedingOperations
Other Agriculture
2002 Land Cover
72.7%
0.8%
11.4%
7.4%
0.5%
7.2%
Agriculture
Barren Land
Forest
Urban
Water
Wetlands
Figure 4: Land cover types and agricultural land uses in the Upper Cohansey River Watershed.

Upper Cohansey River Watershed Restoration and Protection Plan April 5, 2011
14
Figure 5: Delineated subwatersheds in the Upper Cohansey River Watershed.

Upper Cohansey River Watershed Restoration and Protection Plan April 5, 2011
15
Figure 6: Sewer service areas in the Upper Cohansey River Watershed (Fralinger Engineering, 2007).

Upper Cohansey River Watershed Restoration and Protection Plan April 5, 2011
16
Since 1975, USGS has monitored flow at least five times per year on the Cohansey River
at USGS gauge 01412800 (Figure 1). The mean discharge since 1975 is 35.0 cubic feet per
second (cfs); over the past decade, mean discharge has increased slightly to 37.0 cfs (Figure 7).
The Cohansey River tributaries (Clarks Run, Harrow Run, and Parsonage Run) are slow-moving
waterways. Clarks Run is the headwaters to the Cohansey River and exceeds 1 cfs only during
precipitation events. Parsonage Run, monitored below the confluence with Foster Run, carries
the highest volume of all tributaries (averaging 6.9 cfs in dry weather, and 11.1 cfs in wet
weather) and is also the largest subwatershed to the Cohansey River. Flow in Parsonage Run is
limited and controlled in several locations; one area is the crossing at Route 77, where the size of
the culvert is inhibiting flow under the highway. Similarly, Harrow Run has very controlled
flow, largely due to agricultural ditching. Within the HR1 subwatershed, flow from ditches
through field nurseries is routed to the stream. In many cases, these ditches are actively eroding
and transporting sediment to Harrow Run.
0
50
100
150
200
250
300
350
400
450
500
550
Octob
er-1
975
Apr
il-19
77
Octob
er-1
978
Apr
il-19
80
Octob
er-1
981
Apr
il-19
83
Octob
er-1
984
Apr
il-19
86
Octob
er-1
987
Apr
il-19
89
Octob
er-1
990
Apr
il-19
92
Octob
er-1
993
Apr
il-19
95
Oct
ober
-199
6
Apr
il-19
98
Octob
er-1
999
Apr
il-20
01
Octob
er-2
002
Apr
il-20
04
Octob
er-2
005
Apr
il-20
07
Date
Dis
char
ge (c
fs)
Tropical Storm Gaston
Winter storm mix
High flows possibly due to blizzard
Figure 7: River discharge measurements at USGS gauge 01412800.

Upper Cohansey River Watershed Restoration and Protection Plan April 5, 2011
17
The NJDEP classifies waters within the state to properly manage their uses and quality.
Almost all waters within the Upper Cohansey River Watershed are classified as FW2-NT/SE1,
except a small stretch of Clarks Run, which is classified as FW2-NT (Figure 8). FW2-NT waters
are freshwater systems that are subjected to man-made wastewater discharges or increases in
runoff from anthropogenic activities and are not used for either the production or maintenance of
trout populations (NJDEP, 2009b). FW2-NT/SE1 waters are located at a salt water and
freshwater interface and combine the FW2-NT designation and the saline estuarine (SE)
designation. The division between these two designations is determined through salinity
measurements. Salinity below 3.5 parts per thousand (ppt) are governed by the FW2-NT
classification and above 3.5 ppt are classified SE1 (NJDEP, 2009b). The waterways within this
portion of the Upper Cohansey River Watershed have salinity concentrations less than 3.5 ppt, so
all waters are considered FW2-NT.
There are five New Jersey Pollution Discharge Elimination System (NJPDES) permits
allowing discharges in the project watershed (Figure 9). All five are located within the Foster
Run subwatershed (FR1) (Figure 9). Four of these belong to Clement Pappas Company, Inc.,
and one permit belongs to Seabrook Brothers and Sons. All five are minor industrial permits and
discharge to Foster Run via a storm sewer system or an unnamed tributary or ditch. The
Seabrook Brothers and Sons NJPDES permit (NJ0033006) is categorized as stormwater and
thermal surface water discharge. The permit requires monitoring and reporting for temperature,
chemical oxygen demand (COD), total suspended solids (TSS), total petroleum hydrocarbons
(TPHC), pH, and flow in conduit or through the treatment plant. Between March 2001 and
December 2007, there were 27 monitoring dates reported to the NJDEP. On only one occasion
was the water quality standard for pH met at the end of pipe. On all other occasions, pH was less
than 6.5 standard units (SU) and almost consistently less than 5 SU. Note that for that time
period, the water quality standard for pH was 6.5 – 8.5 SU. As of November 2009, the pH water
quality standard for this portion of the Cohansey River has been modified to 4.5 – 7.5 SU.
Seabrook Farms also has a discharge to groundwater permit (NJ0087602) and spray
irrigation for crops (Figure 9). This permit mandates reporting for nutrients, ammonia-nitrogen
(NH3-N), total dissolved solids (TDS), flow, pH, sodium chloride, and TPHC. As reported
according to permit requirements, pH ranged from 3.5 - 7.5 SU. However, upgradient
monitoring wells show low pH values comparable to those downgradient of the discharge. It can

Upper Cohansey River Watershed Restoration and Protection Plan April 5, 2011
18
be assumed that the pH values are either background or are related to the combined subsurface
flows from treated effluent and agricultural activities present on adjacent properties (personal
communication with J. Gray, 2/20/2008).
The four NJPDES permits from Clement Pappas Company, Inc. (NJ0062731) are also
categorized as stormwater and thermal surface water discharges. This discharger is permitted
and monitors for TSS, hydrocarbons, pH, chlorine-produced oxidants, COD, temperature, and
flow in conduit or through the treatment plant. In February 2005, Pipe 002 from this facility
exceeded TSS surface water quality standards for Foster Run (i.e., the effluent result was 43.0
mg/L, and the standard is 40.0 mg/L).

Upper Cohansey River Watershed Restoration and Protection Plan April 5, 2011
19
Figure 8: NJDEP stream classifications for Upper Cohansey River Watershed.

Upper Cohansey River Watershed Restoration and Protection Plan April 5, 2011
20
Figure 9: Surface water and groundwater dischargers in the Upper Cohansey River Watershed.

Upper Cohansey River Watershed Restoration and Protection Plan April 5, 2011
21
Problem Identification and Analysis This report contains summaries and analyses of water quality data, stream assessments,
and macroinvertebrate sampling conducted in the Upper Cohansey River Watershed. For a
complete description of sampling programs and methods, see the Upper Cohansey River
Watershed Restoration and Protection Plan: Data Report (RCE Water Resources Program,
2009a).
Stream Visual Assessment Protocol (SVAP) Data
The USDA SVAP methodology was followed to gain an understanding of potential
physical changes in the Upper Cohansey River Watershed’s rivers and streams that may indicate
water quality problems. The protocol provides an outline to quantitatively score in-stream and
riparian qualities. Such assessed qualities include water appearance, channel condition, canopy
cover, and riparian health.
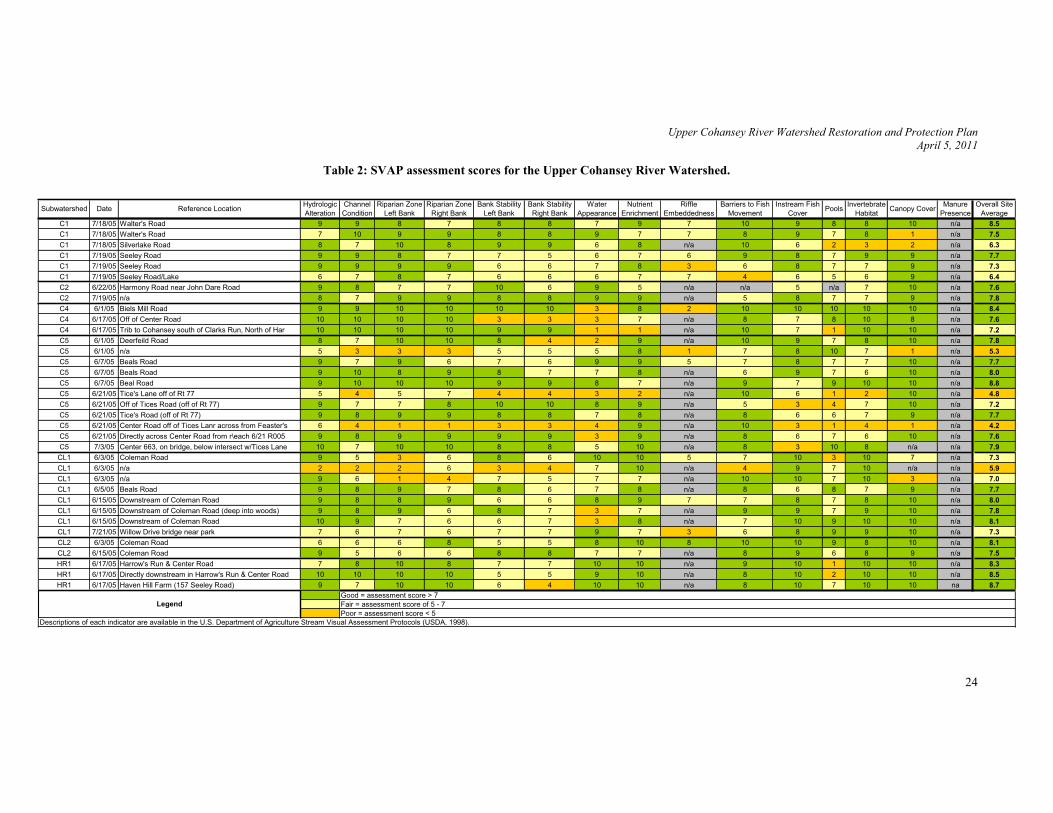
Thirty-five stream reaches were evaluated in the Upper Cohansey River Watershed
(Table 2). While only seven of the ten subwatersheds within the Upper Cohansey River
Watershed were evaluated, SVAP assessment results provide an overall appraisal of watershed
health. The overall mean SVAP assessment score for all thirty-five reaches was 7.41, a resulting
watershed quality of “good.” Assessment scores ranged from 4.20 (“poor”) to 8.80 (“good”)
(Table 2). There were no signs of manure presence, livestock access to streams, or manure
storage facilities within the floodplain (Table 2). Canopy cover was scored at almost every reach
and was the highest scored assessment element with an average score of 8.36 (Table 2). Other
than riffle embeddedness, which is an optional assessment element (i.e., it is scored only if
present), pools were the lowest scoring assessment element. Other assessments with low scores
were water appearance and bank stability (Table 2). None of the assessed stream reaches
received a score of “excellent” (Table 2).
Upper Cohansey River (Subwatersheds C1 – C6)
Many of the stream reaches with an overall score of “poor” (site average < 6.0) are
located in subwatershed C5 (Table 2; Figure 5). Some of the lowest scored assessments were for
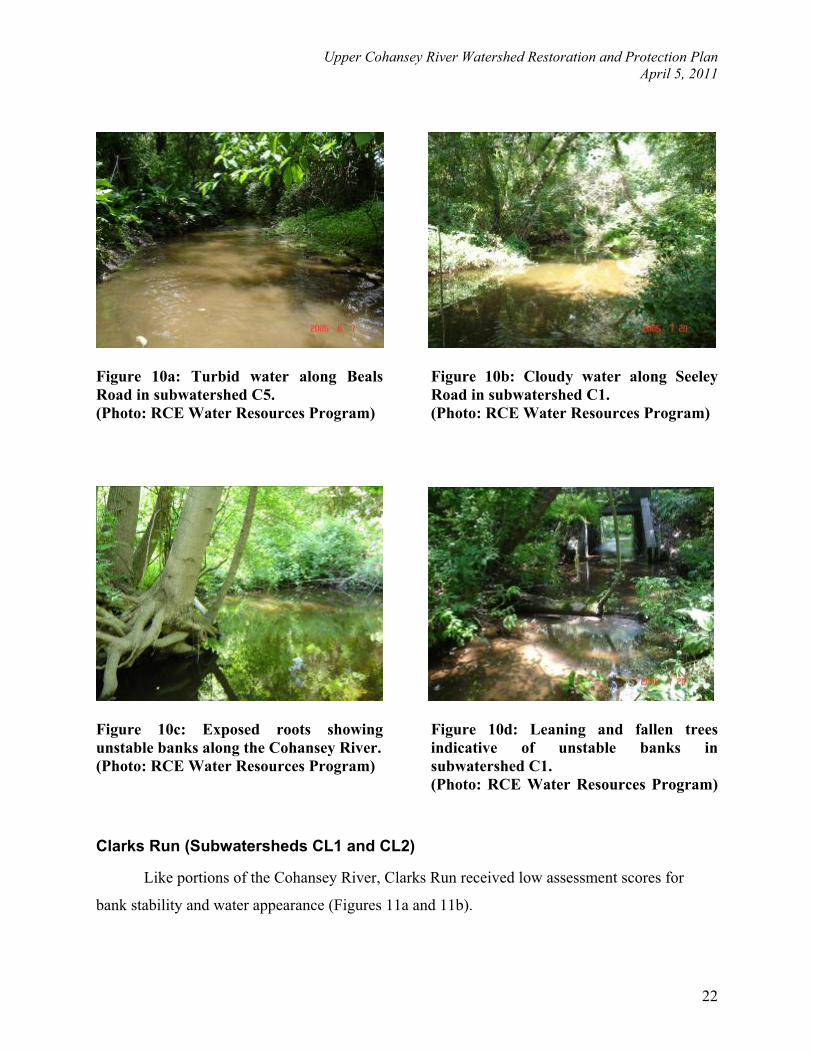
water appearance (Figures 10a and 10b) and bank stability (Figures 10c and 10d) along the river.
Upper Cohansey River Watershed Restoration and Protection Plan April 5, 2011
22
Figure 10a: Turbid water along Beals Road in subwatershed C5. (Photo: RCE Water Resources Program)
Figure 10b: Cloudy water along Seeley Road in subwatershed C1. (Photo: RCE Water Resources Program)
Figure 10c: Exposed roots showing unstable banks along the Cohansey River. (Photo: RCE Water Resources Program)
Figure 10d: Leaning and fallen trees indicative of unstable banks in subwatershed C1. (Photo: RCE Water Resources Program)
Clarks Run (Subwatersheds CL1 and CL2)
Like portions of the Cohansey River, Clarks Run received low assessment scores for
bank stability and water appearance (Figures 11a and 11b).

Upper Cohansey River Watershed Restoration and Protection Plan April 5, 2011
23
Figure 11a: Outfall pipes with turbid water along the Clarks Run. (Photo: RCE Water Resources Program)
Figure 11b: Exposed stream banks indicative of instability along Clarks Run. (Photo: RCE Water Resources Program)
Foster Run (FR1)
No SVAP assessments were performed within the Foster Run subwatershed during this
study.
Harrow Run (Subwatershed HR1)
The Harrow Run subwatershed was assessed as “good” along three stream reaches (Table
2).
Upper Cohansey River Watershed Restoration and Protection Plan April 5, 2011
24
Table 2: SVAP assessment scores for the Upper Cohansey River Watershed.
Subwatershed Date Reference LocationHydrologic
Alteration
Channel
Condition
Riparian Zone
Left Bank
Riparian Zone
Right Bank
Bank Stability
Left Bank
Bank Stability
Right Bank
Water
Appearance
Nutrient
Enrichment
Riffle
Embeddedness
Barriers to Fish
Movement
Instream Fish
CoverPools
Invertebrate
HabitatCanopy Cover
Manure
Presence
Overall Site
Average
C1 7/18/05 Walter's Road 9 9 8 7 8 8 7 9 7 10 9 8 8 10 n/a 8.5C1 7/18/05 Walter's Road 7 10 9 9 8 8 9 7 7 8 9 7 8 1 n/a 7.5C1 7/18/05 Silverlake Road 8 7 10 8 9 9 6 8 n/a 10 6 2 3 2 n/a 6.3C1 7/19/05 Seeley Road 9 9 8 7 7 5 6 7 6 9 8 7 9 9 n/a 7.7C1 7/19/05 Seeley Road 9 9 9 9 6 6 7 8 3 6 8 7 7 9 n/a 7.3C1 7/19/05 Seeley Road/Lake 6 7 8 7 6 6 6 7 7 4 6 5 6 9 n/a 6.4C2 6/22/05 Harmony Road near John Dare Road 9 8 7 7 10 6 9 5 n/a n/a 5 n/a 7 10 n/a 7.6C2 7/19/05 n/a 8 7 9 9 8 8 9 9 n/a 5 8 7 7 9 n/a 7.8C4 6/1/05 Biels Mill Road 9 9 10 10 10 10 3 8 2 10 10 10 10 10 n/a 8.4C4 6/17/05 Off of Center Road 10 10 10 10 3 3 3 7 n/a 8 7 8 10 8 n/a 7.6C4 6/17/05 Trib to Cohansey south of Clarks Run, North of Har 10 10 10 10 9 9 1 1 n/a 10 7 1 10 10 n/a 7.2C5 6/1/05 Deerfeild Road 8 7 10 10 8 4 2 9 n/a 10 9 7 8 10 n/a 7.8C5 6/1/05 n/a 5 3 3 3 5 5 5 8 1 7 8 10 7 1 n/a 5.3C5 6/7/05 Beals Road 9 7 9 6 7 6 9 9 5 7 8 7 7 10 n/a 7.7C5 6/7/05 Beals Road 9 10 8 9 8 7 7 8 n/a 6 9 7 6 10 n/a 8.0C5 6/7/05 Beal Road 9 10 10 10 9 9 8 7 n/a 9 7 9 10 10 n/a 8.8C5 6/21/05 Tice's Lane off of Rt 77 5 4 5 7 4 4 3 2 n/a 10 6 1 2 10 n/a 4.8C5 6/21/05 Off of Tices Road (off of Rt 77) 9 7 7 8 10 10 8 9 n/a 5 3 4 7 10 n/a 7.2C5 6/21/05 Tice's Road (off of Rt 77) 9 8 9 9 8 8 7 8 n/a 8 6 6 7 9 n/a 7.7C5 6/21/05 Center Road off of Tices Lanr across from Feaster's 6 4 1 1 3 3 4 9 n/a 10 3 1 4 1 n/a 4.2C5 6/21/05 Directly across Center Road from r\each 6/21 R005 9 8 9 9 9 9 3 9 n/a 8 6 7 6 10 n/a 7.6C5 7/3/05 Center 663, on bridge, below intersect w/Tices Lane 10 7 10 10 8 8 5 10 n/a 8 3 10 8 n/a n/a 7.9CL1 6/3/05 Coleman Road 9 5 3 6 8 6 10 10 5 7 10 3 10 7 n/a 7.3CL1 6/3/05 n/a 2 2 2 6 3 4 7 10 n/a 4 9 7 10 n/a n/a 5.9CL1 6/3/05 n/a 9 6 1 4 7 5 7 7 n/a 10 10 7 10 3 n/a 7.0CL1 6/5/05 Beals Road 9 8 9 7 8 6 7 8 n/a 8 6 8 7 9 n/a 7.7CL1 6/15/05 Downstream of Coleman Road 9 8 8 9 6 6 8 9 7 7 8 7 8 10 n/a 8.0CL1 6/15/05 Downstream of Coleman Road (deep into woods) 9 8 9 6 8 7 3 7 n/a 9 9 7 9 10 n/a 7.8CL1 6/15/05 Downstream of Coleman Road 10 9 7 6 6 7 3 8 n/a 7 10 9 10 10 n/a 8.1CL1 7/21/05 Willow Drive bridge near park 7 6 7 6 7 7 9 7 3 6 8 9 9 10 n/a 7.3CL2 6/3/05 Coleman Road 6 6 6 8 5 5 8 10 8 10 10 9 8 10 n/a 8.1CL2 6/15/05 Coleman Road 9 5 6 6 8 8 7 7 n/a 8 9 6 8 9 n/a 7.5HR1 6/17/05 Harrow's Run & Center Road 7 8 10 8 7 7 10 10 n/a 9 10 1 10 10 n/a 8.3HR1 6/17/05 Directly downstream in Harrow's Run & Center Road 10 10 10 10 5 5 9 10 n/a 8 10 2 10 10 n/a 8.5HR1 6/17/05 Haven Hill Farm (157 Seeley Road) 9 7 10 10 6 4 10 10 n/a 8 10 7 10 10 na 8.7
Descriptions of each indicator are available in the U.S. Department of Agriculture Stream Visual Assessment Protocols (USDA, 1998).
Good = assessment score > 7
Fair = assessment score of 5 - 7
Poor = assessment score < 5
Legend

Upper Cohansey River Watershed Restoration and Protection Plan April 5, 2011
25
Benthic Macroinvertebrates
The NJDEP Ambient Biological Monitoring Network (AMNET) maintains four benthic
macroinvertebrate stations in the Upper Cohansey River Watershed (Figure 12). These stations
were monitored in 1995, 2000, and 2006 (Table 3). To supplement this data, the RCE Water
Resources Program sampled four stations in the fall of 2006 (Figure 12; Table 3). Full details on
methods for each can be found in the data report (RCE Water Resources Program, 2009a).
The AMNET macroinvertebrate results show moderate impairments to biological
communities within the watershed (Table 3). This is also seen in the RCE collected
macroinvertebrate data (Table 3). The types of organisms found, or the lack thereof, indicate
that possible chemical perturbations are occurring within the system, and/or the benthic
community may be subject to physical or habitat constraints. The habitat assessment revealed
suboptimal habitat conditions, which may explain the observed impaired benthic
macroinvertebrate community (Table 3). Habitat quality may be low due to physical alterations
as observed during SVAP assessments conducted throughout the watershed (Table 2). The
overall quality of the streams was assessed as “good” but individual SVAP element scores
ranged from “fair” to “good” (Table 2). The bank stability scores obtained during SVAP
assessments may signal increased erosion rates in the Upper Cohansey River Watershed which
may cause filling in of habitat necessary for macroinvertebrates.

Upper Cohansey River Watershed Restoration and Protection Plan April 5, 2011
26
Figure 12: Benthic macroinvertebrate stations in Upper Cohansey River Watershed.

Upper Cohansey River Watershed Restoration and Protection Plan April 5, 2011
27
Table 3: Benthic macroinvertebrate results for Upper Cohansey River Watershed.
Agency Station Date Sampled Impairment Status Habitat Analysis NJDEP AN0709 10/19/1995 Non-Impaired N/A NJDEP AN0709 10/17/2000 Moderately Impaired Optimal/ExcellentNJDEP AN0709 10/24/2006 Non-Impaired Suboptimal/Good NJDEP AN0710 10/19/1995 Moderately Impaired N/A NJDEP AN0710 10/17/2000 Moderately Impaired Suboptimal/Good NJDEP AN0710 10/24/2006 Moderately Impaired Suboptimal/Good NJDEP AN0711 10/19/1995 Severely Impaired N/A NJDEP AN0711 10/17/2000 Severely Impaired Suboptimal/Good NJDEP AN0711 10/24/2006 Moderately Impaired Suboptimal/Good NJDEP AN0712 9/26/1995 Moderately Impaired N/A NJDEP AN0712 9/19/2000 Moderately Impaired Optimal/ExcellentNJDEP AN0712 11/28/2006 Moderately Impaired Suboptimal/Good
RCE Water Resources C1 10/24/2006 Moderately Impaired Suboptimal/Good RCE Water Resources FR1 10/24/2006 Severely Impaired Suboptimal/Good RCE Water Resources C3 10/25/2006 Severely Impaired Suboptimal/Good RCE Water Resources C6 10/25/2006 Moderately Impaired Suboptimal/Good
Water Quality Parameters
To identify the cause(s) of impairment observed through both the SVAP assessment
results and biological sampling, water quality monitoring began in June 2006. As per the
NJDEP-approved Quality Assurance Project Plan (QAPP), in situ measurements of pH,
dissolved oxygen (DO), and temperature were collected. Stream velocity and depth were
measured across stream transects at each sampling station. Using this information, flow (Q) was
calculated for each event where access to the stream was deemed safe. Water samples were
collected and analyzed by QC Laboratories in Vineland, New Jersey (NJDEP Certified
Laboratory #PA166) for TP, dissolved orthophosphate phosphorus, ammonia-nitrogen, total
Kjeldahl nitrogen (TKN), nitrate-nitrogen, nitrite-nitrogen, total suspended solids (TSS), and
fecal coliform.
Ten water quality stations (Figure 5) were monitored for three different types of sampling
events. Regular monitoring, which included analysis for all parameters, occurred from June 14,
2006 through November 15, 2006. These events were monitored for all in situ parameters,
velocity and depth, and TP, dissolved orthophosphate phosphorus, ammonia-nitrogen, TKN,
nitrate-nitrogen, nitrite-nitrogen, TSS, and fecal coliform. Bacteria-only monitoring was

Upper Cohansey River Watershed Restoration and Protection Plan April 5, 2011
28
conducted in the summer months of July through September 2006. This entailed collecting three
additional samples per month for fecal coliform analysis, as well as in situ parameters, and
velocity and depth to calculate flow. In addition, water samples from three storm events were
collected from September through November 2006. Four samples were collected over the course
of each storm event for all parameters at all ten monitoring locations.
Since the release of the Upper Cohansey River Watershed Restoration and Protection
Plan: Data Report (RCE Water Resources Program, 2009a), the water quality standard for pH in
the Upper Cohansey River has been modified. It was previously required that pH levels be
between 6.5 and 8.5 SU, with the new standard set so that pH levels should be between 4.5 and
7.5 SU (NJDEP, 2009b; Table 4). Updated pH graphs are presented in Appendix A. All other
water quality standards previously reported are unchanged (Table 4).
The NJDEP’s Integrated Water Quality Monitoring and Assessment Methods advises that
if water quality results exceed the water quality criteria twice within a five-year period, then the
waterway’s quality may be compromised (NJDEP, 2009c). NJDEP has further stated that a
minimum of eight samples need to be collected to confirm the quality of waters, with quarterly
samples over a two-year period being ideal (NJDEP, 2005; NJDEP, 2009c). Therefore, if a
waterbody has a minimum of eight samples collected and samples exceed the water quality
criteria for a certain parameter twice, the waterbody is considered “impaired” for that parameter.
By applying this rule to the Upper Cohansey River Watershed water quality data, it is possible to
identify which stations are impaired for each parameter that has been identified as a concern for
this project (i.e., pH, TP, and fecal coliform). The number of samples exceeding state water
quality standards is given in Table 5.
Nitrate While the focus of water quality issues in this plan is on fecal coliform and phosphorus
impacts due to the currently established TMDLs, other parameters were monitored as part of this
study. Nitrate concentrations at the ten monitoring stations were below the water quality
standard (10 mg/L) except for station C2. Nine of the twelve samples analyzed at this site were
above the water quality standard. Potential sources of nitrate include fertilizers, animal feedlots,
septic systems, and animal waste. Many of the implementation projects recommended for the
Upper Cohansey River Watershed Restoration and Protection Plan April 5, 2011
29
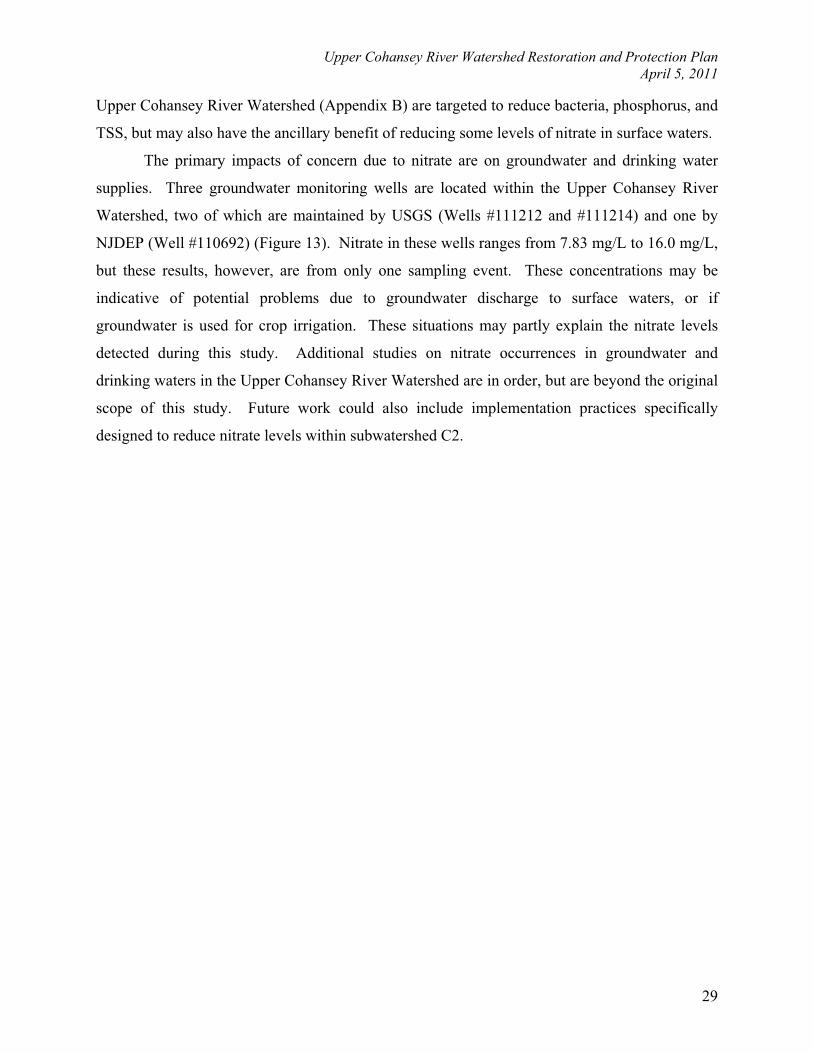
Upper Cohansey River Watershed (Appendix B) are targeted to reduce bacteria, phosphorus, and
TSS, but may also have the ancillary benefit of reducing some levels of nitrate in surface waters.
The primary impacts of concern due to nitrate are on groundwater and drinking water
supplies. Three groundwater monitoring wells are located within the Upper Cohansey River
Watershed, two of which are maintained by USGS (Wells #111212 and #111214) and one by
NJDEP (Well #110692) (Figure 13). Nitrate in these wells ranges from 7.83 mg/L to 16.0 mg/L,
but these results, however, are from only one sampling event. These concentrations may be
indicative of potential problems due to groundwater discharge to surface waters, or if
groundwater is used for crop irrigation. These situations may partly explain the nitrate levels
detected during this study. Additional studies on nitrate occurrences in groundwater and
drinking waters in the Upper Cohansey River Watershed are in order, but are beyond the original
scope of this study. Future work could also include implementation practices specifically
designed to reduce nitrate levels within subwatershed C2.

Upper Cohansey River Watershed Restoration and Protection Plan April 5, 2011
30
Figure 13: Location of groundwater monitoring wells within the Upper Cohansey River Watershed.

Upper Cohansey River Watershed Restoration and Protection Plan April 5, 2011
31
Table 4: Water quality standards for Upper Cohansey River Watershed (NJDEP, 2009b). Bold items are new as of publication of the Upper Cohansey River Watershed Restoration
and Protection Plan: Data Report (RCE Water Resources Program, 2009a).
SubstanceSurfaceWater
ClassificationCriteria
pH (SU) FW2 4.5 – 7.5
FW2 Streams
Except as necessary to satisfy the more stringent criteria in accordance with "Lakes" (above) or where watershed or site-specific criteria are developed pursuant to N.J.A.C. 7:9B-1.5(g)3, phosphorus as total P shall not exceed 0.1 in any stream, unless it can be demonstrated that total P is not a limiting nutrient and will not otherwise render the waters unsuitable for the designated uses.
TP (mg/L)
FW2 Lakes
Phosphorus as total P shall not exceed 0.05 in any lake, pond, or reservoir, or in a tributary at the point where it enters such bodies of water, except where watershed or site-specific criteria are developed pursuant to N.J.A.C. 7:9B-1.5(g)3.
TSS (mg/L) FW2-NT Non-filterable residue/suspended solids shall not exceed 40.
Bacterial counts (col/100 mL):
Fecal Coliforms FW2
Shall not exceed geometric average of 200/100 mL, nor should more than 10% of the total samples taken during any 30-day period exceed 400/100 mL.

Upper Cohansey River Watershed Restoration and Protection Plan April 5, 2011
32
Table 5: Number of samples that exceed state water quality standards.
Select Monitoring Parameters
Station pH* TP TSS Fecalcoliform**
C1 2 10 1 5 C2 0 5 2 5 FR1 0 13 0 9 HR1 0 6 2 9 C3 0 7 1 5 C4 0 8 1 3 C5 0 8 1 8 CL1 0 9 1 2 C6 0 6 0 6 CL2 0 7 0 7
*Based upon the new standard of 4.5 – 7.5 S.U. established in November 2009 (NJDEP, 2009b). **For fecal coliform, the number of samples higher than the 400 col/100ml standard was calculated.
pH With modification of the pH water quality standard for the Upper Cohansey River, many
of the exceedances reported in the Upper Cohansey River Watershed Restoration and Protection
Plan: Data Report (RCE Water Resources Program, 2009a) are no longer evident. Mean pH
levels for all stations were within the state’s water quality standard (Figure 14). The data
indicate two exceedances at one location, station C1 (Table 5). This station is located on the
Cohansey River at USGS 01412800 at Seeley Lake (also AMNET station AN0712) (Figure 1;
Figure 5). While two exceedances would normally indicate impaired waters for this parameter,
pH levels exceeded the water quality with far less frequency than other pollutants of concern
(i.e., TP and fecal coliforms) (Table 5).
The standard error of the mean is indicated on data graphs by error bars (Figure 14;
Figure 15; Figure 17). The standard error of the mean is an estimate of the amount that an
obtained mean may be expected to differ by chance from the true mean. The general rule of
thumb is that the smaller the error of a sample set, the less spread out the data is from the mean
sample size. Also, the larger the error, the more spread out the samples are distributed from the
mean. The standard error on pH levels (Figure 14) was small and ranged from 0.04 to 0.15.

Upper Cohansey River Watershed Restoration and Protection Plan April 5, 2011
33
4.0
4.5
5.0
5.5
6.0
6.5
7.0
7.5
8.0
8.5
9.0
C1 C2 C3 C4 C5 C6 CL1 CL2 FR1 HR1
Sampling Station
pH (S
U)
Lower pH Standard = 4.5 S.U.
Upper pH Standard = 7.5 S.U.
Figure 14: Mean pH levels for RCE monitored stations in Upper Cohansey River Watershed. (Error bars indicate standard error of the mean.)
Total Phosphorus (TP)
All water quality monitoring stations exceeded the 0.05 mg/L standard more than twice
during the sampling season (Table 5). This indicates elevated TP levels are causing impairments
throughout the watershed. Stations FR1 (Parsonage Run) and C1 exceeded the 0.05 mg/L
standard most frequently (on 13 and 10 occasions, respectively) (Table 5). Stations C2, which is
an unnamed tributary to the Cohansey River, and CL2 in the headwaters of Clarks Run (Figure
5) had the highest single concentrations of TP over the course of the monitoring period (1.21
mg/L and 0.92 mg/L, respectively). Both occurred on June 28, 2006, during a precipitation event
of 1.59 inches of rain. Results from station C6 were significantly higher than usual on August
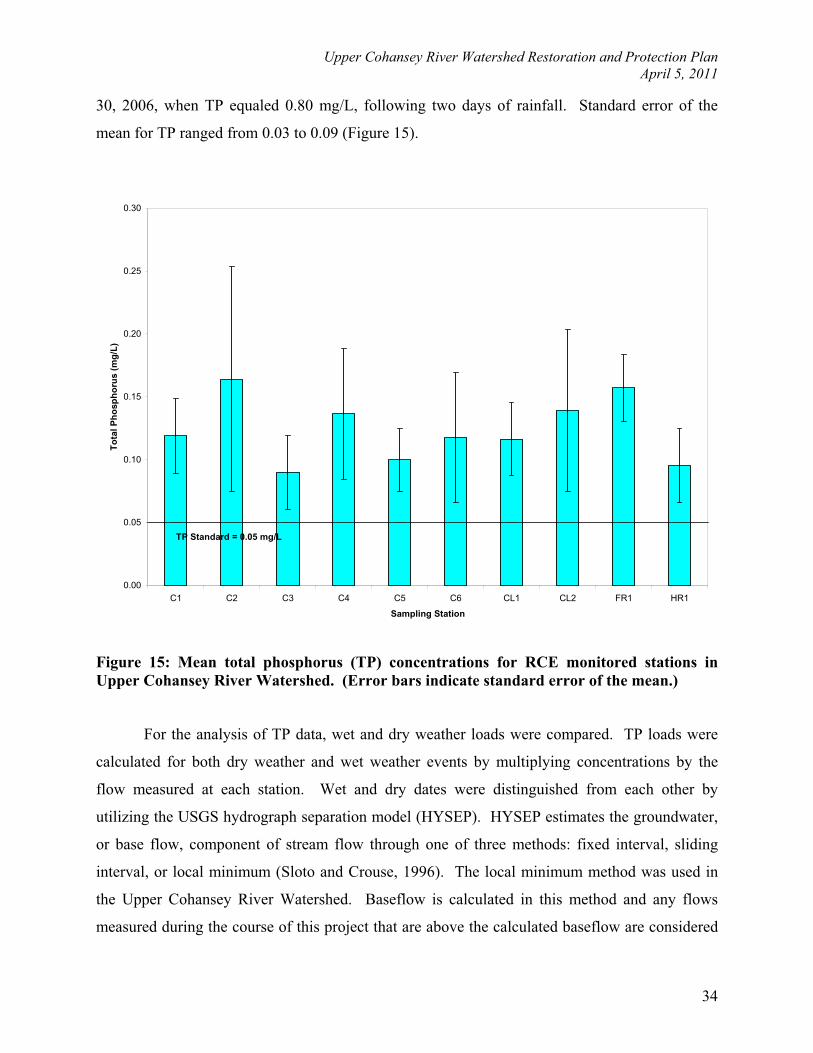
Upper Cohansey River Watershed Restoration and Protection Plan April 5, 2011
34
30, 2006, when TP equaled 0.80 mg/L, following two days of rainfall. Standard error of the
mean for TP ranged from 0.03 to 0.09 (Figure 15).
0.00
0.05
0.10
0.15
0.20
0.25
0.30
C1 C2 C3 C4 C5 C6 CL1 CL2 FR1 HR1
Sampling Station
Tota
l Pho
spho
rus
(mg/
L)
TP Standard = 0.05 mg/L
Figure 15: Mean total phosphorus (TP) concentrations for RCE monitored stations in Upper Cohansey River Watershed. (Error bars indicate standard error of the mean.)
For the analysis of TP data, wet and dry weather loads were compared. TP loads were
calculated for both dry weather and wet weather events by multiplying concentrations by the
flow measured at each station. Wet and dry dates were distinguished from each other by
utilizing the USGS hydrograph separation model (HYSEP). HYSEP estimates the groundwater,
or base flow, component of stream flow through one of three methods: fixed interval, sliding
interval, or local minimum (Sloto and Crouse, 1996). The local minimum method was used in
the Upper Cohansey River Watershed. Baseflow is calculated in this method and any flows
measured during the course of this project that are above the calculated baseflow are considered

Upper Cohansey River Watershed Restoration and Protection Plan April 5, 2011
35
“wet” events, while those below are considered “dry” events (Sloto and Crouse, 1996). In
addition, downstream stations had upstream station loads subtracted from their total load in order
to determine the contribution of individual subwatersheds. In some cases, this can lead to
negative loads at a station due to there being a larger load upstream of that station. By using
these methods, subwatersheds FR1 and C1 were found to have the largest mean TP loads in the
Upper Cohansey River Watershed for both dry and wet weather events (Figure 16). These
subwatersheds have the greatest impact in regards to TP results at the most downstream
monitoring point for the project area (station C1; Figure 5) and may be contributing to the high
concentrations measured during monitoring. High nutrient loading from the large drainage area
to FR1 and in the immediate subwatershed to C1 are priorities for water quality management.
-1.0
0.0
1.0
2.0
3.0
4.0
5.0
6.0
7.0
C1 C2 C3 C4 C5 C6 CL1 CL2 FR1 HR1
Subwatershed
Tota
l Pho
spho
rus
Load
(kg/
day)
Dry Wet
Figure 16: Comparison of daily total phosphorus (TP) loads per subwatershed under dry and wet conditions.

Upper Cohansey River Watershed Restoration and Protection Plan April 5, 2011
36
TP loads were also estimated using the Soil and Water Assessment Tool (SWAT) to
model nutrient dynamics in the Upper Cohansey River Watershed (RCE Water Resources
Program, 2009b). TP loads were calculated from each subwatershed on an annual basis for 2005
and 2006, and then normalized by subwatershed area to compare subwatershed loading rates
(Table 6). These rates were compared to areal loading coefficients used by the NJDEP for TP.
Areal loading coefficients for agricultural land uses, low density residential, and natural lands are
0.60, 0.30, and 0.05 kg/acre/year, respectively (NJDEP, 2004). Normalized total annual TP
loading rates predicted using the SWAT model for 2005 (1.70 kg/acre) and 2006 (0.85 kg/acre)
(Table 6) are higher than the NJDEP coefficient for agriculture (0.60 kg/acre/year). This may be
due to higher soil erodibility, high watershed slopes, and different agricultural practices used in
the Upper Cohansey River Watershed as opposed to those watersheds used to develop the
NJDEP coefficients. If these higher values are representative of conditions in the Upper
Cohansey River Watershed, the need for water quality improvement is reinforced in this project.
Under existing conditions, the subwatersheds that produced the largest TP loads were C4
and C2 in 2005 and C4 and C1 in 2006 (Table 6). When normalized by area, the largest loading
occurred in subwatersheds C2 and C6 in both 2005 and 2006 (Table 6).
Table 6: Estimated subwatershed TP loadings from Cohansey SWAT model.
Total Phosphorus (kg) Total Phosphorus (kg/acre) Subwatershed 2005 2006 2005 2006
CL1 435 235 1.83 0.99 CL2 524 316 1.70 1.02 C6 1,158 620 2.29 1.23 C5 777 388 1.60 0.80 C4 2,964 1,189 1.84 0.74 C3 715 277 1.28 0.50
HR1 258 131 0.54 0.27 FR1 944 637 0.81 0.55 C2 1,999 789 3.12 1.23 C1 1,493 888 2.03 1.21
Watershed Total 11,267 5,470 1.70 0.85

Upper Cohansey River Watershed Restoration and Protection Plan April 5, 2011
37
Fecal Coliform
The former surface water quality standard for bacterial quality of FW2 surface waters
was that the geometric mean of samples not exceed 200 counts of organisms (colonies) per
100mL (col/100mL). Since initiation of this project, the indicator organism has changed for
freshwaters in New Jersey to the use of Escherichia coli (E. coli). For this report, however, the
former standard for fecal coliform will be applied to data collected in the Upper Cohansey River
Watershed since it is a fecal coliform TMDL that is the driver of this effort (Table 4). In the
Upper Cohansey River Watershed, five stations exceeded a geometric mean of 200 col/100 mL
over the course of data collection with maximum fecal coliform concentrations exceeding 600
col/100 mL at least once at all stations throughout sampling (Figure 17; Table 5). The geometric
mean of fecal coliform concentrations was above the standard at stations C5, C6, CL2, FR1 and
HR1 (Figure 17). In addition, all stations exceeded the 400 col/100 mL standard at least once
during the sampling season (Table 5). Station FR1 had the highest fecal coliform count across
all stations over all events (8,000 col/100 mL). Standard error of the mean was large, and ranged
from 41.70 to 360.25 (Figure 17), indicating large variability in the fecal coliform levels.

Upper Cohansey River Watershed Restoration and Protection Plan April 5, 2011
38
-200
-100
0
100
200
300
400
500
600
700
C1 C2 C3 C4 C5 C6 CL1 CL2 FR1 HR1
Sampling Station
Feca
l Col
iform
s (c
ol/1
00 m
L)
Fecal coliform Standard = 200 Col/100 mL
Figure 17: Geometric mean fecal coliform (FC) concentrations for RCE monitored stations in Upper Cohansey River Watershed. (Error bars indicate standard error of the mean.)
As stated in the TMDL, occurrences of high fecal bacteria in surface waters are largely
due to storm events (NJDEP, 2003a). Fecal coliform loads were calculated in the same manner
as TP loads and were also compared between wet and dry events. Fecal coliform loads were
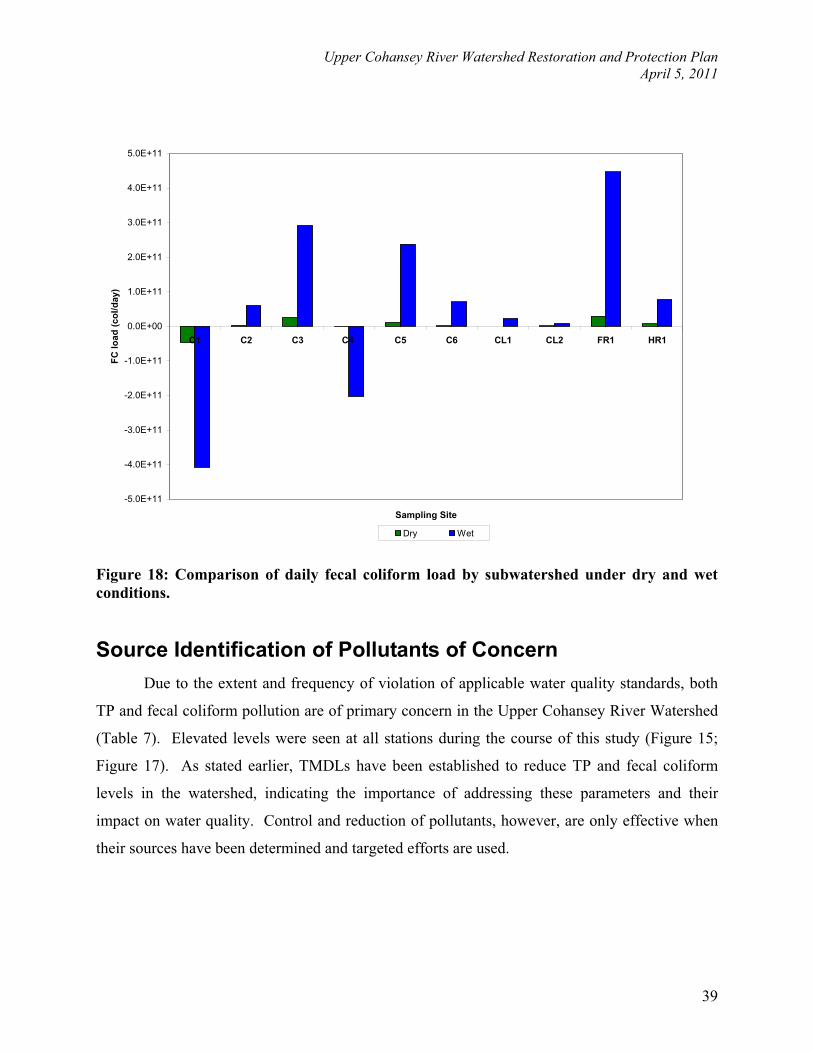
greater in almost every subwatershed during sampling events when stream volume was greater
than baseflow (wet weather events; Figure 18). Only subwatersheds C1 and C4 had lower
loadings during wet events (Figure 18). Assimilation, predation, or some other loss of FC may
be occurring prior to these locations. The FR1 subwatershed was found to have the greatest
influence on water quality at C1, where the USGS gauge 01412800 is located (Figure 1). The
FR1 subwatershed is a priority for controlling pathogens in the Cohansey River, as are C3 and
C5 subwatersheds, which have a strong impact on the downstream pathogen results in dry and
wet weather (Figure 18).
Upper Cohansey River Watershed Restoration and Protection Plan April 5, 2011
39
-5.0E+11
-4.0E+11
-3.0E+11
-2.0E+11
-1.0E+11
0.0E+00
1.0E+11
2.0E+11
3.0E+11
4.0E+11
5.0E+11
C1 C2 C3 C4 C5 C6 CL1 CL2 FR1 HR1
Sampling Site
FC lo
ad (c
ol/d
ay)
Dry Wet
Figure 18: Comparison of daily fecal coliform load by subwatershed under dry and wet conditions.
Source Identification of Pollutants of Concern Due to the extent and frequency of violation of applicable water quality standards, both
TP and fecal coliform pollution are of primary concern in the Upper Cohansey River Watershed
(Table 7). Elevated levels were seen at all stations during the course of this study (Figure 15;
Figure 17). As stated earlier, TMDLs have been established to reduce TP and fecal coliform
levels in the watershed, indicating the importance of addressing these parameters and their
impact on water quality. Control and reduction of pollutants, however, are only effective when
their sources have been determined and targeted efforts are used.

Upper Cohansey River Watershed Restoration and Protection Plan April 5, 2011
40
Table 7: Pollutants of concern (marked with an ) for each subwatershed in the Upper Cohansey River Watershed.
Subwatershed pH Total Phosphorus Fecal coliform C1C2 -C3 -C4 -C5 -C6 -
CL1 -CL2 -FR1 -HR1 -
Total Phosphorus (TP) Fertilizers, domestic animal and livestock wastes, failing septic systems, and crop
residues are potential agricultural and residential nonpoint sources of phosphorus carried by
stormwater runoff and groundwater. Road runoff during storm events may also carry high
concentrations of TP to streams and rivers (Flint and Davis, 2007).
Correlations with TSS and TP were conducted at each sampling station to determine the
relationship between sediments and nutrients. For all stations, the correlation coefficient (R2)
was calculated as 0.81, indicating a strong relationship between TSS and TP (Table 8). At all
stations other than C5, the correlation between TP and TSS yielded an R2 value greater than 0.65
(Table 8). This relationship may indicate that phosphorus is likely attached to suspended
sediments as they tend to occur together (Table 8). Erosion is leading to suspended sediments in
streams and high phosphorus concentrations in the water column. This behavior is similar under
both wet and dry conditions, as illustrated by station C1 (Figure 19).

Upper Cohansey River Watershed Restoration and Protection Plan April 5, 2011
41
Table 8: Correlation between TP and TSS by monitoring station.
Station Correlation Coefficient (r) R2
C1 0.84 0.71 C2 0.96 0.92 C3 0.87 0.76 C4 0.87 0.76 C5 0.23 0.05 C6 0.92 0.85
CL1 0.84 0.71 CL2 0.81 0.65 FR1 0.82 0.66 HR1 0.93 0.86
All Stations 0.81 0.65
y = 110.64x - 0.59R2 = 0.62
y = 65.86x + 0.15R2 = 0.69
0.0
10.0
20.0
30.0
40.0
50.0
60.0
70.0
0 0.05 0.1 0.15 0.2 0.25 0.3 0.35 0.4 0.45 0.5
TP (mg/L)
TSS
(mg/
L)
WET:
DRY
Figure 19: Plot of TP versus TSS concentrations at station C1 for wet and dry events.

Upper Cohansey River Watershed Restoration and Protection Plan April 5, 2011
42
At station C5, there is no correlation between suspended sediments and TP (Figure 20).
TSS is relatively unchanging, even when TP is elevated and when samples were collected under
storm conditions. TSS averaged 6.41 mg/L in dry conditions and 14.11 mg/L in precipitation
events. In addition, TSS levels only violated the state water quality standard once throughout
sampling (RCE Water Resources Program, 2009a). TSS levels may be low due to a lack of
erosion of soils into the stream, as indicated by the high scores for C5 obtained during SVAP
data collection for stream bank stability and the health of the riparian zone (Table 2). Therefore,
there may be a source of phosphorus within the C5 subwatershed independent of suspended
sediments in the Upper Cohansey River.
y = -33.36x + 7.92R2 = 0.35
y = 3.37x + 13.50R2 = 0.00
0.0
10.0
20.0
30.0
40.0
50.0
60.0
0 0.05 0.1 0.15 0.2 0.25 0.3 0.35 0.4
TP (mg/L)
TSS
(mg/
L)
WET
DRY:
Figure 20: Plot of TP vs. TSS concentrations at station C5 for wet and dry events.
The HR1 subwatershed (Harrow Run) has proved to be affected by runoff events. The
average TSS results are eight times higher during precipitation events than dry weather. At this

Upper Cohansey River Watershed Restoration and Protection Plan April 5, 2011
43
station, TP and TSS correlate well (R2 = 0.86; Table 8). SVAP scores for bank stability are low
in HR1, indicative of high levels of erosion in this subwatershed (Table 2). Controlling storm-
induced runoff and erosion are important goals for this subwatershed so that TP can be reduced
and TMDL targets achieved.
In addition, there are a number of man-made impoundments and lakes along the
Cohansey River (Figure 1). These areas may be accumulating sediments and sediment-bound
phosphorus and harboring potential sinks for these pollutants. If the lakes are functioning as a
sink for water quality contaminants, then it is likely that the water quality of the lake and its
sediments are impacted. Nutrients that are accumulating in these waterways can create eutrophic
conditions represented by algal growth, loss of dissolved oxygen, and lake filling. Study on the
lakes and any accumulated sediment and sediment-bound phosphorus is beyond the current
scope of this project, but further research would be necessary to determine the impact of these
impoundments on water quality within the Upper Cohansey River Watershed. Water quality of
these lakes may ultimately indicate that the expensive option of dredging is necessary to
maintain watershed health and improve water quality.
Fecal Coliform Using an indicator organism like fecal coliform to solve pathogen problems in surface
waters presents several challenges. First, fecal coliform is solely an indicator of fecal pollution
and not a direct measure of fecal contamination. Second, the measurement of fecal coliform
concentration does not identify sources of fecal pollution. Therefore, it is imperative that prior to
any remediation strategies the potential sources of pollution be identified. With more than 95%
of the Upper Cohansey River Watershed without centralized wastewater treatment (Figure 6),
failing septic systems are one potential source of fecal contamination. For those areas serviced
by a centralized wastewater treatment plant, failing infrastructure could be a hazard that would
result in waters impaired by bacteria.
Other sources throughout the Upper Cohansey River Watershed include wildlife (deer,
raccoons, muskrats) and waterfowl (ducks, Canada geese, snow geese). Agricultural practices
including the spreading of manure and its use as a fertilizer could potentially lead to runoff of
fecal-related pathogens. Two confined feed operations exist in the watershed, and manure

Upper Cohansey River Watershed Restoration and Protection Plan April 5, 2011
44
management is important at these facilities to prevent runoff. Livestock access to waterways can
also lead to direct impacts on streams, and locations where livestock have access to surface
waters have been identified through field visits. Equine facilities also require manure
management; there are a few of these facilities in the lower reaches of the watershed. Improper
disposal of domestic pet wastes are also a potential source of pathogen pollution. Recently,
dumpsters have been recognized as a source of pathogens in stormwater runoff due to birds using
dumpsters as feeding locations; this is also true of rodents (Central Coast Water Board, 2006).
Microbial source tracking (MST) was employed to determine bacterial sources within the
Upper Cohansey River Watershed. MST is the concept of applying microbiological, genotypic
(molecular), phenotypic (biochemical), and chemical methods to identify the origin of fecal
pollution. MST techniques typically report fecal contamination sources as a percentage of
targeted bacteria. One of the most promising targets for MST is Bacteroides, a genus of
obligately anaerobic, gram-negative bacteria that are found in all mammals and birds.
Bacteroides comprise up to 40% of the amount of bacteria in feces and 10% of the fecal mass.
Due to large quantities of Bacteroides in feces, they are an ideal target organism for identifying
fecal contamination (Layton et al., 2006). In addition, Bacteroides have been recognized as
having broad geographic stability and distribution in target host animals and are a promising
microbial species for differentiating fecal sources (USEPA, 2005; Dick et al., 2005; Layton et
al., 2006).
Three sets of PCR primers (targets) were used to quantify Bacteroides from 1) all sources
of Bacteroides (“AllBac”), 2) human sources (“HuBac”), and 3) bovine sources of Bacteroides
(“BoBac”). This assay is based on published results from a study sponsored by the Tennessee
Department of Environmental Conservation (Layton et al., 2006).
Based on the frequency of bovine- or human-related Bacteroides occurrences in water
quality samples, some conclusions can be drawn in regards to the sources of pathogen pollution
in-stream. Human-related sources of fecal bacteria were measured in higher frequencies than
bovine-related sources (Figure 21). The highest frequency of human Bacteroides (HuBac) was
40% in the C1 subwatershed, followed by 30% of samples from subwatersheds C2, C4, and HR1
(Figure 120). Bovine Bacteroides were less frequently detected in samples. The C3
subwatershed had the highest occurrence of bovine-related Bacteroides at 20% (Figure 21). This

Upper Cohansey River Watershed Restoration and Protection Plan April 5, 2011
45
would indicate that the majority of fecal contamination within the Upper Cohansey River
Watershed is from human sources.
The presence of human fecal matter in-stream is a serious public health threat and needs
to be addressed, especially in the C1 subwatershed. Surface waters contaminated with human
feces may also carry enteric pathogens including the hepatitis A virus, Salmonella enterica
serovar Typhi, Norwalk group viruses, and others. Therefore, the control of human sources of
pathogens in the C1, C2, C4, and HR1 subwatersheds is imperative for both ecological health
and human health.
Figure 21: Percent occurrence of human (HuBac) and bovine (BoBac) Bacteroides by subwatershed over 10 sampling events.

Upper Cohansey River Watershed Restoration and Protection Plan April 5, 2011
46
Addressing Pollutants of Concern The Upper Cohansey River Watershed Restoration and Protection Plan is dedicated to
projects and efforts to control nonpoint source pollution. In the Upper Cohansey River
Watershed, fecal coliform and TP are of concern. Implementation of the suggested projects will
aid in achieving the goals set up in the appropriate TMDLs. Project details include the following
information:
Summary of current conditions at the location or in the watershed
Descriptions of the implementation efforts
Anticipated pollutant removal
An estimate of cost
Potential funding sources and project partners
Proposed monitoring
These projects have been prioritized based on percent removal of pollutants, need on a
subwatershed basis, impact on the watershed’s discharge quality, overall cost-effectiveness, and
best professional judgment.
In an effort to recommend realistic, cost-effective management strategies that will be
welcomed by communities in the watershed, project partners held several meetings with
members of the local farming community (representing grain, nursery, field crops, sod, and
livestock industries), County Health Departments, Cumberland and Salem County governments,
municipal governments, and environmental commission representatives. Information gained
from these meetings was essential to the development of plans that lead to action and water
quality improvement. The recommendations referenced in this Watershed Restoration and
Protection Plan include the information learned and feedback received from these meetings.
Identification of Priority Implementation Efforts Phosphorus and fecal coliform are moved primarily by surface runoff (both storm-driven
flows and irrigation) in the Upper Cohansey River Watershed. Therefore, implementation
projects have been identified and prioritized based on the water quality improvement that will
result from their implementation and the cost-benefit of proposed solutions in dealing with
surface runoff. Identified projects have also been developed based on water quality data

Upper Cohansey River Watershed Restoration and Protection Plan April 5, 2011
47
collected for this project. Some projects are already underway; however, the urgency of their
implementation has been highlighted below for the purposes of attracting funding sources and
expediting their implementation schedule.
The following is a list of recommended implementation efforts to improve the water
quality within the Upper Cohansey River Watershed. Details on each of the efforts identified
below can be found in Appendix B.
1. Sewer Infrastructure Repair in the Parsonage Run Subwatershed
2. Decentralized and Centralized Wastewater Management Options Along the East Shore of
Seeley Lake
3. Nursery Operations Best Management Practices Outreach and Education
4. Minimum Till Drill Program
5. Vegetated Buffers
6. Decentralized Wastewater Treatment Outreach and Education
7. Bioretention Basin and Vegetation Swale in the Harrow Run Watershed
8. Detention Basin Retrofit Designs
9. Addressing Livestock Fencing Needs.
Schedule for Implementation of Management Measures
Implementation of projects listed herein obviously requires some level of funding. The
RCE Water Resources Program, local environmental commissions, municipalities, and citizen
action groups need to work together to begin implementation of this plan. The following is a
schedule for implementation provided funding is available (Table 9). In addition, estimated
reductions in pollutants of concern if improvement projects are enacted and are effective at their
targeted pollutant removals is given (Table 10).

Upper Cohansey River Watershed Restoration and Protection Plan April 5, 2011
48
Table 9: Implementation strategy for water quality improvement projects in the Upper Cohansey River Watershed.
Applicable BMPs Subwatershed Target %
Removal of TP
Target % Removal of
TSS
Target % Removal of
FC
EstimatedPotential
Cost
ImplementationSchedule
85% 85% 85% 95% 95% 95% Sewer Infrastructure Repair in the
Parsonage Run Subwatershed FR1100% 100% 100%
To Be Determined
Repairs Completed; Monitoring by December
31, 2015
85% 85% 85% 95% 95% 95%
Decentralized and Centralized Wastewater Management Options Along the East Shore of Seeley Lake
C1100% 100% 100%
To Be Determined December 31, 2015
Nursery Operations Best Management Practices Outreach and Education
All 50% - 100% 50% - 100% 50% - 100% $325,000 December 31, 2015
Minimum Till Drill Program All 22% 30% 95% $241,000 December 31, 2015
Vegetated Buffers C1, C3, C4, C5, C6,CL1, CL2, HR1 30% 60% - 80% 95% $64,900 December 31, 2015
Decentralized Wastewater Treatment Outreach and Education
All 50% - 100% 50% - 100% 50% - 100% $26,500 December 31, 2015
Bioretention Basin and Vegetated Swale in the Harrow Run Watershed
HR1 94% 90% 95% $70,000 December 31, 2015
Detention Basin Retrofit Designs FR1 60% 90% 95% $95,000 – $475,000 December 31, 2015
Addressing Livestock Fencing Needs C6 30% 80% 95% $1 - $2/linear
foot December 31, 2015

Upper Cohansey River Watershed Restoration and Protection Plan April 5, 2011
49
Table 10: Estimated annual reductions (in kilograms per year; kg/yr) of select pollutants for each recommended water quality improvement project.
Applicable BMPs Subwatershed Estimated TP Reduction
Estimated TSS Reduction (kg/yr)
Estimated FC Reduction
(col/100ml/yr)1,129 51,037 4.8 X 10¹³
1,262 57,041 5.4 X 10¹³Sewer Infrastructure Repair in the Parsonage Run Subwatershed
FR11,328 60,044 5.7 X 10¹³
802 40,220 N/A 896 44,952 N/A
Decentralized and Centralized Wastewater Management Options Along the East Shore of Seeley Lake
C1943 47,318 N/A
Nursery Operations Best Management Practices Outreach and Education
All 1,991 – 3,982 182,943 – 365,885 3.6 X 10¹³ – 7.2 X 10¹³
Minimum Till Drill Program All 876 109,765 6.8 X 10¹³
Vegetated Buffers C1, C3, C4, C5, C6,CL1, CL2, HR1 739 174,171 – 239,229 7.4 X 10¹²
Decentralized Wastewater Treatment Outreach and Education
All 1,991 – 3,982 182,943 – 365,885 3.6 X 10¹³ – 7.2 X 10¹³
Bioretention Basin and Vegetated Swale in the Harrow Run Watershed
HR1 57 66,351 1.1 X 10¹³
Detention Basin Retrofit Designs FR1 797 54,039 5.4 X 10¹³
Addressing Livestock Fencing Needs C6 154 30,912 9.5 X 10¹²

Upper Cohansey River Watershed Restoration and Protection Plan April 5, 2011
50
Information and Education Component The RCE helps the diverse population of New Jersey adapt to a rapidly changing society
and improve their lives through an educational process that uses science-based knowledge. We
focus on issues and needs relating to agriculture and the environment; management of natural
resources; food safety, quality, and health; family stability; economic security; and youth
development. RCE is an integral part of the New Jersey Agriculture Experiment Station and
Rutgers, The State University of New Jersey, and is funded by the United States Department of
Agriculture, the State of New Jersey, and County Boards of Chosen Freeholders.
The Water Resources Program is one of many specialty programs under RCE. The goal
of the Water Resources Program is to provide solutions for many of the water quality and
quantity issues facing New Jersey. This is accomplished through research, project development,
assessment and extension. In addition to preparing and distributing fact sheets, we provide
educational programming in the form of lectures, seminars, and workshops as part of our
outreach to citizens. With New Jersey Agriculture Experiment Station funding and other State
and Federal sources, we conduct research that will ultimately be used by stakeholders to improve
water resources in New Jersey.
Programs listed below are a small sample of educational opportunities available in New
Jersey. The RCE Water Resources Program plays an important role offering programs delivered
to municipalities and working with local stakeholders to educate them on specific concerns in
their area. Along with the RCE Water Resources Program, the USEPA and NJDEP offer
newsletters, brochures and other outreach materials that can be used to supplement programs that
educate stakeholders.
For more information on the RCE Water Resources Program and its educational
opportunities, please visit http://water.rutgers.edu/.
Stormwater Management in Your Backyard
This program provides in-depth instruction on stormwater management. It introduces the
factors that affect stormwater runoff, point and nonpoint source pollution, impacts of
development (particularly impervious cover) on stormwater runoff, and pollutants found in

Upper Cohansey River Watershed Restoration and Protection Plan April 5, 2011
51
stormwater runoff. An overview of New Jersey’s stormwater regulations is presented including
who must comply and what is required. Additionally, TMDLs are introduced along with various
other requirements of the Federal Clean Water Act that have serious implications on New Jersey.
Different types of best management practices (BMPs) are presented and how these BMPs can be
used to achieve the quality, quantity and groundwater recharge requirements of New Jersey
regulations are illustrated. BMPs discussed include bioretention systems (rain gardens), sand
filters, stormwater wetlands, extended detention basins, infiltration basins, manufactured
treatment devices, vegetated filters, and wet ponds.
The program also discusses various management practices that homeowners can install
including dry wells, rain gardens, rain barrels, and alternative landscaping. Protocols for
designing these systems are reviewed in detail with real world examples provided. A step by
step guide is provided for designing a rain garden so that homeowners can actually construct one
on their property. Students have an opportunity to bring in sketches of their property for review
and discussion of various BMP options for each site. The course also provides a discussion of
BMP maintenance focusing on homeowner BMPs. The course concludes with a discussion of
larger watershed restoration projects and how students can lead these restoration efforts in their
communities. The course is very interactive and ample time is set aside for question and answer
sessions.
Environmental Stewards Program
RCE partnered with Duke Farms in Hillsborough, NJ to create a statewide Environmental
Stewardship certification program. Participants learn land and water stewardship, BMPs,
environmental public advocacy, and leadership. Each group meets twenty times for classroom
and field study. They are taught by experts from Rutgers University and its partners. Students
are certified as Rutgers Environmental Stewards when they have completed sixty hours of
classroom instruction and sixty hours of a volunteer internship. Classes are held throughout New
Jersey including at the Essex County Environmental Center in Roseland, Duke Farms, and the
Rutgers EcoComplex in Bordentown, Burlington County. Partners ask students to provide
volunteer assistance to satisfy their internship requirements.

Upper Cohansey River Watershed Restoration and Protection Plan April 5, 2011
52
Graduates of this program become knowledgeable about the basic processes of earth, air,
water and biological systems. They gain an increased awareness of techniques and tools used to
monitor and assess the health of the environment. They gain an understanding of research and
regulatory infrastructure of state and federal agencies operating in New Jersey that relate to
environmental issues. Unlike some programs, they are also given an introduction to group
dynamics and community leadership. Participants are taught to recognize elements of sound
science and public policy while acquiring a sense of the limits of our current understanding of
the environment. The goal of the Rutgers Environmental Stewards program is to give graduates
knowledge to expand public awareness of scientifically based information related to
environmental issues and facilitate positive change in their community.
New Jersey Watershed Stewards Program
The statewide program New Jersey Watershed Stewards (NJWS) was developed by the
RCE Water Resources Program in 2009. The idea of the NJWS program was developed as a
result of the Water Resources Program faculty and staff attending the National Water Conference
in St. Louis in February 2009. The Water Resources Program faculty and staff learned about the
successful Watershed Stewards programs of other states, such as Maine and Texas. The success
of these programs inspired the Water Resources Program faculty and staff to develop a
Watershed Stewards program for New Jersey.
The NJWS program is designed to raise awareness and empower stakeholders to solve
problems of nonpoint source pollution in watersheds throughout New Jersey. As part of the
NJWS program, stakeholders complete in-class training as well as participate in a watershed-
scale apprenticeship in order to obtain the title of a “New Jersey Watershed Steward.” Inducted
stewards become instrumental in continuing participation in watershed projects in New Jersey
and improve the water quality of New Jersey watersheds.
The first NJWS program was offered in spring 2010 at the Rutgers EcoComplex located
in Bordentown, New Jersey. The program includes four modules: one on the NJWS program,
the second on watershed definition and classification, one on watershed impairments, and a final
one on watershed approaches and solutions to watershed impairments. In addition to these
modules, class activities are implemented to engage trainees in the program. Upon completion

Upper Cohansey River Watershed Restoration and Protection Plan April 5, 2011
53
of a one day training program, trainees are required to participate in a NJWS apprenticeship
project where they will participate in a watershed-scale project (e.g., installing rain gardens,
visually assessing streams, assembling rain barrels, etc.).
The goals of the NJWS program are to increase stakeholder involvement in Watershed
Protection Plan and/or TMDL development processes by educating and organizing local citizens;
promote healthy watersheds by increasing citizen awareness, understanding, and knowledge
about the nature and function of watersheds, potential impairments, and watershed protection
strategies to minimize nonpoint source pollution; enhance interactive learning opportunities for
watershed education across the state and establish a larger, more well-informed citizen base;
empower individuals to take leadership roles involving community and watershed level water
resource issues; integrate watershed assessment research, education, and extension; and, deliver
local solutions to community and watershed level water resource issues.
Additional Education Programs The educational programs described above are on-going opportunities for residents,
landscape professionals, and other concerned stakeholders and are applicable to the Upper
Cohansey River Watershed. In addition to these opportunities, education programs specific for
the needs addressed in this Watershed Restoration and Protection Plan are Decentralized
Wastewater Treatment Outreach and Education and Nursery Operations Best Management
Practices Outreach and Education. Additional information regarding these two educational
opportunities for the Upper Cohansey River Watershed is given in Appendix B.
Decentralized Wastewater Treatment Outreach and Education
During this study, it became apparent that many areas within the Upper Cohansey River
Watershed service their wastewater onsite, with septic systems. These systems themselves are
not the primary concern, but it is the fact that older systems that are failing may still be in place
and may not have been detected. Failing onsite wastewater treatment systems have the ability to
emit not only bacteria and associated viruses, but may also contribute to the excess nutrient
pollution within a watershed. Education and outreach would be conducted with homeowners to
describe proper maintenance and operation of their septic systems.
Upper Cohansey River Watershed Restoration and Protection Plan April 5, 2011
54
Nursery Operations Best Management Practices Outreach and Education
Many agricultural areas throughout the Upper Cohansey River Watershed are nurseries
providing vegetation for landscapers, homeowners, or other property owners. The acreage
devoted to nursery production is relatively stable and should be fairly resistant to erosion but
additional practices such as covering with weed cloth, using gravel or shells to keep soil in place,
and growing cover crops. Targeted efforts on these properties would be to inventory nursery
operations in the watershed and provide them with manuals describing agricultural management
practices to reduce erosion, manage fertilizer use, and provide information in irrigation options
(see Appendices D and E for these manuals).
Interim Measurable Milestones Development of this Watershed Restoration and Protection Plan is the result of analyzing
previously collected data, collecting 300 water quality samples and several biological samples,
gathering input from local stakeholders, and modeling the watershed. This multi-year and multi-
step process is based on data collected in the spring, summer, and fall of 2006 and follow-up
field work completed in 2007 and 2008. It is expected that since the time of data collection,
some conditions in the watershed may have changed, either benefiting water quality or
worsening conditions.
With this in mind, projects that have been identified are expected to have the most
effective impact on water quality in the Upper Cohansey River Watershed. This Watershed
Restoration and Protection Plan was developed using a holistic perspective, recommending
projects and implementation efforts that will benefit local water quality beyond just what is
mandated by TMDLs, including other parameters that may have yet been identified as impairing
the watershed.
Projects that involve cessation of human-related pathogens are clearly the top priority,
followed by all pathogen management measures, erosion and sedimentation concerns, and low
cost-high benefit projects. It should be noted that many of these projects will entail several years
of implementation before a project fully achieves its goals. Therefore, it is important that this
Watershed Restoration and Protection Plan remain dynamic and its implementation an evolving
process. Regular meeting with municipalities, counties, and stakeholder groups should be held

Upper Cohansey River Watershed Restoration and Protection Plan April 5, 2011
55
to solicit information on the ever-changing needs of the watershed so additional projects can be
added to this plan and targeted to those expressed needs. This document should be consulted
during the decision-making process for municipal and county governments as they proceed to
plan for growth, keeping watershed protection and water resource protection an utmost priority.
Monitoring Component Implementation of management measures will result in water quality improvements while
minimizing flooding, promoting groundwater recharge or reuse, and other benefits. Both
modeling and monitoring can be conducted to quantify these improvements.
Monitoring can be conducted to also quantify the improvements to the Upper Cohansey
River and its watershed that result from implementation of this plan. NJDEP does maintain four
benthic macroinvertebrate stations on the Upper Cohansey River (Figure 12). These stations can
provide continued information on improvement of water quality and its effects on aquatic biota.
Moreover, water quality samples can be collected at established stations throughout the system
and analyzed for various pollutants that are a concern within the watershed, such as nutrients and
bacteria. These stations include the USGS gauge located at the outlet of the Upper Cohansey
River Watershed (Figure 1). Suggestions for monitoring can be found in the descriptions of
individual BMPs described in Appendix B.

Upper Cohansey River Watershed Restoration and Protection Plan April 5, 2011
56
References
Central Coast Water Board, 2006, Total Maximum Daily Loads for Pathogens in Aptos and Valencia Creeks, including Trout Gulch, Santa Cruz, California. San Luis Obispo, CA.
Dick, L.K., A.E. Bernhard, T.J. Brodeur, J.W. Santo-Domingo, J.M. Simpson, S.P. Walters and K.G. Field, 2005, Host Distributions of Uncultivated Fecal Bacteroidales Bacteria Reveal Genetic Markers for Fecal Source Identification. Appl. Environ. Microbiol. 71(6):3184-3191.
Flint, K.R. and A.P. Davis, 2007, Pollutant Mass Flushing Characterization of Highway Stormwater Runoff from an Ultra-Urban Area, J. of Environmental Engineering. 616-626.
Fralinger Engineering, 2007, Existing and Desired Sewer Service Areas of the Cohansey Sewage Treatment Plant GIS Data. Bridgeton, NJ.
Gray, J., 2008, personal communication on 2/20/08. Senior Environmental Specialist, NJDEP Bureau of Nonpoint Pollution Control.
Johnson, J., 2008, personal communication on 3/24/10. County Extension Department Head, County Agricultural Agent, Rutgers Cooperative Extension of Cumberland County.
Layton, A., L. McKay, D. Williams, V. Garrett, R. Gentry and G. Sayler, 2006, Development of Bacteroides 16S rRNA Gene TaqMan-Based Real-Time PCR Assays for Estimation of Total, Human, and Bovine Fecal Pollution in Water. Appl. Environ. Microbiol. 72(6):4214-4224.
New Jersey Department of Environmental Protection (NJDEP), 2002a, New Jersey 2002 Integrated Water Quality Monitoring and Assessment Report [305(b) and 303(d)]. Trenton, NJ.
New Jersey Department of Environmental Protection (NJDEP), 2002b, High Resolution Orthophotography, Trenton, NJ.
New Jersey Department of Environmental Protection (NJDEP), 2003a, Total Maximum Daily Loads for Fecal Coliform to Address 27 Streams in the Lower Delaware Region. Trenton, NJ.
New Jersey Department of Environmental Protection (NJDEP), 2003b, Total Maximum Daily Loads for Phosphorus to Address 13 Eutrophic Lakes in the Lower Delaware Water Region. Trenton, NJ.

Upper Cohansey River Watershed Restoration and Protection Plan April 5, 2011
57
New Jersey Department of Environmental Protection (NJDEP), 2004, New Jersey Stormwater Best Management Practices Manual. Division of Watershed Management. Trenton, NJ.
New Jersey Department of Environmental Protection (NJDEP), 2005, Field Sampling Procedures Manual. Trenton, NJ.
New Jersey Department of Environmental Protection (NJDEP), 2007, NJDEP 2002 Land Use/Land Cover Update, WMA-17. Trenton, NJ.
New Jersey Department of Environmental Protection (NJDEP), 2009a, 2008 New Jersey Integrated Water Quality Monitoring and Assessment Report. Trenton, NJ.
New Jersey Department of Environmental Protection (NJDEP), 2009b, Surface Water Quality Standards, N.J.A.C. 7:9B. Trenton, NJ.
New Jersey Department of Environmental Protection (NJDEP), 2009c, 2010 Integrated Water Quality Monitoring and Assessment Methods (DRAFT). Trenton, NJ.
Rutgers Cooperative Extension (RCE) Water Resources Program, 2009a, Upper Cohansey River Watershed Restoration and Protection Plan: Data Report. New Brunswick, NJ.
Rutgers Cooperative Extension (RCE) Water Resources Program, 2009b, Upper Cohansey River Watershed Restoration and Protection Plan: Model Report. New Brunswick, NJ.
Sloto, R.A. and M.Y. Crouse, 1996, HYSEP: A Computer Program for Streamflow Hydrograph Separation and Analysis. Rep. no. 96-4040. Lemoyne, Pennsylvania: USGS, 1996.
United States Department of Agriculture (USDA), 2006, Digital Orthoimagery, Cumberland County, NJ. Salt Lake City, UT.
United States Environmental Protection Agency (USEPA), 2005, Microbial Source Tracking Guidance Document. EPA/600/R-05/064. Office of Research and Development National Risk Management Research Library. Washington, DC. 151 pp.
United States Geological Service (USGS), 1995, Digital Orthophoto Quadrangles. Reston, VA.

Upper Cohansey River Watershed Restoration and Protection Plan April 5, 2011
58
APPENDIX A: PRESENTATION OF pH IN-STREAM CONCENTRATIONS IN GRAPHS

Upper Cohansey River Watershed Restoration and Protection Plan April 5, 2011
59
Station C1pH
4.0
5.0
6.0
7.0
8.0
9.0
10.0
6/1/2006 6/21/2006 7/11/2006 7/31/2006 8/20/2006 9/9/2006 9/29/2006 10/19/2006 11/8/2006 11/28/2006
Date
pH (S
U)
Regular Sampling
Bacteria Sampling Only
Storm Event Sampling
pH Criteria = 4.5 S.U.
pH Criteria = 7.5 S.U.
Station C2pH
4.0
5.0
6.0
7.0
8.0
9.0
10.0
6/1/2006 6/21/2006 7/11/2006 7/31/2006 8/20/2006 9/9/2006 9/29/2006 10/19/2006 11/8/2006 11/28/2006
Date
pH (S
U)
Regular Sampling
Bacteria Sampling Only
Storm Event Sampling
pH Criteria = 4.5 S.U.
pH Criteria = 7.5 S.U.

Upper Cohansey River Watershed Restoration and Protection Plan April 5, 2011
60
Station C3pH
4.0
5.0
6.0
7.0
8.0
9.0
10.0
6/1/2006 6/21/2006 7/11/2006 7/31/2006 8/20/2006 9/9/2006 9/29/2006 10/19/2006 11/8/2006 11/28/2006
Date
pH (S
U)
Regular Sampling
Bacteria Sampling Only
Storm Event Sampling
pH Criteria = 4.5 S.U.
pH Criteria = 7.5 S.U.
Station C4pH
4.0
5.0
6.0
7.0
8.0
9.0
10.0
6/1/2006 6/21/2006 7/11/2006 7/31/2006 8/20/2006 9/9/2006 9/29/2006 10/19/2006 11/8/2006 11/28/2006
Date
pH (S
U)
Regular Sampling
Bacteria Sampling Only
Storm Event Sampling
pH Criteria = 4.5 S.U.
pH Criteria = 7.5 S.U.

Upper Cohansey River Watershed Restoration and Protection Plan April 5, 2011
61
Station C5pH
4.0
5.0
6.0
7.0
8.0
9.0
10.0
6/1/2006 6/21/2006 7/11/2006 7/31/2006 8/20/2006 9/9/2006 9/29/2006 10/19/2006 11/8/2006 11/28/2006
Date
pH (S
U)
Regular Sampling
Bacteria Sampling Only
Storm Event Sampling
pH Criteria = 4.5 S.U.
pH Criteria = 7.5 S.U.
Station C6pH
4.0
5.0
6.0
7.0
8.0
9.0
10.0
6/1/2006 6/21/2006 7/11/2006 7/31/2006 8/20/2006 9/9/2006 9/29/2006 10/19/2006 11/8/2006 11/28/2006
Date
pH (S
U)
Regular Sampling
Bacteria Sampling Only
Storm Event Sampling
pH Criteria = 4.5 S.U.
pH Criteria = 7.5 S.U.

Upper Cohansey River Watershed Restoration and Protection Plan April 5, 2011
62
APPENDIX B: IMPLEMENTATION PROJECTS TO ADDRESS KNOWN WATER QUALITY IMPAIRMENTS IN THE UPPER
COHANSEY RIVER

Upper Cohansey River Watershed Restoration and Protection Plan April 5, 2011
63
Sewer Infrastructure Repair in the Parsonage Run Subwatershed
Current Conditions
Based on feedback received from Upper Deerfield Township, sanitary sewers dating back to earlier than the 1940’s are leaking in the Seabrook region of the Township. This region of town is serviced by the Cumberland County Utilities Authority (CCUA), and a decrease in volume of wastewater to the treatment plant has raised attention to this engineering and public health problem. This area of the watershed falls within subwatershed FR1, where coliform counts have been as high as 8,000 col/100mL (Figure B-1). Sewer lines were replaced in the 1990’s in some sections of this high density residential area (Figure B-2); however, easement issues and funding have prevented the final sections of pipe to be replaced and repaired. More than 20 homes could be discharging wastewater to a failing sewer line. Furthermore, nitrogen loading in this watershed is extremely high compared to loadings documented by other researchers (Mostaghimi et al., 1997); this can also be considered a public health risk since the residents of the watershed rely on private wells for drinking water.
On two dates, water quality samples were collected immediately downstream of this high density residential development at two locations (PR1 and FR2) in addition to downstream monitoring at FR1 on Parsonage Run. Fecal coliform results were non-detect and at or below surface water standards at all locations (Figure B-3). Given the infrastructure issues, these fecal results are relatively low. However, these stations were only monitored on two occasions and are deemed as inconclusive evidence of the impacts of failing infrastructure on Parsonage Run water quality.
Parsonage Run at FR1Fecal Coliform Concentrations
0
500
1000
1500
2000
2500
3000
3500
4000
4500
6/1/2006 6/21/2006 7/11/2006 7/31/2006 8/20/2006 9/9/2006 9/29/2006 10/19/2006 11/8/2006 11/28/2006
Date
FC (c
ol/1
00m
L)
0.00
0.50
1.00
1.50
2.00
2.50
3.00
3.50
Dai
ly R
ainf
all (
in)
on 8/9/06, FC = 8000
Total Fecal Coliform
Criteria = 200 col/100mL
Figure B-1: Fecal coliform results at FR1 and precipitation patterns.
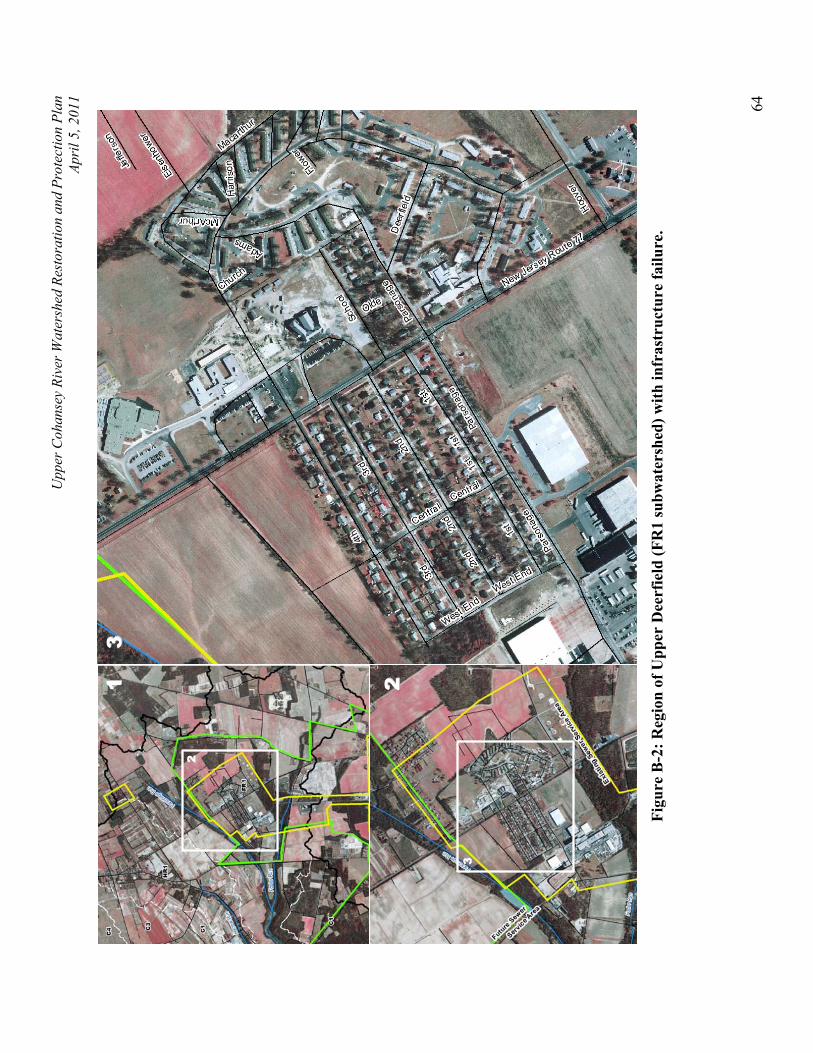
Upp
er C
ohan
sey
Rive
r Wat
ersh
ed R
esto
ratio
n an
d Pr
otec
tion
Plan
Ap
ril 5
, 201
1 64
1133
22
22
33
1133
22
22
33
Figu
re B
-2: R
egio
n of
Upp
er D
eerf
ield
(FR
1 su
bwat
ersh
ed) w
ith in
fras
truc
ture
failu
re.

Upper Cohansey River Watershed Restoration and Protection Plan April 5, 2011
65
Figure B-3: Monitoring locations downstream of failing infrastructure and fecal coliform results.
Implementation
Since the conclusion of water quality monitoring in 2006, Upper Deerfield Township completed repairs to sections of this sewer pipeline in late 2010 with grant support from the New Jersey Small Cities Community Development Block Grant, a funding source administered by the NJ Department of Community Affairs and from the US Department of Housing and Urban Development. With replacement of the failing infrastructure, it is believed that much of the pathogen and TP pollution will be removed from this subwatershed area, which is a subwatershed that highly impacts the final watershed discharge at the USGS gauging station.
Raw sewage is typically in the magnitude of 106 – 107 col/100mL for fecal coliform (Metcalf and Eddy, 1991; Overcash and Davidson, 1980). Since these densities are not corroborated by our water quality monitoring data, it can be concluded that die-off and other mechanisms may be at work, limiting the transport of pathogens from the Seabrook area to the monitoring station at FR1. It is not possible to predict the benefits that fixing this sewer line will have on the monitoring station; however, fixing the sewer line will decrease pathogen concerns in this subwatershed, as well as public health-related issues.
.
100NDPR1
200100FR2
NDNDFR1
11/1/200610/24/2006
Fecal Coliform Monitoring Results
(orgs/100mL)
ND refers to < 100 orgs/100mL
.
100NDPR1
200100FR2
NDNDFR1
11/1/200610/24/2006
Fecal Coliform Monitoring Results
(orgs/100mL)
ND refers to < 100 orgs/100mL

Upper Cohansey River Watershed Restoration and Protection Plan April 5, 2011
66
Post Construction Monitoring
Since improved water quality management in this subwatershed will have a definitive impact on water quality at the USGS gauge below Seeley Lake, it is recommended that water quality continue to be monitored on Parsonage Run at PR1 and on Foster Run at FR1 and FR2 to determine the extent of this impact downstream of the repairs. Monitoring should target both wet and dry weather samples and should occur five (5) times per month in June, July, and August following the pipeline repair in order to determine that the infrastructure functions properly. Stream discharge at all locations should be measured, and laboratory analyses should be conducted for fecal coliform, E. coli, total nitrogen, and TP.
References
Metcalf and Eddy, 1991, Wastewater Engineering: Treatment, Disposal, Reuse 3rd ed. McGraw-Hill, Inc., New York, NY.
Mostaghimi, S., S.W. Park, R.A. Cooke, and S.Y. Wang, 1997, Assessment of Management Alternatives on a Small Agricultural Watershed. Water. Res. 31(8):1867-1878.
Overcash, M.R. and J.M. Davidson, 1980, Environmental Impact of Nonpoint Source Pollution.Ann Arbor Science Publishers, Inc., Ann Arbor, MI.

Upper Cohansey River Watershed Restoration and Protection Plan April 5, 2011
67
Current Conditions
The current sewer service area for the Cumberland County Utilities Authority extends only to Columbia Highway and Finley Road in Upper Deerfield, just south of Seeley Lake. Outside of the sewer service area, between Seeley Road and Seeley Lake, are several large residences along the pond’s shoreline (Figure B-4). Given that there is no sewer service in this area, it can be deduced that wastewater from these homes is serviced by a septic system or a cesspool. There are wastewater concerns that should be addressed along this waterbody:
Several of these properties are narrow, with homes set close to the road. The front and side areas of the homes are limited for space for septic system disposal; therefore, if a disposal field does exist, it must be along the lake. A property across from the lake on the other side of Seeley Road has a mounded septic system. This need for a mounded system is evidence of a high water table in this area, which leads to failure in a traditional septic system and poses immediate health risks. Properties along the shoreline must also be within the high water table extent and experiencing leach field failure.
This region of the watershed is within subwatershed C1, which terminates at the USGS gauging station below Seeley Lake. Water quality at C1 exceeded the former water quality standard for fecal coliform on five monitoring events and had results as high as 2,000 col/100mL. Moreover, 40% of the MST samples collected and analyzed contained human-related Bacteroides. There are few other areas in this subwatershed that could be contributing to human-related pathogen contamination discovered during monitoring. Considering the vulnerability of septic systems and cesspools along the shoreline and the risk to surface water in close proximity, it has been determined that improving the current wastewater management strategy along Seeley Road is a priority for pathogen and TP control in the Cohansey River. This may include funding for alternative treatment units or extending sewer service lines to this region.
Decentralized and Centralized Wastewater Management Options along the East Shore of Seeley Lake

Upper Cohansey River Watershed Restoration and Protection Plan April 5, 2011
68
Seel
eyRo
ad
Finley Road
Imagery retrieved from Microsoft® Virtual Earth™ (3/3/2008).
Seel
eyRo
ad
Finley RoadSe
eley
Road
Finley Road
Imagery retrieved from Microsoft® Virtual Earth™ (3/3/2008).
Figure B-4: Seeley Lake and its spillway to the Cohansey River.
Implementation
With the sewer service area extended to this region of Upper Deerfield, it is believed that pathogen pollution exhibited in this watershed will be greatly reduced, allowing the Cohansey River to more fully meet the requirements of its designated uses. If extending the sewer line is excessively costly or will promote unwanted growth in Upper Deerfield, then alternative treatment systems should be considered. Due to limited space on the properties for adsorption fields, other systems that require less absorption field area are viable options. These include aerobic pre-treatment units or recirculating sand filters. With the installation of new, working alternative units, nutrients and pathogens released from the failing septic systems will be removed. Cycling of phosphorus within the lake, however, will continue to impact water quality at the USGS gauge long after septic systems discontinue releasing high nutrients.
State revolving funds could be an option for the Township of Upper Deerfield and could expedite extending sewer service areas. The Environmental Infrastructure Trust Financing Program offers traditional financing at a rate as low as 2.13%. As for alternative treatment units, Upper Deerfield can utilize the state revolving fund to provide low interest loans to homeowners to replace failing septic systems or cesspools. Repayment of this loan can be extended over a 20-year period and paid back as part of a tax assessment on the property. More information on state revolving funds and this financing option can be found at http://www.njeit.org. The Environmental Infrastructure Trust specifically has stated its commitment to solving septic management issues in New Jersey (NJEIT, 2008).

Upper Cohansey River Watershed Restoration and Protection Plan April 5, 2011
69
Post Construction Monitoring
Following extension of sewer service to Seeley Road for the portion parallel to the shoreline of Seeley Lake or installation of alternative treatment units, water quality should be collected at monitoring station C1. Data collection at this location can be less frequent because of the USGS gauging station 01412800 at the same location on the Cohansey River. Fecal coliform and E. coli should be monitored, as well as TSS, TP, and nitrogen. In situ parameters should also be monitored. It is recommended that samples be collected year-round one time per month, except in June, July, and August when samples should be collected five times per month for fecal coliform and E. coli.
References
New Jersey Environmental Infrastructure Trust, 2010, Other Projects.http://www.njeit.org/otherprojects.htm, Last updated January 28, 2010.

Upper Cohansey River Watershed Restoration and Protection Plan April 5, 2011
70
Current Conditions
A large portion of the agricultural lands within the Upper Cohansey River Watershed are nursery operations (Figure B-5). Most of the acreage devoted to nursery production is relatively stable and should be fairly resistant to erosion. Practices currently protecting nursery lands include production areas and roads covered with weed cloth, gravel, or shells (Figure B-6). Additionally, grass strips between beds (Figure B-7), and tailwater recovery basins that collect stormwater runoff should prevent movement of sediment in most cases (Figure B-8).
One area in particular for education is in the promotion and use of cover crops as a means of erosion control. Cover crops act to hold soils in place and prevent their loss from surface runoff. In addition, they have the capability to reduce flow rates of runoff and lower the concentration of pollutants found within this runoff.
A second area for education is in water reuse. Overdevest Nurseries in Bridgeton, NJ provides an excellent example of how the nursery industry can maximize its water reuse. They have been reusing over 75% of their water since 2000 and continue to expand this practice rapidly approaching 100% reuse. Overdevest Nurseries could be used as a model upon which to build other systems in the Upper Cohansey River Watershed. Information regarding their systems, including initial and maintenance costs, sizing of systems, and ease of use, would be gathered and shared with other nurseries. Materials specific to these topics would be developed (if not already in existence) and incorporated into education programs. The water recovery practice standard established by the NRCS provides limited
Figure B-6: Nursery with weed cloth and gravel to reduce runoff and erosion.
Figure B-5: Location of nursery operations.
Nursery Operations Best Management Practices Outreach and Education
Upper Cohansey River Watershed Restoration and Protection Plan April 5, 2011
71
information on sizing storage basins for irrigation water, especially if basins are to be used for collection of storm runoff in addition to irrigation runoff (NRCS, 2007). The information provided by Overdevest Nurseries will be reviewed to determine the role of water reuse in water quality improvement. Future work in the watershed could be accomplished to provide design criteria for nurseries wishing to incorporate stormwater runoff control into their water reuse systems. Basin designs to provide storage of various precipitation events could be developed as a result of such work.
In addition, there are opportunities for research needed for water recycling adoption at nurseries in the Upper Cohansey River Watershed and other areas. A small percentage of nurseries across the nation have successfully implemented systems for collecting, treating, and reusing runoff for irrigation water. Questions remain, however, as to which technologies or practices should be recommended for local growers. Since collected runoff can potentially carry plant pathogens and/or herbicides that could be devastatingly injurious to crops, this lack of knowledge represents a significant hindrance for nursery adoption of this technology. Research into the following topics may prove useful in promoting the adoption of water reuse at nurseries:
Efficacy of various sanitation technologies. o Review current information in literature on the advantages and disadvantages of
various sanitation technologies (chlorine, ultraviolet light, ozone, etc.) particularly in relation to initial and maintenance costs, effectiveness against plant pathogens, and limitations.
o Local onsite research is indicated at cooperating nursery sites since effectiveness of technologies may vary according to local factors, such as the physical and chemical properties of runoff (entrained sediment, organic matter, salts).
Occurrence and fate of herbicide in collected water. o Based on local uses, collection system designs, and treatment options, what is the
potential for herbicides to be found in runoff and in what concentrations? o Are herbicides likely to be eliminated through the treatment process, for example
in settling ponds, sanitation treatment, and blending with fresh water? o What is the risk of residual herbicides to crops and are there additional steps
growers can take to avoid crop injury? Pathogen viability in irrigation systems.
o What plant pathogens are likely to be found in collected water? o Are there pathogens that survive the treatment processes? o Are there plant pathogens that may not be of concern since they do not survive
well in water?
A third area for education is the disconnection of impervious surfaces. Many green house roofs, roadways, and other impervious areas can be disconnected from flowing off-site and rerouted to a tailwater recovery system for reuse or simply directed to pervious areas for filtering and infiltration. This practice is very inexpensive and very effective at reducing stormwater runoff volumes for smaller storm events.

Upper Cohansey River Watershed Restoration and Protection Plan April 5, 2011
72
Implementation
Despite nursery acreage being protected from erosion, other management practices can affect phosphorus contribution to waterbodies from nurseries. Container and field nurseries will be surveyed with a peer-reviewed questionnaire (Newman et al., 2008) modified for applicability for New Jersey operations. This would document good agricultural management practices and determine if any deficiencies exist.
Draft agricultural management practice (AMPs) manuals developed by Rutgers New Jersey Agricultural Experiment Station for container and field nurseries will be finalized and produced in 2011 and distributed to operations in the watershed (Appendix D; Appendix E). A shorter quick reference guide would be created of these AMP Manuals for use in the field. Support could be given for studies further characterizing the contribution of nutrients to surface water bodies from nurseries, and for the further implementation of agricultural management practices where appropriate. Participation by nursery operators in this type of research, documentation, and implementation should be considered significant cost share on the part of the growers.
This outreach campaign will begin with the operator’s surveys to better understand the current AMPs (if any) being conducted at nursery areas in the watershed. Feedback from this survey will direct educational opportunities adapted and/or developed to aid in increasing the use of AMPs. The educational/outreach programs that are highlighted through the needs survey will be developed to target the nurseries of Cumberland and Salem Counties. Demonstration AMPs will be constructed at various nurseries throughout the watershed and used as educational tools for outreach programming.
Following this initial educational campaign, a web-based follow-up survey will be launched to identify the effectiveness of this outreach program. Results of this survey will be compared to original survey results and determine possible reductions in fertilizer and pesticide use. Newspaper articles will be written to announce the program’s effectiveness, and a final implementation report will summarize the results of this work.
Figure B-7: Grass filter strips between rows of nursery plants.
Figure B-8: Basins collect runoff from nursery acreage.
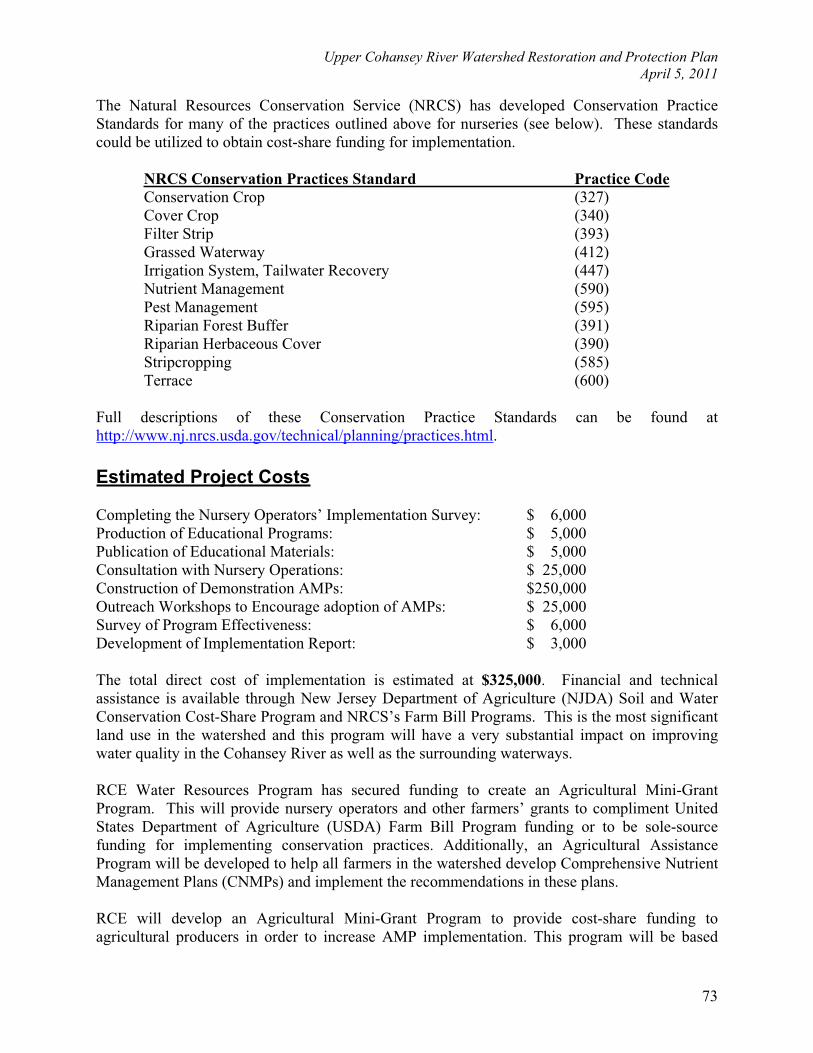
Upper Cohansey River Watershed Restoration and Protection Plan April 5, 2011
73
The Natural Resources Conservation Service (NRCS) has developed Conservation Practice Standards for many of the practices outlined above for nurseries (see below). These standards could be utilized to obtain cost-share funding for implementation.
NRCS Conservation Practices Standard Practice CodeConservation Crop (327) Cover Crop (340) Filter Strip (393) Grassed Waterway (412) Irrigation System, Tailwater Recovery (447) Nutrient Management (590) Pest Management (595) Riparian Forest Buffer (391) Riparian Herbaceous Cover (390) Stripcropping (585) Terrace (600)
Full descriptions of these Conservation Practice Standards can be found at http://www.nj.nrcs.usda.gov/technical/planning/practices.html.
Estimated Project Costs
Completing the Nursery Operators’ Implementation Survey: $ 6,000 Production of Educational Programs: $ 5,000 Publication of Educational Materials: $ 5,000 Consultation with Nursery Operations: $ 25,000 Construction of Demonstration AMPs: $250,000 Outreach Workshops to Encourage adoption of AMPs: $ 25,000 Survey of Program Effectiveness: $ 6,000 Development of Implementation Report: $ 3,000
The total direct cost of implementation is estimated at $325,000. Financial and technical assistance is available through New Jersey Department of Agriculture (NJDA) Soil and Water Conservation Cost-Share Program and NRCS’s Farm Bill Programs. This is the most significant land use in the watershed and this program will have a very substantial impact on improving water quality in the Cohansey River as well as the surrounding waterways.
RCE Water Resources Program has secured funding to create an Agricultural Mini-Grant Program. This will provide nursery operators and other farmers’ grants to compliment United States Department of Agriculture (USDA) Farm Bill Program funding or to be sole-source funding for implementing conservation practices. Additionally, an Agricultural Assistance Program will be developed to help all farmers in the watershed develop Comprehensive Nutrient Management Plans (CNMPs) and implement the recommendations in these plans.
RCE will develop an Agricultural Mini-Grant Program to provide cost-share funding to agricultural producers in order to increase AMP implementation. This program will be based

Upper Cohansey River Watershed Restoration and Protection Plan April 5, 2011
74
upon the New Jersey Water Supply Authority program that is being created in the Raritan River Watershed. The program is intended to expand the ability of farmers to implement conservation practices by providing a funding source to either serve as a complement to USDA Farm Bill programs or be a sole-source of funding. This task also includes the development of producer contracts and the development of an educational and outreach program for all farmers to inform them of this mini-grant program.
The USDA Farm Bill Program offers funding to farmers to implement various AMPs but these programs often require the farmer to pay a cost-share. Many farmers do not have the financial capacity to pay this cost-share. Therefore, a mini-grant program needs to be put in place to help the farmer pay for the cost-share associated with accepting Farm Bill Program funding. Additionally, some farmers are not eligible for Farm Bill Program funding. This mini-grant program would make available financial resources to these farmers to implement AMPs.
Post Implementation Monitoring
As indicated above, post-implementation monitoring will be conducted as part of this implementation project. Success will be measured in terms of use of additional AMPs in the watershed and number of operators enrolled in the program. Success will also be measured by long-term correspondence with the nursery operators using these techniques.
This can be related to water quality using the USGS monitoring station 01482500, Cohansey River at Seeley Lake, or through addition monitoring of pre- and post-management of nursery lands. It is expected that improvement will be demonstrated through this monitoring. The USGS monitoring station would require no additional cost.
References
Natural Resources Conservation Service (NRCS), 2007, Natural Resources Conservation Service Conservation Practice Standard fro New Jersey, Irrigation System, Tailwater Recovery (No.) Code 447. PDF format available at http://www.nj.nrcs.usda.gov/technical/planning/practices.html, Last updated November 18, 2010.
Newman, J., V. Mellano, K. Robb, and D. Haver, 2008, Conducting an environmental audit, Chapter 9. In Greenhouse and Nursery Management Practices to Protect Water Quality Univ. of Calif. Div. of Agric. and Nat. Resources. Publication 3508. Oakland, CA.

Upper Cohansey River Watershed Restoration and Protection Plan April 5, 2011
75
Minimum Till Drill Program
Current Conditions
Based on water quality monitoring data, suspended sediments are highly correlated with total phosphorus results; therefore, erosion has been highlighted as a major concern in all but one of the ten subwatersheds in the Upper Cohansey River Watershed. Due to the agricultural nature of the watershed (86% agriculture), low till, no till, and other till methods have been investigated as management options to reduce sediment loss on agricultural lands, such as the sediment loss from agricultural ponds (Figure B-9). According to feedback from the agricultural community, a minimum till drill used in bi-annual rotation is an effective tool to conserve valuable top soils, decrease erosion and transport of nutrients, and still produce a crop undiminished by a change in till methods. This is a realistic implementation opportunity that will be successful, according to the feedback received from the agricultural community in and around the watershed. Also, due to the large areas of the watershed covered by cropland and pastureland, this agricultural management practice has great potential to improve water quality and soil protection (Figure B-10).
Figure B-9: Turbid discharge from agricultural pond in the Upper Cohansey River Watershed.

Upper Cohansey River Watershed Restoration and Protection Plan April 5, 2011
76
Figure B-10: Cropland and Pastureland Land Uses in the Project Watershed
Implementation
The project team proposes that two minimum till drills be purchased and housed at the Salem County RCE office. Farmers will be paid $15 per acre to utilize this equipment and participate as a partner in this minimum till effort. Farmers will have the option of using this equipment on an annual or biannual basis. The Salem County RCE office, Cumberland County RCE office, and Cumberland-Salem Conservation District (CSCD) will be responsible for providing advice and consultations with farmers to encourage this program’s success and make this a positive, stronger relationship with landowners. Farmers’ participation and feedback during this project will result in a document and final report that includes the following information:
Comparison of crop yields from regular till to minimum till; Cost comparison of regular versus minimum till for fertilizers, pesticides, hours in the field, and equipment; Comments on equipment use, erosion control, and lessons learned.
Refers to cropland and pastureland agricultural land uses (NJDEP, 2007)

Upper Cohansey River Watershed Restoration and Protection Plan April 5, 2011
77
The final report will also include a photo log of regular till versus minimum till. An outreach campaign will also be developed and implemented that will include feedback from the agricultural community and feedback from those working in the minimum till program. The feedback and open discussions will lead to shared advice and increased production at a lower cost to farmers.
It is the goal of project partners that farmers will initially be paid for their participation in the data gathering process. After five years, equipment will be leased and maintained at the Salem County RCE office for those interested in utilizing minimum till on their properties.
Estimated Project Costs
Purchase of Two Minimum Till Drills: $70,000 ($35,000 per unit for two units) Equipment Maintenance Costs: $10,000 Oversight of Operations/Feedback Surveys: $75,000 ($15,000 per year for five years) Payment for Farmer Participation: $36,000 Water Quality Monitoring Costs: $35,000 Outreach Program Materials: $5,000 Final Report and Documentation: $10,000
Total direct cost of this implementation project is $241,000. Some these costs may be reduced by utilizing NRCS information on no-till practices and cost-sharing. Financial and technical assistance is available through NJDA Soil and Water Conservation Cost-Share Program and NRCS’s Farm Bill Programs. Leveraging of funds is also possible to further incentivize this practice to the farmer. This can be done by combining NRCS financial and technical assistance programs with NJDEP 319 (h) implementation funds.
Post Implementation Monitoring
Sampling stations used in this project will be monitored as farmers join the program in that particular subwatershed. Water quality monitoring should be conducted bi-weekly and during storm events and should include TSS and nutrients (nitrogen and phosphorus), as well as indicators of pesticide runoff. Water quality monitoring should initiate when the farmer agrees to participate and before fields are planted. Monitoring should continue for six months after planting.
Post-implementation monitoring will also include an analysis of buffer widths surrounding the till and minimum till fields, and water quality data’s correlation to buffer width and health. This will ensure that appropriate buffer widths are being utilized to prevent pesticide runoff from harming nearby surface waters.
References
New Jersey Department of Environmental Protection (NJDEP), 2007, NJDEP 2002 Land Use/Land Cover Update, WMA-17. Trenton, NJ.

Upper Cohansey River Watershed Restoration and Protection Plan April 5, 2011
78
Vegetated Buffers
Current Conditions
Considering the amount of agricultural lands within the Upper Cohansey River Watershed, there are many opportunities for implementation of this agricultural buffer program. An ideal location for a vegetative buffer has been identified and is featured in Figure B-11. The thick orange line is the proposed vegetative buffer. Above that line is the drainage area to the vegetative buffer. The land use of the 25-acre drainage area treated by the proposed vegetative buffer strip is agriculture row crops and a small amount of greenhouse nursery land use. The site is located in the subwatershed HR1 which is classified as a priority subbasin for TP management and buffer implementation, as identified in the SWAT model developed for this project.
Description
A vegetative filter is an area designed to remove suspended solids and other pollutants from stormwater runoff flowing through a length of vegetation called a vegetated filter strip. The vegetation planted in a filter strip typically can be turf grasses, native grasses, herbaceous vegetation and woody vegetation, or some combination of these. It is important to note that all runoff to a vegetated filter strip must enter and flow through the strip as sheet flow. Failure to do so can severely reduce and even eliminate the filter strip’s pollutant removal capabilities.
A vegetated filter is intended to remove pollutants from runoff flowing though it. Vegetated filter strips can be effective in reducing sediment and other solids and particulates, as well as associated pollutants such as hydrocarbons, heavy metals, and nutrients. The TSS removal rate for vegetative filters will depend upon the vegetated cover in the filter strip, but is reported to range from 60 to 80% (NJDEP, 2004). The pollutant removal mechanisms include sedimentation, filtration, adsorption, infiltration, biological uptake, and microbial activity. Vegetated filter strips have a removal rate of 30% for phosphorus and nitrogen (NJDEP, 2004). Vegetated filter strips with planted or indigenous woods may also create shade along water bodies that decrease aquatic temperatures, provide a source of detritus and large woody debris for fish and other aquatic organisms, and provide habitat and protective corridors for wildlife (Figure B-12).
Figure B-11: Aerial View of Acres Treated by Agricultural Buffer Strip (USDA, 2006)

Upper Cohansey River Watershed Restoration and Protection Plan April 5, 2011
79
In addition, buffers act to exclude Canada geese from adjacent waterways. The non-migratory Canada goose has been identified as contributing nutrient and bacteria pollution to lands and waterways throughout New Jersey, including the Upper Cohansey River Watershed. Many areas have had success with deterrents, such as ‘Geese Police,’ but vegetated buffers offer a permanent solution to goose management. Ideally, the buffer should only be mowed once a year during the winter so that the buffer is kept to a minimum height of six (6) inches at all times. The geese will not feel safe walking through the buffer to access the water as the buffer will obstruct the geese’s view making them wary of predators lurking in the buffer. The buffer will also dramatically reduce the amount of turf grass the geese will be able to eat at the site.
Figure B-12: Typical profile of a vegetated buffer in agricultural areas (FISRWG, 1998).
Location
Potential locations for vegetated stream buffers are found throughout the Upper Cohansey River Watershed (Figure B-13). The criteria used to determine each site are very simple; any portion of a stream or water body that was surrounded by agricultural land from the 2006 NJDEP aerials was chosen as a potential site for this BMP. This project could result in approximately 69,500 feet (13.2 miles) of additional vegetated buffer.
Implementation
The Cumberland-Salem Conservation District (CSCD) developed and implemented an agricultural buffer program, which installed 35 acres of vegetated buffers along agricultural lands in the Upper Cohansey River Watershed (Figure B-14). The program was very attractive to farmers for several reasons – the application and paperwork was not cumbersome, money was paid directly to the farmer in a timely manner, and seeds were provided for the buffer planting. The feedback from the farmer advisory committee about this program was always positive.

Upper Cohansey River Watershed Restoration and Protection Plan April 5, 2011
80
The agricultural buffer program developed by the CSCD paid landowners per acre to plant and maintain 30 foot wide agricultural buffers along fields to trap sediment and nutrients for an agreed upon number of years. The design of the CSCD program supplied the landowner with the seed mix for the vegetative filter strip and maintained communication with the landowners to ensure the success of the buffer.
Landowners involved in the program, appreciated the minimum amount of paper work, and waiting time for implementation and payment. Vegetative buffers are excellent management practices for agricultural areas because they require little space and are successful at controlling impacts of runoff.
Figure B-13: Potential locations for vegetated buffers within the Upper Cohansey River Watershed.

Upper Cohansey River Watershed Restoration and Protection Plan April 5, 2011
81
A farmer who was interested in the program would apply to enter the program. The application included where the buffer will be, the existing slope of the land, and a proposed width of the buffer. After application is approved the farmer should be supplied with the appropriate amount of seed to create the buffer. The farmer will use the same practices that he or she uses for planting his or her crops to install the buffer. Clear the land of existing vegetation, plant the seed and allow time to grow. The agency that manages the program should be stay in contact with the farmer while he or she participates in the program and the status of the buffer should be checked from time to time to ensure the farmer is maintaining the buffer to allow it to function properly.
Maintenance
Vegetated filter strips are expected to trap debris and sediment therefore they must be inspected for clogging and excessive debris and sediment accumulation at least four times annually and after every storm exceeding 1 inch of rainfall. Sediment removal should take place when the filter strip is thoroughly dry. Disposal of debris and trash should be done only at suitable disposal/recycling sites and must comply with all applicable local, state, and federal waste regulations. (NJDEP, 2004)
Mowing of filter strips must be performed on a regular schedule based on specific site conditions (typically once every six months is the minimum). Turf grass should be mowed at least once a month during the growing season. If the buffer contains shrubs and/or trees, then mowing should not occur. Vegetated stream buffers must be inspected at least annually for erosion and scour. Vegetated buffer areas should also be inspected at least annually for unwanted growth, which should be removed with minimum disruption to the planting soil bed and remaining vegetation. When establishing or restoring vegetation in the stream buffer, biweekly inspections of vegetation health should be performed during the first growing season or until the vegetation is established. Once established, inspections of vegetation health, density, and diversity should be performed during both the growing and non-growing season at least twice annually. All use of fertilizers, mechanical treatments, pesticides and other means to assure optimum vegetation
Refers to cropland and pastureland agricultural land uses (NJDEP, 2002)
Refers to agricultural buffers installed by the CSCD
Refers to cropland and pastureland agricultural land uses (NJDEP, 2002)
Refers to agricultural buffers installed by the CSCD
Figure B-14: Vegetated agricultural buffers installed by the CSCD.

Upper Cohansey River Watershed Restoration and Protection Plan April 5, 2011
82
health must not compromise the intended purpose of the vegetative filter. All vegetation deficiencies should be addressed without the use of fertilizers and pesticides whenever possible. All areas of the filter strip should be inspected for excess ponding after significant storm events. Corrective measures should be taken when excessive ponding occurs. (NJDEP, 2004)
Cost
The cost of this program and project in particular is from the filter strip program that existed in this watershed. It will cost $600 for seed, and administrative fees or about $0.42 per linear foot of a 30 foot wide strip. The farmers will be paid $200 a year to maintain each acre of filter strip or $0.14 per linear foot of a 30 foot wide strip. Financial and technical assistance is available through New Jersey Department of Agriculture (NJDA) Soil and Water Soil and Water Conservation Cost-Share Program and NRCS’s Farm Bill Programs. In addition, New Jersey Conservation Reserve Enhancement Program (NJCREP) funds are also available for cost-sharing of agriculture buffer projects with farmers. More information on NJCREP can be found at: http://www.fsa.usda.gov/FSA/webapp?area=home&subject=copr&topic=cep.
Prioritization
This program is on a volunteer basis by the land owner. As shown by the involvement of farmers in the first round of vegetated buffers installed with the CSCD, there is a strong interest in willing participation with this form of water quality improvement. Priority sites will be chosen in cooperation with the CSCD.
Expected Results
Following the designs standards outlined in this document the vegetative buffers installed should remove 70% of the TSS from runoff and 30% of the nitrogen and phosphorus in the runoff. There is no removal rate of bacteria for vegetative filter strips, but it is fair to assume that the bacteria act as particles much like fecal coliform and the removal rate should be similar because the same mechanism expected to reduce TSS will reduce bacteria.
References
Federal Interagency Stream Restoration Working Group (FISRWG), 1998, Stream Corridor Restoration: Principles, Processes, and Practices. GPO Item No. 0120-A; SuDocs No. A 57.6/2:EN3/PT.653. ISBN-0-934213-59-3.
New Jersey Department of Environmental Protection (NJDEP), 2002, NJDEP Aerial Photography of Salem County. Trenton, NJ.
New Jersey Department of Environmental Protection (NJDEP), 2004, New Jersey Stormwater Best Management Practices Manual. Division of Watershed Management. Trenton, NJ.
New Jersey Department of Environmental Protection (NJDEP), 2006, NJDEP Aerial Photography of Salem County. Trenton, NJ.

Upper Cohansey River Watershed Restoration and Protection Plan April 5, 2011
83
Current Conditions
Outdated systems, lack of maintenance, and improper use have been identified as reasons for failure of onsite wastewater treatment systems in this region. According to community feedback and discussions with local inspectors/pumpers, education is needed on how to maintain and care for decentralized treatment systems. Through partnership with county health departments, an effort will be undertaken to educate homeowners with support from municipalities, identification of appropriate public service announcements, and K-12 education materials. Also distribution of educational materials can be administered with the help of pumping/inspecting companies that operate in the watershed, tax mailers, and newspaper articles. Working with septic-related businesses in the watershed will help to correct misconceptions and misuse that are currently in practice at some residences.
Overall, the majority of the watershed’s homeowners rely on septic for wastewater treatment (Figure B-15). It is estimated that more than 600 residences rely on septic systems and cesspools for wastewater treatment in the Upper Cohansey River Watershed. The USEPA reports that septic system failure rates typically range from 10-20%, which would be 61-121 residences per year dealing with septic system failure. Failure has been defined by the USEPA as wastewater ponding on the surface or backing up into the home (USEPA, 2002). In neighboring states such as New York, the reported failure rate is 4% (Nelson, Dix, and Shepard, 1999). With appropriate targeted education and availability of resources, this 4% failure rate could be achieved in the Upper Cohansey River Watershed, which would reduce the number of failing systems in the Upper Cohansey River Watershed to 24 systems, resulting in a significant reduction in pathogens and nutrients impacting surface waters. Currently, the pathogen load in the Upper Cohansey River ranges from 107 – 109 col/day during dry weather and 109 – 1011 col/day during wet weather.
Decentralized Wastewater Treatment Outreach and Education
Figure B-15: Areas served by centralized wastewater treatment.

Upper Cohansey River Watershed Restoration and Protection Plan April 5, 2011
84
Table B-2: Fecal coliform load per subwatershed based on 2006 water quality monitoring.
Dry Weather Mean FC Load
Wet Weather Mean FC LoadIndividual
Catchments col/day col/day C1 -4.70E+10 -4.08E+11
C2 2.54E+09 6.01E+10
C3 2.55E+10 2.92E+11
C4 7.10E+08 -2.03E+11
C5 1.11E+10 2.37E+11
C6 1.52E+09 7.07E+10
CL1 7.15E+07 2.27E+10
CL2 1.12E+09 7.90E+09
FR1 2.89E+10 4.47E+11
HR1 7.51E+09 7.75E+10
Septic systems from typical residential units will discharge 106 – 108 most probable number (MPN) of fecal coliforms per 100 mL (Bauer et al., 1979; Bennett and Linstedt, 1975; Laak, 1975; Sedlak, 1991; Tchobanoglous and Burton, 1991), and a reported volume of wastewater from a toilet is 70 liters per person per day (Mayer et al., 1999). Even with a failing septic system, unless the wastewater is being trenched illegally directly to the stream, the effluent will undergo some die-off naturally through soil infiltration and biological degradation. A worst-case scenario for water quality is pooled wastewater from a failing system mobilized by rainfall, entering the stream. This would result in effluent high in nutrients, pathogens and metals impacting local water quality.
In addition to water quality protection yielded from improved septic education and use, this project should engage municipalities in investigating management goals and opportunities. Management programs should be tailored to a municipality’s capabilities, as well as their needs. Management programs typically are more stringent with increasing risks to public health and the environment. Management programs should include specific program goals, public education tasks, record management, technical guidelines for site evaluation, construction, and operation/maintenance, system inspections and maintenance monitoring, and may also include licensing and certification of inspectors, installers, and pumpers (USEPA, 2002). Consultation will be given to municipalities to identify their goals for decentralized management and approaches to reach those goals. Management, though initially difficult to discuss, is a long-term solution to decentralized wastewater problems, management will provide both a strategy and funding source for improving current conditions.
Implementation
This outreach campaign will begin with a homeowner survey to better understand the homeowners’ understanding of how a septic system works and the care and maintenance required. Feedback from this survey will direct educational materials that are adapted and/or developed and methods used to effectively reach homeowners. Educational materials will be re-

Upper Cohansey River Watershed Restoration and Protection Plan April 5, 2011
85
tooled or developed to fit the population’s needs. If educational programs are highlighted through the needs survey, then an evening program will be developed to target the residents of Cumberland and Salem Counties.
Following this initial educational campaign, a web-based follow-up survey will be launched to identify the effectiveness of this outreach program. Results of this survey will be compared to original survey results. Newspaper articles will be written to announce the program’s effectiveness, and a final implementation report will summarize the results of this work.
Estimated Project Costs
Completing the Homeowner Needs Survey: $6,000 Adaptation and Development of Educational Programs: $8,000 Consultation with Municipalities: $5,000 Survey of Program Effectiveness: $6,000 Development of Implementation Report: $1,500
The total direct cost of implementation is estimated at $26,500, which includes production and distribution of educational materials tailored to meet the area’s needs.
Post Implementation Monitoring
As indicated above, post-implementation monitoring will be conducted as part of this implementation project. Success will be measured in terms of improved understanding of working septic systems and number of homeowners educated. Success will also be measured by long-term correspondence with the septic inspectors and pumpers working in these communities.
This can be related to water quality using the USGS monitoring station 01482500, Cohansey River at Seeley Lake. It is expected that improvement will be demonstrated at this monitoring station, which requires no additional cost.
References
Bauer, D.H., E.T. Conrad, and D.G. Sherman, 1979, Evaluation of On-Site Wastewater Treatment and Disposal Options. U.S. Environmental Protection Agency, Cincinnati, OH.
Bennett, E.R. and E.K. Linstedt, 1975, Individual Home Wastewater Characterization and Treatment. Completion report series no. 66. Colorado State University, Environmental Resources Center, Fort Collins, CO.
Laak, R., 1975, Relative Pollution Strengths of Undiluted Waste Materials Discharged in Households and The Dilution Waters Used for Each. In Manual of Grey Water Treatment Practice. Ann Arbor Science, Ann Arbor, MI.
Upper Cohansey River Watershed Restoration and Protection Plan April 5, 2011
86
Mayer, P.W., W.B. DeOreo, E.M. Opitz, J.C. Kiefer, W.Y. Davis, B. Dziegielewski, and J.O. Nelson, 1999, Residential End Uses of Water. Report to AWWA Research Foundation and American Water Works Association (AWWA), Denver, CO.
Nelson, V.I., S. P. Dix, and F. Shepard, 1999, Advanced On-Site Wastewater Treatment and Management Scoping Study: Assessment of Short-Term Opportunities and Long-Run Potential. Prepared for the Electric Power Research Institute, the National Rural Electric Cooperative Association, and the Water Environment Federation.
Sedlak, R. ed., 1991, Phosphorus and Nitrogen Removal from Municipal Wastewater, Principles and Practice. 2nd ed. The Soap and Detergent Association. Lewis Publishers, New York, NY.
Tchobanoglous, G. and F.L. Burton, 1991, Wastewater Engineering: Treatment, Disposal, Reuse, 3rd ed. McGraw-Hill, Inc., New York, NY.
US Environmental Protection Agency, 2002, Onsite Wastewater Treatment Systems Manual, EPA/625/R-00/008. Washington, D.C.

Upper Cohansey River Watershed Restoration and Protection Plan April 5, 2011
87
Bioretention Basin and Vegetated Swale in the Harrow Run Watershed
Current Conditions
The land use of the 117 acres treated by the proposed bioretention basin and swale is agriculture row crops and field nursery. The proposed project site is located in the HR1 subwatershed, which has been identified as a priority subwatershed for TP management (Figure B-16). Currently, runoff from the nursery flows through a mowed grassed channel, but rapid flow and a bend in the channel are leading to erosive conditions and undercutting at the road (Figure B-17).
Description
A bioretention system consists of a soil bed planted with native vegetation located above an underdrain sand layer. Bioretention can be in the form of a swale or a basin. A swale is a grassed channel that routes water from one point to another. While traveling through the swale, some of the flowing water infiltrates into the ground. A bioretention basin is a small depression in the ground that holds water in place while it infiltrates. Basins are sized to hold the runoff from one to five acres of land; they can be used in succession for drainage areas larger than 5 acres. Stormwater runoff entering the bioretention system is filtered first through the vegetation and then the sand/soil mixture before being conveyed downstream by the underdrain system or discharged to groundwater (Figure B-18). Runoff storage depths above the planting bed surface are typically shallow. The accepted TSS removal rate for bioretention systems is 90% (NJDEP, 2004).
Bioretention systems are used to remove a wide range of pollutants, including TSS, nutrients, metals, hydrocarbons, and pathogens from stormwater runoff. They can also be used to reduce peak runoff rates and increase stormwater infiltration when designed as a multi-stage, multi-function system. Bioretention systems have estimated removal efficiencies of 60% and 30% for TP and TN, respectively (NJDEP 2004). A bioretention column study found removal efficiencies averaging 91.5% for TSS and 91.6% for fecal coliform (Rusciano and Obropta, 2007).
The areas proposed for bioretention and swale installation are shown in orange on Figure B-17. This is an estimation from visual inspections of the natural and unnatural drainage of the site with existing stormwater controls. Runoff from row crops in the northeastern area of the site drains towards the three areas of proposed bioretention. Stormwater is then piped under the road and flows overland to the tailwater recovery pond. Visual inspections of the tailwater recovery
Figure B-16: Photograph of site.

Upper Cohansey River Watershed Restoration and Protection Plan April 5, 2011
88
pond indicate eutrophication even during cold weather, indicative of excessive nutrients discharging to the pond.
The Cohansey River Watershed typically has very porous soil, which is advantageous to this project, avoiding the need for construction of an underdrain in this bioretention retention system.
Implementation
Construction of bioretention systems can cost between $3 to $15 per square yard (Lake Superior, 2005). For the demonstration project outlined in this document, the cost would range from $20,000 to $100,000. This estimated cost is probably lower because there will be no underdrain in this system Potential Funding Sources:
NJDEP 319 (h) Grants (http://www.state.nj.us/dep/watershedmgt/319grant_sfy2005_projects.htm);Watershed Institute Grants Program (http://www.thewatershedinstitute.org/resources/twig/);Watershed Protection and Flood Prevention Program (http://www.nrcs.usda.gov/programs/watershed/); Clean Water State Revolving Fund (http://www.epa.gov/owm/cwfinance/cwsrf/index.htm);Infrastructure Trust Fund (http://www.njeit.org/); NRCS Farm Bill and other conservation programs (http://www.nj.nrcs.usda.gov/programs/index.html);NJDA’s Soil and Water Conservation Cost-Share Program (http://www.state.nj.us/agriculture/grants/soil.html).
Figure B-17: Aerial View of Acres Treated (NJDEP, 2006)

Upper Cohansey River Watershed Restoration and Protection Plan April 5, 2011
89
Checklist for construction: Soil Erosion Sediment Control Permit (minimum of $820) available through the CSCD; Heavy equipment to clear, excavate and re-grade site; Plants (herbaceous plugs); Soil stabilizing material (mulch or coconut or straw matting).
Post Construction Maintenance
Bioretention systems must be inspected for clogging and excessive debris and sediment accumulation at least four times annually as well as after every storm exceeding 1 inch of rainfall. Sediment removal should take place when the basin is thoroughly dry. Disposal of debris, trash, sediment, and other waste material should be done at suitable disposal/recycling sites and in compliance with all applicable local, state, and federal waste regulations. (NJDEP, 2004)
Mowing of bioretention system can be performed on a regular schedule based on specific site conditions (once every six months is the minimum). Grass should be mowed at least once a month during the growing season. Vegetated areas must be inspected at least annually for erosion and scour. Vegetated areas should also be inspected at least annually for unwanted growth, which should be removed with minimum disruption to the planting soil bed and remaining vegetation. When establishing or restoring vegetation, biweekly inspections of vegetation health should be performed during the first growing season or until the vegetation is established. Once established, inspections of vegetation health, density, and diversity should be
Figure B-18: Typical Profile of a bioretention system with optional underdrain system
(NJDEP, 2004)

Upper Cohansey River Watershed Restoration and Protection Plan April 5, 2011
90
performed during both the growing and non-growing season at least twice annually. All use of fertilizers, mechanical treatments, pesticides and other means to assure optimum vegetation health must not compromise the intended purpose of the vegetative filter. All vegetation deficiencies should be addressed without the use of fertilizers and pesticides whenever possible. The bioretention system should be inspected for excess ponding after significant storm events. Corrective measures should be taken when excessive ponding occurs (NJDEP, 2004).
The system’s drain time should be evaluated after rain storms larger than 1”. If the drain time is longer than 72 hours, they system needs to be evaluated to find a way decrease the drain time to at least 72 hours, which is the maximum drain time allowed by NJDEP (NJDEP, 2004).
References
New Jersey Department of Environmental Protection (NJDEP), 2004, New Jersey Stormwater Best Management Practices Manual. Division of Watershed Management. Trenton, NJ.
New Jersey Department of Environmental Protection (NJDEP), 2006, NJDEP Aerial Photography of Salem County. Trenton, NJ.
Lake Superior Streams, 2005, LakeSuperiorStreams: Community Partnerships for Understanding Water Quality and Stormwater Impacts at the Head of the Great Lakes (http://lakesuperiorstreams.org). University of Minnesota-Duluth, Duluth, MN
Rusciano, G.M. and C.C. Obropta, 2007, Bioretention Column Study: Fecal Coliform and Total Suspended Solids Reductions. Trans. of the ASABE., 50(4) 1261-1269.

Upper Cohansey River Watershed Restoration and Protection Plan April 5, 2011
91
Detention Basin Retrofit Designs
Current Conditions
The Cohansey River Watershed has been listed in the New Jersey Integrated Water Quality Monitoring and Assessment Report, which includes the 305(b) Report and 303(d) List, as impaired for phosphorus, total suspended solids (TSS) and bacteria. Stormwater runoff from developed areas is a primary source of these pollutants. Although runoff from some developed sites is managed with detention basins, these systems are mainly designed to reduce downstream flooding and do little to address water quality. In most cases, detention basins can be retrofitted to enhance their pollutant removal capabilities and achieve water quality improvements.
Many of these detention basins can be altered or retrofitted to improve their ability to remove TSS and phosphorus loads from stormwater runoff and achieve water quality improvements. If these improvements are made correctly, they could improve water quality, as well as reduce maintenance costs. There are only a few detention basins in the Cohansey River watershed but they are found in subwatershed that has been identified as a significant source of pollution for the watershed. This document reviews several recommendations to improve the water quality of a detention basin’s effluent. These recommendations can be incorporated into future designs of proposed detention basins because there is still development in the Cohansey River Watershed.
Detention Basin Retrofit Design Alternatives
The rainfall event used to analyze and design stormwater best management practices (BMPs) for water quality improvements is the “water quality storm” of 1.25 inches of rain over two hours. This storm can be used to compute runoff volumes and peak rates to ensure that stormwater quality BMPs, whether they are based on total runoff volume or peak runoff rate, will provide a standard level of stormwater pollution control. Since approximately 90% of storms in New Jersey are typically smaller than the water quality storm, BMP designs and retrofits that treat these small storms will have a significant impact on improving water quality in the watershed.
Low Flow Vegetated Channel
A common design feature for detention basins is a low flow concrete channel that carries runoff from the inlets to the outlet structure of the detention basin. This feature is intended to force water to quickly pass through the basin during small storm events to avoid ponding and maintenance issues. Due to sediment and debris accumulation in these channels and the lack of regular maintenance, these channels frequently tend to clog, causing ponding of water in the channel. The small stagnant ponds become ideal mosquito breeding habitat, thereby creating a problem they originally intended to avoid.
Low flow concrete channels act as an impediment to improving water quality in a detention basin. It is recommended to remove the concrete channel and replace it with a vegetated swale
Upper Cohansey River Watershed Restoration and Protection Plan April 5, 2011
92
(see attached detail). The swale should have a 0.1% side slope to ensure easy maintenance and a slope not exceed 3%. The swale should be seeded with native grasses to minimize maintenance. Where possible, replacement soils should be installed with the top 1.5 feet of soil composed of a bioretention soil mix to encourage infiltration (see detail). Below this infiltration media, a 6” layer of 3/4” diameter clean stone should be installed. The native vegetation in the swale should be cut once or twice a year.
Dense native vegetation creates friction along the flow path of runoff through the detention basin. This friction slows the water allowing sediment to settle out. Water will be held in the detention basin longer increasing infiltration and allowing the vegetation to take up nutrients carried in stormwater runoff. Finally, native vegetation that is allowed to grow taller will develop a deep root structure allowing a much greater infiltration rate than soil with short turf grass. The channel should be designed to infiltrate and pass water through within 48 hours after a storm to prevent mosquito breeding.
Low Flow Rip-Rap Channel
This design is similar to the vegetated channel but instead of vegetation, the channel is filled with rip-rap stone. The channel should not be any wider than 10 feet with the bottom at least three feet above the seasonal-high groundwater elevation. The channel should be designed to hold the runoff volume of the water quality storm from the detention basin’s drainage area. The infiltration rate of the soil where the channel will be installed should be taken into consideration before sizing. The channel will infiltrate any storm equal to or smaller than the water quality storm within 48 hours.
When retrofits are installed, the concrete channel should be completely removed.
¾” Stone Filled Sock
Many municipalities are hesitant to remove the low flow concrete channel in detention basins. There is an alternative method that will yield similar results that requires alterations be completed for only a small section of the low flow concrete channel to work; the section is approximately 8” wide. Contractors can fill an 8” diameter sock with ¾” clean stone that is then set in the detention basin and surrounds the outlet of the detention basin. Any runoff must pass through the sock before it enters the outlet. Since, the v-shape of the low flow concrete channel will not allow the sock to rest on the bottom of the channel; water will be able to pass underneath the sock. Therefore, only a section as wide as the sock should be removed from the low flow concrete channel. This will ensure that all the runoff entering the basin must pass through the sock before it exits the basin.
The purpose of the sock is to act as a check dam in the basin. The stone-filled sock will reduce the speed of the runoff in the basin and promote more ponding of stormwater. This will provide the stormwater a larger contact area with the bottom of the basin promoting more infiltration and treatment. The stone-filled sock will act as a rough filter to remove sediment and nutrients attached to the sediment from the water column and allow to pond to slowly drain to the outlet

Upper Cohansey River Watershed Restoration and Protection Plan April 5, 2011
93
structure. Higher flows will overtop the sock and make its way to the outlet structure, maintaining the flow control capacity of the basin.
Native and Low Maintenance Grasses and Vegetation
Detention basins with turf grass provide for minimal infiltration. Turf grass has a shallow root structure that does not open up the soil below the surface allowing water to infiltrate. By introducing native grasses and reducing the frequency of mowing from once a week to once or twice a year (in the winter), native grasses develop a deep root structure. The height of grass is directly proportional to the depth of the root structure. Limiting mowing and allowing the grass to grow taller will ensure development of a deep root structure. This method reduces maintenance costs due to less mowing and improves water quality through increases in infiltration and subsequent decreases in stormwater discharges to nearby waterways.
Additionally, many basins throughout New Jersey are over-compacted, thereby limiting their infiltration capacity. Although the root structure of native vegetation may increase infiltration rates, some of these over-compacted basins may need to be deep-tilled to loosen up the soil, and soil amendments may need to be added. Promoting infiltration in these basins is important to improve water quality in the watershed.
Location
Only four detention basins are to be located within the Upper Cohansey River Watershed (Figure B-19).
Implementation
The modifications of the detention basins should take a short amount of time. Although heavy equipment may be needed to remove the concrete channel and install the vegetative channel, precautions should be taken to avoid over-compacting the basin. This can be done by minimizing the use of heavy equipment. Deep-tilling may be needed to loosen the soil in areas where heavy equipment is driven if compaction does occur. The native grass will be seeded in the basins after the turf grass in the basin has been eliminated with an herbicide. Seed will need to be covered and protected from erosion.
The detention basins must be inspected for excessive debris and sediment accumulation at least four times annually, as well as after every storm exceeding one inch of rainfall. Sediment removal should take place when the basin is thoroughly dry. Disposal of debris, trash, sediment, and other waste material should be done at suitable disposal/recycling sites and in compliance with all applicable local, state, and federal waste regulations (NJDEP, 2004).
Mowing of these newly vegetative basins must be performed on a regular schedule based on specific site conditions (once every six months). Vegetated areas must be inspected at least annually for erosion, scour and unwanted growth, which should be removed with minimum disruption to the planting soil bed and remaining vegetation. When establishing or restoring vegetation, biweekly inspections of vegetation health should be performed during the first

Upper Cohansey River Watershed Restoration and Protection Plan April 5, 2011
94
growing season or until the vegetation is established. Once established, inspections of vegetation health, density, and diversity should be performed during both the growing and non-growing season at least twice annually. Use of fertilizers, mechanical treatments, pesticides and other means to assure optimum vegetation health must not compromise the intended purpose of the vegetative filter. Vegetation deficiencies should be addressed without the use of fertilizers and pesticides whenever possible. The vegetative detention basin system should be inspected for excess ponding after significant storm events. Corrective measures should be taken when excessive ponding occurs (NJDEP, 2004).
Cost
The cost of the detention basin will vary depending on the amount of work that needs to be done to improve the detention. If the detention basin needs to be excavated and replanted the cost would be approximately $2 to $4 per square foot of the detention basin. When a detention basin needs to be re-vegetated the cost to improve the detention basin is $0.25 to $2 per sq. ft. The cost estimates vary because the designs to improve the detention basins have so much flexibility to them. The cost to remove a low flow concrete channel is approximately $100 per linear foot of low flow channel.
Expected Results
Retrofit designs should target infiltration of runoff generated from the water quality storm. Since approximately 90% of all storms in each year in New Jersey come in storms smaller than the water quality storm, this will have a dramatic effect on water quality in the watershed. While it is hard to measure the exact effect, the basins will have many of the same characteristics as a vegetated filter strip. It is difficult to estimate the reductions for each pollutant because many of the functions of the basin will be enhanced by the proposed changes. Targeted reductions in TSS, total nitrogen and total phosphorus are expected to be 90%, 60% and 30%, respectively. Depending on the final design of the detention basin, it will function like a bioretention basin or a wetland. The removal rates for bioretention basins and wetlands are at or above 90% for fecal coliform (Karathanasis 2003; Rusciano and Obropta, 2007). Since drainage areas for each basin were not readily available it is impossible to estimate the total pounds of pollutants removed by retrofitting the detention basins in the Neshanic River Watershed.
References
Karathanasis, A. D., C. L. Potter, and M. S. Coyne, 2003, Vegetation Effects on Fecal Bacteria, BOD, and Suspended Solid Removal in Constructed Wetlands Treating Domestic Wastewater. Ecological Engineering, 20(2): 157-69.
New Jersey Department of Environmental Protection (NJDEP), 2004, New Jersey Stormwater Best Management Practices Manual. Division of Watershed Management. Trenton, NJ.
Rusciano, G.M. and C.C. Obropta, 2007, Bioretention Column Study: Fecal Coliform and Total Suspended Solids Reductions. Trans. of the ASABE., 50(4) 1261-1269.

Upper Cohansey River Watershed Restoration and Protection Plan April 5, 2011
95
Figure B-19: Location of detention basins in subwatershed FR1 of the Upper Cohansey River Watershed.

Upper Cohansey River Watershed Restoration and Protection Plan April 5, 2011
96
Addressing Livestock Fencing Needs
Current Conditions
Livestock-related runoff and direct discharge of waste can be a major pathogen and nutrient concern, as well as impact other water quality parameters and stream conditions. To remediate this issue, livestock fencing around rivers and streams can prevent livestock from having direct access and reduce the potential for pathogens to enter surface waters. Fencing also provides a physical space between livestock and the waterway where vegetated filter strips should be installed to filter and treat runoff, as well as improve ecological diversity and stream stability. There are not many situations that call for animal fencing in the Upper Cohansey River Watershed but they are suspected to be large sources pathogens.
By restricting livestock access to the surface waters with fencing, landowners can quickly eliminate direct discharges of pathogens and nutrients to surface waters. With fencing setbacks, there will be ample room for a vegetated filter strip to buffer contaminants entering the stream from overland flow, as well as improve stream stability at the location where livestock are currently entering the river. Vegetative filter strips have a removal efficiency of 30% for phosphorus and nitrogen and 80% removal efficiency for TSS (NJDEP, 2004). The one major concern for the landowner and livestock owner is finding an alternative water supply for the animals. Providing a watering facility (NRCS Conservation Practice Standard #614) is eligible for cost-sharing funds. Water and feed should be provided for the livestock at the opposite corner of the property at the highest elevation, so that runoff can be minimized.
Location
The location of potential livestock fencing projects is shown in Figure B-20. The criteria for site selection were any portion of stream or water body that was surrounded by agricultural land and appeared to hold livestock from the 2006 NJDEP aerials was chosen as a potential site for this BMP. This is projected to result in approximately 3,600 feet of livestock fencing in the Upper Cohansey River Watershed (Figure B-20).
Prioritization
There are only three sites for the entire watershed that have been selected for this practice. The RCE Water Resources Program did not rank any of these projects above another because of the small number of projects proposed. The RCE Water Resources Program would recommend the most northern site as the first to implement. This project would serve as a great demonstration project due its high visibility.
Cost
There are several different types of fencing that can be used in this project (electrified polywire, high tensile electrified wire, high tensile non-electrified wire, barbed wire or woven wire) and

Upper Cohansey River Watershed Restoration and Protection Plan April 5, 2011
97
each have similar costs. The cost for installing a fence can range from $1.00 to $2.00 per linear foot (Meyer and Olsen, 2005); with an estimated 3,600 linear feet of lands needing fencing, a total of $3,600.00 to $7,200.00 would be needed to fence all projected areas within the Upper Cohansey River Watershed. Both fencing and creation of a watering facility are projects eligible for cost-sharing through NRCS. These funds can be combined with NJDEP 319 (h) implementation funds to help offset costs. These costs do not include any additional costs accrued due to the inclusion of a vegetated buffer to improve water quality (see Vegetated Buffers section in Appendix B for more information on costs).
Expected Results
If livestock fencing alone is installed, benefits to water quality would be expected. Previous research has not quantified water quality benefits of livestock fencing alone but models are capable of approximating these benefits. The EPA Spreadsheet Tool for Estimating Pollutant Load (STEPL) model, for example, can be used to estimate a reduction in nutrient and bacterial loads if fencing is included in the model (Michigan Department of Environmental Quality, 1999). Providing an alternate watering source for livestock, in addition to fencing, has been estimated to reduce TSS by 90%, total nitrogen by 54%, and TP by 81% (Agouridis et al., 2005).Following state design standards, vegetative buffers installed in areas between the fencing and the waterway should remove 70% of the TSS in the runoff that it filters throughout the year and 30% of the nitrogen and phosphorus in the runoff (NJDEP, 2004). There is no removal rate of bacteria for vegetative filter strips, but it is fair to assume that the bacteria act as particles much like fecal coliform and the removal rate should be similar because the same mechanism expected to reduce TSS will reduce bacterial concentrations. Livestock fencing in North Carolina in conjunction with tree plantings reduced TSS by 82.3% and TP by 78.5% (Agouridis et al., 2005).
References
Agouridis, C.T., S.R. Workman, R.C. Warner, and G.D. Jennings, 2005, Livestock Grazing Management Impacts on Stream Water Quality: A Review. J. of Amer. Water Res. Assoc. 41(3): 591-606.
Meyer, R. and T. Olsen, 2005, Estimated Costs for Livestock Fencing. File B1-75 Fact Sheet. Iowa State University Extension. Ames, IA.
Michigan Department of Environmental Quality, 1999, Pollutants Controlled Calculation and Documentation for Section 319 Watersheds: Training Manual. Surface Water Quality Division. Lansing, MI.
New Jersey Department of Environmental Protection (NJDEP), 2004, New Jersey Stormwater Best Management Practices Manual. Division of Watershed Management. Trenton, NJ.

Upper Cohansey River Watershed Restoration and Protection Plan April 5, 2011
98
Figure B-20: Potential locations for livestock fencing in the Upper Cohansey River Watershed.

Upper Cohansey River Watershed Restoration and Protection Plan April 5, 2011
99
APPENDIX C: ENGINEERING PLANS FOR IMPLEMENTATION PROJECTS TO ADDRESS KNOWN WATER QUALITY
IMPAIRMENTS IN THE UPPER COHANSEY RIVER

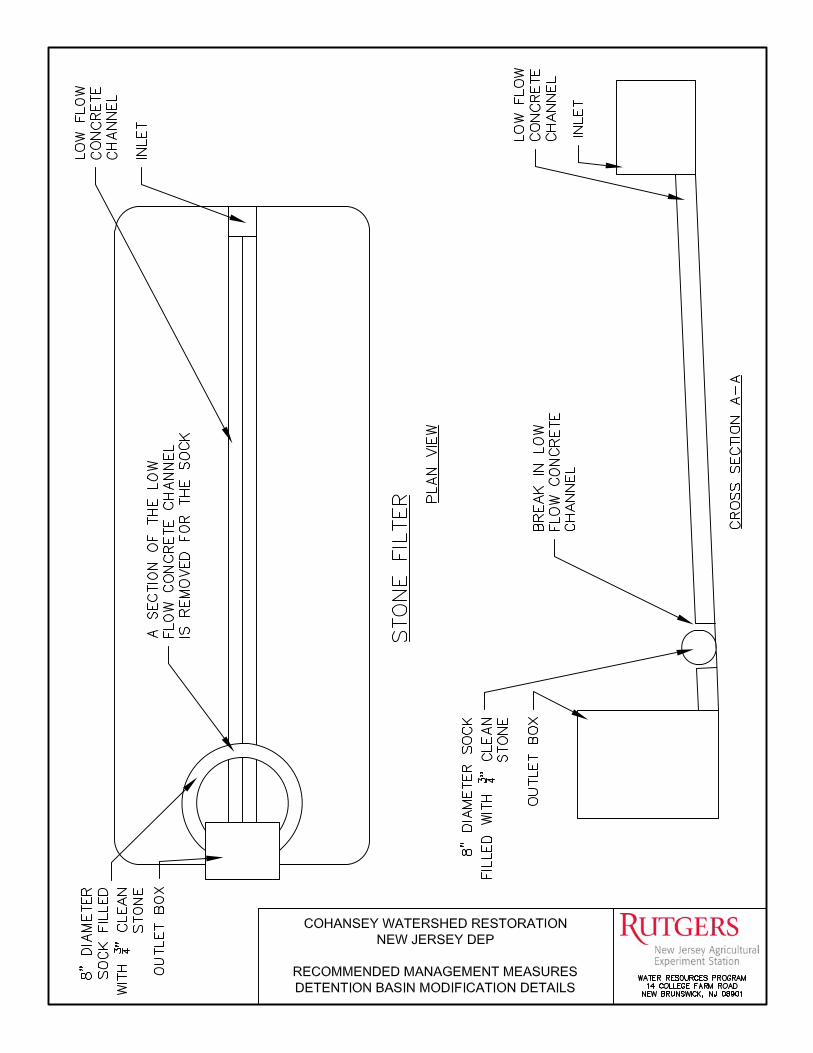
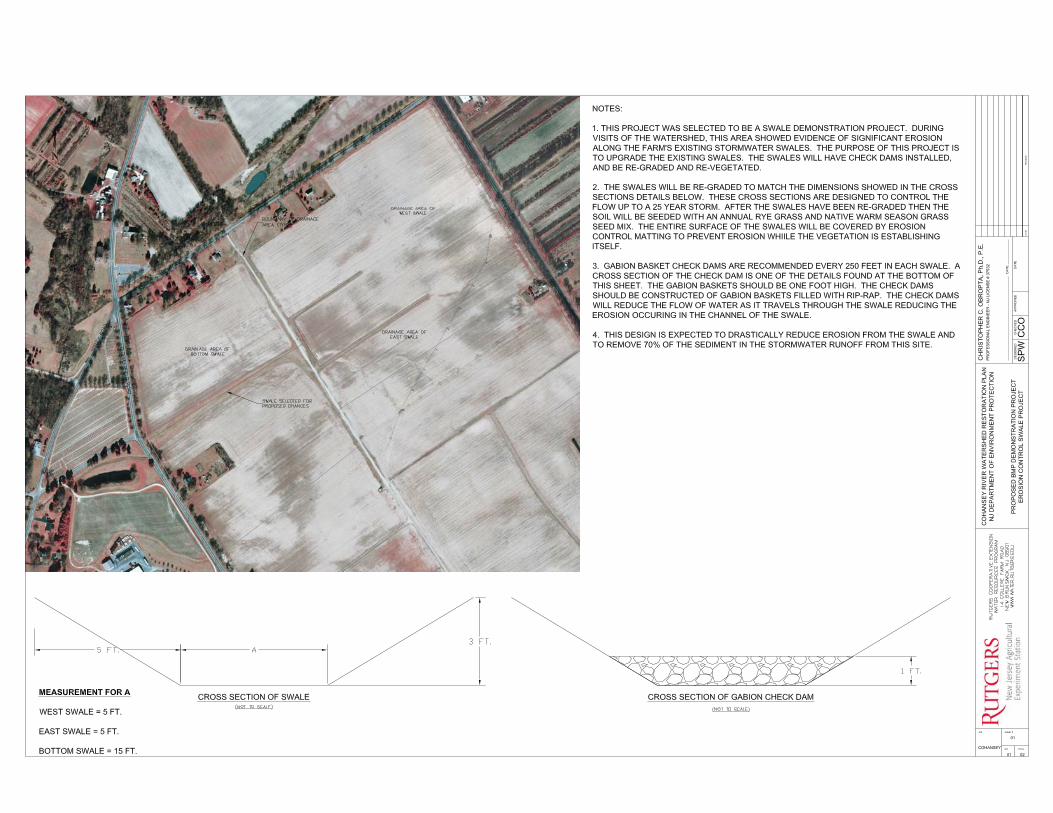


Upper Cohansey River Watershed Restoration and Protection Plan April 5, 2011
100
APPENDIX D: SOIL, WATER, NUTRIENT AND PESTICIDE AGRICULTURAL MANAGEMENT PRACTICES FOR FIELD
NURSERIES IN THE UPPER COHANSEY RIVER WATERSHED

Soil, Water,Nutrient and Pesticide
Agricultural Management Practices for
Field Nurseriesin the
Upper Cohansey River Watershed
James Johnson Dr. Salvatore Mangiafico Agricultural Agent Environmental and Resource Management Agent Cumberland County Cumberland & Salem Counties

Field Nursery AMP Page 2 of 28 7/16/09

Field Nursery AMP Page 3 of 28 7/16/09
Table of Contents Introduction 4Nursery design 5
1. Site selection 2. Site development and layout 6
Irrigation management 71. Water quantity and quality 2. Water use certification 3. Water system design 8
a. Water treatment b. Water system management
i. When to irrigate ii. Cyclic irrigation 9 iii. Irrigation for heat or cold protection iv. Micro-irrigation
Nutrient management 101. Soil fertility
a. Soil amendments 11 b. Non-crop area management during production c. Soil conservation 12
i. Table 1: Ground Cover Crops 13 2. Fertilization 14
a. Fertigation procedures Pest management 15
1. Pest management planning 2. Rules and regulations 16
a. Pesticide use certification program b. Employee requirements c. Reporting
3. Monitoring pest populations 4. Pesticide applications 17 5. Fumigation 186. Operation and maintenance for pesticide management equipment
a. Storageb. Mixing and rinsing stations 19 c. Pre-planting weed management planning d. Pesticide considerations
7. Guidelines for using pre-emergence herbicides 20 8. Guidelines for using post-emergence herbicides
a. Post-emergence herbicide considerations 21 9. Guidelines for weed control without the use of herbicides
Glossary 22Useful References 24Appendices
1. Fertilizer Applications Record Sheet 25 2. Fertilizante Aplicación Tablero 26 3. Pesticide Application Record Sheet 27 4. Peste Aplicación Tablero 28

Field Nursery AMP Page 4 of 28 7/16/09
IntroductionWithin New Jersey, the Cumberland/Salem/Gloucester area accounts for nearly half the nursery acreage in the
state while the Monmouth/Burlington area adds over 25% more. The Southern region of Cumberland, Salem and Gloucester Counties has continued to expand while areas north have either remained stable or decreased in acreage.
New Jersey has many attributes that make it an ideal spot to produce nursery plants. The marketing potential is great since it is geographically located in the center of the BosWash megalopolis. The conglomeration of cities that makes up the megalopolis is around 500 miles long from the areas of Boston, Massachusetts to Washington, DC and has a population of approximately 44 million people. That represents about 16% of the total population of the United States.
Soils, water resources and environmental factors make Southern New Jersey optimal for nursery plant production. Soils are somewhat variable from very sandy to silt loams. This allows a wide range of plant material to be grown. Southern New Jersey sits atop the Cohansey aquifer. It is one of the largest aquifers on the East coast of the US. The environment is moderated by the Atlantic Ocean and the Delaware Bay. As a consequence, it has a similar hardiness zone to central North Carolina.
New Jersey is an expensive state in which to conduct business. The cost of land and higher than average operational costs force producers to find ways to maximize production while also protecting the environment. These factors provide significant challenges that require good managerial leadership. Profitability has a direct relationship to the time it takes to produce the crop and plant population density.
Interest in planting field-grown nursery stock has seen resurgence in recent years. This is the result of growers identifying a potentially profitable niche. It may be that the niche is there because there is a potential for increased sales of similar material, similar material of higher product quality, new or different material, or a myriad of other reasons. The marketing skills of an individual will largely determine the difference between success and failure. It has become very difficult for a business to survive for an extended period of time by just being nursery stock growers.
In a perfect world, nurseries would be designed for maximum efficiency with minimal environmental impact. In reality, few nurserymen have financial resources adequate to complete installation of an ideal facility when they are starting out in the business. However, many practices can be adopted which both increase profitability and minimize environmental impacts. If an established nursery moves to a new site, one should take advantage of the opportunity. The result of not designing from the ground up is the need for retrofitting existing nurseries that may end up costing more than a nursery built from the ground up. Planning is critically important for every nursery. No matter where one is financially, one should always plan for the future while building for the present.
When designing the nursery, pay special attention to water movement that minimizes environmental impact. Runoff water is typically higher in nutrient content than surface or groundwater. Because of the need to have minimal environmental impact, it is increasingly important to use turf between plant rows and in waterways to reduce erosion and capture nutrients. Depending on the site, a bio-filter may be important to install to enhance water quality before it leaves the nursery during significant rain events. A bio-filter uses vegetative plant material to remove pollutants from the water before it enters ground or surface waters. Wetlands plants have been shown to be quite effective at removing nutrients in biofilters while being resilient to varying water conditions.

Field Nursery AMP Page 5 of 28 7/16/09
Grouping plants by water or nutrient needs can help reduce water and nutrient use. Grouping by pesticide requirement is usually difficult but where possible may enhance pesticide use safety. Recommendations for pesticide use on nursery stock can be found in Rutgers Cooperative Extension Publication #E036: Pest Control Recommendations for Shade Trees and Commercial Nursery Crops (available online at the website listed in the References section of this document).
Nursery Design Site Selection
The ultimate success of a field nursery is highly dependent on soil characteristics. While soils in field nurseries can be amended with organic matter, native soil characteristics such as texture, drainage, profile and slope need to be suitable for production of perennial crops. Most field-grown nursery crops are produced on 1 to 7 year cycles. Knowing the history of the field including previous crops grown, types of pesticides applied (especially herbicides) and types of organic soil amendments are important since each can affect plant growth.
Field-grown nursery stock production can range from multiplication of stock material and liners that are bare-rooted to digging large material that is balled and burlapped. When producing balled and burlapped material, field soils need to be cohesive enough to maintain an intact ball. Root balls that are excessively sandy may fall apart during handling. Ideally, soils should be relatively free of large rocks and deep enough to allow easy digging. The American Standards for Nursery Stock (ANSI Z60.1) includes standard dimensions for harvesting root balls according to the size of the plant (available online at the website listed in the References section of this document).
Balled and burlapped material may be hand dug or dug by machine. Machine digging is much faster than hand digging for intermediate-sized plant material and requires less-trained individuals. With trained personnel, hand digging is usually faster with small plant material and typically becomes the only option, as root balls get very large.
Soil drainage should be considered when selecting a site. Try to avoid soils that have poor internal drainage or that are subject to flooding. Nursery stock that has been flooded is often weakened and predisposed to increased disease and insect problems. Fields being considered for nursery stock production should have a minimum of 8 to 10 inches well-drained profile but this requirement varies based on which plants are to be grown. A soil probe can be used to investigate the soil profile, in order to determine the depth and texture of soil layers and see if there are layers that may restrict root growth or water drainage. Even sandy soils can have poor drainage if there is an impervious layer, as is common in many fields. At the other extreme, deep sandy soils have relatively little water holding capacity and generally require an irrigation system to ensure successful field production. A penetrometer can be used to determine the strength of soil layers. Soil layers that require a strong force for the insertion of a penetrometer may limit root growth or water infiltration. These hard layers can be the result of soil compaction or tillage practices, or may be natural hard pans in the soil.
While flat, non-flooding fields are optimal for mechanical production practices, some slope can offer enhanced air and water drainage. As the slope increases, one should consider contour planting and the use of turf plantings between rows to reduce erosion potential. A good place to start in determining soil potentials are the “Soil Surveys” for each county prepared by the Natural Resources Conservation Service. Paper copies of some county Soil Surveys were produced as recently as 2008 but the internet-based Web Soil Survey is now the official soil survey document. Websites for these resources are listed in the References section of this document.
It is critically important to have water available to irrigate crops. Nursery transplants are expensive and avoidable losses need to be minimized. Growers also need to maximize growth to be profitable. The use of irrigation can shorten the production cycle by 1 to 2 years over non-irrigated crops. It is important to choose field production land with good water resource access. When locating a field nursery near surface bodies of water, withdrawals for irrigation should not have a negative effect on nearby surface bodies of water. The nursery also bears a responsibility to protect the surface waters from field erosion sediment and nutrient contamination. Site Development and Layout
Natural features of the land should be considered when developing a field nursery site. Consider all production operations when laying out the fields. Set them up for the best efficiency of plant maintenance,

Field Nursery AMP Page 6 of 28 7/16/09
irrigation, harvesting and maneuvering sprayers, tractors and wagons. Consider contour plantings on sloped land and plan for turfgrass waterways and field edge buffer strips to reduce erosion. Grass strips can effectively slow runoff and trap sediment, thereby reducing soil losses by 30 to 50 percent compared to bare soil. A grass strip will slow runoff water, allowing silt to settle out. Buffer strips should be established between production areas and surface water bodies including streams and lakes. The first 3 to 4 feet of buffer strips do most of the filtering. As slope increases, the number of strips needed increases and the distance between them needs to decrease. Grasses for buffer strips and grass waterways should be able to withstand wet growing conditions and still produce an aggressive root system that will take abuse and maintain a good grass mat to slow runoff and catch sediment.
What’s most important in choosing grass species for use as a buffer is to identify a species or mixture that will maintain a dense stand in the conditions of your site. Different species will thrive in different site conditions, including soil drainage, available moisture, and fertility. While some turfgrasses are more demanding in terms of water and fertilizer, tall fescue and creeping red fescue, for examples, are two rhizomatous species that may be more tolerant of drought, lower fertility and higher salts. If areas have poor drainage or will be wetted continually with runoff, other grasses or appropriate wetland plants should be chosen. A guide for choosing appropriate grass species can be found in the Rutgers fact sheet Turfgrass Seed Selection for Home Lawns (available online at the website listed in the References section of this document).
Mow grass strips to keep the grass from seeding and to encourage a thicker stand. Since these grasses accumulate nutrients from runoff, grass clippings should be removed and the organic matter used to amend field soils. To keep grass waterways and buffer strips vigorous, avoid frequent traffic over them and lift implements above the ground before crossing. Monitor growth to determine if supplemental fertilization is required.
Few fields are uniform in slope, drainage (air and water), and fertility. Determine optimal conditions for growth of plant material and plant accordingly. As examples, plants that will tolerate wetter soils include red maple, river birch, bald cypress, willows, sweet gum and black gum. Crape myrtle will thrive in moist locations but should be planted on well-drained sites because they tend to grow too long in the fall and may be damaged by frost when planted on moist sites. Dogwoods require very well-drained locations. Avoid frost pockets with crops such as flowering cherries and Colorado blue spruce, which begin growth early in the spring. A few degrees difference could damage early cherry and plum flowers or destroy the first flush of growth.

Field Nursery AMP Page 7 of 28 7/16/09
Irrigation ManagementWater quantity and quality
It is important to secure good water resources when considering a new nursery site. Generally, nursery crops require between one and two inches of water per week. Natural rainfall will reduce the need for other water resources. If water quantity is limited, consider lower water use irrigation systems (drip or trickle irrigation, center pivots, travelers, etc.).
Micro-irrigation (drip or trickle irrigation) is a low volume, low-pressure system that applies water directly to the soil surface over extended periods of time. It results in less water lost to evaporation or run off. There are several benefits derived from the use of micro-irrigation.
1. Micro-irrigation applies water only to the root zone of the nursery crop so roots tend to concentrate within the zone wet by the micro-irrigation. That forces more roots into the ultimate root ball.
2. Fewer weeds tend to germinate since water is distributed over a smaller surface area than with overhead irrigation. Less weed competition can increase the effectiveness and reduce costs of pre-emergent herbicides and directed post-emergent herbicides management programs, which also reduces the need for frequent tilling.
3. Since only a small surface area is wetted when using micro-irrigation, field operations can continue with fewer interruptions.
Overhead irrigation is especially useful when using lower quality water and when it is necessary to make frequent cropping changes. Including infrastructure needs, the initial investment of an overhead irrigation system is typically lower than a trickle system but operational costs may be higher.
Micro-irrigation requires clean water, free of sediment and minerals. Well water generally requires little or no filtration. Surface water from rivers or ponds generally requires sand media filters so emitters don’t plug. If fertilizer is applied with micro-irrigation, the amount of fertilizer applied to a crop can be reduced while increasing growth due to improved fertilizer use efficiency. Fertilizer use in field crops can be cut in half from traditional fertilization and overhead irrigation methods.Water Use Certification
Without access to an adequate quantity and quality of water, the nursery industry and agriculture in general is not viable. In an effort to monitor and regulate water use in the state of New Jersey, the Department of Environmental Protection (DEP) has created a water use certification program. For crop needs in excess of 3,100,000 gallons per month, growers are required to have water diversions certified for use by the DEP. A second threshold is the composite farm pumping rate capability. When the combined total pumping capacity for wells exceeds 70 gallons per minute, certification is also required. The process requires a certification of need by the local Agricultural Agent, information on water sources, specific locations of diversions, crops grown, and public notification that allows area resident input. Annual reporting of actual use is required along with a five-year recertification cycle. Uses under the aforementioned levels should be registered with DEP in a similar process but lacking the public notice requirement.
The cost of doing business in New Jersey is high. Because of this, it is necessary to maximize growth and yields of nursery plants. A requirement for maximizing growth is that plants receive optimal amounts of water. History has proven that anticipated natural rainfall is never a sure thing. Avoid delays in irrigating crops. It is better to start irrigation as soon as crops need the water rather than delay watering in anticipation of a rain event. If one gets behind in supplying plants water, it may be nearly impossible to catch up without a significant rain event. Remember that although heavier soils dry out more slowly than sandy soils, when they dry down to a certain point they are difficult to re-wet. Water system design
The irrigation system should be designed during the planning stage of the business and should be definitely considered prior to property purchase. Identify how much water, practically and legally, will be available to you and from what sources. Decide what types of irrigation systems will be placed in each field. If possible, design for flexibility in case there are changes in crop and/or irrigation system needs. The main irrigation trunk lines should be buried, usually along roads, with the valves located at convenient intervals. Irrigation lines are susceptible to

Field Nursery AMP Page 8 of 28 7/16/09
damage caused by winter freezing. When possible, plan for a gravity method of draining the lines so they don’t have to be blown out.
Recognize water use differences and crop response to overhead versus micro-irrigation systems and the associated costs of installation and use. If considering overhead irrigation, understand that water cannons are not the only option. When conditions for installation are good, center pivots and travelers can provide a gentle rain-like effect while using less water than do water cannons. Center pivots and travelers also produce less soil compaction and consequent water runoff. There are many types of irrigation systems available, many of which are specifically tailored to certain types of production. Be sure to evaluate the options.
Water treatmentTreatment of water for irrigation purposes is generally unnecessary when using well water. When using
surface water sources such as rivers and ponds, water should be evaluated to determine the need for water treatment. If there is the opportunity to use recycled water, the probability of needing to treat water to eliminate pathogens increases.
If using a source of water that has the potential for problems, carefully observe plant material for disease symptoms and dieback. Presently, most water treatment systems for pathogen control at nurseries are using chlorine. Realize that chlorine can be toxic to humans and some plants and that training and caution are needed when using chlorine. Other options include the use of ultraviolet radiation (UV), ozone, heat treatment, bromine, and copper. The combination of UV and ozone treatments may offer the most effective water treatment of any system. Costs of the systems vary widely.
Remember that each treatment option has strengths and weaknesses, and evaluate them accordingly. Copper is a known root inhibitor and bromine is in the same family as chlorine. When using these treatments, be vigilant in looking for negative effects on plants. UV radiation is the only treatment listed above that does not directly add potentially harmful chemicals to the treated water. One source of information to help evaluate treatments is found in the publication entitled “Management Practices to Protect Water Quality: A Manual for Greenhouses and Nurseries.” It can be found at http://ceventura.ucdavis.edu/files/32117.pdf.Water system management
When to irrigateAvoid getting behind! Growers should rely on natural rainfall as the basis for nursery crops water
needs but recognize that natural rainfall will either be inadequate in quantity or timing during the growing season. Many growers have a tendency to delay irrigation in anticipation of rain events. Unfortunately, rainfall is not entirely timely or reliable. When irrigation gets behind, virtually all plant material may be in need of water. If the need for water exceeds the nursery’s water resources or the capacity of the water distribution system, choices will have to be made as to what will be watered and what will wait. There are economic costs no matter what the decision.
Be sure to understand how the physical properties of the soils in your nursery affect the water holding capacity of the soils and how quickly soils will dry out and require irrigation. Review NRCS soil survey information to help determine which types of soils you have in which location on the nursery. The available water capacity of a soil will depend on its texture and organic matter content. Sandy soils hold less plant-available water than do loamy and heavier soils. The desired frequency of irrigation will also depend on the rooting depth of the plants and the rate at which plants and soils are transpiring water. The evapotranspiration rate increases as solar radiation, temperature and wind increases and as humidity decreases. Plants will require more frequent irrigations in hot, dry, windy weather. It is also important to understand how dry of a soil your particular crop will tolerate without suffering water stress or decreased yield. Check with your local agricultural agent if you have questions. Remember, heavier soils dry more slowly but when dry are difficult to re-wet.Cyclic irrigation
Cyclic irrigation uses shorter but more frequent irrigation cycles to conserve water. It is a system that wets and then re-wets soils but uses lower amounts of water so runoff is limited. Where micro-irritation systems are not appropriate, it offers the opportunity for an effective method of irrigation water

Field Nursery AMP Page 9 of 28 7/16/09
reduction using the same irrigation equipment. Field soils may exhibit a similar benefit, especially in cases where irrigation rates would exceed the infiltration capacity of the soil or not allow uniform wetting of the soil profile if cyclic irrigation were not used. Remember to consider field operations scheduling prior to using cyclic irrigation because the field will be irrigated more than once each irrigation cycle. Irrigation for heat or cold protection
For crops that initiate growth early in the spring and those that grow late into the fall it is critically important to have overhead irrigation available to protect from late and early freezes respectively. To have water freeze, a great deal of energy is required to be released in what is called the “heat of fusion.” Essentially, when temperatures drop below freezing, water will cool to approximately 32oF and will stay at that temperature for an extended time until it freezes solid. The ice temperature will then drop to near the ambient air temperature. All the time the water remains at the freezing point it offers protection to plant material on which it is located. As long as water keeps running, the temperature should never drop below freezing.
On a practical basis, irrigation systems should be started prior to when the air temperature drops below freezing and remain on until the temperature rises above freezing and ice formed on the plants disappears.Micro-irrigation
Micro-irrigation (drip or trickle irrigation) is an irrigation system that applies water very slowly over a longer time period than with overhead irrigation. The result is a small wetted profile on the surface that expands outward and downward as it moves through the soil profile. A heavier soil will have a wider profile than a lighter soil.
Benefits of using this type system include lower water consumption, an effective irrigation of the root profile, reduced weed problems, reduced disease problems, good access to field operations with equipment since the area between rows is not wetted, and a lower cost of operation than with overhead irrigation. Drawbacks include an inability to protect from freezes, the need for higher quality water resources, the need to have set planting blocks and patterns in the field to allow for infrastructure and a higher cost of initial installation.
Nutrient Management The concept of soil quality includes assessing a soil for its ability to grow plants, cycle nutrients, and percolate
and hold water. In nursery production, a healthier soil will have a greater ability to maximize plant growth. The factors that help determine a soil’s productivity include the cation exchange capacity, the water holding capacity, drainage characteristics and slope. Depending on the crops to be grown and production systems, different soils will be more or less desirable for nursery production. Soil survey information is available from the Natural Resources Conservation Service on line at: http://soils.usda.gov/survey/
Soil FertilitySoil testing forms the basis for all fertility recommendations. Conduct soil tests prior to each crop cycle to
determine nutrient status. Sampling needs to be representative of the field so the number of soil tests required per field will vary with the size and uniformity of the field. Unless there are specific areas of concern, submit composite samples of the field for testing. Take vertical cores of the soil profile that are 6 to 8 inches in depth. Separately sample areas that have differing field textures, colors and drainage characteristics.
The soil pH and nutrient content may vary considerably, thus requiring varied amendment practices. It is important to take soil tests well in advance of any cultivation, because of the time it takes to conduct the tests, evaluate the results, plan the most economical and effective program for crop production, apply treatments and allow time for the treatments to integrate into the soil. Lime and phosphorus applications should be completed well before planting. These materials should be thoroughly mixed with the top 6 to 8 inches of soil during normal soil preparation practices. Complete soil test results will also indicate if other soil nutrients are required as pre-plant adjustments.
Optimal management practices for fertilizer applications focus not only on maximizing growth of nursery stock but also the potential for excess fertilizer to be lost from fields through runoff, leaching, and soil erosion.

Field Nursery AMP Page 10 of 28 7/16/09
These losses can negatively impact surface water bodies and groundwater. Nitrogen and potassium applications should take place close to the time of planting.
Nursery stock sold with a root ball includes soil necessary to stabilize roots and ensure transplanting success. Preventing further loss of soil and rebuilding soil in fields is very important. Each cropping cycle for field grown nursery crops generally requires one to seven years. Therefore, nursery professionals need to implement growing practices that maintain and improve soil quality characteristics during fallow periods, as well as during field preparation for planting and during the production cycle.
Organic matter, along with naturally occurring silt and clay, serves as a nutrient buffer for soils. Organic matter, silt and clay have high cation exchange capacities that allow a soil to hold some applied nutrients and make them slowly available to plants. While the amount of silt and clay in soils cannot be effectively modified, the organic matter content of a soil can be increased through management practices.
Most soils benefit from the addition of organic matter. Benefits include improving soil structure, water retention, drainage and aeration. The quality of nursery stock grown is typically improved and digging is usually easier in mineral soils that have been amended with organic matter. Some nursery species also develop a more fibrous root system as the amount of organic matter is increased.

Field Nursery AMP Page 11 of 28 7/16/09
Soil AmendmentsThe long-term health and productivity of soil is a major concern for field nurseries. The loss of soil and
nutrients from fields due to environmental conditions such as wind and rain are responsible for major losses. Normal farming practices can result in losses under adverse environmental conditions. Tillage operations that are followed a short time later with significant wind or rain events results in loose soil that will blow and/or wash away. Tillage can also result in soil compaction that will reduce water penetration and moisture holding characteristics. Because of reduced water penetration into the soil, it can increase the formation of washes and gullies.
Costs may prohibit transporting significant quantities of bark, yard waste compost, mushroom soil or other organic amendments to any but the most intensively cultivated sites like seedbeds or transplant production beds. Light application of animal wastes can be applied to field soils but recognize there can be weed issues later. Apply only 1/4 to 1/2 inch and incorporate as soon as practical following application. If wastes are incorporated, 75 to 100 percent of the nitrogen in the waste may be available the first year. Rate of application should be based on nutrient analysis of animal wastes. Particular attention should be given to the metal content of animal wastes. Zinc and copper levels may be high enough to raise these elements to toxic levels if repeated applications are made over a number of years. Foliar tissue analysis of fully expanded leaves collected from crops early in the growing season can provide valuable information about the efficiency of the animal waste application and determine if any supplement is required.
Growers should check to see if composts from municipal yard wastes are affordable organic source for amending fields. Application rates of stabilized composted wastes range from 50 to 200 tons per acre and with nitrogen contents ranging from 0.2 to 0.5 percent, nutrient loss is of less concern. The 50 tons per acre application rate represents approximately 1/2-inch coverage over a 1-acre area, while the 200 tons per acre would be approximately a 2-inch depth.
An alternative to applying organic materials over the entire field is to incorporate the organic matter in planting rows only. If rows in the field are spaced 12 feet apart and the root zone area of plants is considered to be 2 feet on each side of the stem, a 4-foot strip would receive the organic matter, thus reducing the amount of organic matter applied in the field by two-thirds. Planting rows would need to remain in the same location each year for this to have long-term benefit. Non-crop Area Management During Production
Semi-permanent turf-type grass cover established between rows in a field nursery is an important component of minimizing soil losses and maintain long-term soil productivity. Grass sod also makes it easier to move equipment through fields when they are wet or snow covered. Grassed contour strips slow down and direct flow of water across a slope and serve as a buffer and a biological filter to remove excess nutrients before water leaves the nursery. Turf-type fescues are probably the most effective grasses. They are vigorous, don’t readily seed, are somewhat drought tolerant and provide some biomass when plowed down. Nursery planting rows should be kept clean or mostly weed free with pre-emergence or post-emergence herbicides while maintaining grass cover between rows.
Grass should be mowed regularly to avoid seed formation. An option to mowing is to use chemical mowing techniques. Sub-lethal rates of herbicides and/or growth regulators can be used to slow growth of grass but not kill it. For example, tall or fine fescues or a mix of the two grasses will be suppressed for eight to ten weeks by spraying in early spring when there are four to five new leaves or seven to ten days after mowing with 1 pint / acre of sethoxydim (Vantage), a selective grass herbicide. Another alternative is to use glyphosate (Roundup 4L) at the rate of 4 to 8 ounces per acre as a directed spray. The 4-ounce rate usually gives six weeks of suppression; the 8-ounce rate gives about 10 weeks of suppression. Glyphosate needs to be applied as a directed spray between the nursery stock rows. Use no more than 25 gallons of the final spray mix per broadcast acre. Chemical mowing will result in chlorotic (yellow) grass for up to 30 days.Soil Conservation
Conservation efforts are needed to reduce soil and nutrient loss resulting from wind erosion and storm water movement. Soil stabilization and erosion control management practices include:
Contoured layout of fields (planting across slopes)

Field Nursery AMP Page 12 of 28 7/16/09
Use of cover crops between crops Fallowing land (letting it rest without a crop for a year or more) Use of vegetation in aisles, row ends, drive roads, field border strips & waterways Use of sediment dams in waterways Installation of swales to collect soil in runoff water Installation of wetlands areas to collect nutrients Use of irrigation practices that do not increase erosive washes Use of trickle irrigation to reduce the wetted surface area thereby reducing the need for tillage to help control weeds.
Most practices used to reduce soil loss involve planting and maintaining vegetation cover while growing nursery crops. The physical effect of cover crops protecting the surface of the ground has a direct beneficial effect on reducing soil loss. Growing cover crops may be one of the most important management tools to improve soil productivity.
As an example, integrating a cover-cropping plan that maintains or increases soil productivity into a three-year crop rotation plan requires four acres annually for every three acres of productive area. In a traditional crop cycle where a field of plants would be sold by April, following harvest, the field would immediately be prepared for planting. The field would be plowed, fertilized, and sown with a sorghum-Sudan hybrid. The cover crop would be mowed as many times as necessary to avoid seed-head formation and then the field would be plowed under in September. A small grain winter cover crop such as rye should then be planted for winter soil stabilization and as a source of additional organic matter. The rye or other winter cover crop should be plowed down in the spring prior to planting a nursery crop.
This use of sequential planting of grasses and small grains reduces sediment and nutrient losses and potentially increase the soil organic matter levels. Sudan hybrids can be grown all summer and are killed by freezing temperatures. Small grains make an excellent winter cover crop. Seeding rates and planting dates are shown in Table 1. To avoid a serious weed problem grasses should be mowed or killed with herbicides prior to seed formation. The residue should be plowed down.
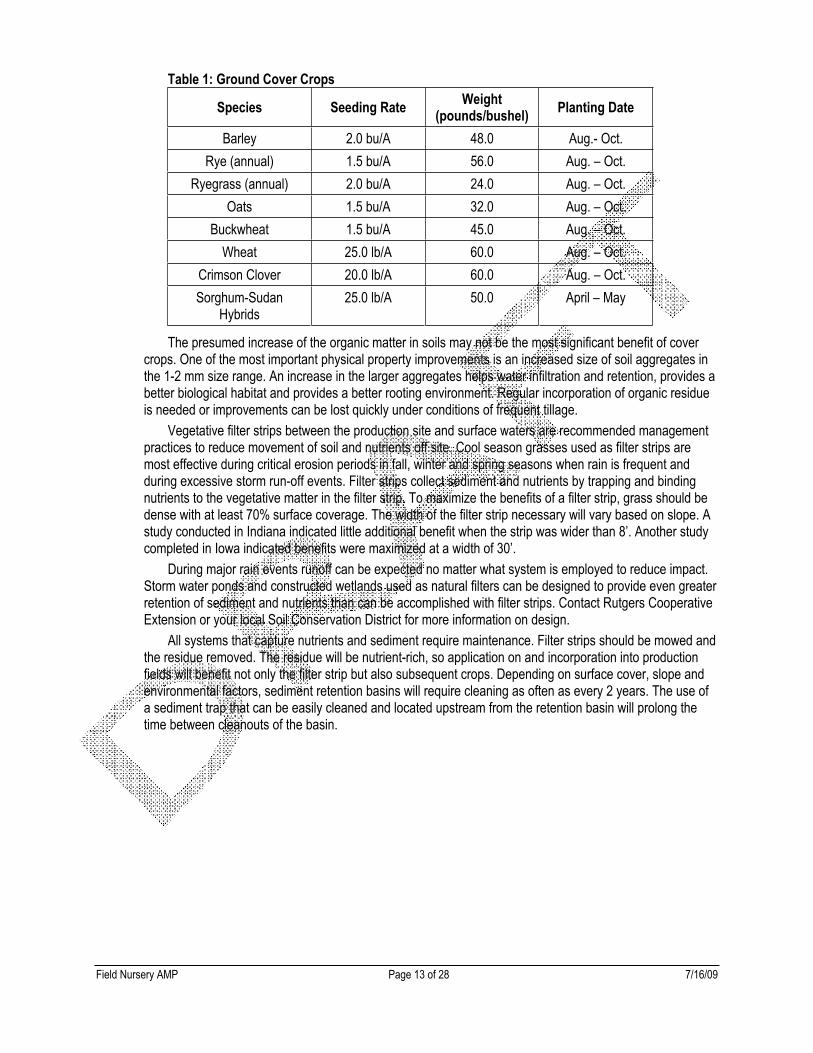
Field Nursery AMP Page 13 of 28 7/16/09
Table 1: Ground Cover Crops
Species Seeding Rate Weight(pounds/bushel) Planting Date
Barley 2.0 bu/A 48.0 Aug.- Oct. Rye (annual) 1.5 bu/A 56.0 Aug. – Oct.
Ryegrass (annual) 2.0 bu/A 24.0 Aug. – Oct. Oats 1.5 bu/A 32.0 Aug. – Oct.
Buckwheat 1.5 bu/A 45.0 Aug. – Oct. Wheat 25.0 lb/A 60.0 Aug. – Oct.
Crimson Clover 20.0 lb/A 60.0 Aug. – Oct. Sorghum-Sudan
Hybrids25.0 lb/A 50.0 April – May
The presumed increase of the organic matter in soils may not be the most significant benefit of cover crops. One of the most important physical property improvements is an increased size of soil aggregates in the 1-2 mm size range. An increase in the larger aggregates helps water infiltration and retention, provides a better biological habitat and provides a better rooting environment. Regular incorporation of organic residue is needed or improvements can be lost quickly under conditions of frequent tillage.
Vegetative filter strips between the production site and surface waters are recommended management practices to reduce movement of soil and nutrients off site. Cool season grasses used as filter strips are most effective during critical erosion periods in fall, winter and spring seasons when rain is frequent and during excessive storm run-off events. Filter strips collect sediment and nutrients by trapping and binding nutrients to the vegetative matter in the filter strip. To maximize the benefits of a filter strip, grass should be dense with at least 70% surface coverage. The width of the filter strip necessary will vary based on slope. A study conducted in Indiana indicated little additional benefit when the strip was wider than 8’. Another study completed in Iowa indicated benefits were maximized at a width of 30’.
During major rain events runoff can be expected no matter what system is employed to reduce impact. Storm water ponds and constructed wetlands used as natural filters can be designed to provide even greater retention of sediment and nutrients than can be accomplished with filter strips. Contact Rutgers Cooperative Extension or your local Soil Conservation District for more information on design.
All systems that capture nutrients and sediment require maintenance. Filter strips should be mowed and the residue removed. The residue will be nutrient-rich, so application on and incorporation into production fields will benefit not only the filter strip but also subsequent crops. Depending on surface cover, slope and environmental factors, sediment retention basins will require cleaning as often as every 2 years. The use of a sediment trap that can be easily cleaned and located upstream from the retention basin will prolong the time between cleanouts of the basin.

Field Nursery AMP Page 14 of 28 7/16/09
FertilizationPerform soil testing regularly to identify fertilization needs and to develop a historical record of soil pH and
nutritional status. If the field does not have a historical record, test for several years annually. When soil pH and phosphorus levels have stabilized, one can test less frequently.
When possible, plan to use split applications of fertilizers. Plants will use nitrogen and other nutrients more efficiently when applied in smaller doses, more frequently. Split applications will also reduce the potential for nutrient runoff. Remember that a number of other nutrients, as recommended by soil tests, should be incorporated into the soil before planting.
Side dressing plants rather than broadcast fertilization places fertilizers in proximity to the root zone. When plants are spaced out, nitrogen application should be based on an amount of nitrogen per plant rather than pounds of nitrogen per acre. When plants are closely spaced in rows, adjust the amount of fertilizer used to reflect the area actually fertilized. (If the row spacing is at 6 feet while the root zone is about 1 foot, use 1/6 the amount of fertilizer usually recommended.) Doing so maximizes growth with a minimum amount of fertilizer.
When using a two-way split application, the initial fertilization should take place before bud break. A second application should generally be applied by mid-June. When the total fertilizer requirement is split three ways, the final application should be administered no later than mid-August. With a two-way split application, the first application should use about 65% of the total for the year. For plants that normally have a single annual flush of growth, 65% of the total annual rate should be applied before bud break.
Slower-growing cultivars or species should be fertilized at the lower rates. Vigorous plants require higher rates of fertilizer to maximize growth. Excessive fertilization has been shown to reduce growth and can contribute to nutrient runoff, negatively affecting water quality. The use of controlled-release fertilizers is an optional method of applying nutrients. While initial costs are generally higher than using a granular fertilizer, there may be cost savings of time and equipment use since one application will last the entire growing season.
A combination (N, P, K) fertilizer may be the appropriate selection based on results of a soil test. Generally, applying combination or complete fertilizers has been less expensive than applying nutrient-specific fertilizers (e.g. urea (46-0-0), ammonium nitrate (33-0-0), potassium chloride (0-0-60), etc.). When a certain nutrient in the combination is not needed, however, negative environmental impacts may be greater. Phosphorus is usually the nutrient found to be most in excess for agricultural production. The pollution risk associated with phosphorus is generally related to soil particulate movement that occurs during significant rain events. When phosphorus-laden runoff water enters surface waters, the result can be algal blooms and fish kills.
Fertigation is the process of injecting fertilizers into irrigation water. It can be a good method of applying nursery crop fertilizers since it allows plant material to be “spoon fed” as the season progresses. It can also be effectively used to quickly address crop nutrient deficiencies. Care must be taken to avoid runoff during fertigation.
Fertigation Procedures: 1. Fully charge the irrigation system. When the system is fully charged, water should be coming out of
the emitter farthest from the injection point. Record the amount of time required from when the irrigation is turned on until water is flowing from the farthest emitter, then add a couple of minutes safety margin. Using this figure during each fertigation event can save time walking to check the end of the system during each cycle.
2. Begin injection. The length of time required to inject the fertilizer should be at least as long as it took to fully charge the system.
3. After all fertilizer solution is injected, run the system for at least as long as it took to charge the irrigation system to be sure all fertilizer solution has been flushed from the system. This is a good time to walk the system to make sure emitters are not clogged.
Pest Management Plants produced in the nursery require careful attention during production to maintain suitable plant quality.
Plants may be grown under conditions that often favor development of pests that can adversely affect plant
Field Nursery AMP Page 15 of 28 7/16/09
growth. These pests may include weeds, insects, and diseases. In the past, pest control utilized preventative pesticide (herbicides, fungicides, or insecticides) applications. Newer pesticides have been developed minimize environmental impact and to target specific pests or groups of pests. As newer pesticides have been developed, the cost of pest control applications have increased. To help contain costs associated with pest control, scouting nurseries for pests on a regular basis is necessary. Upon finding suspected pests, identification is necessary and then selection of appropriate control measures. Rotating chemical classes is important to reduce the probability of pest resistance.Pest Management Planning
Certain pest problems can be anticipated by knowing the crop history of a field. If a field has been in sod, for instance, grubs might be expected. When sod is killed, root-feeding grubs remain and will feed on roots of liners planted into the field unless control measures are taken. In the case of certain nematode-sensitive crops like American boxwood, soil testing for presence of harmful nematodes is prudent. Contact your Extension Agricultural Agent for assistance in taking a nematode assay sample.
Pest management should be a primary consideration in designing the layout of a field nursery. Any practice that reduces stress on the plant will help promote healthy, vigorous growth and reduce pest problems. Ensure good air drainage by removing windbreaks or barriers to the downhill flow of cold air, plant on the contour to help maintain uniform soil moisture and maintain plants in optimal nutritional condition. Also, control weed growth and keep plants free of damaging insects and diseases.
Give careful consideration to crop rotation practices. Avoid plants with allelopathic relationships. Allelopathy is the inhibition of growth in one species of plants by chemicals produced by another species and can occur by just having leaf residues over the root areas of susceptible plants. The most familiar example of allelopathy is suppression of many plants within the root zone areas of black walnut trees. Growers have reported similar problems when planting deciduous shrubs after boxwoods, yews after yews, oaks after oaks, poplars after poplars, and many rosaceous crops such as cotoneaster, pears, mountain ash, hawthorn or quince in rotations.
Crops with complementary pest problems should not be grown in the same fields or fields close to each other. An awareness of these instances can help reduce pest problems such as cedar-apple rust in crabapple and cedars. Pesticides used on neighboring crops may negatively affect other crops. For instance, Burford holly is very sensitive to and can be defoliated by dimethoate (Cygon).

Field Nursery AMP Page 16 of 28 7/16/09
Rules and Regulations Pesticide Use Certification Program
o All agricultural businesses that use pesticides must possess a pesticide applicator license. If the business applies pesticide only for their own business they should have a private license.
To receive a license, one must pass a test administered by the New Jersey Department of Environmental Protection (NJDEP). Licenses are good for five years but need to be renewed annually. During the five-year license period one is expected to receive 8 credits of core and 16 credits of category recertification training.
Employee requirements o Employees may apply pesticides as a “handler.” Annual training is required. A roster of trained
handlers must be maintained. o Employees are required to receive EPA-approved Worker Protection Safety training every five
years and have a current verification card in their possession. Agricultural Worker Protection
o Employers are required to “assure that each worker has received a employee orientation at least once each year for each agricultural establishment on which the worker is employed, on the first day of their employment, or at least one day prior to any work in a field which has been treated within the past 30 days”
Reportingo Businesses need to inventory stored pesticides annually and submit a copy to the local fire
company by May 1. o It is required that an annual use report be submitted to the NJDEP Pesticide Control Program
office.A complete set of rules and regulations can be found on the Internet at: http://www.nj.gov/dep/enforcement/pcp/pcp-regs.htm.
Monitoring pest populations Pest management strategies should be used to minimize the amount of pesticides applied. That entails the
application of pesticides based on need and requires monitoring to make that determination. In addition, pesticides should be applied efficiently and at times when runoff losses are unlikely.
Scouting is a key element of pesticide management. Traditional pest management programs identify pest problems and then establish a threshold (a tolerable pest population) after which control measures are started. A significant difference for the nursery industry is that there is a zero threshold requirement for plant material stock that is shipped, as established by law. Essentially that means that all plant material shipped interstate must be pest-free. The following is a list of pest management strategies:
Establish a scouting program to monitor pest problem outbreaks. Scouting can include direct observation or trapping with sticky cards or pheromone traps. Trained employees or professional pest control advisors should do scouting. Records of scouting results should be maintained and there should be a designated person for making pest management decisions.Apply insecticides, miticides and fungicides based on need. Only apply in anticipation of a pest problem when methods of predicting outbreaks have been documented. The major exception is that some disease pathogens require preventative sprays on susceptible crops. Apply weed control agents based on control characteristics of specific herbicides (pre-emergence or post-emergence).When possible, use pesticides that are effective but less environmentally persistent, toxic, or mobile. Maintain records on past pest problems, pesticide use, environmental and other information for treatment areas.

Field Nursery AMP Page 17 of 28 7/16/09
Use control options that help maintain pest predators. Use narrow-spectrum pesticides that affect only target organisms and apply pesticides only to affected plants or areas. Evaluate the use of pheromones for monitoring populations, for mass trapping, for disrupting mating or other behaviors of pests and to attract predators or parasites. Destroy pest breeding, refuge and overwintering sites. Remove plant debris from plant growing areas or the nursery. Inspect and quarantine newly introduced plant material. When possible, choose plant species or cultivars that are known to be more resistant to common pests and diseases. Use spreader/stickers with fungicides and insecticidal sprays to increase efficiency and reduce losses due to rain or irrigation.
Pesticide Applications When the application of pesticides is necessary, growers need to identify and evaluate pesticide options.
Growers should develop a schedule that provides a rotation between pesticide classes to help reduce pest resistance to the controls. When a choice of registered materials exists, producers are encouraged to choose the most environmentally benign pesticide products. Consider persistence, toxicity runoff and leaching potential of products along with other factors.
Growers need to be licensed to use pesticides and meet the requirements of federal and state laws that regulate use of pesticides. Users must apply pesticides in accordance with the instructions on the label of each pesticide product and wear appropriate protective equipment. Farm-worker safety requirements should also be reviewed and met. A checklist of some pesticide safety needs follows:
Calibrate pesticide spray equipment annually. Use backflow protection devices on hoses used for filling tank mixtures. Evaluate the soil and physical characteristics of the site. Locate mixing, loading and storage in areas that have a low potential leaching or runoff of pesticides. In situations where the potential for pesticide loss is high, emphasis should be given to practices and/or management practices that will minimize these potential losses. Recognize physical characteristics that may be impacted by pesticide movement and take steps to reduce the risk of an incident occurring.
o Proximity to surface water o Runoff potential o Wind erosion and prevailing wind direction o Highly erodible soils o Highly permeable soils o Shallow aquifers o Wellhead protection areas o Proximity to dwellings
When possible, use pesticides with a low solubility in water (5 ppm or less) or a low potential risk for leaching.Use pesticides with a short half-life to reduce the persistence of the pesticide in the soil and thus the opportunity for leaching. Time the pesticide application as far in advance as possible of irrigation and unfavorable weather conditions. The interval between pesticide application and irrigation or rain is closely related to the amount of pesticide runoff and leaching loss. It also relates to pesticide efficacy against the pest. Use efficient application methods, e.g., banding of pesticides or applying chemicals when containers are jammed (containers spaced pot-to-pot), or stagger applications.
FumigationFumigation kills most insects, disease, nematodes and weeds, and may be the most practical solution for a
valuable, pest-prone crop. Because fumigation kills by using toxic chemicals, it is important that care be given to each stage of the fumigation process to ensure the safety of the fumigator and the effectiveness of the treatment.

Field Nursery AMP Page 18 of 28 7/16/09
Fumigants are highly toxic chemicals. Purchase and application in many states requires certified applicator licensing.
Maximum effectiveness may be achieved when the treated area is covered with plastic sheeting. The plastic helps ensure that certain fumigants remain in the soil long enough to be effective before escaping into the atmosphere. Cultivate the treated area seven days after application. Do not plant until 14 to 20 days after treatment. If the soil is cold and/or wet you will have to wait longer. Always refer to the product label for details and precautions.
Regardless of the fumigant you use, soil preparation is the key to successful sterilization. Soil should be cultivated twice to a depth of 6 to 8 inches: once 7 to 10 days before fumigation and once immediately before fumigation. Tillers and rotavators are excellent for this purpose. At treatment time, the soil should be free of clods and fresh organic debris, moist enough for seed germination and have a temperature greater than 55oF at the 6-inch depth. Most fumigants are less effective when organic material (such as roots, stumps, leaves, and grass) have not decomposed. Either remove organic debris or allow it to decompose before fumigation.
Fall is an excellent time to fumigate because soils are warm and proper moisture levels are easier to attain. Investigate fumigant options prior to use for best effect. If you have never fumigated soil before, have an experienced pesticide applicator help the first time you fumigate. Fumigants are highly toxic chemicals that must be handled properly to be both safe and effective.Operation and Maintenance of Pesticide Application Equipment
All pesticide application equipment should be maintained in good working condition. Make a checklist of known replacement, repair and wear items. Calibrate spray equipment with clear water prior to the start of the spray application season. All sprayer tanks should be labeled to identify what types of pesticides can be used with the specific equipment. Lock the tanks when not in use to avoid possible contamination of spray materials.
StorageChemical storage facilities must be designed or located such that weather conditions or accidental spills
or leakage will not impact soil, water, air or plants. Chemical storage facilities should be posted with adequate safety warning signs and chemicals in storage must be reported to the local fire department annually. Store pesticides in their original containers in environmentally safe and secure locations. Storage should be secure and include proper ventilation and control for any potential chemical leakage that may contaminate water sources or be a detriment to living organisms. Designs for chemical storage and handling facilities can be obtained through Rutgers Cooperative Extension or through your local Natural Resources Conservation Service office. Mixing and Rinsing Stations
Research has indicated that one of the greatest potentials for ground water contamination from pesticides comes from spills that may occur during the mixing and loading process. The location and design of proper mixing and rinsing equipment stations, relative to the potential contamination of ground or surface water sources should be considered.
To protect against ground water contamination, mixing, loading and cleaning operations should be done on an impervious surface covered with a roof and surrounded by impervious curbing. Wash water and waste products used in cleaning of pesticide application equipment should be disposed of in a safe manner. Rinse water from equipment and containers should be stored and used in the following batch mixture where possible. Where disposal is necessary and allowed by laws and regulations, it should be performed avoiding high runoff and leaching areas such as ponds, lakes, streams, and other water bodies. Disposal of empty pesticide containers should follow instructions provided on the container.
All operations should be performed at a safe distance (100 ft.) from any well. When wells are in close proximity, extreme care must be exercised when mixing or applying chemicals. Anti-siphoning devices should always be used to prevent backflow into the well. Pre-Planting Weed Management Planning
The most important weed management tasks are done before planting. Good site preparation includes scouting for perennial weeds and controlling the difficult species such as multi flora rose, Canada thistle, mugwort and field bindweed before planting. Controlling perennial weeds requires killing the root system,

Field Nursery AMP Page 19 of 28 7/16/09
since most perennial weeds will re-grow if only the top is destroyed. There are few effective options for controlling perennial weeds in crop areas. Fumigation is not an option and the control spectrum for systemic post-emergence herbicides is generally limited. Cultivation is a possible control technique and it can be effective against perennial weeds using multiple cultivations over a period of several months to control the root systems. Timing of the application is critical to ensure satisfactory perennial weed control. Fumigant information is indicated above.
Planting sequential cover crops and allowing the land to remain fallow can help to reduce some weed and insect problems. The intense shading, mowing and competition created in a cover crop program will greatly reduce, if not eliminate, certain weed problems.
Growing individual species of nursery crops in separate blocks allows for more options in weed control. Another management consideration is herbicide carryover from one season to another. When planning new fields, obtain the herbicide history because some herbicides remain in the soils and cause problems for new crops.Pesticide Considerations
Follow label guidelines: o Use recommended rates o Use recommended methods of container disposal o Follow all instructions as indicated on the pesticide label.
Re-entry interval Worker protection standards, etc.
Mix only the amount of pesticide needed: o Plan ahead and be sure to use all mixed pesticides. o Spay all material on labeled plants to avoid water quality problems. Comply with Worker Protection Standards:o Train workers on “Worker Protection Standards”
Train nursery workers and pesticide handlers to use correct procedures: applications, mixing, loading, handling, posting, record-keeping, re-entry of treated areas, use of personal protective equipment (PPE), and emergency assistance.Document all training sessions. Provide decontamination sites and post necessary information in a central location.
Stagger herbicide applications whenever possible:o Most herbicide runoff occurs during irrigation or rain events shortly after application. Avoid
making a pesticide application to the entire nursery to reduce peak loading of the runoff water. Avoid injecting pesticides into the overhead irrigation system. Select pesticides with lower water solubility. Participate in pesticide recycling programs.
Guidelines for using pre-emergence herbicidesMost pre-emergence herbicides can be used after the soil is settled around the transplants. They must be
applied before weeds emerge. This prevents weed seeds from germinating from several weeks to months. As with any other tool, each herbicide has unique characteristics that should be considered when planning a weed management program. Always review labeled information prior to using pesticides. Consider the following during decision-making.
Rate of application (The correct rate will vary with weed pressure, organic matter content of the soil and ornamental species.) Residual (length of time the herbicide will provide effective weed control)

Field Nursery AMP Page 20 of 28 7/16/09
Activation (For maximum effectiveness, herbicides need to be watered with 1/2-inch of irrigation water or rain into the soil surface within a specified time.) Mechanism of action (how the herbicide kills weeds) Weed control spectrum (which weeds the herbicide will and will not control) Potential losses (leaching, runoff, and volatility)
Since pre-emergence herbicides will not control growing weeds, they should be applied before weeds germinate. In field production, pre-emergence herbicides should be applied on weed-free, stabilized soil after transplanting and then irrigated. Frequency of herbicide application will depend upon the herbicide’s residual. Residual weed control will increase with increasing herbicide application rate; control decreases with increasing amounts of rainfall or irrigation, temperature, and organic matter. The proper herbicide for each situation will be dictated by the plant species, weed species, and future use of the field. Guidelines for using post-emergence herbicides
Post-emergence herbicides can be classified as systemic or contact and selective or nonselective. Selective herbicides kill only specific plants while nonselective herbicides kill all plants. Systemic herbicides are absorbed and move through the plant. These are useful for controlling perennial weeds. For best control, the weeds must be actively growing so the herbicides can move throughout the plant. Contact herbicides kill only the portion of the plant on which the herbicide actually settles. Contact-type herbicides kill small annual weeds but only burn back perennial or large annual weeds. Good spray coverage is important. Check the label to determine the need to treat at a specific stage of weed growth.
All post-emergence herbicides need to dry on the plant to maximize effectiveness. Specific drying times range from 30 minutes to 8 hours and are specified on the label. This is the length of time that needs to pass after herbicide application before irrigation or rain to ensure that the herbicide has had adequate time to affect the plant. Although post-emergence herbicides labeled for field production remain in the soil for a short length of time after application, they have no residual and little or no soil activity; therefore, multiple applications are needed for perennial weeds. The majority of herbicides registered for post-emergence weed control in field production are used either for grass control or for nonselective weed control. Products that provide nonselective weed control should not be applied to the foliage of ornamental plants as severe injury or plant death may occur.
Post-emergence herbicide considerations:Apply at correct rate. Remember that multiple applications are usually required to control perennial weeds. Use the type and amount of surfactant specified on the label. Apply when the air temperature is above 50o F and the comfort index (temperature in oF plus humidity) is below 140. Treat weeds at proper growth stage. Avoid mowing three or four days before and after herbicide application. Allow adequate time for treated plants to die before disturbing the soil. When there is a potential for losses through leaching, runoff, and/or volatility, check the label and consider another option if necessary.
Guidelines for weed control without the use of herbicidesHerbicides cannot always be used, nor are they effective in controlling all weeds. In these situations,
cultivation and hand pulling may be the only available options. Cultivation works well on small annual weeds. Perennials will often re-grow from the roots even if the top is removed. Also, remember cultivation can stimulate successive flushes of germinating weeds by bringing new weed seeds to the soil surface. Check for emerging weeds on a two- to three-week cycle if you are routinely cultivating. If pre-emergence herbicides have been applied and activated, they form a chemical barrier that must be left undisturbed to be effective. Cultivation disrupts this barrier and lessens the effectiveness of the herbicide. Therefore, avoid cultivating if using pre-emergence herbicides.

Field Nursery AMP Page 21 of 28 7/16/09
Cultivation is not without other drawbacks. Cultivated soil is very susceptible to erosion since there is little to no vegetation to hold the soil in place. In addition, implements such as in-row weeders, which cut off weeds 1 inch below the soil surface, can build up ridges. Ridged soil around the stem collar of newly set liners tends to suffocate them just as if they had been planted too deeply.
It is important to develop a weed management strategy that encompasses all 12 months of the year and uses all available options. This strategy should include preventative measures such as pre-emergence herbicides, as well as sanitary practices that prevent weed seeds and vegetative parts from spreading.
Field Nursery AMP Page 22 of 28 7/16/09
GlossaryAMP - the Agricultural Management Practices include schedules of activities, prohibitions, maintenance procedures
and structural or other management practices found to be the most effective and practicable methods to prevent or reduce the discharge of pollutants to the air or waters of the United States. Best management practices also include operating procedures and practices to control site runoff, spillage or leaks, sludge or waste disposal, or drainage from raw material storage.
Cation Exchange Capacity (CEC) – the total of exchangeable cations (positively charged ions) that a soil can adsorb. Mineral particles and organic matter in the soil are able to exchange cations adsorbed to their surfaces with other cations in the soil solution, acting as a store for nutrients and buffering against changes in pH. Some cations of interest are ammonium (NH4+), potassium (K+), calcium (Ca2+), and magnesium (Mg2+), all of which serve as plant nutrients, and hydrogen ions (H+), which cause soil acidity.
Constructed wetland - a shallow bed filled with selected vegetation, such as cattails, into which runoff water is diverted and which serve as a biological filter for removing chemicals from the water. Constructed wetlands are designed to slow moving water, allowing time for treatment, and can use a variety of substrates, from native soil to sand or gravel. They can be designed to have the water level above the substrate surface or so that the water is kept below the surface.
Controlled-release fertilizer (CRF) - a formulation of fertilizer where release time is controlled by the thickness of the coating (i.e. resin) or the amount of the release agent in the coating that dissolves in water to form pores in the coating (i.e. plastic). CRFs have the advantages of slowly but continually feeding crops and not exposing plants to a large dose of salt at one time (as using some granular fertilizers may).
Cyclic irrigation –an irrigation schedule in which a plant’s daily water allotment is divided up and applied in a series of irrigation and rest intervals throughout the day.
Emitter - a device used to apply water in the form of spray or drops to the soil surface. It is a general term that can be applied to drip stakes, micro-sprinklers, misters, etc.
Half-life - the time required for a substance to degrade by one-half. Pesticides with a long half-life are considered persistent.
Lime - a material containing carbonates, oxides, and/or hydroxides, and used to neutralize substrate acidity. Dolomitic limestone contains calcium and magnesium.
Nematode - very small worms abundant in many soils and important because many attack and destroy plant roots. Pathogen - a causal agent of disease. The term can refer to funguses, bacteria, viruses, or other disease-causing
organisms.Permeability - the capacity of porous rock, sediment or soil to transmit water. Pesticide - any form of chemical or substance used to control pests. Pesticides include fungicides, herbicides, and
insecticides.pH - a measurement, ranging from 0 to 14, of the concentration of hydrogen ions (H+) in a solution. A pH of 7 is
neutral, a pH below 7 is acidic, and a pH above 7 is alkaline or basic. Pheromone – a naturally occurring or synthetically produced substance that can result in specific reactions of
organisms. Pheromones are notably used by insects for communication, and so can be used in pest management to scout for, trap, or disrupt mating in insect pests.
Runoff - the portion of precipitation or irrigation on an area that is discharged from the area. Runoff which is lost without entering the soil is called surface runoff and that which enters the soil is called ground water runoff or seepage flow. Managing runoff is critical in the nursery industry because it can carry sediment, fertilizers, pesticides and other pollutants to surface water bodies or groundwater.
Soil – a natural body composed of unconsolidated minerals, organic matter, air, water and organisms. Considering plant growth, soils serve to provide a plant with support, water, nutrients and air for its roots. Soils also provide important environmental functions including regulating water movement in a watershed, sequestering carbon from the atmosphere, and removing pollutants from water and air. In nursery production, care is necessary to conserve soil by preventing erosion and promoting soil health in order to preserve these functions and encourage healthy and vigorous plants.

Field Nursery AMP Page 23 of 28 7/16/09
Substrate - organic and inorganic materials, often bark, peat and sand, used as growing media in a container to support the plant and contain the root system.
Water holding capacity - the amount of water a soil can hold after being fully wetted and allowed to drain. In soils, the term field capacity is also used. Because some water will be held too tightly by the soil for plants to use, the term available water capacity is used to designate the amount water a soil can hold that can be used by plants. A soil’s water holding capacity is affected by soil texture and organic matter content. An understanding of the water holding capacity of your soil is important because it determines how frequently you should irrigate and how much water should be applied.

Field Nursery AMP Page 24 of 28 7/16/09
Useful ReferencesArchived historical soil survey publications for New Jersey counties. http://soils.usda.gov/survey/online_surveys/new_jersey/Best Management Practices Guide 2.0. Order through the Southern Nursery Association, Inc. http://www.sna.org/forms/SNAProductOrderForm.pdf“Management Practices to Protect Water Quality: A Manual for Greenhouses and Nurseries”. http://ceventura.ucdavis.edu/files/32117.pdf.New Jersey Department of Environmental Protection rules and regulations can be found on the Internet at: http://www.nj.gov/dep/enforcement/pcp/pcp-regs.htmPest Control Recommendations for Shade Trees and Commercial Nursery Crops. By A. B. Gould, S. Hart and J. Lashomb. NJAES pub. #E036. http://njaes.rutgers.edu/pubs/publication.asp?pid=e036Pruning Field Grown Shade and Flowering Trees. By T. E. Bilderback, R.E. Bir and M.A. Powell. Horticultural Information Leaflet NO. 406. http://www.ces.ncsu.edu/depts/hort/hil/hil-406.htmlSoil quality information is available from the Natural Resources Conservation Service on line at http://www.statlab.iastate.edu/survey/SQI/sqiinfo.shtmlThe American Standards for Nursery Stock. ANSI 60.1. American Association of Nurserymen. 1250 I Street N.W. Suite 500, Washington D.C. 20005. http://www.jerseygrown.nj.gov/jgstandards.pdf“Water Quality Handbook for Nurseries”. http://osuextra.okstate.edu/pdfs/e-951.pdfWeb Soil Survey website. http://soils.usda.gov/survey/
Field
Nurse
ry AM
P Pa
ge 25
of 28
7/1
6/09
Appe
ndix
1:
Ferti
lizer
App
licat
ion
Reco
rd S
heet
Date
Field
Loca
tion
Fertil
izer
Analy
sis
Bran
d Nam
e Am
ount
Appli
ed
Plan
t Nam
e En
viron
menta
l Con
dition
s

Field
Nurse
ry AM
P Pa
ge 26
of 28
7/1
6/09
Appe
ndix
2:
Ferti
lizan
te A
plica
ción
Tabl
ero
Fech
a Ár
ea
Análi
sis de
fer
tiliza
nte
Nomb
re de
l Pro
ducto
Ca
ntida
d tota
l us
ada
Plan
ta Co
ndici
ones
ambie
ntal

Field
Nurse
ry AM
P Pa
ge 27
of 28
7/1
6/09
Appe
ndix
3:
Pest
icide
App
licat
ion
Reco
rd S
heet
Date
Field
Loca
tion
Plan
t W
ind
Prod
uct N
ame
Poun
ds pe
r Se
ction
To
tal U
sed
Leng
th of
Contr
ol Pe
sts N
ot Co
ntroll
ed
Gene
ral P
lant H
ealth

Field
Nurse
ry AM
P Pa
ge 28
of 28
7/1
6/09
Appe
ndix
4:
Pest
e Apl
icació
n Ta
bler
o
Fech
a Ár
ea
Plan
ta Vi
ento
Nomb
re de
l Pro
ducto
Lib
ras p
or la
se
cción
Ca
ntida
d tota
l us
ada
Long
itud d
el Co
ntrol
Peste
s (Pl
agas
) no
contr
olada
s Sa
lud de
Plan
ta Ge
nera
l

Upper Cohansey River Watershed Restoration and Protection Plan April 5, 2011
129
APPENDIX E: SOIL, WATER, NUTRIENT AND PESTICIDE AGRICULTURAL MANAGEMENT PRACTICES FOR
CONTAINER NURSERIES IN THE UPPER COHANSEY RIVER WATERSHED
Soil, Water,Nutrient and Pesticide
Agricultural Management Practices for
Container Nurseriesin the
Upper Cohansey River Watershed
James Johnson Dr. Salvatore Mangiafico Agricultural Agent Environmental and Resource Management Agent Cumberland County Cumberland & Salem Counties

Container Nursery AMP Page 2 of 33 7/21/09

Container Nursery AMP Page 3 of 33 7/21/09
Table of Contents
Introduction 5Irrigation management 6
A. Water use certification B. Water quality
1. Water quality monitoring i. Table 1: Irrigation water quality guidelines for container plant production 7 ii. Table 2: Irrigation water quality guidelines for micro-irrigation
2. Water treatment 3. Water system design and management 8
i. Designing an irrigation system ii. When to irrigate iii. Cyclic irrigation iv. Micro-irrigation 9 v. Sub-irrigation vi. Irrigation uniformity vii. Management of irrigation systems viii. Irrigation for heat or cold protection 10
C. Runoff water management 11 1. Erosion control 2. Collection 12 3. Wetlands 4. Recycling water
Nutrient management 13A. Substrates B. Preparing substrates 14 C. Container substrate physical properties
1. Table 3. Recommended physical characteristics for container substrates 16 D. Fertilization E. Pre-plant substrate amendments
1. Dolomitic limestone 2. Micronutrients 17 3. Superphosphate 4. Fertilizer applications 5. Fertilizer application rate 6. Monitoring container substrates for nutrient status 18
i. How often to monitor ii. Substrate sampling methods for nutrient extraction iii. Interpretation of substrate extract levels 19
1. Table 4: Desirable nutritional substrate levels for container plants with high

Container Nursery AMP Page 4 of 33 7/21/09
nutritional requirements 7. Supplemental fertilization 20
i. Foliar analyses 1. Tissue sampling considerations 2. Taking tissue samples 3. Interpretation of tissue analyses 21
a. Table 5: Elemental ranges for uppermost mature leaves of woody ornamentals
Pest management A. Rules and regulations
1. Pesticide use certification program 2. Reporting
B. Nursery pest management 22 C. Pesticide applications 23 D. Operation and maintenance for pesticide management equipment 24
1. Storage 2. Mixing and rinsing stations
E. Other pesticide considerations System integration: Grouping plants 25 References 26AcknowledgmentsGlossary 27Appendices
1. A partial list of container-grown plants with low, medium, or high water requirements 30 2. A partial list of plants with low, medium, or high nutritional requirements when container-grown 31 3. Fertilizer applications record sheet 32 4. Fertilizante Aplicación Tablero 33 5. Pesticide Application Record Sheet 34 6. Peste Aplicación Tablero 35

Container Nursery AMP Page 5 of 33 7/21/09
IntroductionNew Jersey has many attributes that make it an ideal spot to produce nursery plants. The marketing potential is
great since it is geographically located in the center of the “BosWash” megalopolis. The megalopolis is around 500 miles long from the areas of Boston, Massachusetts to Washington, DC and has a population of approximately 44 million people. That represents 16% of the total population of the United States.
Unfortunately, New Jersey is also an expensive state in which to conduct business. The cost of land and higher than average operational costs force producers to find ways to maximize production in a way that also protects the environment. While these factors are generally considered to be negative, they also provide opportunities for the good manager and a container operation.
In a perfect world, nurseries would be designed for maximum efficiency with minimal environmental impact. In reality, few nurserymen have financial resources adequate to complete the planning and installation of such a facility when they are starting out in the business. If an established nursery moves to a new site, one should take advantage of the opportunity. The result of not designing from the ground up is the need for retrofitting existing nurseries. One should remember, however, that lack of finances to build a state-of-the-art nursery doesn’t mean one should not plan for that nursery. Nurseries should plan for the future while building for the present.
Infrastructure efficiency of plant and support materials handling is critical to profitability. One must maximize space use and minimized the number of times plants are moved. One should examine and evaluate everything. Included would be identifying where raw materials are stored, where substrate (container media) is prepared, the potting location, how plant material is moved within the nursery, and how plant material is sold off the nursery to include site selection of transportation docks and handling facilities.
When designing the nursery, there should be special attention toward water movement that minimizes environmental impact. Runoff water is typically higher in nutrient content than surface or groundwater and can carry sediment and pesticides. Because of the need to have minimal environmental impact, it is important to capture and re-use excess irrigation water. The need to also capture a certain amount of water from rainfall is a compounding factor. The reason for capturing water from rainfall is that there is typically a nutrient load that comes from the nursery associated with the early stages of a rain event. Optimally, nurseries should develop the capability to capture the first inch of a rain event.
A system for capturing and treating excess irrigation and rainfall water may include a biofilter, an impoundment and a filtration system. A biofilter is an area of vegetation where runoff is slowed, allowing sediment to be removed from the water. Plants and microbes in the biofilter help reduce nutrient content in the water. An impoundment is a natural or constructed basin that captures and stores runoff. Water in the impoundment can be recycled, which entails treatment and reuse for irrigation. When water from an impoundment is used for irrigation, a filtration system may be necessary to reduce water particulate matter so sprinklers won’t plug. Because impoundments may overflow during significant rain events, an additional biofilter can be placed to further remove pollutants from the water leaving the nursery before it enters ground or surface waters.
Plant grouping is encouraged to help reduce water or nutrient use or to enhance pesticide use safety. A partial list of species with low, medium, or high irrigation requirements is included in Appendix 2. Foliage characteristics (dense vs. sparse leaves, and branching) will affect water use by plants. Certain plant species will channel more overhead water into a container than others; this is a lesser consideration if using micro-irrigation. Water use is also affected by plant growth. During rapid growth (usually spring and summer), the plants require more water than during times of slower growth (winter). A partial list of plants with low, medium, or high nutritional requirements when container-grown is included in Appendix 3. If fertilizer is applied through the irrigation system or it is applied overhead, many of the plant environment characteristics noted for irrigation requirements will apply. Grouping by pesticide requirements is usually much more difficult. Recommendations for pesticide use on nursery stock can be found in Rutgers Cooperative Extension Publication #E036: Pest Control Recommendations for Shade Trees and Commercial Nursery Crops (available online at <http://njaes.rutgers.edu/pubs/publication.asp?pid=e036>)
Irrigation Management

Container Nursery AMP Page 6 of 33 7/21/09
Water Use Certification Prior to starting a nursery, it is important to establish the right to use water in the state of New Jersey. The
New Jersey Department of Environmental Protection (NJDEP) administers the water use certification program. It is required that one be certified for water use when there is a water need in excess of 100,000 gallons per day or one has the capability to pump water at a rate over 70 gallons per minute. Remember that a permit to drill a well is not a permit to use the water from that well. It is increasingly important to use the most efficient methods of irrigation because of limits being placed on allowable water use. Factors that have increased water regulation include the need to conserve water in designated critical areas with limited water supplies and perceived overuse of water resources. One can get additional information on the water certification program through your local Rutgers Cooperative Extension Agricultural Agent or through the NJDEP. Water Quality
High quality water is necessary for nursery industry success. Water should be evaluated for pH and soluble salts. If salts are elevated, water should also be checked for sodium. Iron and sulfur may also be of importance, especially in regard to their cosmetic effect on many species of plants (leaf discoloration). For container irrigation, it is generally preferable to use a groundwater source rather than surface water. If surface water is used, it may be necessary to filter it to prevent the clogging of irrigation nozzles, misters, or micro-irrigation emitters. If the pH of the water is elevated, pesticide labels should be carefully reviewed to determine the potential for pesticide deactivation.
Water Quality Monitoring 1. Water quality should be monitored at least twice a year (preferably during extended periods of wet and
dry weather). More frequent monitoring may be needed to adjust production practices in response to changes in water quality.
2. Water quality should always be monitored prior to locating a new nursery, moving to a new site, or using a new water source. Test the water quality to ensure that the concentration of chemical constituents is acceptable for plant growth according to guidelines.

Container Nursery AMP Page 7 of 33 7/21/09
Irrigation Water Quality Guidelines Table 1: General irrigation water quality guidelines for container plant production.
Degree of Problem Characteristic None Increasing SeverePotting Substrate pH Maintenance
pH 6.5 – 7.0 > 7.0 Bicarbonate (ppm alkalinity) < 61 61 – 214 > 214 Bicarbonate (meq/L) < 1.0 1.0 – 3.5 > 3.5
Soluble Salts Electrical Conductivity (EC, dS/m) < 0.75 0.75 – 1.4 > 1.4
Toxicity - Root Absorption (Sensitive Crops) Sodium (Sodium Adsorption Ratio (SAR)) < 3 3 – 9 > 9 Chloride (ppm) < 70 70 – 345 > 345
Toxicity - Foliar Absorption Sodium (ppm) < 70 > 70 - Chloride (ppm) < 100 > 100 -
Foliar Residues Bicarbonate (ppm hardness) < 40 – 90 90 – 520 > 520 Bicarbonate (meq/L) < 0.7 – 1.5 1.5 – 8.5 > 8.5 Iron (ppm) < 3 > 3 -
Permeability - Organic Potting Substrate Sodium (Sodium Adsorption Ratio (SAR)) < 35 > 35 -
Table 2: Irrigation water quality guidelines for micro-irrigation. Degree of Problem Characteristic None Increasing SevereHydrogen Sulfide (H2S) (ppm) < 0.1 0.1 – 0.5 > 0.5 Iron (Fe++) (ppm) < 0.2 0.2 – 0.3 > 0.3 Tannins, Phenolics, Humic Acids (ppm) - - > 2.0 Total Dissolved Solids (TDS, ppm) < 525 525 – 2100 > 2100 Suspended Solids (ppm) < 50 50 – 100 >100
Water Treatment Treatment of irrigation water may be necessary if the water quality is poor. In New Jersey there is usually
no need to change the water pH. If it is necessary to reduce the pH, the addition of an acid to the water will work. Remember that acidification will not reduce the salt concentration of water with a high soluble salt content. Deionization and reverse osmosis can be used to remove salts from irrigation water. These water treatments are used if soluble salts, especially sodium, are high enough to cause plant damage. These are expensive treatments and so are generally limited to high value crops.

Container Nursery AMP Page 8 of 33 7/21/09
Water System Design and Management Designing an Irrigation System
Irrigation systems should be designed to maximize the amount of irrigation water reaching the plant substrate while minimizing water that lands away from plant material. Test them with a water collection system to measure the amount of water applied and the uniformity of application. The water collection system can be as simple as placing same sized containers in various locations within the plant growing area, running the irrigation system and then measuring differences between water quantities collected in the containers. Different sprinkler heads will result in widely different dispersal patterns. Be sure to test when there is little air movement as well as when there is increased wind. Determine the maximum wind speed under which plant material can be effectively irrigated. When to Irrigate
The amount of irrigation water needed per application depends on container size, growing substrate, plant species, and weather conditions. A substrate’s water absorptive capacity is similar to that of a sponge. When relatively moist, there is a low water absorption capacity. When relatively dry, there is a high water adsorption capacity. Organic media tend to become hydrophobic when they get excessively dry, will tend to allow irrigation water to run through resulting in very little adsorption and will hold be quite difficult to re-wet. If the substrate is too wet, it will also hold very little water.
Growers can get a feel for the amount of water needed by checking the water content of the substrate as well as taking into consideration weather conditions since the previous irrigation. By adjusting the irrigation amount according to the amount of water lost since the last irrigation, growers can greatly reduce the amount of water they use and reduce the amount of fertilizer exiting containers through excess leaching.
Increasing the substrate’s water-holding capacity can decrease the frequency of irrigation. Substrates with a higher proportion of fine particles, including water-holding organic materials like peat and coir, will retain more water. An increase in water-holding capacity of substrate must be balanced with the need to maintain air-filled pore space in the substrate. A substrate with insufficient air-filled pore space will be excessively wet and have a higher potential for the incidence of diseases such as Phytophthora or Pythium.Materials such as vermiculite, perlite or rice hulls are added to substrate mixes to increase air-filled pore space.Cyclic Irrigation
Most nurseries irrigate on a daily basis with water being applied in a single, continuous application. An alternative approach to help increase the water-holding capacity is cyclic irrigation in which the daily water allotment is applied in more than one application with timed intervals between applications. For example, using cyclic irrigation, one might apply three 0.1-inch doses of water lasting about 20 minutes each. The first hour 0.1 inch would be applied, one hour later another 0.1 inch and the final 0.1 inch of water would be applied one hour after the last application. This would replace a single application of 0.3 inch in 1 hour.
Compared to continuous irrigation, cyclic irrigation has been shown to reduce the volume of irrigation runoff by 30% and the amount of nitrate leached from containers by as much as 41% (Fare et al. 1994). Growers have also indicated that the amount of water applied per cycle can be reduced because of better wetting characteristics, resulting in a net water savings. Cyclic irrigation can be used with both overhead and micro-irrigation systems. Using timers and solenoid valves is desirable when applying cyclic irrigation because manual control can become cumbersome.
Electronic control of irrigation systems has been developed using several different soil moisture sensing devices appropriate for use in containers. These systems can be used to indicate when to irrigate and how much water to apply. While they have been used successfully in nursery situations, an understanding of the limitations of individual sensors is important since many have some limitations such as erroneous readings caused by elevated salt levels in the substrate. A successful approach is to use more than one system, so that the strengths of one system offset the weaknesses of the other. Micro-irrigation

Container Nursery AMP Page 9 of 33 7/21/09
Micro-irrigation is a method of irrigating where water is applied at a relatively slow rate and usually directly to the container substrate. While a variety of emitters can be used, point source emitters (in-line emitters, spray stakes, spaghetti drippers, etc.) are generally used for container production. Irrigating container-grown plants with micro-irrigation can result in water, fertilizer and pesticide savings as compared to overhead irrigation. Additional savings are realized because micro-irrigation systems require smaller pumps and pipe sizes. However, micro-irrigation systems generally have higher initial and maintenance costs. Use of micro-irrigation also affords the opportunity to harvest crops shortly after irrigation because most of the soil is not wetted. Sub-irrigation
Use of a sub-irrigation system is another irrigation option. A capillary mat system employs a water-conducting porous plastic mat to conduct water to plants. The ebb-and-flow system uses a flooded bed in which the base of the container is submerged in water during the flood cycle and water is absorbed by the substrate through capillary action. Following irrigation, water drains from the production area into a reservoir. Sub-irrigation has become increasingly important in greenhouse production systems. Advantages include eliminating runoff leaving the production area and conserving water and fertilizer. Care must be taken to avoid salt accumulation in container substrate and disease transmission among plants through recycled water. Irrigation Uniformity
The uniformity of water application and efficiency of an irrigation system tends to decrease over time because of wear. Maintenance is required to retain efficiency and that justifies the need to test the system annually at the start of the season. Use the same water collection system as described in the “Designing an Irrigation System” section. When irrigation uniformity decreases and water is wasted, disease problems tend to increase and crops become less uniform. Be sure to keep baseline information developed when the system was new for comparison during annual inspections. As irrigation uniformity becomes less acceptable, repairs, replacements and adjustments must be performed. Management of Irrigation Systems
1. Irrigation should be scheduled (both when to initiate irrigation and the duration) based on plant demand. Schedules can be determined by container weight, color or feel of substrate, or electronically measuring substrate moisture content. Remember, when plants show moisture stress growth has been lost.
2. A substrate’s water-holding capacity is related to the pre-irrigation substrate water content. Substrates that are moist will require less irrigation water to complete wetting than a substrate that has excessively dried.
3. Irrigation should be managed to minimally exceed the water-holding capacity of the substrate. Be sure there is enough water applied to have 15% of the water leach through the substrate to control soluble salts. It is helpful to occasionally measure the actual volume of the leachate to avoid insufficient or excessive leaching. When attempting to limit water use during extended periods of limited rainfall, soluble salts can build up in the center portion of containers. Leaching is critical to avoid plant injury.
4. When using timer-controlled automated systems, a main shutoff device should be used to prevent irrigation system operation during significant rainfall events.
5. Where practical, use substrate moisture sensors or a class A evaporation pan calibrated to plant demand to help schedule irrigation applications.
6. Where practical, use cyclic irrigation to decrease the amount of water and nutrients exiting the container.
7. Micro-irrigation should be used for large containers (7 gallons and larger) to minimize water loss between containers.
8. When practical, the irrigation system should be separated into zones to match plant irrigation

Container Nursery AMP Page 10 of 33 7/21/09
needs. If possible, plants with similar irrigation requirements should be grouped into the same irrigation zone.
9. Irrigation should be scheduled to allow the maximum time following pesticide applications. 10. When practical, irrigation should be applied during time of minimal wind. 11. Personnel need to be trained in irrigation management, procedures for recording water use and
problem reporting. 12. Avoid irrigating areas without plants, considering both non-crop areas like roads and walkways and
crop areas where plants have been removed. Consolidate plants from partially filled irrigation zones.
13. When using overhead irrigation, keep plant spacing close to minimize water falling between pots, while leaving enough space between pots to allow sufficient air flow around foliage.
14. Use a well-designed irrigation system and keep it maintained. Maintain water pressure appropriate for sprinklers to maintain desired drop site. Use identical emitters within a zone. Maintain filters and inspect the performance of the irrigation system. Space overhead sprinklers to achieve head-to-head coverage.
Irrigation for Heat or Cold Protection 1. Water application should be initiated as the air temperature nears the critically hot temperature for
plant injury. Intermittent syringing of the foliage is important to avoid serious wilting. One must carefully consider not only the temperature, but also the wind speed and relative humidity, as they will increase plant stress as winds increase and the relative humidity decreases.
2. Water application should be initiated as the air temperature nears critically cool temperatures for plant injury. When irrigation is started for cold protection, it should continue until ice has melted off the plant material. Review weather forecast. Irrigating for cold protection is only effective for relatively short cold snaps.
Runoff Water Management Erosion Control
Water erosion is the process by which the land surface is worn away by water flowing over exposed soil. In the process, water picks up detached soil particles and debris that may contain chemicals harmful to receiving waters. Erosive forces increase as the velocity of flowing water increases resulting in small channels and eventually gullies of varying widths and depths. Soil erosion, therefore, should be avoided for two reasons: first, because it entails a loss and degradation of soil onsite; second, because the sediment and chemicals associated with the sediment particles can be harmful if it enters surface water bodies. Sedimentation is the process where soil particles settle out of suspension as the velocity of water decreases. Larger and heavier particles (gravel and sand) settle out more rapidly than fine silt and clay particles. It is difficult to totally eliminate the transportation of these fine particles even with the most effective erosion control program. A well-designed nursery facility will help reduce erosion from both irrigation and rain events.
Each container nursery should develop a plan for erosion and sediment control. Personnel from the local Natural Resources Conservation Service (NRCS) and Soil Conservation District (SCD) can help with design planning. The plan should address: 1) preventing slope soil erosion by using vegetative cover and other means; 2) a system to capture excess irrigation water; 3) a method to remove sediment from excess irrigation water; 4) a designed biofilter to remove nutrients and other chemicals from the water (e.g.: vegetated buffers, wetland areas, or grassed waterways).
Most slopes can be stabilized with a permanent vegetative cover. A temporary cover can be used for quick establishment until a permanent cover can be established. While grasses will form the basis for stabilization, woody plant material can be incorporated to reduce wind, noise and dust as appropriate.

Container Nursery AMP Page 11 of 33 7/21/09
Ground covers can also be used in the stabilization scheme, especially on slopes where mowing is not feasible or in shaded areas where grass establishment is difficult.
Mulching includes using a protective layer of straw, plant residues, stone, or synthetic materials to protect the soil surface from the forces of raindrop impact and overland flow. Mulch fosters the growth of vegetation and reduces evaporation. Organic mulches such as straw, wood chips and shredded bark have been found to be the most effective materials. A variety of erosion control blankets have been developed in recent years for use as mulch, particularly in critical areas such as waterways and channels. Jute mesh or various types of netting are very effective in holding mulch in place on waterways and slopes before grasses become established.
A filter strip is an area of vegetation that removes sediment, organic matter and other contaminants from runoff and wastewater. They do this by filtration, deposition infiltration, absorption, decomposition and volatilization, thereby reducing pollution and protecting the environment. Often they do not filter out soluble materials. This type of filter is often wet, difficult to maintain and should not be used as travel lanes.
A vegetated buffer strip is a form of a filter strip. It is usually viewed as a protective barrier to a sensitive area such as a river. It should be retained in its natural state if created along the banks of water bodies. Vegetated buffers prevent erosion, trap sediment, filter runoff and function as a floodplain during periods of high water. Design of filter strips should be site specific because of topographic differences in sites. Slope, soil type, vegetative cover and other runoff control measures may differ for different sites. It is important in the design of the slope that buffer strips do not cause flow concentrations that will result in erosion or carry sediment across the buffer. Collection
A water collection basin or impoundment is a primary means of reducing potential water quality problems. It should be the goal of each container nursery operation that no irrigation water leaves the property.
During the irrigation season, to the maximum extent practicable, all irrigation return flows should be recycled with no discharge back to public waters. As a general rule, newly constructed water collection and recycling facilities should be designed to accommodate the irrigation return flow.
Basins are typically constructed with an emergency overflow to prevent dike damage that can result from storm water overtopping. Basins or other structures that are planned for construction must have all permits. Where rainwater is allowed to discharge from the property, it must be considered in the design of the water collection basin. The Natural Resources Conservation Service and/or the local Soil Conservation District can provide design criteria and expertise to help develop the best plans for the nursery collection or retention basin.
Systems should be designed to collect a certain amount of storm water runoff in addition to irrigation water. Some locations require that the first inch of storm water be collected. Storm water runoff should not be discharged directly into surface or ground waters. Runoff should be routed over a longer distance, through grass waterways, wetlands, vegetative buffers and other places designed to increase overland flow. These components increase infiltration and evaporation, allow suspended solids to settle, and remove potential pollutants before they are introduced to other water sources. Wetlands
A constructed wetland is an aquatic ecosystem with rooted emergent hydrophytes designed and managed to treat agricultural wastewater. The plants extract water and nutrients and add oxygen to the root zone to help in the treatment process. There are a number of attractive herbaceous and woody plants that are adapted to permanently saturated soil conditions including species of cattails, bulrushes, iris, oak, willow, rose, hibiscus and lobelia. A constructed wetland used to treat runoff typically includes an impervious subsurface barrier, a suitable substrate for the hydrophytic vegetation, the plants, wastewater or runoff flowing at a slow velocity through the system and the structural components needed to contain and control the flow. The system can be designed as either 1) a free-water or surface flow system or 2) a subsurface-

Container Nursery AMP Page 12 of 33 7/21/09
flow system. The wetland concept has been identified as a beneficial filter for environmental contaminants. The Natural Resources Conservation Service may be able to assist in design. Recycling Water
Water collected in an impoundment can potentially be recycled. Use of recycled water may require some treatment because elevated soluble salts or concerns about disease organisms. Reduction of soluble salts is most cost-effectively addressed by blending recycled water with clean water. Blending also offers safety benefits if concerns exist with regard to residual farm chemicals in the water.
Techniques used to reduce biological organisms in the water include use of chlorine, bromine and ozone or treatment with UV light. Chlorine has been used most extensively in the past, but bromine has been reported to have a broader spectrum of activity on plant pathogens. Bromine in the form of tablets is also safer and easier to handle than chlorine gas. Ozone and UV lighting has been tested with apparent success in nurseries for treating recycled water. Ozone generators can treat large quantities of recycled water faster and safer than chlorine or bromine. It is important to check with the NJDEP to determine if there are any use restrictions on treatment options. Local officials should also be contacted regarding proper notification and reporting when using acid, chlorine, bromine or ozone.
Limited investigation into possible problems with traces of organic chemicals remaining in recycled water has not confirmed that this is a significant concern. A brief review of the subject was prepared (2). It is presently available on the Internet. Even with limited risk it is important to be observant for possible damage to plants from chemical residues in recycled water, especially considering that most nurseries produce a wide variety of plant materials and that some types will be more sensitive than others.
Nutrient Management The goal of a nutrient management program is to apply the minimal amount of fertilizer that will result in the
maximum desired growth rate, flower production, foliage color enhancement, or expected plant quality. The amount of fertilizer needed to achieve the desired response is impacted by container irrigation management practices, as previously discussed, and properties of the substrate, which is discussed below. Considering these factors, nursery operators can develop a nutrient management plan and achieve minimal fertilizer losses from containers. Substrates
Many terms, including soil, soil-less media, potting mix, container mix and substrate are used to describe potting materials for growing plants. However, many of these terms are imprecise or can be confusing. Container mix and potting mix imply that more than one component is used. The term substrate avoids much of the confusion of other terms and is descriptive of the entire composition. Substrate is the term used in Europe and most other parts of the world to describe the components of the root rhizosphere within containers.
Many materials are used as nursery container substrates. The predominant components in the New Jersey and the mid-Atlantic area are pine bark, sphagnum peat moss, vermiculite and sand. Many other materials have been used with varying levels of success. The wetability, stability, chemical and physical characteristics tend to limit the portion of alternative materials that can be used in a potting substrate. Organic components that have not been aged are not stable and may decompose rapidly, causing what is referred to as “shrinkage”. Containers that were full at the potting can rapidly lose substrate volume resulting in a change in characteristics of that substrate. Some composted materials lack the coarse large particles necessary for adequate aeration and limit their use as a container substrate. Some composted materials have high salt levels.
Use of a line-mixer for blending components of the substrate is the optimal method. If blending on the ground, use a concrete slab that does not allow for standing water. In all cases, be sure areas surrounding substrate preparation and storage are kept mowed to prevent weed seeds from contaminating the substrate. Sanitation is the first step toward a weed-free nursery.
When choosing a container substrate, determine ones that are best adapted to plant growth and management. Use stable substrate components that do not decompose rapidly. Check potential organic

Container Nursery AMP Page 13 of 33 7/21/09
substrates for weed seed, nematodes, pathogens and chemical contaminants.Preparing Substrates
Substrate preparation (mixing) systems used in Southern New Jersey include pad mixing, paddle mixing and line mixing. While each has their strengths and weaknesses, all mixing systems have the potential for releasing particulate matter to the air. The pad, tumble and line mixers are the primary types used in commercial operations, although the paddle type of mixer has been used for starting nurseries and for small batch mixing.
Of the three systems used commercially, line mixing generally results in the best media quality and consistency. This is because they produce a uniform product and they tend to have fewer problems breaking down medium components. Breaking down medium components reduces porosity and ultimately can increase the incidence of root diseases.
All mixing systems will generate dust. There are things one can do to minimize worker exposure. Requiring use of a dust mask can dramatically reduce worker exposure. The following are some infrastructure changes that may help and should be evaluated.
Install a sprinkler system on the mixer to settle dust that might be generated. Install a semi-permeable screen to reduce the effect of wind on any dust that might be generated (semi-permeability reduces turbulence effects that may occur as wind wraps around a non-permeable structure). Mix during times of the day when there is less wind.
Further reductions can be accomplished by locating the mixing site away from property borders. If centralizing the location is either not practical or wind continues to move dust, windbreaks may be planted near property boundaries. Windbreaks should contain both deciduous and evergreen species. Be sure to evaluate movement of dust during the various times of the year one may be mixing since wind direction changes seasonally. Container Substrate Physical Properties
The physical characteristics of container substrate dictate how much water and oxygen are available to roots. The characteristics that have the majority of impact on plant growth are bulk density, air space and container moisture capacity. Achieving a fundamental understanding of these physical characteristics is essential to proper irrigation and fertilization management.
The bulk density refers to the weight of substrate per unit volume of substrate particles (usually expressed in grams per cubic centimeter, g/cc). Bulk density values for pine bark range from 0.19 to 0.24 g/cc depending on the particle size distribution of the pine bark. The bulk density for peat ranges from 0.05 to 0.5 g/cc. Particle size distribution refers to sizes of particles (dust-like to chunks) that compose a substrate.
The particle size distribution, particle density and nesting of substrate component particles greatly influence the size and distribution of pore spaces in the substrate and therefore the amount of water and air the wetted substrate will hold. Many sizes of pine bark are available ranging from fine to coarse; the size to be used is dependent on the type of crop and grower practices. Generally, coarse particles are better for peat and vermiculite while one should avoid bark that is either too small or too large. Experience is usually the best judge of which to use.
Pore spaces exist between substrate particles and within particles. When the substrate is fully wetted and allowed to drain, some pores will hold water and some will hold air. Water-filled pore space is critical in a substrate because these pores hold the water that will be taken up by the plants. Air-filled pore space is critical because these pores hold oxygen that is essential for root growth. The term "total porosity" refers to the total volume of pore space in a substrate and is expressed as a percentage of the total substrate volume. Recommended total porosity values range from 50 to 85 %. The term "air space" refers to the fraction of air-filled large pores (macropores) from which water drains following irrigation. Air space values are also expressed as a percentage of the total substrate volume and recommended values range from 10 to 30 %.
In general, a substrate with a relatively high proportion of micropores will have a high water-holding capacity

Container Nursery AMP Page 14 of 33 7/21/09
due to the attraction of water for the walls of small pores. Also, such a substrate will have a relatively low total porosity value since small particles tend to nest or settle within each other. Substrates with a high proportion of micropores are substrates with a high proportion of fine particles.
Container capacity is the maximum volume of water that a substrate can retain following irrigation and drainage and is a measure of the potential water reservoir of a container. The term “water-holding capacity” is used synonymously. An area of saturation, called a perched water table, exists at the bottom of a container following irrigation and drainage. The height of the saturated area is greater for a fine textured (small pores) substrate than for a coarse textured (large pores) substrate. Above the perched water table there is a gradient of air-filled pore spaces. The amount of air-filled pores increases with the distance above the perched water table.
Container capacity is expressed on a volume basis as the percent of water retained relative to the substrate volume. Recommended container capacity values range from 45 to 65 %. The water in a substrate can also be classified as "available" or "unavailable." Available water is that fraction of the water that can be absorbed by roots. Unavailable water (hygroscopic water) is that fraction of water that is held tightly to particles and is unavailable to roots.
Container dimensions can affect the air space and container capacity. For example, a typical bark- filled 1-gallon container (6 inches tall) might have a perched water table that is 1 inch tall. Thus, the perched water table occupies 1/6 (17 %) of the container volume. Using the same substrate, a flat (3 inches tall) will also have a 1 inch perched water table; however, the water table will occupy 1/3 (33 %) of the flat volume. Bilderback and Fonteno, 1987, discuss further information on how container dimensions influence substrate characteristics.
The physical properties of a substrate are also affected by amending the principle substrate with another ingredient. Amending pine bark with sand increases the amount of available water and bulk density but decreases unavailable water, total porosity and air space. Adding peat moss to pine bark also increases the amount of available water. The water-holding capacity of the substrate must be balanced with the air-filled pore space. Insufficient air-filled pore space in the substrate will promote root rot diseases. Conversely, the substrate should have sufficient water-holding capacity to keep plants well supplied with water and avoid excessive leaching. The desired balance between water-holding capacity and air-filled pore space in a substrate can vary with the plant species to be grown.
A substrate with a high proportion of coarse particles has a high air space and a relatively low water-holding capacity. Consequently, leaching of pesticides and nutrients is likely to occur. Always test the physical characteristics of the substrate and use the substrate initially on a trial basis.

Container Nursery AMP Page 15 of 33 7/21/09
Table 3. Recommended physical characteristics for container substrates*:Physical Characteristic Recommended Range
Total Porosity 50 to 85 % Air Space 10 to 30 %
Container Capacity 45 to 65 % Available Water Content 25 to 35 %
Unavailable Water content 25 to 35 % Bulk Density 0.19–0.70 g/cc.
*Following irrigation & drainage as a % of volume
FertilizationThe cation exchange capacity (CEC) indicates how well a substrate holds positively charged ions (cations)
such as ammonium, potassium, calcium and magnesium against leaching. Typical CEC values (in milliequivalents per 100 milliliters of substrate, meq/100 ml) for several container substrate components are: aged pine bark, 10.6; sphagnum peat moss, 11.9; vermiculite, 4.9; and sand, 0.5.
The role of the CEC in soil-less substrates as related to plant nutrient uptake and leaching continues to be important. The pH continues to influence nutrient availability as it does in field soils. The optimum release rates, however, occur at a lower pH than in mineral soils. Research has indicated optimal nutrient availability to occur between a pH of 4 and 5 in bark and peat/bark substrates as opposed to a pH of 6 and 7 in mineral soils (1). The ability to hold nutrients in the substrate is also necessary to maintain plant nutrition and reduce leaching. Research has shown that nitrogen and phosphorus leach readily from container substrates (3, 4). A partial solution to reduce leaching is to use of controlled-release fertilizers as a basis for fertility programs.
The container system requires frequent irrigations because of the limited water volume that can be held by the substrate. Consequently, irrigation is a predominate factor in controlling container substrate nutrient levels. Soluble fertilizers injected frequently through the irrigation system or controlled-release fertilizers are used to provide a continuous supply of nutrients at optimal levels, but in small quantities necessary to minimize nutrient loss due to leaching. Specific nutrient levels and pH required for container substrates are discussed in the section on Interpretation of Substrate Extract Levels. Pre-Plant Substrate Amendments
Dolomitic Limestone Dolomitic limestone supplies calcium (Ca) and magnesium (Mg) and neutralizes the acidity of the growth
substrate. The quantity of dolomitic limestone added to the substrate depends on irrigation water alkalinity and Ca and Mg content, initial pH of growth substrate and the plant species grown. In mineral soils, hollies, azaleas and other ericaceous plants grow best in substrates from pH 4.5 to 5.5, while Nandina, junipers, boxwood and many flowering shrubs require a substrate pH of 5.5 to 6.5. In organic substrates, the nutrient availability curve is lower than that in a mineral soil and optimal uptake of nutrients occurs approximately 1 pH unit below that of mineral soils. Plants requiring a lower pH range (e.g. ericaceous) continue to perform well in the pH of 4.5 to 5.5 while non-acid loving plant material continues to do well at pH reading down to 5.5. The dolomitic limestone requirement will vary based on substrate components. Typically, a bark-based substrate will require less Dolomitic lime to correct pH imbalance than a peat-based substrate. The pH should be monitored to determine how well the substrate pH is being maintained through the growing season. Micronutrients
Micronutrients are essential for plant growth, but only small quantities are required. There are several micronutrient fertilizers sold commercially. These fertilizers usually contain the essential micronutrients and are added to the container substrate as an amendment. Micronutrient amendments are usually effective for up to two growing seasons unless irrigation water alkalinity is high, in which case additional applications of micronutrients may be needed. Micronutrients are also available commercially as a component of the macronutrient fertilizers. If composted yard debris or composted biosolids are 10 % or greater by volume of

Container Nursery AMP Page 16 of 33 7/21/09
the substrate, then micronutrient needs may be met by these components. Superphosphate
Phosphorus leaches rapidly from a soilless container substrate. Complete controlled-release fertilizers applied during the growing season should supply adequate phosphorus. Superphosphate should not be added to the container substrates when controlled-release fertilizers are used. Fertilizer Applications
The preferred nutrient ratio for fertilization of container-grown plants during the growing season is approximately 3:1:2 (N:P2O5:K2O). Fertilizer can be applied with one or more applications of a controlled-release fertilizer (CRF) or with a fertilizer solution through the irrigation system (fertigation).
Controlled-release fertilizers supply essential plant nutrients for an extended period of time (months). Fertilizers are available that contain different mechanisms of nutrient release and contain various components. CRF’s can be applied to the substrate surface or incorporated into the substrate prior to potting. High temperatures can result in excessively high soluble salt levels, so monitoring is important. If the CRF is incorporated, be sure to use it within a few days to prevent excessive soluble salt build-up. Avoid broadcasting CRF fertilizer on spaced containers.
Liquid fertilization should be applied at the frequency of application dependent on nutrient concentration in the substrate solution. When fertilizer is injected in the overhead irrigation system it will be necessary to take steps to capture the nutrient loaded runoff water so it will remain on-site. Fertilizing through the irrigation water is appropriate for low-volume irrigation systems in which irrigation water is delivered into the container. Even then, care should be taken to minimize leaching from the container to prevent nutrient laden runoff from entering surface or ground water. Fertilizer Application Rate
The goal of a fertilizer program is to apply the least amount of fertilizer for the desired growth so that nutrient leaching is minimized. Fertilizer application rates will vary from product to product but will also depend on species and container size.
As a general rule, one should apply CRF’s at the manufacturer's recommended rate. Reapplication of a fertilizer should occur when substrate solution nutrient status is below desirable levels (see section on Monitor Container Substrate Nutrient Status).
Studies have shown that plant growth using 75% of the recommended rate of CRF are not significantly different than full CRF rates. Rates of CRF at 50% of the recommended rate combined with low rate fertigation have resulted in increased growth rates. Even when using lower rates of CRF, there remains the need to capture nutrient-rich runoff water for re-use. Monitoring Container Substrates for Nutrient Status
To ensure adequate nutrient levels in the growth substrate, nursery operators should monitor the container substrate nutrient status and use the results to determine fertilizer reapplication frequency. Periodic monitoring is important because plant growth will be reduced when excessive or inadequate nutritional levels are present. Many times, this reduced growth may not be expressed by visual symptoms.
High concentrations of soluble salts can result from substrate components, inadequate irrigation frequency and duration, water source and/or fertilizer materials and application methods. Container substrate soluble salt levels may also accumulate during the overwintering of plants in polyhouses when fertilized with CRF’s. Excessive nutrient concentrations injure roots, ultimately restricting water and nutrient uptake. That combination ultimately compounds the problem because the plant will remove fewer nutrients from the substrate. Conversely, rainfall and excessive irrigation can leach nutrients from the container substrate resulting in inadequate nutritional levels and threaten water quality.
How Often to Monitor Substrate used for long-term crops should be tested at least monthly. Biweekly monitoring during the
summer may be necessary to track fluctuations in electrical conductivity (EC). The EC level is a

Container Nursery AMP Page 17 of 33 7/21/09
measurement of soluble salts in the substrate and is used as a relative indicator of the nutritional status. Even when controlled-release fertilizers are used, substrate nutritional levels will gradually fall during the growing season to levels that may not support optimal growth.
High temperatures in overwintering structures can result in nutrient release from controlled-release fertilizers. Monitor substrate electrical conductivity two or three times during the winter to ensure levels are not toxic.
Nutrients may accumulate in specific locations in substrate due to irrigation patterns and fertilization methods. Therefore, one isolated sample will not give an accurate representation of the nutrient status of the substrate. Substrate Sampling Methods for Nutrient Extraction
Several procedures have been used to extract the nutrient solution from the container substrate. The liquid extracted or sample of liquid extracted is needed for nutritional analyses. The Virginia Tech Extraction Method (VTEM, also referred to as the pour-through or leachate collection method) enables rapid sample collection.
The Virginia Tech Extraction Method should be conducted about an hour or two after irrigation (so that the growth substrate has drained). Uniform moisture levels are critical for obtaining consistent results with time. The container is then placed in a collection pan with the bottom of container elevated above bottom of the pan.
The bottom or sides of the container do not need to be wiped before collecting leachate. The elevated container does not allow the container to come in contact with the liquid collected in the pan and thereby avoids contaminating the liquid. Apply water (in a circular motion) to the substrate surface to yield about 50 ml (1.5 oz) of leachate (liquid) from the container. Leachate should be collected from five to ten containers per production bed or area to obtain an average value for the five to ten individual samples. This average value should be representative of the growth substrate nutritional status. This method of leachate collection allows for nursery operators to make quick determinations of leachate electrical conductivity and pH. For additional analyses, samples can be sent to a laboratory for determination of elemental concentrations. All laboratories do not use the same procedures, so test results can differ between laboratories. Consequently, interpretation of results by the testing lab is very important. Interpretation of Substrate Extract Levels
Container substrate nutritional levels in Table 2 may be used for interpreting levels obtained with the Virginia Tech Extraction Method. If nutritional levels that result from application of controlled-release fertilizers should drop below desirable levels during periods of active plant growth, then re-application should be considered to maintain optimal levels. Most fertilizers (except urea) are salts and when fertilizers are in solution they conduct electricity. Thus, the electrical conductivity of a substrate solution is indicative of the fertilizer level that is available to plant roots.
Desirable container substrate electrical conductivity levels are 0.5 – 1.0 mmhos/cm for solution fertilizer only, controlled-release fertilizers or the combined use of controlled-release and solution fertilizer. Ranges given in Table 2 correspond to most container-grown landscape plants. However, adjustments must be made for plants known to be sensitive to fertilizer additions. Plants with a low nutrient requirement (Appendix 2) may grow adequately with nutrient levels lower than those given in Table 2. Measure the irrigation water electrical conductivity. The irrigation water electrical conductivity will allow you to know the contribution of your water to the extracted liquid or leachate electrical conductivity and this should be considered when interpreting the substrate electrical conductivity.
Table 4: Desirable nutritional substrate levels for container plants with high nutritional requirements. (Levels are for interpretation of the Virginia Tech Extraction Method when fertilizing with solution or liquid fertilizer alone or in combination with controlled-release (CR) fertilizer or using only controlled-release fertilizer.)

Container Nursery AMP Page 18 of 33 7/21/09
Desirable levelsAnalysis Solution only or CR
and solution CR fertilizer only pH 5.0 to 6.0 5.0 to 6.0 Electrical conductivity, dS/m (mmhos/cm) 0.5 to 1.0 0.2 to 0.5 Nitrate-N, NO3–N mg/L (ppm) 50 to 100 15 to 25 Phosphorus, P mg/L 10 to 15 5 to 10 Potassium, K mg/L 30 to 50 10 to 20 Calcium, Ca mg/L 20 to 40 20 to 40 Magnesium, Mg mg/L 15 to 20 15 to 20 Manganese, Mn mg/L 0.3 0.3 Iron, Fe mg/L 0.5 0.5 Zinc, Zn mg/L 0.2 0.2 Copper, Cu mg/L 0.02 0.02 Boron, B mg/L 0.05 0.05 Levels should not drop below these during periods of active growth. Plants with low nutritional requirements may grow adequately with lower nutrient levels. See Appendix 2 for various plant nutritional requirements.
Supplemental Fertilization When nutritional monitoring indicates the need for additional fertilizer, apply supplemental fertilizer to
return the desired nutritional levels. The two application options are to apply fertilizer by injecting fertilizer into irrigation water or placing fertilizer on the surface of container substrate. When injected fertilizer is applied through an overhead irrigation system, runoff water will have a nutrient load and should be collected in an impoundment for reuse. It is recommended that one inject an individual element or a combination of elements in concentrations slightly less than desirable levels to be maintained in the growth substrate (Table 3).
Surface-applied fertilizer should be applied to specific blocks or groups of plants, thus minimizing nutrient loss and nutrient loading of runoff water. Broadcast fertilizer applications should be avoided whenever possible unless containers are closely spaced.
It is important to record all fertilizer applications. Good current and past records are valuable to help identify production problems. They also to help identify why things went better than expected and can be used to help fine-tune an already good program. Record as much information as possible. At a minimum, information should include fertilizer product name and analysis, date and location applied, and general notes about plant and environmental conditions. See Appendix 4 for a sample record sheet of fertilizer applications. Foliar Analyses
Foliar analyses may be used to verify or diagnose deficiencies or toxicities during the growing season. They are also used to determine the elemental status of plant tissue in fall or winter prior to spring flush of growth. Where a problem exists, it is typically necessary to sample a “good” plant as well as a “bad” plant for basis of comparison. It is important to maintain good records of foliar analyses. Ideally, photographs of sampled plants should also be included. That will help form a database of desired nutritional levels for future plant production. A well-designed fertility program can eliminate the need for tissue testing.
Tissue Sampling Considerations Generally, plants grown under similar conditions can be treated as a group when sampling, although
samples from different species or cultivars should not be mixed. A tissue sample must be representative of plants sampled. An acre of plants of the same species that had been treated similarly would require only one to three composite samples while plants of the same species that have been grown under different cultural or environmental conditions, should be sampled separately.

Container Nursery AMP Page 19 of 33 7/21/09
Taking Tissue Samples Take samples just before new flush of growth develops. Each sample should be composed of 20 –
30 uppermost mature leaves (or shoot tips) selected randomly from the group of plants. Only one or two leaves for broadleaf evergreens or one or two shoot tips (1-inch long) for narrow-leaved evergreens should be removed from a single plant to obtain a sample of green tissue that weighs from 10 to 30 grams (approximately one ounce). When sampling for diagnostic purposes, collect three samples of tissue that are the same age from abnormal or problem tissue and three samples of "normal tissue." Samples that represent different stages of the problem should be obtained to determine whether tissue elemental content changes as the problem progresses. Collect tissue samples in brown paper bags (not plastic lined) and mark with appropriate identification and sampling date. Interpretation of Tissue Analyses
Elemental ranges for uppermost mature leaves of woody ornamental plants are given in Table 4. Compare the magnitude of Table 4 values with test results as well as the ratio between elements. Seldom are all elemental test values within the ranges given in Table 4, but these values are intended to be guidelines. Maintain tissue test records for they are valuable aids when making fertility management decisions and you will be able to refine the guidelines in Table 4 based on your experience and for your crops and growing conditions.
Table 5. Elemental ranges for uppermost mature leaves of woody ornamentals. Element Percent* Element Parts Per Million
(ppm)Nitrogen 2.0–2.5 Iron 100–200 Phosphorus 0.2–0.4 Manganese 50–100 Potassium 1.5–2.0 Zinc 20–75 Calcium 0.5–1.0 Copper 5–10 Magnesium 0.3–0.8 Boron 20–30
* Percent of leaf dry weight Molybdenum 0.1–1.0
Pest Management Plants produced for the landscape require careful attention during production to maintain suitable plant
quality. Container-grown landscape plants are grown under conditions that often favor development of pests that adversely affect plant growth. These pests may include weeds, insects and diseases. In the past, pest control utilized preventative pesticide (herbicides, fungicides or insecticides) applications. Current pest control involves scouting for pests on a regular basis, identifying the pest and selecting appropriate chemicals that are environmentally friendly and target existing pest problems. Other good management practices include using low volume applicators and maintaining proper sprayer calibration and nozzle adjustments. Rules and Regulations
Pesticide Use Certification Program o All agricultural businesses that use pesticides must possess a pesticide applicator license. If
the business applies pesticide only for their own business they should have a private license. To receive a license, one must pass a test administered by the New Jersey Department of Environmental Protection (NJDEP). Licenses are good for five years but need to be renewed annually. During the five-year license period one is expected to receive eight (8) credits of core and sixteen (16) credits of category recertification training.

Container Nursery AMP Page 20 of 33 7/21/09
Employee requirements o Employees may apply pesticides as a “handler”. Annual training is required. A roster of trained
handlers must be maintained. o Employees are required to have received EPA-approved Worker Protection Safety training
every five years and have a current verification card in their possession. Reporting
o Businesses need to inventory stored pesticides annually and submit a copy to the local fire company by May 1.
o It is required that an annual use report be submitted to the NJDEP Pesticide Control Program office.
A complete set of rules and regulations can be found on the Internet at: http://www.nj.gov/dep/enforcement/pcp/pcp-regs.htm.
Nursery Pest Management (NPM) Pest management strategies should be used to minimize the amount of pesticides applied. That entails the
application of pesticides based on need and requires monitoring to make that determination. In addition, pesticides should be applied efficiently and at times when runoff losses are unlikely.
Use of NPM strategies is a key element of pesticide management. NPM strategies follow many of the practices established by integrated pest management programs. The significant difference is that nursery stock is governed by a zero threshold requirement. That requirement is necessary to meet laws established for shipment of nursery plant material. The following is a list of NPM strategies:
Apply insecticides and fungicides based on need. A scouting program to monitor pest problems is a necessary component of a NPM program. Only apply in anticipation of a pest problem when established environmental factors are present that predicts an outbreak. The major exception is that some disease pathogens require preventative sprays on susceptible crops. Use regular scouting to determine pest problems. Scouting can include direct observation or trapping with sticky cards or pheromone traps. Trained employees or professional pest control advisors should do scouting. Records of scouting results should be maintained, and there should be a designated person for making pest management decisions. Use effective pesticides, but choose those that are less environmentally persistent, toxic, or mobile. Maintain records on past pest problems, pesticide use, environmental and other information for treatment areas. Use control options that help maintain pest predators. Use pesticides that affect only target organisms and apply pesticides only to affected plant species or areas. Evaluate the use of pheromones:
o For monitoring populations o For mass trapping o For disrupting mating or other behaviors of pests o To attract predators/parasites
Destroy pest breeding, refuge and overwintering sites. Remove plant debris and keep them in a sealed container until disposal. Inspect and quarantine newly introduced plant material. When possible, choose plant species or cultivars that are known to be more resistant to common pests and diseases. Use spreader/stickers with fungicides and insecticidal sprays to increase efficiency and reduce losses due to rain or irrigation.
Pesticide Applications When pesticide applications are necessary, growers should identify and evaluate pesticide options. Growers

Container Nursery AMP Page 21 of 33 7/21/09
should develop a schedule that provides a rotation between pesticide classes to help reduce pest resistance to the controls. Where a choice of registered materials exists, producers are encouraged to choose the most environmentally benign pesticide products. Consider the persistence, toxicity, runoff and leaching potential of products along with other factors.
Growers should be licensed to use pesticides and meet the requirements of federal and state laws that regulate use of pesticides. Users must apply pesticides in accordance with the instructions on the label of each pesticide product and wear appropriate protective equipment. Farm-worker safety requirements should also be reviewed and met. A checklist of some pesticide safety needs follows:
Calibrate pesticide spray equipment annually. Use backflow protection devices on hoses used for filling tank mixtures. Evaluate the soil and physical characteristics of the site. Locate mixing, loading and storage in areas that have a low potential leaching or runoff of pesticides. In situations where the potential for pesticide loss is high, emphasis should be given to practices and/or management practices that will minimize these potential losses. Recognize physical characteristics that may be impacted by pesticide movement and take steps to reduce the risk of an incident occurring.
o Proximity to surface water o Runoff potential o Wind erosion and prevailing wind direction o Highly erodible soils o Highly permeable soils o Shallow aquifers o Wellhead protection areas o Proximity to dwellings
When possible, use pesticides with a low solubility in water or a low potential risk for leaching. Use pesticides with a short half-life to reduce the persistence of the pesticide in the soil and thus the opportunity for leaching. Time the pesticide application as far in advance as possible of irrigation and unfavorable weather conditions. The interval between pesticide application and irrigation or rain is closely related to the amount of pesticide runoff and leaching loss. It also relates to pesticide efficacy against the pest. Use efficient application methods, e.g., banding of pesticides or applying chemicals when containers are jammed (containers spaced pot-to-pot), or stagger applications.

Container Nursery AMP Page 22 of 33 7/21/09
Operation and Maintenance of Pesticide Application Equipment All pesticide application equipment should be maintained in good working condition and have known
replacement, repair and wear items identified. Calibration of equipment should be conducted prior to the mixing and loading of pesticides, and at a minimum, prior to each season of application or when a change in pesticide application is made. All sprayer tanks should be locked when not in use to avoid possible contamination of spray materials. Even small quantities of herbicides in a spray tank not intended to contain those products can result in significant plant damage.
Storage Chemical storage facilities must be designed or located such that weather conditions or accidental spills
or leakage will not impact soil, water, air or plants. Chemical storage facilities should be posted with adequate safety warning signs and chemicals in storage must be reported to the local fire department annually. Store pesticides in their original containers in environmentally safe and secure locations. Storage should be secure and include proper ventilation and control for any potential chemical leakage that may contaminate water sources or be a detriment to living organisms. Designs for chemical storage and handling facilities can be obtained through Rutgers Cooperative Extension or through your local Natural Resources Conservation Service office. Mixing and Rinsing Stations
Research has indicated that one of the greatest potentials for ground water contamination from pesticides comes from spills that may occur during the mixing and loading process. The location and design of proper mixing and rinsing equipment stations, relative to the potential contamination of ground or surface water sources should be considered.
To protect against ground water contamination, mixing, loading and cleaning operations should be done on an impervious surface covered with a roof and surrounded by impervious curbing. Wash water and waste products used in cleaning of pesticide application equipment should be disposed of in a safe manner. Rinse water from equipment and containers should be stored and used in the following batch mixture where possible. Where disposal is necessary and allowed by laws and regulations, it should be performed avoiding high runoff and leaching areas such as: ponds, lakes, streams and other water bodies. Disposal of empty pesticide containers should follow instructions provided on the container.
All operations should be performed at a safe distance (100 ft.) from any well. When wells are in close proximity, extreme care must be exercised when mixing or applying chemicals. Anti-siphoning devices should always be used to prevent backflow into the well.
Other Pesticide Considerations Follow label guidelines: Pesticide applicators need to follow recommended rates, use recommended methods of container disposal and follow all other instructions (re-entry interval, worker protection standards, etc.) as indicated on the pesticide label. Mix only the amount of pesticide needed: Plan ahead and mix only the amount of pesticide needed. Disposal of excess pesticides often presents water quality problems. Comply with Worker Protection Standards: Worker Protection Standards training sessions need to be conducted (and documented) to train nursery workers and pesticide handlers to use correct procedures for pesticides: applications, mixing, loading, handling, posting, record-keeping, re-entry of treated areas, use of personal protective equipment (PPE) and emergency assistance. Provide decontamination sites and post necessary information in a central location. Stagger herbicide applications whenever possible: Since the major herbicide runoff from container nurseries occurs in the first 6 irrigations after

Container Nursery AMP Page 23 of 33 7/21/09
application, staggering the herbicide applications over small areas should reduce peak loading of the system. Staggering applications would be preferable to one application over a large area. Apply pesticides to containers that are spaced optimally. Excessively wide spacing wastes pesticides and raises the potential for runoff. Avoid injecting pesticides into the overhead irrigation system. Select pesticides with lower water solubility. Participate in pesticide recycling programs.
System Integration: Grouping Plants The content of this document is a review of recommended practices for production of container nursery
plant material. It has been divided into the major categories of water management, nutrient management and pest management and it is recommended to group plants based on those categories for optimal efficiency.
There will always be reasons to modify grouping schemes within each category. As an example, when using controlled-release fertilizer for basal plant needs it may be more important to group according to the need for supplemental fertilization. It becomes increasingly important if the supplemental fertilizer is injected in irrigation water.
The larger challenge for growers is to balance the grouping needs between the water management, nutrient management and pest management categories. As an example, there will be often be times when grouping based on water will not be the best when considering either pesticide use or fertilization requirements. There is not just “one way” of doing things. Growing plants is a series of compromises.
As a grower, one must look for the best workable option. The ability to group plants based on all three management categories is highly improbable if not nearly impossible. One will need to develop a prioritized listing of critical needs. The management area that is most critical for optimal plant growth should be rated highest and should generally form the basis of one’s management program. As an example, if a plant is susceptible to root rots, watering may be the critical management area since plants will die if over-watered.
As a final thought, an agricultural management plan is a series of tools. It is the grower’s responsibility to choose the best tools for success in the nursery business. There is a combination that will maximize profitability while minimizing environmental impact for your business.

Container Nursery AMP Page 24 of 33 7/21/09
Glossary Absorption - to take in through pores or membranes (such as water) or to hold within. Acid - a substance that tends to give up protons (hydrogen ions) to some other substance. Acidity - hydrogen ion activity measured and expressed as a pH value. A substance is considered acidic if the pH is
less than 7. Adsorption - the attraction of ions or compounds to the surface. Substrate particles can adsorb large amounts of
ions and water. Air space - the percentage of container volume occupied by air-filled large pores from which water drains following
irrigation.Alkalinity - concentration of bases often expressed as carbonate or bicarbonate equivalents. An alkaline substrate
will have a pH greater than 7. AMP - the Agricultural Management Practices (AMP’s) include schedules of activities, prohibitions, maintenance
procedures and structural or other management practices found to be the most effective and practicable methods to prevent or reduce the discharge of pollutants to the air or waters of the United States. Practices also include operating procedures and practices to control site runoff, spillage or leaks, sludge or waste disposal, or drainage from raw material storage.
Anion exchange capacity – the sum total exchangeable anions (negatively charged particles) that a soil or substrate can adsorb. Anionic compounds include sources of phosphorus (PO43-), nitrogen (NO3-), and sulfur (S- and SO42-).
Base - a substance that tends to accept protons (hydrogen ions) from some other substance. Soil or water is considered basic if the pH is greater than 7.
Bicarbonate/carbonate - salts of carbonic acid that formed when carbon dioxide dissolves in water. In combination with sodium, calcium, and magnesium (NaHCO3, CaCO3 and MgCO3), they have an alkalizing effect.
Biofilter – a living system of plants, including natural and constructed wetlands, located within a watercourse that uses nutrients in runoff water, captures sediment, and degrades other chemicals, thereby enhancing water quality.
Bulk density - the weight of dry substrate per unit volume of substrate (expressed in grams per cubic centimeter, g/cc).
Carbonate - see bicarbonate. Cation Exchange Capacity (CEC) - total of exchangeable cations (positively charged ions) that a substrate can
adsorb. Some cations of interest include ammonium (NH4+), potassium (K+), calcium (Ca2+), and magnesium (Mg2+), all of which serve as plant nutrients, and hydrogen ions (H+) that cause soil acidity.
Collection basin (pond) – an enclosed body of water to collect excess water from irrigation or storm events. Constructed wetland - a shallow bed filled with selected vegetation, such as cattails, into which runoff water is
diverted and which serve as a biological filter for removing chemicals from the water. Constructed wetlands are designed to slow moving water, allowing time for treatment, and can use a variety of substrates, from native soil to sand or gravel. They can be designed to have the water level above the substrate surface or so that the water is kept below the surface.
Container capacity - the maximum volume of water that a substrate can retain following irrigation and drainage. It is a measure of the water reservoir in the container.
Controlled-release fertilizer (CRF) - a formulation of fertilizer where release time is controlled by the thickness of the coating (i.e. resin) or the amount of the release agent in the coating that dissolves in water to form pores in the coating (i.e. plastic). CRFs have the advantage over granular fertilizers of slowly but continually feeding crops and not exposing plants to a large dose of salt at one time.
Cyclic irrigation –an irrigation schedule in which a plant’s daily water allotment is divided up and applied in a series of irrigation and rest intervals throughout the day.

Container Nursery AMP Page 25 of 33 7/21/09
Deionization - a technique used to remove ions (charged particles) from irrigation water. Systems are available that combine pre-filtration, mixed-bed resins, activated carbon and final filtration.
Electrical conductivity (EC) - the measure of salt content of water based on the flow of electrical current. When the salt content increases, there is greater the flow of electrical current. EC is measured in mmhos/ cm or deciSiemens/m (dSm), which are numerically equivalent.
Emitter - a device used to apply water in the form of spray or drops to the substrate surface. It is a general term that can be applied to drip stakes, micro-sprinklers, misters, etc.
Half-life - the time required for a substance to degrade by one-half. Pesticides with a long half-life are considered persistent.
Leachate - solution that drains from container substrate during and after irrigation and may contain nutrients and pesticides from the substrate solution.
Nematode - very small worms abundant in many soils and important because they may attack and destroy plant roots or infest foliar portions of the plant.
Pathogen - a causal agent of disease. The term can refer to funguses, bacteria, viruses or other disease-causing organisms.
Perched water table – in container production, a saturated zone of water above the bottom of a container. Permeability - the capacity of porous rock, sediment or soil to transmit water. Pesticides - any form of chemical or substance used to control pests. Pesticides include fungicides, herbicides and
insecticides. pH - a measurement, ranging from 0 to 14, of the concentration of hydrogen ions (H+) in a solution. A pH of 7 is
neutral, a pH below 7 is acidic and a pH above 7 is alkaline or basic. Reverse osmosis - process where water is forced under pressure through a semi-permeable membrane to remove
dissolved and suspended constituents. Rhizosphere - the vicinity of the roots. Runoff - the portion of precipitation or irrigation on an area that is discharged from the area. Runoff which is lost
without entering the soil is called surface runoff and that which enters the soil is called ground water runoff or seepage flow. Managing excess irrigation water and rainfall is critical in the nursery industry because it can carry sediment, fertilizers, pesticides and other pollutants to surface water bodies or groundwater.
Sedimentation - particles settling out from suspension.

Container Nursery AMP Page 26 of 33 7/21/09
Sodium Adsorption Ratio (SAR) - the concentrations of calcium and magnesium relative to that of sodium. Sodium is often responsible for salinity problems when linked to chloride (Cl-) or sulfate (SO42-). The SAR can be determined for irrigation water or in soils. The following formulation is used to calculate the adsorption ratio:
2)( MgCa
NaSAR
Soluble salts - see electrical conductivity. Substrate - organic and inorganic materials, often bark, peat, and sand, used as substrate components in a
container to support the plant and contain the root system. Total porosity - total volume of pore space in a substrate. Transpiration – the loss of water vapor from plants, mostly through stomata (a pore in the epidermis of a leaf or
young stem) and lenticels (an opening in the cork of roots and stems). Virginia Tech Extraction Method (VTEM) - a technique used to monitor container nutrient status. Water-holding capacity - the amount of water a substrate can hold after being fully wetted and allowed to drain. In
containers, the term container capacity is also used. Because some water will be held too tightly by the substrate for plants to use, the term available water capacity is used to designate the amount water a substrate can hold that can be used by plants. An understanding of the water-holding capacity of your containers is important because it determines how frequently you should irrigate and how much water should be applied.

Container Nursery AMP Page 27 of 33 7/21/09
References: 1. Altland, J.E., Buamscha, G., Horneck, D. 2008. Substrate pH Affects Nutrient Availability in Fertilized
Douglas Fir Bark Substrates. HortScience. 43:2171-2178 2. Altland, J.E. Herbicide Accumulation in Recycled Irrigation Water, http://oregonstate.edu/dept/nursery-
weeds/feature_articles/herbicide_accum/herbicide_accumulation.html 3. Marconi, D.J. and P.V. Nelson. 1984. Leaching of applied phosphorus in container media. Scientia Hortic.
22:275-285. 4. Yeager, T.H. and J.E. Barrett. 1984. Phosphorus leaching from 32P- superphosphate-amended soilless
container media. HortScience 19: 216-217.
Acknowledgments:The Southern Nursery Association for providing access to their 2000 BMP for container plants. Yeager, T., C. Gilliam, T. Bilderbach, D. Fare. A. Neimeira, K. Tilt. 2000. Best Management Practices Guide for Producing Container-Grown Plants.

Container Nursery AMP Page 28 of 33 7/21/09
Appendix 1: A partial list of container-grown plants with low, medium, or high water requirements.
LOW WATER REQUIREMENT Arctostaphylos spp., Bearberry Berberis thunbergii, Japanese Barberry Cornus spp., Dogwood Cytisus scoparius, Scotch Broom Euonymus japonicus ‘Albo-Marginata’ Hedera helix, English Ivy Juniperus chinensis ‘Blue Vase’ Juniperus chinensis ‘Parsonii’ Juniperus chinensis ‘Torulosa’ Juniperus conferta, Shore Juniper Juniperus horizontalis Blue Rug (`Wiltonii') Leucophyllum frutescens, Texas Sage Mahonia fortunei, Fortune's Mahonia Tilia spp., Linden
MEDIUM WATER REQUIREMENT Abelia X grandiflora, Glossy Abelia Buxus microphylla, Japanese Boxwood Callistemon spp., Bottlebrush Camellia japonica, Camellia Chaenomeles speciosa, Flowering Quince Cortaderia selloana, Pampas Grass Crataegus spp., Hawthorn Forsythia spp. Gardenia jasminoides, Gardenia Hemerocallis spp., Daylily Hibiscus syriacus, Shrub Althaea Ilex X attenuata, East Palatka Holly Ilex cornuta ‘Burfordii Compacta’, Dwarf Burford Holly Ilex crenata, Japanese Holly Ilex crenata ‘Compacta’ Ilex crenata ‘Helleri’ Ilex vomitoria, Dwarf Yaupon Holly Ilex vomitoria ‘Schelling's Dwarf’ Illicium parviflorum, Anise Juniperus chinensis var. sargentii Lantana montevidensis, Trailing Lantana Ligustrum japonicum, Wax-Leaf Ligustrum Ligustrum sinense, Japanese Privet Liriope muscari, Lilyturf
Liriope ‘Evergreen Giant’ Magnolia grandiflora, Southern Magnolia Malus spp., Crab Apple Myrica cerifera, Waxmyrtle Nandina domestica, Heavenly Bamboo Pennisetum setaceum, Red Fountain Grass Philadelphus coronarius, Mock Orange Photinia X fraseri, Fraser's Photinia Pittosporum tobira, Pittosporum Platanus spp., Plane Tree Platycladus spp., Arborvitae Podocarpus macrophyllus, Podocarpus Pyrus spp., Pear Quercus laurifolia, Laurel Oak Quercus virginiana, Live Oak Rhododendron spp., Kurume Azalea Spiraea spp.Ulmus parvifolia, Chinese Elm Zelkova spp., Japanese Zelkova
HIGH WATER REQUIREMENT Acer rubrum, Red Maple Betula spp., Birch Buddleia davidii, Butterfly-Bush Cercis spp., Redbud Cotoneaster spp. Hibiscus rosa-sinensis, Hibiscus Hydrangea macrophylla, Hydrangea Juniperus chinensis var. procumbens Juniperus chinensis ‘San Jose’ Juniperus horizontalis ‘Plumosa Compacta’ Juniperus virginiana ‘Grey Owl’ Eastern Redcedar Lagerstroemia indica, Crape Myrtle Pyracantha spp., Pyracantha Rhododendron spp., Indica Azalea Salix spp., Willow Spiraea spp.Viburnum odoratissimum, Sweet Viburnum Viburnum plicatum var. tomentosum ‘Shasta’, Doublefile Viburnum Vitex agnus-castus, Chastetree
Plant water requirements will vary depending on growth rate desired and cultural conditions.

Container Nursery AMP Page 29 of 33 7/21/09
Appendix 2: A partial list of plants with low, medium, or high nutritional requirements when container-grown.
NutritionLOW NUTRIENT REQUIREMENT Camellia japonica, Camellia Camellia sasanqua, Sasanqua Camellia Cortaderia selloana, Pampas Grass Hydrangea macrophylla, Hydrangea Lantana montevidensis, Trailing Lantana Leucophyllum frutescens, Texas Sage Liriope spp. `Evergreen Giant' Myrica cerifera, Waxmyrtle Pennisetum setaceum, Red Fountain Grass Pinus spp., Pine Prunus caroliniana, Cherry Laurel Rhododendron spp., Azalea, Rhododendron Rhododendron austrinum, Florida Flame Azalea Rhododendron canescens, Pinxter Azalea Taxodium distichum, Bald Cypress MEDIUM NUTRIENT REQUIREMENT Abelia X grandiflora, Glossy Abelia Acer rubrum, Red Maple Buxus microphylla, Japanese Boxwood Dietes vegeta, African Iris Gardenia jasminoides, Gardenia Hedera helix, English Ivy Hemerocallis spp. Daylily Ilex X attenuata, East Palatka Holly Illicium parviflorum, Anise Juniperus chinensis `Blue Vase'
Juniperus chinensis `Parsonii' Juniperus chinensis `Torulosa' Lagerstroemia indica, Crape Myrtle Liriope muscari, Lilyturf Magnolia grandiflora, Southern Magnolia Mahonia fortunei, Fortune's Mahonia Nandina domestica, Heavenly Bamboo Photinia X fraseri, Fraser's Photinia Pittosporum tobira, Pittosporum Podocarpus macrophyllus, Podocarpus Quercus laurifolia, Laurel Oak Quercus virginia, Live Oak Ulmus parvifolia, Chinese Elm Washingtonia robusta, Washington Palm Zamia floridana, Coontie HIGH NUTRIENT REQUIREMENT Buxus sp. `Wintergreen' Boxwood Callistemon spp., Bottlebrush Euonymus spp., Euonymus Hibiscus rosa-sinensis, Hibiscus Hibiscus syriacus, Shrub Althaea Ilex cornuta `Burfordii Compacta' Dwarf Burford Holly Ilex crenata, Japanese Holly Ilex vomitoria, Dwarf Yaupon Holly Ligustrum japonicum, Wax-Leaf Ligustrum Lonicera spp., Honeysuckle Spiraea spp., Spiraea
Plant requirement will vary depending on growth rate desired and cultural conditions.

Nurse
ry AM
P Pa
ge 30
of 33
5/4
/07
Appe
ndix
3:
Ferti
lizer
App
licat
ion
Reco
rd S
heet
Date
Field
Loca
tion
Fertil
izer
Analy
sisBr
and N
ame
Amou
ntAp
plied
Plan
t Nam
e Co
ntaine
rSi
zeEn
viron
menta
l Con
dition
s

Nurse
ry AM
P Pa
ge 31
of 33
5/4
/07
Appe
ndix
4:
Ferti
lizan
te A
plica
ción
Tabl
ero
Fech
a Ar
ea
Análi
sis de
fer
tiliza
nte
Nomb
re de
l Pro
ducto
Ca
ntida
d tota
l us
ada
Plan
ta Vo
lumen
de
Mace
ta
Cond
icion
es A
mbien
tal

Nurse
ry AM
P Pa
ge 32
of 33
5/4
/07
Appe
ndix
5:
Pest
icide
App
licat
ion
Reco
rd S
heet
Date
Loca
tion
Plan
t W
ind
Prod
uct N
ame
Poun
ds pe
r Se
ction
To
tal U
sed
Leng
th of
Contr
olPe
sts N
ot Co
ntroll
ed
Gene
ral P
lant H
ealth

Nurse
ry AM
P Pa
ge 33
of 33
5/4
/07
Appe
ndix
6:
Pest
e Apl
icació
n Ta
bler
o
Fech
a Ar
ea
Plan
ta Vi
ento
Nomb
re de
l Pro
ducto
Lib
ras p
or la
se
cción
Ca
ntida
d tota
l us
ada
Long
itud d
el Co
ntrol
Peste
s (Pl
agas
) no
contr
olada
s Sa
lud de
Plan
ta Ge
nera
l