university of nairobieie.uonbi.ac.ke/sites/default/files/cae/engineering/eie/an overview... · 3.2...
TRANSCRIPT
UNIVERSITY OF NAIROBI FINAL YEAR PROJECT
TITLE: AN OVERVIEW OF GEOTHERMAL
ENERGY IN KENYA.
PROJECT NO. 1
NAME: MUTINDA PETER NZUVA.
REG NO: F17/2126/2004
SUPERVISOR: MR. N. S. WALKADE
EXAMINER: DR. ABUNGU
A report submitted in partial fulfillment of the requirements for the award of the
degree of Bachelor of Science in Electrical and Electronics Engineering of the
University of Nairobi
Date of Submission: 20TH
MAY 2009
DEPARTMENT OF ELECTRICAL AND INFORMATION ENGINEERING

DEDICATION
To my father John and my mother Patricia for humbly nurturing me, their kindness,
understanding, love and guidance and above all for being my parents. Without you I
Would not be what I am today.
Thank you and may God’s blessings be upon you always.
ii

ACKNOWLEDGEMENTS I wish to express my sincere and deep gratitude to all of you who in many ways have
contributed to the fulfillment of this report. I am especially grateful to:
DR. Walkade, my university supervisor, for his profound support, encouragement, never
failing enthusiasm and amiability and for sharing his vast knowledge.
My dear friends and classmates at the university especially Mutonga for sharing the “ups
and downs” and being very important for making the daily life at campus so enjoyable.
Geologist Felix Mutunguti, Ministry of Energy for his support, great understanding and
overwhelming contribution to the successful completion of my project.
Finally but most important my parents, brothers and sisters for their love and endless
support, for always being there for me and giving me strength to continue.
THANK YOU ALL!!!!
iii

ABSTRACT
Geothermal power is a form of energy stored in rocks and fluids within the earths crust.
This form of energy is renewable. If well tapped, it can be used in production of
electricity, heating in green houses and a source of tourist attraction. Due to unreliable
rain patterns, and the fact that Kenya relies highly on hydropower, the electricity supply
has become unreliable especially during the dry season. An example of this scenario was
experienced in the year 2000 which was a great drawback to the country’s economic
development. Kenya is endowed with vast geothermal resources, mainly located in the
Rift valley. Electricity demand in the country has risen over the years, causing great
pressure on the conventional sources of energy like hydropower, which is normally
affected by the weather changes. This is unlike geothermal resources which are yet to be
substantially tapped hence the need to develop geothermal energy.
iv

CONTENTS
CHAPTER ONE: INTRODUCTION
1.1 Overview………………………………………………………………………….1
1.2 Objective………………………………………………………………………….1
1.3 Outline………………………………………………………………………….....1
CHAPTER TWO: BACKGROUND
2.1 Origin of Geothermal Resource…………………………………………………..2
2.2 History of Geothermal Energy..………………………………………………….3
2.3 Exploration ……………………………………………………………………....3
2.4 Location………………..…………………………………………………..…..…4
2.5 Geothermal Prospects in North Rift…………………………………………..…5
2.6 Kenya’s source of energy………………………………………………………..7
2.7 Different sources of electricity………………………………………………….10
CHAPTER THREE: EXPLORATION AND CONVERSION TO ELECTRICITY
3.1 Resource identification…………………………………………………………13
3.2 Olkaria Geothermal system……………………………………………………..14
3.3 Exploration and extraction………………………………………………..…….15
3.4 Steam supply system……………………………………………………………17
3.5 Turbine………………………………………………………………………….19
3.6 Generation and transmission……………………………………………………20
3.7 Geothermal power technologies………………………………………………..22
v
CHAPTER FOUR: GENERATION COST AND CURRENT STATUS OF
GEOTHERMAL DEVELOPMENT:
4.1 Components of Annual Cost…………………………………………………25
4.2 Current status of Geothermal Development………………………………....28
4.3 Olkaria I Geothermal Field…………………………………….………….…29
4.4 Olkaria II Geothermal Field…………………………………………………30
4.5 Olkaria III Geothermal Field………………………………………………...32
4.6 Olkaria IV Geothermal…...………………………………………………….33
4.7 Other Fields………………………………………………………………….34
CHAPTER FIVE: FUTURE DEVELOPMENT
5.1 Future investment opportunities………………..……………………………37
5.2 Geothermal development activities.…………..….………...…………….….39
5.2.1 Dry rock …………………………………………………………….….….39
5.2.2 Heat exchanger liners……………………..………………………………..39
5.2.3 Air-cooled condensers…………………………………………………..…40
5.3 Future plans………………………………………………………………….40
CHAPTER SIX: OTHER USES AND IMPACTS OF GEOTHERMAL ENERGY
6.1 Direct uses of Geothermal energy…………………………………..……….41
6.2 Factors affecting Geothermal energy exploration………...…………………41
6.3 Ways of improving Geothermal energy exploration………………………...44
6.4 Other prospective areas…………………………………………………..…..45
6.5 Advantages of Geothermal energy………………………………………..…45
vi

6.6 Disadvantages of Geothermal energy…………………………………….….46
6.7 Ways of reducing Geothermal energy effects……….………………........48
CHAPTER SEVEN: CONCLUSION AND RECOMMENDATION...….49
Conclusions…………………………………………………...………...…….49
Recommendations…………………………………………………..………..50
REFERENCE……………………………………………………………….51
Vii

ACRONYMS
IPP Independent Power Producer
KENGEN Kenya Energy Generating Company
MW Mega Watt
KPLC Kenya Power and Lighting Company
ERB Energy Regulatory Board
KVA Kilo Volt Ampere
KV Kilo Volt
MV Mega Volt
MVA Mega Volt Ampere
NREL National Renewable Energy Laboratory
GDC Geothermal Development Company
CO2 Carbon dioxide
Lb/KWh Pound per Kilo Watt hour
dB Deci bel
H2S Hydrogen Sulphide
AT Ampere Turn
Ohm-m Ohm meter
vii

LIST OF FIGURES
2.1 Schematic of Geothermal power plant production and injection wells
2.2 A map showing the Active Geothermal centers in Kenya
2.3 A map of Geothermal prospects in Rift valley.
2.4 A map of existing and potential power plants in KenGen.
3.1 A chat representing power in industry players.
3.2 A volcano-tectonic map of Greater Olkaria Geothermal complex..
3.3 A typical Olkaria well profile.
3.4 Kenya National Power Grid system.
3.5 Dry steam power plant schematic.
3.6 Flash steam power plant schematic.
3.7 Binary cycle power plant schematic.
4.1View of Olkaria I power plant.
4.2 View of Olkaria II power plant.
4.3 View of Olkaria III power plant.
4.4 View of Olkaria IV power plant.
4.5 Steam output at Olkaria East field for 23 years.
5.1 A graph of projected future demands and power sources.
6.1 Green house heating.
6.2 Recreation Application for Geothermal energy.
6.3 Pyrethrum drier at Eburru.
6.4 Water harvesting at Eburru.
ix

LIST OF TABLES
2.1 Electricity contribution by different sources.
2.2 Geothermal sites with exploration status.
3.1 Olkaria East field wells characteristic
Geothermal plant capital cost, operation and maintenance cost.
5.1 Proposed sequence for geothermal development in short term to medium term.
5.2 Projected future power demands and sources.
6.1 Planned power additions for five years
6.2 Comparison of CO2 Emissions by power source
x

1
CHAPTER ONE: INTRODUCTION
1.1 Overview
Geothermal power is the thermal energy stored in rocks and fluids within the earth. It is derived
from the heat of the earth’s core. It is clean, abundant and reliable. If properly developed it can
offer a renewable and sustainable energy source. Geothermal energy is applied in electricity
generation, direct use of heat and ground source heat pumps. Direct heat include heating green
houses and drying foods while ground source heat pumps are used to heat and cool buildings
using surface soils as heat reservoir.
1.2 Objective of the project
This project was initiated by Mr.N.S Walkade of the University of Nairobi in December 2008.
The main aim of this project was to carry out in depth research in geothermal energy in Kenya.
The specific instruction was to study the status and potential capacity for Kenyan grid system.
1.3 Outline
The report is organized into six chapters as follows:
Chapter two describes the origin, history and exploration of Geothermal energy and its resources.
It also gives its Location, prospects in Rift valley and other Kenyan sources of energy.
Chapter three describes the resource identification, Olkaria Geothermal system and its
exploration. It also explores its generation, transmission and the geothermal power technologies
Chapter four deals with the cost of generation and the current status of geothermal development
Chapter five elaborates the future development status
Chapter six describes the uses of geothermal energy, the factors affecting it and the ways of
improving them.
Chapter seven gives the conclusions and recommendations
2
CHAPTER TWO: BACKGROUND.
2.1: Origin of geothermal resources
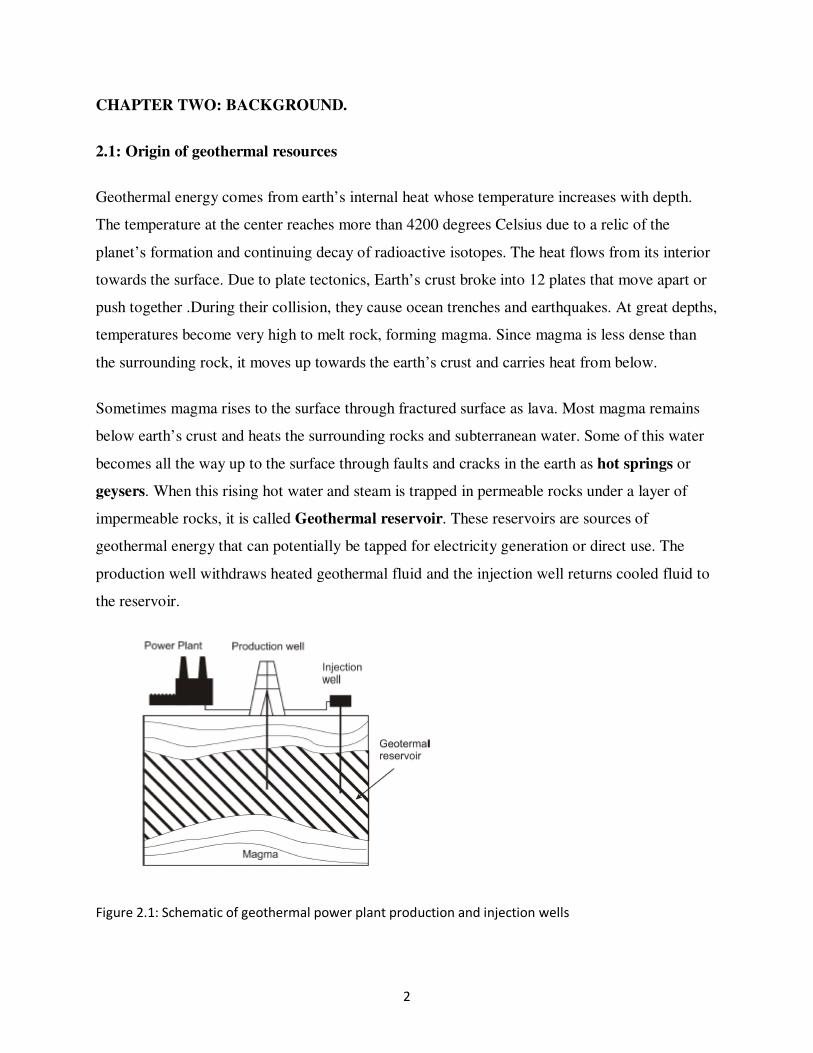
Geothermal energy comes from earth’s internal heat whose temperature increases with depth.
The temperature at the center reaches more than 4200 degrees Celsius due to a relic of the
planet’s formation and continuing decay of radioactive isotopes. The heat flows from its interior
towards the surface. Due to plate tectonics, Earth’s crust broke into 12 plates that move apart or
push together .During their collision, they cause ocean trenches and earthquakes. At great depths,
temperatures become very high to melt rock, forming magma. Since magma is less dense than
the surrounding rock, it moves up towards the earth’s crust and carries heat from below.
Sometimes magma rises to the surface through fractured surface as lava. Most magma remains
below earth’s crust and heats the surrounding rocks and subterranean water. Some of this water
becomes all the way up to the surface through faults and cracks in the earth as hot springs or
geysers. When this rising hot water and steam is trapped in permeable rocks under a layer of
impermeable rocks, it is called Geothermal reservoir. These reservoirs are sources of
geothermal energy that can potentially be tapped for electricity generation or direct use. The
production well withdraws heated geothermal fluid and the injection well returns cooled fluid to
the reservoir.
Figure 2.1: Schematic of geothermal power plant production and injection wells

3
2.2: History of geothermal energy
General
Geothermal Energy was first harnessed in Italy in 1904 by prince piero but its growth was slow
because of cheap competition sources of Electric power. The first geothermal power plant in the
United States was operated in 1960 at the Geysers in Sonoma County, California.
Kenya
Geothermal production began in Kenya at Olkaria when the first 15 MWe generating unit was
commissioned in June 1981 and the second 15 MWe was in November 1982. The third unit was
commissioned in March 1985 raising the total installed capacity at Olkaria to 45 MWe. The other
geothermal generation capacities are Olkaria II, which is currently producing 70 MWe, owned
by KenGen and Olkaria III which is owned by an IPP (ORMAT) and is currently producing 12
MWe and plans are in progress and at and to increase its production to 48 MW by end of 2005.
2.3: Exploration
Exploration first started by drilling two wells in 1956 in Olkaria I and was followed by increased
interest in the 1970s. Initial production started in 1981 when the first plant of 15MW was
commissioned in Olkaria I currently 45MWe is generated by Olkaria I geothermal power station;
70 MWe is produced from Olkaria II (both operated by KenGen) and an IPP is producing12Mwe
at Olkaria III. KenGen and the IPP produce a total of 129 MWe of geothermal energy and this is
expected to increase to 576MWe within the next 20 years. Drilling of three exploratory wells at
Olkaria IV was done between 1998 and 1999.Thereafter six appraisal wells were drilled at the
prospect between July 2007 and June 2008.Development is currently going on for the
construction of a 140MWe power plant. Exploratory drilling was carried out at Eburru between
1988 and 1990.A potential of 20MWe was identified. Over the years, surface exploration has
been going on at various geothermal prospects

4
2.4: Location
Kenya is endowed with geothermal resources mainly located in the Rift Valley. Electricity
demand in Kenya has continued to grow steadily over the years and has caused great pressure on
the conventional sources of energy like hydropower, which is normally affected by weather
changes. It is estimated conservatively that the Kenya Rift has a potential of greater than 2000
MWe of Geothermal Power. A total of twenty sites have been earmarked for further
investigation.

5
Figure 2.2: A map showing the Active geothermal centers in Kenya

6
2.5: Geothermal Prospects in North Rift
The north rift geothermal systems extend from immediately north of Menengai to the central
Island in L.Turkana.They comprise of
Bogoria,Baringo,Korosi,Silali,Emuruangogolak,Namarunu,Barrier Volcano and the central
island geothermal prospects. They are in different stages of exploration.Bogoria; Baringo, Korosi
and paka have been assessed in detail and wells for drilling exploration sited. Development of
two 70MWe geothermal power plant each from the best north rift prospects has been projected
for commissioning by 2018.
Active geothermal centre in Kenya.
The identified geothermal potential in the country is estimated at 7,000MW.However, only
130MW of this potential has so far been harnessed. The large untapped potential makes
Geothermal the most promising indigenous energy resource for development of electricity in
Kenya
7
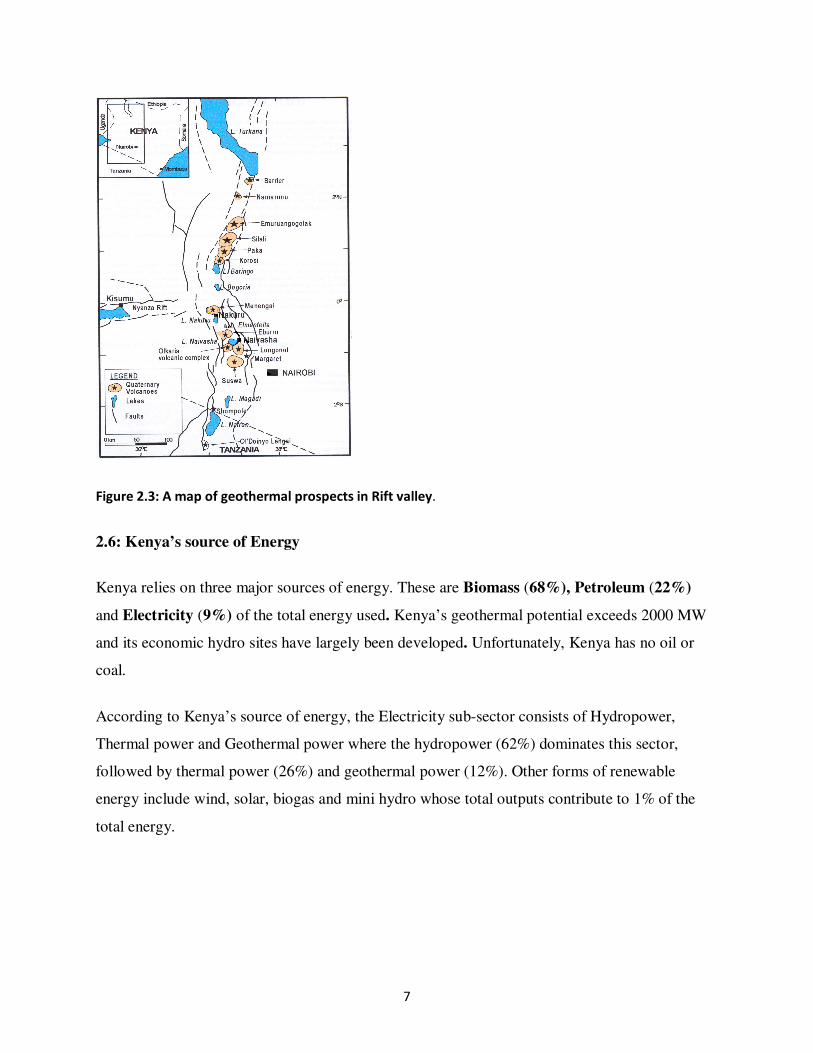
Figure 2.3: A map of geothermal prospects in Rift valley.
2.6: Kenya’s source of Energy
Kenya relies on three major sources of energy. These are Biomass (68%), Petroleum (22%)
and Electricity (9%) of the total energy used. Kenya’s geothermal potential exceeds 2000 MW
and its economic hydro sites have largely been developed. Unfortunately, Kenya has no oil or
coal.
According to Kenya’s source of energy, the Electricity sub-sector consists of Hydropower,
Thermal power and Geothermal power where the hydropower (62%) dominates this sector,
followed by thermal power (26%) and geothermal power (12%). Other forms of renewable
energy include wind, solar, biogas and mini hydro whose total outputs contribute to 1% of the
total energy.

8
Figure 2Figure 2Figure 2Figure 2.4: .4: .4: .4: A map showing existing and potential A map showing existing and potential A map showing existing and potential A map showing existing and potential power plants of KenGenpower plants of KenGenpower plants of KenGenpower plants of KenGen....

9
Preference to Geothermal energy
Due to unreliable rain patterns, and the fact that Kenya relies highly on hydropower, the electricity supply
has become unreliable especially during the dry season. An example of this scenario was experienced in
the year 2000 which was a great drawback to the country’s economic development. Kenya is endowed
with vast geothermal resources, mainly located in the Rift valley. Electricity demand in the
country has risen over the years, causing great pressure on the conventional sources of energy
like hydropower, which is normally affected by the weather changes. This is unlike geothermal
resources which are yet to be substantially tapped.
Development of geothermal energy which is indigenous, low cost environmentally benign and
reliable seems to be the long-lasting solution to this problem. The least cost power development
plan for the year 2004 (KPLC,2004) has considered geothermal energy as a least cost source of
electric power in Kenya to replace the medium diesel plants which were in the earlier plans.
The government of Kenya has demonstrated a great commitment to the exploration and
exploitation of geothermal energy. About 8 million US dollars will be set aside, every year for
the next five years, for geothermal exploration in the Rift valley. More funds are being sought
from development partners for exploitation of the already proven geothermal resources i.e.
Olkaria IV, Eburru, Suswa, Longonot and Menengai.
Kenya is endowed with a rich geothermal resource, mainly located in the Rift valley. Electricity
demand in the country has risen over the years, causing great pressure on the conventional
sources of energy like hydropower, which is normally affected by weather changes. This is
unlike geothermal resources which are yet to be substantially tapped. The identified geothermal
potential in the country is estimated at 7,000 MW. However, only 130MW of this potential has
been harnessed. The large untapped potential makes geothermal the most promising indigenous
energy resource for development of electricity in Kenya.

10
2.7: Electricity contribution by different sources.
The installed electricity capacity in Kenya currently stands at 1,232.6 MW. This includes a firm
20 MW import from Uganda, and 74 MW from Kipevu II diesel plant, which came into
commercial operation in August 2001, 70MW from Olkaria II which was fully commissioned in
November 2003.
Table 2.1 Electricity contributions by different energy sources
Source Capacity in MW
Percentage (%) of total capacity
Hydro (Including Imports)
697.2
57.34
Geothermal
128
10.53
Oil Thermal Generation
133.5
10.98
IPP’s (Thermal)
174.0
14.31
Gas Turbine
73.5
6.05
Wind
0.4
0.033
Isolated Diesel Plants
9.2
0.76
Total 1215.8 100
11
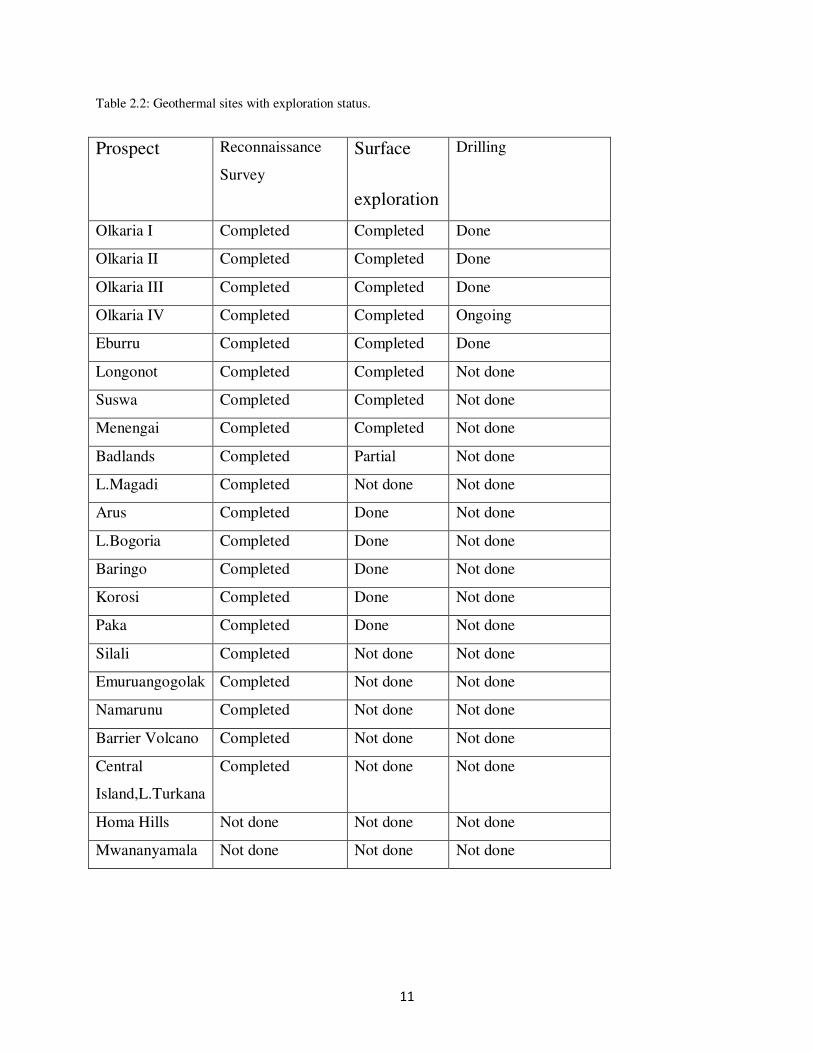
Table 2.2: Geothermal sites with exploration status.
Prospect Reconnaissance
Survey
Surface
exploration
Drilling
Olkaria I Completed Completed Done
Olkaria II Completed Completed Done
Olkaria III Completed Completed Done
Olkaria IV Completed Completed Ongoing
Eburru Completed Completed Done
Longonot Completed Completed Not done
Suswa Completed Completed Not done
Menengai Completed Completed Not done
Badlands Completed Partial Not done
L.Magadi Completed Not done Not done
Arus Completed Done Not done
L.Bogoria Completed Done Not done
Baringo Completed Done Not done
Korosi Completed Done Not done
Paka Completed Done Not done
Silali Completed Not done Not done
Emuruangogolak Completed Not done Not done
Namarunu Completed Not done Not done
Barrier Volcano Completed Not done Not done
Central
Island,L.Turkana
Completed Not done Not done
Homa Hills Not done Not done Not done
Mwananyamala Not done Not done Not done

12
CHAPTER THREE: EXPLORATION AND CONVERSION TO ELECTRICITY
Electrical energy production, exploration and conversion in Kenya is carried out by various
bodies.
Power industry players:
The following bodies help in the power production in Kenya
Figure 3.1 A chart representing power industry players
For geothermal exploration to be successful, various procedures have to be followed in order to
identify the resource and exploit it.

13
3.1 Resource Identification
Geological, hydrogeological, geophysical and geochemical techniques are used to identify and
quantify geothermal resources. Geological and hydro geological studies involve mapping any hot
springs or other surface thermal features and the identification of favorable geological structures.
These studies are used to recommend where production wells can be drilled with the highest
probability of tapping into the geothermal resource. Geophysical surveys are implemented to
figure the shape, size, depth and other important characteristics of the deep geological structures
by using the following parameter: temperature(thermal survey),electrical conductivity(electrical
and electromagnetic methods),propagation velocity of elastic waves (seismic survey),density
(gravity survey),and magnetic susceptibility(magnetic survey).Geochemical survey(including
isotope geochemistry) are a useful means of determining whether the geothermal system is water
or vapor-dominated, of estimating the minimum temperature expected at depth, of estimating the
homogeneity of the water supply and, of determining the source of recharge water.
Before geothermal exploration and exploitation takes place, the following steps have to be
followed
1. Identification of geothermal phenomena.
2. Ascertaining that a useful geothermal production field exists.
3. Estimation of the size of the resource.
4. Classification of the geothermal field.
5. Location of productive zones.
6. Determination of the heat content of the fluids that will be discharged by the wells in the
geothermal field.
7. Compilation of a body of data against which the results of future monitoring can be
viewed.
8. Assessment of the pre-exploitation values of environmentally sensitive parameters.
(9) Determination of any characteristics that might cause problems during field development.

14
3.2 The olkaria geothermal system.
Location
The Olkaria geothermal system is located on the floor of the East Africa Rift valley in Kenya
about 120 km North West of Nairobi. The resource is associated with the Olkaria volcanic
complex which consists of a series of lava domes and ashes. The geothermal reservoir is
considered to be bound by arcuate faults forming a ring or caldera structure. A magmatic heat
source is represented by intrusions at deep levels inside the ring structure. Faults and fractures
are prominent in the area with a general trend of N-S and E-W but there also some inferred faults
striking NW-SE.
Figure 3.2: A volcano-tectonic map of greater Olkaria Geothermal complex
15
The Olkaria geothermal field
The Olkaria geothermal field covers an area of approximately 70 km². A total of 110 wells have
so far been drilled out of which 50 are production wells, 24 for Olkaria I, and 22 for Olkaria II, 6
re-injection wells and four production wells in Olkaria III. The main production zones are
generally between 750-900m being steam dominated and from 1100 metres to 1300 metres
which is richer in water though steam can be intercepted down to the full depth of the well.
Currently there is steam capable of generating an additional 25 MWe in Olkaria I and 28 MWe
in Olkaria II.
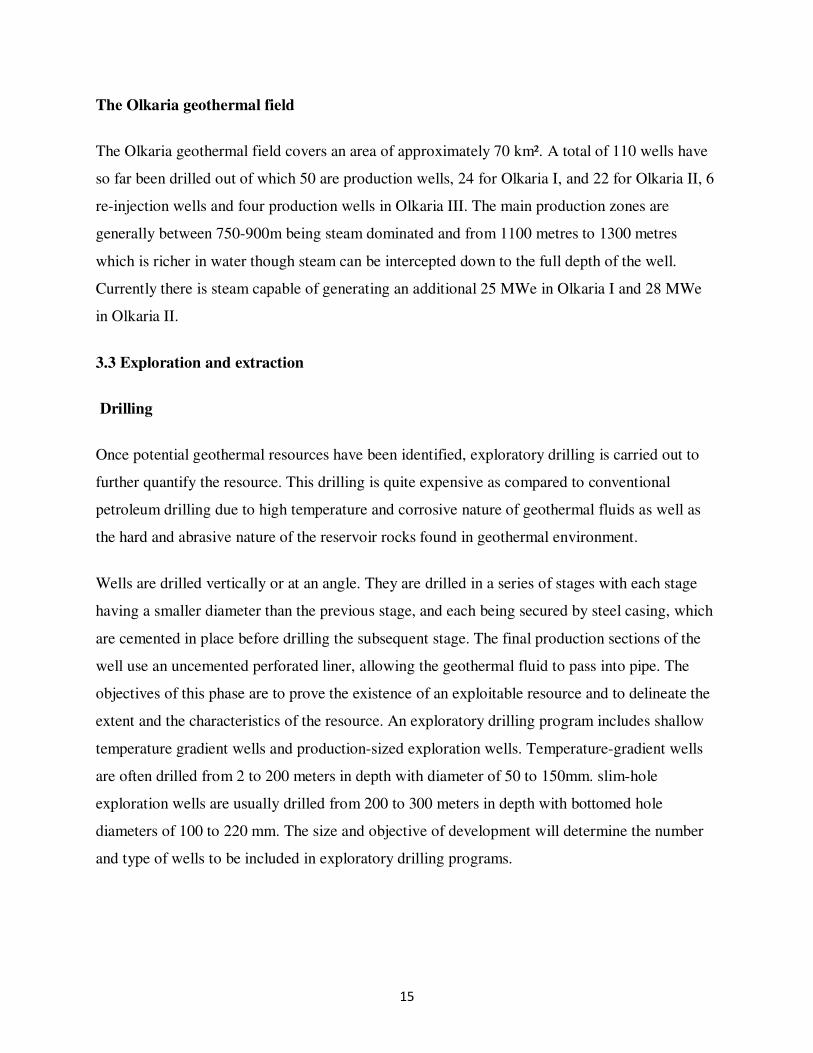
3.3 Exploration and extraction
Drilling
Once potential geothermal resources have been identified, exploratory drilling is carried out to
further quantify the resource. This drilling is quite expensive as compared to conventional
petroleum drilling due to high temperature and corrosive nature of geothermal fluids as well as
the hard and abrasive nature of the reservoir rocks found in geothermal environment.
Wells are drilled vertically or at an angle. They are drilled in a series of stages with each stage
having a smaller diameter than the previous stage, and each being secured by steel casing, which
are cemented in place before drilling the subsequent stage. The final production sections of the
well use an uncemented perforated liner, allowing the geothermal fluid to pass into pipe. The
objectives of this phase are to prove the existence of an exploitable resource and to delineate the
extent and the characteristics of the resource. An exploratory drilling program includes shallow
temperature gradient wells and production-sized exploration wells. Temperature-gradient wells
are often drilled from 2 to 200 meters in depth with diameter of 50 to 150mm. slim-hole
exploration wells are usually drilled from 200 to 300 meters in depth with bottomed hole
diameters of 100 to 220 mm. The size and objective of development will determine the number
and type of wells to be included in exploratory drilling programs.
16
Figure 3.3: A typical Olkaria Well Profile

17
3.4 Steam supply system
The steam/water mixture from the geothermal well is led into a wellhead cyclone separator
where the two are separated. On average the mixture is composed of 75% steam and 25% water.
steam from a set of wells is collected and transmitted through a single pipeline(one for each
turbine) to the turbine through a moisture separator(a secondary separator).The line pressure is
regulated automatically by pneumatically operated pressure relief valves. Dry saturated steam at
0.5 bar abs. and 151.9 º C enters the turbine through two pipes from the moisture separator.
The hot water (at about 70 to 80°C) is discharged into an infiltration pond through a flow
measuring v-notch installed at the outlet of the well-head silencer. This water is highly
mineralized and is not fit for human consumption unless treated.
The three turbines are driven by steam from twenty one wells whose average steam and water
flow, well head pressure and depths are summarized as follows.

18
Table 3.1: Olkaria East field wells characteristics
WELL STEAM
FLOW
(t/h)
WATER
FLOW
(t/h)
OPERATING
PRESS.(bar
abs)
MAX.
RECORDED
SHUT IN
PRESS (bar
abs)
MAX.
RECORDED
TEMP(º)
DRILLED
DEPTH
(m)
Ow-2 21 6 5.8 35.3 282 1360
Ow-5 26 1 5.2 8.4 264 910
Ow-6 14 2 5.8 38 296 1885
Ow-7 10 3 7.7 38 254 1308
Ow-8 26 _ 6.6 266 1600
Ow-10 19 2 5.0 47.6 274 1183
Ow-11 16 8 6.6 36.5 248.1 1221
Ow-12 42 0.3 5.9 42 252 901
Ow-13 14 4 5.8 33.6 230.4 1049
Ow-14 15 0 7.8 29.1 259.7 1069
Ow-15 33 1 5.9 46.3 262.7 1301
Ow-16 59 16 6.8 37.4 287 1304
Ow-17 12 0.1 6.8 33.2 275.4 1234
Ow-18 37 2 7.8 42.2 260 1407
Ow-19 21 1 6.8 63.9 341 2484.6
Ow-20 25 2 5.8 37.3 285 1406
Ow-21 16 1 5.8 31 267 1394
Ow-22 17 6 5.8 34 269 1404
Ow-23 11 2 5.6 33.2 243 1330
Ow-24 28 3 5.8 50.5 287 1600
Ow-25 13 8 5.3 29.1 280 1600
Ow-26 35 15 6.0 40.0 286 1607

19
3.5 Turbine
Each turbine is of a single flow 4-stageimpulse condensing type and rotates at 3,000 revolutions
per minute.
Turbine speed control and protection:-
The turbine is provided with two mechanical speed governors which keep the speed at 3,000 ±
4% and two emergency stop valves. In case the turbine over speeds or experiences an axial thrust
or a drop in bearing lubricating oil pressure or low condenser vacuum below a predetermined
value, protective devices will command the governor and emergency stop valves to shut and stop
steam supply hence stopping the turbine.
Steam condenser and gas extraction system:-
In order to increase enthalpy drop and subsequent power output, the turbine exhaust pressure
must be reduced as much as possible To achieve this end, steam exhausted from turbine is passed
into a condenser situated below the turbine. In this chamber, a number of nozzles spray cold
water on the steam and the latter condenses into warm water. At a rated power output of 15MW,
134 tonnes of hot water (at 50°C) are formed and discharged from the condenser into a hot water
collecting tank (seal pit) through a barometric pipe. In a separate compartment of the same
chamber gas/vapor mixture is cooled. The gases which include hydrogen sulphide and carbon
dioxide are sucked and thrown out to the atmosphere by two steam-jet gas ejectors. After
discharging gases and water from the condenser, a turbine exhaust pressure of about 96mm Hg
abs is achieved.
Cooling and circulating water system:-
Pumps installed at the three hot water collecting tanks pump about 7,860 tonnes of water per
hour through a common pipe to three mechanically induced draft cooling towers. The warm
water is distributed on the top of the cooling towers from where it drops down through wooden
splash bars and exchange heat with cold air being fanned up by fans and flowing counter to it.
About 50% of that water is lost at the cooling tower though evaporation.
20
The cold water (at 23 ºC) is siphoned from the cooling tower basin to the condensers by the
pressure difference between atmospheric pressure and condenser vacuum.
The flow of water from each cooling tower is approximately 2,340m³/h. A portion of this water
is tapped off from the main pipe and pumped through generator air coolers and bearing
lubricating oil coolers.
3.6 Generation and transmission
Each turbine drives 19 1875 KVA, air cooled electrical generator. The power produced is passed
through switchgear to an 11KV bus bar.4% of that power is used to run the plant auxiliary
equipment. One 35 MVA double primary transformer steps up the voltage of the remaining
power from11 to 132KV.A 132 KV 22km long transmission line from these transformers
transmit the station supply to the national grid through the Naivasha sub-station as shown in
figure 2.4.
Protection:-
The generators and transformers are protected by a system of relays which besides tripping the
equipment in emergency, operate bell and buzzar alarms.
Control room
All important control and supervisory instruments are centralized in a control room for ease of
operation. Schematic diagrams displayed on turbine-generator panels show clearly the plant
features and operating conditions of turbo-generator, auxiliary equipment and steam supply
system.

21
Figure 3.4 Kenya National power grid system
22
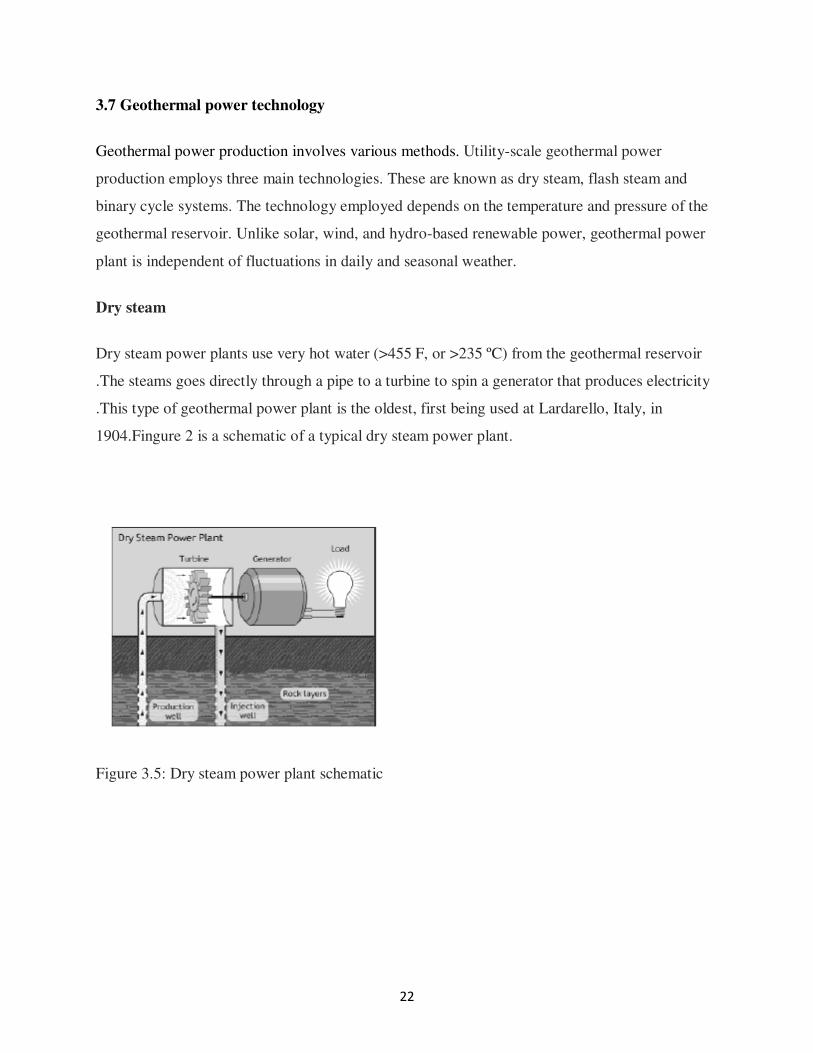
3.7 Geothermal power technology
Geothermal power production involves various methods. Utility-scale geothermal power
production employs three main technologies. These are known as dry steam, flash steam and
binary cycle systems. The technology employed depends on the temperature and pressure of the
geothermal reservoir. Unlike solar, wind, and hydro-based renewable power, geothermal power
plant is independent of fluctuations in daily and seasonal weather.
Dry steam
Dry steam power plants use very hot water (>455 F, or >235 ºC) from the geothermal reservoir
.The steams goes directly through a pipe to a turbine to spin a generator that produces electricity
.This type of geothermal power plant is the oldest, first being used at Lardarello, Italy, in
1904.Fingure 2 is a schematic of a typical dry steam power plant.
Figure 3.5: Dry steam power plant schematic

23
Flash steam
Flash steam power plants use hot water (>360 degrees F, or>182 degrees C) from the geothermal
power plant. when water is pumped to the generator, it is released from the pressure of the deep
reservoir .The sudden drop in pressure causes some of the water to vaporize to steam, which
spins the turbine to generate electricity.
Both dry and flash steam power plants emit small amounts of carbon dioxide, nitric oxide, and
sulfur. Hot water not flashed into steam is returned to the geothermal reservoir through injection
wells
Fig 3.6: Flash steam power plant schematic
Binary –cycle
Binary cycle power plants use moderate-temperature water ( 107 ºC-182 ºC) from the geothermal
reservoir. In binary systems, hot geothermal fluids are passed through one side of a heat
exchanger to heat a working fluid in a separate adjacent pipe. The working fluid with a low
boiling point like butane or Iso-pentane is vaporized and passed through a turbine to generate
electricity. Advantages of binary cycle system are that the working fluid boils at a lower
temperature as water does, so electricity can be generated from reservoirs with lower
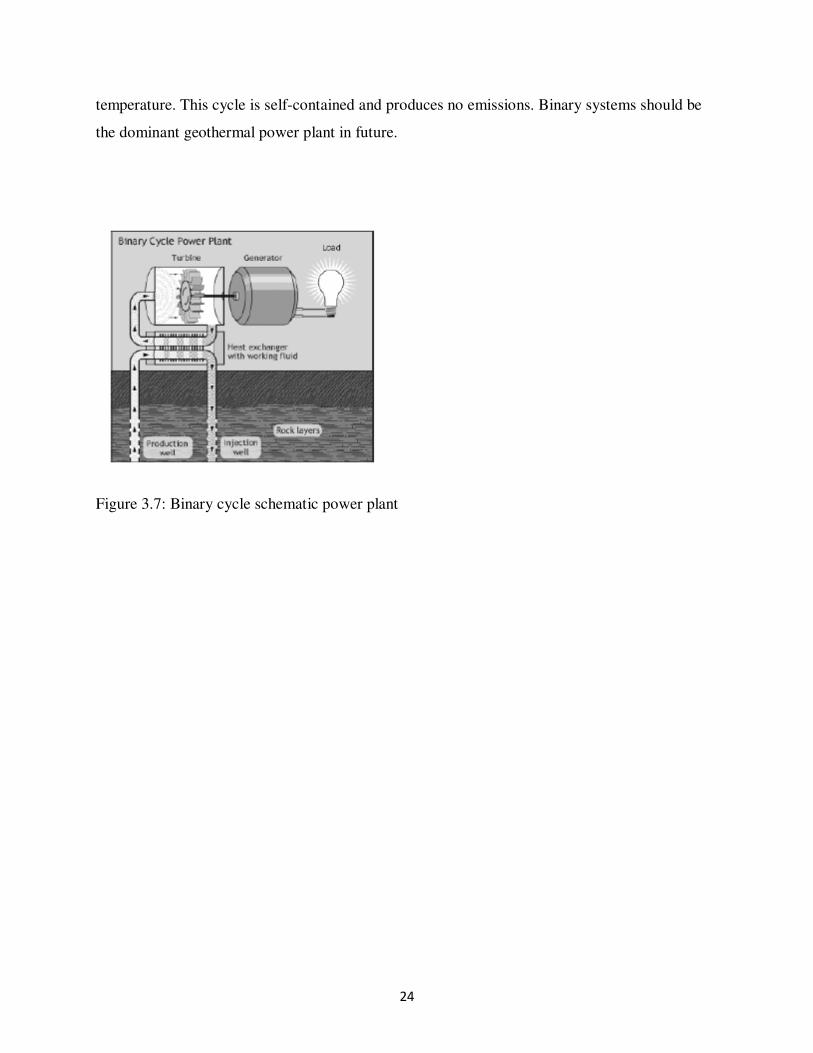
24
temperature. This cycle is self-contained and produces no emissions. Binary systems should be
the dominant geothermal power plant in future.
Figure 3.7: Binary cycle schematic power plant

25
CHAPTER FOUR: GENERATION COST AND THE CURRENT STATUS OF
GEOTHERMAL DEVELOPMENT;
Introduction
The cost benefit analysis of a particular source of energy determines its priority in providing
electrical energy to the consumers. In order to provide a frame of reference against which to
assess the value of the various generating costs, we examine the elements that make up the cost.
4.1 Components of annual costs.
The total annual cost may be broken down into the following components
Fixed costs
This forms the main component in the cost of the generating sources and comprise
(a) Interest on capital, taxes and insurance
(b) Capital cost of the plant
(c) Depreciation charges on the capital costs
(d) Salaries and management
The interest charges on the initial capital expenditure together with other fixed charges such as
insurance, rates, taxes usually form 60% to 70% of the total cost of power and are independent of
the output.
Running costs
These are variable costs and vary some which with output. Running costs include the following
components:
(a) Operation costs including salaries and wages

26
(b) Maintenance and repairs
(c) Capital
The capital expenditure include the following items
(a)Preliminary survey, investigation cost
(b) Cost of detailed survey and sub-surface exploration
(c) Purchase of land and compensation to property owners for disturbance or loss of amenity
(d) Cost of preparation of detailed design real construction and supervision
(e) Cost of testing material of construction and carrying out experimental works and model tests
on design
(f) Actual cost of construction and purchase and installation of equipment
Interest rates
Interest rates payable on capital depends on the following factors
(a) The credit or standing of the borrower, the nature of security offered and the degree of risks
involved
(b) The method of finance, whether the whole or part of the capital is borrowed on security or
whether it is raised as equity implying an element of specification
(c) The interest rates ruling at the time in the country in which the money has to be raised

27
Depreciation and obsolescence charges
From the moment a piece of machine is put into service, it begins to wear out. The depreciation
charges are meant to take care of repairs and maintenance or total replacement at the end of its
useful life.
Obsolescence is defined as the loss of usefulness or economic value which arises from changing
conditions or from scientific progress leading to the development of equipment or methods
which provide same services more efficiently and at lower cost.
Other factors affecting the cost of power
(a) Load factor
This is the ratio of the average load to the maximum load on the system during the period in
consideration. It’s the measure of the extend to which the necessary total investment is being
utilized. The lower the load factor means that the production is more expensive and the returns
are less hence the more the cost of electrical energy. High load factor means better utilization of
the installed capacity hence better use of the capital expenditure on plant thus the cost is low.
Load factor can be improved by additional of industrial load.
(b) Number of units installed
In deciding the number and size of units to be installed, reliability and economics of the plant
must be taken into account. It is necessary to have more than one unit installed, one being for
emergency cases. This increases the expenses since not all the installed capacities are put in use.
Also the capital cost of a large number of units is maintained and increases with increase in the
number of units.
(c) Base load and peak load.
Base plants operate practically all the year round and therefore have high load factor. Peak load
plants operate during the peak time to meet the short period peak demand experienced by the
supplying system.
28
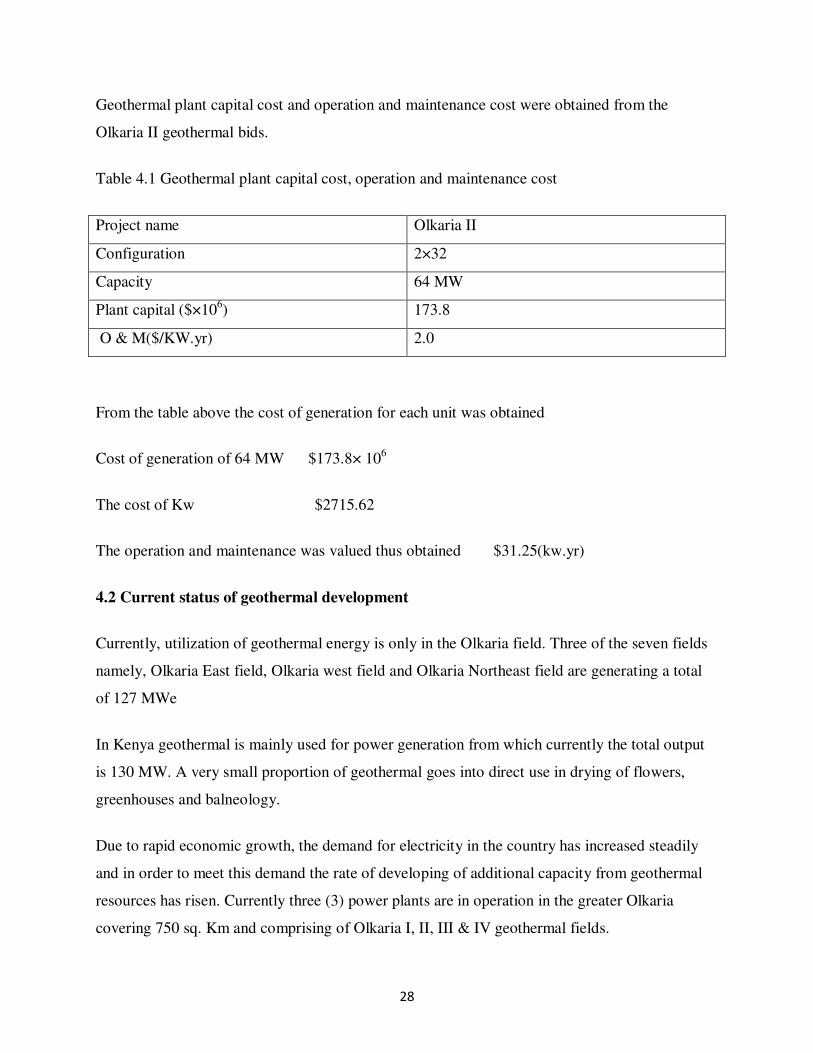
Geothermal plant capital cost and operation and maintenance cost were obtained from the
Olkaria II geothermal bids.
Table 4.1 Geothermal plant capital cost, operation and maintenance cost
Project name Olkaria II
Configuration 2×32
Capacity 64 MW
Plant capital ($×106) 173.8
O & M($/KW.yr) 2.0
From the table above the cost of generation for each unit was obtained
Cost of generation of 64 MW $173.8× 10⁶
The cost of Kw $2715.62
The operation and maintenance was valued thus obtained $31.25(kw.yr)
4.2 Current status of geothermal development
Currently, utilization of geothermal energy is only in the Olkaria field. Three of the seven fields
namely, Olkaria East field, Olkaria west field and Olkaria Northeast field are generating a total
of 127 MWe
In Kenya geothermal is mainly used for power generation from which currently the total output
is 130 MW. A very small proportion of geothermal goes into direct use in drying of flowers,
greenhouses and balneology.
Due to rapid economic growth, the demand for electricity in the country has increased steadily
and in order to meet this demand the rate of developing of additional capacity from geothermal
resources has risen. Currently three (3) power plants are in operation in the greater Olkaria
covering 750 sq. Km and comprising of Olkaria I, II, III & IV geothermal fields.
29
Development of geothermal resource is being carried out by the Government, through KenGen
(Kenya Electricity Generating Company), and Independent Power Producers (IPPs). Detailed
exploration is on-going in other prospects in the Rift Valley so as to rank them for future
development.
4.3 Olkaria I Geothermal Field
A total of thirty three (33) wells have been drilled in Olkaria I Geothermal Field which produces
45 MW. Twenty four (24) of the wells are currently connected to the power station while two (2)
have been retired. One (1) well is being used for re-injection. Currently the field has steam
capable of generating an additional 25 MW.
The plant has three (3) single flow 4-stage turbines, which operate at a steam inlet pressure of
five (5) bars absolute and a saturation temperature of 152oC. The turbines have a specific steam
consumption of 9.2 tones per hour for each megawatt produced. Since commissioning, the plant
has had an average availability and load factor of 98 percent.
The power generated is connected to the national grid via a 22 kilometer 132 kV transmission
line to the Naivasha sub-station on the Jinja-Nairobi transmission line.

30
Figure 4.1: View of Olkaria I Power Plant
4.4 Olkaria II Geothermal Field
The area of this field is about 8.8 Km.Sq, with a total of twenty two (22) wells supplying steam
to the power station. Olkaria II Power station, with a capacity of 70 MW, is currently Africa’s
largest geothermal power station. Wells supplying steam to the power station were drilled
between 1986 and 1993, but construction of the power plant was delayed until 2000 when funds
were available.
The power plant was commissioned in November 2003. The field has an excess steam capacity
capable of generating an additional 28MW. The project was co-financed by the World Bank, the
European Investment Bank, KfW of Germany and The Kenya Government.
31
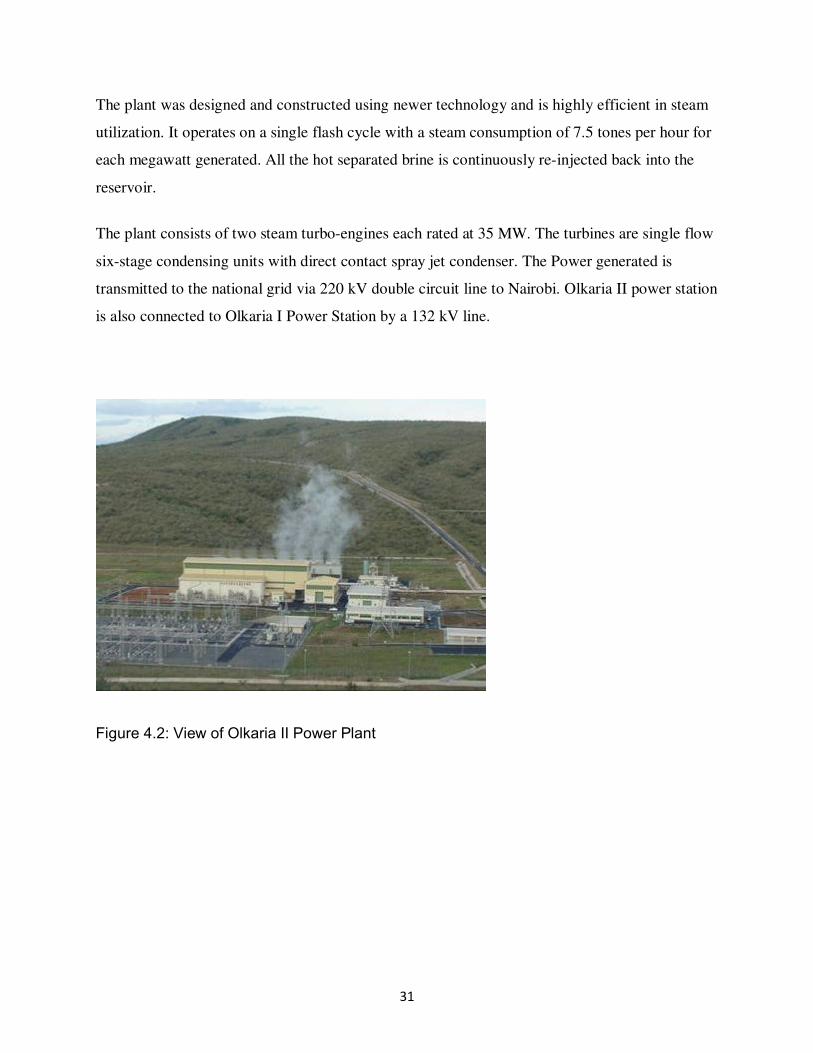
The plant was designed and constructed using newer technology and is highly efficient in steam
utilization. It operates on a single flash cycle with a steam consumption of 7.5 tones per hour for
each megawatt generated. All the hot separated brine is continuously re-injected back into the
reservoir.
The plant consists of two steam turbo-engines each rated at 35 MW. The turbines are single flow
six-stage condensing units with direct contact spray jet condenser. The Power generated is
transmitted to the national grid via 220 kV double circuit line to Nairobi. Olkaria II power station
is also connected to Olkaria I Power Station by a 132 kV line.
Figure 4.2: View of Olkaria II Power Plant

32
4.5 Olkaria III Geothermal Field
This is the first power plant in Kenya. It is also the first geothermal plant to use binary
technology in the country. Out of the seven wells drilled between 1983 and 1997, five wells were
able to discharge steam with an output capacity ranging from 1MW to 4MW.
In 1997, ORMAT International was licensed by the Kenya Government to generate 48 MW from
Olkaria III. In August 2000, the international company, through its local subsidiary OrPower 4,
commissioned 8MW that was later increased to 12MW from a combined binary cycle pilot plant.
As part of its first phase of development, OrPower 4 drilled nine directional wells to further
appraise the Olkaria III field.
Following the appraisal program, construction of an extra 35MW unit commenced and is now on
the completion stage and was lined up for commissioning during October 2008. As the tender for
Olkaria III Geothermal Field was floated for development of a power plant of between 64MW
to100 MW, OrPower 4 has been requested to do more geological work with a view to double the
existing capacity.
As part of the first phase, nine new wells have been drilled to further appraise the Olkaria III
field. Following this appraisal programme, ORMAT has projected that it will be capable of
producing 48 MWe over the next 20 years.
33
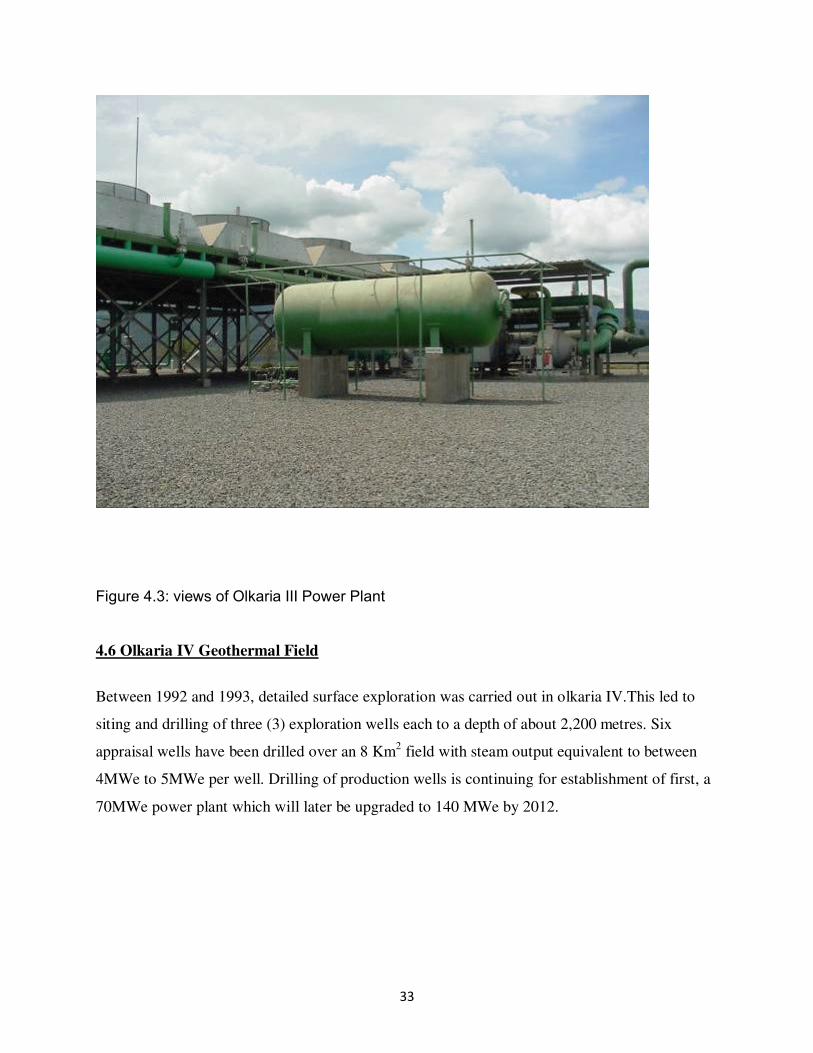
Figure 4.3: views of Olkaria III Power Plant
4.6 Olkaria IV Geothermal Field
Between 1992 and 1993, detailed surface exploration was carried out in olkaria IV.This led to
siting and drilling of three (3) exploration wells each to a depth of about 2,200 metres. Six
appraisal wells have been drilled over an 8 Km2 field with steam output equivalent to between
4MWe to 5MWe per well. Drilling of production wells is continuing for establishment of first, a
70MWe power plant which will later be upgraded to 140 MWe by 2012.
34
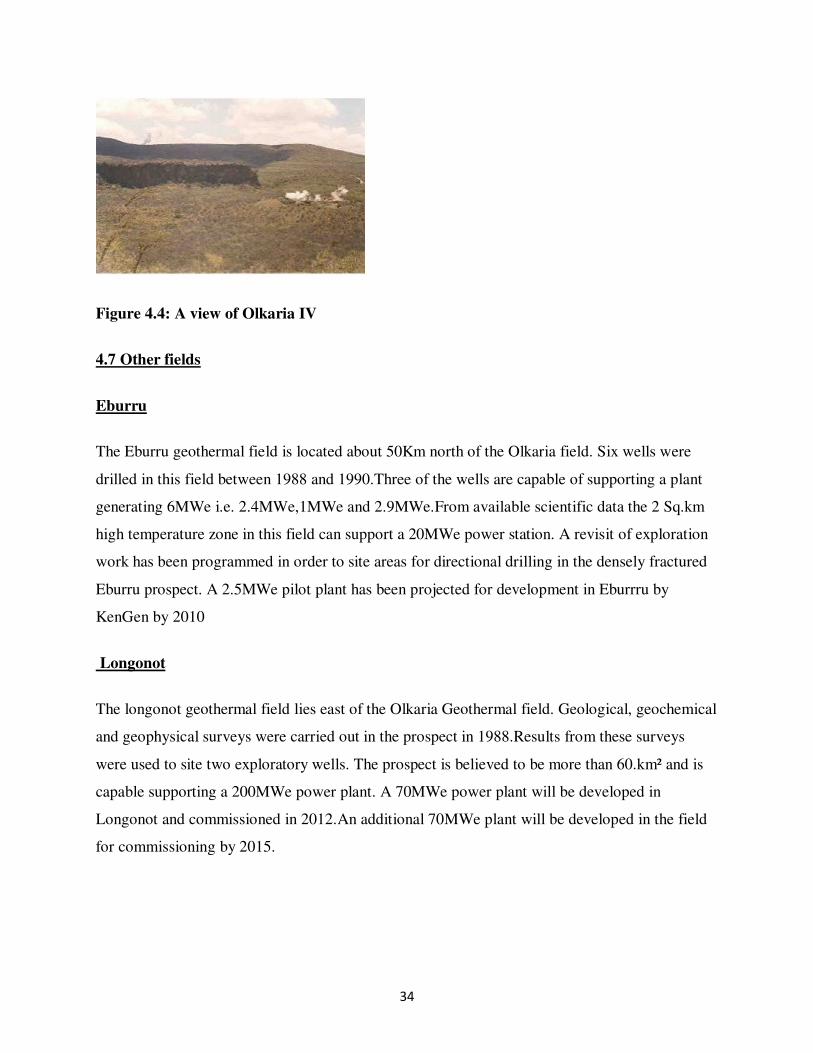
Figure 4.4: A view of Olkaria IV
4.7 Other fields
Eburru
The Eburru geothermal field is located about 50Km north of the Olkaria field. Six wells were
drilled in this field between 1988 and 1990.Three of the wells are capable of supporting a plant
generating 6MWe i.e. 2.4MWe,1MWe and 2.9MWe.From available scientific data the 2 Sq.km
high temperature zone in this field can support a 20MWe power station. A revisit of exploration
work has been programmed in order to site areas for directional drilling in the densely fractured
Eburru prospect. A 2.5MWe pilot plant has been projected for development in Eburrru by
KenGen by 2010
Longonot
The longonot geothermal field lies east of the Olkaria Geothermal field. Geological, geochemical
and geophysical surveys were carried out in the prospect in 1988.Results from these surveys
were used to site two exploratory wells. The prospect is believed to be more than 60.km² and is
capable supporting a 200MWe power plant. A 70MWe power plant will be developed in
Longonot and commissioned in 2012.An additional 70MWe plant will be developed in the field
for commissioning by 2015.
35
Suswa
The Suswa geothermal prospect is located South East of the Olkaria geothermal field. Detailed
geoscientific studies carried out between 1992 and 1993 rated the field as having a good
potential for geothermal development. There is a shallow heat source under the caldera at a depth
of about 10 Km. Three wells have been sited on the main caldera floor. It is estimated that more
than 200 MWe can be generated from this prospect. A 70MWe power plant is programmed for
development and commissioning in 2016.Aprivate investor has been licensed to carry out further
survey and subsequent development, subject to a specific time bound programme.
Menengai
Menengai Geothermal prospect lies to the north of Nakuru town and extends to the south of
Kisanana. Studies carried in 2003 and 2004 indicate the existence of a geothermal system under
the Menengai caldera. It is estimated that the high temperature part of the resource covers 48 Sq.
km and has an estimated potential for generating 720MWe.Three deep exploratory wells were
sited within the caldera floor. It is lined up for development of a 140MWe power plant by the
year 2014.
Oserian power plant
This is a binary power plant owned by Oserian flower farm. It was commissioned in July 2004
where its steam well was leased from Kengen. It generates 2 MW
36
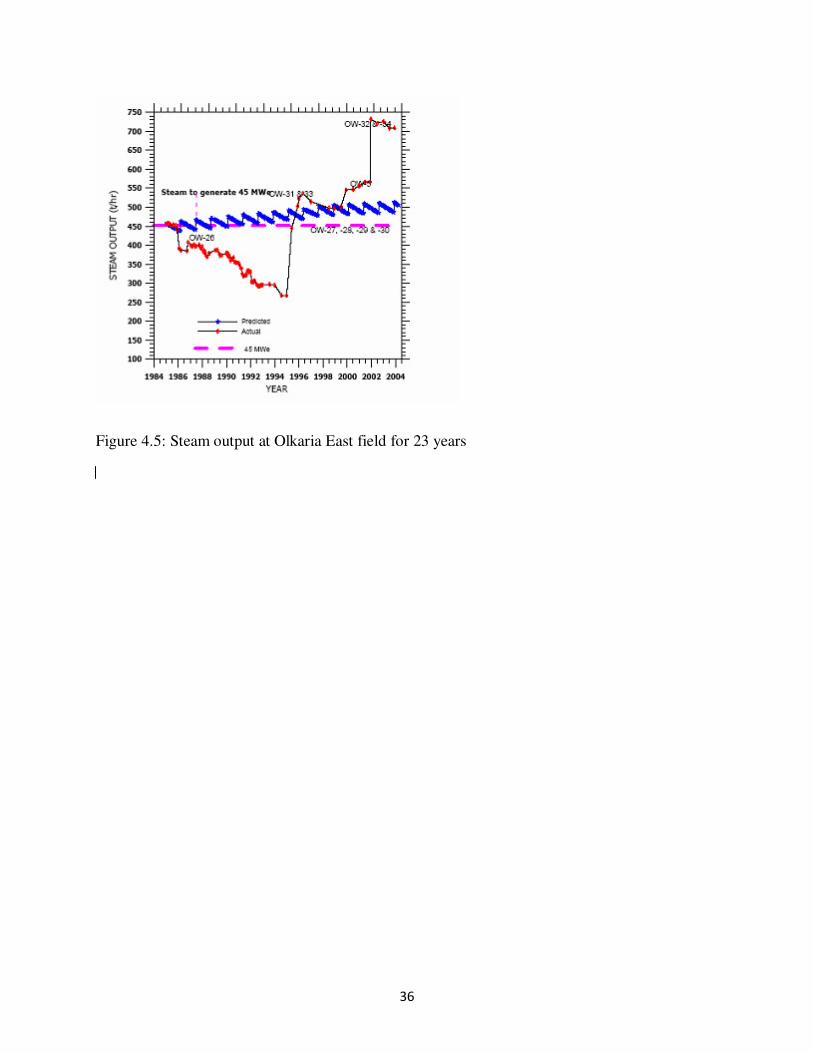
Figure 4.5: Steam output at Olkaria East field for 23 years

37
CHAPTER FIVE: FUTURE DEVELOPMENTS
5.1 Future investment opportunities
Due to rapid economic growth, the demand of electricity has steadily continued to rise. In order
to meet this demand the rate of developing additional electricity from geothermal resources
should continue to increase. This will therefore provide opportunity for investment in
development of geothermal resources by interested parties. The likely order of development of
the geothermal resources is as shown in table below.
Table 5.1: Proposed sequence for geothermal development in the short to medium term
Project Planned generation ( MWe) Year to be commissioned
Olkaria III 35 2008 (Oct.)
Olkaria II 35 2010
Eburru 2.5 2010
Olkaria IV 140 2012
Longonot I 70 2012
Menengai I 70 2013
Menengai II 70 2014
Longonot II 70 2015
Suswa I 70 2016
North Rift I 70 2017
North Rift II 70 2018

38
Figure 5.1 A graph of the projected future demands and power sources.
Renewable energy technology is continuously evolving with the goal of reducing risk and
lowering cost. The goal of geothermal industry is to achieve a geothermal energy life-cycle. To
achieve this goal, other types of nontraditional resources and experimental systems are being
explored like hot dry rock resources, improved heat exchangers, and improved condenser
efficiency.

39
Table 5.2 Projected future power demands and sources
5.2 Future geothermal development activities
5.2.1 Hot dry rock
Hot dry rock geothermal technology offers enormous potential for electricity production. These
resources are much deeper than hydrothermal resources and come from relatively water free hot
rock found at a depth of 4000 meters or more beneath the Earth’s surface. Energy is extracted by
circulating water through man-made fractures in the hot rock. Heat is then extracted from the
water at the surface for power generation, and the cooled water is then recycled through fractures
to pick up more heat, creating a closed-loop system. Hot Dry Rocks resources are much deeper
than hydrothermal resources hence much more expensive to develop.
5.2.2 Heat exchanger liners
The highly corrosive nature of geothermal plants poses a challenge to heat exchangers by
reducing their thermal conductivity. Research is currently being conducted to replace the use of
expensive heat exchanger materials such as stainless steel and titanium, with new, less expensive
40
polymer –base coated carbon steel. The polymer-base-coated carbon steel is proving to be as
resistive to corrosion as the conventional, expensive materials.
5.2.3 Air-cooled condensers
Currently, the National Renewable Energy Laboratory (NREL) is investigating ways to improve
the efficiency of air cooled condensers that are commonly used in binary cycle geothermal
plants. Air-cooled condensers use large airflow rates to lower the temperature of the gas once it
has passed through the system to produce condensation. The fluid is then collected and returned
to the cycle to be vaporized. This cycle is important in binary cycle geothermal plants because of
the lack of make-up water. To increase the heat exchange efficiency, NREL is currently testing
the use of perforated fins in the condensers, with all the air flowing through perforations, to
increase heat exchange and therefore, condensation. As technological improvements continue to
be discovered and more geothermal plants are brought online, geothermal generating capacity
will continue to increase.
5.3 Future plans
(a)Construction of a 2.5 MW Plant and its expansion in future.
(b)Extensive surface exploration
(c)Prioritization of fields as they are explored.
(d)Critical is exploration drilling funding.
(e)Pilot plant if exploration strikes steam.
(f)Carbon credits funding under Kyoto protocol.
(g)Carry prioritization of Menengai, Suswa and Longonot with BGR.
(h)Targeting ARGeo funding

41
CHAPTER SIX: OTHER USES AND IMPACTS OF GEOTHERMAL ENERGY
6.1 Direct uses of geothermal energy.
(a) Green house heating
Oserian Flower Company utilizes both the geothermal hot water and the carbon dioxide from
the steam in growing the flowers as shown in the figure below. The company has currently
expanded from 3 to 30 hectares of land and it is planning to lease more wells from KENGEN
for this purpose
Figure 6.1; Greenhouse heating

42
.(b) Hot springs are used to heat spas in tourist hotels for e.g. in L.Bogoria hotel
Figure 6.2; Recreation applications for Geothermal energy

43
(C) At Eburru, geothermally heated flowers are used to dry pyrethrum flowers.
Figure 6.3: Pyrethrum drier at Eburru
44
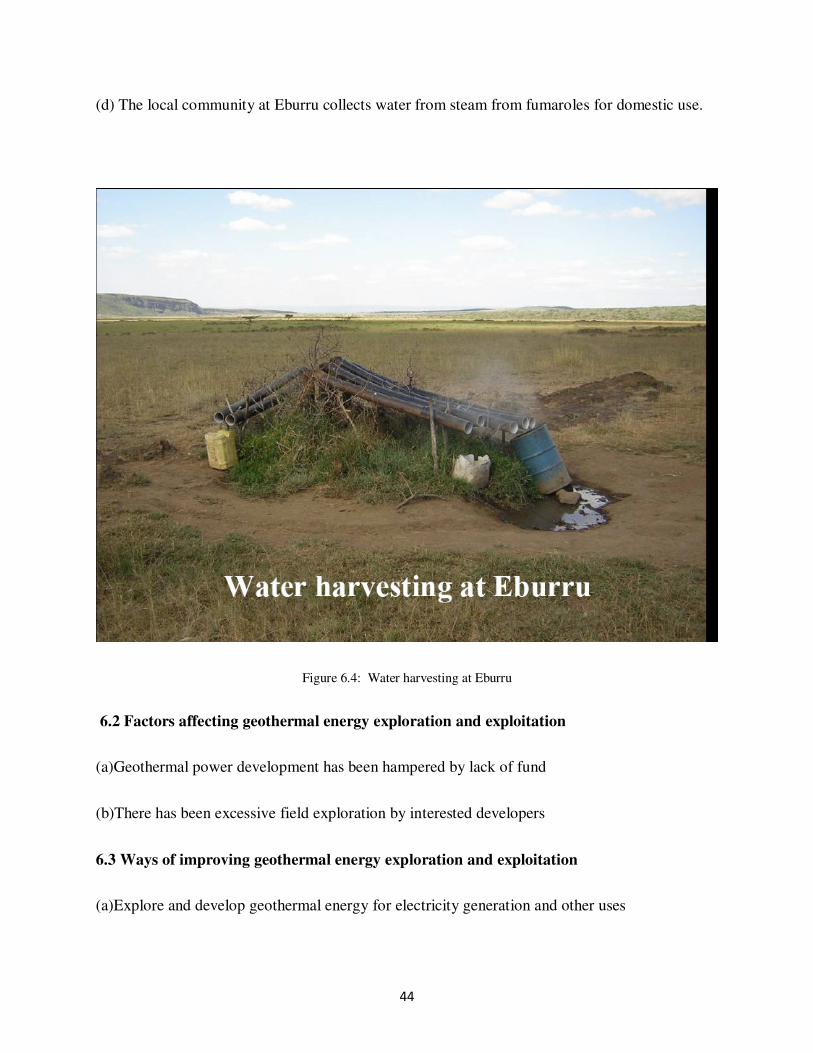
(d) The local community at Eburru collects water from steam from fumaroles for domestic use.
Figure 6.4: Water harvesting at Eburru
6.2 Factors affecting geothermal energy exploration and exploitation
(a)Geothermal power development has been hampered by lack of fund
(b)There has been excessive field exploration by interested developers
6.3 Ways of improving geothermal energy exploration and exploitation
(a)Explore and develop geothermal energy for electricity generation and other uses
45
(b)Remove risk of field of exploration from interested developers
(c)Strengthening of the Geothermal Development Company (GDC)
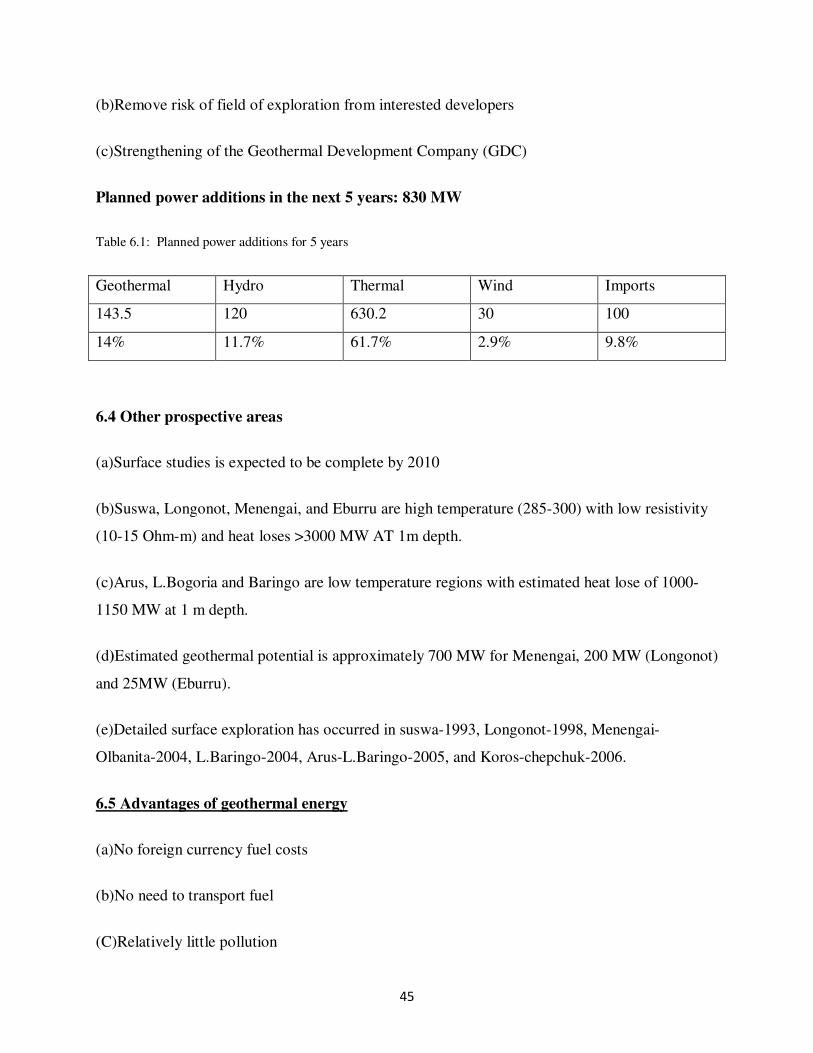
Planned power additions in the next 5 years: 830 MW
Table 6.1: Planned power additions for 5 years
Geothermal Hydro Thermal Wind Imports
143.5 120 630.2 30 100
14% 11.7% 61.7% 2.9% 9.8%
6.4 Other prospective areas
(a)Surface studies is expected to be complete by 2010
(b)Suswa, Longonot, Menengai, and Eburru are high temperature (285-300) with low resistivity
(10-15 Ohm-m) and heat loses >3000 MW AT 1m depth.
(c)Arus, L.Bogoria and Baringo are low temperature regions with estimated heat lose of 1000-
1150 MW at 1 m depth.
(d)Estimated geothermal potential is approximately 700 MW for Menengai, 200 MW (Longonot)
and 25MW (Eburru).
(e)Detailed surface exploration has occurred in suswa-1993, Longonot-1998, Menengai-
Olbanita-2004, L.Baringo-2004, Arus-L.Baringo-2005, and Koros-chepchuk-2006.
6.5 Advantages of geothermal energy
(a)No foreign currency fuel costs
(b)No need to transport fuel
(C)Relatively little pollution

46
(d)No mines, oil ports, etc
(e)Waste product disposal is easy and economical
(f)Uses free fuel i.e. steam
(g)No interference with river flows.
(h)No loss of generating capacity during drought years
(i)Geothermal power plants require relatively little land. An entire geothermal field uses only 1-8
acres per MW versus 5-10 acres per MW for nuclear plants and 19 acres per MW for coal plants.
Geothermal power plants are clean because they neither burn fossil fuels nor produce nuclear
waste. They can be sited in farmland and forests and can share land with cattle and local wildlife
,the Hell’s Gate National park in Kenya is established around Olkaria I. Land uses in the park
include livestock grazing, growing foodstuffs and flowers, wildlife conservation and birds
6.6 Disadvantages of geothermal energy
(a) High tariffs
The main problem hindering Geothermal Power development is one of high tariffs.
The Government needs to raise funds both internally and through donor support in order to
undertake geothermal resource assessment. For tariffs to be low the government needs to
undertake exploration, including steam field development. This would leave the IPP’ s to
undertake plant construction for generating electricity.
(b) Environmental impacts
Geothermal power plants have environmental impacts. These should be balanced against
geothermal energy’s advantages. The primary impacts of geothermal plant construction and
energy production are gaseous emissions, land use, noise, and potential ground subsidence

47
(i)Gaseous Emissions
Geothermal fluids contain dissolved gases mainly carbon dioxide (CO2) and hydrogen
sulfide(H2S),small amounts of ammonia, hydrogen, nitrogen, methane and randon .and minor
quantities of volatile species of boron, arsenic, and mercury.
Table 6.2: Comparison of CO2 Emissions by Power Source
Power source CO2 Emissions (lb/kwh)
Geothermal 0.20
Natural gas 1.321
Petroleum 1.969
Coal 2.095
Hydrogen sulfide emissions create a sulfur smell.
(ii)Noise
Noise occurs during exploration, drilling and construction phases. Noise levels from these
operations range from 45 to 120 decibels (dB)..
(iii) Ground subsidence
In early stages of Geothermal development, fluids are withdrawn from a reservoir at a rate
greater than the natural flow into the reservoir. This net outflow causes rock formations at the
site to compact, particularly in the case of clays and sediments, leading to ground subsidence at
the surface. Key factors causing subsidence include:
(a) A pressure drop in the reservoir as a result of fluid withdrawal
(b) The presence of a highly compressible geological rock formation above or in the upper
part of a shallow reservoir
(c) The presence of high-permeability paths between the reservoir and the formation, and
between the reservoir and the ground surface.

48
Subsidence is greater in liquid dominated fields because of the geological characteristics
associated with the type of field. This subsidence affects the stability of pipelines, drains and
well casings. It also causes formation of ponds, cracks in the ground and instability of buildings.
The greatest recorded subsidence occurred in Wairakei in New Zealand where the ground
subsided by 13 meters which led to creation of 1 Km pond, cracking of a nearby highway,
compressive buckling and tensile fracturing of steam pipelines and fissures occurred in the
surrounding fields.
6.7 Ways of reducing geothermal effects
(a) Mitigate subsidence effects can be prevented by maintaining pressure in the reservoir. Fluid
re-injection help to reduce pressure drop but its effectiveness depends on where the fluid is re-
injected and the permeability conditions in the field. It should be done at some distance from the
production well to avoid the cooler rejected waste fluid from lowering the temperature of the
production fluid and may not help in preventing subsidence
(b) Site workers can be protected from excessive noise by wearing ear mufflers. Noise levels
should be kept below 65 Db.
. (c) According to Geothermal Energy Association, improved and increased injection to sustain
geothermal reservoirs has helped reduce carbon dioxide emissions from geothermal power
plants.
(d)Hydrogen sulphide emissions are removed through a process called stretford, which produces
pure sulphur thus reducing H2S emissions by more than 90%.The hydrogen sulphide can also be
burned to produce sulphur dioxide, which can be dissolved, converted to sulphuric acid and sold
to provide income.
49
CHAPTER SEVEN: CONCLUSIONS AND RECOMMENDATIONS
7.1 CONCLUSIONS
(a) Kenya relies on biomas as the primary source of energy where Electricity accounts to 15%,
Hydropower dominates electricity sector (62%) followed by fossil fuels.
(b) Geothermal exploration has been hampered by lack of funds.
(c) Initiatives like ARGeo and other donor funding agencies augmented with local funding can
accelerate geothermal exploitation.
(d) In Kenya, creation of GDC will accelerate geothermal development.
(e) Due to changing weather patterns, geothermal power is the best way to go for countries with
the potential.
(f) Kenya plans to generate additional 576 MW from geothermal sources by the year 2026.
(g)Geothermal energy exploitation has increased by 280% from 45MW in 1999 to 127 MW in
2004.
(h) In the power development plans of year 2003-2004 geothermal energy has been considered as
the least cost source of electrical power.
(i) Oserian development company, which is a flower developing company has started utilizing
geothermal steam for geothermal heating. Oserian has also constructed 1.8 MW binary plant
Ormat OEC for use in the farm activities.
(j) There is an enormous amount of geothermal energy in the Kenyan rift valley which should be
exploited to replace the fossil fuel plants
(k) Geothermal energy is indigenous, low cost and environmentally benign source of energy and
should be given the first priority whenever it occurs.

50
(l) Creation of a special purpose geothermal development company by the government will be a
useful milestone in Geothermal energy exploitation and is expected to accelerate geothermal
development in Kenya to achieve the least cost development plan.
(m) Since 2000, OrPower inc. have been generating 12 MW from an early generation Ormat
plant in Olkaria west field. They have drilled more wells and obtained enough steam to generate
36 MW over the next 25 years. Plans are underway to construct the additional power plant.
7.2 RECOMMENDATIONS
My intention has been to provide Kenyans with a balanced overview of the utility scale
geothermal power believe that clean reliable power can be developed from renewable sources,
with geothermal power making an important contribution. I would advise Kenyans to gain a
deeper understanding of the potential of geothermal power and the issues surrounding its
development. I urge the government to seek further understanding of these issues through
research and the means to their resolution, in order to support the progress of geothermal energy
in providing clean, reliable, and economic power.
51
REFERENCES
1. Ministry Of Energy
Department of Geology and Geothermal energy.
2. U.S Department of energy
3. National Renewal Energy Laboratory: Geothermal Technologies program
http://www.nrel.gov/geothermal/geoelectricity.html
4. Philippines Department of Energy
http://www.doe.gov.ph
5. The world Bank Group
http://www.worldbank.org/html/fpd/energy/geothermal/
6. Geothermal Energy Association
http://www.geo-energy.org
7. Geothermal Resources Council
http://www.geothermal.org
8. International Geothermal Association
http://iga.igg.cnr.it