university of nairobieie.uonbi.ac.ke/sites/default/files/cae/engineering/eie/stability... · with...
TRANSCRIPT

1
UNIVERSITY OF NAIROBI
SCHOOL OF ENGINEERING
DEPARTMENT OF ELECTRICAL AND INFORMATION ENGINEERING
STABILITY ANALYSIS OF A POWER SYSTEM WITH INCREASING WIND POWER PENETRATION
PROJECT INDEX: 105
SUBMITTED BY:
KOECH BENARD KIPNG’ENO
F17/23432/2008
SUPERVISOR: DR CYRUS WEKESA
EXAMINER: MR. AHMED SAYYID
PROJECT REPORT SUBMITTED IN PARTIAL FULFILLMENT OF THE
REQUIREMENT FOR THE AWARD OF THE DEGREE
OF
BACHELOR OF SCIENCE IN ELECTRICAL AND ELECTRONIC ENGINEERING OF THEUNIVERSITY OF NAIROBI 2015
DATE SUBMITTED: 24th April 2015

2
DECLARATION OF ORIGINALITY
NAME OF STUDENT: KOECH BENARD KIPNG’ENO
REGISTRATION NUMBER: F17/23432/2008
COLLEGE: Architecture and Engineering
FACULTY/SCHOOL/INSTITUTE: Engineering
DEPARTMENT: Electrical and Information Engineering
COURSE NAME: Bachelor of Science in Electrical and Electronic Engineering
TITLE OF WORK: STABILITY ANALYSIS OF A POWER SYSTEM WITH INCREASING WIND POWER PENETRATION
1) I understand what plagiarism is and I am aware of the university policy in this regard.
2) I declare that this final year project report is my original work and has not been submitted elsewhere for examination, award of a degree or publication. Where other people’s work or my own work has been used, this has properly been acknowledged and referenced in accordance with the University of Nairobi’s requirements.
3) I have not sought or used the services of any professional agencies to produce this work.
4) I have not allowed, and shall not allow anyone to copy my work with the intention of passing it off as his/her own work.
5) I understand that any false claim in respect of this work shall result in disciplinary action, in accordance with University anti-plagiarism policy.
Signature…………………………………………………………………..
Date………………………………………………………………………..

3
CERTIFICATION
The report has been submitted to the Department of Electrical and Information Engineering, University of Nairobi with my approval as supervisor:
Dr.CYRUS WEKESA.
Date:……………………………..

4
DEDICATION
This project is dedicated to myfamily for the moral and financial support and also to those who have shown great faith in me throughout my pursuit for higher learning.

5
ACKNOWLEDGEMENT
I acknowledge the great input by my supervisor, Dr.Wekesa, for the guidance and moral support he gave me through the development of the project. The useful comments and suggestions which have led to the to the improvement of the project.

6
ABSTRACT
The use of energy in the world today is increasing with increase in population. The cost and availability of energy significantly impacts our quality of life,the health of national economies and the stability of our environment. The rapid depletion of fossil fuel resources on a worldwide basis has necessitated an urgent search for alternative energy sources to cater to the present day demands. In recent years there has been a significant global commitment to develop clean and alternative sources of energy such as solar and wind. Wind energy technology has been the fastest growing energy source because it is fairly distributed around the world and readily available for use. However, more penetration of wind energy into existing power networks has some impacts on the stability of the power system. Therefore, there is need to study and do analysis on the stability of a power system with increasing wind power penetration so as to try and improve the power system stability.

7
Contents Acknowledgement …………………………………………………………...5
Abstract ………………………………………………………………..6
List of Figures ……………………………………………………......8
List of Tables ……………………………………………………………......9
Abbreviations ……………………………………………………………....10
Nomenclature ………………………………………………………………12
1 Introduction
1.1 Background ……………………………………………………….14
1.2 Problem statement ……………………………………………….15
1.3 Objectives ……………………………………………………….16
1.4 Project scope ……………………………………………………….16
2 Literature Review
2.1 Definitions and classification of power system stability…………….17
2.1.1 Rotor angle stability ……………………………………………….18
2.1.2Voltage stability ……………………………………………….19
2.1.3 Frequency Stability ……………………………………………….19
2.1.4 Transient Stability Indices ……………………………………….19
2.2 Wind Energy Generating Systems …………………………….....19
2.2.1Wind Turbine Generator Technologies ……………………….22
2.3 Power System Excitation Control. ……………………………….27
2.3.1 Automatic Voltage Regulator (AVR) ……………………….27

8
2.3.2Power System Stabilizer (PSS) ………………………………28
3 Methodology
3.1 Power System Modeling using matlab/Simulink……………………..30
3.2 Excitation control system ……………………………………....31
3.3 Simulation block diagrams…………………………………………...32
4 Results and Discussions
4.1 Stability Analysis With and Without the Wind Farm…………………35
5 Conclusions and Recommendations
5.1 Conclusion........……………………………………………………….39
5.2 Recommendations ………………………………………………40
References
Vestas V52-850 kW Wind Turbine Rated Electrical Data
D Author's Publications
Appendix
List of Figures
2.1 Classification of power system stability…………………………………..16
2.2 Conversion of wind power to electrical power ……………………………18
2.3 Power curve for a typical wind turbine. ……………………………19

9
2.4 Grid Connected Squirrel cage induction generator ……………………21
2.5 Equivalent circuit ofa squirrel cage induction generator………………….21
2.6 Schematic diagram of a DFIG …………………………………………....23
2.7 Power converter in DFIG wind turbine……………………………………24
2.8 Model of AVR in excitation system…………………………………….....26
2.9 Model of PSS in excitation system………………………………………...27
3.1 Micro-grid system ……………………………………………………29
3.31 Load Frequency Control Model ……………………………………30
3.32 Generator block diagram with AVR and Rate feedback stabilizer………...30
List of Tables
A. AVR Data
B.I Generator Data
B.2 Load Data
B.3 Line Data in p.u
B.4 Operating Conditions

10
Abbreviations
AC Alternating Current
AVR Automatic Voltage Regulator
CCT Critical Clearing Time
DC Direct Current
DFIG Doubly Fed Induction Generator
GSC Grid Side Converter
GWEC Global Wind Energy Council
IEEE Institution of Electrical and Electronics Engineers
MW Mega Watt
PF Power Factor
PSS Power System Stabilizer
SCIG Squirrel Cage Induction Generator
11
Nomenclature
Pwind Instantaneous power from wind
ρair Mass density of air
vw Velocity of the wind
CP Power performance coefficient
PBetz Betz limit
u Space vector for voltage
i Space vector for current
ψ Space vector for flux
ωsyn Synchronous speed
ωrAngular speed of the rotor
Lm Magnetizing reactance
Ls Stator inductance
Lr Rotor inductance
J Generator inertia
Te Electrical torque
Tm Mechanical torque
Xi Leakage reactance

12
CHAPTER1
INTRODUCTION
1.1 Background
Wind energy is one of the major sources of renewable energy with a remarkable contribution to the installed capacity of electrical power systems. Wind power has been used in ancient times for applications such as: pumping water, grinding mills and in propelling boats.Its contribution in the electricity supply began in the mid 1980‘s and is now firmly established as one of the major technologies of electricity generation in the world. It is one of the fastest growing electricity generating technologies in the world and features in both developed and developing countries.
Wind power’s rapid expansion has been driven by a combination of its environmental benefits, various state and federal policies and incentives, and improving cost-competitiveness with other generating technologies.

13
Several countries are taking steps to develop large-scale wind markets. According to news released by the Global Wind Energy Council (GWEC), the sum of the world’s total wind installations increased to reach over 157-9 GW by the end of 2009. The increase in capacity of over 100% from 12-1 GW in 2008 to 25.1GW (with new capacity additions of 13 GW) by the end of 2009 made China the number one market in terms of new wind power installations. The United States installed nearly 10 GW of wind power in 2009 increasing the nation’s installed capacity by 39% and bringing the total capacity to 35 GW. Maintaining the record of the year 2008, United States remains the leading nation in wind power in the year 2009 with 22.3% of the world total installed wind capacity Following China, Germany and Spain with installed capacities of 25.80GW, 25.77GW and 19.14GW respectively.
The wind turbine generators in a wind farm are distributed within the farm, but the total output of the farm normally connects to the bulk power system at a single substation, in a fashion similar to conventional central-station generation. Integration of large quantities of wind power has however presented some challenges such as absorption of reactive power from the grid during faults which affects on system stability in weak power grids.
1.2 Problem Statement
Power generation using wind, differs in several respects from conventional sources of energy such hydro and thermal , the major difference being that wind generators are usually based on induction generator technologies instead of the conventional synchronous generators. The induction generators are known to consume reactive power (like in induction motors) during system contingency, which in turn affect the stability of a power system.
The problem of the study based on the stability in a power system is during and after a fault is introduced to a system.Furthermore, if and only if the fault does not bring about any sustainable change in power the machine must go back to its original state. If imbalanced demand creates change in load or network/generation condition, new operating state will be required.Thus it can be said that in all cases inter connected synchronous machines must maintain synchronism i.ethey have to work at same speed in parallel. The system disturbance creates transients of

14
oscillatory nature, but if nature of system is stable these oscillations will be moisten to new stable condition.
1.3 Objectives
The main objective of the project was to study and analyze the stability of a power system with increasing wind penetration.The project will present some analyses of a power system and the dynamic behavior which identify the issues that limit the large -scale integration of wind generators in apower system.
1.4 Project Scope
The project entails the following:
i. Developing a power system model for stability analysis with an integrated wind farm.
ii.To analyze the stability of the system when the power system excitation control is included.

15
Chapter2
Literature Review
Here, the different aspects of power system stability are introduced and their causes. The two major technologies employed in wind power generation are also discussed here.
16
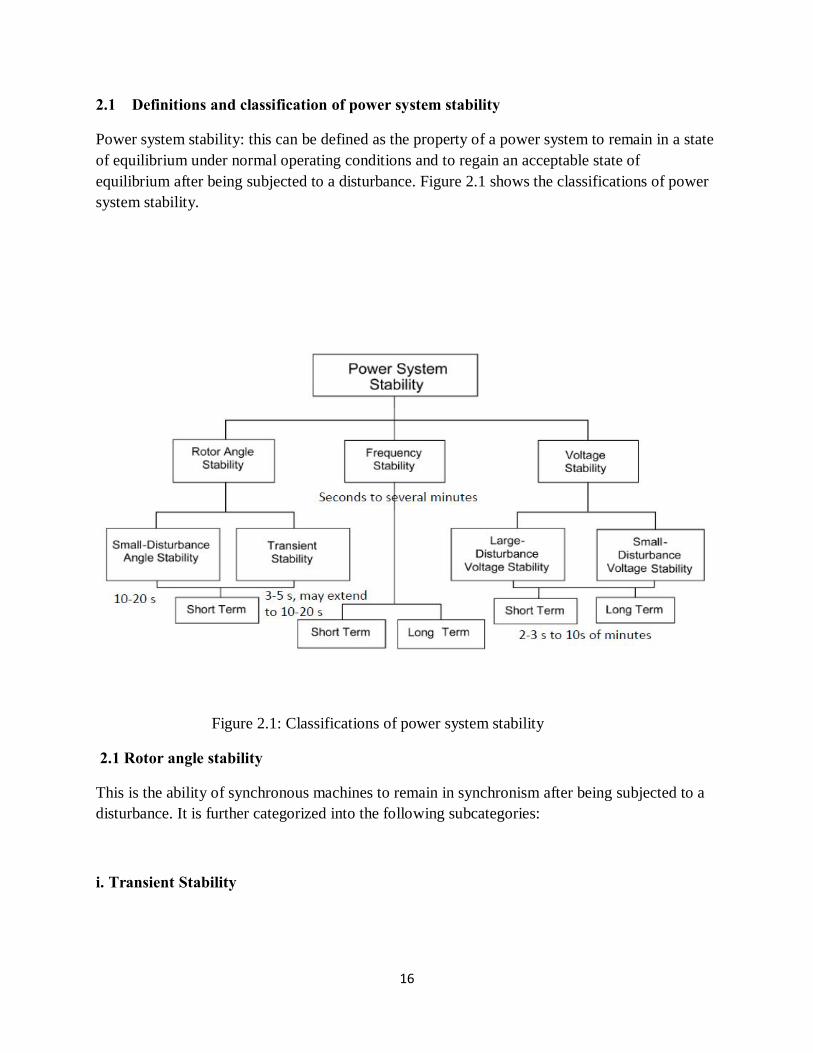
2.1 Definitions and classification of power system stability
Power system stability: this can be defined as the property of a power system to remain in a state of equilibrium under normal operating conditions and to regain an acceptable state of equilibrium after being subjected to a disturbance. Figure 2.1 shows the classifications of power system stability.
Figure 2.1: Classifications of power system stability
2.1 Rotor angle stability
This is the ability of synchronous machines to remain in synchronism after being subjected to a disturbance. It is further categorized into the following subcategories:
i. Transient Stability

17
This is the ability of the power system to remain in synchronism after a large disturbance such as loss of a generator or major load. The time frame of interest in transient stability is usually 3 to 5 seconds following the disturbance but may extend to 10 to 20 seconds for large systems.
ii. Steady State Stability
This refers to the ability of the power system to maintain synchronism when the system is subjected to slow gradual disturbances such as gradual power changes. It is basically concerned with the determination of the upper limit of the machine loading before losing synchronism provided the loading is increasing gradually.
iii.Dynamic stability
This is the ability of the power system to maintain synchronism following a small disturbance over a long period of time after the action of the voltage regulators and turbine governors.Dynamic stability analysis covers longer intervals of 5 to 10 seconds and may extend up to 30 seconds.
2.1.2 Voltage stability
This is the ability of a power system to maintain steady voltages at all buses in the system under normal operating conditions and after being subjected to a disturbance.Voltage instability is mainly caused by the inability of the power system to meet the reactive power demand.
2.1.3 Frequency Stability
This is the ability of a power system to maintain steady frequency after large disturbance resulting in a significant imbalance between generation and load. Frequency instability is mainly caused by the inability of the power system to meet the real power demanded by the load.
2.2 Wind Energy Generating Systems
Wind energy conversion is achieved by wind turbines which produce electricity using wind power to drive an electrical generator. Wind passes over the blades, exerting a turning force. The rotating blades turn a shaft inside the housing, which goes into a gearbox. The rotational speed is increased in the gear box to that which is appropriate for the generator. The mechanical power is converted into electrical power in the generator. Figure2.2 shows the conversion of wind power into electrical power.

18
Figure 2.2: Conversion of wind power to electrical power.
The instantaneous power Pwindavailable in the wind flowing through an area Av can be described as:
Pwind = ½ ρairΑvV3w (2.1)
Whereρair is the mass density of air and is the velocity of the wind, The fraction of the wind captured by a wind turbine is given by the power performance coefficient Cp. This coefficient is based on the theoretical maximum power that can be extracted from the wind, the so called Betz limit which is expressed as:
PBetz = ½ρairAvV3wCp (2.2)
Near the earth’s surface, wind speed is reduced by friction. This means that the higher the wind turbine tower, the greater the wind speed hence more wind power can be obtained if the turbines axe raised well enough above the ground level.
The power output of a wind turbine at various wind speeds is conventionally described by its power curve. The power curve gives the steady-state electrical power output as a function of the

19
wind speed at the hub height. Figure 2.3 shows an example of a power curve for atypical wind turbine.
Figure 2.3: Power curve for a typical wind turbine.
The power curve has three key points on the velocity scale:
i. Cut-in wind speed: The minimum wind speed at which the machine will deliver useful power.
ii. Rated wind speed: The wind speed at which rated power is obtained (rated power is generally the maximum power output of the electrical generator).
iii. Cut-out wind speed: The maximum wind speed at which the turbine is allowed to deliver power (usually limited by engineering loads and safety constraints).
Below the cut-in speed, the wind turbine remains shut down as the speed of the wind is too low for useful energy production. Then, once in operation, the power output increases following the relationship in Equation 2.1 until rated wind speed is reached. Wind turbine blades are designed

20
to generate the maximum power from the wind at the minimum cost. Primarily, the design is driven by the aerodynamic requirements, but economics mean that the blade shape is a compromise to keep the cost of construction reasonable. In particular, the blade tends to be thicker than the aerodynamic optimum close to the root, where the stresses due to bending are greatest.
Modern electricity-generating wind turbines use three-bladed upwind rotors. Reducing the number of blades means that the rotor has to operate at a higher rotational speed in order to extract the wind energy passing through the rotor disk. Although a high rotor speed is attractive in that it reduces the gearbox ratio required, a high blade tip speed leads to increased aerodynamic noise and increased blade drag losses. More than three blades increases the cost of the turbine with no significant gain in efficiency, therefore 3 blades is the optimum number.
2.2.1 Wind Turbine Generator Technologies
Conversion of mechanical energy into electrical energy is done by a generator. It uses magnetic fields to convert the rotational energy into electrical energy. The power output from a generator goes to a transformer, which steps up the power before entering the grid through high voltage transmission lines. Induction generators are mostly used in wind turbines as they can be operated at variable speed unlike synchronous generator.
Two types of induction generators are commonly used in wind turbines namely:
1. Squirrel cage induction generators (SCIGs)
2. Doubly-fed induction generator (DFIGs).
Squirrel Cage Induction Generators
In this technology, both single and double cage squirrel cage induction generators are commonly used. Figure 2.4 shows a diagram of a grid connected squirrel cage induction generator.

21
Figure 2.4: Grid connected Squirrel cage induction generator.
The SCIG is directly coupled to the grid as shown in figure 2.4. The slip hence the rotor speed of a squirrel cage induction generator varies with the amount of power generated. The rotor speed variations are, however, very small approximately 1 to 2 per cent. Because of the small variation in the rotor speed, the SCIG wind turbine is normally referred to as a constant speed or fixed speed turbine. A squirrel cage induction generator always consumes reactive power during a system fault. In most cases, this is undesirable, particularly in case of large turbines and weak grids. Absorption of reactive power from the system lowers the system voltage which can eventually lead to voltage collapse. The capacitor bank usually compensates for the reactive power consumption of the squirrel cage induction generator in order to archive a power factor close to one.
The equivalent circuit of SCIG model is shown in Figure 2.5
Figure 2.5: Equivalent circuit of a squirrel cage induction generator

22
Stator and rotor voltage equations can be written as follows
us=Rsis +jωkψs+dψs/dt (2.3)
ur= 0 = Rrir+j(ωκ −ωr)ψr +dψr/dt (2.4)
where u, i, and ψ are space vectors for the voltage, current and flux, respectively. ωk = ωsyn is the synchronous speed, and ωr is the angular speed of the rotor. The subscripts s and r refer to quantities of the stator and rotor, respectively.
The relation between flux and currents is given by
us = Lsis + Lmir(2.5)
ur = Lrir + Lmis(2.6)
where Lm is the magnetizing reactance, Ls and Lr stand for the stator and rotor inductances, respectively. The two parameters are given by
Ls = Lsl + Lm(2.7)
Lr = Lrl+ Lm(2.8)
WhereLsl and Lil are the stator and rotor leakage inductances, respectively.
The electromagnetic torque produced by the generator can be calculated as a cross product of flux and current vectors
Te = ψ∗×is(2.9)
The complex power of the stator is given by
S = us*is (2.10)
The dynamic model of the induction generator is completed by the mechanical equation:
Jωr= Te– Tm(2.11)
23
Where J is generator inertia, Te is the electrical torque, Tm is the mechanical torque.
Doubly-fed induction generator (DFIG)
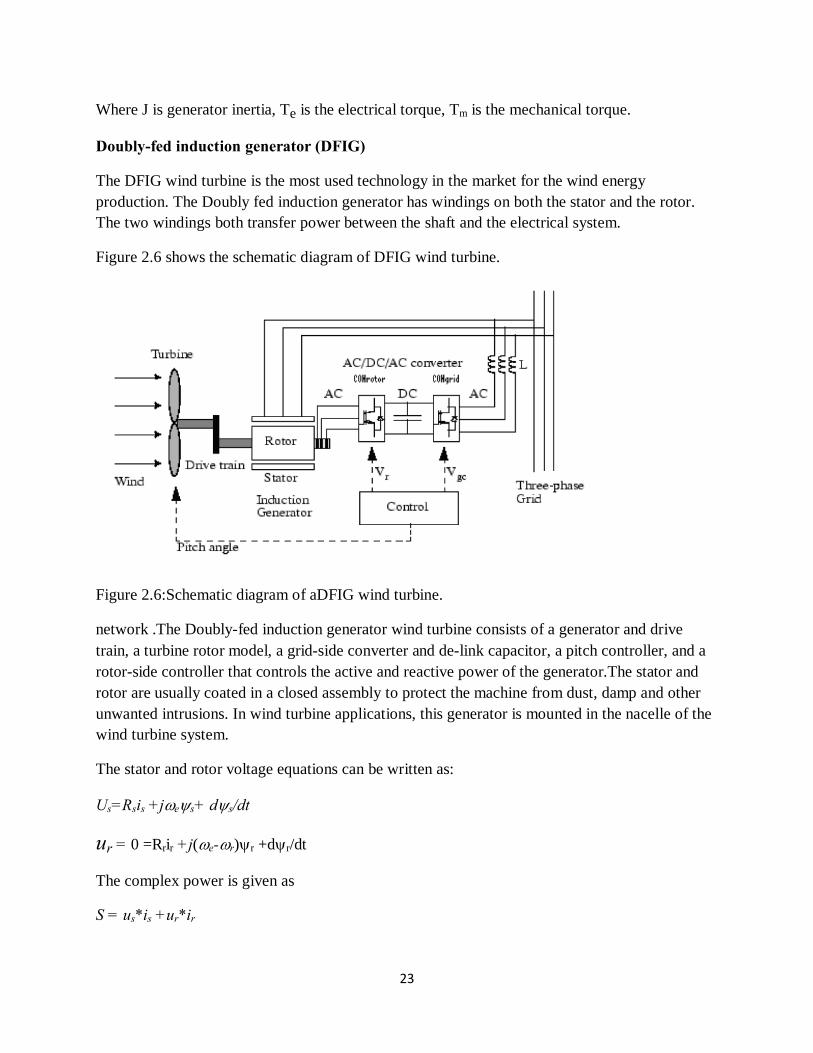
The DFIG wind turbine is the most used technology in the market for the wind energy production. The Doubly fed induction generator has windings on both the stator and the rotor. The two windings both transfer power between the shaft and the electrical system.
Figure 2.6 shows the schematic diagram of DFIG wind turbine.
Figure 2.6:Schematic diagram of aDFIG wind turbine.
network .The Doubly-fed induction generator wind turbine consists of a generator and drive train, a turbine rotor model, a grid-side converter and de-link capacitor, a pitch controller, and a rotor-side controller that controls the active and reactive power of the generator.The stator and rotor are usually coated in a closed assembly to protect the machine from dust, damp and other unwanted intrusions. In wind turbine applications, this generator is mounted in the nacelle of the wind turbine system.
The stator and rotor voltage equations can be written as:
Us=Rsis +jωeψs+ dψs/dt
ur = 0 =Rrir +j(ωe-ωr)ψr +dψr/dt
The complex power is given as
S = us*is +ur*ir
24
Drive-train
The generator in a DFIG wind turbine is driven by the wind turbine through a gearbox system. This enables the rotor to attain a suitable speed range for the rotor. By means of the gearbox, the low rotational speed of the wind turbine (9-21 rpm) is transformed into high rotational speed on the generator side (900-2000 rpm for 50 Hz system frequency). For 2- 3 MW wind turbines, a gearbox ratio of around 80-100 is common. The actual gearbox ratio is chosen considering the optimum operation speed of the generator. The optimum speed of the generator is selected based on two factors, namely the annual wind speed distribution and the size of the power convertor. Annual efficiency of the generator is somehow influenced by the operating speed of the generator, whether it operates at sub-synchronous or super-synchronous speed. Another aspect to be considered when selecting a gearbox ratio is the weight is also considered when selecting a gearbox.
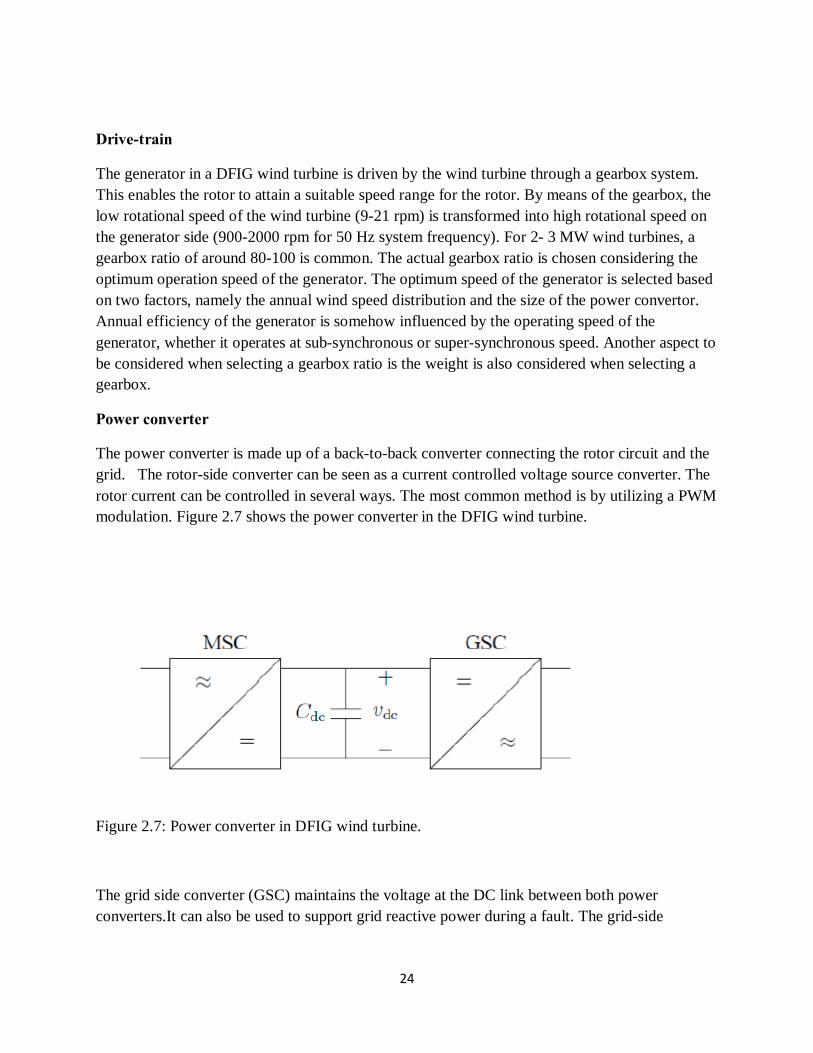
Power converter
The power converter is made up of a back-to-back converter connecting the rotor circuit and the grid. The rotor-side converter can be seen as a current controlled voltage source converter. The rotor current can be controlled in several ways. The most common method is by utilizing a PWM modulation. Figure 2.7 shows the power converter in the DFIG wind turbine.
Figure 2.7: Power converter in DFIG wind turbine.
The grid side converter (GSC) maintains the voltage at the DC link between both power converters.It can also be used to support grid reactive power during a fault. The grid-side

25
converter can also be used to enhance grid power quality. The losses in the converter can be considered small therefore neglected.
2.3 Power System Excitation Control
Generation is mainly dominated by synchronous generators in most power systems around the world. This is because of the fact that it has good controlling capabilities, high ratings and a low inrush current. All power systems rely mainly on control systems so as to ensure that their operation is secure. These controls include the speed governing and voltage regulation systems at all the major generating stations. The main purpose of these control systems is to act on dynamical changes in the system, such -as in load, in order to minimize voltage and frequency changes. Thus their operation is essential in ensuring quality of supply by the power system. An example is the governor which adjusts the flow of the prime mover to a turbine. This helps to keep rotor speed constant. The excitation control of a generator generally helps in improving the performance of a system. It does this by supporting the voltage, enhancing transient stability and damping oscillations.
2.3.1 Automatic Voltage Regulator (AVR)
The automatic voltage regulator (AVR) systems adjust the field current excitation in the generator, in order to keep terminal voltage constant. The main function of the AVR is to keep the generator voltage at fixed nominal value. An AVR model depends on the type of DC current injection source to the excitation system. The AVR consists of; amplifiers, exciter, excitation, excitation voltage limiters, generators and transducers.
The AVR transfer function is:
VR(s)/VC(s)= KA/1+STA
where VR(s), Vc(s), KA and TA are the output amplifier, control signal, amplifier gain and time constant interval, respectively. These parameters have values ranging between 10 - 400 p.u and
0.02 - 0.1se for the KA and TA, respectively. Excitation system voltage is limited by using a limiter to avoid over excitation or under excitation. Figure 2.10 shows a linear model of AVR in excitation system.

26
Figure 2.8: Model of AVR in excitation system
2.3.2 Power System Stabilizer (PSS)
The function of a PSS is to add damping to generator rotor oscillations by controlling its excitation using auxiliary stabilizing signal. To provide damping, the stabilizer must produce a component of electrical torque in phase with rotor speed deviation.However, for the practical implementation, other signals such as bus frequency, electrical power, accelerating power are also used. The latter signal is actually synthesized by a combination of electrical and mechanical power signals. The mechanical power signal can be obtained from the gate position in a

27
hydraulic turbine or steam pressers in steam turbine. The choice of control signal for PSS can be based on the following criteria;
1. The signal must be obtained from local measurements and easily synthesized.
2. The noise content of the signal must be minimal. Otherwise complicated filters are required which can introduce their own problems,
3. The PSS design based on a particular signal must be robust and reject noise.
All the control signals considered such as rotor speed, frequency, electrical power are locally available. The speed signal can be obtained from the angle of the internal voltage which can be synthesized. The bus frequency signal can be obtained by measuring the period using zero crossing detection. The power signal can be derived from a Hall Effect transducer. Figure 2.10 shows a PSS model
Figure 2.9: Model of PSS in excitation system.
The stabilizer gain KSdetermines the amount of damping introduced by the PSS. The signal washout block serves as a high pass filter with the time constant T5 high enough to allow signals associated with oscillation in ωr to pass unchanged. Without it, steady - changes in speed would modify the terminal voltage. The value of T5 is not critical can be in the range of 1 to 20 sec. The phase compensation blocks with time constants T1,T2,T3 and T4 provides the appropriate phase lead characteristics to compensate for the phase lag between the exciter input and the generator electrical torque.

28
CHAPTER 3
Methodology
In this chapter, the procedure of how the project was carried out is addressed and also the simulation tool used. All the simulations carried out here were done using Matlab/Simulink. This is a data flow graphical programming language tool for modeling , simulating and analyzing multi-domain dynamic systems. It is widely used in control theory and digital signal processing for multi-domain simulation Model-Based Design.
3.1 Power System Modeling using Matlab/Simulink

29
A micro-grid was modeled by connecting distributed generators near the load together with main grid as shown in figure 3.1
Figure 3.1 Micro-grid system
Generator DG3 was introduced and integrated into the micro-grid. The generator DG3 represents a wind farm.The proposed wind farm was aggregated to an equivalent generator producing 300 MW. The data used to model the system is given in appendix C.
The wind power generator was modeled using Matlab/Simulink and integrated to the micro-grid.
3.2 Excitation control system
The Automatic Voltage Regulator (AVR) and the Power System Stabilizer comprise the excitation control system. They were modeled and included in the system. Further simulations were carried out so as to acertain their effect. The AVR system used has its parameters provided below in table 3.1

30
3.3 Simulation Block Diagrams
The load frequency control model of an isolated power system with constant parameters was modeled as shown below in figure 3.31
The generator block diagram with AVR only is shown in figure 3.32

31
The generator block diagram with AVR and rate feedback stabilizer is shown in figure 3.33
An assumption was made that wind speed is constant , all the wind turbines are exposed to the same wind speed and turbulence level. These assumptions were made so that the wind turbines could be considered to produce their maximum rated power.A short circuit fault was introduced on the bus connecting the micro-grid to the main grid. It was introduced after 1seconds and

32
cleared after 1.01 seconds by tripping the line. The behavior of the generators were observed and analyzed after the fault.

33
Chapter 4
Results and Analysis
In this chapter the simulation results were used to analyze the stability of the power system with wind power generation. The results compared the presence and absence of wind. The results also compared the simulations when the various excitation control elements were included.
To investigate the impact of wind from the power system, the response of the system before and after the wind farm was considered.
4.1 Stability Analysis With and Without the wind Farm
The simulations were carried out with and without the wind farm for the different models.
The Load Frequency Control of the isolated power system was simulated.
Figure 4.1 shows the steady state response of LFC model of an isolated with and without the wind farm

34
Y axis- frequency deviation
X axis-time( seconds)

35
Figure 4.2 shows the transient response of the power system with AVR only
Figure 4.2
Y axis- p.u terminal voltage
X axis- time (secs)
Figure 4.3 shows transient response of the power system with AVR and rate feedback stabilizer
36
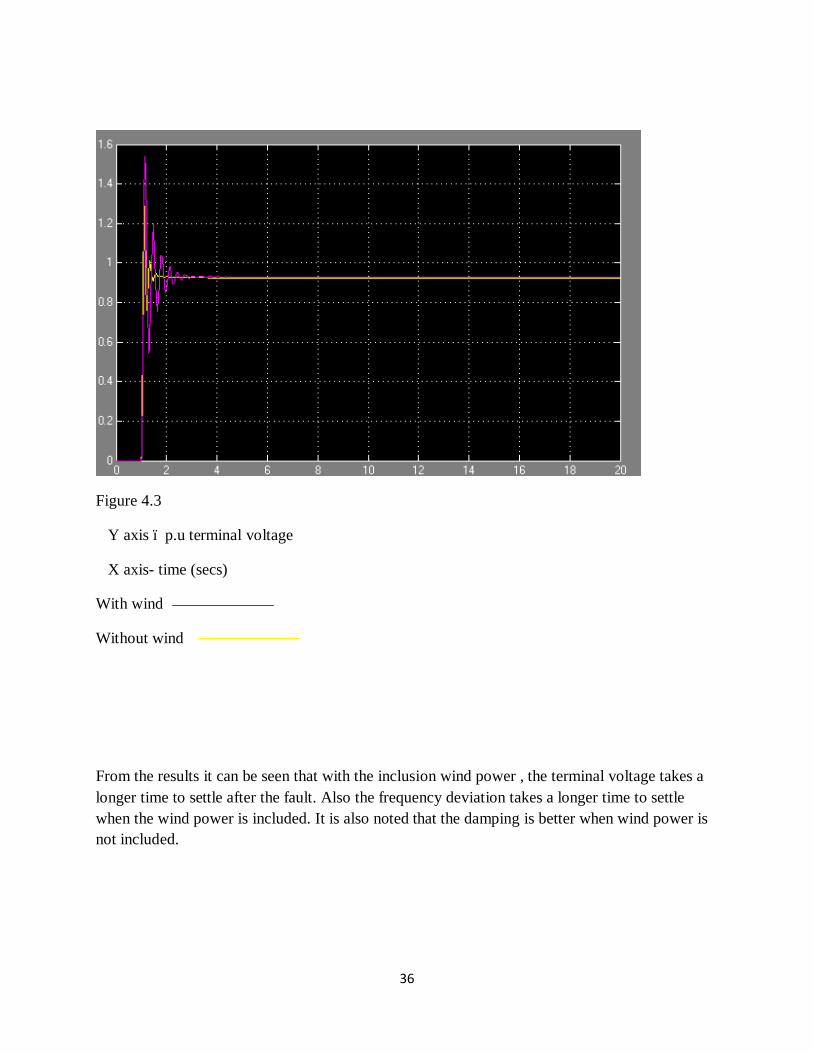
Figure 4.3
Y axis – p.u terminal voltage
X axis- time (secs)
With wind
Without wind
From the results it can be seen that with the inclusion wind power , the terminal voltage takes a longer time to settle after the fault. Also the frequency deviation takes a longer time to settle when the wind power is included. It is also noted that the damping is better when wind power is not included.

37
Chapter 5
Conclusions and Recommendations
In this chapter comments on the simulation results are made. Also recommendations are made for future researches.
5.1 Conclusion
From the project, stability of a power system was analyzed. The performance of the system without wind power was studied first and then was compared with the case when wind power is present. It was observed after considering the settling time of different parameters after a system fault that the operation of the system can be enhanced with inclusion of the excitation controllers

38
in the model. This inclusion is of the excitation control system is necessary when considering integrating this large wind farm into the system.
5.2 Recommendation
Power system stability deals with different aspects of system. Power system stability analysis is important when there is the inclusion of wind power in the system. It is therefore necessary for studies to be carried outto investigate the impact of Wind power generation on the aspects of stability which include voltage, frequency and rotor angle stability.
39
References
1H.Saadat, Power Analysis McGraw –Hill,1999
2. M.G.Simes ,S.Chakraborty,andR.Wood ,”Induction Generators for small wind energy systems,”IEEE power electronics society newsletter , October 2006.
3 G.M. Masters , Renewable and Efficient Electric Power Systems .AJohn Wiley &Sons Publishers, 2004.
4 P.Kundur , Power System Stability and Control McGraw – Hill,1994
5 S.S. Vadhera, Power System Analysis and Stanility.Khana Publishers ,1987
6 B.R Gupta, Power System Analysis and Design. S. Chand &Company LTD,
7 M.Chappell, “Wind Energy Basics ,” Energy Efficiency and Renewable and Energy Workshop,2003

40
APPENDIX A
AVR data
Parameter Setting
Tr, Measurement Delay (s) 0.02
Ka, Controller Gain (pu) 150
Ta, Controller Time Constant (s) 0.03
Ke, Exciter Constant (pu) 0.2
Kf, Stabilization Path Gain (pu) 0.05
Tf, Stabilization Path Time Constant (s) 1.5
El, Saturation Factor 1 (pu) 3.9
Sel, Saturation Factor 2 (pu) 0.1
E2, Saturation Factor 3 (pu) 5.2
Sel, Saturation Factor 4 (pu) 0.5
Vmin, Controller Minimum output (pu) -10
Vmax, Controller Maximum output (pu) 10
41
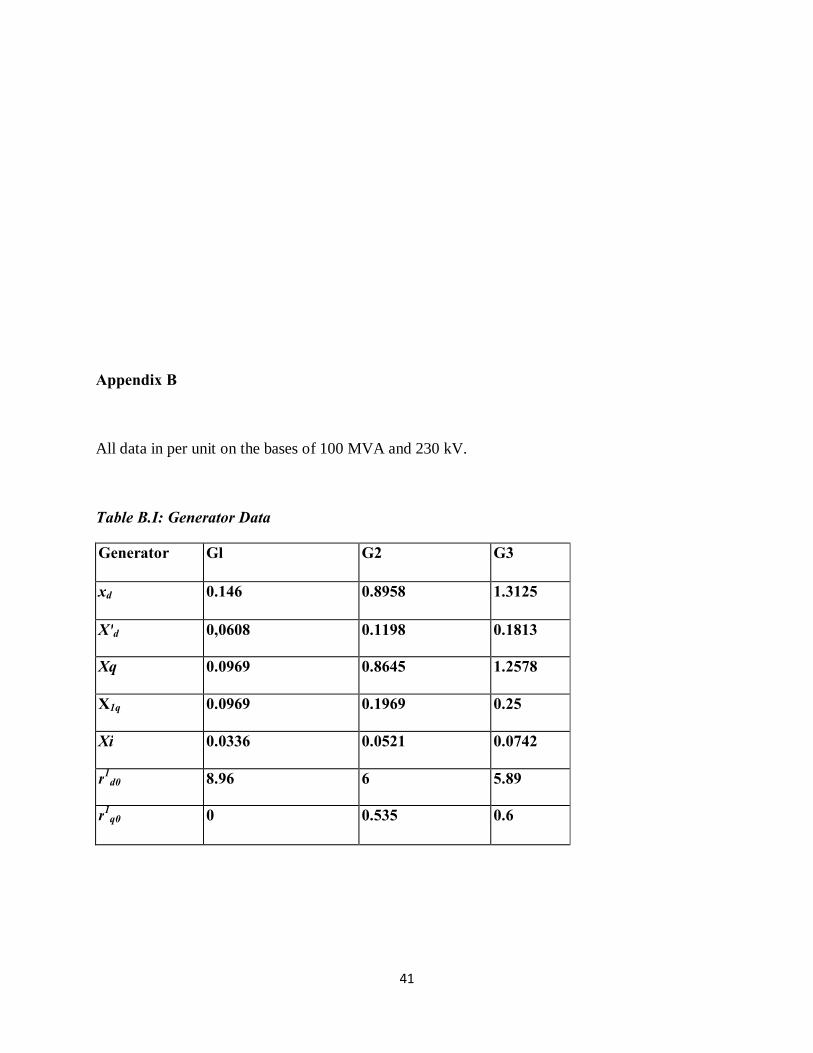
Appendix B
All data in per unit on the bases of 100 MVA and 230 kV.
Table B.I: Generator Data
Generator Gl G2 G3
xd 0.146 0.8958 1.3125
X'd 0,0608 0.1198 0.1813
Xq 0.0969 0.8645 1.2578
X1q 0.0969 0.1969 0.25
Xi 0.0336 0.0521 0.0742
r1d0 8.96 6 5.89
r1q0 0 0.535 0.6

42
r"d0 0.015 0.075 0.075
r"q0 0.024 0.075 0.075
X"d 0.04 0.112 0.12
Y"q
0.024 0.112 0.2
Inertia Time Constant (H)
9.5438 6.214 2.3516
KG =1
TG=1
Table B.2: Line Data in p.u
From (Bus) To (Bus) Resistance (R) Reactance (X)
1 4 0 0.0576
2 7 0 0.0625
Table B.3: Operating Conditions

43
P Q V (p.u)
G1
G2
247.5
163.2
0
28.8
1
1
G3 108.8 19.2 1

44