universidade federal de santa catarina behramand · ciclos anódico e catódico, respectivamente....
TRANSCRIPT

1.1.
Behramand
Thesis submitted to the Post-
graduation program of the Federal
University of Santa Catarina in
partial fulf illment of the
requirements for degree of the Doctor of Philosophy in Chemistry
Area: Organic Chemistry
Research supervisor: Prof. Dr. Hugo
Gallardo
Universidade Federal de Santa Catarina
CFM-PGQMC
Behramand
SYNTHESES AND CHARACTERIZATION OF LUMINESCENT
COMPOUNDS CONTAINING 2,1,3-BENZOXADIAZOLE AND
2,1,3 BENZOTHIADIAZOLE AND THIOPHENE BASED LUMINESCENT LIQUID CRYSTALS
Florianópolis / SC-Brazil 2013

This thesis has been evaluated by the Post-graduation program of the
Department of Chemistry at Federal University of Santa Catarina
and approved for obtaining the degree of
Doctor of Philosophy in Chemistry
Florianópolis, 8th
March 2013
Examination Committee
_______________________
Prof. Dr. Almir Spinelli
Coordinator of the Post-graduation Program in Chemistry Federal University of Santa Catarina-UFSC
_________________________
Prof. Dr. Hugo Gallardo
(QMC-UFSC)
Research Supervisor
_________________________
Prof. Dr. Antonio Luiz Braga
(QMC-UFSC)
Member of the defense committee
_________________________
Prof. Dr. Rodrigo Cristiano
(DQ-UFPB)
Member of the defense committee
__________________________
Prof. Dr. Maria Graça Nascimento
(QMC-UFSC)
Member of the defense committee
__________________________
Prof. Dr. Ivan H. Bechtold
(UFSC)
Member of the defense committee
__________________________
Prof. Dr. Aloir Merlo
(IQ-UFRGS)
Member of the defense committee
Behramand
SYNTHESES AND CHARACTERIZATION OF LUMINESCENT
COMPOUNDS CONTAINING 2,1,3-BENZOXADIAZOLE AND 2,1,3
BENZOTHIADIAZOLE AND THIOPHENE BASED LUMINESCENT
LIQUID CRYSTALS

Dedicated to my parents and my family

ACKNOWLEDGEMENTS "In the name of God, most gracious, most compassionate"
I would like to express my greatest gratitude and sincere thanks to
my research advisor and mentor Prof. Dr. Hugo Gallardo for all his
supervision during this work. With my very limited research experience,
he took me as his graduate student and with his integrity, patience and
guidance encouraged me throughout the years. Bes ides providing
chemicals and instruments, he has always been available and accessible
all the time to provide suggestions and ideas and helps in every way to
make things work.
I am very grateful to the members of the defense committee Prof.
Dr. Rodrigo Cristiano, Prof. Dr. Antonio Luiz Braga, Prof. Dr. Maria
Graça Nascimento, Prof. Dr. Aloir Merlo and Prof. Dr. Ivan H. Bechtold
for their precious contribution in improving this thesis.
It is beyond the words to express my gratitude to my laboratory
fellows Gilmar, Deisi, André, Molin, Eduard, Marli and Luciano, Japa
(formally as Patrícia kkkk), Hugo, Didi, Alana, Danilo, Neto, Coelho,
Paolla, Renato, Ratto and friends from the other laboratories for all kind
of support and keeping a very friendly and caring environment in the
laboratory which make working enjoyable. All the moments spent
together whether travelling for conferences, waiting in queue of the
university restaurant, social gatherings and barbecue parties with
pushing to the swimming pool in Prof. house was a great fun. I wish
best of luck to all in academic and scientific endeavors and hope the
friendship established in Brazil will last in years to come.
I am thankful to Prof. Haidi Fiedler, Prof. Faruk Nome, Prof.
Edson Minatti and Prof. Iolanda Souza for free access to the optical
electrochemical equipments and to Dr. Ismael Bellettini and Jorge A.
Pedro for assistance in emission experiments. I am also thankful to
Professors of the Chemistry department, the technical staff of the center
of analysis and to Grace and Jadir of the Post-Graduation office for their
cooperations.
I am also thankful to the Conselho Nacional de Desenvolvimento
Científ ico e Tecnológico (CNPq) and the Academy of Sciences for the
Developing world (TWAS) for financial support.
I am grateful to all my friends in Brazil, in other parts of the world
and my friends and relatives back in Pakistan for their care and moral
support.

At last but not least, I am extremely indebted to my parents and
other family members for their love, understanding, and support. It was
not easy being so far away from you all, but knowing deep and down, you are very proud of me.
Behramand, Florianopolis, Brazil. 12th Feb. 2013.

ABSTRACT
This thesis entitled as “Synthesis and Characterization of Luminescent
Compounds Containing 2,1,3-Benzoxadiazole and 2,1,3-
Benzothiadiazole and Thiophene Based Luminescent Liquid Crystals"
presents the synthesis and characterization of two series of compounds.
The first series consist of π-conjugated luminescent compounds
containing 2,1,3-benzoxadiazole and 2,1,3 benzothiadiazole as the
central units to which terminal carbocycles with varying number of
alkoxy chains are connected via bonds. Their synthesis and
structural characterizations are described in section A along with a
discussion of the results obtained from their optical and electrochemical
analys is. These compounds showed an intense and bright yellowish
green fluorescence with relative quantum yields (Φ f) of 27 to 32 % in
their CHCl3 solutions. Identity of the central heterocycle and length of
the directly attached alkoxy chains showed minute influence on both the
absorption and emission behavior. However, the number of terminal
alkoxy chains attached to the terminal carbocycles showed a moderate
effect on the absorption. The Stokes shifts were determined to be
reasonably high, with values ranging from 95 to 107 nm and with only a
small region of coincidence between the absorption and emission.
Electrochemical measurements exhibit s ingle oxidation and reduction
peaks in anodic and cathodic sweeps respectively. The HOMO and
LUMO energy levels were assessed from the voltammetric data and the
calculations showed that these compounds possess small energy band
gaps between 1.91 and 2.57 eV.
The second series of compounds are described in section B. These
compounds possess bent shaped molecular structures due to the
presence of thiophene at their centers. As in the previous series, these
compounds are also highly conjugated and the terminal carbocycles are
connected to the central thiophene via bonds. These
compounds were designed to exhibit liquid-crystalline and luminescent
properties. They showed strong blue fluorescence with satisfactory
quantum yields of 26 to 56 % relative to quinine sulfate. Some of the
compounds of this series showed mesomorphism. The preliminary
results suggest a general pattern that increasing the length of the rigid
part of the molecule increase the tendency to form a mesophase.
Another general conclusion that can be drawn from these results is that
an increase in the molecular length also enhances the thermal stability of

the mesophases due to increased rigidity which facilitates a better orientational order and molecular packing in the mesophases.
Key words: Luminescence, Liquid crystals, Sonogashira cross
coupling, 2,1,3-Benzoxadiazole, 2,1,3-Benzothiadiazole, Thiophene.
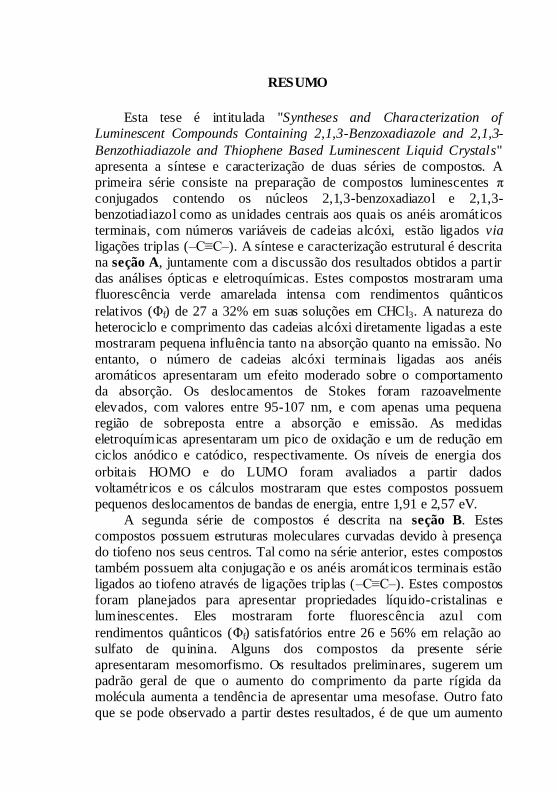
RESUMO
Esta tese é intitulada "Syntheses and Characterization of
Luminescent Compounds Containing 2,1,3-Benzoxadiazole and 2,1,3-
Benzothiadiazole and Thiophene Based Luminescent Liquid Crystals"
apresenta a síntese e caracterização de duas séries de compostos. A
primeira série consiste na preparação de compostos luminescentes π
conjugados contendo os núcleos 2,1,3-benzoxadiazol e 2,1,3-
benzotiadiazol como as unidades centrais aos quais os anéis aromáticos
terminais, com números variáveis de cadeias alcóxi, estão ligados via
ligações triplas (–C≡C–). A síntese e caracterização estrutural é descrita
na seção A, juntamente com a discussão dos resultados obtidos a partir
das análises ópticas e eletroquímicas. Estes compostos mostraram uma
fluorescência verde amarelada intensa com rendimentos quânticos
relativos (Φf) de 27 a 32% em suas soluções em CHCl3. A natureza do
heterociclo e comprimento das cadeias alcóxi diretamente ligadas a este
mostraram pequena influência tanto na absorção quanto na emissão. No
entanto, o número de cadeias alcóxi terminais ligadas aos anéis
aromáticos apresentaram um efeito moderado sobre o comportamento
da absorção. Os deslocamentos de Stokes foram razoavelmente
elevados, com valores entre 95-107 nm, e com apenas uma pequena
região de sobreposta entre a absorção e emissão. As medidas
eletroquímicas apresentaram um pico de oxidação e um de redução em
ciclos anódico e catódico, respectivamente. Os níveis de energia dos
orbitais HOMO e do LUMO foram avaliados a partir dados
voltamétricos e os cálculos mostraram que estes compostos possuem
pequenos deslocamentos de bandas de energia, entre 1,91 e 2,57 eV.
A segunda série de compostos é descrita na seção B. Estes
compostos possuem estruturas moleculares curvadas devido à presença
do tiofeno nos seus centros. Tal como na série anterior, estes compostos
também possuem alta conjugação e os anéis aromáticos terminais estão
ligados ao tiofeno através de ligações triplas (–C≡C–). Estes compostos
foram planejados para apresentar propriedades líquido-cristalinas e
luminescentes. Eles mostraram forte fluorescência azul com
rendimentos quânticos (Φf) satisfatórios entre 26 e 56% em relação ao
sulfato de quinina. Alguns dos compostos da presente série
apresentaram mesomorfismo. Os resultados preliminares, sugerem um
padrão geral de que o aumento do comprimento da parte rígida da
molécula aumenta a tendência de apresentar uma mesofase. Outro fato
que se pode observado a partir destes resultados, é de que um aumento

no comprimento molecular também aumenta a estabilidade térmica das
mesofases devido a uma maior rigidez, o que facilita uma melhor orientação e ordenamento molecular nas mesofases.
Palavras-chave: Luminescência, Cristais líquidos, Acoplamento
cruzado de Sonogashira, 2,1,3-Benzoxadiazol, 2,1,3-Benzotiadiazol, Tiofeno.

LIST OF FIGURES
Figure 1. Different electronic states in a molecule. ...........................21 Figure 2. Perrin–Jablonski diagram illustrating various phenomena
during the photons absorption and emission and relative energy
positions of the absorption, fluorescence and phosphorescence. ..........22 Figure 3. Diagrammatic definition of the Stokes shift. ......................25 Figure 4. The influence of molecular f lexibility and r igidity on the
fluorescence quantum yields. .........................................................26 Figure 5. Possible de-excitation pathways of the photo-excited
molecules.21
................................................................................27 Figure 6. Energy transfer by collisional quenching. ..........................28 Figure 7. Energy transfer by coulombic interactions. ........................28 Figure 8. The molecular structure of cholesteryl benzoate. ................31 Figure 9. Different states of matter and the molecular ordering present
in them. ......................................................................................32 Figure 10. Preferential molecular alignments in liquid crystals. .........33 Figure 11. Cross sections of normal and reverse micelles formed by
surfactants. ..................................................................................35 Figure 12. General template of calamitic LCs where molecular length
(l)>> breadth (b). .........................................................................37 Figure 13. Representation of molecular arrangements in (a) nematics
phase (b) helical macrostructure of chiral nematic or cholesteric phase.
..................................................................................................38 Figure 14. Structural representation of (a) SmA (b) SmC (c) SmB
viewed from side (left) from top (right). ..........................................40 Figure 15. General template of the DLCs molecular architecture. ......40 Figure 16. Aromatic cores commonly used in discotic mesogens,
triphenylene (6), hexaazatr iphenylene (7), tristriazolotr iazine (8),
porphyrine (9)..............................................................................41 Figure 17. Stacking of discotics into different kinds of columnar
assemblies : (a) ordered column, (b) and (c) disordered columns, (d)
helical column, and (e) tilted column.80
...........................................41 Figure 18. Structural representations of the well defined columnar
phases (a) columnar hexagonal Colh, (b) columnar rectangular Colr and
(c) columnar oblique Colob. ..........................................................42 Figure 19. Schematic representation of various discotic nematic
phases11 (a) discotic nematic ND (b) chiral discotic nematic ND* (c)
columnar nematic NCol (d) lateral nematic phase (NL).80
..................43

Figure 20. Structural representation of (a) main chain and (b) branched
chain or comb shaped polymeric liquid crystals. .............................. 44 Figure 21. Packing of main chain polymer mesogenic groups in (a)
nematic and (b) smectic A phases.93
............................................... 44 Figure 22. Molecular shapes of some non conventional LCs distorted
away from rod and disc shapes. ..................................................... 46 Figure 23. Illustration of cis-trans photoisomerization and consequent
mesophase change. ...................................................................... 47 Figure 24. Self assembly of non-mesogenic components into
supramolecular liquid-crystal.107
.................................................... 48 Figure 25. Schematic representation of light induced alignment changes
in LCs doped with photochromic compound and potential applications
of the doped system. .................................................................... 48 Figure 26. Molecular structures of the 2,1,3-benzothiadiazole (10),
2,1,3-benzoxadiazole (11) and thiophene (12).................................. 50 Figure 27. Representative structures of the planned luminescent
compounds. ................................................................................ 59 Figure 28. Retrosynthetic analysis of the target luminescent
compounds. ................................................................................ 60 Figure 29. Retrosynthetic analysis of the central heterocycles. .......... 64 Figure 30. 1H-NMR spectra of compounds 34 and 13 (CDCl3, 400
MHz) as representative of the spectral changes accompanying the
bromination step. ......................................................................... 67 Figure 31. Proposed mechanism of the alkyne deprotection step........ 69 Figure 32.
1H-NMR spectra of compounds 37 and 17 (CDCl3, 400-
MHz) to show the spectral changes that occured during the deprotection
step. ........................................................................................... 70 Figure 33. The IR spectrum of 1,2-bis(dodecyloxy)-4-ethynylbenzene
17 (in KBr disc) with characteristic bands. ...................................... 71 Figure 34.
1H NMR spectrum (CDCl3, 400-MHz) showing formation of
the homocoupled side product 38 as the major product. .................... 74 Figure 35.
1H NMR spectrum of the homocoupled side product 38
(CDCl3, 400 MHz) after purification. ............................................. 75 Figure 36.
1H NMR spectrum of compound 20 (CDCl3, 400 MHz) with
peaks assignments........................................................................ 76 Figure 37.
13C NMR spectrum of the compound 20 (CDCl3, 100 MHz)
showing the important peaks in non-aliphatic region. ....................... 77 Figure 38. FT-IR spectrum (in KBr disc) of compound 23 as
representative model for the final compounds 18-23. ........................ 78

Figure 39. UV-vis absorption spectra of the fluorescent compounds 18-
23 taken in 5 x 10⁻⁶ molar solutions in CHCl3. .................................80
Figure 40. (a) Emission spectra of the compounds 18-23 obtained by
excitation at their respective λmax and (b) Photographs showing the
fluorescence in chloroform solution under UV lamp (λ = 360nm). ......81 Figure 41. Cyclic voltammograms of the final compounds 18-23
obtained in their solutions in dichloromethane at the scan rate of 50
mV.s.-1........................................................................................83
Figure 42. Determining the onset potentials in cyclic voltammogram for
small current changes and wavy peaks. ...........................................83 Figure 43. Resonance in the final compounds..................................88 Figure 44. Representative structures of the designed luminescent liquid
crystals. ......................................................................................90 Figure 45. General retrosynthetic analysis of the bent shaped
luminescent compounds. ...............................................................91 Figure 46. Molecular structures of the terminal alkynes 39 and 40. ....92 Figure 47.
1H-NMR (400 MHz, CDCl3) spectra of compounds 41, 42
(aromatic region) and 40 (aromatic region) showing gradual emergence
of the second order pattern during the course of -C≡C- insertion.........94 Figure 48.
1H NMR spectra of the mono-coupled intermediate 49 (400
MHz, CDCl3) showing two distinct doublets around 7.16 and 6.94 ppm
for the thiophenic hydrogens..........................................................97 Figure 49. UV-vis absorption spectra of compounds 45 - 51 taken in 1 x
10-5
molar solutions in CHCl3. .......................................................99 Figure 50. Photograph showing the fluorescence in chloroform solution
under UV lamp (λ = 360nm). .........................................................99 Figure 51. POM photographs of compound 47 on cooling (I → N) at 3 oC/minute: (a) Appearance of spherical droplets at 166.6
oC
(magnification 10 x 10); (b) Schlieren texture of a nematic phase at
135.8 oC (magnification 10 x 10).................................................. 103
Figure 52. Differential scanning thermogram of compound 47 as a
function of temperature for the second heating and cooling cycles (at
scan rate 10 oC min
-1). ................................................................ 104
Figure 53. POM photographs of compound 51 on second cooling (I →
SmC) at 3 oC/minute : (a) batonnet texture at 92
oC (magnification 10 x
10); (b) fan shaped texture of SmC phase at 86.5 oC (magnification 10 x
10); (c) Appearance of a Schlieren texture of the SmC phase after
rubbing the glass lamina at 80 oC (magnification 10 x 10). .............. 105
Figure 54. Differential scanning thermogram of compound 51 as a
function of temperature for the second heating and cooling cycles (at
scan rate 10 oC min-1). ............................................................... 106
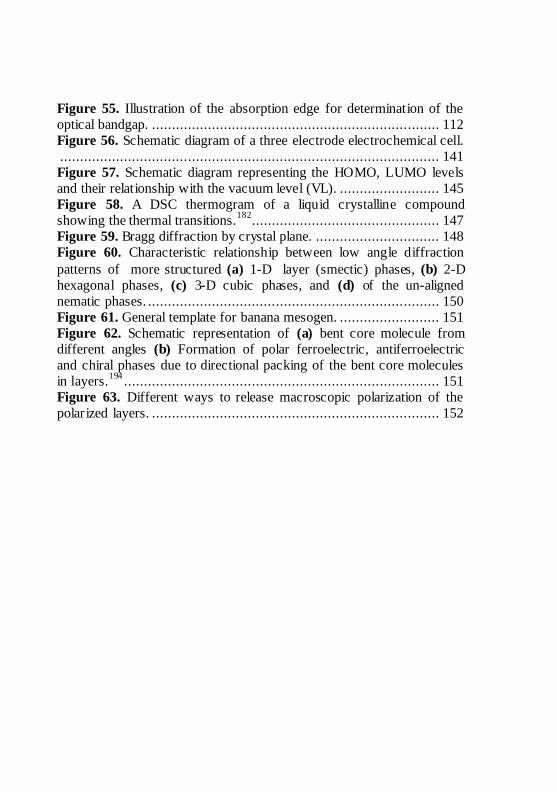
Figure 55. Illustration of the absorption edge for determination of the
optical bandgap. ........................................................................ 112 Figure 56. Schematic diagram of a three electrode electrochemical cell.
............................................................................................... 141 Figure 57. Schematic diagram representing the HOMO, LUMO levels
and their relationship with the vacuum level (VL). ......................... 145 Figure 58. A DSC thermogram of a liquid crystalline compound
showing the thermal transitions.182
............................................... 147 Figure 59. Bragg diffraction by crystal plane. ............................... 148 Figure 60. Characteristic relationship between low angle diffraction
patterns of more structured (a) 1-D layer (smectic) phases, (b) 2-D
hexagonal phases, (c) 3-D cubic phases, and (d) of the un-aligned
nematic phases. ......................................................................... 150 Figure 61. General template for banana mesogen. ......................... 151 Figure 62. Schematic representation of (a) bent core molecule from
different angles (b) Formation of polar ferroelectric, antiferroelectric
and chiral phases due to directional packing of the bent core molecules
in layers.194
............................................................................... 151 Figure 63. Different ways to release macroscopic polarization of the
polarized layers. ........................................................................ 152
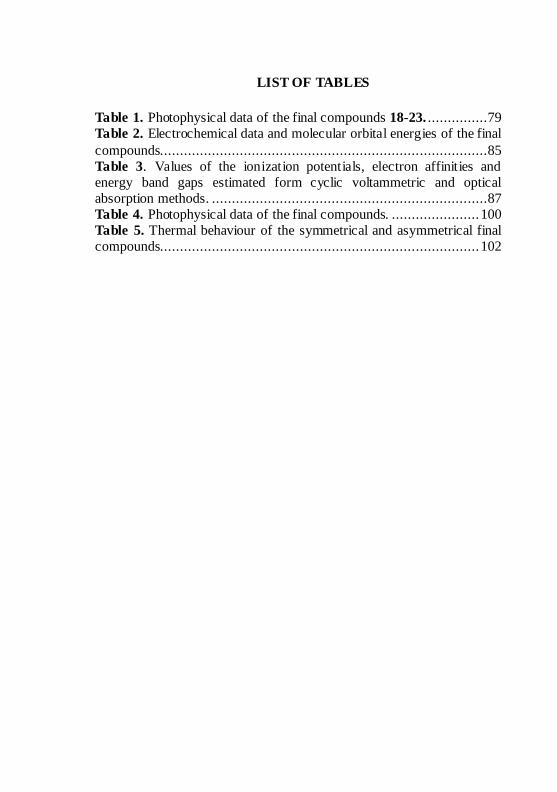
LIST OF TABLES
Table 1. Photophysical data of the final compounds 18-23. ...............79 Table 2. Electrochemical data and molecular orbital energies of the final
compounds. .................................................................................85 Table 3. Values of the ionization potentials, electron affinities and
energy band gaps estimated form cyclic voltammetric and optical
absorption methods. .....................................................................87 Table 4. Photophysical data of the final compounds. ...................... 100 Table 5. Thermal behaviour of the symmetrical and asymmetrical final
compounds................................................................................ 102
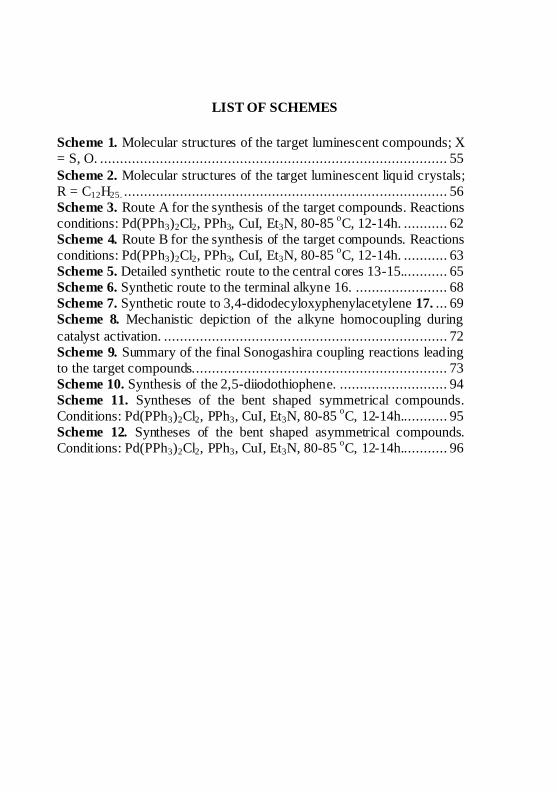
LIST OF SCHEMES
Scheme 1. Molecular structures of the target luminescent compounds; X
= S, O. ....................................................................................... 55 Scheme 2. Molecular structures of the target luminescent liquid crystals;
R = C12H25. ................................................................................. 56 Scheme 3. Route A for the synthesis of the target compounds. Reactions
conditions: Pd(PPh3)2Cl2, PPh3, CuI, Et3N, 80-85 oC, 12-14h. ........... 62
Scheme 4. Route B for the synthesis of the target compounds. Reactions
conditions: Pd(PPh3)2Cl2, PPh3, CuI, Et3N, 80-85 oC, 12-14h. ........... 63
Scheme 5. Detailed synthetic route to the central cores 13-15............ 65 Scheme 6. Synthetic route to the terminal alkyne 16. ....................... 68 Scheme 7. Synthetic route to 3,4-didodecyloxyphenylacetylene 17. ... 69 Scheme 8. Mechanistic depiction of the alkyne homocoupling during
catalyst activation. ....................................................................... 72 Scheme 9. Summary of the final Sonogashira coupling reactions leading
to the target compounds. ............................................................... 73 Scheme 10. Synthesis of the 2,5-diiodothiophene. ........................... 94 Scheme 11. Syntheses of the bent shaped symmetrical compounds.
Conditions: Pd(PPh3)2Cl2, PPh3, CuI, Et3N, 80-85 oC, 12-14h............ 95
Scheme 12. Syntheses of the bent shaped asymmetrical compounds.
Conditions: Pd(PPh3)2Cl2, PPh3, CuI, Et3N, 80-85 oC, 12-14h............ 96

LIST OF ABBREVIATIONS
CMC Critical micelle concentration
Colhd Columnar hexagonal disordered
Colho Columnar hexagonal ordered
Colob Columnar oblique
Colr Columnar rectangular
Cr Crystalline phase
CRTs Cathode ray tubes
CV Cyclic voltammetry
DLCs Discotic liquid crystals
DMF Dimethylformamide
DSC Differential scanning calorimetry
EA Electron affinity
Eg Bandgap energy
Et4NClO4 Tetraethylammonium perchlorate
Fc Ferrocene
FONs Fluorescent organic nanoparticles
HOMO Highest occupied molecular orbital
IC Internal conversion
IL Isotropic liquid
IP Ionization potential
ISC Intersystem crossing
LCDs Liquid crystals displays
LCs Liquid crystals
LLCs Lyotropic liquid crystals
LUMO Lowest unoccupied molecular orbital
MS Mass spectrometry
N Nematic mesophase
N* Chiral nematic (Cholesteric) mesophase
NBS N-Bromosuccinimide
n Director
NCol Columnar nematic mesophase
ND Discotic nematic mesophase
ND* Chiral nematic discotic mesophase
OLEDs Organic light emitting diodes
POM Polarizing optical microscopy
PTC Phase transfer catalyst
SCE saturated calomel electrode
SHE Standard hydrogen electrode
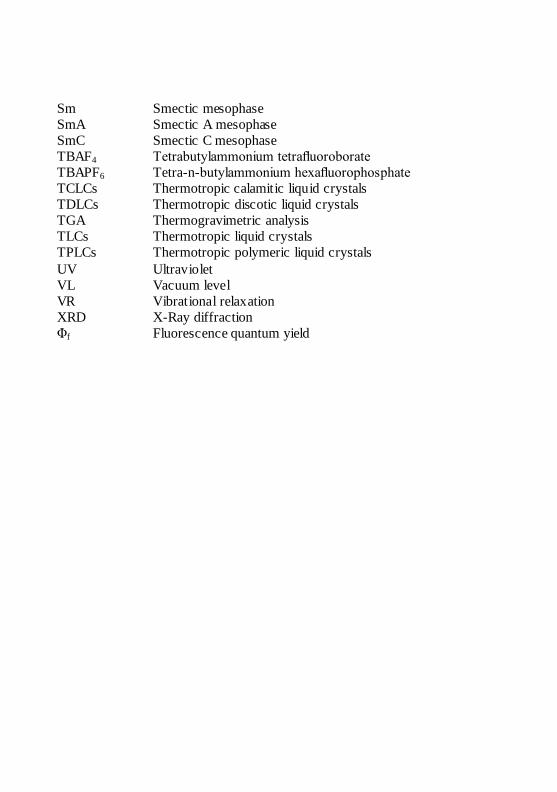
Sm Smectic mesophase
SmA Smectic A mesophase
SmC Smectic C mesophase
TBAF4 Tetrabutylammonium tetrafluoroborate
TBAPF6 Tetra-n-butylammonium hexafluorophosphate
TCLCs Thermotropic calamitic liquid crystals
TDLCs Thermotropic discotic liquid crystals
TGA Thermogravimetric analysis
TLCs Thermotropic liquid crystals
TPLCs Thermotropic polymeric liquid crystals
UV Ultraviolet
VL Vacuum level
VR Vibrational relaxation
XRD X-Ray diffraction
Φf Fluorescence quantum yield
TABLE OF CONTENTS
1. INTRODUCTION ..................................................................19 1.1. LUMINESCENCE .........................................................................................20 1.2. GENERA L TERMS IN LUMINESCENCE ..............................................20 1.3. MECHANISM OF LUMINESCENCE ......................................................21 1.4. THE STOKES SHIFT ....................................................................................24 1.5. QUANTUM YIELD ......................................................................................25 1.5.1. Factors that Affect Quantum Yield ......................................................... 26 1.6. LIQUID CRYSTA LS.....................................................................................29 1.7. HISTORY OF LIQUID CRYSTALS......................................................................30 1.8. DESCRIPTION OF THE LIQUID CRYSTA LLINE STATE ................31 1.9. CLASSES OF THE LIQUID CRYSTA LS ................................................33 1.9.1. Thermotropic Liquid Crystals ................................................................... 33 1.9.2. Lyotropic Liquid Crystals ........................................................................... 34 1.9.3. Amphotropic or Amphitropic Liquid Crystals........................................ 36 1.10. MOLECULA R STRUCTURES A ND MESOPHASES OF
THERMOTROPIC LIQUID CRYSTA LS.........................................................36 1.10.1. Thermotropic Calamitic Liquid Crystals ............................................... 37 1.10.1.1. Nematic Mesophase................................................................................... 37 1.10.1.2. Cholesteric Mesophase............................................................................... 38 1.10.1.3. Smectic Mesophases .................................................................................. 39 1.10.2. Thermotropic Discotic Liquid Crystals.................................................. 40 1.10.2.1. Columnar Mesophases of Discotic Liquid Crystals ..................................... 42 1.10.2.2. Nematic Mesophases Of Discotic Liquid Crystals....................................... 43 1.10.3. Thermotropic Polymeric Liquid Crystals .............................................. 43 1.10.4. Non Conventional Liquid Crystals ......................................................... 45 1.11. FUNCTIONA LIZATION OF THE LIQUID CRYSTA LS ...................46 1.12. A BRIEF REVIEW OF THE 2,1,3-BENZOTHIADIAZOLE ..............49 1.13. A BRIEF REVIEW OF THE 2,1,3-BENZOXADIAZOLE ..................49 1.14. A BRIEF LITERATURE REVIEW OF THE THIOPHENE ................50 2. OBJECTIVES ........................................................................53 3. RESULTS AND DISCUSSION................................................57 3.1. SYNTHESES AND CHARACTERIZATION OF LUMINESCENT COMPOUNDS
CONTAINING 2,1,3-BENZOXADIAZOLE AND 2,1,3 BENZOTHIADIAZOLE AND
THEIR OPTICAL AND ELECTROCHEMICAL PROPERTIES ....................................58 3.2. MOLECULA R DESIGN...............................................................................59 3.3. RETROSYNTHETIC ANALYSIS .............................................................59 3.4. SYNTHETIC PLAN ......................................................................................60 3.4.1. Syntheses and Characterizations of The Central Cores....................... 64 3.4.2. Synthesis of The Terminal Acetylenes .................................................... 67 3.4.3. Synthesis of The Final Compounds ......................................................... 71

3.5. OPTICA L PROPERTIES ............................................................................. 78 3.6. ELECTROCHEMICAL PROPERTIES..................................................... 82 3.7. THE EG , IP AND EA FROM OPTICA L ABSORPTIONS...................... 85 3.8. SYNTHESES AND CHARACTERIZATION OF THIOPHENE BASED
LUMINESCENT LIQUID CRYSTALS........................................................................ 89 3.9. MOLECULA R DESIGN OF THE TA RGET COMPOUNDS ............... 90 3.10. SYNTHETIC PLAN.................................................................................... 91 3.10.1. Synthesis of The Terminal Alkynes ........................................................92 3.10.2. Synthesis and Characterization of The Final Compounds .................94 3.11. OPTICA L PROPERTIES ........................................................................... 98 3.12. MESOMORPHIC AND THERMA L PROPERTIES ..........................100 4. CONCLUSIONS .................................................................. 107 5. EXPERIMENTAL DETAILS ............................................... 109 5.1. GENERA L MATERIA LS ..........................................................................110 5.2. INSTRUMENTATION AND METHODS..............................................110 5.2.1. Structural Characterizations ...................................................................110 5.2.2. Optical Analyses ........................................................................................110 5.2.3. Determination of The Optical Bandgaps ..............................................111 5.2.4. Cyclic Voltammetric Analysis ..................................................................112 5.2.5. Thermal Analysis .......................................................................................113 5.3. EXPERIMENTA L PROCEDURES AND SPECTRA L DATA OF THE
SYNTHESIZED COMPOUNDS......................................................................113 6. APPENDIX .......................................................................... 139 7. BIBLIOGRAPHY ................................................................ 153 8. PUBLISHED PAPER ........................................................... 173

1. INTRODUCTION
20 Introduction
1.1. LUMINESCENCE
Luminescence is the radiative emission of ultraviolet, visible or
infrared photons from an electronically excited species to return to its
ground state. In the ground state, the bonding electrons occupy the
highest occupied molecular orbital (HOMO). When sufficient energy is
provided to a molecule, its electrons can overcome the energy barrier
required to move from their ground state (HOMO) to a higher energy
level (LUMO). The excited molecule may be organic, inorganic or
organometallic in nature. These excited molecules can partially lose the
energy radiatively (emit light radiations) when electrons go from the
excited state back to the ground state and this phenomenon of light
emission is called luminescence.
Molecules that exhibit luminescence are very important in
modern day technology and find important uses in diverse fields like
organic light-emitting diodes (OLEDs) for electroluminescent devices
and flat panel display technology,1,2
fluorescent organic nanoparticles
(FONs),3 as solid state light sources for sign boards and light appliances,
fluorescent probes in medical science for locating tumor cells,4
photoconductors for solar cells5 and chemical sensors.
6
1.2. GENERAL TERMS IN LUMINESCENCE
Although there are various methods of inducing excitation and
subsequent emission, e.g. thermoluminescence, excitation by thermal
heating, chemiluminescence, based on the production of electromagnetic
radiation observed when a chemical reaction yields an electronically
excited product, bioluminescence (by biochemical process),7
sonoluminescence, (by ultrasounds), electroluminescence, (by electric
field), solvoluminescence,8
and mechanoluminescence9
etc, the present
discussion is related to photoluminescence in which a species is excited
by absorption of photon and subsequently the excited species loses part
of the absorbed energy radiatively resulting in luminescence. The
photoluminescence is further classified into fluorescence or
phosphorescence depending on whether the excited species responsible for emission is in the singlet or triplet state (Fig. 1).

Introduction 21
Figure 1. Different electronic states in a molecule.
Organic molecules contain an even number of electrons and have
a singlet ground state with a net spin of zero. The ground singlet state is
usually labeled as S0 and the f irst, second and higher electronic excited
singlet states are represented by S1, S2 and Sn respectively, with n = 3, 4,
5 and so on. A molecule exhibits a singlet state when there is no net
electronic spin associated with the state i.e. all of the spins are paired.
The spin multiplicity formula (M = 2S + 1) gives the number of the
states which can arise, where the ‘S’ is the total spin quantum number.
In the case when all the electrons of a molecule are spin-paired, S = 0,
the spin multiplicity is 1, which represents the singlet state. In contrast,
the excited states in which the two electron spins are parallel have an
overall spin momentum (S = 1) an the spin multiplicity = 3. Having
unpaired electrons, they exhibit magnetic properties and, in a magnetic
field, split into three sub-states of slightly different energies. These
states are therefore referred as "triplet" states" and are labelled as T 1, T2,
and so on, where ‘T’ indicates that there are three possibilities of spin orientation of the two unpaired electrons.
10
1.3. MECHANISM OF LUMINESCENCE
The various excitation and relaxation processes involved in
photoluminescence are illustrated in the Jablonski diagram presented in
fig. 2. Diagrams of this type were introduced by A. Jablonski (1935) on
the mechanism of phosphorescence. The straight arrows represent
various possible radiative transitions, whereas the wavy arrows show the
non-radiative transitions between electronic or vibrational states. When
the molecule is excited, one of the paired electrons moves up to an

22 Introduction
orbital of higher energy. Its spin may still be paired with that of the
electron left behind and so a whole series of excited states exists in
which the total electron spin is still zero. Energy of the absorbed
photons determine which excited state the electrons reach and
transitions such as So → S1, So → S2, So → S3, etc can be achieved by
the absorption of photons of specific energies. Within each energy level,
there are several closely spaced vibrational states and excited electrons
will undergo vibrational relaxation (VR) to the lowest vibrational level
within the same electronic state. If the molecule is excited to the singlet
excited state higher than S1, (S0 → S2, S3 etc), it rapidly relaxes to the
lower level S1 via internal conversion (IC) – a rapid non-radiative
transition between two electronic states of the same spin multiplicity. In
most organic molecules, internal conversion from the higher excited
states to the lowest or first excited singlet state (Sn → S1) occurs much
more rapidly (10-12
s or less)11
than the decay from the lowest excited
state to the ground state (S1 → S0). The measured fluorescence thus
occurs mainly from the lowest excited state (S1 → S0) with typical
lifetime of 10-10
to 10-7
s, even if the molecule is initially excited to a
higher state. This generalization is often called Kasha’s rule after Michael Kasha, who first formalized it.
12
Figure 2. Perrin–Jablonski diagram illustrating various phenomena during the photons absorption and emission and relative energy positions of the absorption,
fluorescence and phosphorescence.

Introduction 23
Direct transitions from the ground singlet state to the excited
triplet states (S0 → T1, S0 → T2 etc) cannot occur because they violate
one of the laws of quantum mechanics: the "selection rule" which states
that the spin of the electron cannot be changed during the transitions
associated with the absorption or emission of radiation. In the excited
state, however, the two electrons occupying separate orbitals are no
longer restricted by the Pauli principle, and consequently, molecules can
adopt the triplet states (the Hund's rule) by intersystem crossing or in
some cases by other processes such as chemical reactions. Intersystem
crossing (ISC) is a non-radiative transition between two isoenergetic
vibrational levels belonging to electronic states of different
multiplicities. Crossing between states of different multiplic ity is in
principle forbidden, but coupling between the orbital magnetic moment
and the spin magnetic moment (i.e. spin–orbit coupling)13
can be large
enough to make it possible. Intersystem crossing often occurs with a rate
constant on the order of 106 – 10
8 s
−1 and its probability depends on the
singlet and tr iplet states involved. If the transition S0 → S1 is of n → p
type for instance, intersystem crossing (S1 → T1) is often efficient. Also
the presence of heavy atoms (i.e. whose atomic number is large, for
example Br, I, Pb) increases spin–orbit coupling and thus favors
intersystem crossing. Typical lifetimes of excited triplet states range
from 10−6
s to more than 1 s.14
After ISC, the molecule at the higher vibrational energy levels of
T1 state can release the excess energy via vibrational relaxation (VR) to
the lowest vibrational energy level of T1 state. Subsequently, the triplet
can then emit light (phosphorescence) as it decays back to the singlet
ground state. In principle, electronic transition from the triplet states to
the ground singlet state (T1 → So) is "forbidden". In practice, the
selection rule is not so rigorous and there is a small probability that such
a forbidden transition can still occur. Thus, after an intersystem crossing
from S1 to T1, the latter, if not deactivated by some other processes, can
eventually return to the singlet ground state So with the emission of a
photon. It is this principle that accounts for the long lifetime of the
triplet state and the associated phosphorescence emission. The rate
constants for phosphorescence are several orders of magnitude smaller
(106 – 10
0 s
-1) than those for fluorescence due to the fact that the
transition from T1 to S0 is spin-forbidden.11
The lifetime for
phosphorescence is above 10-4
second and the emission length varies
greatly,15
e.g. for aromatic hydrocarbons, the radiative lifetime for

24 Introduction
phosphorescence is typically on the order of 30 s. In contrast, the
fluorescence emission occurs very quickly (10-8
s) after it reaches its
excited state,16
because it does not involve any spin change and goes
back to the ground state immediately after its excitation.
Due to its forbidden nature, phosphorescence is quite rare in
organic materials. Nevertheless, it is commonly observed in metal
complexes due to spin-orbit coupling.17
Phosphorescence is, however,
not the only fate of a molecule in the triplet state. In the presence of
quenchers such as O2 or Br2, intersystem crossing (ISC) from the triplet
state to the ground state (T1 → S0) may compete with the
phosphorescence. Also, reverse intersystem crossing T1 → S1 can occur
when the energy difference between S1 and T1 is small and when the life
time of T1 is long enough. This results in delayed f luorescence with the
same spectral distribution as normal fluorescence but with a much
longer decay time because the molecules stay in the triplet state before
emitting from S1. Delayed f luorescence is thermally activated and
consequently, its efficiency increases with increasing temperature.
Delayed fluorescence is very efficient in fullerenes.18
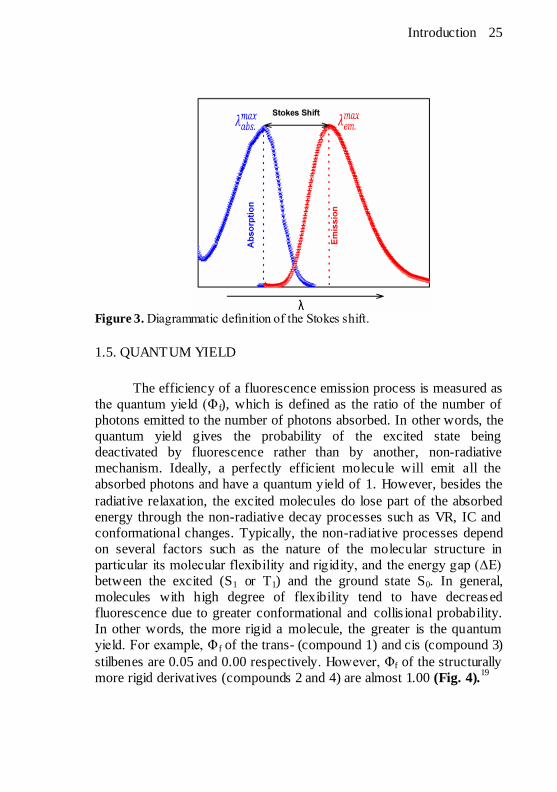
1.4. THE STOKES SHIFT
Since the luminescence occurs from the lowest excited states (S1
and T1) and the excited molecule loses some energy through the
processes of vibrational relaxation (VR) and internal conversion (IC)
etc, the re-emitted light has lower energy than that absorbed, hence the
emission wavelength is always longer than the excitation wavelength as
shown in fig. 3. This red shift of the emission relative to the absorption
i.e. difference between the positions of the band maxima in absorption
and emission spectra, is called the Stokes shift after George Stokes, a
British mathematician and physic ist who, in 1852, discovered that the
mineral fluorspar emits visible light when it is illuminated with UV
light. Stokes also described the red shift of the fluorescence of quinine,
coined the term “fluorescence,” and was the first to observe that a
solution of hemoglobin changes from blue to red when the protein binds
O2.14
As T1 is often lower in energy than S1, phosphorescence generally
occurs at lower frequency relative to fluorescence resulting in Stokes
shift greater than in the case of fluorescence.11
Introduction 25
Figure 3. Diagrammatic definition of the Stokes shift.
1.5. QUANTUM YIELD
The efficiency of a fluorescence emission process is measured as
the quantum yield (Φ f), which is defined as the ratio of the number of
photons emitted to the number of photons absorbed. In other words, the
quantum yield gives the probability of the excited state being
deactivated by fluorescence rather than by another, non-radiative
mechanism. Ideally, a perfectly efficient molecule will emit all the
absorbed photons and have a quantum yield of 1. However, besides the
radiative relaxation, the excited molecules do lose part of the absorbed
energy through the non-radiative decay processes such as VR, IC and
conformational changes. Typically, the non-radiative processes depend
on several factors such as the nature of the molecular structure in
particular its molecular flexibility and rigidity, and the energy gap (∆E)
between the excited (S1 or T1) and the ground state S0. In general,
molecules with high degree of flexibility tend to have decreased
fluorescence due to greater conformational and collis ional probability.
In other words, the more rigid a molecule, the greater is the quantum
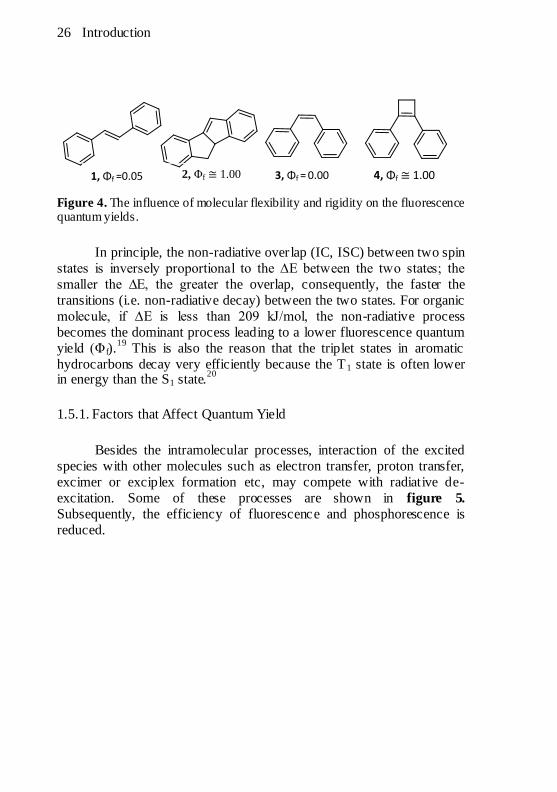
yield. For example, Φ f of the trans- (compound 1) and cis (compound 3)
stilbenes are 0.05 and 0.00 respectively. However, Φf of the structurally
more rigid derivatives (compounds 2 and 4) are almost 1.00 (Fig. 4).19
26 Introduction
2, Φf ≅ 1.00 3, Φf = 0.00 1, Φf =0.05 4, Φf ≅ 1.00
Figure 4. The influence of molecular flexibility and rigidity on the fluorescence quantum yields.
In principle, the non-radiative overlap (IC, ISC) between two spin
states is inversely proportional to the ∆E between the two states; the
smaller the ∆E, the greater the overlap, consequently, the faster the
transitions (i.e. non-radiative decay) between the two states. For organic
molecule, if ∆E is less than 209 kJ/mol, the non-radiative process
becomes the dominant process leading to a lower fluorescence quantum
yield (Φf).19
This is also the reason that the triplet states in aromatic
hydrocarbons decay very efficiently because the T1 state is often lower in energy than the S1 state.
20
1.5.1. Factors that Affect Quantum Yield
Besides the intramolecular processes, interaction of the excited
species with other molecules such as electron transfer, proton transfer,
excimer or exciplex formation etc, may compete with radiative de-
excitation. Some of these processes are shown in figure 5.
Subsequently, the efficiency of fluorescence and phosphorescence is
reduced.
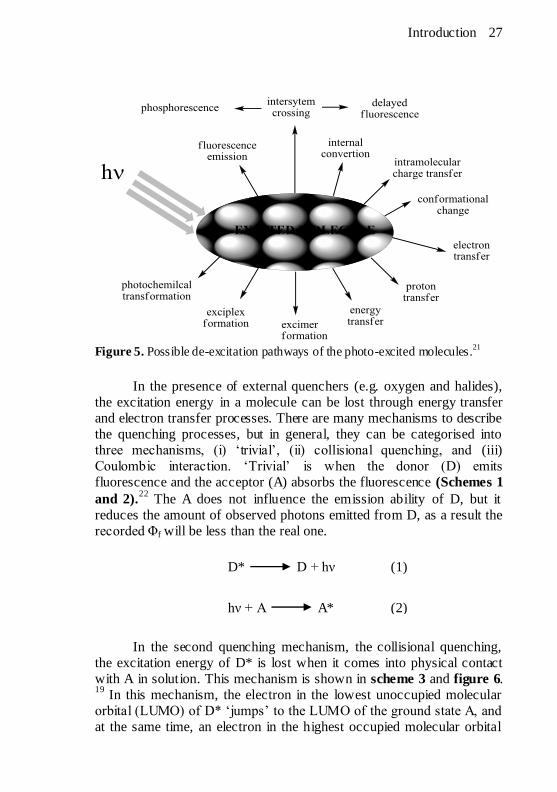
Introduction 27
Figure 5. Possible de-excitation pathways of the photo-excited molecules.
21
In the presence of external quenchers (e.g. oxygen and halides),
the excitation energy in a molecule can be lost through energy transfer
and electron transfer processes. There are many mechanisms to describe
the quenching processes, but in general, they can be categorised into
three mechanisms, (i) ‘trivial’, (ii) collisional quenching, and (iii)
Coulombic interaction. ‘Trivial’ is when the donor (D) emits
fluorescence and the acceptor (A) absorbs the fluorescence (Schemes 1
and 2).22
The A does not influence the emission ability of D, but it
reduces the amount of observed photons emitted from D, as a result the
recorded Φf will be less than the real one.
In the second quenching mechanism, the collisional quenching,
the excitation energy of D* is lost when it comes into physical contact
with A in solution. This mechanism is shown in scheme 3 and figure 6.
19 In this mechanism, the electron in the lowest unoccupied molecular
orbital (LUMO) of D* ‘jumps’ to the LUMO of the ground state A, and
at the same time, an electron in the highest occupied molecular orbital
hν + A A* (2)
D* D + hν (1)
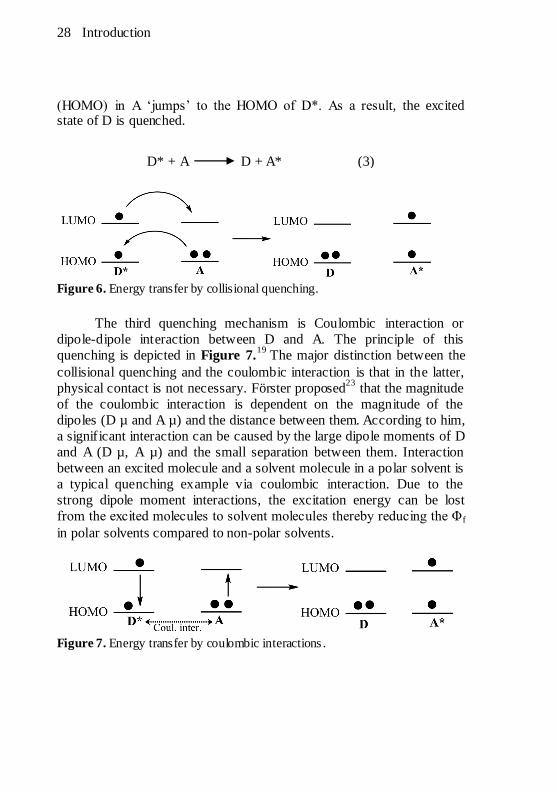
28 Introduction
(HOMO) in A ‘jumps’ to the HOMO of D*. As a result, the excited state of D is quenched.
Figure 6. Energy transfer by collisional quenching.
The third quenching mechanism is Coulombic interaction or
dipole-dipole interaction between D and A. The principle of this
quenching is depicted in Figure 7.19
The major distinction between the
collisional quenching and the coulombic interaction is that in the latter,
physical contact is not necessary. Förster proposed
23 that the magnitude
of the coulombic interaction is dependent on the magnitude of the
dipoles (D µ and A µ) and the distance between them. According to him,
a significant interaction can be caused by the large dipole moments of D
and A (D µ, A µ) and the small separation between them. Interaction
between an excited molecule and a solvent molecule in a polar solvent is
a typical quenching example via coulombic interaction. Due to the
strong dipole moment interactions, the excitation energy can be lost
from the excited molecules to solvent molecules thereby reducing the Φf
in polar solvents compared to non-polar solvents.
Figure 7. Energy transfer by coulombic interactions .
D* + A D + A* (3)

Introduction 29
The quantum yield is one of the most difficult quantities to be
determined accurately.21,24
This is because its value measured for a
solution varies depending on the experimental conditions including the
kind of solvent, the concentrations of the sample, dissolved oxygen in the solution, temperature and the excitation wavelength.
1.6. LIQUID CRYSTALS
Liquid crystals (LCs) represent phases of matter with the
molecular order intermediate between a fully ordered crystalline solid
and an isotropic liquid. This phase has the property to flow like liquids
and retains varying degrees of arrangement of molecules like crystals.
They occupy a key position in our modern world and have many
technological, scientif ic, artistic and medical applications. This is
because they can be functionalized in a variety of ways and they
consume a barely perceptible amount of energy when they change their
state under external influences such as temperature, electric field,
mechanical stress or whatever. The most familiar and prominent
commercial application of LCs is their use in display technology.25
We
see them in our digital watches, computer displays, laptops, TV screens,
telephones and calculators, polarized light emitting displays, car
dashboards, photo-cameras, etc. Liquid crystals displays (LCDs) are
superior over the cathode ray tubes (CRTs) used in the recent past and
they have dominated the displays market especially in portable
instruments due to a combination of physical properties e.g. low power
consumption, low operating voltage, light-weight, slim shape and
reduced size for the same screen dimensions.26
Apart from their
applications in the area of displays which depend on their electro-optical
properties, their thermo-optical properties (thermochromic effect) are
exploited in a number of temperature sensors. These include liquid
crystal thermometer for medical use to read body temperature by
placing against the forehead, mood rings, hot warning indicators,
monitoring devices for the packaging of chilled food and colour
changing jewellery. In scientif ic laboratories, they are used in
chromatography where they create an anisotropic medium that promotes
the separation of close-boiling isomers which are very difficult or
impossible to separate on classical stationary phases.27
Being anisotropic
fluids, LCs can be used as organized reaction media.28
Because of the
orientation of the reactants dissolved in the liquid crystal, the
30 Introduction
regioselectivity and chemoselectivity of organic reactions in liquid
crystalline solvents differ from those observed in conventional organic
solvents.29,30
They are used as anisotropic solvents for certain
spectroscopic applications. For example, anisotropic chemical shifts31
and enantiomeric excess32
can be measured from NMR spectra taken in
liquid crystals as solvents. Other applications of liquid crystals include
their use in light modulators and gates for photonics, liquid crystal
lasers, skin-care cosmetic products, soaps and detergents, as charge
transport materials,33
as intelligent lubricants,34
artificial muscle, chemical sensors,
35 optical data storage
36 and
drug delivery systems etc.
1.7. History of liquid crystals
In 1888, an Austrian botanical physiologist Friedrich Reinitzer
observed that cholesteryl benzoate and some other cholesterol
derivatives show a strange thermal behaviour, i.e. possessing double
melting points. He observed that the solid cholesteryl benzoate (5)
changed into a turbid viscous fluid on first melting at 145.5°C, which
on second melting at 178.5°C, turned in to a clear and transparent liquid.
Moreover, he also observed the appearance of a blue glow just before
the turbid liquid transformed into the clear form. Surprised and curious
by these observations, he sent these samples to Otto Lehmann, a
polarizing microscopy expert who had developed a polarization
microscope with a heating stage. Investigating the samples of Reinitzer
under his microscope and passing polarized light through the strange
cloudy fluid, Lehmann noticed birefringence, a phenomenon associated
with crystals. He also observed the same phenomenon in other
substances that pass through such intermediate cloudy liquids and
understood that he was dealing with a new state of matter, which at first,
he gave the name fliessende Kristalle (flowing crystals).37
Later he
thought that the term flüssige Kristalle ( liquid crystals) corresponds
better to the essence of mesophases and used it as a title of the very first
book on liquid crystals.38

Introduction 31
Figure 8. The molecular structure of cholesteryl benzoate.
Lehmann’s idea of considering the birefr ingent fluid, which he
called liquid crystals, as a novel state of matter was not accepted by
majority of the scientists39
who considered it to be colloidal
suspension40
or mixture of tautomers.41
However, the systematic work
of George Friedel continued to steadily provide a growing body of
evidence supporting the view that liquid crystals do represent a true state
of matter. In 1922, the famous publication42
by George Friedel proved to
be a real seal of universal acceptance of liquid crystals as a distinct
phase of matter. Friedel studied the orientations of liquid crystals in the
presence of electric field and introduced a classification scheme for
liquid crystals on the basis of differences in molecular ordering.
Today liquid crystals are known to represent the fourth state of
matter, structurally (molecular arrangement) and thermodynamically
located between the highly ordered crystalline solid and the disordered
liquid states. Being at the mesophase, liquid crystals partially exhibit
properties of both the crystalline solids e.g. optical anisotropy, as well as
the liquids e.g. fluidity. In other words, liquid crystals are anisotropic
liquids with a certain long-range order in their molecular arrangement and represent a partially ordered and delicate phase of the matter.
43
1.8. DESCRIPTION OF THE LIQUID CRYSTALLINE STATE
In crystalline solids, the molecules (in molecular crystals) are
highly organized occupying fixed positions and having defined relative
orientations, i.e. the molecules posses both positional and orientational
order. The intermolecular forces responsible for holding the molecules
into their fixed positions in a crystal need not be the same in all
directions especially if the molecules are geometrically anisotropic as in
32 Introduction
the cases of mesogenic compounds i.e. compounds structurally suitable
to give mesophases.44
In such cases, the transition from crystalline phase
to the isotropic liquid and vice versa is not direct and single stepped but
occurs via one or more intermediate steps. Upon heating a mesogenic
compound, the molecules vibrate and overcome the weaker organizing
forces first but they still remain bound by the stronger forces and lose
some or all of their positional order while still maintaining some
orientational order. This non crystalline and anisotropic liquid phase of
the matter with partial long range orientational order qualif ies to what is
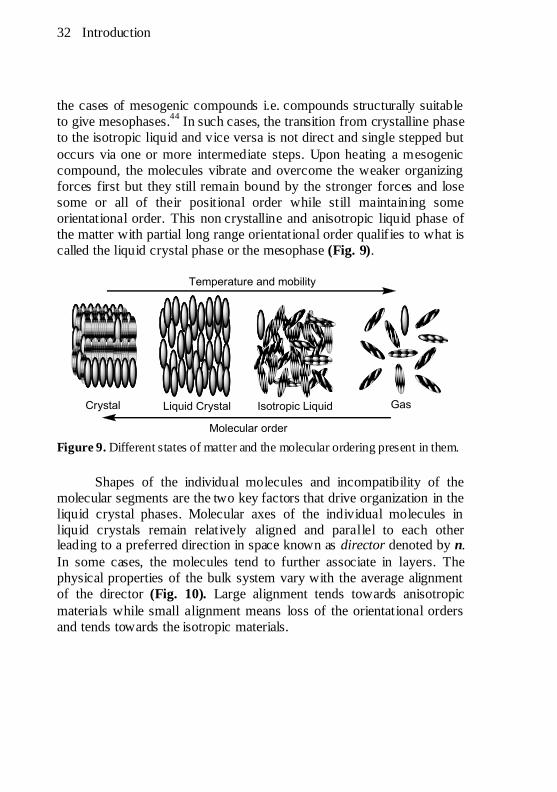
called the liquid crystal phase or the mesophase (Fig. 9).
Figure 9. Different states of matter and the molecular ordering present in them.
Shapes of the individual molecules and incompatibility of the
molecular segments are the two key factors that drive organization in the
liquid crystal phases. Molecular axes of the individual molecules in
liquid crystals remain relatively aligned and parallel to each other leading to a preferred direction in space known as director denoted by n.
In some cases, the molecules tend to further associate in layers. The
physical properties of the bulk system vary with the average alignment
of the director (Fig. 10). Large alignment tends towards anisotropic
materials while small alignment means loss of the orientational orders
and tends towards the isotropic materials.

Introduction 33
Figure 10. Preferential molecular alignments in liqu id crystals.
1.9. CLASSES OF THE LIQUID CRYSTALS
In liquid crystals, transitions to the mesophases may be brought
about by purely thermal processes or by the influence of the solvents.
Based on the physical parameters that control the entrance of mesogenic
compounds into mesophase, there are three distinct classes of liquid
crystals i.e. thermotropic LCs, lyotropic LCs and amphotropic or amphitropic LCs.
45
1.9.1. Thermotropic Liquid Crystals
In thermotropic liquid crystals (TLCs) or “thermotropics”,
transitions to the liquid crystalline states are induced by thermal
triggering of the mesogenic compound. The mesophase can be obtained
by either cooling an isotropic liquid below the clearing point or by
heating the solid mesogenic compound above its melting point, i.e. one
can arrive at the liquid crystalline state by raising the temperature of a
solid and/or lowering the temperature of a liquid. At much higher
temperature, the thermal motions destroy ordering of the mesophase and
transform the material into a conventional isotropic liquid phase. At
lower temperatures, most liquid crystal materials form a conventional
crystal.
The thermotropic liquid crystal may be monotropic, where a
particular mesophase can be achieved only from one direction
(irreversible process) in the thermal cycle usually upon cooling,46
or
enantiotropic, where a certain mesophase can be achieved either by
heating or cooling (reversible cycles) of the mesogen. Depending on the
34 Introduction
kind of bonding interactions, the mesogenic compound may be
ionic,47,48
metallomesogenic49-51
or supramolecular52,53
in nature. Many
thermotropic liquid crystals are polymorphic (shows polymorphism) and
exhibit a variety of different mesophases as a function of temperature. In
these cases a mesophase is obtained by heating or cooling from a different adjacent mesophase.
54
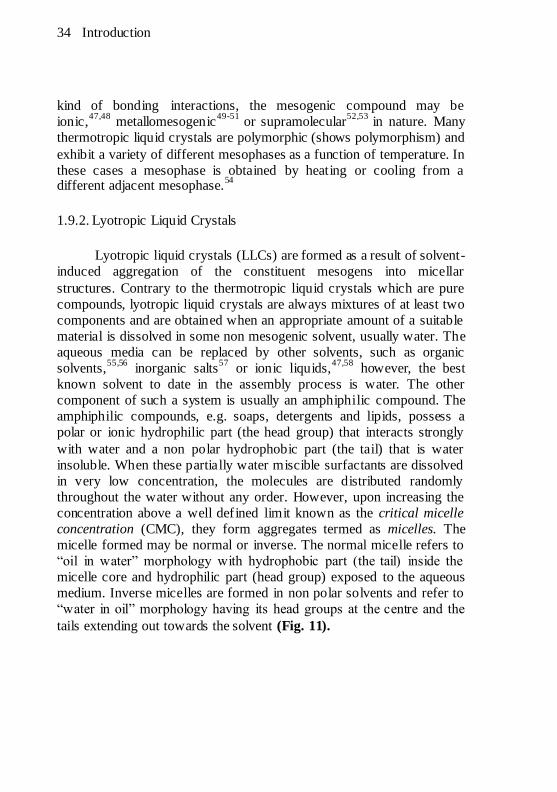
1.9.2. Lyotropic Liquid Crystals
Lyotropic liquid crystals (LLCs) are formed as a result of solvent-
induced aggregation of the constituent mesogens into micellar
structures. Contrary to the thermotropic liquid crystals which are pure
compounds, lyotropic liquid crystals are always mixtures of at least two
components and are obtained when an appropriate amount of a suitable
material is dissolved in some non mesogenic solvent, usually water. The
aqueous media can be replaced by other solvents, such as organic
solvents,55,56
inorganic salts57
or ionic liquids,47,58
however, the best
known solvent to date in the assembly process is water. The other
component of such a system is usually an amphiphilic compound. The
amphiphilic compounds, e.g. soaps, detergents and lipids, possess a
polar or ionic hydrophilic part (the head group) that interacts strongly
with water and a non polar hydrophobic part (the tail) that is water
insoluble. When these partially water miscible surfactants are dissolved
in very low concentration, the molecules are distributed randomly
throughout the water without any order. However, upon increasing the
concentration above a well defined limit known as the critical micelle
concentration (CMC), they form aggregates termed as micelles. The
micelle formed may be normal or inverse. The normal micelle refers to
“oil in water” morphology with hydrophobic part (the tail) inside the
micelle core and hydrophilic part (head group) exposed to the aqueous
medium. Inverse micelles are formed in non polar solvents and refer to
“water in oil” morphology having its head groups at the centre and the
tails extending out towards the solvent (Fig. 11).

Introduction 35
Figure 11. Cross sections of normal and reverse micelles formed by surfactants.
Although the micelles are formed in different sizes and shapes,
three types of them are important from perspective of liquid crystals, i.e.
disc shaped, rod like and spherical micelles.59
The shape and size of a
micelle is a function of the size and geometry of the surfactant
molecules,60
and solution conditions such as surfactant concentration,
temperature, pH, and ionic strength. These micelles are the building
blocks of the liquid crystalline phases. As the concentration increases
beyond the CMC, the micelles increase in size and eventually coalesce
to separate the newly formed liquid crystalline state from the solvent. In
these phases, the solvent molecules fill the space around (and/or in) the
structures to provide fluidity to the system. The driving force for the
formation of liquid crystalline phases of these amphiphilic molecules is
the micro-segregation of hydrophilic and hydrophobic molecular parts
into different regions.
Because lyotropics are comprised of at least two chemical
constituents, concentration is a much more important parameter
compared to temperature. However being in the form of solution, the
mesophase transitions in lyotropic liquid crystals are also sensitive to
other factors that affect the solution conditions e.g. temperature, pH,
ionic strength, counter ion polarizability and charge etc.61
Like
thermotropics, the lyotropic liquid crystals also exhibit polymorphism
and different phases can be observed as the concentration of the solution
is changed.62
36 Introduction
1.9.3. Amphotropic or Amphitropic Liquid Crystals
Another class of liquid crystal which has received special
attention is termed amphotropic or amphitropic.
63,64 Such particular
compounds termed as amphotorps, show mesomorphism in their pure
state on heating as well as form lyotropic mesophases on the addition of
an inorganic or organic solvent in certain amounts. However, the
mesophases observed in these two regimes are often quite different.65
Examples of such amphotropic molecules are amphiphilic polyhydroxy compounds and carbohydrate derivatives.
1.10. MOLECULAR STRUCTURES AND MESOPHASES OF THERMOTROPIC LIQUID CRYSTALS
The recipe for a compound to be mesogenic is geometrical
anisotropy at molecular level because compounds with pronounced
shape anisotropy are able to form mesophases with temperature
changes. The molecules need to possess some rigid as well as some
flexible groups. The presence of a central rigid core, usually aromatic
and conjugated systems, renders it the required r igidity which helps the
molecules in self assembling or self alignment. The flexible groups
(usually hydrocarbon chains) on the other hand, render some fluidity to
the system by promoting dispersive interactions between the
neighboring molecules due to their highly dynamic motions. A delicate
balance of molecular rigidity and flexibility is required to partially
acquire both the molecular alignment (orientational order) and fluidity at
certain temperature i.e. to give the mesophase. To ensure geometrical
anisotropy, molecular shape must be such that at least one axis is very
different from the other two. Mostly they have rod or disc shaped
molecules and classically thermotropic liquid crystals were classified as
calamitic and discotic liquid crystals. However molecules with shapes
other than rods or discs, e.g. lath-like, bent core, bowls etc, are also able
to form liquid crystals and recently novel classes are being added to
thermotropic liquid crystals. Now conventional thermotropic liquid
crystals are classified into calamitic, discotic, bent core and polymeric
LCs. Each of these classes have their own typical mesophases (i.e.
amount of order in the material) such as nematic, smectic, columnar,
cholesteric etc. Each mesophase possesses distinct opto-electronic properties which results in their characteristic optical texture.
66

Introduction 37
1.10.1. Thermotropic Calamitic Liquid Crystals
Calamitics are the most common type of LCs and they have cigar
or rod like elongated molecules in which one molecular axis is much
longer than the other two (Fig. 12). The rigid centre, which comprises
the molecular long axis, often consists of one or more aromatic rings
and usually long n-alkyl or alkoxy chain as the terminal end groups. The
aromatic rings may be connected to each other directly or through
linking groups like –CH2CH2-, -CH=N-, -C≡C-, -CH2O-, -COO- etc.
Sometimes small substituents (e.g. –Cl, –Br, –NO2, –CH3, –OCH3, –CN,
etc) may also be present as lateral substituents. The nature of the central
core, the linking groups, and the lateral substituents impart s ignificant
effect on the physical properties and mesophase morphology of the calamitic LCs.
67
Figure 12. General template of calamitic LCs where molecular length (l)>>
breadth (b).
The rod like polarizable core together with the flexible end chains
orient themselves such that their long axes are, on average, parallel to each other (along the director, n) and facilitate liquid crystal formation.
The most common types of mesophases exhibited by calamitic LCs are nematic, cholesteric and smectic phases.
1.10.1.1. Nematic Mesophase
The term nematic is derived from the Greek word nematos for
thread and relates to the thread-like texture of this mesophase observed
under polarizing optical microscope. Nematic mesophase (N) is closest
to the isotropic liquid (the least ordered) and the most frequently used

38 Introduction
mesophase in display devices. This phase possesses long-range orientational order but no long-range positional order (Fig. 13a).
1.10.1.2. Cholesteric Mesophase
The chiral version of nematic phase (N*) is comprised of the
chiral molecules and is more specifically called as cholesteric
mesophase because the first materials exhibiting this phase were
cholesterol derivatives. The cholesteric mesophase can also be achieved
by inducing chirality through the addition of a chiral dopant (not
necessarily mesogenic) in small amount to a nematic material.68
In such
cases, the chiral dopant creates a chiral environment for the achiral
nematic molecules causing a slight and gradual rotation of the director
and, as result, a chiral helical macrostructure with a specific temperature
dependent pitch is generated. Literally the cholesteric phase consists of
local nematic “layers”, which are continuously twisted with respect to
each other66
(Fig. 13b). As apparent from Fig. 13b, the pitch refers to
the distance along the helix over which the director rotates by 360o. The
helical structure selectively reflects the light of wavelength equal to its
pitch. The pitch length, and hence the reflected colors, are temperature
dependant and this correlation has been successfully utilized in
thermochromic thermometers and other devices that change color with
temperature.
Figure 13. Representation of molecular arrangements in (a) nematics phase (b)
helical macrostructure of chiral nematic or cholesteric phase.

Introduction 39
1.10.1.3. Smectic Mesophases
The smectic mesophases (Sm) are formed at temperatures below
the nematic phase and represent relatively more ordered phase
structures. They have lamellar or layered structures characterized by
arrangement of the molecules in the form of layers. In between the
layers, they have a well-defined interlayer spacing69
which can be
measured by X-ray diffraction. Within a layer, the molecules may
possess positional order (as in smectic B phase) so in addition to the
orientational order, the smectic phases also possess short range
positional order.70
The interlayer attractions are weaker compared to the
lateral forces between the molecules within a layer making the layers
able to s lide over one another relatively easily. This ease of sliding of
the layers renders fluid property to the more viscous smectic systems.
There are several types of smectic mesophases characterized by
molecular arrangements within and between the layers. They are
classified on the basis of angle between the director (n) and the layer
normal into orthogonal (no tilt, angle of 90o) and tilted (angle < 90
o)
smectic phases. Both the orthogonal and the tilted phases may have
ordered (structured layers) or random molecular arrangement
(unstructured layers) within the layers.45
Of the various well defined
smectic phases, SmA and SmC are the most commonly encountered.
Molecules in Sm A possess the least order amongst all smectic phases. It
is an orthogonal phase with director perpendicular to the layer planes
and with unstructured layers (Fig. 14a). The molecules posses very
short range positional order within the layer and there is no positional
correlation between the layers. The SmC phase has the same layer
structure as that of SmA but the molecules are tilted with respect to the
layer normal (Fig. 14b). In this phase too, there is no positional order
within and between the layers, i.e. both SmA and SmC posses
unstructured layers. The less common SmB, SmF, and SmI phases are
more ordered and the molecules in SmB posses hexagonal order within
the layers (Fig. 14c).

40 Introduction
Figure 14. Structural representation of (a) SmA (b) SmC (c) SmB viewed from
side (left) from top (right).
1.10.2. Thermotropic Discotic Liquid Crystals
Discotic liquid crystals (DLCs) are referred to the liquid crystals
formed by the disc shaped molecules and were first reported by
Chandrasekhar71
seventy years after the discovery of the calamitics.
Before this report, molecular linearity was considered to be an essential
requirement to exhibit mesomorphism.72
A typical discotic mesogen
generally consist a central aromatic core functionalized with peripheral
flexible chains (Fig. 15).
Figure 15. General template of the DLCs molecular architecture.
In beginning, small sized aromatic rings e.g. benzene, pyridine,
triazine were used as the central core.73
However later on, with the
discoveries that the individual molecules group up as columns via π-π
stacking and that the larger polyaromatic cores are more efficiently
stacked, the use of larger aromatic cores became more common. Today,
in addition to the small s ized aromatic rings, the typically used discotic
cores consist of polyaromatic systems like triphenylenes74
(6),
hexaazatr iphenylenes75
(7), tristriazolotr iazines
76 (8) and porphyrines
77
(9) to name few of the many known systems78
(Fig. 16). Moreover,
macromolecules with much larger dimensions like polyaromatic

Introduction 41
hydrocarbons and macrodiscotic material with extended planar
structures79
have also been exploited as discotic cores.
Figure 16. Aromatic cores commonly used in discotic mesogens, triphenylene
(6), hexaazatriphenylene (7), tristriazolotriazine (8), porphyrine (9).
A characteristic feature of the discotic liquid crystals is stacking
of the individual molecules to form columns which act as the basic units
of their most typical columnar mesophases. Depending on the details of
the intra-columnar interactions, different types of stackings are observed
like “disordered columns” with an irregular stacking of the disks,
“ordered columns” in which the central cores are stacked in a regularly
ordered (equidistant) fashion while the f lexible tails are still disordered,
and “tilted columns” where the cores of the disks are tilted with respect
to the column axis (Fig. 17).
Figure 17. Stacking of discotics into different kinds of columnar assemblies: (a)
ordered column, (b) and (c) disordered columns, (d) helical column, and (e)
tilted column.80
These columns can self organize and serve as the structural units
of the different types of columnar mesophases, typical of the discotic
liquid crystals. Four types of mesophases are formed by the individual
discs or columns, i.e. columnar, nematic, smectic and cubic.80
Of them,

42 Introduction
columnar and nematic phases are the most common and well defined,
whereas the smectic and cubic phases are rarely observed.
81 In the
smectic phase, also known as discotic lamellar phase (DL), the discs are
arranged in a layered fashion separated by sub-layers of peripheral
chains and are formed when there is a reduced number or an uneven
distribution of peripheral chains.82
Most of the discotics exhibit only one
type of mesophase and fewer examples of DLCs showing polymorphism are known.
83
1.10.2.1. Columnar Mesophases of Discotic Liquid Crystals
Columnar phases are the most common mesophases of DLCs. In
these phases, the columns (ordered, disordered or tilted) formed by
piling up of the discotic molecules self organize themselves parallel to
each other in various fashions like hexagonal, tetragonal, oblique etc.84
Seven types of columnar mesophases are found80
depending on the
degree of order in the molecular stacking and inter-columns
orientations, out of them the structural arrangements of columnar
hexagonal, columnar rectangular and columnar oblique mesophases are
well defined. Columnar hexagonal phase (Colh) is characterized by a
hexagonal packing (Fig. 18a) of the stacked columns. In the columnar
rectangular mesophase (Colr), the columns are packed in a rectangular
fashion (Fig. 18b) surrounded by the disordered aliphatic chains. In the
columnar oblique mesophase (Colob), tilted columns are involved that
are arranged with an oblique unit cell (Fig. 18c).
Figure 18. Structural representations of the well defined columnar phases (a)
columnar hexagonal Colh, (b) columnar rectangular Colr and (c) columnar
oblique Colob.
Introduction 43
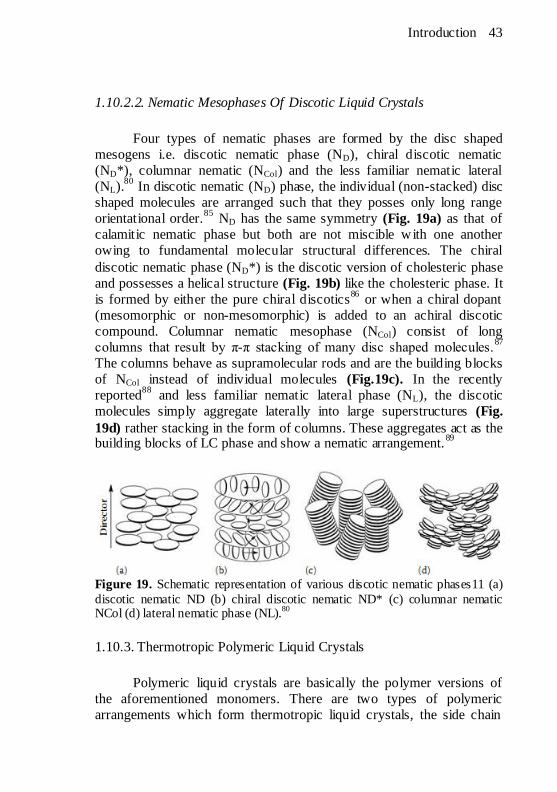
1.10.2.2. Nematic Mesophases Of Discotic Liquid Crystals
Four types of nematic phases are formed by the disc shaped
mesogens i.e. discotic nematic phase (ND), chiral discotic nematic
(ND*), columnar nematic (NCol) and the less familiar nematic lateral
(NL).80
In discotic nematic (ND) phase, the individual (non-stacked) disc
shaped molecules are arranged such that they posses only long range
orientational order.85
ND has the same symmetry (Fig. 19a) as that of
calamitic nematic phase but both are not miscible with one another
owing to fundamental molecular structural differences. The chiral
discotic nematic phase (ND*) is the discotic version of cholesteric phase
and possesses a helical structure (Fig. 19b) like the cholesteric phase. It
is formed by either the pure chiral discotics86
or when a chiral dopant
(mesomorphic or non-mesomorphic) is added to an achiral discotic
compound. Columnar nematic mesophase (NCol) consist of long
columns that result by π-π stacking of many disc shaped molecules.87
The columns behave as supramolecular rods and are the building blocks
of NCol instead of individual molecules (Fig.19c). In the recently
reported88
and less familiar nematic lateral phase (NL), the discotic
molecules simply aggregate laterally into large superstructures (Fig.
19d) rather stacking in the form of columns. These aggregates act as the building blocks of LC phase and show a nematic arrangement.
89
Figure 19. Schematic representation of various discotic nematic phases11 (a)
discotic nematic ND (b) chiral discotic nematic ND* (c) columnar nematic NCol (d) lateral nematic phase (NL).
80
1.10.3. Thermotropic Polymeric Liquid Crystals
Polymeric liquid crystals are basically the polymer versions of
the aforementioned monomers. There are two types of polymeric
arrangements which form thermotropic liquid crystals, the side chain

44 Introduction
and the main-chain polymers (Fig. 20). In side-chain polymers,90
the
mesogenic units are attached to the polymer backbone by more or less
flexible chains. In main-chain polymers, the mesogenic units are
incorporated into the polymer backbone and separated from each other
by flexible spacer chains.91
Figure 20. Structural representation of (a) main chain and (b) branched chain or comb shaped polymeric liquid crystals.
The flexibility in chains (spacers) is necessary to provide a
certain freedom to mesogenic moieties to form an ordered structure.92
Formation of nematic or smectic phase is quite natural for side chain
polymeric mesogens because mesogenic units can easily be arranged
parallel to each other. The main chain polymers require long enough
flexible spacers between the mesogenic groups to form nematic and even smectic phases (Fig. 21).
93
Figure 21. Packing of main chain polymer mesogenic groups in (a) nematic and
(b) smectic A phases.93

Introduction 45
1.10.4. Non Conventional Liquid Crystals
In classical approach of thermotropic liquid crystals, only cigar or
disc shaped structures can produce liquid crystalline phases. However,
the fundamental requirement for mesogenity is molecular anisotropy
and many compounds with non conventional molecular shapes (other
than rod or disc) are known to show mesomorphism.94
Liquid crystals
formed by compounds with molecules that are neither rod nor disc
shaped are collectively termed as non conventional liquid crystals.
Theoretically, the non conventional LCs may present mesophases
other than those of the conventional calamitics and discotics because the
type of mesophase is determined by the molecular shape to a large
extent.95
Changing the shape of the r igid segments from classical rod or
disc to other geometries leads to quite unusual mesophase
morphologies96
distinct from the conventional smectic and columnar
mesophases of the classical rod and disc-like molecules.97
For example
some achiral bent shaped compounds that are neither perfectly linear nor
discotic can form mesophases with chiral properties. A brief note about
such liquid crystals is given in the index section. Examples of liquid
crystals with non-conventional molecular topology include multiarm
star-shaped,98,99
board-like molecules with molecular structures at
borderline between calamitic and discotic,100
polycatenars,101,102
shuttlecock shaped,103,104
cone shaped,105
ring shaped mesogens forming
tubular liquid crystals106
and other molecules that combine features of
both the rods and discs. Figure 22 shows some representative examples of the non conventional liquid crystals.

46 Introduction
Figure 22. Molecular shapes of some non conventional LCs distorted away
from rod and disc shapes.
1.11. FUNCTIONALIZATION OF THE LIQUID CRYSTALS
Future technological developments require multifunctional
materials where several physical properties are met in a s ingle material.
Liquid crystals are multifunctional material because in addition to their
unique property of being both dynamic (soft) as well as ordered, they
can be functionalized by different ways.107
Functionalization means
rendering a stimulus-responsive desirable property (e.g. electric, optical,
magnetic, luminescence etc) to the material for practical applications.
Due to the anisotropic nature of LCs, these additional properties are
directional and such systems can be used in ordered functional material.
For example, the presence of electroactive moieties in mesomorphic
molecules result in compounds with anisotropic (directional) electrical
and electrochemical properties108
that can be used in developing new
electroactive materials.109
Similarly ionic liquid crystals, due to the
presence of charges, combine the properties of liquid crystals
(anisotropy) and ionic liquids i.e. low vapor pressure, high solubilizing
power and ion conductivity. Combination of anisotropic and ionic
properties makes ionic liquid crystals very promising candidates to
design ion-conductive materials.47
An intelligent and useful approach to LC functionalization is the
insertion of a photo-isomerizable group to control molecular alignment
by means of photoirradiation. For example, the azo group (-N=N-)
undergoes reversible cis-trans photoisomerization and its insertion in a
liquid crystal have shown to help control the molecular alignment
through photo-irradiation. When the molecule is in the
thermodynamically stable trans configuration, the high discotic

Introduction 47
anisometry promotes a columnar hexagonal mesophase. After photo-
isomerization to the cis- configuration, the material becomes an
isotropic liquid (Fig. 23). This controlling mechanism of the molecular
alignment makes them promising candidates as optical switch for controlling the conductivity in electro-optical devices.
110
Figure 23. Illustration of cis-trans photoisomerization and consequent
mesophase change.
Another common approach for LC functionalization is through
the self-assembly of the rationally designed liquid crystals via non
covalent interactions (especially hydrogen bonding)111
into
supramolecular liquid crystals with more complex but well-defined
structures and new functions107
(Fig. 24). One of the specific features of
supramolecular liquid crystals is their dynamic structures due to
involvement of weaker non covalent interactions.112
The molecular order
in these states can be switched on/off by external stimuli such as thermal
treatment, light irradiation, electric fields etc. Moreover, these
supramolecular LC assemblies show reversible mesomorphic–isotropic
phase transitions as a result of reversible formation and breaking of the
hydrogen bonds. Such systems can be used to prepare stimuli-responsive
113 dynamic material.

48 Introduction
Figure 24. Self assembly of non-mesogenic components into supramolecular
liquid-crystal.107
Another useful approach to LC functionalization is to control LC
alignments and properties by doping with stimuli (thermal, electric,
optical etc.) responsive dopants. For example, the properties of LCs can
be reversibly photo-regulated by doping LCs with photochromic
compounds. Photo chromic dopants e.g. spiroxazine,114
diarylethene,115
fulgide,116
thioindigo,117
azobenzene etc, undergo reversible changes of
their molecular structures through photo-radiations. Due to the dopant-
LC molecular interactions, structural changes of the dopants induce
changes in the LC alignments (Fig. 25). This provides a mechanism to
reversibly regulate the various LC properties and functionalizing for
various optical applications.118
Figure 25. Schematic representation of light induced alignment changes in LCs
doped with photochromic compound and potential applications of the doped system.

Introduction 49
1.12. A BRIEF REVIEW OF THE 2,1,3-BENZOTHIADIAZOLE
The 2,1,3-benzothiadiazole (10) is an aromatic heterocycle with a
planar molecular structure. The non-bonding electron pair of the sulfur
atom makes part of the aromatic system making it electron deficient. It
is an efficient luminescence precursor and its derivatives with extended
conjugation are intensely fluorescent, usually with high quantum
yields.119
Depending on the type of substituents and conjugation length,
the 2,1,3-benzothiadiazole based materials emit a variety of different
colors including green,120
red121
and blue,122
the three fundamental
colors for full-color displays. Due to its rigid planar structure, ability to
form well-ordered crystals and its significant polarizability leading to
intermolecular interactions such as heteroatom-heteroatom contact and
π-π interactions, we have successfully used this system as the central
core for luminescent liquid crystals.123-125
Linking an electron deficient aromatic system to electron rich
systems in alternative fashion leads to a donor-acceptor-donor
combination with enhanced intramolecular charge transfer. Due to its
electron-deficient nature, the 2,1,3-benzothiadiazole have been used
extensively as an accepter unit in many π conjugated systems especially
in donor-acceptor conjugated copolymers.126
This enhanced charge
transfer from electron-rich units to electron deficient 2,1,3-
benzothiadiazole moieties in donor-acceptor conjugated copolymers,127
lowers the band gap (HOMO-LUMO) significantly resulting in small
bang gap or even ultrasmall band gap128
material. Such low band gap
systems are very responsive to external optical and/or electrical stimuli
and are highly desirable for use in solar cells,129
light emitting diodes,130
field-effect transistors
131 etc.
1.13. A BRIEF REVIEW OF THE 2,1,3-BENZOXADIAZOLE
The 2,1,3-benzoxadiazole heterocycle more specifically known as
benzofurazan (11) is the oxygen containing analogue of 2,1,3-
benzothiadiazole (10). It also possesses a planar and conjugated bicyclic
molecular structure (Fig. 26) and its derivatives with extended
conjugation are highly fluorescent. Due to the presence of oxygen in the
heterocycle, the benzofurazan is more electronegative (more electron
deficient) compared to 2,1,3-benzothiadiazole.

50 Introduction
Figure 26. Molecular structures of the 2,1,3-benzothiadiazole (10), 2,1,3-benzoxadiazole (11) and thiophene (12).
The major application of benzofurazan heterocycle is in the
design of various f luorescent derivatization reagents possessing
benzofurazan structure132
that are used as fluorogenic pre-column
labeling reagents for amino acids and peptides analys is,133
HPLC
separation of enantiomers by converting to diastereomers134
and heavy
metals detection.135
Recently the benzooxadiazole system has been used
as an acceptor (electron deficient) unit in a π-conjugated donor-acceptor
copolymer for potential application in organic solar cells136
and in small
molecular low band gap linear137
and star-shaped138
D-π-A-π-D
structured organic dyes for solution-processable organic photovoltaic
cells. However contrary to its sulfur containing analog, i.e. 2,1,3-
benzothiadiazole, the benzofurazan derivatives are rarely reported for such kind of applications.
127
1.14. A BRIEF LITERATURE REVIEW OF THE THIOPHENE
Thiophene is a well known heteroaromatic compound with a five-
membered flat ring. Being electron rich (six electrons delocalized over
five atoms), it undergoes a range of electrophilic substitutions with
preference for the 2- and 5-positions, i.e. adjacent to the heteroatom.
Halogenations give initially 2-halo derivatives followed by 2,5-
dihalothiophenes. Conjugated polymers are important materials for the
development of new technologies in electronics and optoelectronics.
Due to their chemical stability and synthetic versatility, thiophenes are
ideal building blocks in transition metal-catalyzed cross-coupling
reactions for the synthesis of most thiophene-based materials, in
particular oligo- and polythiophenes.139
Polythiophenes display the most
unique combination of effic ient electronic conjugation, chemical
stability, high environmental stability of both its doped and undoped

Introduction 51
states and solution processability.140
The high polarizability of the sulfur
atom in thiophene rings leads to stabilization of the conjugated chain
and excellent charge transport properties141
important for their
applications such as thin-film transistors, conductors and organic
semiconductors. Besides their extensive applications in the field of
conducting polymers, the thiophene unit has also been used in the field
of liquid crystals.142-144

52 Introduction

Objectives 53
2. OBJECTIVES
"Management by objectives works if you
first think through your objectives"
Peter F. Drucker

54 Objectives
As discussed previously, compounds that present mesomorphism
and luminescence possess great technological applications. This have
greatly boosted up the design and synthesis of new organic compounds
with suitable structures for potential applications in developing a variety
of functional materials. In this context, the objective of this thesis work
is the synthesis and characterization of some new luminescent and
mesomorphic compounds. These compounds are derived from the 2,1,3-
benzothiadiazole, 2,1,3-benzoxadiazole and thiophene heterocycles as
the central units because these heterocycles have already shown their potential for generating luminescent and/or mesomorphic properties.
The specific objectives of this work include:
Syntheses of new luminescent compounds derived from the 2,1,3-
benzoxadiazole and 2,1,3-benzothiadiazole heterocycles with
molecular structures shown in scheme 1.
Syntheses of new bent shaped liquid crystals based on the 2,5-
disubstituted thiophene with molecular structures shown in scheme
2.
Structural characterization of the intermediate and final compounds
through melting point, infrared spectroscopy (IR), hydrogen and
carbon nuclear magnetic resonance spectroscopies (1HNMR,
13CNMR) and mass spectrometry (MS).
Studies of the thermal and mesomorphic properties (if presented) of
the final compounds through DSC, TGA and POM.
Investigation of the photophysical properties of the final compounds
by using UV-Vis absorption and emission techniques and
calculation of their molar absorptivity coefficients, stokes shifts,
relative quantum yields and optical bandgaps.
Studies of the electrochemical behaviour and calculation of the
redox potentials, energies of the frontier orbitals (EHo mo, ELumo) and
electrical bandgap of the final compounds by using cyclic
voltammetry.
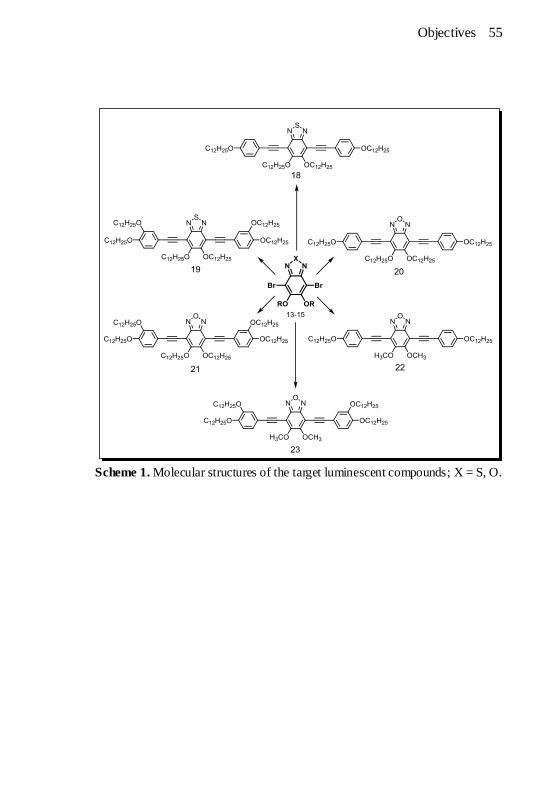
Objectives 55
Scheme 1. Molecular structures of the target luminescent compounds; X = S, O.

56 Objectives
Scheme 2. Molecular structures of the target luminescent liquid crystals; R =
C12H25.
Results and discussion 57
3. RESULTS AND DISCUSSION
To present and discuss the results in a precise way, this section is
divided in two parts. Part A presents the syntheses and structural
characterization of luminescent compounds containing 2,1,3-
benzoxadiazole and 2,1,3 benzothiadiazole as the central units along
with discussion of the results obtained from their optical and
electrochemical analys is. In part B, the syntheses and characterizations
of thiophene based luminescent liquid crystals and their mesomorphic and optical properties are presented and discussed.

58 Results and discussion
Part A
3.1. Syntheses and Characterization of Luminescent Compounds
Containing 2,1,3-Benzoxadiazole and 2,1,3 Benzothiadiazole and Their Optical and Electrochemical Properties
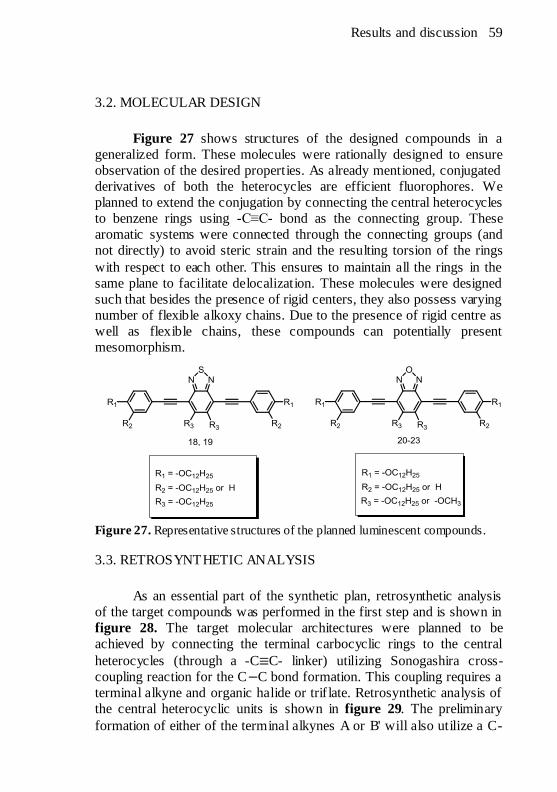
Results and discussion 59
3.2. MOLECULAR DESIGN
Figure 27 shows structures of the designed compounds in a
generalized form. These molecules were rationally designed to ensure
observation of the desired properties. As already mentioned, conjugated
derivatives of both the heterocycles are efficient fluorophores. We
planned to extend the conjugation by connecting the central heterocycles
to benzene rings using -C≡C- bond as the connecting group. These
aromatic systems were connected through the connecting groups (and
not directly) to avoid steric strain and the resulting torsion of the rings
with respect to each other. This ensures to maintain all the rings in the
same plane to facilitate delocalization. These molecules were designed
such that besides the presence of rigid centers, they also possess varying
number of flexible alkoxy chains. Due to the presence of rigid centre as
well as flexible chains, these compounds can potentially present
mesomorphism.
Figure 27. Representative structures of the planned luminescent compounds.
3.3. RETROSYNTHETIC ANALYSIS
As an essential part of the synthetic plan, retrosynthetic analysis
of the target compounds was performed in the first step and is shown in
figure 28. The target molecular architectures were planned to be
achieved by connecting the terminal carbocyclic rings to the central
heterocycles (through a -C C- linker) utilizing Sonogashira cross-
coupling reaction for the C C bond formation. This coupling requires a
terminal alkyne and organic halide or trif late. Retrosynthetic analysis of
the central heterocyclic units is shown in figure 29. The preliminary
formation of either of the terminal alkynes A or B' will also utilize a C-

60 Results and discussion
C bond formation for incorporation of the -C C- moiety. The alkoxide
chains can be incorporated through the base catalyzed C O bond
formation between phenols and haloalkanes through Williamson
etherification.
Figure 28. Retrosynthetic analysis of the target luminescent compounds.
3.4. SYNTHETIC PLAN
As also shown in the retrosynthetic analysis, the target
fluorescent derivatives of the 2,1,3-benzothiadiazole and 2,1,3-
benzoxadiazole (18 - 23) can be accessed by two routes. Both these
routes utilize the Sonogashira C C coupling reaction as the key
synthetic step to incorporate the acetylene moiety as the spacer unit
between the central heterocycle and the terminal aromatic rings. Both
the possible synthetic routes are shown in detailed synthetic schemes 3
and 4. In route A, the acetylene functionality comes from the
carbocyclic intermediates (16, 17) and they couple with the bromine
Results and discussion 61
functionalized heterocycles (13 - 15) to furnish the target compounds. In
route B, the functionalization and reaction sequence is reversed, i.e. the
products are formed by coupling between the acetylene functionalized
heterocycles (24 - 26) with the bromine functionalized carbocycles 27
and 28. Route A was followed in this work as it is more preferable than
route B in two ways. First, the route A involves fewer steps than the
route B to make the substrates for the final step. The second and more
important reason is the probable instability of the heterocyclic diynes 24
- 26, since a closer analogue is reported to be only temporarily stable
and darkens in the air in few minutes.119,145
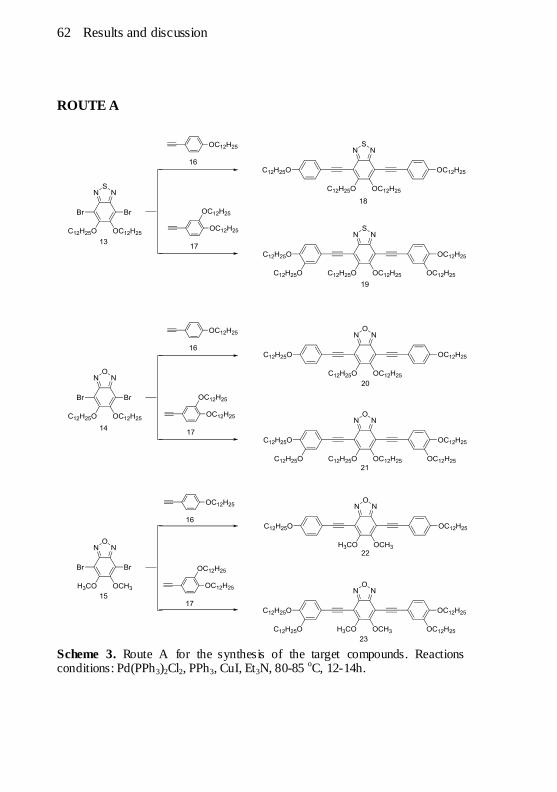
62 Results and discussion
ROUTE A
Scheme 3. Route A for the synthesis of the target compounds. Reactions conditions: Pd(PPh3)2Cl2, PPh3, CuI, Et3N, 80-85
oC, 12-14h.
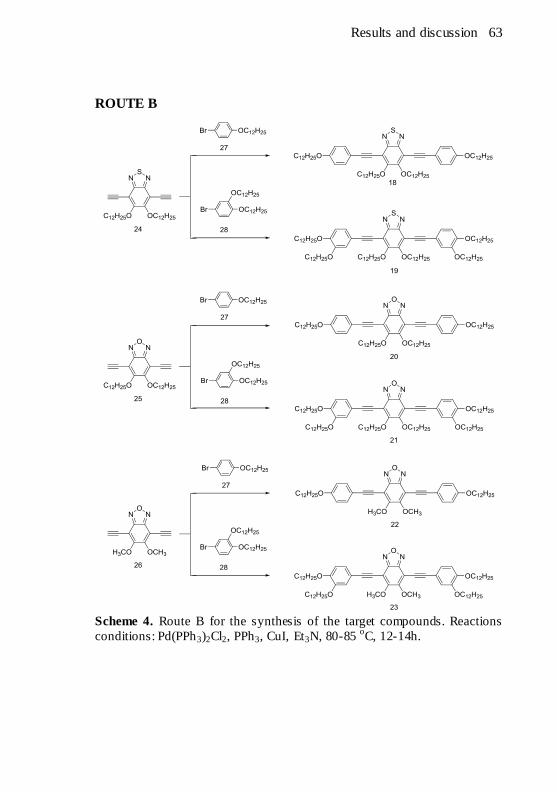
Results and discussion 63
ROUTE B
Scheme 4. Route B for the synthesis of the target compounds. Reactions
conditions: Pd(PPh3)2Cl2, PPh3, CuI, Et3N, 80-85 oC, 12-14h.

64 Results and discussion
3.4.1. Syntheses and Characterizations of The Central Cores
Retrosynthetic analysis of the heterocycles is shown in figure 29.
The synthesis utilize commercial catechol as the starting material and
the synthetic steps include formation of the ether linkage via the
Williamson etherif ication, nitration of the aromatic ring, nitro group
reduction and subsequent cyclization. The final step is bromine
functionalization of the heterocycle for the final Sonogashira coupling.
Figure 29. Retrosynthetic analysis of the central heterocycles.
A detailed route to the synthesis of the heterocycles is shown in
scheme 5. Catechol 29 was alkylated to 1,2-bis(dodecyloxy)benzene
30a with improved yield by a slight experimental and work-up
modification of the procedure described in the literature.146
The
compound 30a was nitrated to 1,2-bis(dodecyloxy)-4,5-dinitrobenzene
31a at room temperature by stirring it with HNO3-H2SO4 as the nitrating
mixture, a procedure already described for an analogous
transformation.147
Veratrol (30b) was formed by the methylation of
catechol using iodomethane as the methylating agent in the presence of
base. When the same nitration protocol of using HNO3-H2SO4 as the
nitrating mixture was attempted to transform veratrol to 4,5-
dinitroveratrol (31b), trinitration occured and 3,4,5-trinitroveratrol (31c)
was formed. This is probably due to the fact that unlike in 30a, the ortho
positions in 30b are sterically less hindered due to small s ize of the
methoxy groups. The desired transformation to 31b was then achieved
under milder conditions using 70% aqueous nitric acid as nitration
mixture.148
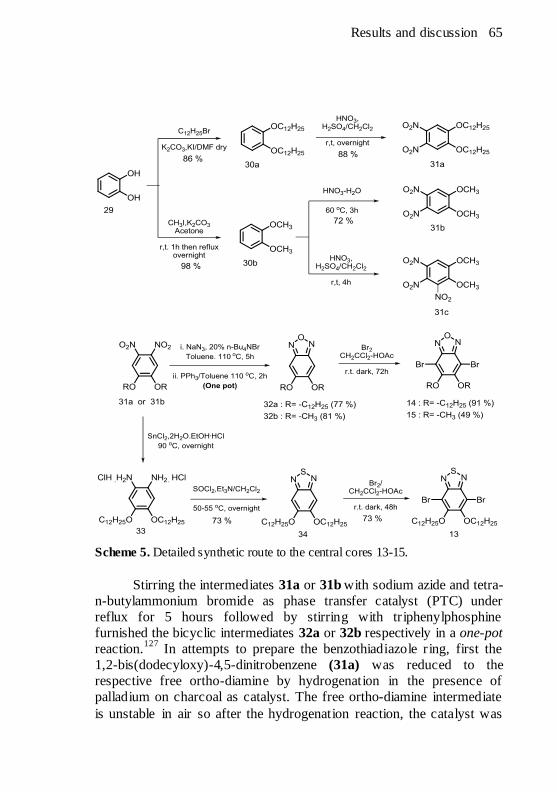
Results and discussion 65
Scheme 5. Detailed synthetic route to the central cores 13-15.
Stirring the intermediates 31a or 31b with sodium azide and tetra-
n-butylammonium bromide as phase transfer catalyst (PTC) under
reflux for 5 hours followed by stirring with tr iphenylphosphine
furnished the bicyclic intermediates 32a or 32b respectively in a one-pot
reaction.127
In attempts to prepare the benzothiadiazole r ing, first the
1,2-bis(dodecyloxy)-4,5-dinitrobenzene (31a) was reduced to the
respective free ortho-diamine by hydrogenation in the presence of
palladium on charcoal as catalyst. The free ortho-diamine intermediate
is unstable in air so after the hydrogenation reaction, the catalyst was
66 Results and discussion
filtered off and the diamine was directly reacted with thionyl chloride
under argon to give the cyclized product (34). This route resulted in low
yield and the product was purified through column chromatography.
Alternative route in which the nitro groups of 31a were reduced with tin
chloride to the diammonium salt (33) and subsequently cyclized with
thionyl chloride was found to work well in this case. This route
furnished the same target compound (34) with improved yield and the
product was more easily purif ied through recrystallization from ethyl
alcohol. The sulfur containing analogue of compound 15 could not be
synthesized because attempts to cyclize 31b using both the SnCl2
reduction-cyclization and hydrogenation-cyclization routes led to a solid
residue that was insoluble in all common organic solvents as well as in
water and was not characterized. Finally, the cyclized products (34, 32a
and 32b) were functionalized for the final cross-coupling step by their
bromination with bromine in the dark.
Structures of the heterocyclic intermediates were characterized
mainly by the 1H-NMR spectroscopy. Figure 30 shows a comparison of
the 1H-NMR spectra of 34 and 13 as representative of the spectral
changes accompanying the bromination step. The 1H-NMR spectra of
non-halogenated intermediates (34, 32a and 32b) contain aromatic
singlets which disappear after bromination. The spectra of the
halogenated intermediates (13-15) contain only peaks of the ethereal
groups with a characteristic peak around 4 ppm corresponding to the α
hydrogens of the ethereal chains.
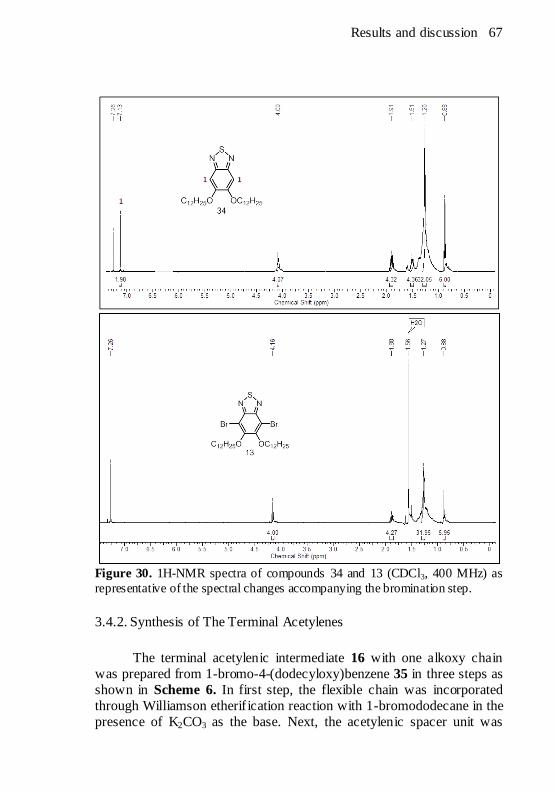
Results and discussion 67
Figure 30. 1H-NMR spectra of compounds 34 and 13 (CDCl3, 400 MHz) as
representative of the spectral changes accompanying the bromination step.
3.4.2. Synthesis of The Terminal Acetylenes
The terminal acetylenic intermediate 16 with one alkoxy chain
was prepared from 1-bromo-4-(dodecyloxy)benzene 35 in three steps as
shown in Scheme 6. In first step, the flexible chain was incorporated
through Williamson etherif ication reaction with 1-bromododecane in the
presence of K2CO3 as the base. Next, the acetylenic spacer unit was
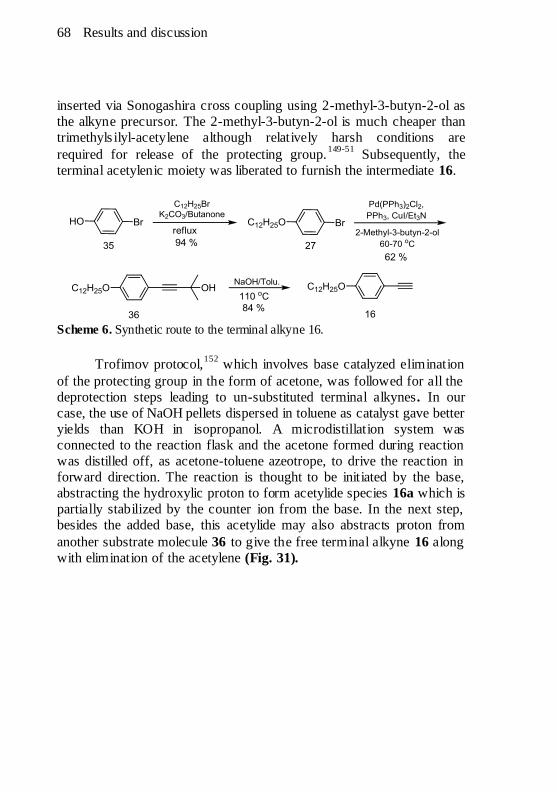
68 Results and discussion
inserted via Sonogashira cross coupling using 2-methyl-3-butyn-2-ol as
the alkyne precursor. The 2-methyl-3-butyn-2-ol is much cheaper than
trimethyls ilyl-acetylene although relatively harsh conditions are
required for release of the protecting group.149-51
Subsequently, the
terminal acetylenic moiety was liberated to furnish the intermediate 16.
Scheme 6. Synthetic route to the terminal alkyne 16.
Trofimov protocol,152
which involves base catalyzed elimination
of the protecting group in the form of acetone, was followed for all the
deprotection steps leading to un-substituted terminal alkynes. In our
case, the use of NaOH pellets dispersed in toluene as catalyst gave better
yields than KOH in isopropanol. A microdistillation system was
connected to the reaction flask and the acetone formed during reaction
was distilled off, as acetone-toluene azeotrope, to drive the reaction in
forward direction. The reaction is thought to be initiated by the base,
abstracting the hydroxylic proton to form acetylide species 16a which is
partially stabilized by the counter ion from the base. In the next step,
besides the added base, this acetylide may also abstracts proton from
another substrate molecule 36 to give the free terminal alkyne 16 along
with elimination of the acetylene (Fig. 31).

Results and discussion 69
Figure 31. Proposed mechanism of the alkyne deprotection step.
The intermediate 17 possessing two flexible chains was
synthesized from commercial catechol i.e. 1,2-dihydroxybenzene (29)
according to scheme 7. In first step, the two chains were incorporated
by alkylation of both the hydroxy groups through the Williamson
etherification in dry dimethyl sulfoxide (DMF) at inert atmosphere. The
30a was next mono-brominated by reacting with N-bromosuccinimide
(NBS), a mild brominating agent to avoid multiple bromination. The
common silica gel was used as the acid catalyst in this step. Next, the
acetylene moiety insertion and subsequent deprotection, by the same
procedures used in the case of compound 16 preparation, led to the
target compound 1,2-bis(dodecyloxy)-4-ethynylbenzene 17.
Scheme 7. Synthetic route to 3,4-didodecyloxyphenylacetylene 17.
The 1H-NMR spectra of all the products from the Sonogashira
reactions show a characteristic six protons singlet around 1.6 ppm
corresponding to the two methyl groups of the acetylene protecting
group. After deprotection step, this singlet disappears and the 1H-NMR
spectra of the liberated terminal alkynes 16 and 17 show a characteristic
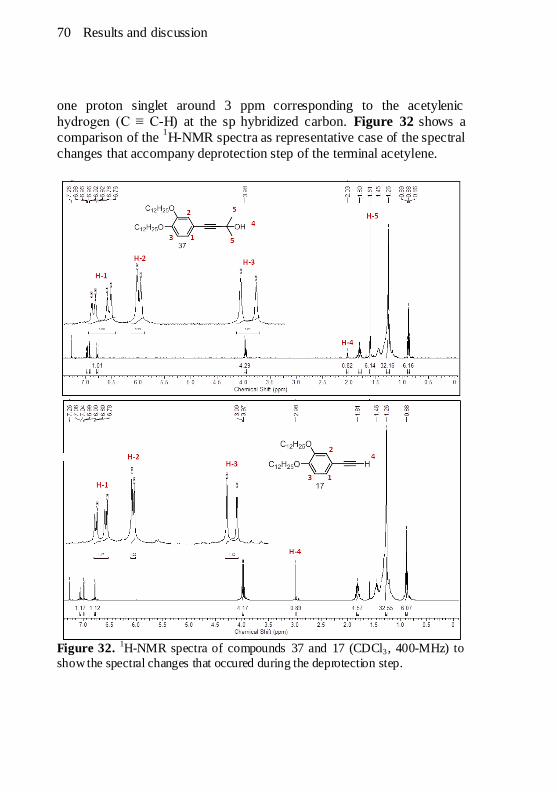
70 Results and discussion
one proton singlet around 3 ppm corresponding to the acetylenic
hydrogen (C ≡ C-H) at the sp hybridized carbon. Figure 32 shows a
comparison of the 1H-NMR spectra as representative case of the spectral
changes that accompany deprotection step of the terminal acetylene.
Figure 32.
1H-NMR spectra of compounds 37 and 17 (CDCl3 , 400-MHz) to
show the spectral changes that occured during the deprotection step.

Results and discussion 71
Structures of the terminal alkynes 16 and 17 were also
characterized by the IR spectroscopy. Their IR spectra showed a typical
sharp band near 3310 cm-1
characteristic of the alkyne C-H bond stretch
(νC ≡ C-H). The other prominent stretching bands include two closely
located strong bands at 2923 cm-1
and 2853 cm-1
corresponding
(respectively) to asymmetrical and symmetrical sp3 C-H stretching of
the methylene groups and a weak and sharp band near to 2108 cm-1
referring to C-C stretching (νC ≡ C) of the triply bonded carbon atoms
(Fig. 33).
Figure 33. The IR spectrum of 1,2-bis(dodecyloxy)-4-ethynylbenzene 17 (in
KBr disc) with characteristic bands.
3.4.3. Synthesis of The Final Compounds
As already mentioned, Sonogashira cross coupling of the
acetylenes 16 and 17 with the halogen functionalized heterocycles 13-15
was used as the final and key step to furnish the target compounds. The
Sonogashira reactions usually involve the sp2
- sp coupling reaction
between aryl or alkenyl halides or triflates and terminal alkynes in the
presence of Pd and copper (I) iodide and an amine as a base and as a
solvent. The general reactivity order of the sp2 species is vinyl iodide >
vinyl trif late > vinyl bromide > vinyl chloride > aryl iodide > aryl
triflate > aryl bromide > aryl chloride. Although this reaction is widely
used in the field of organic chemistry for the syntheses of a variety of
molecular structures as natural products, pharmaceuticals and molecular

72 Results and discussion
organic materials, the exact mechanistic details such as nature of the
catalytically active species, role of the added CuI remain unknown.153,154
This is mainly due to the difficulty to isolate and characterize the
organometallic intermediates from the reaction mixtures to validate a
mechanism beyond any doubt. The generally accepted mechanism is shown in scheme 8.
Scheme 8. Mechanistic depiction of the alkyne homocoupling during catalyst
activation.
All the final steps leading to the target fluorescent and
mesomorphic compounds are summarized in a generalized fashion in
scheme 9. The final steps gave poor isolated yields (30-52 %). The poor
isolated yields can be explained by considering several factors including
difficulties in complete purif ication, the occurrence of incomplete
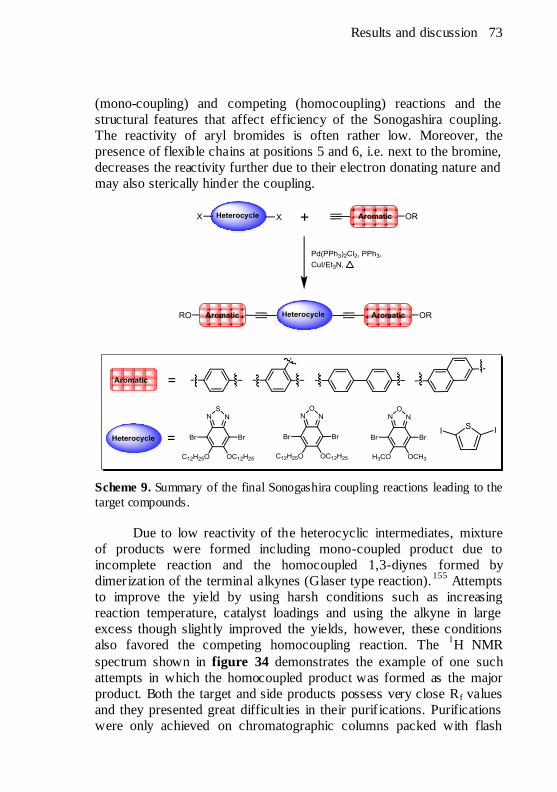
Results and discussion 73
(mono-coupling) and competing (homocoupling) reactions and the
structural features that affect efficiency of the Sonogashira coupling.
The reactivity of aryl bromides is often rather low. Moreover, the
presence of flexible chains at positions 5 and 6, i.e. next to the bromine,
decreases the reactivity further due to their electron donating nature and
may also sterically hinder the coupling.
Scheme 9. Summary of the final Sonogashira coupling reactions leading to the
target compounds.
Due to low reactivity of the heterocyclic intermediates, mixture
of products were formed including mono-coupled product due to
incomplete reaction and the homocoupled 1,3-diynes formed by
dimerization of the terminal alkynes (Glaser type reaction).155
Attempts
to improve the yield by using harsh conditions such as increasing
reaction temperature, catalyst loadings and using the alkyne in large
excess though slightly improved the yields, however, these conditions
also favored the competing homocoupling reaction. The 1H NMR
spectrum shown in figure 34 demonstrates the example of one such
attempts in which the homocoupled product was formed as the major
product. Both the target and side products possess very close Rf values
and they presented great difficulties in their purif ications. Purifications
were only achieved on chromatographic columns packed with flash
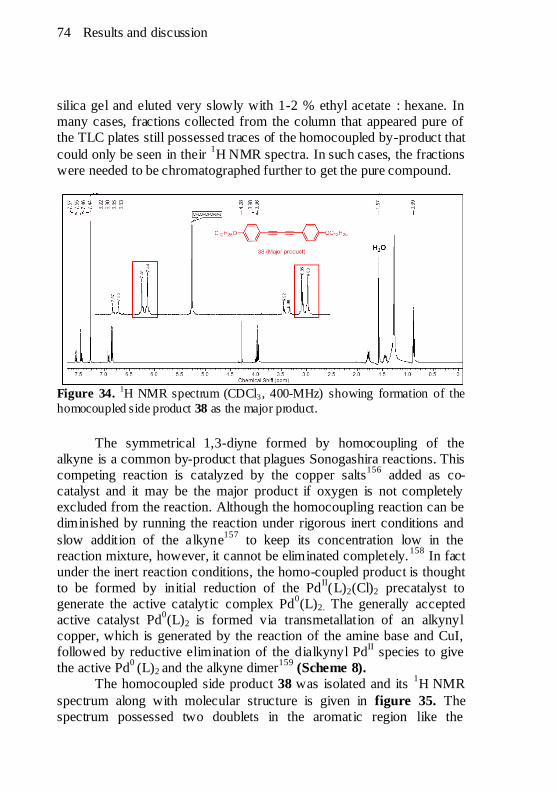
74 Results and discussion
silica gel and eluted very slowly with 1-2 % ethyl acetate : hexane. In
many cases, fractions collected from the column that appeared pure of
the TLC plates still possessed traces of the homocoupled by-product that
could only be seen in their 1H NMR spectra. In such cases, the fractions
were needed to be chromatographed further to get the pure compound.
Figure 34.
1H NMR spectrum (CDCl3 , 400-MHz) showing formation of the
homocoupled side product 38 as the major product.
The symmetrical 1,3-diyne formed by homocoupling of the
alkyne is a common by-product that plagues Sonogashira reactions. This
competing reaction is catalyzed by the copper salts156
added as co-
catalyst and it may be the major product if oxygen is not completely
excluded from the reaction. Although the homocoupling reaction can be
diminished by running the reaction under rigorous inert conditions and
slow addition of the alkyne157
to keep its concentration low in the
reaction mixture, however, it cannot be eliminated completely.158
In fact
under the inert reaction conditions, the homo-coupled product is thought
to be formed by initial reduction of the PdII(L)2(Cl)2 precatalyst to
generate the active catalytic complex Pd0(L)2. The generally accepted
active catalyst Pd0(L)2 is formed via transmetallation of an alkynyl
copper, which is generated by the reaction of the amine base and CuI,
followed by reductive elimination of the dialkynyl PdII species to give
the active Pd0 (L)2 and the alkyne dimer
159 (Scheme 8).
The homocoupled side product 38 was isolated and its 1H NMR
spectrum along with molecular structure is given in figure 35. The
spectrum possessed two doublets in the aromatic region like the
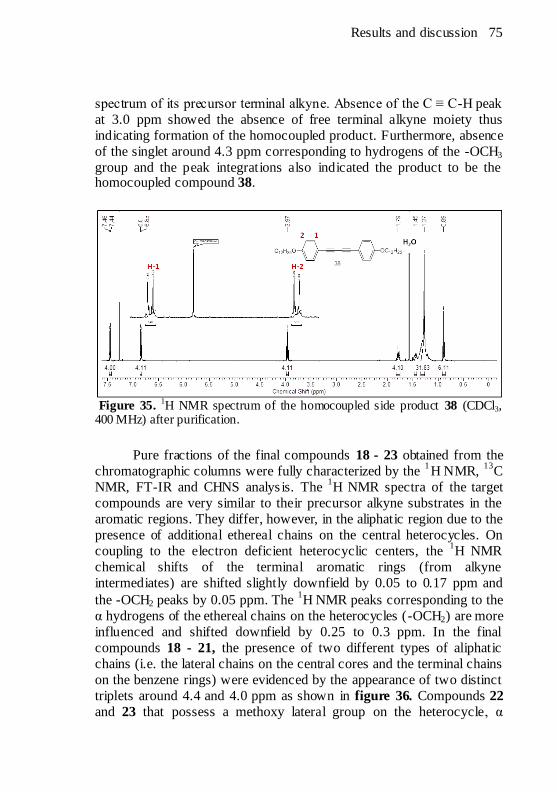
Results and discussion 75
spectrum of its precursor terminal alkyne. Absence of the C ≡ C-H peak
at 3.0 ppm showed the absence of free terminal alkyne moiety thus
indicating formation of the homocoupled product. Furthermore, absence
of the singlet around 4.3 ppm corresponding to hydrogens of the -OCH3
group and the peak integrations also indicated the product to be the homocoupled compound 38.
Figure 35.
1H NMR spectrum of the homocoupled side product 38 (CDCl3,
400 MHz) after purification.
Pure fractions of the final compounds 18 - 23 obtained from the
chromatographic columns were fully characterized by the 1H NMR,
13C
NMR, FT-IR and CHNS analys is. The 1H NMR spectra of the target
compounds are very similar to their precursor alkyne substrates in the
aromatic regions. They differ, however, in the aliphatic region due to the
presence of additional ethereal chains on the central heterocycles. On
coupling to the electron deficient heterocyclic centers, the 1H NMR
chemical shifts of the terminal aromatic rings (from alkyne
intermediates) are shifted slightly downfield by 0.05 to 0.17 ppm and
the -OCH2 peaks by 0.05 ppm. The 1H NMR peaks corresponding to the
α hydrogens of the ethereal chains on the heterocycles (-OCH2) are more
influenced and shifted downfield by 0.25 to 0.3 ppm. In the final
compounds 18 - 21, the presence of two different types of aliphatic
chains (i.e. the lateral chains on the central cores and the terminal chains
on the benzene rings) were evidenced by the appearance of two distinct
triplets around 4.4 and 4.0 ppm as shown in figure 36. Compounds 22
and 23 that possess a methoxy lateral group on the heterocycle, α

76 Results and discussion
hydrogens of the lateral and terminal ethereal chains appeared as singlet and triplets respectively.
Figure 36.
1H NMR spectrum of compound 20 (CDCl3, 400 MHz) with peaks
assignments.
The presence of these two different aliphatic chains on the central
heterocycles and on the terminal benzene r ings was also confirmed in
their 13
C NMR spectra by the presence of two signals around 75 and 68-
69 ppm referring to the -OCH2 carbons. In the final compounds, the 13
C
NMR peaks of the aromatic carbons are shifted slightly downfield by 1-
2 ppm in comparison to their precursor intermediates. The 13
C NMR
peaks of the sp hybridized carbon atoms (C ≡ C) that appeared around
84 and 76 ppm in the alkynes were also shifted downfield and appeared
around 101 and 79-81 ppm. The 13
CNMR spectrum of compound 20 is
shown in figure 37. Only the non-aliphatic region is shown for better
clarity. The 1H NMR and
13C NMR data of other compounds are
presented in the experimental section.

Results and discussion 77
Figure 37.
13C NMR spectrum of the compound 20 (CDCl3, 100 MHz) showing
the important peaks in non-aliphatic region.
The FT-IR spectra of the final compounds 18-23 were found to
be very similar. The IR spectrum of compound 23 is shown as
representative model in figure 38 while the IR data for other compounds
are presented in the experimental section. The complete absence of
sharp bands near the 3310 cm-1
region, that were observed in the IR
spectra of precursor alkynes for the νC ≡ C-H bond stretch, indicated the
occurrence of the Sonogashira coupling. This was also indicated
primarily by the appearance of intense luminescence in the reaction
mixture. The bands in the 2923 to 2853 cm-1
region for both the
asymmetrical and symmetrical -C-H stretching of the methylene groups
were almost un-affected. The sharp bands near to 2108 cm-1, referring to
the -C ≡ C- stretching, were shifted to around 2205 cm-1.

78 Results and discussion
Figure 38. FT-IR spectrum (in KBr disc) of compound 23 as representative
model for the final compounds 18-23.
3.5. OPTICAL PROPERTIES
The whole series of compounds 18-23 was found to be intensely
fluorescent and emit in the yellowish-green region of the visible
spectrum under an UV light. To study influence of the molecular
structure on their photophysical properties, their absorption and
emission spectra were measured in dilute chloroform solutions using
UV-absorption and f luorescence spectroscopic techniques. The
measured wavelengths of their absorptions, excitations and emissions
and their respective molar absorptivity coefficients (ε), Stokes shifts (nm) and fluorescence quantum yields (Φf) are presented in table 1.

Results and discussion 79
Table 1. Photophysical data of the final compounds 18-23.
Comp.
(nm)a
ε
Lmol-1
cm-1
(nm)b
(nm)b
Stokes
(nm)c
Φfd
18 429 19400 442 543 101 0.32
19 428 30200 440 535 95 0.32
20 429 26400 436 535 99 0.31
21 437 25200 449 552 103 0.28
22 426 18600 435 536 101 0.31
23 435 26000 448 555 107 0.27 a Absorption spectra were taken in solutions of 5 x 10
-6 mol L
-1 in CHCl3.
b Irradiated with wavelengths corresponding to their respective low energy
absorption bands. c Stokes shifts =
˗
d
Measured in CHCl3, using 4,7-bis(phenylethynyl)-2,1,3-benzothia-diazole
(Φf= 0.37) as the standard119
Due to similarities in their molecular structures, all the
compounds showed very similar absorption patterns. As can be seen in
figure 39 which shows the UV-absorption spectra of the final
compounds, all compounds showed bands with maximum absorptions ( ) between 426 and 437 nm. These bands possess high molar
absorptivity coefficients ranging from 18600 to 30200 Lmol-1
cm-1
and
appear due to the symmetry allowed π-π* transitions.
Length of the lateral f lexible chains (on the heterocycles) showed
negligible influence on the absorptions behaviour as can be seen by
comparing the wavelengths of maximum absorptions of compounds 20
and 21 with those of compounds 22 and 23 respectively. Contrary to
length of the lateral chain, the number of chains showed a greater effect
on the absorption behaviour. The presence of additional -OC12H25 chains
on both the terminal aromatic rings in 21 and 23 caused a moderate red
shift (8-9 nm) in the low energy absorption bands compared to
compounds 20 and 22. However, the same pattern was not observed in
the case of their sulfur containing analogs 18 and 19. Compared to the
benzoxadiazole 21, its sulfur-containing analogue 19 absorb at s lightly
shorter wavelength. This blue shift (of 9 nm) in the absorption may be
attributed to a slightly diminished delocalization of the lone pair on
sulfur atom towards nitrogen due to the difference in the sizes of the
participating orbitals.
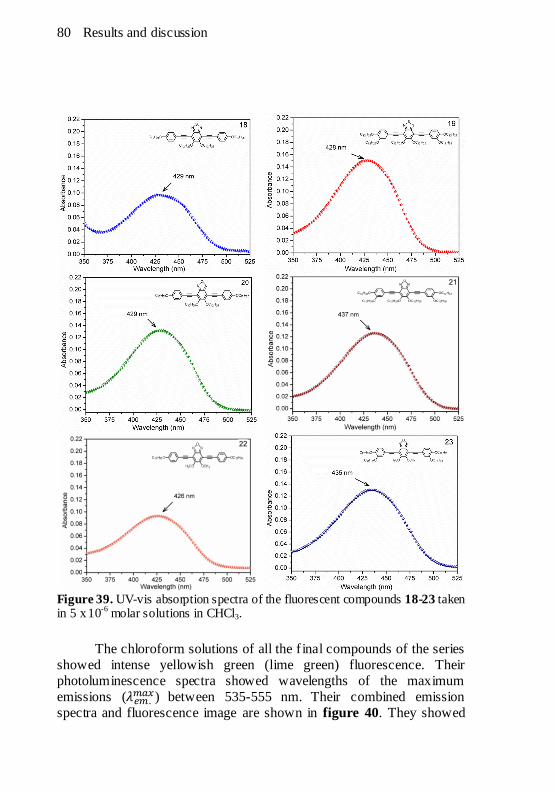
80 Results and discussion
Figure 39. UV-vis absorption spectra of the fluorescent compounds 18-23 taken in 5 x 10
-6 molar solutions in CHCl3.
The chloroform solutions of all the f inal compounds of the series
showed intense yellowish green (lime green) fluorescence. Their
photoluminescence spectra showed wavelengths of the maximum
emissions ( ) between 535-555 nm. Their combined emission
spectra and fluorescence image are shown in figure 40. They showed
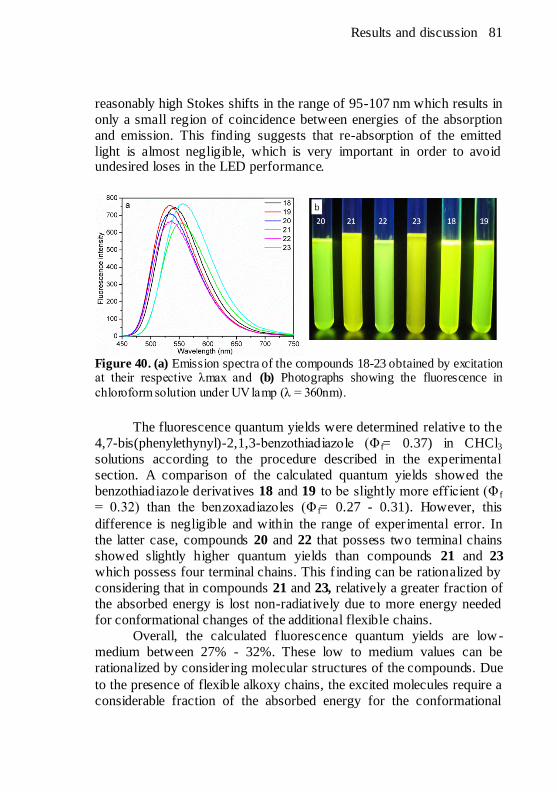
Results and discussion 81
reasonably high Stokes shifts in the range of 95-107 nm which results in
only a small region of coincidence between energies of the absorption
and emission. This finding suggests that re-absorption of the emitted
light is almost negligible, which is very important in order to avoid undesired loses in the LED performance.
Figure 40. (a) Emission spectra of the compounds 18-23 obtained by excitation at their respective λmax and (b) Photographs showing the fluorescence in
chloroform solution under UV lamp (λ = 360nm).
The fluorescence quantum yields were determined relative to the
4,7-bis(phenylethynyl)-2,1,3-benzothiadiazole (Φ f= 0.37) in CHCl3
solutions according to the procedure described in the experimental
section. A comparison of the calculated quantum yields showed the
benzothiadiazole derivatives 18 and 19 to be slightly more eff icient (Φ f
= 0.32) than the benzoxadiazoles (Φ f= 0.27 - 0.31). However, this
difference is negligible and within the range of experimental error. In
the latter case, compounds 20 and 22 that possess two terminal chains
showed slightly higher quantum yields than compounds 21 and 23
which possess four terminal chains. This f inding can be rationalized by
considering that in compounds 21 and 23, relatively a greater fraction of
the absorbed energy is lost non-radiatively due to more energy needed
for conformational changes of the additional flexible chains.
Overall, the calculated f luorescence quantum yields are low-
medium between 27% - 32%. These low to medium values can be
rationalized by considering molecular structures of the compounds. Due
to the presence of flexible alkoxy chains, the excited molecules require a
considerable fraction of the absorbed energy for the conformational

82 Results and discussion
changes of the chains and consequently the efficiency of fluorescence is
decreased. 3.6. ELECTROCHEMICAL PROPERTIES
Electrochemical properties of the final compounds were studied
using cyclic voltammetry. The experimental details are given in the
experimental section. The cyclic voltammograms of all the six
compounds are shown in figure 41. Due to their structural similarities,
all the compounds showed very similar oxidation and reduction profiles
within the available potential range of the dichloromethane solvent system.

Results and discussion 83
Figure 41. Cyclic voltammograms of the final compounds 18-23 obtained in
their solutions in dichloromethane at the scan rate of 50 mV.s .-1
The onset potentials were determined from the intersection of two
tangents drawn at the rising oxidation or reduction current and
background current as shown in figure 42. To determine this point
graphically, a straight line was extended from left to r ight along the
linear portion of the initially flat curve, i.e. the cell current. Similarly, a
line was drawn from the linear portion of the r ising oxidation current.
The onset potential was taken at the intersection of the extrapolated lines
near the bottom of the steeply rising portion rather than the peak
maximum.160,161
For the reverse scan, the onset potential for the reverse
process was taken at the intersection of the lines extrapolated in the reverse order compared to the forward scan.
Figure 42. Determining the onset potentials in cyclic voltammogram for small
current changes and wavy peaks.

84 Results and discussion
As apparent from figure 41, the oxidative cycles exhibit single
and irreversible waves rather than peaks between 1.07 to 1.36V vs.
Ag/AgCl. The cathodic sweeps show single reduction peaks with
reduction potentials between -0.78 and -1.29 V vs. Ag/AgCl. These
results were used to assess the HOMO and LUMO energy levels and to
calculate the electrochemical band gaps. For this purpose, initially both
the oxidation and reduction potentials, measured originally relative to
Ag+/AgCl reference electrode, were converted relative to the ferrocene–
ferrocenium (FOC) redox couple (the internal reference) by considering
the potential difference between FOC and Ag/AgCl in the same
solutions.162
Since the redox potentials (Eox, Ered.) were measured in
solution and not in vacuum, the HOMO and LUMO energy levels
(alternatively the IP and EA values respectively) were then estimated by
relating the corrected anodic and cathodic potentials to the vacuum scale
using the standard approximation that the Fc/Fc+ HOMO level is - 4.8
eV.131,162
with respect to the vacuum level (Equ. 1, 2). The band gap
energy Eg was then calculated by taking the difference between
ionization potential and electron affinity ( equivalent to HOMO and
LUMO energy levels respectively) according to equation 3. The
estimated redox potentials, HOMO and LUMO positions together with the electrochemical bandgaps are summarized in table 2.
IP = Eox. + 4.8 or IP = -Eox. - 4.8 (1)
EA = Ered. + 4.8 or EA = -Ered. - 4.8 (2)
Egap = EA - IP (3)

Results and discussion 85
Table 2. Electrochemical data and molecular orbital energies of the final
compounds.
Compounds Eoxa Ered
a EHOMO
b
(eV)
ELUMOc
(eV)
Egapd
(eV)
18 0.85 -1.72 -5.65 -3.08 2.57
19 0.93 -1.21 -5.73 -3.59 2.14
20 0.70 -1.24 -5.50 -3.56 1.94
21 0.80 -1.27 -5.60 -3.53 2.07
22 0.76 -1.22 -5.56 -3.58 1.98
23 0.64 -1.27 -5.44 -3.53 1.91
a All redox potentials are referenced to the Fc/Fc+
redox couple. b EHOMO = (-4.8–Eox).
c ELUMO = (-4.8–Ered).
d Egap = EHOMO - ELUMO.
3.7. THE Eg, IP AND EA FROM OPTICAL ABSORPTIONS
The ionization potentials (IP) and electron affinities (EA) were
also estimated from the optical bandgap energy (
) values which
were, in turn, determined from the absorption spectra according to
procedure described in the experimental section. Usually, the optical
bandgap (
) of a compound is determined to help calculate the
ionization potential or electron affinity in cases where these values
cannot be obtained directly from the voltammetric data. For an analyte
that undergoes only oxidation, the EA (and consequently the energy
bandgap Egap) cannot be determined electrochemically. Similarly for
analyte that undergoes only reduction, the IP and the Egap cannot be
determined directly. In the absence of direct measurement through CV,
the EA is estimated163
by subtraction of the optical gap energy
from the IP (Equ. 4)161
which is determined through the CV. Similarly,
for the analyte that undergoes only reduction, the IP is calculated from
the optical gap energy
using equation 5. Equations 8 and 9,

86 Results and discussion
however, give good estimates only when the electrochemical and optical band gaps are the same.
EA = IP -
(4)161
IP
= EA +
(5)
160
Values of the electron affinity, ionization potential and band gap
determined from the electrochemical and optical absorption are
presented in table 3 for comparison purpose. Note that the negative of
HOMO and LUMO energies (from table 2) are approximated as IPcv and
EAcv respectively.164
As apparent from the table 3, these values
calculated from the optical and electrochemical methods are different
from each other. The fact that the optical and electrochemical bandgaps
can be different has already been reported in many cases165,166
though in
some cases they may be comparable.167,168
This discrepancy in the
estimated values is due to the difference in th e energy processes
contributing to the band gap estimations.169
In the optical absorption
method, usually energy at the longer wavelength region of the
absorption band is revealed as the band gap. The position of this band is
dictated by the molecular planarity and length of the conjugation. Cyclic
voltammetry, on the other hand, provides band gap information based
on the HOMO and LUMO energy levels on the s ites of oxidation and
reduction respectively. If the conjugation is extended over both the
oxidation and reduction sites (i.e. the donor and acceptor segments are
in complete conjugation), in redox process the electrons are extracted
from or injected into the fully conjugated system. In such cases, the
optical and electrochemical band gaps are comparable. On the other
hand, structures in which the oxidation and reduction segments are
discrete and the conjugation is not effectively extend over both these
components, energies of the absorption and redox processes are
different. Consequently, the HOMO−LUMO gap and the optical band
gap values are not the same i.e. the optical and electrochemical band gap should not converge.
170
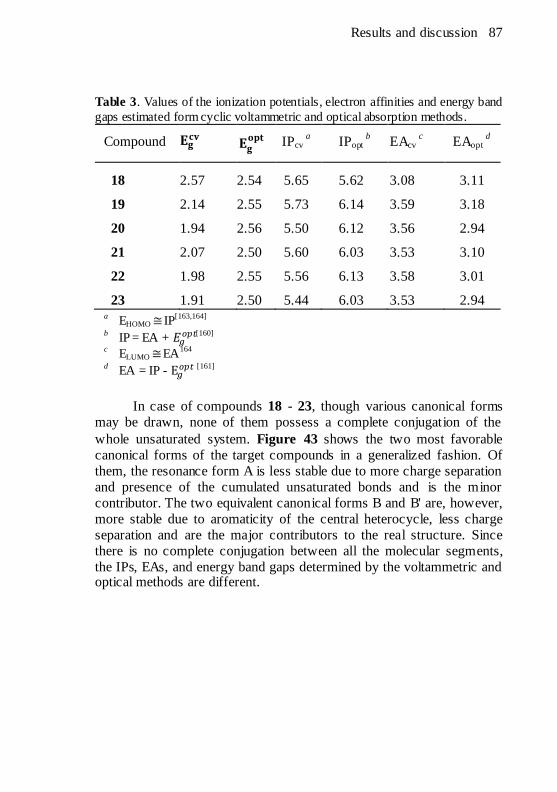
Results and discussion 87
Table 3. Values of the ionization potentials, electron affinities and energy band
gaps estimated form cyclic voltammetric and optical absorption methods.
Compound
IPcv
a IPopt
b EAcv
c EAopt
d
18 2.57 2.54 5.65 5.62 3.08 3.11
19 2.14 2.55 5.73 6.14 3.59 3.18
20 1.94 2.56 5.50 6.12 3.56 2.94
21 2.07 2.50 5.60 6.03 3.53 3.10
22 1.98 2.55 5.56 6.13 3.58 3.01
23 1.91 2.50 5.44 6.03 3.53 2.94 a EHOMO ≅ IP
[163,164]
b IP = EA +
[160]
c ELUMO ≅ EA164
d EA = IP -
[161]
In case of compounds 18 - 23, though various canonical forms
may be drawn, none of them possess a complete conjugation of the
whole unsaturated system. Figure 43 shows the two most favorable
canonical forms of the target compounds in a generalized fashion. Of
them, the resonance form A is less stable due to more charge separation
and presence of the cumulated unsaturated bonds and is the minor
contributor. The two equivalent canonical forms B and B' are, however,
more stable due to aromaticity of the central heterocycle, less charge
separation and are the major contributors to the real structure. Since
there is no complete conjugation between all the molecular segments,
the IPs, EAs, and energy band gaps determined by the voltammetric and optical methods are different.
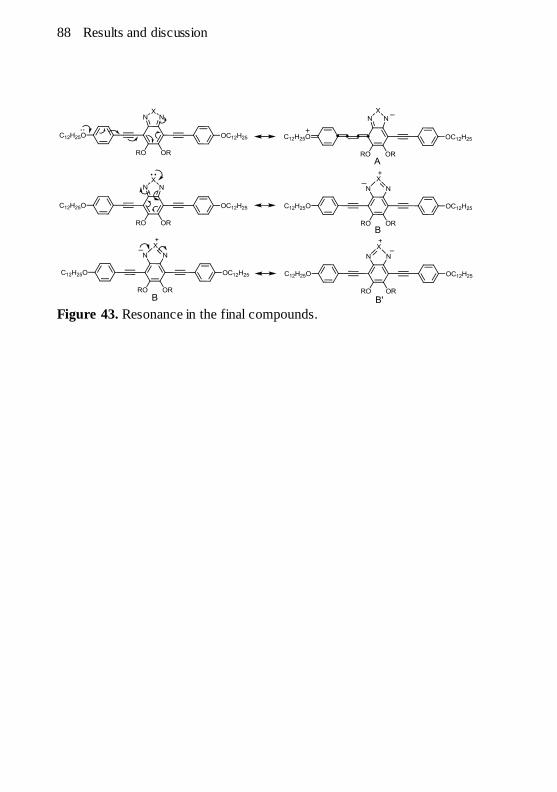
88 Results and discussion
Figure 43. Resonance in the final compounds.

Results and discussion 89
Part B:
3.8. Syntheses and Characterization of Thiophene Based Luminescent
Liquid Crystals.

90 Results and discussion
3.9. MOLECULAR DESIGN OF THE TARGET COMPOUNDS
Figure 44 shows representative structures of the designed
molecules with potential as luminescent liquid crystals. These
molecules were rationally designed by selecting a suitable core
fragment, linking group and terminal groups to ensure observation of
luminescence as well as mesomorphism. The compounds were designed
with two arms (symmetrical or unsymmetrical) about the thiophene ring.
In order to study the effect of structure on optical and mesomorphic
properties, different aromatic moieties (benzene, naphthalene and
biphenyl) were selected to lengthen the r igid center and the conjugation
length. These aromatic moieties were linked to the thiophenic core
through a -C≡C- bond to produce a conjugated structure. In addition to
varying the length of the rigid core, the number of flexible alkoxy chains
were also varied to find the influence on the observed properties.
Figure 44. Representative structures of the designed luminescent liquid crystals.

Results and discussion 91
3.10. SYNTHETIC PLAN
The preliminary retrosynthetic analysis of the target compounds
is shown in figure 45. The target molecules can be achieved by
connecting the terminal alkynes to the 2,5-diiodothiophene through
C C bond formation. The 2,5-diiodothiophene can be prepared by
iodination at positions 2 and 5 that are more reactive (towards
electrophilic aromatic substitution) than pos itions 3 and 5. The terminal
aromatic alkynes can be prepared through a sequence of reactions
including Williamson etherif ication, Sonogashira cross coupling and
acetylene deprotection.
Figure 45. General retrosynthetic analysis of the bent shaped luminescent compounds.

92 Results and discussion
3.10.1. Synthesis of The Terminal Alkynes
The naphthalene and biphenyl based terminal alkynes 39, 40 were
prepared via the same synthetic steps through which the compounds 16
and 17 were prepared. The 4-bromo-4'-(dodecyloxy)biphenyl 41 was
prepared in one pot from the available 4-bromo-[1,1'-biphenyl]-4-ol
acetate. First the hydroxyl group was liberated by saponification of the
ester group with NaOH then followed by etherification of the liberated hydroxyl in the same pot.
Figure 46. Molecular structures of the terminal alkynes 39 and 40.
During the preparation of intermediate 40, a gradual collapse of
the 1H NMR peaks was observed in the aromatic region.
1H NMR
spectrum of the precursor compound 41 (Fig. 47a) showed four well
defined doublets in the aromatic region as expected for the biphenyl
unit. Of them, three closely spaced doublets are located downfield to the
chloroform and an isolated upfield doublet. After insertion of the
acetylenic moiety, the compound 42 showed a second order 1H NMR
spectrum in the aromatic region with the three closely spaced doublets
partially overlapped (Fig. 47b). Upon deprotection of the acetylenic
group, this second order pattern was enhanced further and the
aforementioned doublets appeared as a multiplet (6H integrals) due to greater overlap of the peaks (Fig. 47c).

Results and discussion 93

94 Results and discussion
Figure 47.
1H-NMR (400 MHz, CDCl3) spectra of compounds 41, 42 (aromatic
region) and 40 (aromatic region) showing gradual emergence of the second
order pattern during the course of -C≡C- insertion.
3.10.2. Synthesis and Characterization of The Final Compounds
In the case of thiophene based compounds too, the same synthetic
strategy of using Sonogashira cross-coupling of the separately prepared
terminal acetylenes (17, 39, 40) with the 2,5-diiodothiophene as the final
step was applied. The 2,5-diiodothiophene intermediate 44 was formed
in a single step by iodination of the thiophene as shown in scheme 10.
Scheme 10. Synthesis of the 2,5-diiodothiophene.
The symmetrical products (45 - 47) were obtained by us ing 2.2
equivalents of the terminal acetylenes (Scheme 11). Compounds 45 and
49 containing the biphenyl unit was sparingly soluble in a vast range of
organic solvents such as CDCl3, DMSO-d6, acetone-d6. The low
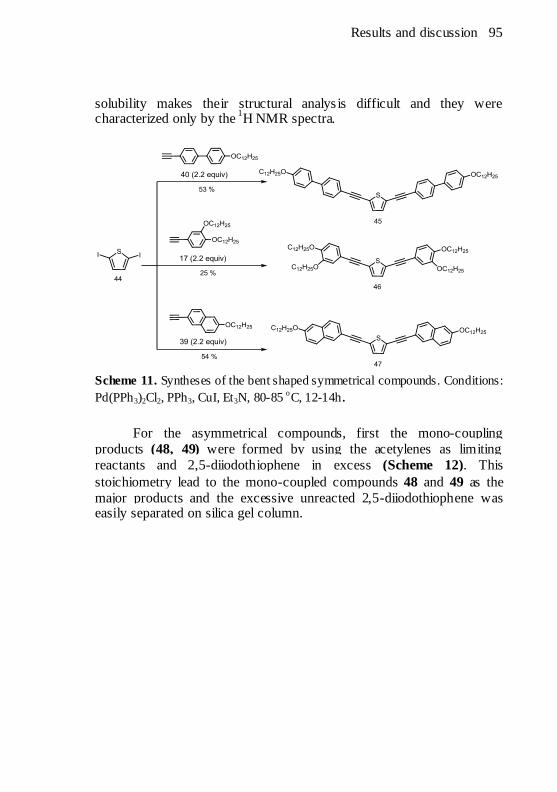
Results and discussion 95
solubility makes their structural analys is difficult and they were characterized only by the
1H NMR spectra.
Scheme 11. Syntheses of the bent shaped symmetrical compounds. Conditions:
Pd(PPh3)2Cl2, PPh3, CuI, Et3N, 80-85 oC, 12-14h.
For the asymmetrical compounds, first the mono-coupling
products (48, 49) were formed by using the acetylenes as limiting
reactants and 2,5-diiodothiophene in excess (Scheme 12). This
stoichiometry lead to the mono-coupled compounds 48 and 49 as the
major products and the excessive unreacted 2,5-diiodothiophene was easily separated on silica gel column.
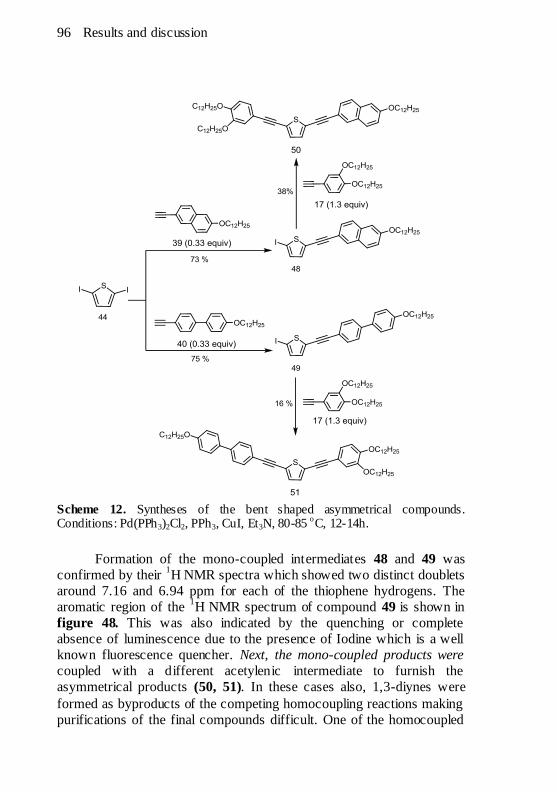
96 Results and discussion
Scheme 12. Syntheses of the bent shaped asymmetrical compounds. Conditions: Pd(PPh3)2Cl2, PPh3, CuI, Et3N, 80-85
oC, 12-14h.
Formation of the mono-coupled intermediates 48 and 49 was
confirmed by their 1H NMR spectra which showed two distinct doublets
around 7.16 and 6.94 ppm for each of the thiophene hydrogens. The
aromatic region of the 1H NMR spectrum of compound 49 is shown in
figure 48. This was also indicated by the quenching or complete
absence of luminescence due to the presence of Iodine which is a well
known fluorescence quencher. Next, the mono-coupled products were
coupled with a different acetylenic intermediate to furnish the
asymmetrical products (50, 51). In these cases also, 1,3-diynes were
formed as byproducts of the competing homocoupling reactions making
purifications of the final compounds difficult. One of the homocoupled

Results and discussion 97
byproduct 1,4-bis(6-(dodecyloxy)naphthalen-2-yl)buta-1,3-diyne 52 was
isolated and its 1H NMR spectrum along with molecular structure is
given in the experimental section. The experimental details and spectral
data of all the other intermediates and f inal compounds are given in the experimental section.
Figure 48.
1H NMR spectra of the mono-coupled intermediate 49 (400 MHz,
CDCl3) showing two distinct doublets around 7.16 and 6.94 ppm for the thiophenic hydrogens.
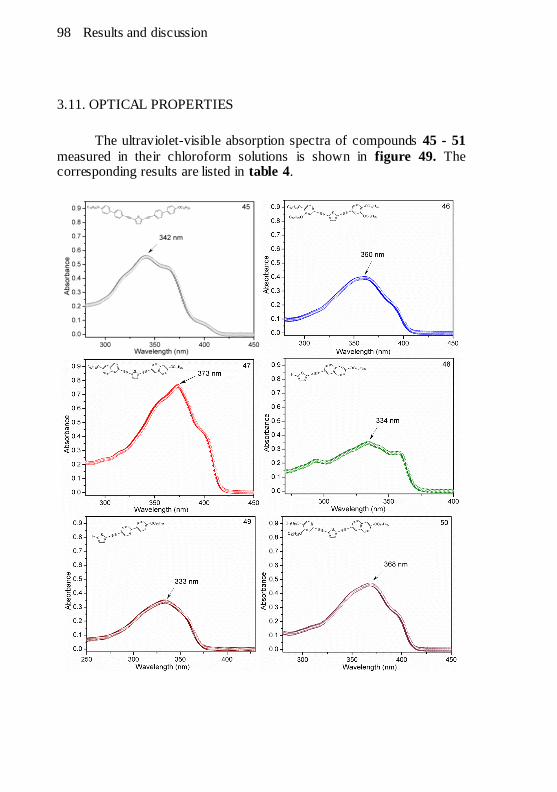
98 Results and discussion
3.11. OPTICAL PROPERTIES
The ultraviolet-visible absorption spectra of compounds 45 - 51
measured in their chloroform solutions is shown in figure 49. The corresponding results are listed in table 4.

Results and discussion 99
Figure 49. UV-vis absorption spectra of compounds 45 - 51 taken in 1 x 10
-5
molar solutions in CHCl3.
Compounds 47 and 50 containing the naphthalene group were
shown to absorb at longer wavelengths. This is due to extended and
efficient conjugation of the naphthalenic groups. Compared to the
naphthalene unit, the presence of biphenyl unit caused a blue shift of the
absorption wavelength. For example, compounds 45 and 51, that differ
from 47 and 50 (respectively) in the sense that the naphthalene is
replaced by the biphenyl unit, absorbed at much shorter wavelengths.
This indicates less efficient conjugation in 45 and 51. The monocoupled
products 48 and 49 absorb at much shorter wavelengths as expected.
Figure 50. Photograph showing the fluorescence in chloroform solution under
UV lamp (λ = 360nm).
All the products were shown to emit in the blue region of visible
spectrum when their solutions in chloroform were irradiated with
ultraviolet radiations. Figure 50 shows the fluorescence photograph of
these compounds. Note that the monocoupled compounds 48 and 49
showed low fluorescence due to the presence of iodine, a well known
51

100 Results and discussion
fluorescence quencher. The fluorescent quantum yields were determined
relative to quinine sulfate used as the standard. Table 4 summarize
results of the absorption and emission studies and relative quantum
yields of the final compounds.
Table 4. Photophysical data of the final compounds.
Comp.
(nm)a
ε
Lmol-1
cm-1
(nm)b
(nm)b
Stokes
(nm)c
Φfd
45 342 55500 345 404 59 0.48
46 360 39400 358 405 47 0.34
47 373 76200 370 409 39 0.56
50 368 46400 365 408 43 029
51 354 48700 361 411 50 0.26
a Absorption spectra were taken in solutions of 1 x 10
-5 mol L
-1 in CHCl3.
b Irradiated with wavelengths of their respective low energy absorption
bands. c Stokes shifts =
-
d
Relative to quinine sulfate (in 1 N H2SO4, Φf = 0.546) as the standard.
3.12. MESOMORPHIC AND THERMAL PROPERTIES
The mesophases for these compounds were identified by
polarized optical microscopy upon cooling from the isotropic phase and
the phase transition temperatures were determined us ing differential
scanning calorimetry. Furthermore, thermal stability of the compounds
were investigated using thermogravimetric analys is. The results of DSC
coupled with POM and TGA are summarized in table 5.
The TGA analys is reveals that under the protection of an inert
atmosphere, the final compounds show good thermal stabilities with
decomposition temperatures between 292 - 396 oC. As evident from the
table, change in the length of the rigid core results in very interesting
thermal properties. The general pattern showed that increasing the
length of the rigid part of the molecule increased the tendency to form a
liquid crystalline phase. For example, compound 46 that contains two
terminal benzene r ings have the smallest molecular length among the
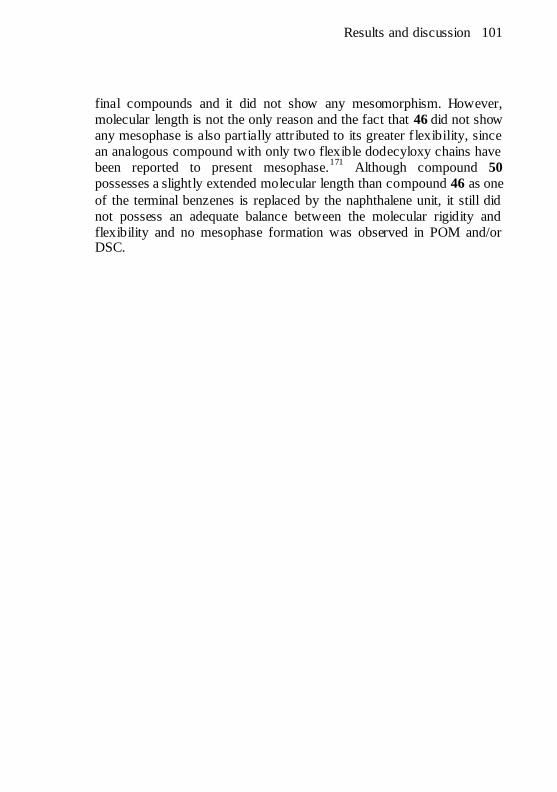
Results and discussion 101
final compounds and it did not show any mesomorphism. However,
molecular length is not the only reason and the fact that 46 did not show
any mesophase is also partially attr ibuted to its greater f lexibility, since
an analogous compound with only two flexible dodecyloxy chains have
been reported to present mesophase.171
Although compound 50
possesses a slightly extended molecular length than compound 46 as one
of the terminal benzenes is replaced by the naphthalene unit, it still did
not possess an adequate balance between the molecular rigidity and
flexibility and no mesophase formation was observed in POM and/or DSC.

102 Results and discussion
Table 5. Thermal behaviour of the symmetrical and asymmetrical final
compounds
Compound Transitions T (ΔH)a,b
Heating
T (-ΔH)a,b
Cooling
Tdec c
45 d - - 396
46 - - - 305
47 Cr - N
N - I
I - N
N - Cr
130.2 (39.5)
169.0 (1.7)
-
-
-
-
166.4 (2.4)
115.2 (40.8)
388
50 - - - 297
51 Cr - Cr'
Cr' - SmC
SmC - I
I - SmC
SmC - Cr'
Cr' - Cr
81.8 (e)
85.4 (26.6)
125f
-
-
-
-
-
-
123f
-60.1 (29.7)
54.1 (e)
292
a Determined by the POM and DSC measurements
b ΔH Units: KJ mol
-1
c Determined by TGA, the values are taken at the 5% decomposition in
inert atmosphere d DSC indicate the presence of impurities
e Overlapped with mesophase transition peak
f Observed by POM but not detected in DSC measurements
It was envisioned that either an extens ion of the molecular
rigidity or a diminution of the number or length of the flexible chains or
a combination of both will possibly lead to the formation of mesophase.
The molecular length was extended further in compound 47 by
substituting both the active positions on thiophene (through
linking group) with the naphthalenic units. Furthermore, compound 47
possesses only two chains and consequently, it presented mesophase.
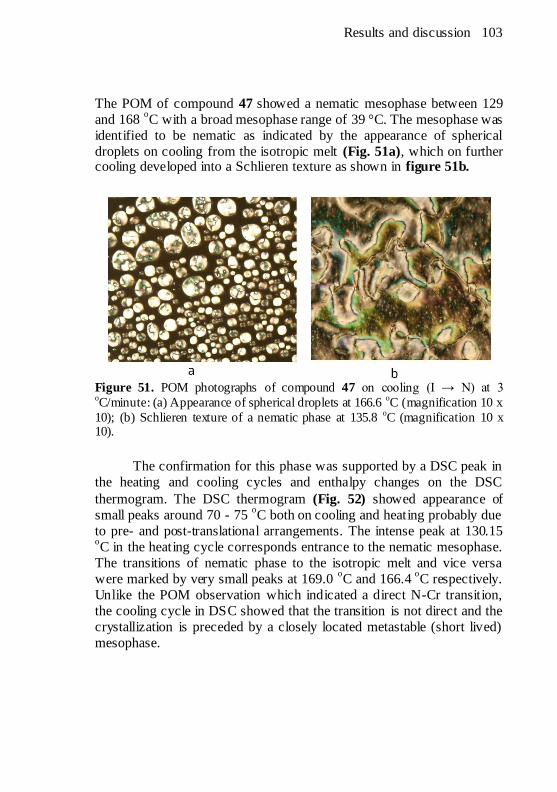
Results and discussion 103
The POM of compound 47 showed a nematic mesophase between 129
and 168 oC with a broad mesophase range of 39 °C. The mesophase was
identified to be nematic as indicated by the appearance of spherical
droplets on cooling from the isotropic melt (Fig. 51a), which on further cooling developed into a Schlieren texture as shown in figure 51b.
Figure 51. POM photographs of compound 47 on cooling (I → N) at 3 oC/minute: (a) Appearance of spherical droplets at 166.6
oC (magnification 10 x
10); (b) Schlieren texture of a nematic phase at 135.8 oC (magnification 10 x
10).
The confirmation for this phase was supported by a DSC peak in
the heating and cooling cycles and enthalpy changes on the DSC
thermogram. The DSC thermogram (Fig. 52) showed appearance of
small peaks around 70 - 75 oC both on cooling and heating probably due
to pre- and post-translational arrangements. The intense peak at 130.15 oC in the heating cycle corresponds entrance to the nematic mesophase.
The transitions of nematic phase to the isotropic melt and vice versa
were marked by very small peaks at 169.0 oC and 166.4
oC respectively.
Unlike the POM observation which indicated a direct N-Cr transition,
the cooling cycle in DSC showed that the transition is not direct and the
crystallization is preceded by a closely located metastable (short lived)
mesophase.
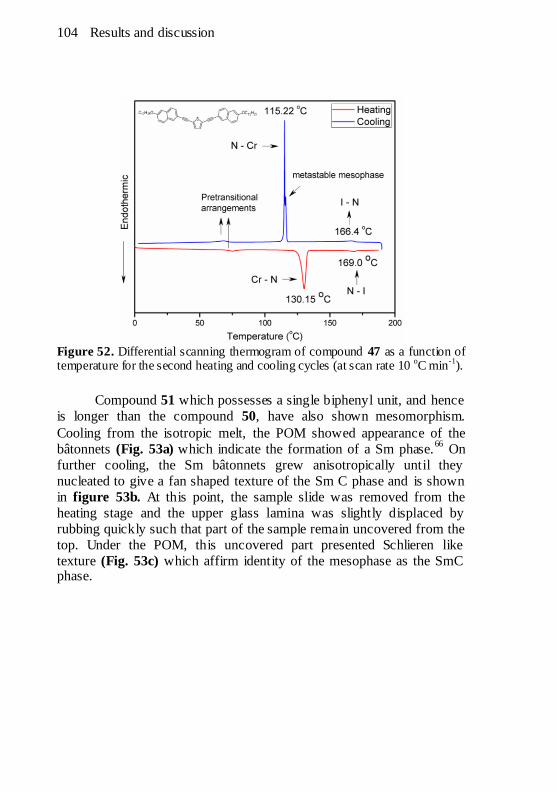
104 Results and discussion
Figure 52. Differential scanning thermogram of compound 47 as a function of temperature for the second heating and cooling cycles (at scan rate 10
oC min
-1).
Compound 51 which possesses a single biphenyl unit, and hence
is longer than the compound 50, have also shown mesomorphism.
Cooling from the isotropic melt, the POM showed appearance of the
bâtonnets (Fig. 53a) which indicate the formation of a Sm phase.66
On
further cooling, the Sm bâtonnets grew anisotropically until they
nucleated to give a fan shaped texture of the Sm C phase and is shown
in figure 53b. At this point, the sample slide was removed from the
heating stage and the upper glass lamina was slightly displaced by
rubbing quickly such that part of the sample remain uncovered from the
top. Under the POM, this uncovered part presented Schlieren like
texture (Fig. 53c) which affirm identity of the mesophase as the SmC phase.
Results and discussion 105
Figure 53. POM photographs of compound 51 on second cooling (I → SmC) at
3 oC/minute : (a) batonnet texture at 92
oC (magnification 10 x 10); (b) fan
shaped texture of SmC phase at 86.5 oC (magnification 10 x 10); (c)
Appearance of a Schlieren texture of the SmC phase after rubbing the glass lamina at 80
oC (magnification 10 x 10).
The POM observations for compound 51 were supported by the
DSC thermogram which is shown in figure 54 below. The intense peak
at 85.4 oC in the heating cycle corresponds entrance to the SmC
mesophase. The appearance of a shoulder at 81.8 oC indicates that a Cr-
Cr' transition peak is overlapped with Cr'-SmC transition. The same
transitional pattern was observed in the cooling cycle. Transitions of
smectic phase to the isotropic melt and vice versa were not observed in
the DSC experiments even in experiments in which more sample was
used and the temperature was changed at higher (20 oC min
-1) and lower
(5 oC min.
-1) change rates. The values shown for these transitions in
table 5 are the ones obtained from the POM. b
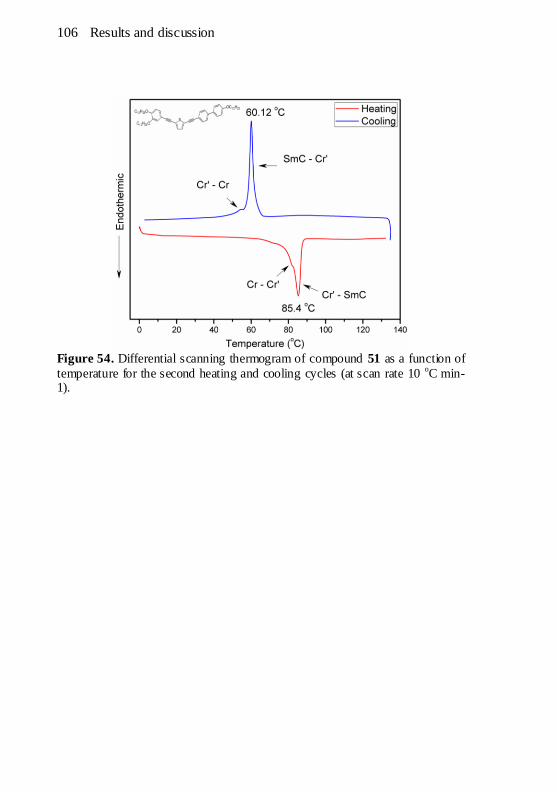
106 Results and discussion
Figure 54. Differential scanning thermogram of compound 51 as a function of
temperature for the second heating and cooling cycles (at scan rate 10 oC min-
1).

Conclusions 107
4. CONCLUSIONS
Two series of compounds were successfully synthesized using the
Sonogashira cross-coupling as the key synthetic step. A common feature
of all the compounds of both the series is the presence of a planar and
highly conjugated rigid center and the presence of several flexible
alkoxy chains. The first series consists of luminescent compounds
containing 2,1,3-benzoxadiazole and 2,1,3 benzothiadiazole
heterocycles as the central units to which benzene rings with varying
number of flexible alkoxy chains were connected through
bonds. Nature of the central heterocycle and length of the lateral alkoxy
chains (directly attached to the heterocycle) did not show a significant
influence on the absorption and emission behavior. However, the
number of terminal alkoxy chains attached to the terminal benzenes
showed a moderate effect on the absorption behaviour. Connecting the
central heterocycle to the benzene rings through the linking
group resulted in extens ion of the conjugation and consequently, these
compounds showed yellowish-green fluorescence with fluorescence
quantum yields (Φf) between 27 to 32 %. Theirs absorption and
emission spectra showed only a small region of coincidence between
them and high Stokes shifts of 95 - 107 nm. Although compounds of
this series possess rigid as well as f lexible groups making them eligible
to be liquid crystals, none of them presented mesomorphism. Cyclic
voltammograms of all compounds of this series possess single oxidation
and reduction peaks. Calculations based on the voltammetric and optical
measurements revealed the presence of small band gaps (1.91 to 2.57
eV) between their HOMO and LUMO energy levels making them
attractive candidates for potential use in solar cells and OLEDs.
In the second series, aiming at the synthesis of fluorescent liquid
crystals, compounds containing thiophene as the central core were
successfully synthesized. As in the previous series, the Sonogashira
cross-coupling was used as the key synthetic step in these synthetic
routes as well. The molecular lengths and the degree of conjugation
were varied through the use of benzene, naphthalene and biphenyl
groups and their effects on the optical, thermal and mesomorphic
properties were determined. All the final compounds showed good
thermal stabilities with decomposition temperatures between 292 - 396 oC. Their photophysical parameters were measured in chloroform
solutions. The optical absorptions were influenced by the length of the

108 Conclusions
conjugation as was expected. Their solutions in chloroform showed
strong blue fluorescence with good quantum yields of 26 to 56 %
relative to quinine sulfate. The Stokes shifts determined for these
compounds were between 39 to 66 nm. The preliminary results showed
a general pattern that increasing the length of the rigid part of the
molecule increased the tendency to form a liquid crystalline phase.
Another general conclusion that can be drawn from these results is that
increase in the molecular length also enhanced the thermal stability of
the mesophases. This is due to increased rigidity which facilitates a better orientational order and molecular packing in the mesophases.

Experimental details 109
5. EXPERIMENTAL DETAILS

110 Experimental details
5.1. GENERAL MATERIALS
4-Bromophenol 97%, 1-bromododecane 98%, methyl iodide and
thionyl chloride 97% were purchased from Sigma-Aldrich; catechol
99%, 2-methyl-3-butyn-2-ol 98% and tin (II) chloride dihydrate were
purchased from Acros Organics and used as received. N-bro-
mosuccinimide was recrystallized from water (10mL H2O per 1 g of
NBS) prior to its use. Toluene and dimethylformamide were dried over
activated molecular sieves. Triethylamine was dried by heating under
reflux in the presence of KOH and subsequent distillation. The progress
of the reactions was monitored using thin-layer chromatography. The
intermediates were purified either by recrystallization in commercial
grade solvents or via column chromatography on silica-gel 60-200
(mesh 60A). The final compounds were purified by column
chromatography using flash silica gel. Preliminary purity tests were
performed by developing thin layer chromatographs using silica-gel Si 60-F254 TLC plates purchased from Merck.
5.2. INSTRUMENTATION AND METHODS
5.2.1. Structural Characterizations
Melting points were determined with an Olympus BX50
microscope equipped with a Mettler Toledo FP-82 hot stage. 1H and
13C
NMR spectra were recorded on a Varian Mercury Plus spectrometer
operating at 400 and 100.6 MHz, respectively. The data for 1H NMR
spectra are reported as: chemical shift, multiplicity (s = singlet, d =
doublet, dd = doublet of doublet, t = triplet, q = quintet, b = broad and m
= multiplet), integration and coupling constant (Hz). Fourier transform
infrared spectra were recorded with a Varian 3100 FT-IR Spectrometer
in the spectral region of 600-4000 cm-1. The IR spectra are reported as
neat in the cm-1
units. Mass spectra were obtained using Bruker APCI/MS/MS Ion Trap mass spectrometer.
5.2.2. Optical Analyses
UV-Vis and f luorescence spectra were recorded in HPLC grade
Chloroform. All of the UV-Vis absorption spectra and extinction

Experimental details 111
coefficients were measured on a Hewlett-Packard 8453 diode array
spectrophotometer using standard 1 cm width quartz cells. Emission
spectra were obtained on Cary Eclipse Varian s (Dr. Haidi Fiedler's
laboratory) and Hitachi F-4500 (Dr. Edson Minatti's laboratory)
spectrofluorimeters located in the Department of Chemistry, Federal
University of Santa Catarina. For calculations of the Stokes shifts, first
the emission spectra were taken by irradiating each compound at the
wavelengths of their respective lowest-energy absorption bands. The
emission wavelengths were then used for excitations. The quantum
yields were determined relative to the 4,7-bis (phenylethynyl) -2,1,3-
benzothiadiazol (Φf = 0.37 in chloroform) and quinine sulfate in 1 N
H2SO4 (Φf = 0.546) as the standard.
Since the inner filter effects reduce the fluorescence intensity at
high concentrations of the fluorescent compound, the quantum yields
were determined using dilute solutions. Initially, concentrations of both
the sample and reference compounds were adjusted such that they
exhibit the same absorbance at a particular wavelength. For accurate
quantum yield measurements, the absorbance was kept around 0.044.
Since such a low absorption cannot be measured without error, first the
product was dissolved and the absorbance of the solution was adjusted
to around 0.44 and then this solution was diluted by a factor of 10 to get
a solution with absorbance of 0.044.172
The area of each emission
spectrum was integrated and the fluorescence quantum yields were
calculated by using equation 6.
where Φf is quantum yield of the fluorescence process and the subscripts
x and s denote the unknown and standard samples respectively. A is the
absorbance at the excitation wavelength, F is the integrated emission
intensity and n is the refractive index of the solvent used.
5.2.3. Determination of The Optical Bandgaps
The optical bandgap (
) energy values were calculated from
the absorption band edge (absorption onsets) rather than the peak
maxima. The absorption onsets were determined by the most widely
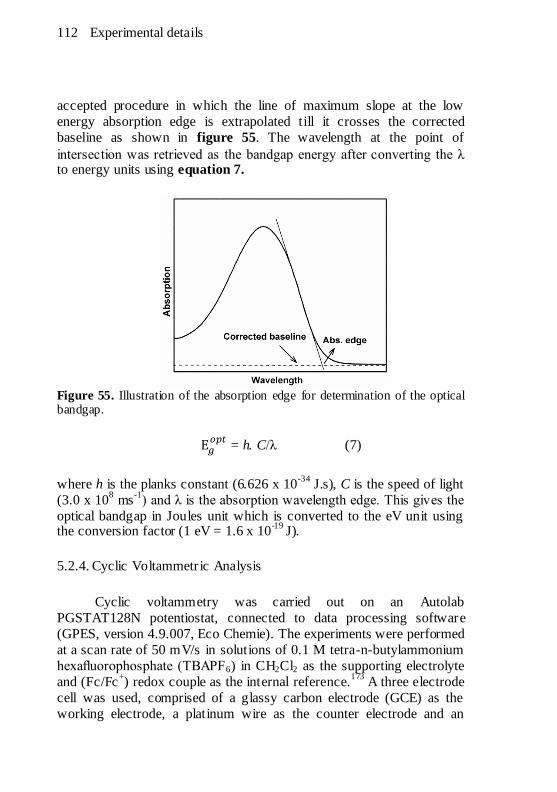
112 Experimental details
accepted procedure in which the line of maximum slope at the low
energy absorption edge is extrapolated till it crosses the corrected
baseline as shown in figure 55. The wavelength at the point of
intersection was retrieved as the bandgap energy after converting the λ to energy units using equation 7.
Figure 55. Illustration of the absorption edge for determination of the optical bandgap.
= h. C/λ (7)
where h is the planks constant (6.626 x 10⁻³⁴
J.s), C is the speed of light
(3.0 x 10⁸ ms
-1) and λ is the absorption wavelength edge. This gives the
optical bandgap in Joules unit which is converted to the eV unit using the conversion factor (1 eV = 1.6 x 10
-19 J).
5.2.4. Cyclic Voltammetric Analysis
Cyclic voltammetry was carried out on an Autolab
PGSTAT128N potentiostat, connected to data processing software
(GPES, version 4.9.007, Eco Chemie). The experiments were performed
at a scan rate of 50 mV/s in solutions of 0.1 M tetra-n-butylammonium
hexafluorophosphate (TBAPF6) in CH2Cl2 as the supporting electrolyte
and (Fc/Fc+) redox couple as the internal reference.
173 A three electrode
cell was used, comprised of a glassy carbon electrode (GCE) as the
working electrode, a platinum wire as the counter electrode and an
Experimental details 113
Ag+/AgCl electrode as the reference electrode. Prior to experiment, any
dissolved oxygen was removed from the solution by bubbling argon
through the solution. This is because oxygen is electroactive and is
reduced quite easily. The solutions were allowed to become quiescent
before the experiment, however, a blanketing layer of inert gas was
maintained over the solution to ensure absence of the interfering oxygen
during the experiment.
5.2.5. Thermal Analys is
The transition temperatures and latent heats were determined
using a TA DSC Q2000 differential scanning calorimeter. Samples
between 3 and 5 mg were weighted into aluminum pans covered by a
hold-cap and heated in a static nitrogen atmosphere. Measurements were
performed at the heating and cooling rates of 10 ºC min.-1
For
compound 51, the DSC measurements were also performed at the
heating and cooling rates of 20 ºC min-1
and 5 ºC min.-1
The first DSC
scan was retained as a valid curve to obtain information on first and
second-order thermodynamic transitions. TGA measurements were
carried out using Shimadzu TGA-50 equipment with a TA-60 WS
thermal analyzer at heating rate of 10 oC min
-1 and nitrogen f low of 50
mL min-1
. The mesophases were characterized by their textures using an
Olympus BX53 polarizing optical microscope equipped with a Mettler Toledo FP-90 hot stage control unit.
5.3. EXPERIMENTAL PROCEDURES AND SPECTRAL DATA OF THE SYNTHESIZED COMPOUNDS
Preparation of Pd(PPh3)2Cl2
The active Pd0
catalyst is air sensitive/unstable so it was
generated in-situ by reduction of the Pd(PPh3)2Cl2 as pre-catalyst. The
pre-catalyst was formed by following the general procedure of Heck.174
First a mixture of Palladium (II) Chloride (0.5 g, 2.82 mmol) and
Lithium Chloride (0.24 g, 5.64 mmol) in methanol (8 mL) was stirred at
55-60 oC till their complete dissolution. Then triphenylphosphine (1.6 g,
6.1 mmol) was added in portions. Upon PPh3 addition, the color
changed from reddish brown solution to a bright yellow suspension.
After complete addition of the PPh3,the reaction mixture was heated till
114 Experimental details
80 °C and stirred for an hour to complete the formation of the catalyst as
an insoluble yellow solid. The reaction mixture was cooled to ambient
temperature and the yellow product (1.6 g, 81%) was collected by
vacuum filtration, washed with methanol (20 mL) and dried overnight in a desiccator prior to use.
1-Bromo-4-(dodecyloxy)benzene (27)
In a 250 mL flask, a mixture of 4-bromophenol (2.67 g, 15.43
mmol), K2CO3 (4.15 g, 30 mmol) and 1- bromododecane (4.57 g, 18
mmol) in butanone (30 mL) was stirred under reflux for 24 h. After
reaction completion (indicated by TLC), the reaction mixture was
cooled to room temperature, filtered off and washed with butanone (20
mL). The filtrate was concentrated under reduced pressure and the
residue recrystallized from ethanol to give the 1-bromo-4-
(dodecyloxy)benzene 27 as white crystals.
Yield: 4.8 g, 94 %; m. p. 32.0 - 33.2 oC;
1H NMR (CDCl3): δ =
7.36 (d, 2H, J = 8.98 Hz), 6.77 (d, 2H, J = 8.98 Hz), 3.91 (t, 2H, J = 8.01
Hz), 1.76 (qui, 2H, J = 8.01 Hz), 1.44 (qui, 2H, J = 8.01 Hz), 1.26 (m,
16H), 0.88 (t, 3H, J = 7.03 Hz); 13
C NMR (CDCl3): δ = 158.37, 132.31,
116.41, 112.66, 68.39, 32.07, 29.80, 29.74, 29.50, 29.31, 26.14, 22.85,
14.28; FT-IR (KBr, cm-1
): 2942, 2903, 2835, 2537, 2277, 2037, 1872,
1584, 1488, 1459, 1289, 1246, 1175, 1103, 1072, 1032, 1004, 821, 599, 506.
4-(4-(Dodecyloxy)phenyl)-2-methylbut-3-yn-2-ol (36)
In a flame dried 3-necked flask (250 mL) under argon and fitted
with a dropping funnel, a mixture of the 1-bromo-4-
(dodecyloxy)benzene 27 (8.0 g, 23.44 mmol), Pd(PPh3)2Cl2 (0.75 g,
1.07 mmol), PPh3 (0.28 g, 1.07 mmol) and CuI (0.4 g, 2.13 mmol) in
Et3N (50 mL) was stirred at 75 oC for 30 minutes. A solution of 2-
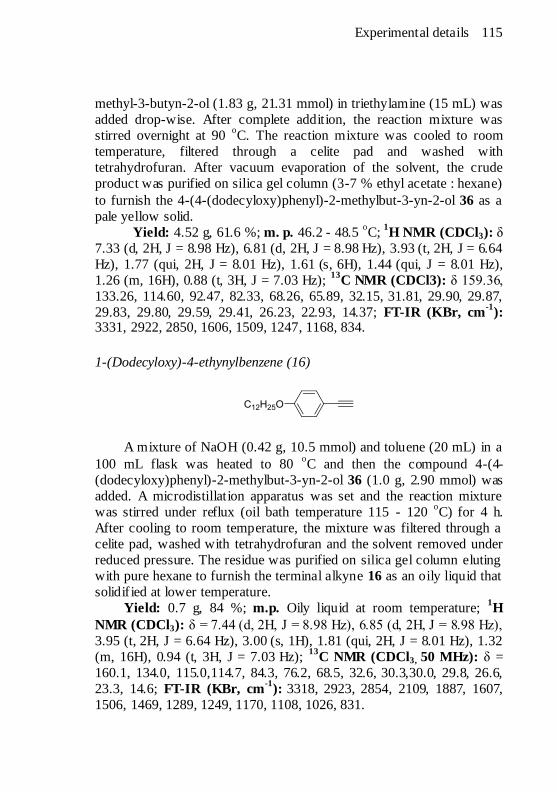
Experimental details 115
methyl-3-butyn-2-ol (1.83 g, 21.31 mmol) in triethylamine (15 mL) was
added drop-wise. After complete addition, the reaction mixture was
stirred overnight at 90 oC. The reaction mixture was cooled to room
temperature, filtered through a celite pad and washed with
tetrahydrofuran. After vacuum evaporation of the solvent, the crude
product was purified on silica gel column (3-7 % ethyl acetate : hexane)
to furnish the 4-(4-(dodecyloxy)phenyl)-2-methylbut-3-yn-2-ol 36 as a
pale yellow solid.
Yield: 4.52 g, 61.6 %; m. p. 46.2 - 48.5 oC;
1H NMR (CDCl3): δ
7.33 (d, 2H, J = 8.98 Hz), 6.81 (d, 2H, J = 8.98 Hz), 3.93 (t, 2H, J = 6.64
Hz), 1.77 (qui, 2H, J = 8.01 Hz), 1.61 (s, 6H), 1.44 (qui, J = 8.01 Hz),
1.26 (m, 16H), 0.88 (t, 3H, J = 7.03 Hz); 13
C NMR (CDCl3): δ 159.36,
133.26, 114.60, 92.47, 82.33, 68.26, 65.89, 32.15, 31.81, 29.90, 29.87,
29.83, 29.80, 29.59, 29.41, 26.23, 22.93, 14.37; FT-IR (KBr, cm-1
): 3331, 2922, 2850, 1606, 1509, 1247, 1168, 834.
1-(Dodecyloxy)-4-ethynylbenzene (16)
A mixture of NaOH (0.42 g, 10.5 mmol) and toluene (20 mL) in a
100 mL flask was heated to 80 oC and then the compound 4-(4-
(dodecyloxy)phenyl)-2-methylbut-3-yn-2-ol 36 (1.0 g, 2.90 mmol) was
added. A microdistillation apparatus was set and the reaction mixture
was stirred under reflux (oil bath temperature 115 - 120 oC) for 4 h.
After cooling to room temperature, the mixture was filtered through a
celite pad, washed with tetrahydrofuran and the solvent removed under
reduced pressure. The residue was purified on silica gel column eluting
with pure hexane to furnish the terminal alkyne 16 as an oily liquid that
solidif ied at lower temperature.
Yield: 0.7 g, 84 %; m.p. Oily liquid at room temperature; 1H
NMR (CDCl3): δ = 7.44 (d, 2H, J = 8.98 Hz), 6.85 (d, 2H, J = 8.98 Hz),
3.95 (t, 2H, J = 6.64 Hz), 3.00 (s, 1H), 1.81 (qui, 2H, J = 8.01 Hz), 1.32
(m, 16H), 0.94 (t, 3H, J = 7.03 Hz); 13
C NMR (CDCl3, 50 MHz): δ =
160.1, 134.0, 115.0,114.7, 84.3, 76.2, 68.5, 32.6, 30.3,30.0, 29.8, 26.6,
23.3, 14.6; FT-IR (KBr, cm-1
): 3318, 2923, 2854, 2109, 1887, 1607,
1506, 1469, 1289, 1249, 1170, 1108, 1026, 831.
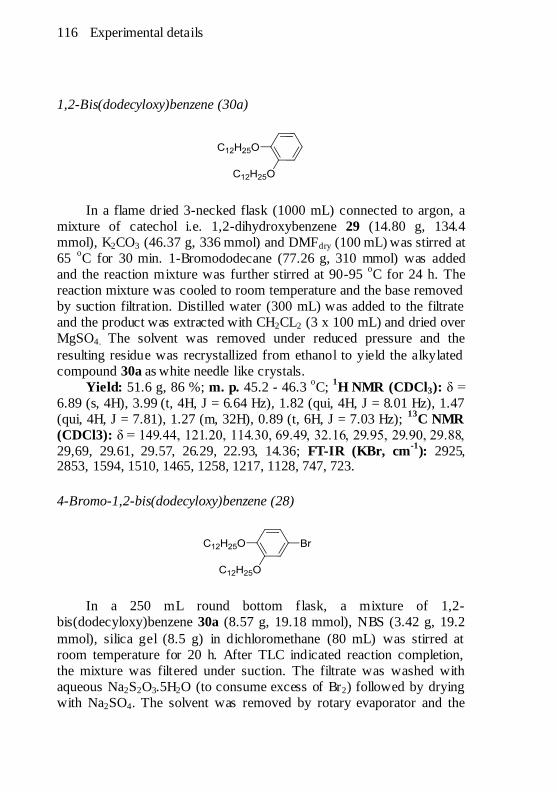
116 Experimental details
1,2-Bis(dodecyloxy)benzene (30a)
In a flame dried 3-necked flask (1000 mL) connected to argon, a
mixture of catechol i.e. 1,2-dihydroxybenzene 29 (14.80 g, 134.4
mmol), K2CO3 (46.37 g, 336 mmol) and DMFdry (100 mL) was stirred at
65 oC for 30 min. 1-Bromododecane (77.26 g, 310 mmol) was added
and the reaction mixture was further stirred at 90-95 oC for 24 h. The
reaction mixture was cooled to room temperature and the base removed
by suction filtration. Distilled water (300 mL) was added to the filtrate
and the product was extracted with CH2CL2 (3 x 100 mL) and dried over
MgSO4. The solvent was removed under reduced pressure and the
resulting residue was recrystallized from ethanol to yield the alkylated
compound 30a as white needle like crystals.
Yield: 51.6 g, 86 %; m. p. 45.2 - 46.3 oC;
1H NMR (CDCl3): δ =
6.89 (s, 4H), 3.99 (t, 4H, J = 6.64 Hz), 1.82 (qui, 4H, J = 8.01 Hz), 1.47
(qui, 4H, J = 7.81), 1.27 (m, 32H), 0.89 (t, 6H, J = 7.03 Hz); 13
C NMR
(CDCl3): δ = 149.44, 121.20, 114.30, 69.49, 32.16, 29.95, 29.90, 29.88,
29,69, 29.61, 29.57, 26.29, 22.93, 14.36; FT-IR (KBr, cm-1
): 2925, 2853, 1594, 1510, 1465, 1258, 1217, 1128, 747, 723.
4-Bromo-1,2-bis(dodecyloxy)benzene (28)
In a 250 mL round bottom flask, a mixture of 1,2-
bis(dodecyloxy)benzene 30a (8.57 g, 19.18 mmol), NBS (3.42 g, 19.2
mmol), silica gel (8.5 g) in dichloromethane (80 mL) was stirred at
room temperature for 20 h. After TLC indicated reaction completion,
the mixture was filtered under suction. The filtrate was washed with
aqueous Na2S2O3.5H2O (to consume excess of Br2) followed by drying
with Na2SO4. The solvent was removed by rotary evaporator and the
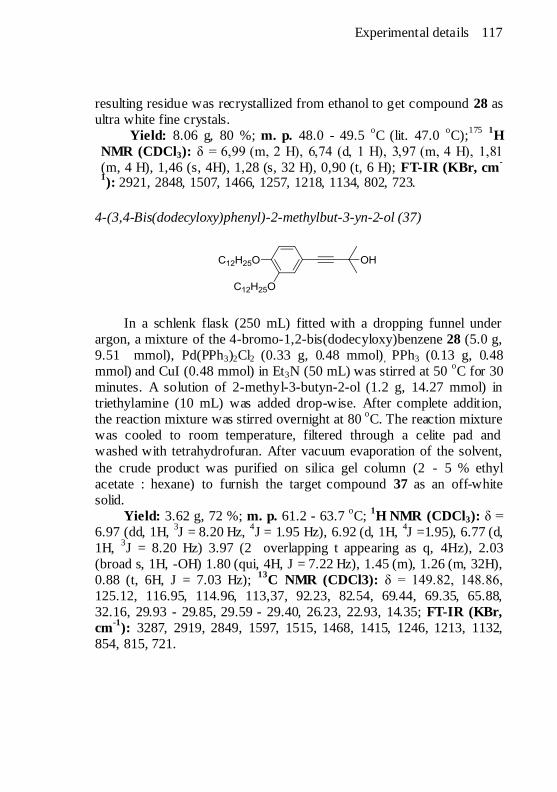
Experimental details 117
resulting residue was recrystallized from ethanol to get compound 28 as
ultra white fine crystals.
Yield: 8.06 g, 80 %; m. p. 48.0 - 49.5 oC (lit. 47.0
oC);
175
1H
NMR (CDCl3): δ = 6,99 (m, 2 H), 6,74 (d, 1 H), 3,97 (m, 4 H), 1,81
(m, 4 H), 1,46 (s, 4H), 1,28 (s, 32 H), 0,90 (t, 6 H); FT-IR (KBr, cm-
1): 2921, 2848, 1507, 1466, 1257, 1218, 1134, 802, 723.
4-(3,4-Bis(dodecyloxy)phenyl)-2-methylbut-3-yn-2-ol (37)
In a schlenk flask (250 mL) fitted with a dropping funnel under
argon, a mixture of the 4-bromo-1,2-bis(dodecyloxy)benzene 28 (5.0 g,
9.51 mmol), Pd(PPh3)2Cl2 (0.33 g, 0.48 mmol), PPh3 (0.13 g, 0.48
mmol) and CuI (0.48 mmol) in Et3N (50 mL) was stirred at 50 oC for 30
minutes. A solution of 2-methyl-3-butyn-2-ol (1.2 g, 14.27 mmol) in
triethylamine (10 mL) was added drop-wise. After complete addition,
the reaction mixture was stirred overnight at 80 oC. The reaction mixture
was cooled to room temperature, filtered through a celite pad and
washed with tetrahydrofuran. After vacuum evaporation of the solvent,
the crude product was purified on silica gel column (2 - 5 % ethyl
acetate : hexane) to furnish the target compound 37 as an off-white
solid.
Yield: 3.62 g, 72 %; m. p. 61.2 - 63.7 oC;
1H NMR (CDCl3): δ =
6.97 (dd, 1H, 3J = 8.20 Hz,
4J = 1.95 Hz), 6.92 (d, 1H,
4J =1.95), 6.77 (d,
1H, 3J = 8.20 Hz) 3.97 (2 overlapping t appearing as q, 4Hz), 2.03
(broad s, 1H, -OH) 1.80 (qui, 4H, J = 7.22 Hz), 1.45 (m), 1.26 (m, 32H),
0.88 (t, 6H, J = 7.03 Hz); 13
C NMR (CDCl3): δ = 149.82, 148.86,
125.12, 116.95, 114.96, 113,37, 92.23, 82.54, 69.44, 69.35, 65.88,
32.16, 29.93 - 29.85, 29.59 - 29.40, 26.23, 22.93, 14.35; FT-IR (KBr,
cm-1
): 3287, 2919, 2849, 1597, 1515, 1468, 1415, 1246, 1213, 1132,
854, 815, 721.
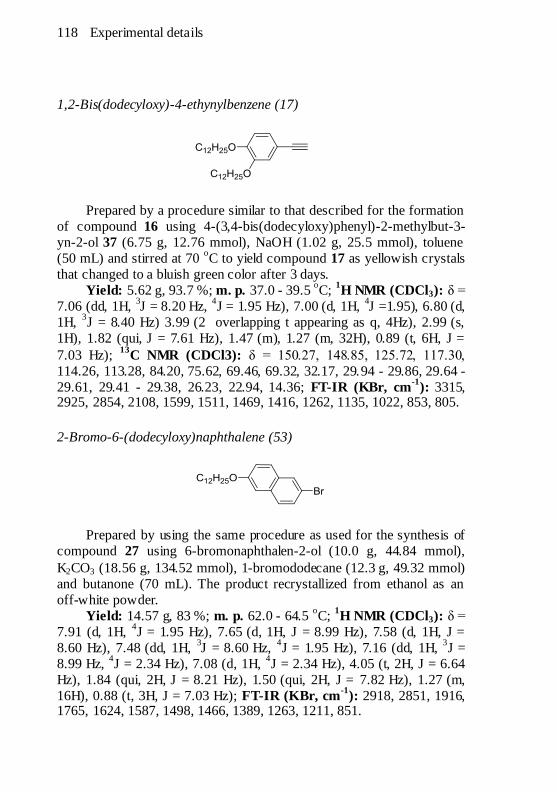
118 Experimental details
1,2-Bis(dodecyloxy)-4-ethynylbenzene (17)
Prepared by a procedure similar to that described for the formation
of compound 16 using 4-(3,4-bis(dodecyloxy)phenyl)-2-methylbut-3-
yn-2-ol 37 (6.75 g, 12.76 mmol), NaOH (1.02 g, 25.5 mmol), toluene
(50 mL) and stirred at 70 oC to yield compound 17 as yellowish crystals
that changed to a bluish green color after 3 days.
Yield: 5.62 g, 93.7 %; m. p. 37.0 - 39.5 oC;
1H NMR (CDCl3): δ =
7.06 (dd, 1H, 3J = 8.20 Hz,
4J = 1.95 Hz), 7.00 (d, 1H,
4J =1.95), 6.80 (d,
1H, 3J = 8.40 Hz) 3.99 (2 overlapping t appearing as q, 4Hz), 2.99 (s,
1H), 1.82 (qui, J = 7.61 Hz), 1.47 (m), 1.27 (m, 32H), 0.89 (t, 6H, J =
7.03 Hz); 13
C NMR (CDCl3): δ = 150.27, 148.85, 125.72, 117.30,
114.26, 113.28, 84.20, 75.62, 69.46, 69.32, 32.17, 29.94 - 29.86, 29.64 -
29.61, 29.41 - 29.38, 26.23, 22.94, 14.36; FT-IR (KBr, cm-1
): 3315,
2925, 2854, 2108, 1599, 1511, 1469, 1416, 1262, 1135, 1022, 853, 805.
2-Bromo-6-(dodecyloxy)naphthalene (53)
Prepared by using the same procedure as used for the synthesis of
compound 27 using 6-bromonaphthalen-2-ol (10.0 g, 44.84 mmol),
K2CO3 (18.56 g, 134.52 mmol), 1-bromododecane (12.3 g, 49.32 mmol)
and butanone (70 mL). The product recrystallized from ethanol as an
off-white powder.
Yield: 14.57 g, 83 %; m. p. 62.0 - 64.5 oC;
1H NMR (CDCl3): δ =
7.91 (d, 1H, 4J = 1.95 Hz), 7.65 (d, 1H, J = 8.99 Hz), 7.58 (d, 1H, J =
8.60 Hz), 7.48 (dd, 1H, 3J = 8.60 Hz,
4J = 1.95 Hz), 7.16 (dd, 1H,
3J =
8.99 Hz, 4J = 2.34 Hz), 7.08 (d, 1H,
4J = 2.34 Hz), 4.05 (t, 2H, J = 6.64
Hz), 1.84 (qui, 2H, J = 8.21 Hz), 1.50 (qui, 2H, J = 7.82 Hz), 1.27 (m,
16H), 0.88 (t, 3H, J = 7.03 Hz); FT-IR (KBr, cm-1
): 2918, 2851, 1916, 1765, 1624, 1587, 1498, 1466, 1389, 1263, 1211, 851.
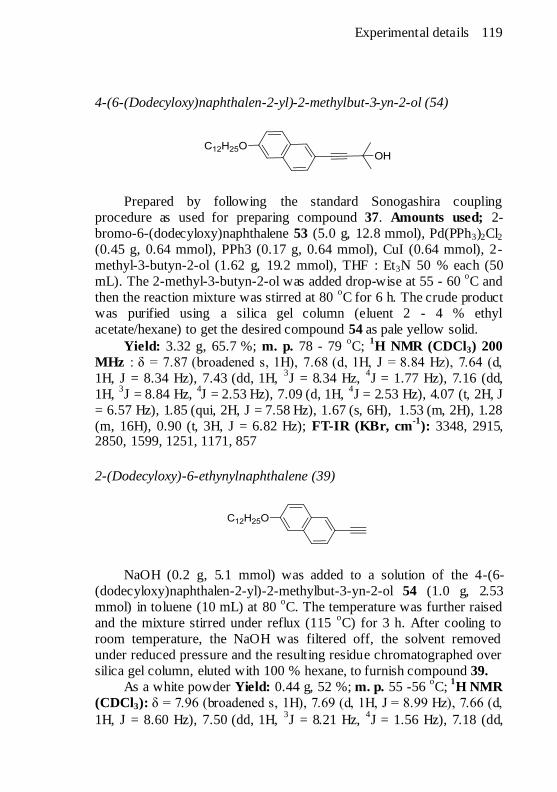
Experimental details 119
4-(6-(Dodecyloxy)naphthalen-2-yl)-2-methylbut-3-yn-2-ol (54)
Prepared by following the standard Sonogashira coupling
procedure as used for preparing compound 37. Amounts used; 2-
bromo-6-(dodecyloxy)naphthalene 53 (5.0 g, 12.8 mmol), Pd(PPh3)2Cl2
(0.45 g, 0.64 mmol), PPh3 (0.17 g, 0.64 mmol), CuI (0.64 mmol), 2-
methyl-3-butyn-2-ol (1.62 g, 19.2 mmol), THF : Et3N 50 % each (50
mL). The 2-methyl-3-butyn-2-ol was added drop-wise at 55 - 60 oC and
then the reaction mixture was stirred at 80 oC for 6 h. The crude product
was purified using a silica gel column (eluent 2 - 4 % ethyl
acetate/hexane) to get the desired compound 54 as pale yellow solid.
Yield: 3.32 g, 65.7 %; m. p. 78 - 79 oC;
1H NMR (CDCl3) 200
MHz : δ = 7.87 (broadened s, 1H), 7.68 (d, 1H, J = 8.84 Hz), 7.64 (d,
1H, J = 8.34 Hz), 7.43 (dd, 1H, 3J = 8.34 Hz,
4J = 1.77 Hz), 7.16 (dd,
1H, 3J = 8.84 Hz,
4J = 2.53 Hz), 7.09 (d, 1H,
4J = 2.53 Hz), 4.07 (t, 2H, J
= 6.57 Hz), 1.85 (qui, 2H, J = 7.58 Hz), 1.67 (s, 6H), 1.53 (m, 2H), 1.28
(m, 16H), 0.90 (t, 3H, J = 6.82 Hz); FT-IR (KBr, cm-1
): 3348, 2915, 2850, 1599, 1251, 1171, 857
2-(Dodecyloxy)-6-ethynylnaphthalene (39)
NaOH (0.2 g, 5.1 mmol) was added to a solution of the 4-(6-
(dodecyloxy)naphthalen-2-yl)-2-methylbut-3-yn-2-ol 54 (1.0 g, 2.53
mmol) in toluene (10 mL) at 80 oC. The temperature was further raised
and the mixture stirred under reflux (115 oC) for 3 h. After cooling to
room temperature, the NaOH was filtered off, the solvent removed
under reduced pressure and the resulting residue chromatographed over
silica gel column, eluted with 100 % hexane, to furnish compound 39.
As a white powder Yield: 0.44 g, 52 %; m. p. 55 -56 oC;
1H NMR
(CDCl3): δ = 7.96 (broadened s, 1H), 7.69 (d, 1H, J = 8.99 Hz), 7.66 (d,
1H, J = 8.60 Hz), 7.50 (dd, 1H, 3J = 8.21 Hz,
4J = 1.56 Hz), 7.18 (dd,
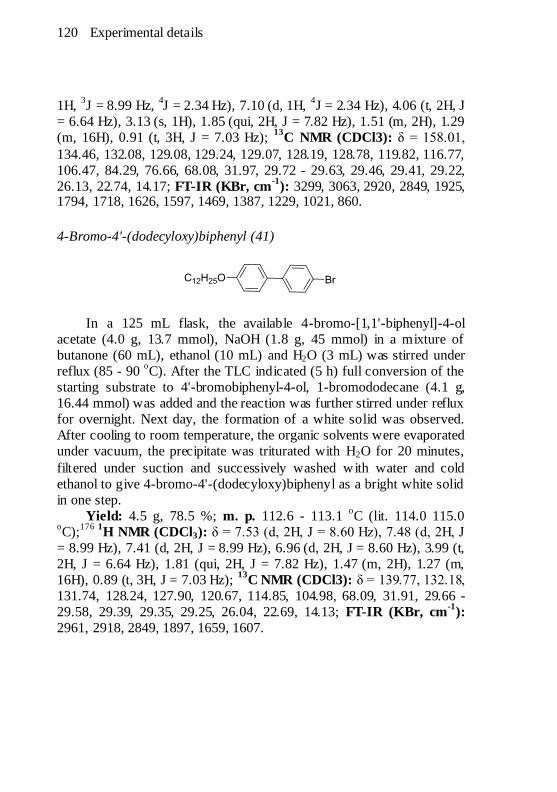
120 Experimental details
1H, 3J = 8.99 Hz,
4J = 2.34 Hz), 7.10 (d, 1H,
4J = 2.34 Hz), 4.06 (t, 2H, J
= 6.64 Hz), 3.13 (s, 1H), 1.85 (qui, 2H, J = 7.82 Hz), 1.51 (m, 2H), 1.29
(m, 16H), 0.91 (t, 3H, J = 7.03 Hz); 13
C NMR (CDCl3): δ = 158.01,
134.46, 132.08, 129.08, 129.24, 129.07, 128.19, 128.78, 119.82, 116.77,
106.47, 84.29, 76.66, 68.08, 31.97, 29.72 - 29.63, 29.46, 29.41, 29.22,
26.13, 22.74, 14.17; FT-IR (KBr, cm-1
): 3299, 3063, 2920, 2849, 1925, 1794, 1718, 1626, 1597, 1469, 1387, 1229, 1021, 860.
4-Bromo-4'-(dodecyloxy)biphenyl (41)
In a 125 mL flask, the available 4-bromo-[1,1'-biphenyl]-4-ol
acetate (4.0 g, 13.7 mmol), NaOH (1.8 g, 45 mmol) in a mixture of
butanone (60 mL), ethanol (10 mL) and H2O (3 mL) was stirred under
reflux (85 - 90 oC). After the TLC indicated (5 h) full conversion of the
starting substrate to 4'-bromobiphenyl-4-ol, 1-bromododecane (4.1 g,
16.44 mmol) was added and the reaction was further stirred under reflux
for overnight. Next day, the formation of a white solid was observed.
After cooling to room temperature, the organic solvents were evaporated
under vacuum, the precipitate was triturated with H2O for 20 minutes,
filtered under suction and successively washed with water and cold
ethanol to give 4-bromo-4'-(dodecyloxy)biphenyl as a bright white solid
in one step.
Yield: 4.5 g, 78.5 %; m. p. 112.6 - 113.1 oC (lit. 114.0 115.0
oC);
176 1H NMR (CDCl3): δ = 7.53 (d, 2H, J = 8.60 Hz), 7.48 (d, 2H, J
= 8.99 Hz), 7.41 (d, 2H, J = 8.99 Hz), 6.96 (d, 2H, J = 8.60 Hz), 3.99 (t,
2H, J = 6.64 Hz), 1.81 (qui, 2H, J = 7.82 Hz), 1.47 (m, 2H), 1.27 (m,
16H), 0.89 (t, 3H, J = 7.03 Hz); 13
C NMR (CDCl3): δ = 139.77, 132.18,
131.74, 128.24, 127.90, 120.67, 114.85, 104.98, 68.09, 31.91, 29.66 -
29.58, 29.39, 29.35, 29.25, 26.04, 22.69, 14.13; FT-IR (KBr, cm-1
):
2961, 2918, 2849, 1897, 1659, 1607.

Experimental details 121
4-(4'-(Dodecyloxy)biphenyl-4-yl)-2-methylbut-3-yn-2-ol (42)
Prepared by following the same procedure as used for analogous
reactions. Amounts of reagents used: 4-bromo-4'-(dodecyloxy)biph-
enyl 41 (4.0 g, 9.58 mmol), Pd(PPh3)2Cl2 (0.34 g, 0.48 mmol), PPh3
(0.12 g, 0.48 mmol), CuI (0.48 mmol), 2-methyl-3-butyn-2-ol (0.97 g,
11.5 mmol), THF : Et3N 50 % each (50 mL). The reaction mixture was
stirred at 80 oC for 15 h and after reaction work up, the product was
purified on a silica gel column eluted with 3-5 % ethyl acetate/hexane to
get the target compound 42.
A pale yellow solid. Yield: 1.6 g, 40 %; m. p. 127.5 - 130 oC;
1H
NMR (CDCl3): δ = 7.51 (overlapped d, 2H), 7.49 (overlapped d, 2H),
7.45 (d, 2H, J = 8.60 Hz), 6.96 (d, 2H, J = 8.60 Hz), 3.99 (t, 2H, J = 6.64
Hz), 2.07 (broad s, 1H), 1.80 (qui, 2H, J = 7.82 Hz), 1.63 (s, 6H), 1.46
(m, 2H), 1.26 (m, 16H), 0.88 (t, 3H, J = 7.03 Hz); 13
C NMR (CDCl3): δ
= 158.99, 140.64, 132.52, 132.0, 127.97, 126.37, 120.80, 114.83, 94.08,
82.13, 68.11, 65.69, 31.91, 31.53, 29.66 - 29.58, 29.40, 29.35, 29.26,
26.04, 22.69, 14.12; FT-IR (KBr, cm-1
): 3444, 2987, 2959, 2920, 2849, 1608, 1578, 1528, 1497.
4-(Dodecyloxy)-4'-ethynylbiphenyl (40)
Prepared by procedure as followed for preparing the compound 39.
Amounts of reagents used: 4-(4'-(dodecyloxy)biphenyl-4-yl)-2-
methylbut-3-yn-2-ol 42 (1.47 g, 3.5 mmol), NaOH (0.42 g, 10.5 mmol),
toluene (30 mL). Purification on silica gel column eluted with pure
hexane to furnish compound 40 as a white solid.
Yield: 0.7 g, 55 %; m. p. 97.0 - 98.5 oC;
1H NMR (CDCl3): δ =
7.55 - 7.50 (m, 6H), 6.97 (d, 2H, J = 8.60 Hz), 3.99 (t, 2H, J = 6.64 Hz),
3.12 (s, 1H), 1.80 (qui, 2H, J = 7.82 Hz), 1.47 (m, 2H), 1.27 (m, 16H),
0.89 (t, 3H, J = 7.03 Hz); 13
C NMR (CDCl3): δ = 159.05, 141.12,
132.49, 128.02, 126.43, 120.12, 114.83, 83.67, 77.45, 68.09, 31.91,
29.66 - 29.58, 29.39 - 29.25, 26.04, 22.69, 14.13; FT-IR (KBr, cm-1
):

122 Experimental details
3288, 3092, 3038, 2955, 2919, 2872, 2850, 2106, 1919, 1896, 1875, 1665, 1608, 1581, 1529.
1,2-Bis(dodecyloxy)-4,5-dinitrobenzene (31a)
A solution of 30a (14.0 g, 31.36 mmol) in dichloromethane (150
ml) was added drop-wise to vigorously stirred concentrated HNO3 (80
ml) over a period of 30 min. After stirring for 2 h at room temperature,
concentrated sulfuric acid (40 ml) was added in portions and stirred
overnight at room temperature. The reaction mixture was next poured
onto crushed ice and the resultant suspension was extracted with
dichloromethane (3 x 50 ml). The organic layer was washed thoroughly
with saturated aqueous sodium carbonate, then with water, and finally
dried over anhydrous MgSO4. The solvent was evaporated to give a
crude product which was crystallized from ethanol to give compound
31a as a bright yellow crystalline solid.
Yield: 14.76 g, 88 %; m. p. 79.0 -80.0 oC;
1H NMR (CDCl3): δ =
7.26 (s, 2H), 4.09 (t, 4H, J = 6.44 Hz), 1.87 (qui, 4H, J = 8.01 Hz), 1.48
(qui, 4H, J = 8.01), 1.26 (m, 32H), 0.88 (t, 6H, J = 7.03 Hz); 13
C NMR
(CDCl3): δ = 151.98, 136.68, 108.03, 70.40, 32.16, 29.91, 29.47, 28.91,
26.04, 22.93, 14.37; FT-IR (KBr, cm-1
): 2123, 3070, 2917, 2850, 1727,
1586, 1529, 1465, 1372, 1334, 1289, 1225, 1070, 1041, 987, 949, 909, 872, 823.
4,5-Bis(dodecyloxy)benzene-1,2-diammonium chloride (33)177
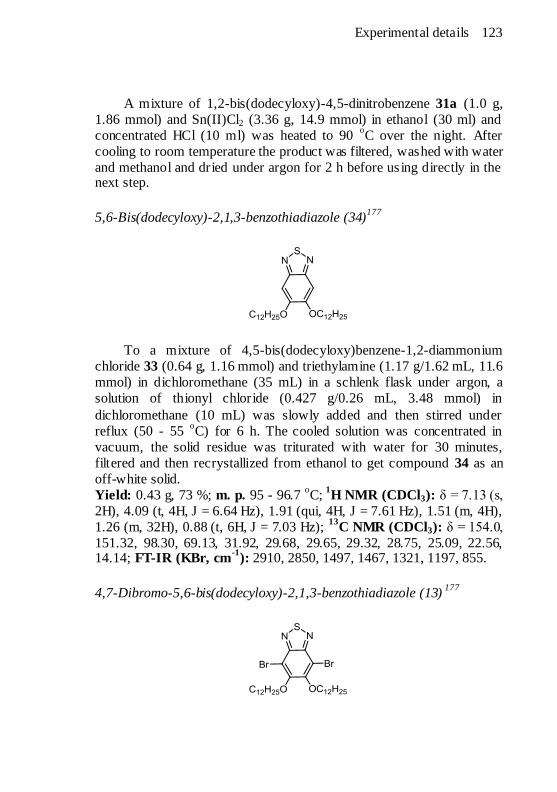
Experimental details 123
A mixture of 1,2-bis(dodecyloxy)-4,5-dinitrobenzene 31a (1.0 g,
1.86 mmol) and Sn(II)Cl2 (3.36 g, 14.9 mmol) in ethanol (30 ml) and
concentrated HCl (10 ml) was heated to 90 oC over the night. After
cooling to room temperature the product was filtered, washed with water
and methanol and dried under argon for 2 h before us ing directly in the next step.
5,6-Bis(dodecyloxy)-2,1,3-benzothiadiazole (34)177
To a mixture of 4,5-bis(dodecyloxy)benzene-1,2-diammonium
chloride 33 (0.64 g, 1.16 mmol) and triethylamine (1.17 g/1.62 mL, 11.6
mmol) in dichloromethane (35 mL) in a schlenk flask under argon, a
solution of thionyl chloride (0.427 g/0.26 mL, 3.48 mmol) in
dichloromethane (10 mL) was slowly added and then stirred under
reflux (50 - 55 oC) for 6 h. The cooled solution was concentrated in
vacuum, the solid residue was triturated with water for 30 minutes,
filtered and then recrystallized from ethanol to get compound 34 as an
off-white solid.
Yield: 0.43 g, 73 %; m. p. 95 - 96.7 oC;
1H NMR (CDCl3): δ = 7.13 (s,
2H), 4.09 (t, 4H, J = 6.64 Hz), 1.91 (qui, 4H, J = 7.61 Hz), 1.51 (m, 4H),
1.26 (m, 32H), 0.88 (t, 6H, J = 7.03 Hz); 13
C NMR (CDCl3): δ = 154.0,
151.32, 98.30, 69.13, 31.92, 29.68, 29.65, 29.32, 28.75, 25.09, 22.56, 14.14; FT-IR (KBr, cm
-1): 2910, 2850, 1497, 1467, 1321, 1197, 855.
4,7-Dibromo-5,6-bis(dodecyloxy)-2,1,3-benzothiadiazole (13) 177
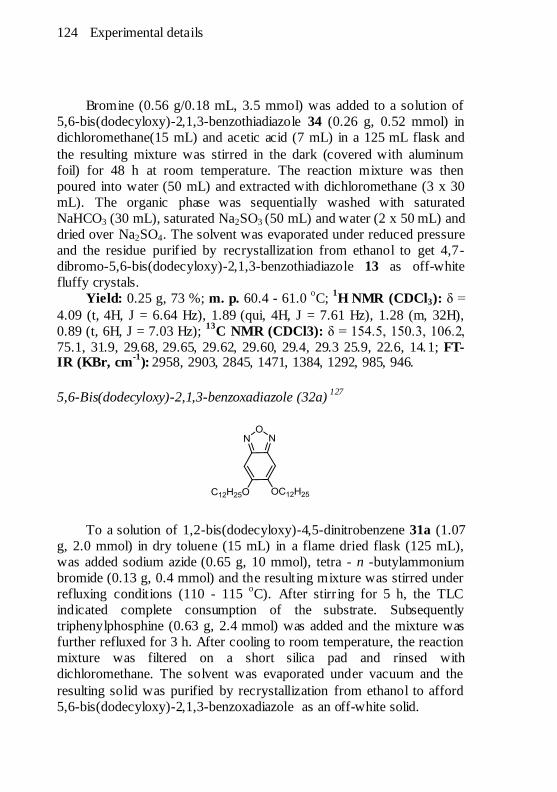
124 Experimental details
Bromine (0.56 g/0.18 mL, 3.5 mmol) was added to a solution of
5,6-bis(dodecyloxy)-2,1,3-benzothiadiazole 34 (0.26 g, 0.52 mmol) in
dichloromethane(15 mL) and acetic acid (7 mL) in a 125 mL flask and
the resulting mixture was stirred in the dark (covered with aluminum
foil) for 48 h at room temperature. The reaction mixture was then
poured into water (50 mL) and extracted with dichloromethane (3 x 30
mL). The organic phase was sequentially washed with saturated
NaHCO3 (30 mL), saturated Na2SO3 (50 mL) and water (2 x 50 mL) and
dried over Na2SO4. The solvent was evaporated under reduced pressure
and the residue purif ied by recrystallization from ethanol to get 4,7-
dibromo-5,6-bis(dodecyloxy)-2,1,3-benzothiadiazole 13 as off-white
fluffy crystals.
Yield: 0.25 g, 73 %; m. p. 60.4 - 61.0 oC;
1H NMR (CDCl3): δ =
4.09 (t, 4H, J = 6.64 Hz), 1.89 (qui, 4H, J = 7.61 Hz), 1.28 (m, 32H),
0.89 (t, 6H, J = 7.03 Hz); 13
C NMR (CDCl3): δ = 154.5, 150.3, 106.2,
75.1, 31.9, 29.68, 29.65, 29.62, 29.60, 29.4, 29.3 25.9, 22.6, 14.1; FT-IR (KBr, cm
-1):
2958, 2903, 2845, 1471, 1384, 1292, 985, 946.
5,6-Bis(dodecyloxy)-2,1,3-benzoxadiazole (32a) 127
To a solution of 1,2-bis(dodecyloxy)-4,5-dinitrobenzene 31a (1.07
g, 2.0 mmol) in dry toluene (15 mL) in a flame dried flask (125 mL),
was added sodium azide (0.65 g, 10 mmol), tetra - n -butylammonium
bromide (0.13 g, 0.4 mmol) and the resulting mixture was stirred under
refluxing conditions (110 - 115 oC). After stirr ing for 5 h, the TLC
indicated complete consumption of the substrate. Subsequently
triphenylphosphine (0.63 g, 2.4 mmol) was added and the mixture was
further refluxed for 3 h. After cooling to room temperature, the reaction
mixture was filtered on a short silica pad and rinsed with
dichloromethane. The solvent was evaporated under vacuum and the
resulting solid was purified by recrystallization from ethanol to afford
5,6-bis(dodecyloxy)-2,1,3-benzoxadiazole as an off-white solid.

Experimental details 125
Yield: 0.75 g, 77 %; m. p. 107.3 - 108.8 oC;
1H NMR (CDCl3): δ
= 6.81 (s, 2H), 4.07 (t, 4H, J = 6.64 Hz), 1.90 (qui, 4H, J = 7.62 Hz),
1.51 (m, 4H), 1.27 (m, 32H), 0.88 (t, 6H, J = 7.03 Hz); FT-IR (KBr,
cm-1
): 2913, 2847, 1502, 1471, 1318, 1202, 848; CHN: Expected
C30H52N2O3: C 73.72, H 10.72, N 5.73. Found: C 73.72, H 10.69, N 5.70.
4,7-Dibromo-5,6-bis(dodecyloxy)-2,1,3-benzoxadiazole (14) 127
To a solution of compound 32a (0.3g, 0.61 mmol) in
dichloromethane (10 mL), was added acetic acid (2 mL) and then
bromine (0.48 g, 3.0 mmol). The flask was covered with aluminum foil
and stirred at room temperature for 72 h in dark. A solution of 20 %
NaOH (20 mL) was added and the resulting yellowish suspension was
extracted with dichloromethane (3 x 50 mL). The organic phase was
washed with brine (30 mL) followed water (30 mL), dried over Na2SO4
and the solvent evaporated on vacuum rotary evaporator to furnish
compound 14 as an off-white solid that was characterized without any
further purification.
Yield: (0.36g, 91 %; m. p. 55.1 - 56.0 oC;
1H NMR (CDCl3): δ =
4.15 (t, 4H, J = 6.64 Hz), 1.86 (qui, 4H, J = 7.81 Hz), 1.52 (m, 4H), 1.27
(m, 32H), 0.89 (t, 6H, J = 7.03 Hz); FT-IR (KBr, cm-1
): 2954, 2919,
2851, 2331, 1734, 1612, 1473, 1380, 1296, 1187, 1072, 1014, 996, 948,
883, 723. CHN: Expected C30H50 Br2N2O3: C 55.73, H 7.79, N 4.33.
Found: C 55.72, H 7.80, N 4.30.
1,2-Dimethoxybenzene/veratrol (30b)
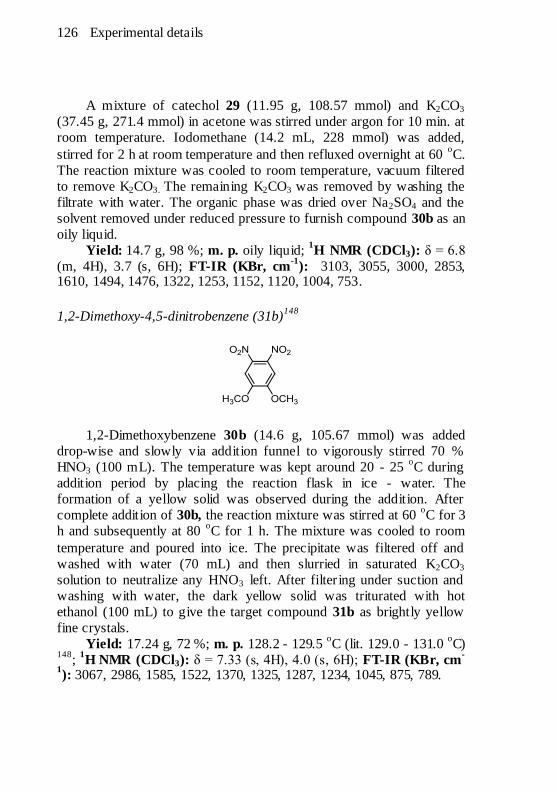
126 Experimental details
A mixture of catechol 29 (11.95 g, 108.57 mmol) and K2CO3
(37.45 g, 271.4 mmol) in acetone was stirred under argon for 10 min. at
room temperature. Iodomethane (14.2 mL, 228 mmol) was added,
stirred for 2 h at room temperature and then refluxed overnight at 60 oC.
The reaction mixture was cooled to room temperature, vacuum filtered
to remove K2CO3. The remaining K2CO3 was removed by washing the
filtrate with water. The organic phase was dried over Na2SO4 and the
solvent removed under reduced pressure to furnish compound 30b as an
oily liquid.
Yield: 14.7 g, 98 %; m. p. oily liquid;
1H NMR (CDCl3): δ = 6.8
(m, 4H), 3.7 (s, 6H); FT-IR (KBr, cm-1
): 3103, 3055, 3000, 2853, 1610, 1494, 1476, 1322, 1253, 1152, 1120, 1004, 753.
1,2-Dimethoxy-4,5-dinitrobenzene (31b)148
1,2-Dimethoxybenzene 30b (14.6 g, 105.67 mmol) was added
drop-wise and slowly via addition funnel to vigorously stirred 70 %
HNO3 (100 mL). The temperature was kept around 20 - 25 oC during
addition period by placing the reaction flask in ice - water. The
formation of a yellow solid was observed during the addition. After
complete addition of 30b, the reaction mixture was stirred at 60 oC for 3
h and subsequently at 80 oC for 1 h. The mixture was cooled to room
temperature and poured into ice. The precipitate was filtered off and
washed with water (70 mL) and then slurried in saturated K2CO3
solution to neutralize any HNO3 left. After filter ing under suction and
washing with water, the dark yellow solid was triturated with hot
ethanol (100 mL) to give the target compound 31b as brightly yellow
fine crystals.
Yield: 17.24 g, 72 %; m. p. 128.2 - 129.5 oC (lit. 129.0 - 131.0
oC)
148;
1H NMR (CDCl3): δ = 7.33 (s, 4H), 4.0 (s, 6H); FT-IR (KBr, cm
-
1): 3067, 2986, 1585, 1522, 1370, 1325, 1287, 1234, 1045, 875, 789.

Experimental details 127
5,6-Dimethoxy-2,1,3-benzoxadiazole (32b)
Prepared by the cyclization of compound 31b by the same
procedure as followed for preparing compound 32a. Amounts used;
1,2-dimethoxy-4,5-dinitrobenzene 31b (5 g, 21.91 mmol), NaN3 (7.12 g,
109.57 mmol), tetra-n-butylammonium bromide (1.41 g, 4.38 mmol),
triphenylphosphine (6.9 g, 26.28 mmol), toluene (70 mL). After
complete work-up and solvent evaporation, the resulting solid was
purified by recrystallization in methanol to give the target compound
32b as golden-yellow fine crystalline solid.
Yield: 3.2 g, 81 %; m. p. 195 - 197 oC;
1H NMR (CDCl3): δ =
6.88 (s, 4H), 3.99 (s, 6H); 13
C NMR (CDCl3): δ = 155.36, 146.69,
90.67, 56.58; FT-IR (KBr, cm-1
): 3146, 3082, 3069, 2995, 2943, 2847,
2442, 1635, 1544, 1521, 1447, 1368, 1244, 1224, 1178, 1001, 854;
CHN: Expected C8H8N2O3 : C 53.33, H 4.48, N 15.55. Found: C 53.30,
H 4.50, N 15.56.
4,7-Dibromo-5,6-dimethoxy-2,1,3-benzoxadiazole (15)
Prepared by the bromination of the compound 32b by the same
procedure as followed for preparation of the compound 14. Amounts
used; 5,6-dimethoxy-2,1,3-benzoxadiazole (0.4 g, 2.22 mmol), bromine
(1.77 g/0.57 mL, 11.1 mmol), dichloromethane (25 mL), acetic acid (4
mL). The product 15 was recrystallized from methanol (0.37 g, 49.3 %)
as an off-white crystalline solid.
Yield: 0.37 g, 49.3 %; m. p. 128.5 - 131.0 oC;
1H NMR (CDCl3): δ =
4.03 (s); FT-IR (KBr, cm-1
): 3010, 2952, 2847, 2363, 2136, 1608,
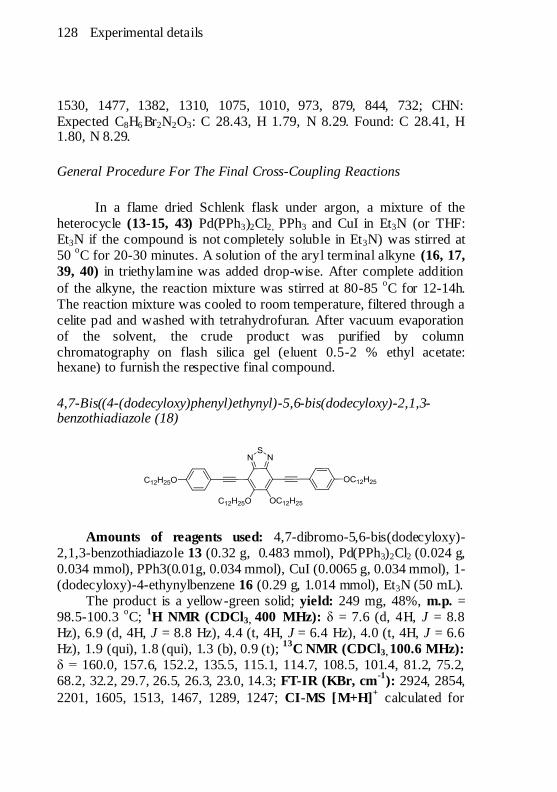
128 Experimental details
1530, 1477, 1382, 1310, 1075, 1010, 973, 879, 844, 732; CHN:
Expected C8H6 Br2N2O3: C 28.43, H 1.79, N 8.29. Found: C 28.41, H 1.80, N 8.29.
General Procedure For The Final Cross-Coupling Reactions
In a flame dried Schlenk flask under argon, a mixture of the
heterocycle (13-15, 43) Pd(PPh3)2Cl2, PPh3 and CuI in Et3N (or THF:
Et3N if the compound is not completely soluble in Et3N) was stirred at
50 oC for 20-30 minutes. A solution of the aryl terminal alkyne (16, 17,
39, 40) in triethylamine was added drop-wise. After complete addition
of the alkyne, the reaction mixture was stirred at 80-85 oC for 12-14h.
The reaction mixture was cooled to room temperature, filtered through a
celite pad and washed with tetrahydrofuran. After vacuum evaporation
of the solvent, the crude product was purified by column
chromatography on flash silica gel (eluent 0.5-2 % ethyl acetate: hexane) to furnish the respective final compound.
4,7-Bis((4-(dodecyloxy)phenyl)ethynyl)-5,6-bis(dodecyloxy)-2,1,3-benzothiadiazole (18)
Amounts of reagents used: 4,7-dibromo-5,6-bis(dodecyloxy)-
2,1,3-benzothiadiazole 13 (0.32 g, 0.483 mmol), Pd(PPh3)2Cl2 (0.024 g,
0.034 mmol), PPh3(0.01g, 0.034 mmol), CuI (0.0065 g, 0.034 mmol), 1-
(dodecyloxy)-4-ethynylbenzene 16 (0.29 g, 1.014 mmol), Et3N (50 mL).
The product is a yellow-green solid; yield: 249 mg, 48%, m.p. =
98.5-100.3 oC;
1H NMR (CDCl3, 400 MHz): δ = 7.6 (d, 4H, J = 8.8
Hz), 6.9 (d, 4H, J = 8.8 Hz), 4.4 (t, 4H, J = 6.4 Hz), 4.0 (t, 4H, J = 6.6
Hz), 1.9 (qui), 1.8 (qui), 1.3 (b), 0.9 (t); 13
C NMR (CDCl3, 100.6 MHz):
δ = 160.0, 157.6, 152.2, 135.5, 115.1, 114.7, 108.5, 101.4, 81.2, 75.2,
68.2, 32.2, 29.7, 26.5, 26.3, 23.0, 14.3; FT-IR (KBr, cm-1
): 2924, 2854,
2201, 1605, 1513, 1467, 1289, 1247; CI-MS [M+H]+ calculated for

Experimental details 129
C70H108N2O4S m/z: 1072.8; Found: 1073.9. CHN: Expected: C 78.31, H 10.14, N 2.61. Found: C 78.26, H 10.14, N 2.57.
4,7-Bis((3,4-bis(dodecyloxy)phenyl)ethynyl)-5,6-bis(dodecyloxy)-2,1,3-benzothiadiazole (19)
Amounts of reagents used: 4,7-dibromo-5,6-bis(dodecyloxy)-
2,1,3-benzothiadiazole 13 (0.21 g, 0.317 mmol), Pd(PPh3)2Cl2 (0.022 g,
0.031 mmol), PPh3(0.01 g, 0.031 mmol), CuI (0.0061 g, 0.031 mmol),
1,2-bis(dodecyloxy)-4-ethynylbenzene 17 (0.376 g, 0.8 mmol), Et3N (50
mL).
The product is a lime colored solid; yield: 233.2 mg, 51 %, m.p. =
80.0-81.7oC;
1H NMR (CDCl3, 400 MHz): δ = 7.23 (dd, 2H, J = 8.2 Hz,
J4 = 2.0 Hz), 7.15 (d, 2H, J
4 = 2.0 Hz), 6.86 (d, 2H, J = 8.4 Hz), 4.36 (t,
4H, J = 6.6 Hz), 4.0 (ot, 8H), 1.9 (qui), 1.8 (qui), 1.3 (b), 0.9 (t); 13
C
NMR (CDCl3, 100.6 MHz): δ = 157.7, 152.1, 150.5, 149.0, 125.6,
116.8, 115.1, 113.2, 108.5, 101.6, 80.8, 75.3, 69.5, 69.3, 32.2, 30.0,
29.9, 29.6, 29.4, 26.3, 23.0, 14.1; FT-IR (KBr, cm-1
): 2922, 2852,
2205, 1605, 1505, 1468, 1290, 1246; CHN: Expected: C 78.28, H 10.90, N 1.94. Found: C 78.29, H 10.80, N 1.90.
4,7-Bis((4-(dodecyloxy)phenyl)ethynyl)-5,6-bis(dodecyloxy)-2,1,3-benzoxadiazole (20)
Amounts of reagents used: 4,7-dibromo-5,6-bis(dodecyloxy)-
2,1,3-benzoxadiazole 14 (0.65 g, 1.0 mmol), Pd(PPh3)2Cl2 (0.05 g, 0.07
mmol), PPh3(0.02 g, 0.07 mmol), CuI (0.013 g, 0.07 mmol), 1-
(dodecyloxy)-4-ethynylbenzene 16 (0.6 g, 2.1 mmol), Et3N (50 mL).
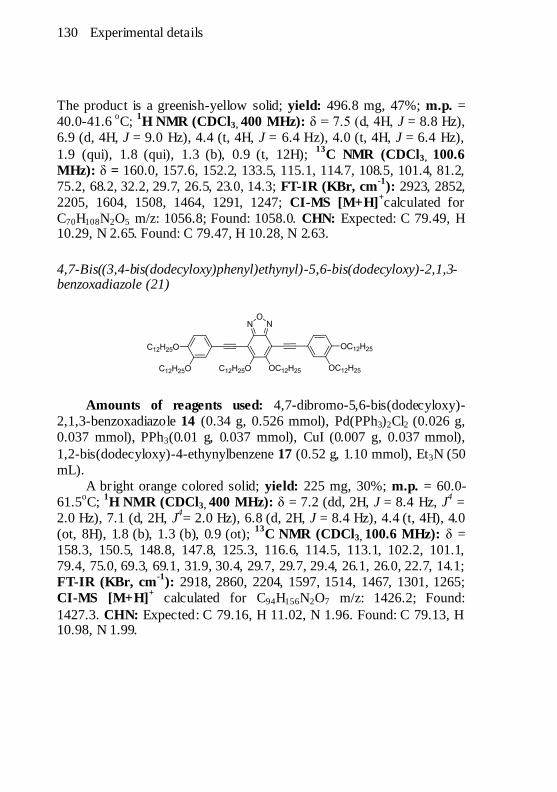
130 Experimental details
The product is a greenish-yellow solid; yield: 496.8 mg, 47%; m.p. =
40.0-41.6 oC;
1H NMR (CDCl3, 400 MHz): δ = 7.5 (d, 4H, J = 8.8 Hz),
6.9 (d, 4H, J = 9.0 Hz), 4.4 (t, 4H, J = 6.4 Hz), 4.0 (t, 4H, J = 6.4 Hz),
1.9 (qui), 1.8 (qui), 1.3 (b), 0.9 (t, 12H); 13
C NMR (CDCl3, 100.6
MHz): δ = 160.0, 157.6, 152.2, 133.5, 115.1, 114.7, 108.5, 101.4, 81.2,
75.2, 68.2, 32.2, 29.7, 26.5, 23.0, 14.3; FT-IR (KBr, cm-1
): 2923, 2852,
2205, 1604, 1508, 1464, 1291, 1247; CI-MS [M+H]+calculated for
C70H108N2O5 m/z: 1056.8; Found: 1058.0. CHN: Expected: C 79.49, H 10.29, N 2.65. Found: C 79.47, H 10.28, N 2.63.
4,7-Bis((3,4-bis(dodecyloxy)phenyl)ethynyl)-5,6-bis(dodecyloxy)-2,1,3-benzoxadiazole (21)
Amounts of reagents used: 4,7-dibromo-5,6-bis(dodecyloxy)-
2,1,3-benzoxadiazole 14 (0.34 g, 0.526 mmol), Pd(PPh3)2Cl2 (0.026 g,
0.037 mmol), PPh3(0.01 g, 0.037 mmol), CuI (0.007 g, 0.037 mmol),
1,2-bis(dodecyloxy)-4-ethynylbenzene 17 (0.52 g, 1.10 mmol), Et3N (50
mL).
A bright orange colored solid; yield: 225 mg, 30%; m.p. = 60.0-
61.5oC;
1H NMR (CDCl3, 400 MHz): δ = 7.2 (dd, 2H, J = 8.4 Hz, J
4 =
2.0 Hz), 7.1 (d, 2H, J4= 2.0 Hz), 6.8 (d, 2H, J = 8.4 Hz), 4.4 (t, 4H), 4.0
(ot, 8H), 1.8 (b), 1.3 (b), 0.9 (ot); 13
C NMR (CDCl3, 100.6 MHz): δ =
158.3, 150.5, 148.8, 147.8, 125.3, 116.6, 114.5, 113.1, 102.2, 101.1,
79.4, 75.0, 69.3, 69.1, 31.9, 30.4, 29.7, 29.7, 29.4, 26.1, 26.0, 22.7, 14.1;
FT-IR (KBr, cm-1
): 2918, 2860, 2204, 1597, 1514, 1467, 1301, 1265;
CI-MS [M+H]+ calculated for C94H156N2O7 m/z: 1426.2; Found:
1427.3. CHN: Expected: C 79.16, H 11.02, N 1.96. Found: C 79.13, H 10.98, N 1.99.
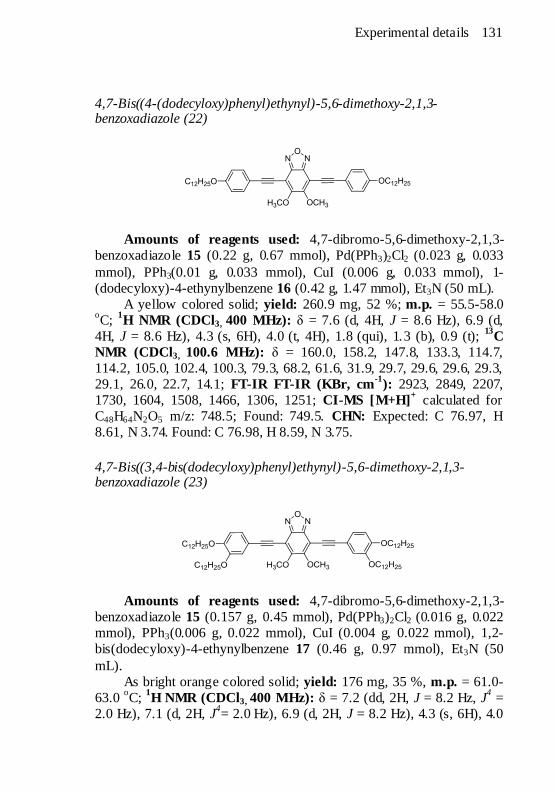
Experimental details 131
4,7-Bis((4-(dodecyloxy)phenyl)ethynyl)-5,6-dimethoxy-2,1,3-benzoxadiazole (22)
Amounts of reagents used: 4,7-dibromo-5,6-dimethoxy-2,1,3-
benzoxadiazole 15 (0.22 g, 0.67 mmol), Pd(PPh3)2Cl2 (0.023 g, 0.033
mmol), PPh3(0.01 g, 0.033 mmol), CuI (0.006 g, 0.033 mmol), 1-
(dodecyloxy)-4-ethynylbenzene 16 (0.42 g, 1.47 mmol), Et3N (50 mL).
A yellow colored solid; yield: 260.9 mg, 52 %; m.p. = 55.5-58.0 oC;
1H NMR (CDCl3, 400 MHz): δ = 7.6 (d, 4H, J = 8.6 Hz), 6.9 (d,
4H, J = 8.6 Hz), 4.3 (s, 6H), 4.0 (t, 4H), 1.8 (qui), 1.3 (b), 0.9 (t); 13
C
NMR (CDCl3, 100.6 MHz): δ = 160.0, 158.2, 147.8, 133.3, 114.7,
114.2, 105.0, 102.4, 100.3, 79.3, 68.2, 61.6, 31.9, 29.7, 29.6, 29.6, 29.3,
29.1, 26.0, 22.7, 14.1; FT-IR FT-IR (KBr, cm-1
): 2923, 2849, 2207,
1730, 1604, 1508, 1466, 1306, 1251; CI-MS [M+H]+ calculated for
C48H64N2O5 m/z: 748.5; Found: 749.5. CHN: Expected: C 76.97, H
8.61, N 3.74. Found: C 76.98, H 8.59, N 3.75.
4,7-Bis((3,4-bis(dodecyloxy)phenyl)ethynyl)-5,6-dimethoxy-2,1,3-benzoxadiazole (23)
Amounts of reagents used: 4,7-dibromo-5,6-dimethoxy-2,1,3-
benzoxadiazole 15 (0.157 g, 0.45 mmol), Pd(PPh3)2Cl2 (0.016 g, 0.022
mmol), PPh3(0.006 g, 0.022 mmol), CuI (0.004 g, 0.022 mmol), 1,2-
bis(dodecyloxy)-4-ethynylbenzene 17 (0.46 g, 0.97 mmol), Et3N (50
mL).
As bright orange colored solid; yield: 176 mg, 35 %, m.p. = 61.0-
63.0 oC;
1H NMR (CDCl3, 400 MHz): δ = 7.2 (dd, 2H, J = 8.2 Hz, J
4 =
2.0 Hz), 7.1 (d, 2H, J4= 2.0 Hz), 6.9 (d, 2H, J = 8.2 Hz), 4.3 (s, 6H), 4.0

132 Experimental details
(ot 8H), 1.8 (quint), 1.3 (br), 0.9 (t); 13
C NMR (CDCl3, 100.6 MHz): δ
= 158.3, 150.6, 148.8, 147.8, 125.4, 116.5, 114.3, 113.0, 105.0, 102.7,
100.3, 79.0, 69.4, 69.1, 61.7, 31.9, 29.4, 26,0, 22.7, 14.1; FT-IR (KBr,
cm-1
): 2919, 2848, 2209, 1730, 1515, 1467, 1313, 1270; CI-MS
[M+H]+ calculated for C72H112N2O7 m/z: 1116.8; Found: 1117.9. CHN:
Expected: C 77.37, H 10.10, N 2.51. Found: C 77.30, H 10.11, N 2.51.
1,4-bis(4-(dodecyloxy)phenyl)buta-1,3-diyne (38)
The homocoupling product 38 was isolated as by-product during
the synthesis of compound 22. 1H NMR (CDCl3): δ = 7.45 (d, 4H, J = 8.79 Hz), 6.84 (d, 4H, J =
8.79 Hz), 3.97 (t, 4H, J = 6.64 Hz), 1.79 (qui, 4H, J = 7.81 Hz), 1.45 (m,
4H), 1.27 (br, 32H), 0.89 (t, 6H, J = 7.03 Hz).
2,5-Diiodothiophene (44)
In a 125 mL flask, a mixture of thiophene (10 g, 118.9 mmol),
Iodine (30.18 g, 118.9 mmol) and chloroform (50 mL) was stirred at
room temperature till dissolution. Then 20 mL of 50% HNO3 was added
slowly and drop wise with vigorous stirring. After complete addition of
the acid, the reaction mixture was refluxed for 24 hours. After cooling to
room temperature, the reaction mixture was extracted with
dichloromethane (3 x 50 mL). The organic phase was successively
washed with saturated Na2SO3 (2 x 25 mL), 10 % NaOH (2 x 10 mL),
water (2 x 10 mL) and then dried over Na2SO4. The solvent was
evaporated under reduced pressure and the residue was purified through
silica gel column eluted with hexane to furnish the 2,5-diiodothiophene.
Yield: 31.15 g, 78 % ; 1H NMR (CDCl3): δ = 6.94 (s);
13C NMR
(CDCl3): δ = 138.75, 76.19.
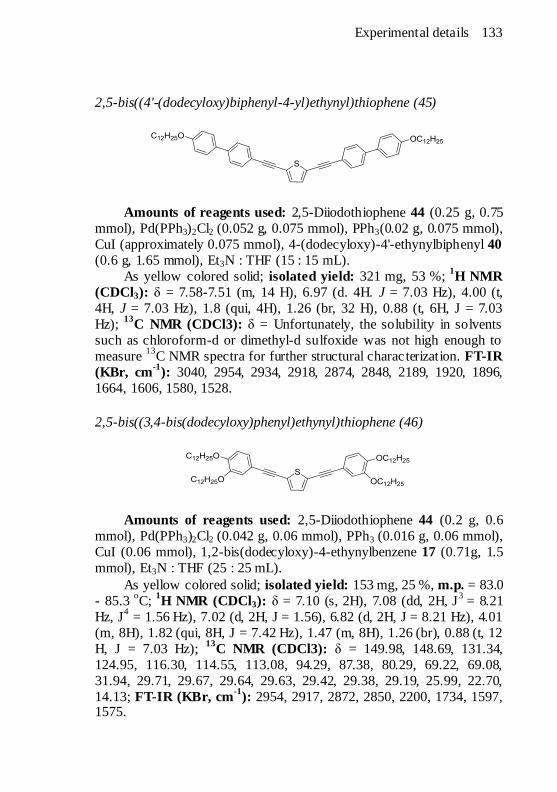
Experimental details 133
2,5-bis((4'-(dodecyloxy)biphenyl-4-yl)ethynyl)thiophene (45)
Amounts of reagents used: 2,5-Diiodothiophene 44 (0.25 g, 0.75
mmol), Pd(PPh3)2Cl2 (0.052 g, 0.075 mmol), PPh3(0.02 g, 0.075 mmol),
CuI (approximately 0.075 mmol), 4-(dodecyloxy)-4'-ethynylbiphenyl 40
(0.6 g, 1.65 mmol), Et3N : THF (15 : 15 mL).
As yellow colored solid; isolated yield: 321 mg, 53 %; 1H NMR
(CDCl3): δ = 7.58-7.51 (m, 14 H), 6.97 (d. 4H. J = 7.03 Hz), 4.00 (t,
4H, J = 7.03 Hz), 1.8 (qui, 4H), 1.26 (br, 32 H), 0.88 (t, 6H, J = 7.03
Hz); 13
C NMR (CDCl3): δ = Unfortunately, the solubility in solvents
such as chloroform-d or dimethyl-d sulfoxide was not high enough to
measure 13
C NMR spectra for further structural charac terization. FT-IR
(KBr, cm-1
): 3040, 2954, 2934, 2918, 2874, 2848, 2189, 1920, 1896,
1664, 1606, 1580, 1528.
2,5-bis((3,4-bis(dodecyloxy)phenyl)ethynyl)thiophene (46)
Amounts of reagents used: 2,5-Diiodothiophene 44 (0.2 g, 0.6
mmol), Pd(PPh3)2Cl2 (0.042 g, 0.06 mmol), PPh3 (0.016 g, 0.06 mmol),
CuI (0.06 mmol), 1,2-bis(dodecyloxy)-4-ethynylbenzene 17 (0.71g, 1.5
mmol), Et3N : THF (25 : 25 mL).
As yellow colored solid; isolated yield: 153 mg, 25 %, m.p. = 83.0
- 85.3 oC;
1H NMR (CDCl3): δ = 7.10 (s, 2H), 7.08 (dd, 2H, J
3 = 8.21
Hz, J4 = 1.56 Hz), 7.02 (d, 2H, J = 1.56), 6.82 (d, 2H, J = 8.21 Hz), 4.01
(m, 8H), 1.82 (qui, 8H, J = 7.42 Hz), 1.47 (m, 8H), 1.26 (br), 0.88 (t, 12
H, J = 7.03 Hz); 13
C NMR (CDCl3): δ = 149.98, 148.69, 131.34,
124.95, 116.30, 114.55, 113.08, 94.29, 87.38, 80.29, 69.22, 69.08,
31.94, 29.71, 29.67, 29.64, 29.63, 29.42, 29.38, 29.19, 25.99, 22.70,
14.13; FT-IR (KBr, cm-1
): 2954, 2917, 2872, 2850, 2200, 1734, 1597, 1575.

134 Experimental details
2,5-bis((6-(dodecyloxy)naphthalen-2-yl)ethynyl)thiophene (47)
Amounts of reagents used: 2,5-Diiodothiophene 44 (0.25 g, 0.74
mmol), Pd(PPh3)2Cl2 (0.05 g, 0.074 mmol), PPh3(0.02 g, 0.074 mmol),
CuI (approximately 0.074 mmol), 2-(dodecyloxy)-6-ethynylnaphthalene
39 (0.54 g, 1.6 mmol), Et3N : THF (15 : 15 mL).
As cream color solid; isolated yield: 303 mg, 54 %; 1H NMR
(CDCl3): δ = 7.97 (broad singlet, 2H), 7.71 (d, 2H, J = 9.38 Hz), 7.68
(d, 2H, J = 8.60 Hz), 7.52 (dd, 2H, J3 = 8.60 Hz, J
4 = 1.56 Hz), 7.19 (s,
2H), 7.17 (dd, 2H, J3 = 9.38 Hz, J
4 = 2.74 Hz), 7.10 (d, 2H, J = 1.95 Hz),
4.01 (t, 4H, J = 6.64 Hz), 1.85 (qui, 4H, J = 7.42 Hz), 1.5 (m), 1.27
(broad peak, 32 H), 0.89 (t, 6H, J = 7.03 Hz); 13
C NMR (CDCl3): δ =
158.05, 134.38, 131.67, 131.34, 129.34, 128.56, 128.32, 126.86, 124.73,
119.85, 117.28, 106.56, 94.80, 82.01, 68.12, 31,93, 29.68, 29.65, 29.65,
29.60, 29.42, 29.36, 29.20, 26.10, 22.70, 14.14; FT-IR (KBr, cm-1
):
3058, 2954, 2918, 2871, 2849, 2205, 2141, 1923, 1781, 1718, 1623,
1600.
2-((6-(dodecyloxy)naphthalen-2-yl)ethynyl)-5-iodothiophene (48)
Amounts of reagents used: 2,5-Diiodothiophene 44 (3.0 g, 8.93
mmol), Pd(PPh3)2Cl2 (0.1 g, 0.15 mmol), PPh3(0.04 g, 0.15 mmol), CuI
(0.15 mmol), 2-(dodecyloxy)-6-ethynylnaphthalene 39 (g, mmol), Et3N:
THF (25 : 25 mL).
As cream colored solid; Isolated yield: 1.18 g, 73.3 %, m.p. = 86.7
- 87.5 oC;
1H NMR (CDCl3): δ = 7.94 (broad singlet, 1H), 7.70 (d, 1H,
J = 8.99 Hz), 7.67 (d, 1H, J = 8.60 Hz), 7.49 (dd, 1H, J3 = 8.21 Hz, J
4 =
1.56 Hz), 7.18 (d, 1H, J = 2.74 Hz), 7.16 (d, 1H, J = 3.91 Hz), 7.10 (d,
1H, J = 1.95 Hz), 6.95 (d, 1H, J = 3.91 Hz), 4.07 (t, 2H, J = 6.64 Hz),
1.85 (qui, 2H, J = 7.82), 1.5 (m, 2H), 1.27 (broad peak, 16 H), 0.89 (t,
3H, J = 7.03 Hz); 13
C NMR (CDCl3): δ = 158.07, 137.08, 134.39,
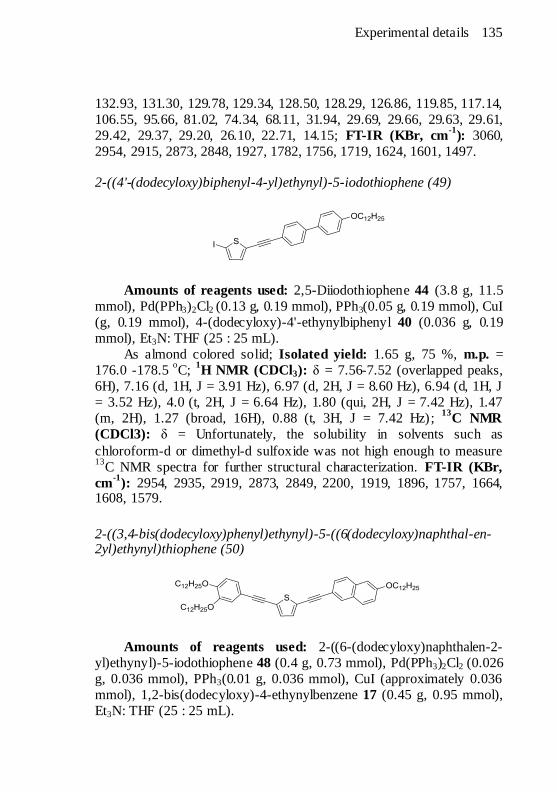
Experimental details 135
132.93, 131.30, 129.78, 129.34, 128.50, 128.29, 126.86, 119.85, 117.14,
106.55, 95.66, 81.02, 74.34, 68.11, 31.94, 29.69, 29.66, 29.63, 29.61,
29.42, 29.37, 29.20, 26.10, 22.71, 14.15; FT-IR (KBr, cm-1
): 3060,
2954, 2915, 2873, 2848, 1927, 1782, 1756, 1719, 1624, 1601, 1497.
2-((4'-(dodecyloxy)biphenyl-4-yl)ethynyl)-5-iodothiophene (49)
Amounts of reagents used: 2,5-Diiodothiophene 44 (3.8 g, 11.5
mmol), Pd(PPh3)2Cl2 (0.13 g, 0.19 mmol), PPh3(0.05 g, 0.19 mmol), CuI
(g, 0.19 mmol), 4-(dodecyloxy)-4'-ethynylbiphenyl 40 (0.036 g, 0.19
mmol), Et3N: THF (25 : 25 mL).
As almond colored solid; Isolated yield: 1.65 g, 75 %, m.p. =
176.0 -178.5 oC;
1H NMR (CDCl3): δ = 7.56-7.52 (overlapped peaks,
6H), 7.16 (d, 1H, J = 3.91 Hz), 6.97 (d, 2H, J = 8.60 Hz), 6.94 (d, 1H, J
= 3.52 Hz), 4.0 (t, 2H, J = 6.64 Hz), 1.80 (qui, 2H, J = 7.42 Hz), 1.47
(m, 2H), 1.27 (broad, 16H), 0.88 (t, 3H, J = 7.42 Hz); 13
C NMR
(CDCl3): δ = Unfortunately, the solubility in solvents such as
chloroform-d or dimethyl-d sulfoxide was not high enough to measure 13
C NMR spectra for further structural characterization. FT-IR (KBr,
cm-1
): 2954, 2935, 2919, 2873, 2849, 2200, 1919, 1896, 1757, 1664, 1608, 1579.
2-((3,4-bis(dodecyloxy)phenyl)ethynyl)-5-((6(dodecyloxy)naphthal-en-2yl)ethynyl)thiophene (50)
Amounts of reagents used: 2-((6-(dodecyloxy)naphthalen-2-
yl)ethynyl)-5-iodothiophene 48 (0.4 g, 0.73 mmol), Pd(PPh3)2Cl2 (0.026
g, 0.036 mmol), PPh3(0.01 g, 0.036 mmol), CuI (approximately 0.036
mmol), 1,2-bis(dodecyloxy)-4-ethynylbenzene 17 (0.45 g, 0.95 mmol),
Et3N: THF (25 : 25 mL).

136 Experimental details
As yellow colored solid; Isolated yield: 250 mg, 38.3 %, m.p. = 73.0 -
74.5 oC;
1H NMR (CDCl3): δ = 7.98 (s, 1H), 7.73 (d, 1H, J = 6.06 Hz),
7.69 (d, 1H, J = 5.56 Hz), 7.53 (dd, 1H, J3 = 8.59 Hz, J
4 = 2.02 Hz), 7.20
(m, 1H), 7.16 (m, 2H), 7.13 (m, 1H),7.09 (d, 1H, J = 2.02 Hz), 7.05 (d,
1H, J = 2.02 Hz), 6.84 (d, 1H, J = 8.59 Hz), 4.07 (t, 2H, J = 6.57 Hz),
4.02 (t, 4H, J = 6.57 Hz) 1.84 (m, 6H), 1.29 (broad, 48 H), 0.90 (t, 9H, J
= 7.03 Hz); 13
C NMR (CDCl3): FT-IR (KBr, cm-1
): 2955, 2919, 2873, 2849, 2200, 1850, 1776, 1627, 1598, 1574, 1521.
2-((3,4-bis(dodecyloxy)phenyl)ethynyl)-5-((4'-(dodecyloxy)biphenyl-4-yl)ethynyl)thiophene (51)
Amounts of reagents used: 2-((4'-(dodecyloxy)biphenyl-4-
yl)ethynyl)-5-iodothiophene 49 (0.44 g, 0.76 mmol), Pd(PPh3)2Cl2
(0.027 g, 0.038 mmol), PPh3(0.01 g, 0.038 mmol), CuI (approximately
0.038 mmol), 1,2-bis(dodecyloxy)-4-ethynylbenzene 17 (g, mmol), Et3N
: THF (25 : 25 mL).
As bright yellow solid; isolated yield: 110 mg, 15.7 %; 1H NMR
(CDCl3): δ = 7.55-7.52 (overlapped peaks, 6H), 7.16 (d, 1H, J = 3.91
Hz), 7.13 (d, 1H, J = 3.52 Hz), 7.09 (dd, 1H, J3 = 8.21 Hz, J4 = 1.56
Hz), 7.03 (d, 1H, J = 1.56 Hz), 6.97 (d, 2H, J = 8.60 Hz), 6.83 (d, 1H, J
= 8.21 Hz), 4.02-3.98 (m, 6H), 1.82 (m), 1.47 (m), 1.26 (m), 0.88 (t, 9H,
J = 7.03 Hz); 13
C NMR (CDCl3): δ = 159.11, 148.75, 140.99, 131.85,
131.72, 131.36, 128.0, 126.50, 125.04, 125.0, 124.27, 120.70, 116.40,
114.88, 114.55, 113.16, 94.51, 94.04, 86.22, 80.75, 69.26, 68.12, 59.52,
38.14, 31.93, 31.23, 29.70-29.63 (overlapped), 29.41, 29.37, 29.27,
29.20, 29.17, 26.0, 22.69, 14.11; FT-IR (KBr, cm-1
): 2954, 2919, 2872, 2848, 2197, 2140, 1597, 1575, 1518, 1495.

Experimental details 137
1,4-bis(6-(dodecyloxy)naphthalen-2-yl)buta-1,3-diyne (52)
The homocoupling product 52 was isolated as by-product during
the synthesis of compound 47. 1H NMR (CDCl3): δ = 8.0 (s, 2H), 6.7 (d, 2H, J = 8.99 Hz), 7.66
(d, 2H, J = 8.60 Hz),7.51 (dd, 2H, J3 = 8.60 Hz, J
4 = 1.56 Hz), 7.17 (dd,
2H, J3 = 8.99 Hz, J
4 = 2.74 Hz), 7.10 (d, 2H, J = 1.95 Hz), 4.07 (t, 4H, J
= 6.64 Hz), 1.85 (qui, 4H, J = 7.82 Hz), 1.5 (m, 4H), 1.27 (br, 32H),
0.88 (t, 6H, J = 7.03 Hz); FT-IR (KBr, cm-1
): 2957, 2921, 2870, 2848, 2141, 1917, 1781, 1622, 1600, 1498.

138 Experimental details

Appendix 139
6. APPENDIX

140 Appendix
A.1. CYCLIC VOLTAMMETRY
Cyclic voltammetry (CV) is a s imple, rapid and a dynamic
electrochemical technique that is most widely used for the fundamental
studies of oxidation and reduction processes. Important parameters to
analyze the electrical properties of organic materials such as ionization
potential (IP), electron affinity (EA) and energy gap (Eg) can be
determined from the cyclic voltammogram. This technique is based on
varying the applied potential at a working electrode (at some scan rate)
and monitoring any resulting changes in cell current. The initial scan
can be in either direction (negative or positive) and then reversed to run
in the opposite direction to complete a potential sweep cycle, hence, the
name cyclic voltammetry. The applied potential forces a change in the
concentration of an electroactive species at the electrode surface by
reducing or oxidizing it. Advantages of the cyclic voltammetry include
excellent sensitivity for both inorganic and organic species, rapid
analys is times (seconds) and the ease with which small currents are measured.
A.1.1. The Electrochemical Cell
The CV experiment is carried out in the electrochemical cell
which consists of the sample dissolved in a solvent, an
electrochemically inactive ionic electrolyte, a working electrode, a
reference electrode, and usually a counter (auxiliary) electrode. The
material of the cell (glass, teflon, polyethylene) is selected to minimize reaction with the sample.
Working Electrodes: The working electrodes are of various
geometries and materials, ranging from small Hg drops to flat Pt disks.
Other commonly used electrode materials are gold, graphite and glassy
carbon. Reference Electrodes: The voltage measured is that of the
working electrode relative to the reference electrode. In most cases, the
reference electrode should be as close as possible to the working
electrode without touching it. The most commonly used reference
electrodes are the calomel electrode and the silver/silver chloride
electrode. Counter Electrodes: The counter electrode plays no part in
redox reaction but completes the circuit. Most often, it consists of a thin

Appendix 141
Pt wire, although other inert material like Au and sometimes graphite are also used.
Figure 56. Schematic diagram of a three electrode electrochemical cell.
In aqueous solutions, the redox potentials are measured versus the
universally accepted and reliable reference electrodes such as the normal
hydrogen electrode (SHE) or the saturated calomel electrode (SCE).
However, measurements in water are not possible in many instances due
to insolubility or instability of the compound in water. Unlike for
aqueous solutions, no universal reference electrode exists for the
measurements in non aqueous solutions. The potentials measured versus
different reference electrode systems cannot be directly related to each
other, and are occasionally difficult to be reproduced. A practical
approach to this problem is the use of a redox couple (e.g. Fc+/Fc)173
as
an internal standard in the same fashion as the use of internal standards
in NMR spectroscopy. In such cases, the measured potentials are
reported relative to the (common) internal reference rather the different
reference electrodes. An important advantage of this approach is that the
effects of variables (i.e. type of reference electrode, solvents, electrode
degradation etc.) in different measurements are eliminated. The formal
potentials relative to the internal standard remain unchanged and are reproducible.
142 Appendix
A.1.2. Practical Considerations In Cyclic Voltammetry
During a CV experiment, considerations are given to the effects
of the solvent, the electrolytes and the electrodes. For accurate
measurement, the solvent must resist oxidation or reduction at the
applied potentials. Usually the solvents with high dielectric constants
(e.g. water or acetonitrile) are used to enable the electrolyte to dissolve
and aid the passage of current. Furthermore, the electrodes and the
supporting electrolyte also must not react with the sample. The
combination of solvent, electrolyte and specific working electrode
material determines the range of the potential that can be applied. Prior
to experiment, any dissolved oxygen is removed from the solution by
bubbling an inert gas. A potentiostat applies a known potential between
the working and the reference electrodes. Potential of the reference
electrode is usually f ixed and only potential of the working electrode is
varied. At a certain potential, the oxidation or reduction of a substance
takes place on the surface of the working electrode (Fig. 56). This
results in the mass transport of new material from bulk solution to the
electrode surface, which in turn generates a current that flows between
the working and counter electrodes. When the scan is reversed, the
reaction moves back through the equilibrium position gradually
converting electrolysis product back to reactant. The current flow is now
in the direction opposite to that of the forward step, i.e. from the solution species back to the electrode.
A.1.3. Mass Transport
The current is a quantitative measure of how fast a species is
being reduced or oxidized at the electrode surface. For a fixed electrode
area, the reaction can be controlled by two factors i.e. the rate constant
and the surface concentration of the reactant. If the rate constant is large
such that any reactant close to the interface is immediately converted
into products, then the current will be controlled by the amount of fresh
reactant reaching the interface from the bulk solution. Thus movement
of reactant in and out of the electrode-solution interface (mass transport) is important in predicting the current flowing.

Appendix 143
There are three forms of mass transport which can influence an
electrolysis reaction. Diffusion: Diffusion arises from the local uneven
concentrations of reagents and is often found to be the most significant
transport process for many electrolysis reactions. Since the reaction only
occurs at the electrode surface, there exist a lower reactant concentration
at the electrode than in bulk solution. Similarly a higher concentration of
product will exist near the electrode than further out into solution.
Entropic forces act to smooth out these uneven distributions of
concentration and are therefore the main driving force for the diffusion
process. Migration: Migration is the movement of a charged ion in the
presence of an electric field. In the bulk solution, concentration
gradients are generally small and ionic migration carries most of the
current. The relative contributions of diffusion and migrat ion to the flux
of a species differs for different locations in solution. Near the electrode,
in general, the mass transport is mainly by the diffusion. In the bulk
solution (away from the electrode), concentration gradients are usually
small and the current is carried mainly by migration. Convection:
Convection is the mass transfer of the electroactive species by thermal
currents, by density gradients present in the solution, or by some form of
mechanical movement like stirring the solution or rotating the electrode.
In many voltammetric experiments, there is no stirr ing and the only
form of mass transport is diffusion. These are referred to as stationary
solution techniques. In other experiments referred to as hydrodynamic
techniques, the solution is stirred either by a stir bar or preferably (due
to the more precise control of the rate of rotation) by a rotating electrode.
A.1.4. The Role of Supporting Electrolyte
The shape of the voltammogram depends on the rate of reaction
and the rate of the mass transport. If the rate of reaction is very slow or
the transport is migration controlled, a wave instead of a peak is
observed. Addition of an excess of a supporting electrolyte (non-
electroactive ions) nearly eliminates the contribution of migration to the
mass transfer and the flux of electroactive species to the electrode is
almost completely due to diffusion.178
The choice of supporting
electrolyte depends on the solvent used and electrode process of interest.
Many acids, bases, and salts are available for aqueous solutions. For
organic solvents with high dielectric constants, e.g. acetonitrile and

144 Appendix
DMF, usually tetra-n-alkylammonium salts such as tetrabutylammonium
tetrafluoroborate (TBABF4), tetra-n-butylammonium hexafluorophosph-
ate (TBAPF6) and tetraethylammonium perchlorate (Et4NClO4) are
employed. In addition to minimizing the contribution of migration, the
supporting electrolyte serves other important functions as well. The
presence of a high concentration of ions decreases the solution
resistance between the working and reference electrodes. Consequently,
the supporting electrolyte allows an improvement in the accuracy with
which the working electrode's potential is measured. It also establishes a
uniform ionic strength throughout the solution, even when ions are
produced or consumed at the electrodes. Besides these physical benefits,
the supporting electrolyte may also contribute chemically by
establishing the solution composition (pH, ionic strength, ligand
concentration) that controls the reaction conditions.179
A.2. Vacuum Level and Its Relationship With The IP, EA and Egap
When an isolated electron is at rest in a vacuum, it is said to be at
the vacuum level (VL)180
and this level is often taken as an invariant
energy reference. Ionization potential (IP) is the energy required to
remove an electron from the HOMO to an infinite distance in vacuum
and the energy required to bring an electron from an infinite distance in
vacuum to the LUMO is called the electron affinity (EA). The
difference between IP and EA is equivalent to the band gap energy Eg
i.e. difference between HOMO and LUMO energy levels (Fig. 57).
These parameters are very important to understand the electrical
properties of materials and can be determined from the cyclic
voltammogram. The graphical and mathematical procedures for
estimating the positions of HOMO and LUMO levels from electrochemical data are described in the results and discussions section.

Appendix 145
Figure 57. Schematic diagram representing the HOMO, LUMO levels and their
relationship with the vacuum level (VL).
A.3. IDENTIFICATION OF THE MESOPHASES
No single method of identif ication is conclusive in determining
the mesophase and a set of optical, spectroscopic and calorimetric
methods are used. The most commonly used techniques for the
identification of liquid crystal phases are differential scanning
calorimetry, polarizing optical microscopy and X-ray diffraction
analys is. Before performing DSC, thermal stability of the sample is
determined thermogravimetrical-ly to find the safe temperature limit up to which it can be repeatedly heated without any decomposition.
A.3.1. Polarizing Optical Microscopy
Polarizing optical microscopy (POM) is often the method of first
choice for the identif ication of different types of mesophases formed
and to note their respective transition temperatures. In this technique, a
small amount of the test sample taken on a glass slide and covered with
a cover slip is placed on a temperature controlled hot stage between the
polarizer and analyzer which are crossed at 90° to each other. The
compound is gradually heated first at a controlled rate and then cooled
at a slow rate, usually from 0.5 to 2°C/min. Interactions of the resulting
phases with the polarized light are observed through the analyzer.
Polarized light remains unaffected by isotropic liquid and the field of
view appears dark. However, for the mesophases, being anisotropic and
hence birefringent, light is not extinguished and an optical texture

146 Appendix
develops that gives information about the arrangement of molecules
within the mesophase. The term texture refers to the orientation of liquid
crystal molecules in the vicinity of a surface. Regions with the same
color have the same orientation of their constituent molecules. Each
liquid crystal mesophase can form its own characteristic textures, which are useful in identification.
66
A.3.2. Differential Scanning Calorimetry
Differential scanning calorimetry (DSC) is a preliminary
technique used for determining the transition temperatures and
complements optical methods in the study of liquid crystal phase
transitions. It proves useful to determine the occurrence, magnitude and
temperatures of transitions, however, it is not a tool for identification of
the mesophases. This technique involves measurement of heat changes
of the sample in comparison to some reference. Any material having
constant heat capacity for the temperature range may be used as a
reference. A sample pan containing the material to be analyzed and
another pan containing a reference material are heated or cooled
simultaneously at a particular rate, usually 5-10°C/min. During heating
(or cooling) any chemical or physical event in which the sample absorbs
or releases energy must be offset by the reference so that the balance is
maintained through a displacement of the base line.181
An endothermic
transition in the sample demands more heat to flow to it as compared to
the heat that f lows to the reference compound to ensure that the
temperature of the two ovens remain the same. Similarly, any
exothermic change causes diminution of heat flow to the sample to
maintain the uniform temperature r ise for both the sample and the
reference. This difference in heat f lux between the two pans is recorded and plotted versus temperature to give a DSC thermogram (Fig. 58).
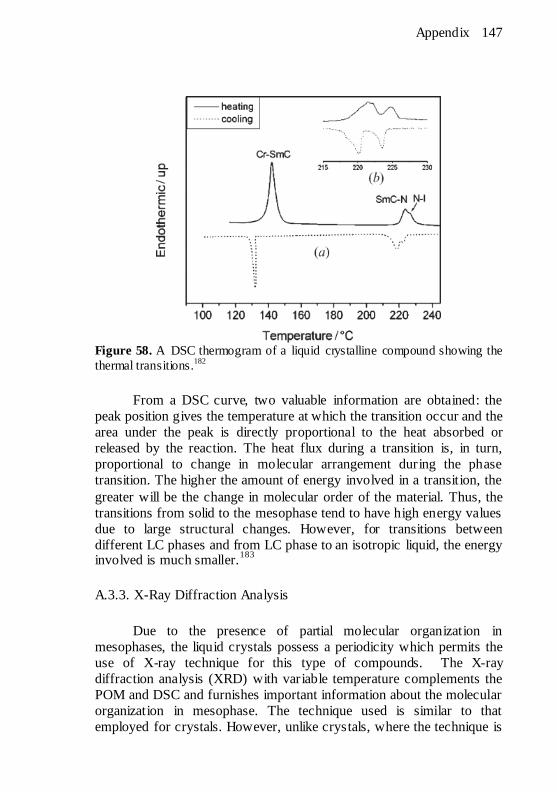
Appendix 147
Figure 58. A DSC thermogram of a liquid crystalline compound showing the
thermal transitions.182
From a DSC curve, two valuable information are obtained: the
peak position gives the temperature at which the transition occur and the
area under the peak is directly proportional to the heat absorbed or
released by the reaction. The heat flux during a transition is, in turn,
proportional to change in molecular arrangement during the phase
transition. The higher the amount of energy involved in a transition, the
greater will be the change in molecular order of the material. Thus, the
transitions from solid to the mesophase tend to have high energy values
due to large structural changes. However, for transitions between
different LC phases and from LC phase to an isotropic liquid, the energy involved is much smaller.
183
A.3.3. X-Ray Diffraction Analysis
Due to the presence of partial molecular organization in
mesophases, the liquid crystals possess a periodicity which permits the
use of X-ray technique for this type of compounds. The X-ray
diffraction analysis (XRD) with variable temperature complements the
POM and DSC and furnishes important information about the molecular
organization in mesophase. The technique used is similar to that
employed for crystals. However, unlike crystals, where the technique is

148 Appendix
based on the distance between the periodically repeating atomic planes,
in liquid crystals, the technique is based on the distance between the
molecular planes of a mesophase. Due to their relatively low scattering
power, LCs require the use of more intense X-ray beams than the
solids.184
The sample is placed on top of a controlled heating plate, and
then irradiated by a beam of X-ray from the source. The irradiated X-ray
beam undergoes diffraction. Meanwhile, the detector moves in order to measure the intensity of diffracted radiation at different angles.
Figure 59. Bragg diffraction by crystal plane.
Bragg's law visualizes the scattering of X-rays as the result of
reflections from sets of lattice planes (Fig. 59). Note that the phases of
the incident X-rays change by 180o upon scattering. The various
scattered wavelets from the different atomic sites combine and undergo
constructive or destructive interference, depending on the relative
phases of the different wavelets. According to Bragg's law, for a
particular set of planes, constructive interference between the rays
reflected by successive planes occurs only when the path difference
between the reflected rays (2d sine θ) equals an integral number of the wavelength.
185
2dsin θ = nλ (8)
where: n is an integral number, λ is the wavelength of the X-ray beam, d
is the distance between periodic atomic planes and θ the angle between
the incident beam and the scattering plane. The diffraction angle, i.e. the
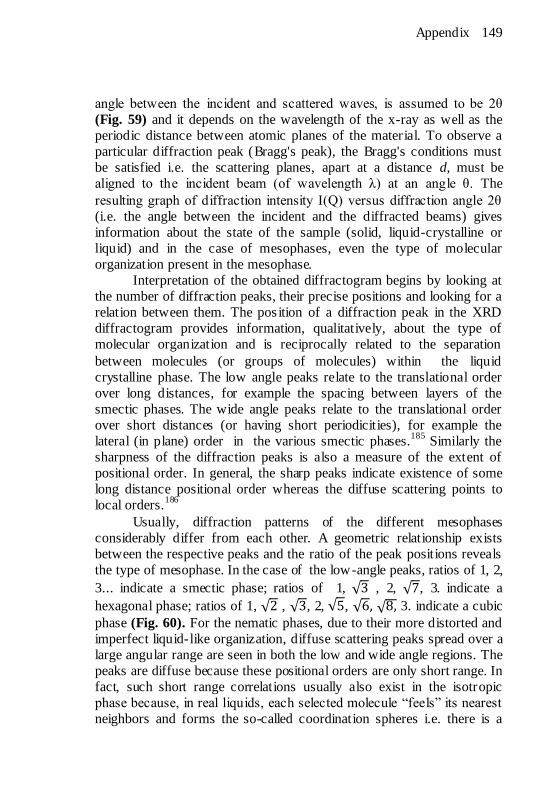
Appendix 149
angle between the incident and scattered waves, is assumed to be 2θ
(Fig. 59) and it depends on the wavelength of the x-ray as well as the
periodic distance between atomic planes of the material. To observe a
particular diffraction peak (Bragg's peak), the Bragg's conditions must
be satisfied i.e. the scattering planes, apart at a distance d, must be
aligned to the incident beam (of wavelength λ) at an angle θ. The
resulting graph of diffraction intensity I(Q) versus diffraction angle 2θ
(i.e. the angle between the incident and the diffracted beams) gives
information about the state of the sample (solid, liquid-crystalline or
liquid) and in the case of mesophases, even the type of molecular
organization present in the mesophase.
Interpretation of the obtained diffractogram begins by looking at
the number of diffraction peaks, their precise positions and looking for a
relation between them. The pos ition of a diffraction peak in the XRD
diffractogram provides information, qualitatively, about the type of
molecular organization and is reciprocally related to the separation
between molecules (or groups of molecules) within the liquid
crystalline phase. The low angle peaks relate to the translational order
over long distances, for example the spacing between layers of the
smectic phases. The wide angle peaks relate to the translational order
over short distances (or having short periodicities), for example the
lateral (in plane) order in the various smectic phases.185
Similarly the
sharpness of the diffraction peaks is also a measure of the extent of
positional order. In general, the sharp peaks indicate existence of some
long distance positional order whereas the diffuse scattering points to
local orders.186
Usually, diffraction patterns of the different mesophases
considerably differ from each other. A geometric relationship exists
between the respective peaks and the ratio of the peak positions reveals
the type of mesophase. In the case of the low-angle peaks, ratios of 1, 2,
3... indicate a smectic phase; ratios of 1, , 2, , 3. indicate a
hexagonal phase; ratios of 1, , , 2, , 3. indicate a cubic
phase (Fig. 60). For the nematic phases, due to their more distorted and
imperfect liquid-like organization, diffuse scattering peaks spread over a
large angular range are seen in both the low and wide angle regions. The
peaks are diffuse because these positional orders are only short range. In
fact, such short range correlations usually also exist in the isotropic
phase because, in real liquids, each selected molecule “feels” its nearest
neighbors and forms the so-called coordination spheres i.e. there is a

150 Appendix
short-range positional order.93
So it may be difficult to distinguish the
powder patterns of the nematic from that of the isotropic phase.185
Figure 60. Characteristic relationship between low angle diffraction patterns of
more structured (a) 1-D layer (smectic) phases, (b) 2-D hexagonal phases, (c) 3-D cubic phases, and (d) of the un-aligned nematic phases.
A.4. BANANA LIQUID CRYSTALS
Some bent shaped (e.g. v-shaped, hockey stick) compounds that
are neither perfectly linear nor discotic can also form mesophases. In
addition to the formation of conventional smectic and nematic phases,
the distinguishing and characteristic feature of some bent-core LCs is
the formation of polar smectic or the so called “banana phases” (B). The
banana mesophases are polar and chiral (shows ferroelectricity,
antiferroelectricity) even if the molecules are achiral in nature.187
However, not all the bent shaped LCs are banana LCs and the term
banana liquid crystals is used specifically in cases when a chiral
mesophase (banana mesophase) is generated by achiral bent shaped
molecules. Once grouped into the non-conventional LCs, they are now
established as the third class of thermotropic LCs.188
Typically, their
molecular structure consists of three units : an angular central core,
usually 1,3-phenylene with a bent angle of 120o that is changed in case
of nearby substituents,188
two linear r igid cores and terminal flexible
chains (Fig. 61). Most of the banana LCs contain at least five aromatic
rings. Compounds with six or seven aromatic r ings189,190
including six
membered heteroaromatic systems as angular central core191
have also
been reported. Whether banana or conventional smectic (or both) phases
will be formed, depends both on conformation and size of the bent core and on the structure and length of the terminal chains.
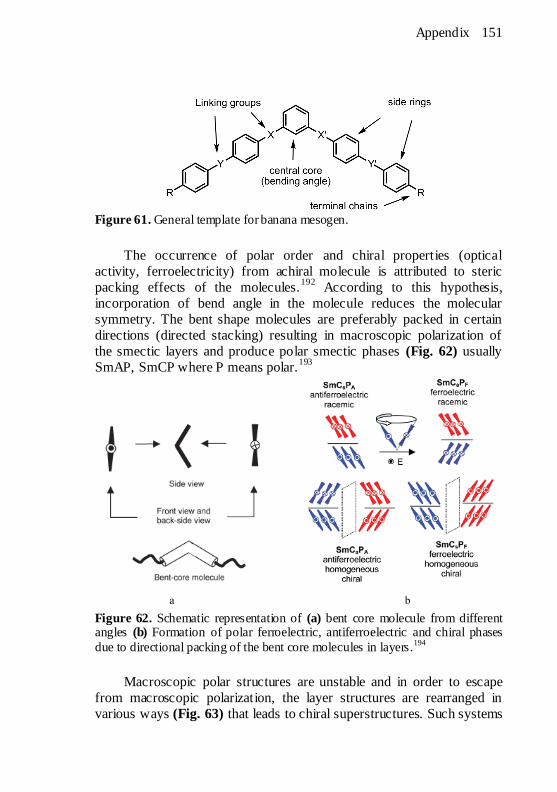
Appendix 151
Figure 61. General template for banana mesogen.
The occurrence of polar order and chiral properties (optical
activity, ferroelectricity) from achiral molecule is attributed to steric
packing effects of the molecules.192
According to this hypothesis,
incorporation of bend angle in the molecule reduces the molecular
symmetry. The bent shape molecules are preferably packed in certain
directions (directed stacking) resulting in macroscopic polarization of
the smectic layers and produce polar smectic phases (Fig. 62) usually
SmAP, SmCP where P means polar.193
Figure 62. Schematic representation of (a) bent core molecule from different angles (b) Formation of polar ferroelectric, antiferroelectric and chiral phases
due to directional packing of the bent core molecules in layers.194
Macroscopic polar structures are unstable and in order to escape
from macroscopic polarization, the layer structures are rearranged in
various ways (Fig. 63) that leads to chiral superstructures. Such systems

152 Appendix
manifest superstrucutral chirality even though the constituent molecules
are achiral.194
Moreover in polar SmC (SmCP) with polarized tilted
layers, combination of director tilt and polar order leads to the chirality
of smectic layers although the constituent molecules are achiral.195
Figure 63. Different ways to release macroscopic polarization of the polarized
layers.

Bibliography 153
7. BIBLIOGRAPHY
154 Bibliography
1. Geffroy B.; Le Roy P.; Prat C. Organic light-emitting diode
(OLED) technology: materials, devices and display
technologies. Polym. Int. 2006, 55(6), 572 - 82.
2. Maria V.; Dimitra G.; George P.; Panagiotis A. Tuning the
Emitting Color of Organic Light-Emitting Diodes Through
Photochemically Induced Transformations: Towards Single-
Layer, Patterned, Full-Color Displays and White-Lighting
Applications. Adv. Funct. Mater. 2007, 17, 3477–3485.
3. Su, S. Y.; Lin, H. H.; Chang, C. C. Dual optical responses of
phenothiazine derivatives: near-IR chromophore and water-
soluble f luorescent organic nanoparticles. J. Mater. Chem.
2010, 20 (39), 8653-8658.
4. Xiong, L.; Yu, M.; Cheng, M.; Zhang, M.; Zhang, X.; Xu, C.; et
al. A photostable fluorescent probe for targeted imaging of
tumor cells possessing integrin alpha(v)beta(3). Mol. BioSyst.
2009, 5 (3), 241-243.
5. Kajiyama, S.; Uemura, Y.; Miura. H.; Hara, K.; Koumura, N.
Organic dyes with oligo-n-hexylthiophene for dye- sensitized
solar cells. Relation between chemical structure of donor and
photovoltaic performance. Dyes Pigment. 2012, 92 (3), 1250-
1260.
6. Monnier, V.; Dubuisson, E.; Sanz-Menez, N.; Boury, B.;
Rouessac, V.; Ayral, A.; et al. Selective chemical sensors
based on fluorescent organic nanocrystals confined in sol- gel
coatings of controlled porosity. Microporous Mesoporous
Mater. 2010, 132 (3), 531-537.
7. Akio, Tsuji.; Masakatsu, M.; Masako, M.; Larry, J. K.; Philip,
E. S. Proceedings of the 13th International Symposium on
bioluminescence and chemiluminescence progress and
Perspectives. World Scientific Publishing Co. 2005.
8. Fung, E. Y.; Olmstead, M. M.; Vickery, J. C.; Balch, A. L.
Glowing gold rings: solvol- uminescence from planar
trigold (I) complexes. Coord. Chem. Rev. 1998, 171, 151-
159.
9. Eddingsaas, N. C.; Suslick, K. S. Intense mechanoluminescence
and gas phase reactions from the sonication of an organic
slurry. J. Am. Chem. Soc. 2007, 129 (21), 6718-6719.
10. Gilbert, A.; Baggott, J. Essentials of Molecular Photochemistry,
1st ed., Blackwell Scie- nce, Oxford, 1991.

Bibliography 155
11. Lakowicz, J. R. Principles of Fluorescence Spectroscopy, 2nd
ed., Kluwer Academic Plenum Publishers, New York, 1999.
12. Kasha, M. Characterization of electronic transitions in complex
molecules. Disc. Faraday Soc. 1950, 9, 14-19.
13. Korolkova, N.V.; Klimenko, V.G.; Kir’yanova, T.A.; Serov,
S.A.; Gastilovich, E.A. Internal heavy-atom effect on spin
orbit and vibronic–spin–orbit coupling: nπ*
phosphorescence of 9,10-anthraquinone haloderivatives. Chem.
Phys. 1999, 248, 233–246.
14. Parson, W. W. Modern Optical Spectroscopy. Springer, 2007.
15. Schenk, G. H. Absorption of Light and Ultraviolet Radiation
Fluorescence and Phosphorescence Emission. Al1y and
Bacon Inc., Boston, 1973.
16. Rendell, D. Fluorescence and Phosphorescence Spectroscopy.
John Wiley & Sons, 1987.
17. Yersin, H.; Finkenzeller, W. J. Triplet Emitters for Organic
Light-Emitting Diodes: Basic Properties. In Highly Efficient
OLEDs with Phosphorescent Materials; Yersin, H., Ed.;
Wiley-VCH: Weinheim, 2008, p 1.
18. Baleizão, C.; Berberan-Santos, M. N. Thermally activated
delayed fluorescence as a cycling process betweenexcited
singlet and triplet states: Application to the fullerenes. J. Chem.
Phys. 2007, 126 (20), 204510/1-204510/8.
19. Turro, N. J. Modern Molecular Photochemistry, 1st ed.,
University Science Books, 1991.
20. Wilson, J. S.; Chawdhury, N.; Al-Mandhary, M. R. A.; Younus,
M.; Khan, M. S.; Raithby, P. R.; Köhler, A.; Friend, R. H.
The Energy Gap Law for Triplet States in Pt-Containing
Conjugated Polymers and Monomers. J. Am. Chem. Soc. 2001,
123 (38), 9412-9417.
21. Valeur, Bernard. Molecular Fluorescence: Principles and
Applications. Wiley-VCH, 2001.
22. Birks, J. B. Photochemistry of Aromatic Molecules. John Wiley,
New York, 1970.
23. Förster, T. Intermolecular energy transference and fluorescence.
Ann. Physik. 1948, 2, 55-75.
24. Lakowicz, J. R. Principles of Fluorescence Spectroscopy, 3rd
ed. Springer, New York, 2006.
156 Bibliography
25. Pauluth, Detlef; Tarumi, Kazuaki. Advanced liquid crystals for
television. J. Mater. Chem. 2004, 14 (8), 1219-1227.
26. Kelly, S. M. Flat panel displays: Advanced Organic Materials.
RSC Materials Monographs, RS.C, 2000.
27. Vernon, F.; Khakoo, A. N. Comparison of Bentone and liquid-
crystal stationary phases for the gas chromatographic
separation of isomers. J. Chromatogr. 1978, 157, 412-41.
28. Weiss, R. G. Thermotropic liquid crystals as reaction media for
mechanistic investigations. Tetrahedron. 1988, 44 (12), 3413-
75.
29. Fukunaga, K.; Kansui, H.; Taniguchi, T.; Kunieda, T. Liquid
Crystal Control of Regio- and Diastereoselectivity in the Ac id-
Catalyzed Elimination of Alkyl Phosphates to Alkenes.
Tetrahedron Lett. 1997, 38 (50), 8731-8734.
30. Fukunaga, K. Kunieda, T. Liquid Crystal Control: A
remarkable enhancement of both efficiency and
diastereoselectivity of intramolecular thermal cycloadditions in
smectic solvents. Tetrahedron Lett. 1999, 40, 6041-6044.
31. Lounila, J.; Jokisaari, J. Anisotropies in spin-spin coupling
constants and chemical shifts as determined from the NMR
spectra of molecules oriented by liquid-crystal solvents.
Progress in NMR Spectroscopy. 1982, 15, (3), 249-90.
32. Meddour, A. ; Berdague, P.; Hedli, A.; Courtieu, J.; Lesot, P.
Proton-decoupled carbon-13 NMR spectroscopy in a lyotropic
chiral nematic solvent as an analytical tool for the
measurement of the enantiomeric excess. J. Am. Chem. Soc.
1997, 119, 4502-4508.
33. Eichhorn,H. Mesomorphic phthalocyanines, tetraazaporphyrins,
porphyrins and triphenyl-enes as charge-transporting materials.
J. Porphyrins Phthalocyanines. 2000, 4 (1), 88-102.
34. Eidenschink, R.; Hager, A. M. Reduction of fr iction through
presmectic lubricants. Mol. Cryst. Liq. Cryst. Sci. Technol. Sect.
A. 1997, 304, 513-517.
35. Hussain, A.; Pina, A. S.; Roque, A. C. A. Bio-recognition and
detection using liquid crystals. Biosens. bioelectron. 2009, 25
(1), 1-8.
36. Matharu, A. S.; Shehzad, J.; Ramanujam, P. S. Liquid crystals
for holographic optical data storage. Chem. Soc. Rev. 2007, 36
(12), 1868-80.

Bibliography 157
37. Lehmann, O. Über f liessende Kristalle. Zeitschrift für
Physikalische Chemie. 1889, 4, 462-72.
38. Lehmann, O. Die flüssige Kristalle. Leipzig, Wilhelm
Engelmann, 1904.
39. Gray, G. W. Introduction and historical development. In:
Demus.; Goodby, D. J.; Gray, G.W.; Spiess, H.W.; Vill, V.
(Ed.). Handbook of Liquid Crystals. Wiley-VCH, 1998, Vol. 1,
page 3-4.
40. G. Tammann, Ann. Physik. 1901, 4, 524. 1902, 8, 103. 1906,
19,421.
41. W. Nernst, Z. Elektrochem. 1906, 12, 43.
42. Firedel, G. The mesomorphic states of matter. Ann.
phys. 1922, 18, 273-474.
43. Collings, P. J. Nature’s Delicate Phase of Matter. Princeton U.
P. 1990.
44. Baron1, M.; Stepto, R. F. T. Pure Appl. Chem. 2002, 74 (3),
493–509.
45. Singh, S. Phase transitions in liquid crystals. Phys. Rep. 2000,
324(2-4), 107-269.
46. Guittard, F.; Taffin de Givenchy, E.; Geribaldi, S.; Cambon, A.
Highly f luorinated thermotropic liquid crystals: an update. J.
Fluorine Chem. 1999, 100 (1-2), 85-96.
47. Binnemans, K. Ionic liquid crystals. Chem. Rev. 2005, 105 (11),
4148-204.
48. Cook, A. G.; Baumeister, U.; Tschierske, C. Supramolecular
dendrimers: Unusual mesophases of ionic liquid crystals
derived from protonation of DAB dendrimers with facial
amphiphilic carboxylic acids. J. Mater. Chem. 2005, 15 (17),
1708-1721.
49. Hudson, S. A.; Maitlis, P. M. Calamitic metallomesogens:
metal-containing liquid crystals with rodlike shapes. Chem.
Rev. 1993, 93 (3), 861-85.
50. Giroudgodquin, A. M.; Maitlis, P. M. Metallomesogens: Metal Complexes in Organized Fluid Phases . Angew. Chem. Int. Ed.
Engl. 1991, 30 (4), 375-402.
51. Metallomesogens: Synthesis, Properties, and Applications.
Edited by Jose Luis Serrano, VCH, 1996.
52. Ishihara, S.; Furuki, Y.; Takeoka, S. A hydrogen-bonded
supramolecular hexagonal columnar liquid crystal composed of

158 Bibliography
a tricarboxylic triphenylene and monopyridyl dendrons. Chem.
Lett. 2007, 36 (2), 282-283.
53. Ciferri, Alberto. Assembling nano and macrostructures and the
supramolecular liquid crystal. Prog. Polym. Sci. 1995, 20 (6),
1081-120.
54. Taylor, R. A.; Ellis, H. A. Polymorphism, crystal-crystal and
liquid crystalline thermotropic phase transition behaviour of
even chain length zinc(II) n-alkanoates. Liq. Cryst. 2009, 36
(3), 257-268.
55. Ray, A. Micelle formation in pure ethylene glycol. J. Amer.
Chem. Soc. 1969, 91 (23), 6511-6512.
56. Nakamura, Y.; Koori, M.; Li, Y.; Norisuye, T. Lyotropic liquid
crystal formation of polystyrene polymacromonomers in
dichloromethane. Polymer 2008, 49 (22), 4877-4881.
57. Albayrak, C.; Oezkan, N.; Dag, O. Origin of Lyotropic Liquid
Crystalline Mesophase Formation and Liquid Crystalline to
Mesostructured Solid Transformation in the Metal Nitrate Salt-
Surfactant Systems. Langmuir 2011, 27 (3), 870-873.
58. Greaves, T. L.; Drummond, C. J. Ionic liquids as amphiphile
self-assembly media. Chem. Soc. Rev. 2008, 37 (8), 1709-1726.
59. Fairhurst, C. E.; Fuller, S.; Gray, J.; Holmes, M.C.; Tiddy, G. J.
T. Lyotropic surfactant liquid crystals. In: Demus, D.; Goodby,
J.; Gray, G.W.; Spiess, H.-W.; Vill, V. (Ed.). Handbook of
Liquid Crystals. Wiley-VCH, 1998, Vol. 3, 346.
60. Orisch, K.; Tschierske, C.; Goring, P.; Diele, Siegmar.
Molecular design of thermotropic liquid crystalline
polyhydroxy amphiphiles exhibiting columnar and cubic
mesophases of the normal type. Chem. Commun. 1998, (24),
2711-2712.
61. Stephen T. H. Identification of lyotropic liquid crystalline
mesophases. In: Holmberg, K. (Ed.). Handbook of applied
surface and colloid chemistry. John Wiley & sons 2001.
62. Hamley, I.W.; Krysmann, M. J.; Castelletto, V.; Noirez, L.
Multiple lyotropic polymorphism of a poly(ethylene glycol)-
peptide conjugate in aqueous solution. Adv. Mater. 2008, 20
(23), 4394-4397.
63. Fuller, S.; Hopwood, J.; Rahman, A.; Shinde, N.; Tiddy, G. J.;
Attard, G. S.; Howell, O.; Sproston, S. Amphitropic liquid
crystals: two lamellar phases in a surfactant containing
Bibliography 159
thermotropic and lyotropic mesogenic groups. Liq. Cryst. 1992,
12 (3), 521-529.
64. Corcoran, J.; Fuller, S.; Rahman, A.; Shinde, N.; Tiddy, G. T.;
Attard, G. S. Amphitropic liquid crystals. Part 1. Effect of a
thermotropic mesogen on lyotropic mesomorphism, and of a
surfactant on thermotropic mesomorphism. The C16EO8-5-CB-
water system. J. Mater. Chem. 1992, 2 (7), 695-702.
65. Joshi, L.; Kang, S. W.; Agra, K.; Dena, Mae.; Kumar, S.
Concentration, temperature, and pH dependence of sunset-
yellow aggregates in aqueous solutions : An x-ray investigation.
Phys. Rev. E: Stat.,Nonlin. Soft Matter Phys. 2009, 80,
041703/1-041703/8.
66. Dierking, I. Textures of Liquid Crystals. WILEY-VCH Verlag
GmbH & Co. KGaA, Weinheim, 2003.
67. Goodby, G.W. Phase structures of calamitic liquid crystals. In:
Demus, D.; Goodby, J.; Gray, G.W.; Spiess, H.-W.; Vill, V.
(Ed.). Handbook of Liquid Crystals. Wiley-VCH, 1998, Vol.
2A, 3-20.
68. Osipov, M. A.; Kuball, H. G. Helical twisting power and
circular dichroism in nematic liquid crystals doped with chiral
molecules. Eur. Phys. J. E: Soft Matter 2001, 5 (5), 589-598.
69. Gray, G. W.; Goodby, J. W. Smectic Liquid Crystals: Textures
and Structures. Leonard Hill, Glasgow, UK, 1984.
70. Lagerwall, J. P. F.; Giesselmann, F. Current topics in smectic
liquid crystal research. ChemPhyschem: A European journal of
chemical physics and physical chemistry 2006, 7 (1), 20-45.
71. Chandrasekhar, S.; Sadashiva, B. K.; Suresh, K. A. Liquid
crystals of disc-like molecules. Pramana 1977, 9 (5), 471-480.
72. Vorlander, D. Influence of Molecular form on the Liquid
Crystalline State. Ber. Dtsch. Chem. Ges. 1907, 40, 1970-
1972.
73. Cammidge, A. N.; Bushby, R. J. Synthesis and structural
features. In: Demus, D.; Goodby, J.; Gray, G.W.; Spiess, H.-
W.; Vill, V. (Ed.). Handbook of Liquid Crystals. Wiley-VCH,
1998, Vol. 2B, 693-747.
74. Dolores, P.; Enrique, G. Selected strategies for the synthesis of
triphenylenes. Chem. Soc. Rev. 2004, 33 (5), 274-283.
160 Bibliography
75. Roussel, O; Kestemont, G.; Tant, J.; Halleux, V. Discotic
liquid crystals as electron carrier materials. Molec. Cryst.Liq.
Cryst. 2003, 396, 35-39.
76. Cristiano, R.; Gallardo, H.; Bortoluzzi, A. J.; Bechtold, I. H.;
Carlos, E. M. Longo, R. L. Tristriazolotriazines: a core for
luminescent discotic liquid crystals. Chem. Commun. 2008,
5134–5136.
77. Qi, M-H.; Liu, G-F. Synthesis and properties of transition metal
benzoporphyrin compound liquid crystals. J. Mater. Chem.
2003, 13 (10), 2479-2484.
78. Sergeyev, S.; Pisula, W.; Geerts, Y. H. Discotic liquid crystals:
A new generation of organic semiconductors. Chem. Soc. Rev.
2007, 36 (12), 1902-1929.
79. Msayib, K.; Makhseed, S.; McKeown, N. B. Synthetic
strategies towards macrodiscotic materials. Can a new
dimension be added to liquid crystal polymers? J. Mater. Chem.
2001, 11(11), 2784-2789.
80. Kumar, S. Chemistry of Discotic Liquid Crystals: From
Monomers to Polymers. CRC Press, Taylor and Francis Group
2011.
81. Ichihara, M.; Suzuki, A.; Hatsusaka, K.; Ohta, K. Discotic
liquid crystals of transition metal complexes 37*: A
thermotropic cubic mesophase having symmetry
exhibited by phthalocyanine based derivatives. Liq. Cryst.
2007, 34 (5), 555-567.
82. Alameddine, B.; Aebischer, O. F.; Deschenaux, R.; Guillon, D.;
Titus, A. Mesomorphic Hexabenzocoronenes Bearing
Perfluorinated Chains. Chem. Mater. 2005, 17 (19), 4798-4807.
83. Kumar, S. Playing with discs. Liq. Cryst. 2009, 36 (6-7), 607-
638.
84. Madhusudana, N. V. Recent advances in thermotropic liquid
crystals. Current Science 2001, 80 (8), 1018-1025.
85. Kohne, B.; Praefcke, Klaus. Liquid crystal compounds. Part 43.
Hexaalkynylbenzene derivatives, first hydrocarbons as new
columnar or nematic discotic liquid crystals. Chimia 1987,
41(6), 196-198.
86. Langne, M.; Praefcke, K.; Krueerke, D.; Heppke, G. Chiral
radial pentaynes exhibiting cholesteric discotic phases. J.
Mater. Chem. 1995, 5 (4), 693-699.
Bibliography 161
87. Praefcke, K.; Singer, D.; Kohne, B.; Ebert, M.; Liebmann, A.;
Wendorff, J. H. Liquid crystalline compounds. 63. Charge
transfer induced nematic columnar phase in low molecular
weight disk-like systems. Liq. Cryst. 1991, 10 (2), 147-159.
88. Kouwer, P. H. J.; Jager, W. F.; Mijs, W.; Picken, S. J. The
Nematic Lateral Phase: A Novel Phase in Discotic
Supramolecular Assemblies. Macromolecules 2001, 34 (22),
7582-7584.
89. Kouwer, P. H. J.; Van den Berg, O.; Jager, W. F.; Mijs, W. J.;
Picken, St. J. Induced Liquid Crystalline Diversity in Molecular
and Polymeric Charge-Transfer Complexes of Discotic
Mesogens. Macromolecules 2002, 35 (7), 2576-2582.
90. ImrieC. T.; Karasz, F. E.; Attard, G. S. Comparison of the
mesogenic properties of monomeric, dimeric, and side-chain
polymeric liquid crystals. Macromolecules 1993, 26 (3), 545-
50.
91. Blumstein, A.; Sivaramakrishnan, K. N.; Clough, S. B.;
Blumstein, R. B. Polymeric thermotropic liquid crystals:
polymers with mesogenic elements and flexible spacers in the
main chain. Mol. Cryst. Liq. Cryst. 1979, 49 (8), 255-8.
92. Blumstein, R. B.; Blumstein, A. Inherently flexible
thermotropic main chain polymeric liquid crystals. Mol. Cryst.
Liq. Cryst. 1988, 165, 361-87.
93. Blinov, L. M. Structure and Properties of Liquid Crystals.
Springer Science, 2011.
94. Demus, D. One century liquid crystal chemistry: From
Vorlander's rods to disks, stars and dendrites. Mol. Cryst. Liq.
Cryst. Sci. Technol., Sect. A. 2001, 364 25-91.
95. Tschierske, C. Non-conventional liquid crystals: the importance
of micro-segregation for self-organization. J. Mater. Chem.
1998, 8 (7), 1485-1508.
96. Tschierske, C. Micro-segregation, molecular shape and
molecular topology-partners for the design of liquid crystalline
materials with complex mesophase morphologies. J. Mater.
Chem. 2001, 11 (11), 2647-2671.
97. Goodby, J. W.; Bruce, D. W.; Hird, M.; Imrie, C.; Neal, M. An
introduction to Materials Discussion No. 4: Molecular topology
in liquid crystals. J. Mater. Chem. 2001, 11, 2631–2636.
162 Bibliography
98. Lehmann, M.; Jahr, M.; Grozema, F. C.; Abellon, R. D.;
Siebbeles, L. D. A.; Mueller, M. Columnar mesophases with
3D order from new functional nonconventional star-shaped
mesogens. Adv. Mater. 2008, 20 (23), 4414-4418.
99. Lehmann, M.s; Gearba, R. I.; Koch, M. H. J.; Ivanov, D. A.
Semiflexible Star-Shaped Mesogens as Nonconventional
Columnar Liquid Crystals. Chem. Mater. 2004, 16(3), 374-376.
100. Artal, M. C.; Toyne, K. J.; Goodby, J. W.; Barbera, J.;
Photinos, D. J. Synthesis and mesogenic properties of novel
board-like liquid crystals. J. Mater. Chem. 2001, 11(11), 2801-
2807.
101. Sultana, N. H.; Kelly, S. M.; Mansoor, B.; O'Neill, M.
Polycatenar oligophenylene liquid crystals. Liq. Cryst. 2007, 34
(11), 1307-1316.
102. Gharbia, M.; Gharbi, A.; Nguyen, H. T.; Malthete, J.
Polycatenar liquid crystals with long rigid aromatic cores: a
review of recent works. Curr. Opin. Colloid Interface Sci. 2002,
7 (5,6), 312-325.
103. Yutaka, M.; Ayako, M.; Ryo, H.; Norihiro, M.; Takashi, K.;
Eiichi, N. Stacking of molecules possessing a fullerene apex
and a cup-shaped cavity connected by a silicon connection. J.
Amer. Chem. Soc. 2004, 126 (2), 432-433.
104. Zhong, Y-W; Matsuo, Y.; Eiichi, N. Lamellar Assembly of
Conical Molecules Possessing a Fullerene Apex in Crystals and
Liquid Crystals. J. Amer. Chem. Soc. 2007, 129 (11), 3052-
3053.
105. Komori, T.; Shinkai, S. Novel columnar liquid crystals
designed from cone-shaped calix[4]arenes. The rigid bowl is
essential for the formation of the liquid crystal phase. Chem.
Lett.(1993), (8), 1455-8.
106. Mindyuk, O.; Stetzer, M. R.; Heiney, Paul, A.; Nelson, J. C.;
Moore, J. S. High-resolution x-ray diffraction study of a tubular
liquid crystal. Adv. Mater. 1998, 10 (16), 1363-1366.
107. Kato, T.; Mizoshita, N.; Kishimoto, K. Functional liquid-
crystalline assemblies: Self-organized soft materials. Angew.
Chem. Int. Ed. 2006, 45 (1), 38-68.
108. Tabushi, I.; Yamamura, K.; Kominami, K. Electric stimulus-
response behavior of liquid-crystalline viologen. J. Amer.
Chem. Soc. 1986, 108 (20), 6409-10.
Bibliography 163
109. Aprahamian, I.; Yasuda, T.; Ikeda, T.; Saha, S.; Dichtel, W. R.;
Isoda, K.; Kato, T.; Stoddart, J. Fraser. A liquid-crystalline
bistable [2]rotaxane. Angew. Chem. Int. Ed. 2007, 46 (25),
4675-4679.
110. Westphal, E.; Bechtold, I. H.; Gallardo, H. Synthesis and
Optical/Thermal Behavior of New Azo Photoisomerizable
Discotic Liquid Crystals. Macromolecules 2010, 43, 1319-
1328.
111. Broer, D. J.; Cees, M. W.; Bastiaansen, M. G. Debije, Albertus
P. H.; Schenning, J. Functional Organic Materials based on
Polymerized Liquid-Crystal Monomers: Supramolecular
Hydrogen-Bonded Systems. Angew. Chem. Int. Ed. 2012, 51,
7102-7109.
112. Kato, T.; Kihara, H.; Kumar, U.; Uryu, T.; Fréchet, J. M. J. A
Liquid-Crystalline Polymer Network Built by Molecular Self-
Assembly through Intermolecular Hydrogen Bonding. Angew.
Chem.Int. Ed. Engl.1994, 33, 1644-1645.
113. Kanie, K.; Yasuda, T.; Nishii, M.; Ujiie, S.; Kato, T. Hydrogen-
bonded lyotropic liquid crystals of folic acids : responses to
environment by exhibiting different complex patterns. Chem.
Lett. 2001, (6), 480-481.
114. Berkovic, G.; Krongauz, V.; Weiss, V. Spiropyrans and
Spirooxazines for Memories and Switches. Chem. Rev. 2000,
100, 174.
115. Irie, M. Diarylethenes for Memories and Switches. Chem. Rev.
2000, 100, 1685.
116. Yokoyama, Y. Fulgides for Memories and Switches. Chem.
Rev. 2000, 100, 1717.
117. Dinescu, L.; Lemieux, R.P. Photomodulation of the
Spontaneous Polarization of a Ferroelectric Liquid Crystal:
Harnessing the Transverse Dipole Modulation of a Chiral
Thioindigo Dopant. J. Amer. Chem. Soc. 1997, 119, 8111.
118. Nobuyuki, T; Takashi, K. Reversible photo-regulation of the
properties of liquid crystals doped with photochromic compounds. J. Photochem. Photobio. C: Photochem. Rev. 2010,
11, 47–61.
119. Neto, B. A. S; Lopes, A. S. A.; Ebeling, G.; Goncalves, R. S.;
Costa, V. E. U.; Quina, F. H.; Dupont, J. Photophysical and

164 Bibliography
electrochemical properties of π-extended molecular 2,1,3-
benzothiadiazoles. Tetrahedron 2005, 61 (46), 10975-10982.
120. Ku, S-Y.; Chi, L-C.; Hung, W-Y.; Yang, S-W.; Tsai, T.C.;
Wong, K-T.; Chen, Y-H.; Wu, C-I. High-luminescence non-
doped green OLEDs based on a 9,9-diarylf luorene-terminated
2,1,3-benzothiadiazole derivative. J. Mater. Chem. 2009, 19
(6), 773-780.
121. Thomas, K. R. J.; Lin, J. T.; Velusamy, M.; Tao, Y-T; Chuen,
C-H. Color tuning in benzo[1,2,5]thiadiazole-based small
molecules by amino conjugation/deconjugation: Bright red-
light-emitting diodes. Adv. Funct. Mater. 2004, 14 (1), 83-90.
122. Zhang, D.; Liu, J.; Wang, L.; Liu, Y.; Ma, D. Blue amplified
spontaneous emission from 2,1,3-benzothiadiazole attached
polyfluorene semiconductor polymer with high
photoluminescence efficiency. J. Phys. D: Appl. Phys. 2009, 42
(4), 045417/1-045417/4.
123. Vieira, A. A.; Cristiano, R; Bortoluzzi, A. J.; Gallardo, H.
Luminescent 2,1,3-benzothiadiazole-based liquid crystalline
compounds. J. Mol. Struct. 2008, 875(1-3), 364-371.
124. Gallardo, H.; Conte, G.; Tuzimoto, P. A.; Behramand, B.;
Molin, F.; Eccher, J.; Bechtold, I. V. New Luminescent
Liquid Crystals Based on 2,1,3-Benzothiadiazole and Bent
Five-membered N-Heterocyclic Cores. Liquid Cryst. 2012, 39
(9), 1099–1111.
125. Marcelo, N. F.; Vieira, A. A.; Cristiano, R.; Gallardo, H.;
Bechtold, I. H. Polarized light emission from aligned
luminescent liquid crystal films based on 4,7-disubstituted-
2,1,3-benzothiadiazoles. Synth. Met. 2009, 159 (7-8), 675-680.
126. Fu, B.; Baltazar, J.; Hu, Z.; Chien, A-T.; Kumar, S.; Henderson,
C. L.; Collard, D. M.; Reichmanis, E. High Charge Carrier
Mobility, Low Band Gap Donor−Acceptor Benzot-hiadiazole-
oligothiophene based Polymeric Semiconductors. Chem.
Mater. 2012, 24, 4123−4133
127. Bouffard, J.; Swager, T. M. Fluorescent conjugated polymers
that incorporate substituted 2,1,3-benzooxadiazole and 2,1,3-
benzothiadiazole units. Macromolecules 2008, 41 (15), 5559-
5562.
128. Zoombelt, A. P.; Fonrodona, M.; Wienk, M. M.; Sieval, A. B.;
Hummelen, J. C.; Janssen, R.A. J. Photovoltaic Performance of

Bibliography 165
an Ultrasmall Band Gap Polymer. Org. Lett. 2009, 11 (4), 903-
906.
129. Subbiah, J.; Choudhury, K. R.; Ellinger, S.; Reynolds, J. R.;
Franky S. Color Tunable π-Conjugated Polymers for
Solar-Cell Applications : Engineering of Bandgap, Interface,
and Charge Transport Properties. IEEE J. Sel. Topics
Quantum Electron. 2010, 16 (6), 1792-1800.
130. Yang, R.; Tian, R.; Yan, J.; Zhang, Y.; Yang, J.; Hou, Q.;
Yang, W.; Zhang, C.; Cao, Y. Deep-Red Electroluminescent
Polymers: Synthesis and Characterization of New Low Band-
Gap Conjugated Copolymers for Light-Emitting Diodes and
Photovoltaic Devices. Macromolecules 2005, 38 (2), 244-253.
131. Fabio, S.; Assunta, M.; Mirko, S.; Choongik, K.; Tobin J. M.;
Antonio, F.; Aldo, T. Solution-processable low-molecular
weight extended arylacetylenes: versatile p-type
semiconductors for field-effect transistors and bulk
heterojunction solar cells. J. Amer. Chem. Soc. 2010, 132 (17),
6108-6123.
132. Santa, T.; Takeshi, F.; Tomoko, I.; Imai, K. Recent progress in
the development of derivatization reagents having a
benzofurazan structure. Biomed. Chromatogr. 2008, 22 (4),
343-353.
133. Song, Y.; Funatsu, T.; Tsunoda, M. Amino acids analys is using
a monolithic silica column after derivatization with 4-fluoro-7-
nitro-2,1,3-benzoxadiazole (NBD-F). J. Chromatogr. B. 2011,
879, 335–340.
134. Toshimasa, T. Indirect enantioseparation by HPLC using chiral
benzofurazan-bearing reagents. Methods Mol. Biol. 2004, 243,
231-246.
135. Sumiya, S.; Sugii, T.; Shiraishi, Y.; Hirai, T. A benzoxadiazole-
thiourea conjugate as a fluorescent chemodosimeter for Hg(II)
in aqueous media. J. Photochem. Photobiol., A: Chemistry
2011, 219, 154–158.
136. Caputo, B. J. A.; Welch, G. C.; Kamkar, D. A.; Henson, Z. B.;
Nguyen, T-Q.; Bazan, G. C. A Dithienosilole Benzooxadiazole
Donor-Acceptor Copolymer for Utility in Organic Solar Cells.
Small 2011, 7(10), 1422-1426.
137. Zeng, S.; Yin, L.; Jiang, X.; Li, Y.; Li, K. D-A-D low band gap
molecule containing triphenylamine and benzoxadiazole/ben-
166 Bibliography
zothiadiazole units: Synthesis and photophysical properties.
Dyes Pigment. 2012, 95, 229-235.
138. Lin, Z.; Bjorgaard, J.; Yavuz, A. G. Kose, M. E. Low Band Gap
Star-Shaped Molecules Based on Benzothia(oxa)diazole for
Organic Photovoltaics. J. Phys. Chem. C 2011, 115,
15097–15108.
139. Chan, H. S. O.; Choon Ng, S. Synthesis, Characterization and
applications of thiophene-based functional polymers. Prog.
Polym. Sci., 1998, 23, 1167-1231.
140. Roncali, J. Conjugated Poly(thiophenes): Synthesis,
Functionalization, and Applications. Chem. Rev. 1992, 92, 711-
738.
141. Mishra, A.; Ma, C-Q,; Segura, J. L.; Bauerle, P. Functional
oligothiophene-based materials : Nanoarchitectures and
Applications. In: Handbook of Thiophene-based Materials:
Applications in Organic Electronics and Photonics. John Wiley
& Sons 2009.
142. Seed, A. Synthesis of self-organizing mesogenic materials
containing a sulfur-based five-membered heterocyclic core.
Chem. Soc. Rev. 2007, 36, 2046–2069.
143. Yasuda, T.; Shimizu, T.; Liu, F.; Ungar, G.; Kato, T. Electro-
functional Octupolar π-Conjugated Columnar Liquid Crystals.
J. Am. Chem. Soc. 2011, 133, 13437–13444.
144. Jie, H.; Yan-Mei, W.; Xiao-Guang, W. Synthesis, Mesogenic
and Spectroscopic Properties of 2,5-Disubstituted Thiophene
Derivatives. Chin. J. Chem. 2006, 24, 1594-1598.
145. Huang, X.; Dong, Y.; Meng, J.; Cheng, Y.; Zhu, C.
Fluorescence Polymer Incorporating Triazole and
Benzo[2,1,3]thiadiazole Moieties for Ni2+
Detection. Synlett
2010, (12), 1841-1844.
146. Tahara, K.; Furukawa, S.; Uji-i, H; Uchino, T.; Ichikawa, T.;
Zhang, J.; Mamdouh, W.; Sonoda, M.; De Schryver, F. C.;
De Feyter, S.; Tobe, Y. Two-Dimensional Porous Molecular
Networks of Dehydrobenzo[12]annulene Derivatives via Alkyl
Chain Interdigitation. J. Am. Chem. Soc. 2006, 128, 16613-
16625.
147. Grolik, J.; Sieron, L.; Eilmes, J. A new liquid crystalline
derivative of dibenzotetraaza[14]annulene: synthesis,
Bibliography 167
characterization and the preliminary evaluation of mesomorphic
properties. Tetrahedron Lett. 2006, 47, 8209–8213.
148. Wulfman, D. S.; Cooper, C. F. Monoreduction of dinitroarenes
with iron/acetic acid. Synthesis 1978, 12, 924-925.
149. Melissaris, A. P.; Litt, M. H. A simple and economic route to p-
ethynylaniline and ethynyl terminated substrates. J. Org. Chem.
1994, 59 (19), 5818-5821.
150. Ma, L.; Hu, Q. S.; Pu, L. Synthesis of an optically active poly
(aryleneethynylene) containing extended conjugation in the
repeat unit. Tetrahedron: Asymmetry 1996, 7 (11), 3103-3136.
151. Bleicher, L.; Cosford, N. D. P. Aryl- and heteroaryl-alkyne
coupling reactions catalyzed by palladium on carbon and CuI in
an aqueous medium. Synlett 1995, 11, 1115-1116.
152. Malkina, A. G.; Brandsma, L.; Vasilevsky, S. F.; Trofimov, B.
A. An improved procedure for the preparation of aryl- and
hetarylacetylenes. Synthesis 1996, 589-590.
153. Chinchilla, R.; Najera, C. The Sonogashira Reaction: A
Booming Methodology in Synthetic Organic Chemistry.
Chem. Rev. 2007, 107, 874−922.
154. Chinchilla, R.; Najera, C. Recent advances in Sonogashira
reactions. Chem. Soc. Rev. 2011, 40, 5084–5121.
155. Siemsen, P.; Livingston, R. C.; Diederich, F. Acetyleni
Coupling: A powerful tool in molecular construction.
Angew. Chem. Int. Ed. 2000, 39, 2632-2657.
156. Li, J. H.; Liang, Y.; Zhang, X. D. Amine- and Phosphine-free
Palladium(II)- Catalyzed Homocoupling Reaction of
Terminal Alkynes. Tetrahedron 2005, 61, 1903-1907.
157. Thorand, S.; Krause, N. Improved Procedures for the
Palladium-Catalyzed Coupling of Terminal Alkynes with
Aryl Bromides (Sonogashira Coupling) J. Org. Chem. 1998,
63, 8551 8553.
158. Gerard P. M.; Fairlamb, I. J. S. Palladium-Catalysed Cross-
Coupling and Related Proesses: Some Interesting
Observations that Have Been Exploited in Synthetic Chemistry.
Eur. J. Org. Chem. 2009, 4011–4029.
159. Marsden, J. A.; Haley, M. M. Cross-Coupling Reactions to sp
Carbon Atoms. In: Metal Catalyzed Cross-Coupling Reactions.
2nd Ed. Volume 1, Edited by A. de Meijere, F. Diederich.
WILEY-VCH, 2004.

168 Bibliography
160. Wei, Y.; Zhang, Q.; Jiang, Y.; Yu, J. Novel Low Bandgap
EDOT- Naphthalene Bisimides Conjugated Polymers:
Synthesis, Redox, and Optical Properties. Macromol. Chem.
Phys. 2009, 210, 769-775.
161. Crespilho, F. N.; Zucolotto, V.; Siqueira Jr, J. R.; Carvalho, A.
J. F.; Nart, F. C.; Oliveira Jr, O. N. Using Electrochemical Data
to Obtain Energy Diagrams for Layer-By-Layer Films from
Metallic Phthalocyanines. Int. J. Electrochem. Sci. 2006, 151-
159.
162. Wu, C-C.; Sturm, J. C.; Register, R. A.; Tian, J.; Dana, E. P.;
Thompson, M. E. Efficient Organic Electroluminescent Devices
Using Single- Layer Doped Polymer Thin Films with Bipolar
Carrier Transport Abilities. IEEE Trans. Electron Devices
1997, 4 (8), 1269-1281.
163. Micaroni, L.; Nart, F.C.; Hummelgen, I.A. Considerations
about the electrochemical estimation of the ionization potential
of conducting polymers. J. Solid State Electrochem.
2002, 7: 55–59.
164. Hung, Y-C.; Jiang, J-C.; Chao, C-Y.; Su, W. F.; Lin, S-T.
Theoretical Study on the Correlation between Band Gap,
Bandwidth, and Oscillator Strength in Fluorene-Based
Donor Acceptor Conjugated Copolymers. J. Phys. Chem. B
2009, 113, 8268–8277.
165. Chen, X.; Liu, B.; Zou, Y.; Xiao, L.; Guo, X.; He Y.; Li, Y. A
new benzo[1,2-b:4,5-b']difuran-based copolymer for efficient
polymer solar cells. J. Mater. Chem. 2012, 22, 17724–17731.
166. Kayaa, I.; Aydın, A. Synthesis, characterization, thermal
stability, conductivity, and band gaps of substitute
oligo/polyamines or polyphenol. Polym. Adv. Technol. 2010, 21
337–347.
167. Gallardo, H.; Conte, G.; Tuzimoto, P.; Bortoluzzi, A.; Peralta,
R. A.; Neves, A. Synthesis, crystal structure and luminescent
properties of new tris-b-diketonate Eu(III) complex with
thiadiazolophenanthroline derivative ligand. Inorg. Chem.
Commun. 2008, 11, 1292–1296.
168. Eckhardt, H.; Shacklette, L.W.; Jen, K.Y.; Elsenbaumer, R.L.
The electronic and electrochemical properties of
poly(phenylene vinylenes) and poly(thienylene vinylenes): An

Bibliography 169
experimental and theoretical study. J. Chem. Phys. 1989, 91(2),
1303-1315.
169. Zhang, K.; Tieke, B.; Forgie, J. C.; Vilela, F.; Skabara, P. J.
Donor-Acceptor Conjugated Polymers Based on p- and o-
Benzodifuranone and Thiophene Derivatives: Electrochemical
Preparation and Optical and Electronic Properties.
Macromolecules 2012, 45, 743−750.
170. Hellstrom, S.; Zhang, F.; Inganas, O.; Andersson, M. R.
Structure-property relationships of small bandgap
conjugated polymers for solar cells. Dalton Trans. 2009,
10032–10039.
171. Han, J.; Wang, Y-M, Wang, X-G. Synthesis, Mesogenic and
Spectroscopic Properties of 2,5-Disubstituted Thiophene
Derivatives. Chin. J. Chem. 2006, 24, 1594—1598.
172. Fery-Forgues, S.; Lavabre, D. Are Fluorescence Quantum
Yields So Tricky to Measure? A Demonstration Using Familiar
Stationery Products. J. Chem. Educ.1999, 76 (9), 1260-1264.
173. Robert, R. G.; Carl, A. K.; George, C. L. Ferrocene as an
Internal Standard for Electrochemical Measurements.
Inorg. Chem. 1980,19 (9), 2854-5.
174. Heck, R. F.; Palladium Reagents in Organic Synthesis.
Academic Press: London, 1985.
175. Kaller, M.; Tussetschlager, S.; Fischer, P.; Deck, C.; Baro, A.;
Giesselmann, F.; Laschat, S .Columnar Mesophases Controlled
by Counterions in Potassium Complexes of Dibenzo[18]
crown-6 Derivatives. Chem. Eur. J. 2009, 15 (37) 9530-9542.
176. McDonald, R.; Lacey, D.; Watson, P.; Cowling, S.; Wilson, P.
Synthesis and evaluation of some novel chiral heterocyclic
liquid crystalline materials exhibiting ferro- and
antiferroelectric phases. Liq. Cryst. 2005, 32 (3), 319-330.
177. Helgesen, M.; Gevorgyan, S. A.; Krebs, F. C.; Janssen, R. A. J.
Substituted 2,1,3-Benzothiadiazole- and Thiophene-Based
Polymers for Solar Cells - Introducing a New Thermocleavable
Precursor. Chem. Mater. 2009, 21, 4669–4675.
178. Edmund, J. F.; Dickinson, J. G. Limon, P.; Rees, N. V.;
Richard, G. C. How Much Supporting Electrolyte is
Required to Make a Cyclic Voltammetry Experiment
Quantitatively “Diffusional”? A Theoretical and Experimental
Investigation. J. Phys Chem. C. 2009, 113, 11157–11171.

170 Bibliography
179. Bard, A. J.; Faulkner, L. R. ELECTROCHEMICAL
METHODS: Fundamentals and Applications. 2nd ed. Chapter 4
© John Wiley & Sons Inc. 2001.
180. Ishii, H.; Sugiyama, K.; Ito, E.; Seki, K. Energy Level
Alignment and Interfacial Electronic Structures at
Organic/Meta and Organic/Organic Interfaces. Adv. Mater.
1999, 11, No. 8, 605-625.
181. Fifield, F. W.; Kealey, D. Principles and Practice of Analytical
Chemistry. 5th ed. 2000, Blackwell Science Ltd.
182. Cristiano, R.; Oliveira Santos, D. M. P.; Conte, G.; Gallardo, H.
1,4-Diaryl and Schiff’s base [1,2,3]-triazole derivative liquid
crystalline compounds. Liq. Cryst. 2006, 33 (9), 997–1003.
183. Boden, N.; Movaghar, B. Applicable Properties of Columnar
Discotic Liquid Crystals. In: Demus, D.; Goodby, J.; Gray,
G.W.; Spiess, H.W.; Vill, V. (Ed.). Handbook of Liquid
Crystals. Wiley-VCH, 1998, Vol. 2b, 781-798.
184. Ternpler, R. H. X-Ray Characterization of Liquid Crystals:
Instrumentation. In: Demus, D.; Goodby, J.; Gray, G.W.;
Spiess, H.W.; Vill, V. (Ed.). Handbook of Liquid Crystals.
Wiley-VCH, 1998, Vol. 1, 619-634.
185. Seddon, J.M. Structural studies of liquid crystals by X-Ray
diffraction. In: Demus, D.; Goodby, J.; Gray, G.W.; Spiess,
H.W.; Vill, V. (Ed.). Handbook of Liquid Crystals.
Wiley-VCH, 1998, Vol. 1, 635-680.
186. Davidson, P. Selected topic in X-Ray scattering by liquid-
crystalline polymers. In: Liquid crystals II, Structure and
bonding 95, Volume Editor: Mingos, D.M.P. Springer-Verlag,
1999.
187. Niori, T.; Sekine, T.; Watanabe, J.; Furukawa, T.; Takezoe, H.
Distinct ferroelectric smectic liquid crystals consisting of
banana shaped achiral molecules. J. Mater. Chem. 1996, 6 (7),
1231-1233.
188. Weissflog, W.; Nadasi, H.; Dunemann, U.; Pelzl, G.; Diele, S.;
Eremin, A.; Kresse, H. Influence of lateral substituents on the
mesophase behaviour of banana-shaped mesogens. J. Mater.
Chem. 2001, 11 (11), 2748-2758.
189. Shen, D.; Pegenau, A.; Diele, S.; Wirth, I.; Tschierske, C.
Molecular Design of Nonchiral Bent-Core Liquid Crystals with

Bibliography 171
Antiferroelectric Properties. J. Amer. Chem. Soc. 2000, 122 (8),
1593-1601.
190. Sadashiva, B. K.; Murthy, H. N.; Shreenivasa; Dhara, S. Effect
of lateral substituents on the mesophases formed by some
achiral banana-shaped molecules. Liq. Cryst. 2001, 28 (3), 483-
487.
191. Shen, D.; Diele, S.; Pelzl, G.; Wirth, I.; Tschierske, C.
Designing banana-shaped liquid crystals without Schiff's base
units: m-terphenyls, 2,6-diphenylpyridines and V-shaped tolane
derivatives. J. Mater. Chem. 1999, 9 (3), 661-672.
192. Link, D. R.; Natale, G.; Shao, R.; Maclennan, J. E.; Clark, N.
A.; Korblova, E.; Walba, D.M. Spontaneous formation of
macroscopic chiral domains in a fluid smectic phase of achiral
molecules. Science 1997, 278 (5345), 1924-1927.
193. Gerhard P; Wolfgang, W. Mesophase behavior at the borderline
between calamitic and “banana shaped” mesogens. In:
Ayyalusamy R. (Ed.) Thermotropic Liquid Crystals recent
advances. Springer, 2007, 1-54.
194. Reddy, R. A.; Tschierske, C. Bent-core liquid crystals: polar
order, superstructural chirality and spontaneous
desymmetrization in soft matter systems. J. Mater. Chem. 2006,
16 (10), 907-961.
195. Heppke, G.; Moro, D. Chiral order from achiral molecules.
Science 1998, 279 (5358), 1872-1873.
196. Sekine, T.; Niori, T.; Sone, M.; Watanabe, J.; Choi, S-W.;
Takanishi, Y.; Takezoe, H. Origin of helix in achiral banana-
shaped molecular systems. Jpn J. Appl. Phys., Part 1. 1997, 36
(10), 6455-6463.

172 Bibliography

8. PUBLISHED PAPER