unit 2 cells and tissues diagrams. © 2012 pearson education, inc. figure 3.2 extracellular fluid...
TRANSCRIPT
Unit 2 Cells and Tissues
Diagrams
© 2012 Pearson Education, Inc. Figure 3.2
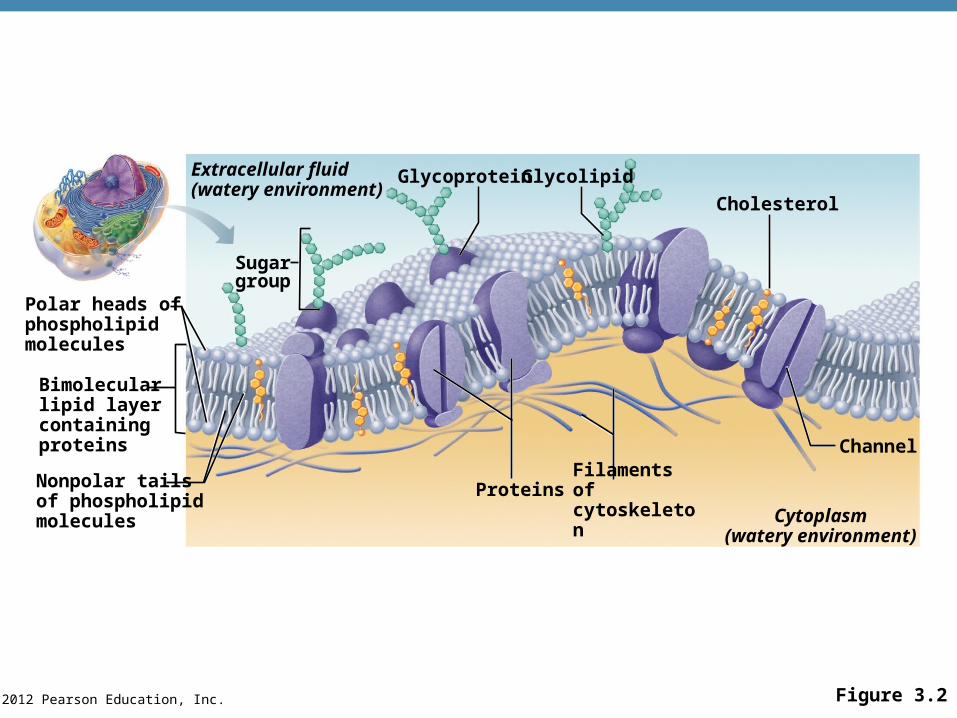
Extracellular fluid(watery environment)
Sugargroup
Polar heads ofphospholipidmolecules
Bimolecularlipid layer containingproteins
Nonpolar tailsof phospholipidmolecules
Glycoprotein
Proteins Filaments ofcytoskeleton Cytoplasm
(watery environment)
Channel
Cholesterol
Glycolipid
© 2012 Pearson Education, Inc.
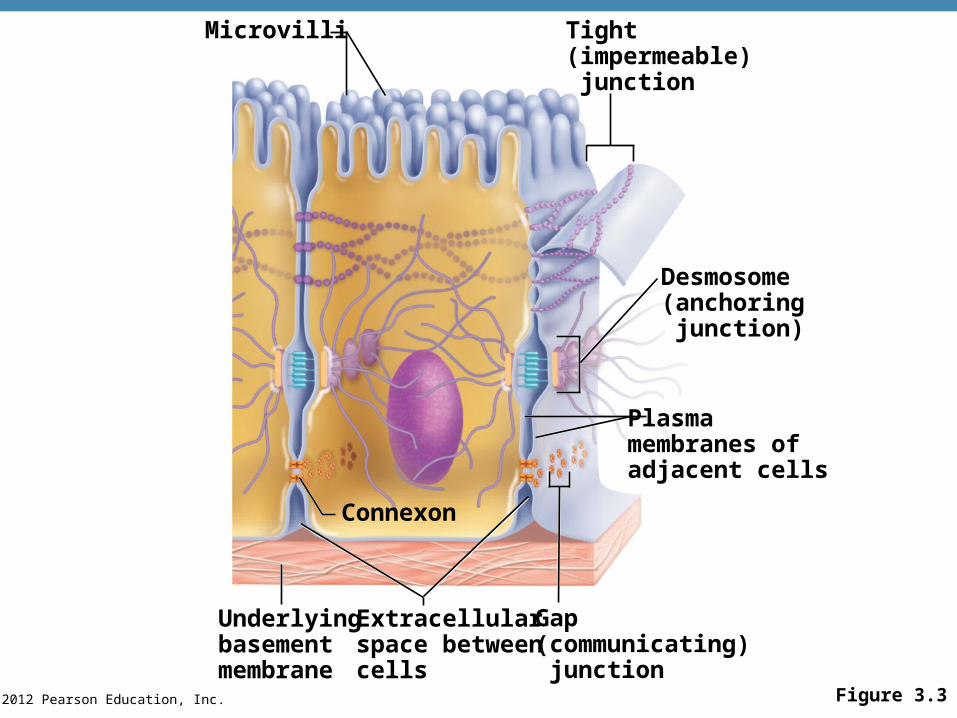
Plasmamembranes ofadjacent cells
Desmosome(anchoring junction)
Tight(impermeable) junction
Microvilli
Gap(communicating) junction
Extracellularspace betweencells
Underlyingbasementmembrane
Connexon
Figure 3.3
© 2012 Pearson Education, Inc.
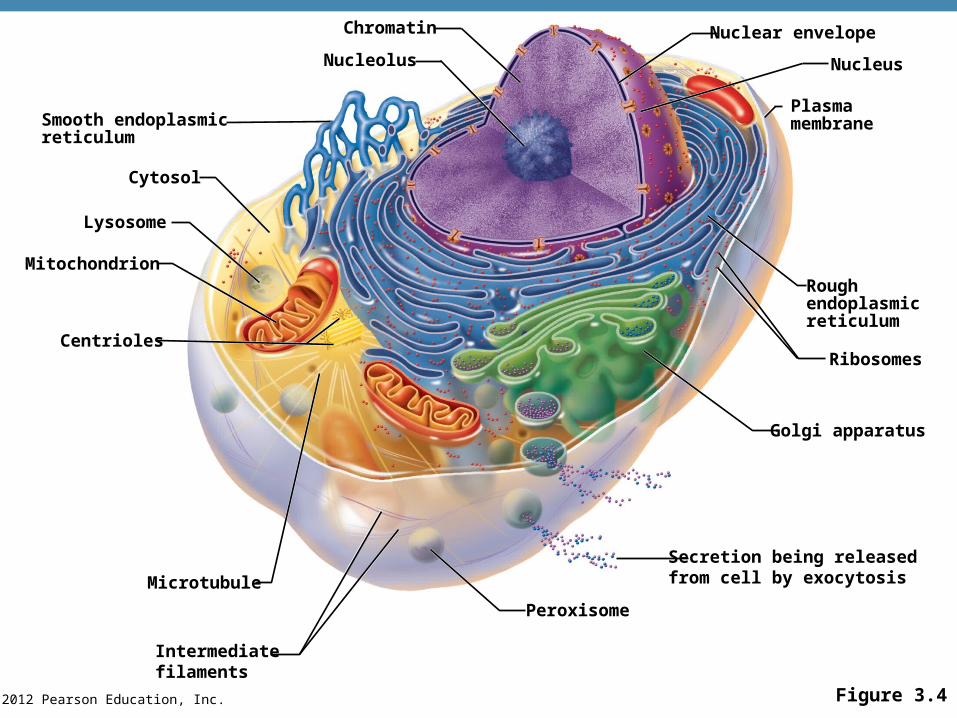
Ribosomes
Golgi apparatus
Secretion being releasedfrom cell by exocytosisMicrotubule
Centrioles
Mitochondrion
Lysosome
Cytosol
Smooth endoplasmicreticulum
Chromatin
Nucleolus
Nuclear envelope
Nucleus
Plasmamembrane
Roughendoplasmicreticulum
Intermediatefilaments
Peroxisome
Figure 3.4

© 2012 Pearson Education, Inc. Figure 3.5
In the cistern, the protein folds into itsfunctional shape. Short sugar chainsmay be attached to the protein (forminga glycoprotein).
The protein is packaged in a tinymembranous sac called a transportvesicle.
The transport vesicle buds from therough ER and travels to the Golgiapparatus for further processing.
As the protein is synthesized on theribosome, it migrates into the rough ERcistern.
32
1
Ribosome mRNA
Rough ER
Transportvesicle buds off
Protein insidetransport vesicle
Protein
4
3
2
1
4
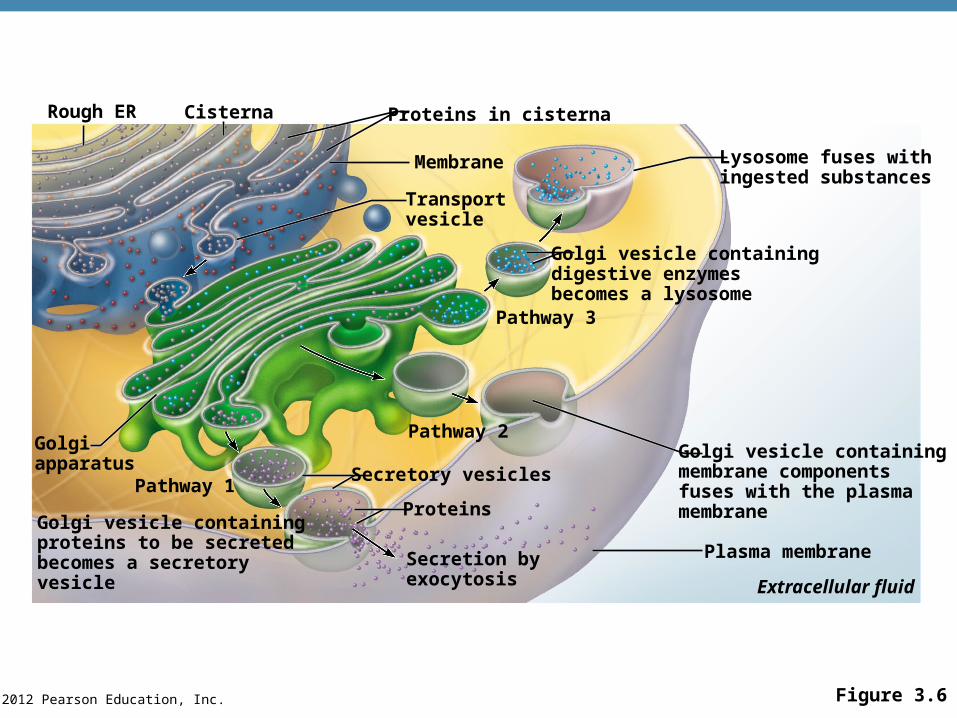
© 2012 Pearson Education, Inc. Figure 3.6
Golgi vesicle containingdigestive enzymesbecomes a lysosome
Pathway 3
Pathway 2
Secretory vesicles
Proteins
Secretion byexocytosis
Golgi vesicle containingproteins to be secretedbecomes a secretoryvesicle
Golgiapparatus
Pathway 1
Transportvesicle
Membrane
Proteins in cisternaCisternaRough ER
Lysosome fuses withingested substances
Golgi vesicle containingmembrane componentsfuses with the plasmamembrane
Plasma membrane
Extracellular fluid
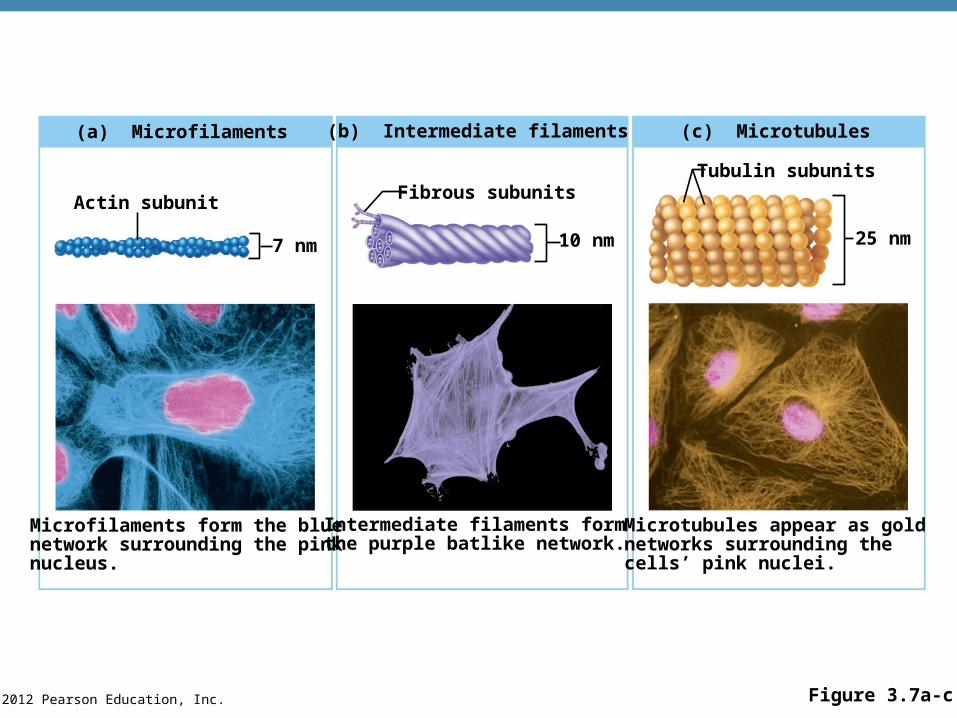
© 2012 Pearson Education, Inc. Figure 3.7a-c
(a) Microfilaments (b) Intermediate filaments (c) Microtubules
Actin subunit
7 nm 10 nm
Fibrous subunitsTubulin subunits
25 nm
Microfilaments form the bluenetwork surrounding the pinknucleus.
Intermediate filaments formthe purple batlike network.
Microtubules appear as goldnetworks surrounding thecells’ pink nuclei.
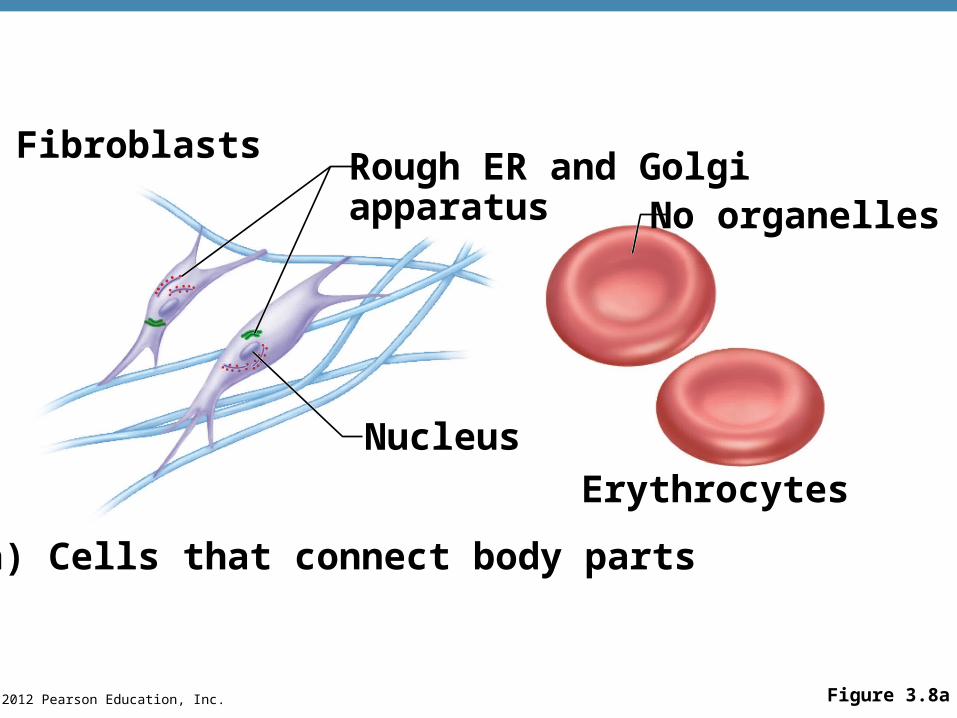
© 2012 Pearson Education, Inc. Figure 3.8a
FibroblastsRough ER and Golgiapparatus No organelles
Nucleus
Erythrocytes
(a) Cells that connect body parts
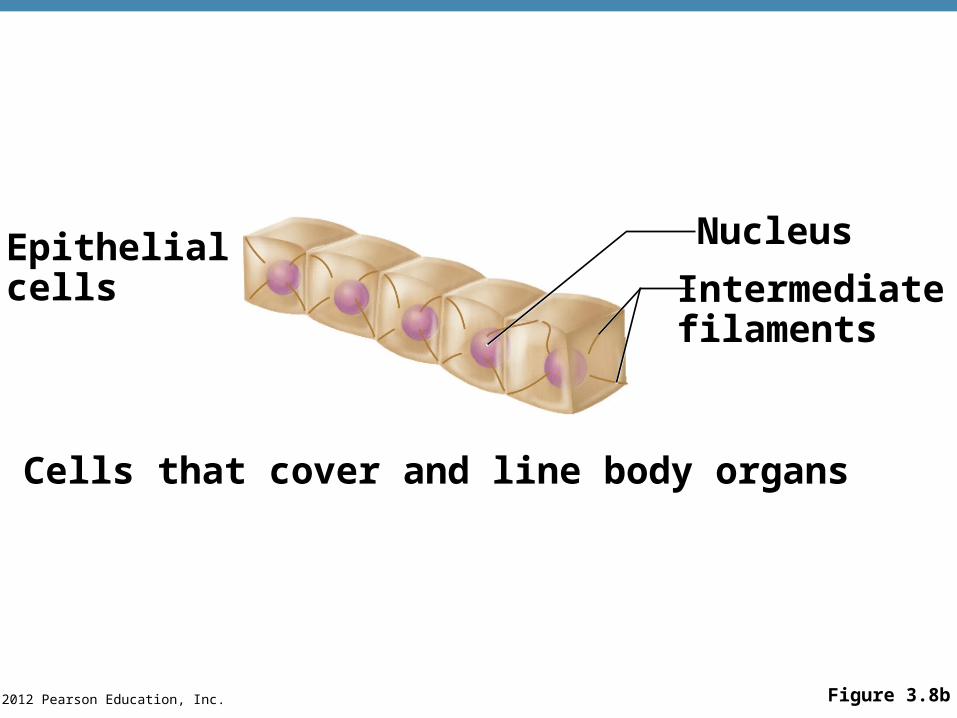
© 2012 Pearson Education, Inc. Figure 3.8b
Epithelialcells
Nucleus
Intermediatefilaments
(b) Cells that cover and line body organs

© 2012 Pearson Education, Inc. Figure 3.8c
Skeletalmuscle cell
Nuclei
Contractilefilaments
Smoothmuscle cells
(c) Cells that move organs and body parts
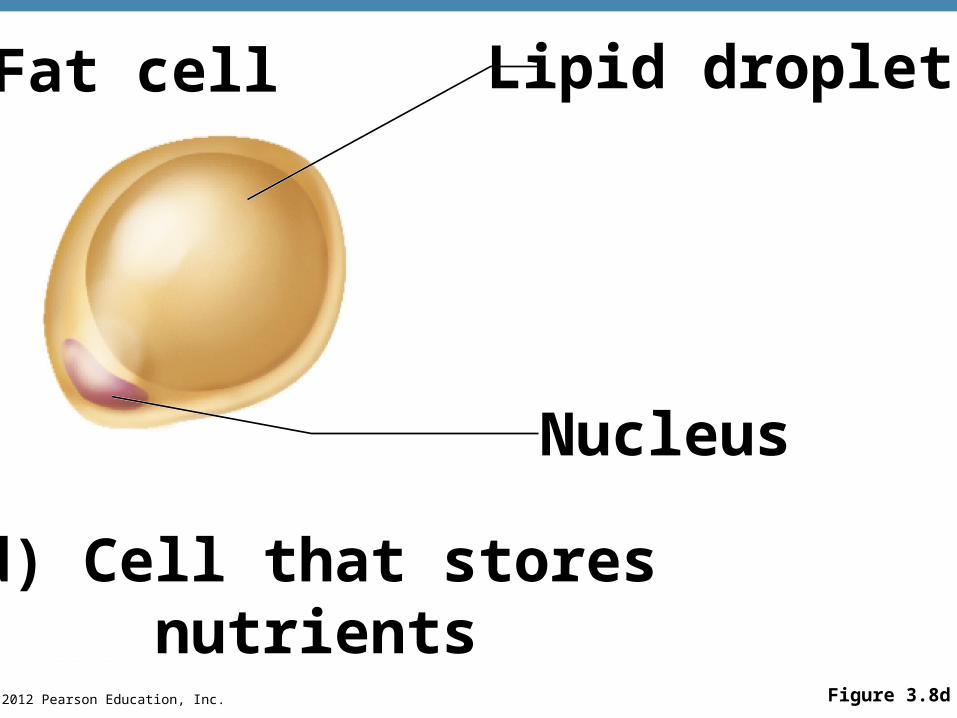
© 2012 Pearson Education, Inc. Figure 3.8d
Fat cell Lipid droplet
(d) Cell that stores nutrients
Nucleus
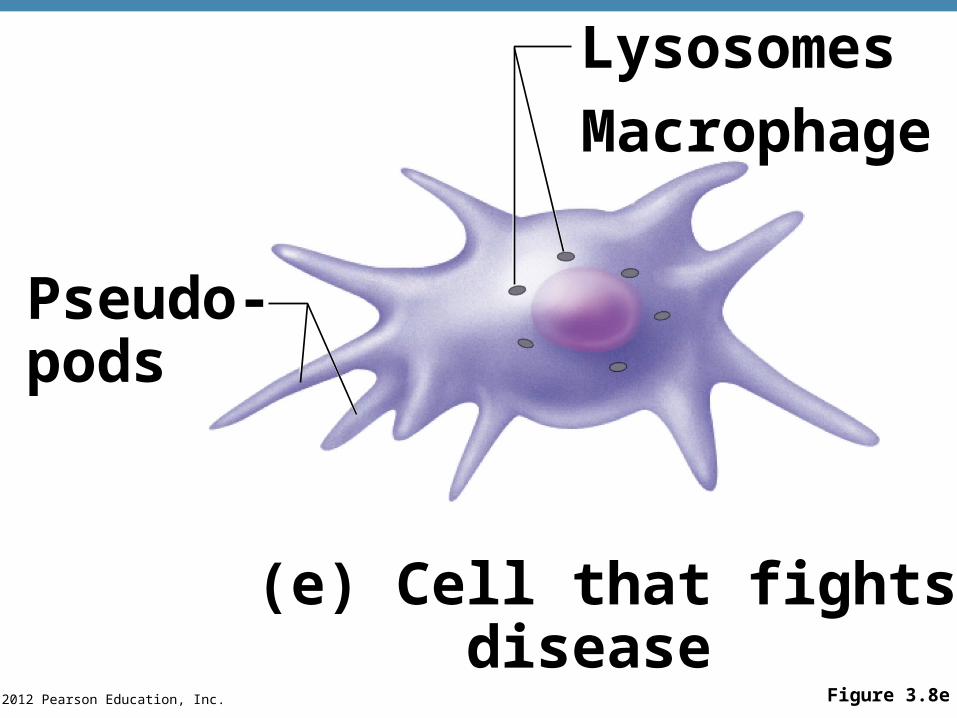
© 2012 Pearson Education, Inc.
Lysosomes
Macrophage
(e) Cell that fights disease
Pseudo-pods
Figure 3.8e
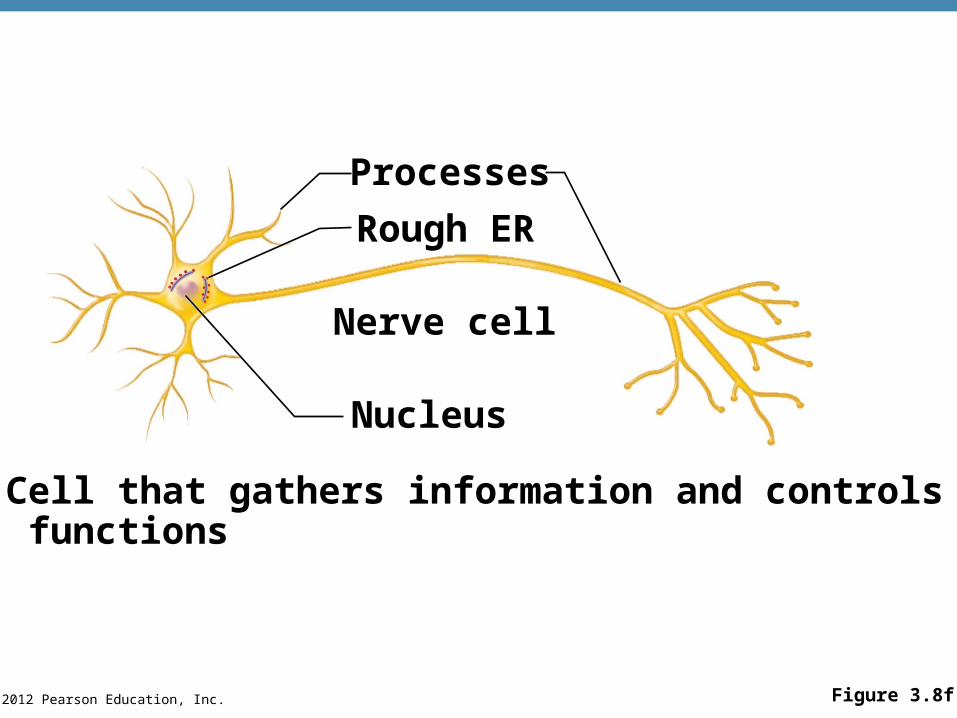
© 2012 Pearson Education, Inc. Figure 3.8f
Processes
Rough ER
Nerve cell
Nucleus
(f) Cell that gathers information and controls body functions
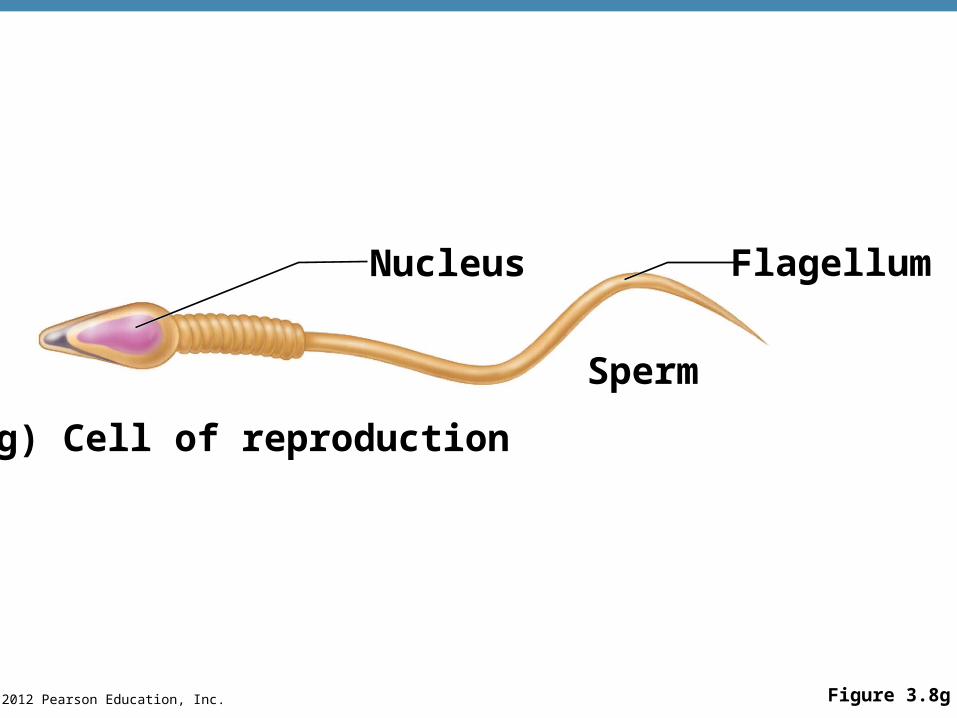
© 2012 Pearson Education, Inc. Figure 3.8g
Nucleus Flagellum
Sperm
(g) Cell of reproduction
© 2012 Pearson Education, Inc.
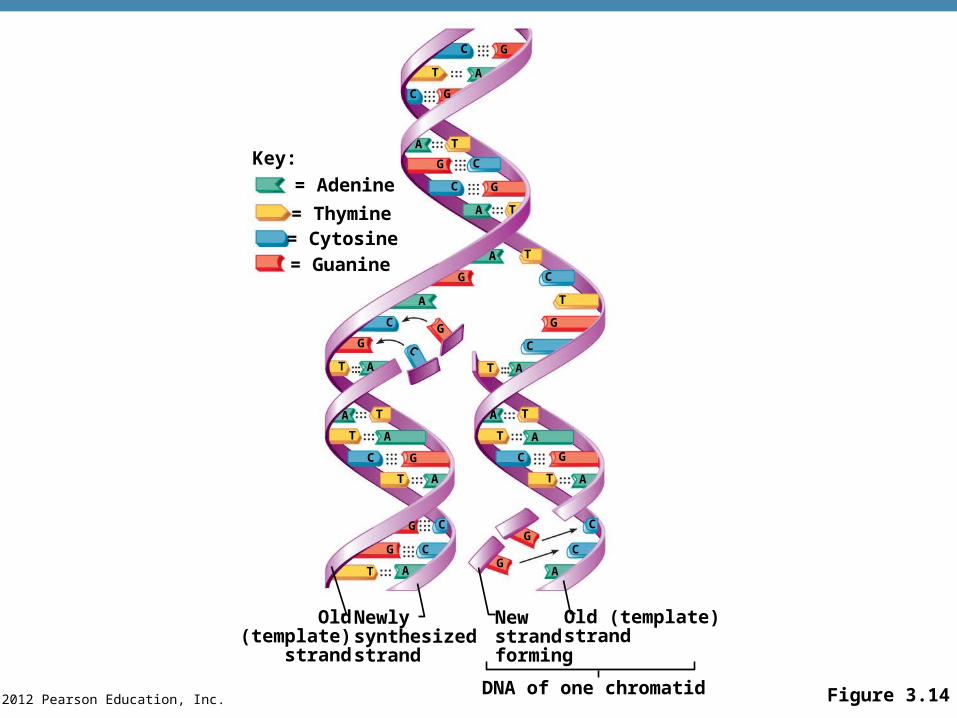
Key:
= Adenine
= Thymine= Cytosine= Guanine
Old(template)
strand
Newlysynthesizedstrand
Newstrandforming
Old (template)strand
DNA of one chromatid
C G
T A
A
C G
T
G C
GC
A T
A T
G C
A
G
T
A
C
C
G
CG
TT A
A
A
T
T
C G
T A
A
A
T
T
C G
T A
T A
G C
G CG
C
GC
A
Figure 3.14

© 2012 Pearson Education, Inc.
Centrioles Chromatin
Formingmitoticspindle
Centrioles
Chromosome,consisting of twosister chromatids
Nuclearenvelope
Plasmamembrane
Interphase
Metaphaseplate
Nucleolus
Early prophase
Fragments ofnuclear envelope
Late prophase
Nucleolusforming
Spindlepole
Cleavagefurrow
Nuclearenvelopeforming
Telophase and cytokinesis
Daughterchromosomes
Anaphase
Sisterchromatids
Spindle
Metaphase
Spindlemicrotubules
Centromere
Centromere
Figure 3.15
© 2012 Pearson Education, Inc.
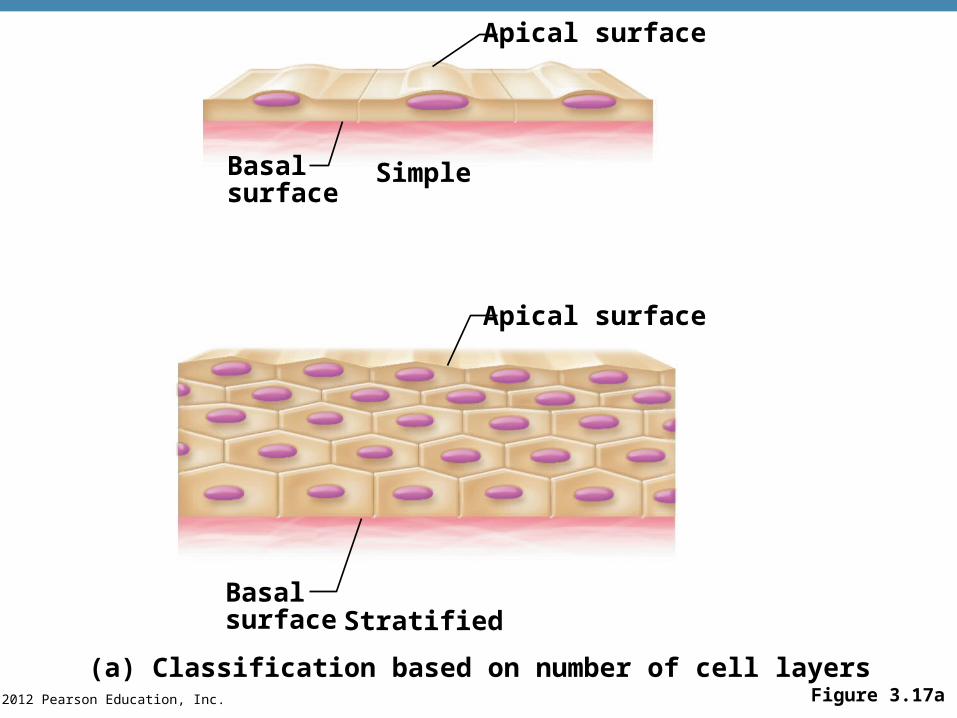
Apical surface
Basalsurface
Simple
Apical surface
Basalsurface Stratified
(a) Classification based on number of cell layersFigure 3.17a
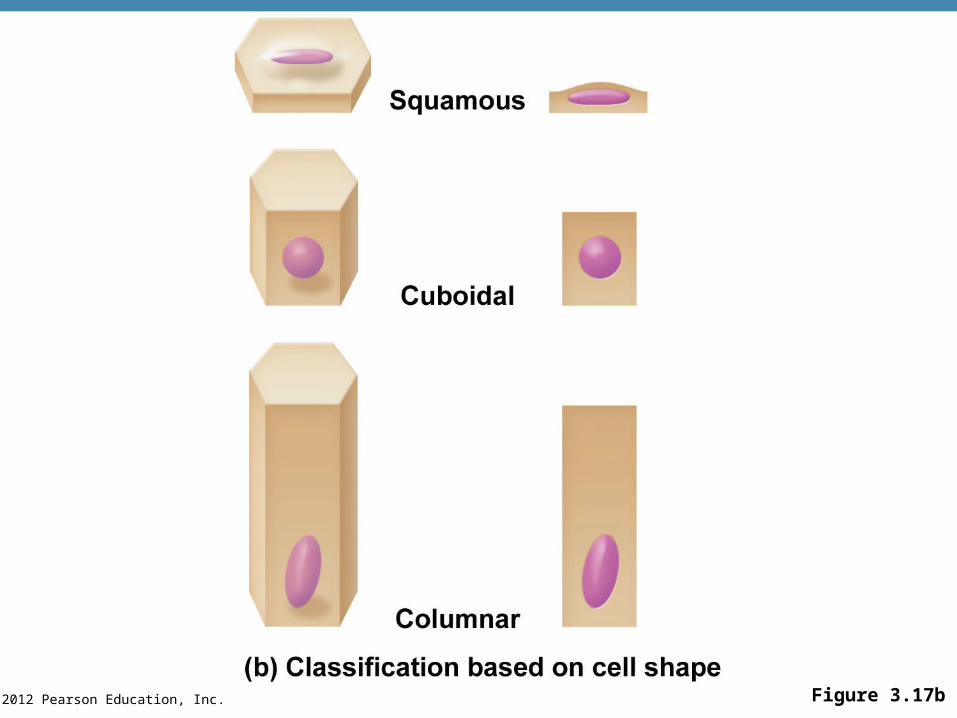
© 2012 Pearson Education, Inc. Figure 3.17b
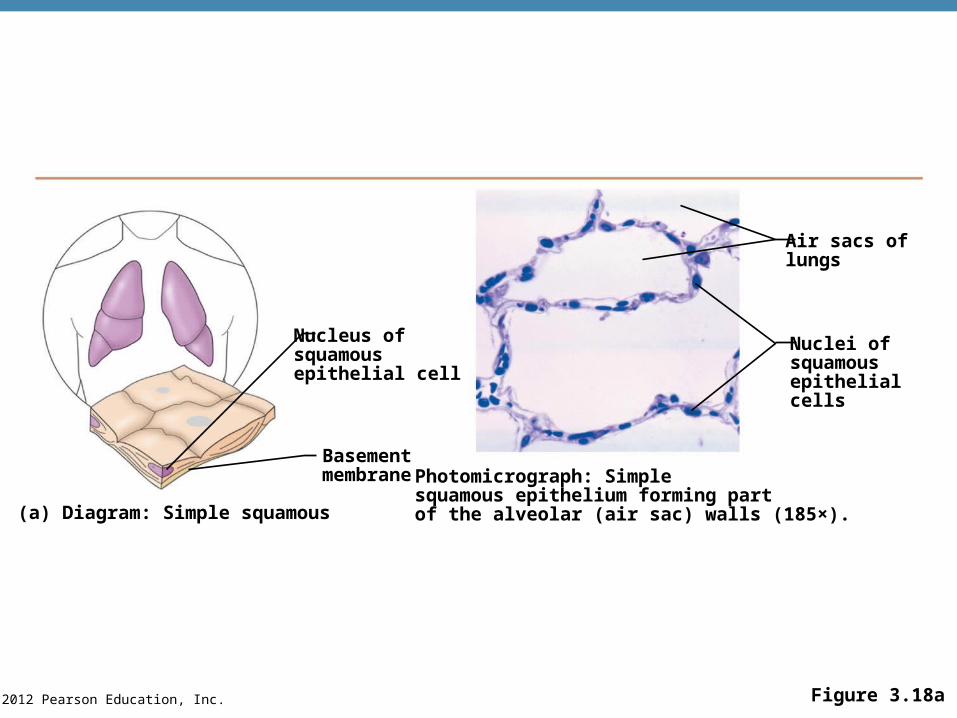
© 2012 Pearson Education, Inc. Figure 3.18a
Nucleus ofsquamousepithelial cell
Basementmembrane
(a) Diagram: Simple squamous
Photomicrograph: Simplesquamous epithelium forming partof the alveolar (air sac) walls (185×).
Nuclei ofsquamousepithelialcells
Air sacs oflungs

© 2012 Pearson Education, Inc. Figure 3.18b
(b) Diagram: Simple cuboidal
Nucleus ofsimplecuboidalepithelialcell
Photomicrograph: Simple cuboidalepithelium in kidney tubules (250×).
Basementmembrane
Connectivetissue
Basementmembrane
Simplecuboidalepithelialcells
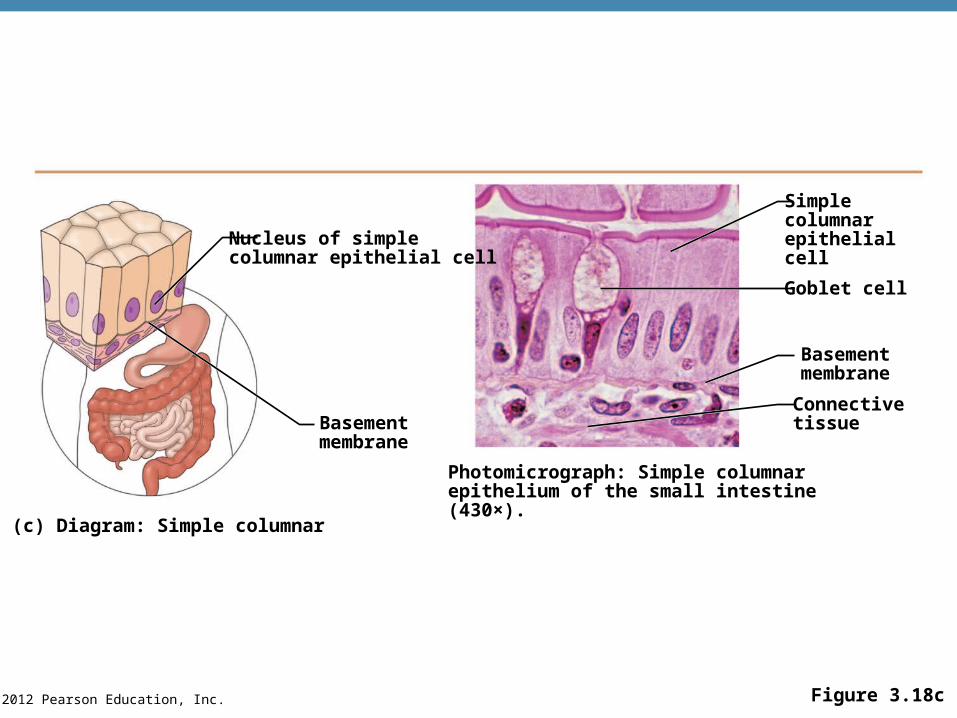
© 2012 Pearson Education, Inc. Figure 3.18c
Nucleus of simplecolumnar epithelial cell
Connectivetissue
Photomicrograph: Simple columnarepithelium of the small intestine(430×).
Basementmembrane
(c) Diagram: Simple columnar
Basementmembrane
Goblet cell
Simplecolumnarepithelialcell
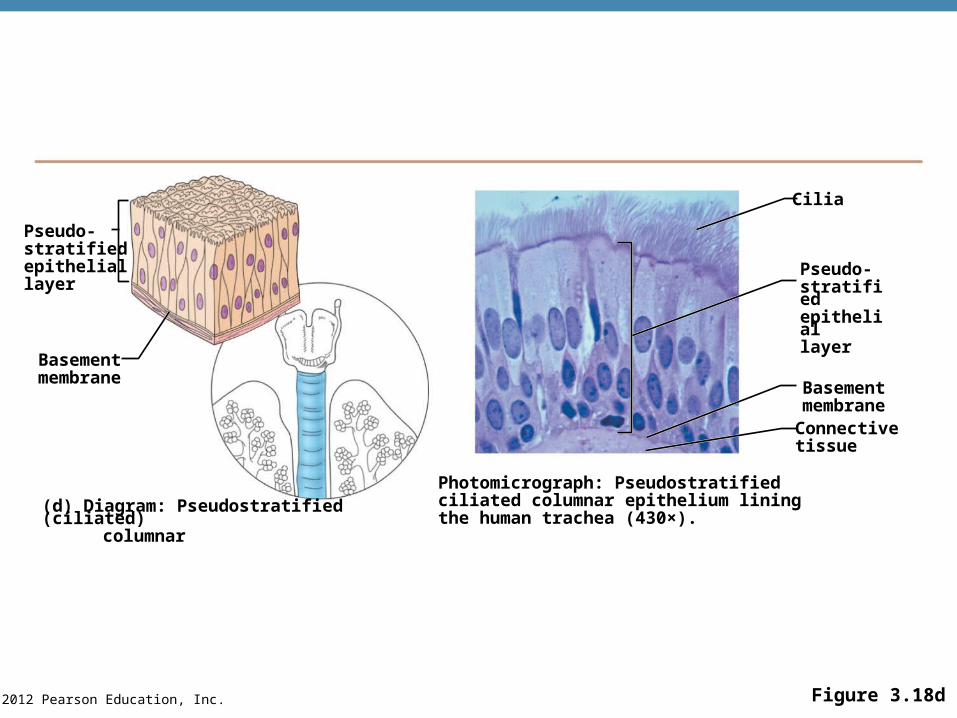
© 2012 Pearson Education, Inc. Figure 3.18d
Pseudo-stratifiedepitheliallayer
Basementmembrane
(d) Diagram: Pseudostratified (ciliated) columnar
Photomicrograph: Pseudostratifiedciliated columnar epithelium liningthe human trachea (430×).
Pseudo-stratifiedepitheliallayer
BasementmembraneConnectivetissue
Cilia
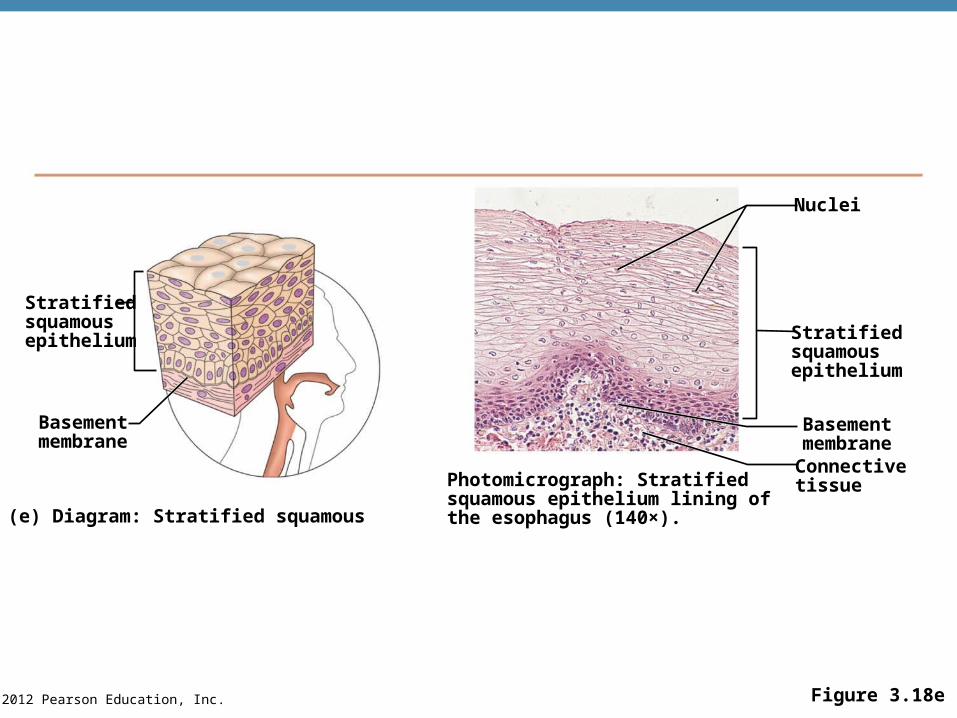
© 2012 Pearson Education, Inc. Figure 3.18e
Stratifiedsquamousepithelium
Basementmembrane
(e) Diagram: Stratified squamous
Photomicrograph: Stratifiedsquamous epithelium lining ofthe esophagus (140×).
Connectivetissue
Stratifiedsquamousepithelium
Nuclei
Basementmembrane
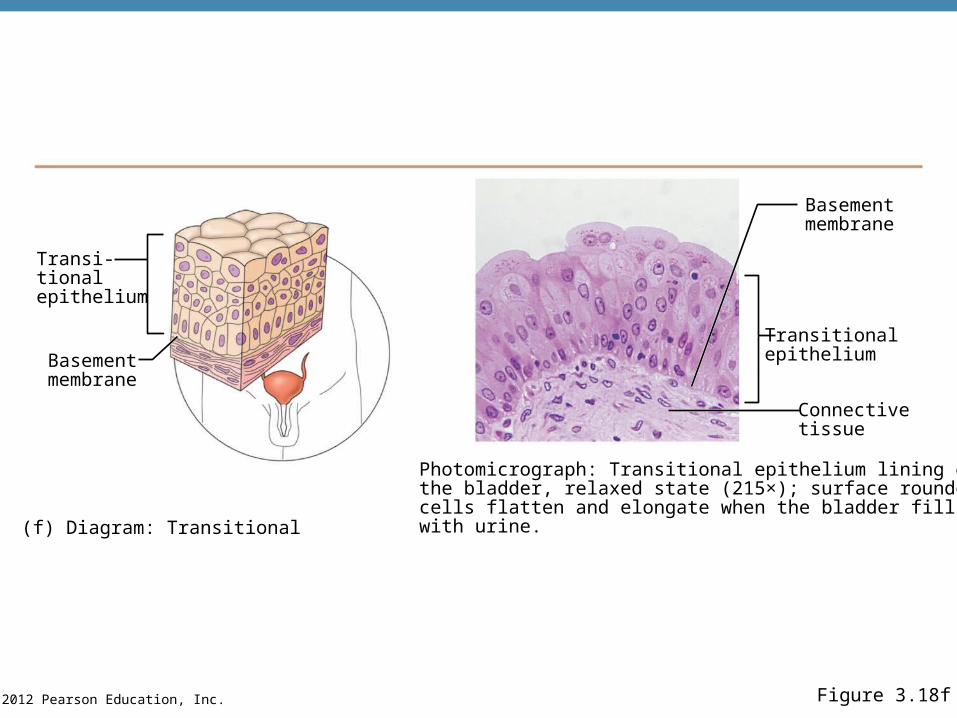
© 2012 Pearson Education, Inc. Figure 3.18f
Transi-tionalepithelium
Basementmembrane
Photomicrograph: Transitional epithelium lining ofthe bladder, relaxed state (215×); surface roundedcells flatten and elongate when the bladder fillswith urine.(f) Diagram: Transitional
Connectivetissue
Transitionalepithelium
Basementmembrane
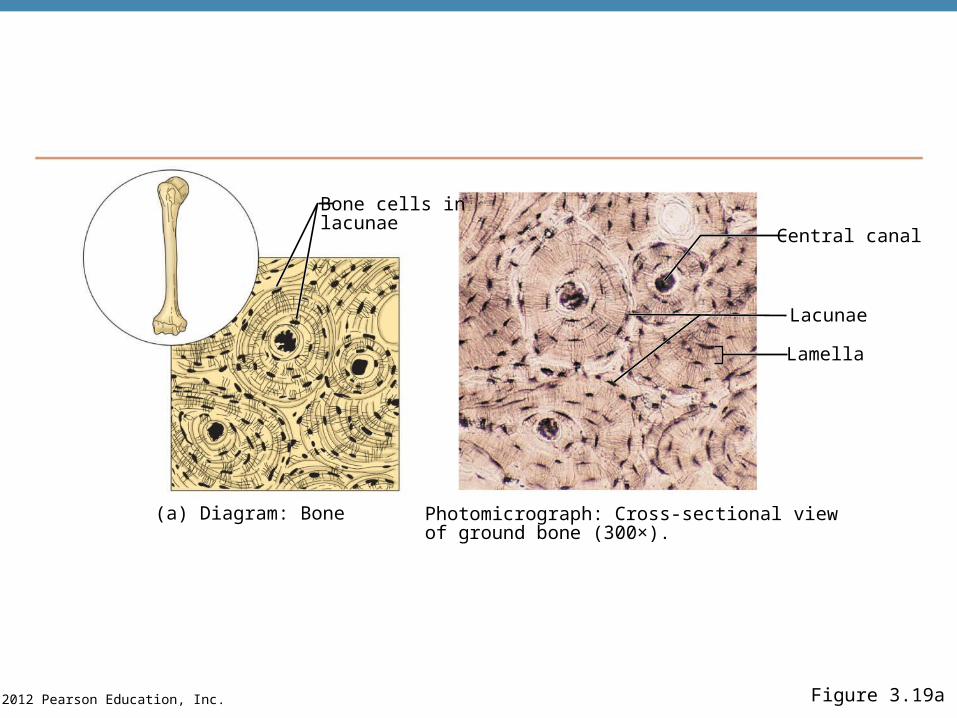
© 2012 Pearson Education, Inc. Figure 3.19a
Bone cells inlacunae
(a) Diagram: Bone Photomicrograph: Cross-sectional viewof ground bone (300×).
Lamella
Lacunae
Central canal
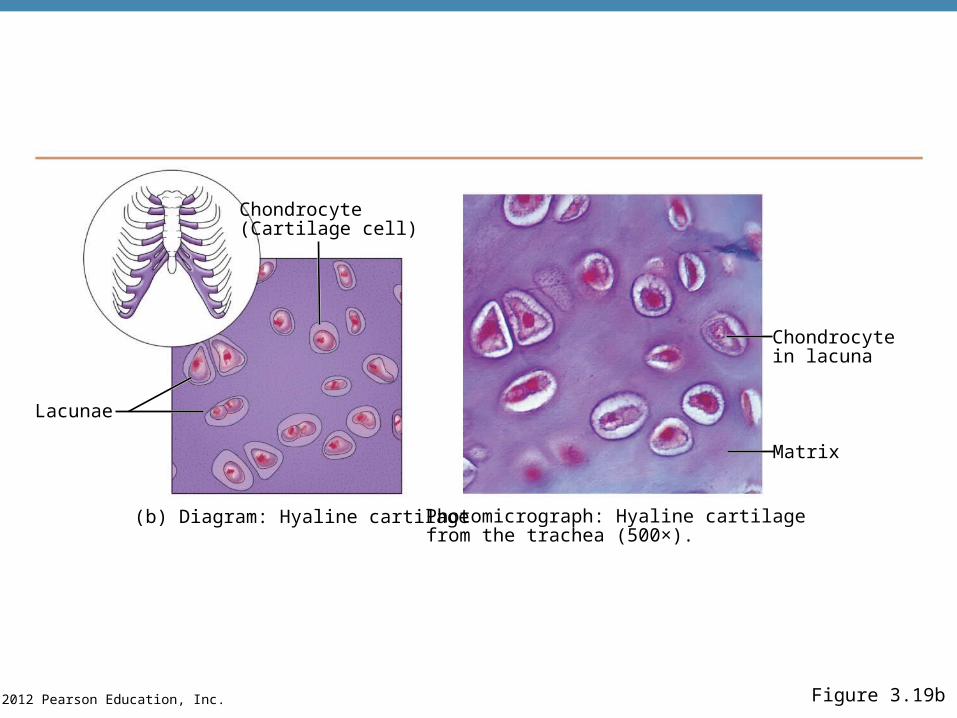
© 2012 Pearson Education, Inc. Figure 3.19b
Chondrocyte(Cartilage cell)
Lacunae
(b) Diagram: Hyaline cartilage Photomicrograph: Hyaline cartilagefrom the trachea (500×).
Matrix
Chondrocytein lacuna
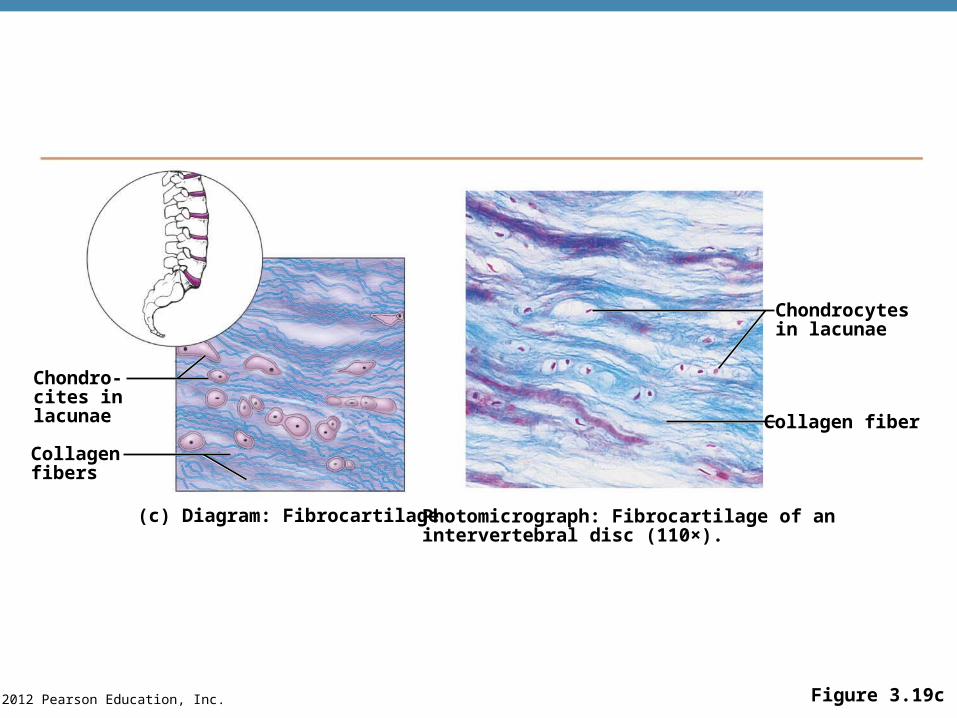
© 2012 Pearson Education, Inc. Figure 3.19c
Chondro-cites inlacunae
Collagenfibers
(c) Diagram: Fibrocartilage Photomicrograph: Fibrocartilage of anintervertebral disc (110×).
Collagen fiber
Chondrocytesin lacunae
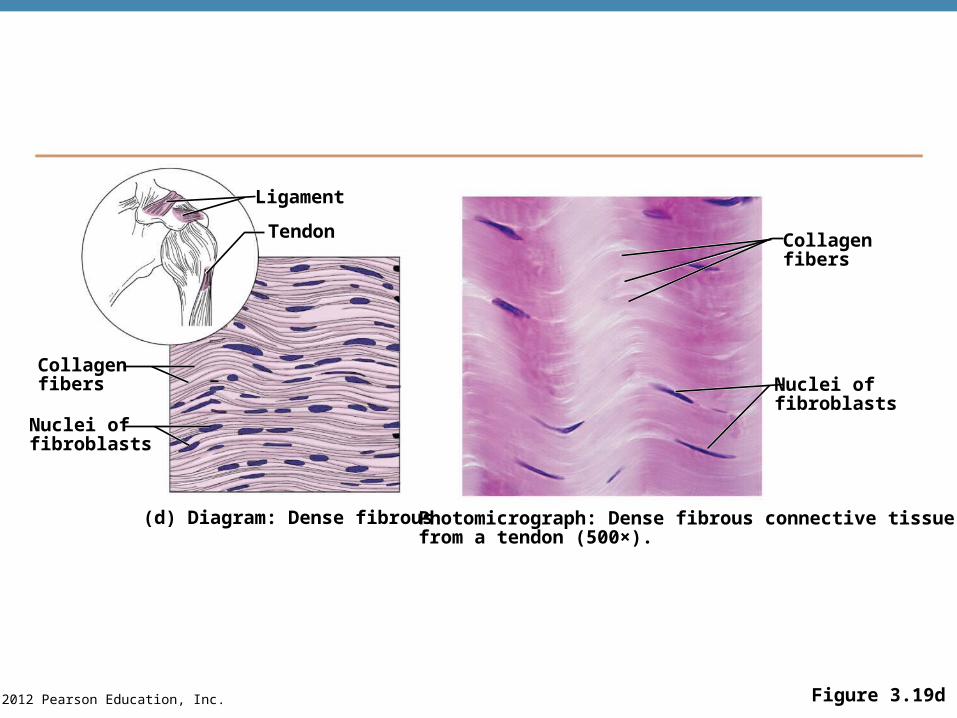
© 2012 Pearson Education, Inc. Figure 3.19d
Ligament
Tendon
Collagenfibers
Nuclei offibroblasts
(d) Diagram: Dense fibrous Photomicrograph: Dense fibrous connective tissuefrom a tendon (500×).
Nuclei offibroblasts
Collagenfibers

© 2012 Pearson Education, Inc. Figure 3.19e
Mucosaepithelium
Laminapropria
Fibers ofmatrix
Nuclei offibroblasts
(e) Diagram: Areolar Photomicrograph: Areolar connective tissue, asoft packaging tissue of the body (300×).
Fibroblastnuclei
Collagenfibers
Elasticfibers
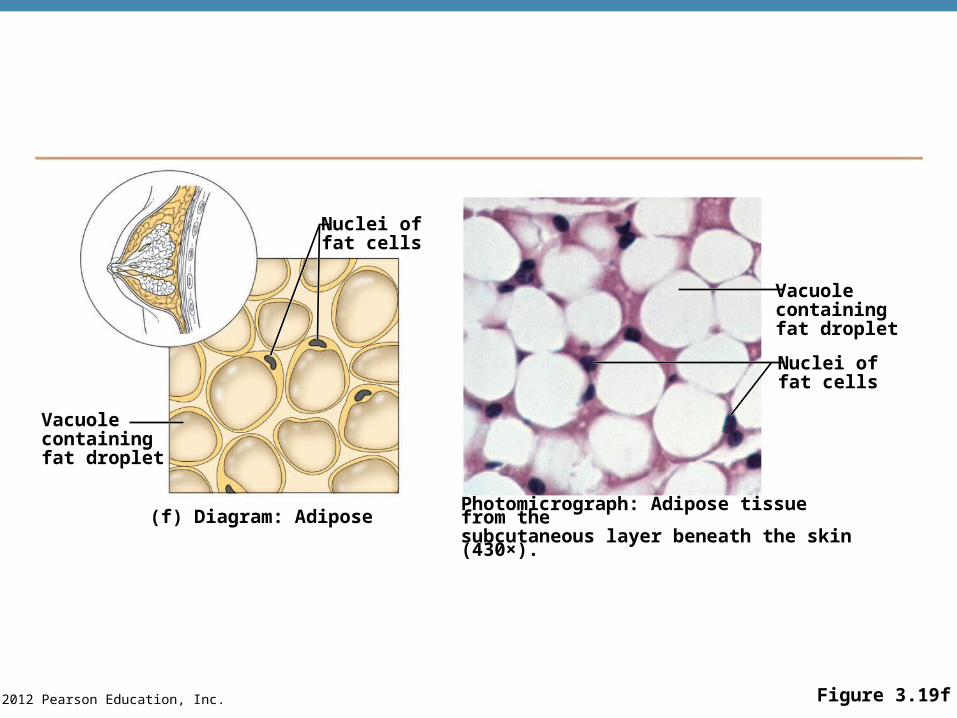
© 2012 Pearson Education, Inc. Figure 3.19f
Nuclei offat cells
Vacuolecontainingfat droplet
(f) Diagram: Adipose Photomicrograph: Adipose tissue from thesubcutaneous layer beneath the skin (430×).
Vacuolecontainingfat droplet
Nuclei offat cells
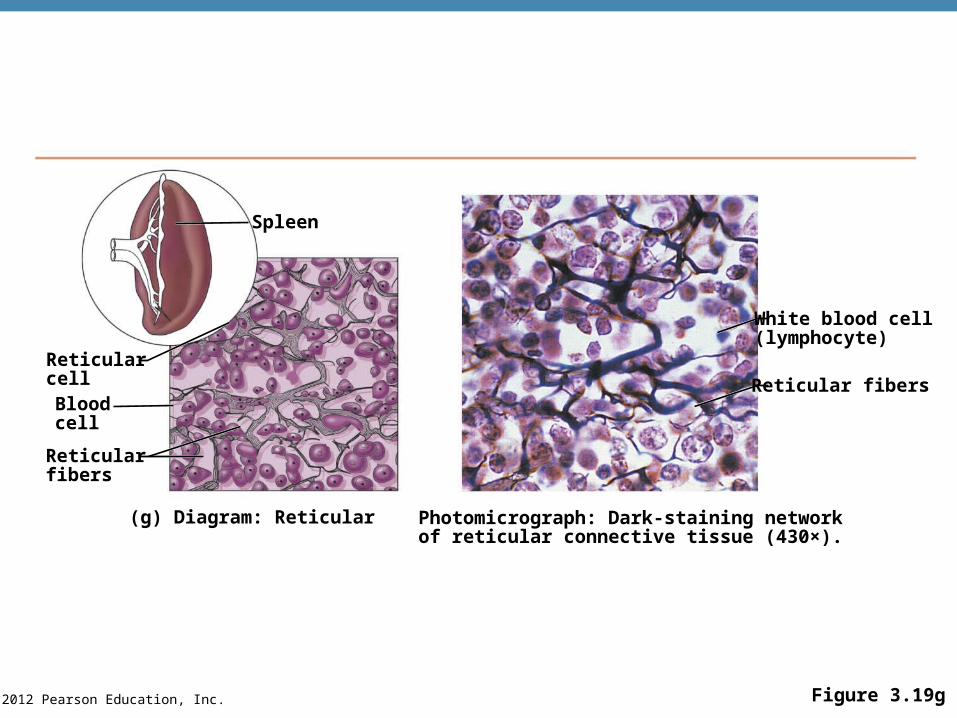
© 2012 Pearson Education, Inc. Figure 3.19g
Spleen
Reticularcell
Reticularfibers
Bloodcell
(g) Diagram: Reticular Photomicrograph: Dark-staining networkof reticular connective tissue (430×).
White blood cell(lymphocyte)
Reticular fibers
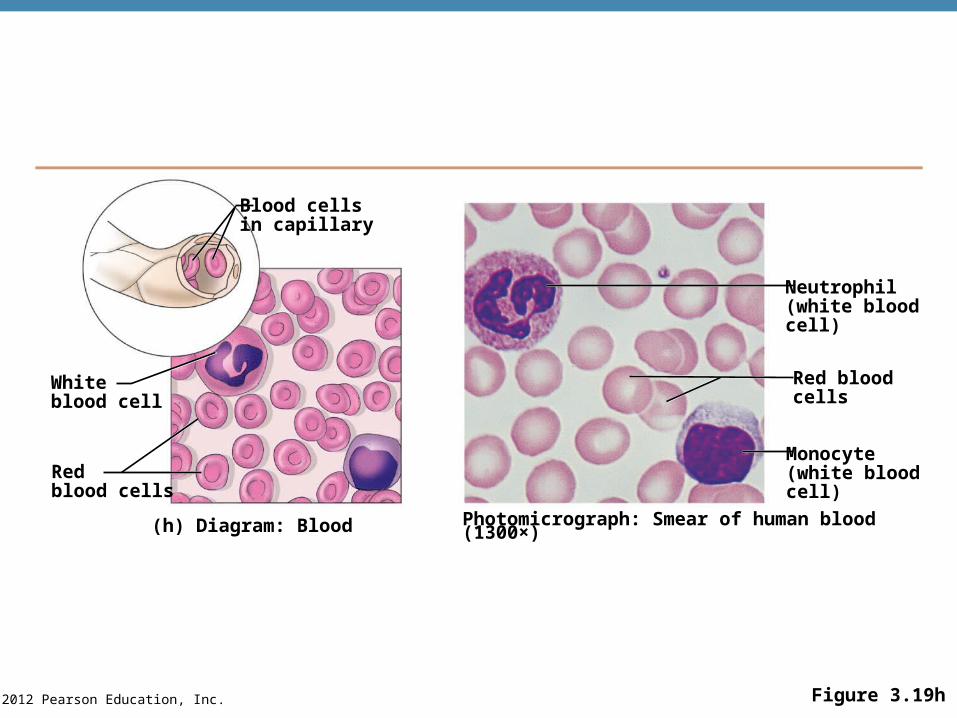
© 2012 Pearson Education, Inc. Figure 3.19h
Neutrophil(white bloodcell)
Red bloodcells
Monocyte(white bloodcell)
Photomicrograph: Smear of human blood (1300×)(h) Diagram: Blood
Whiteblood cell
Redblood cells
Blood cellsin capillary
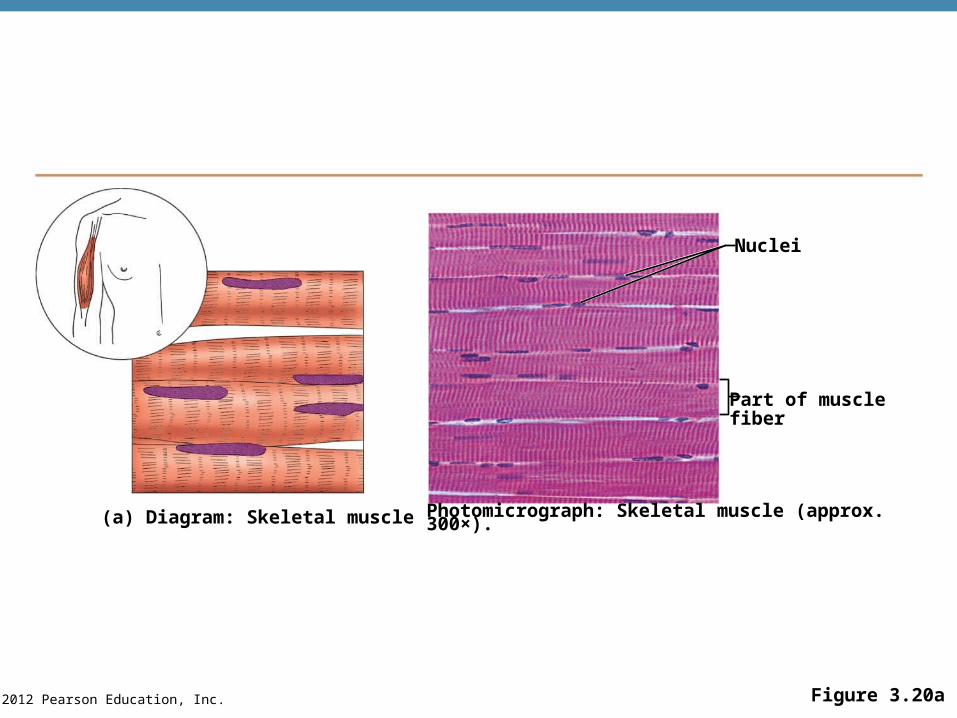
© 2012 Pearson Education, Inc. Figure 3.20a
Nuclei
Part of musclefiber
(a) Diagram: Skeletal muscle Photomicrograph: Skeletal muscle (approx. 300×).
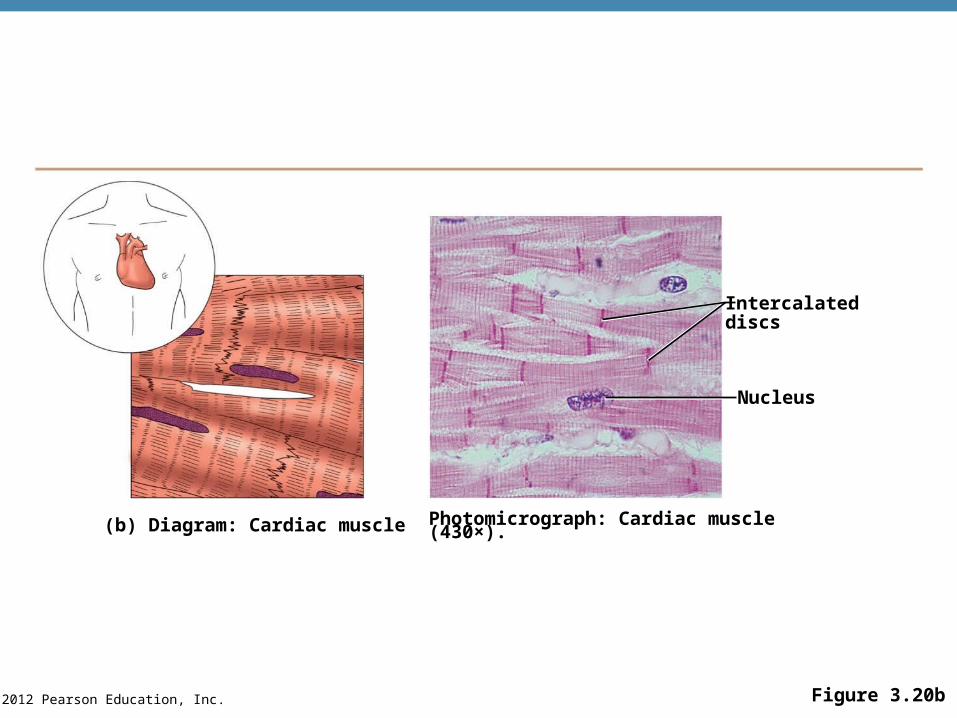
© 2012 Pearson Education, Inc. Figure 3.20b
Intercalateddiscs
Nucleus
(b) Diagram: Cardiac muscle Photomicrograph: Cardiac muscle (430×).
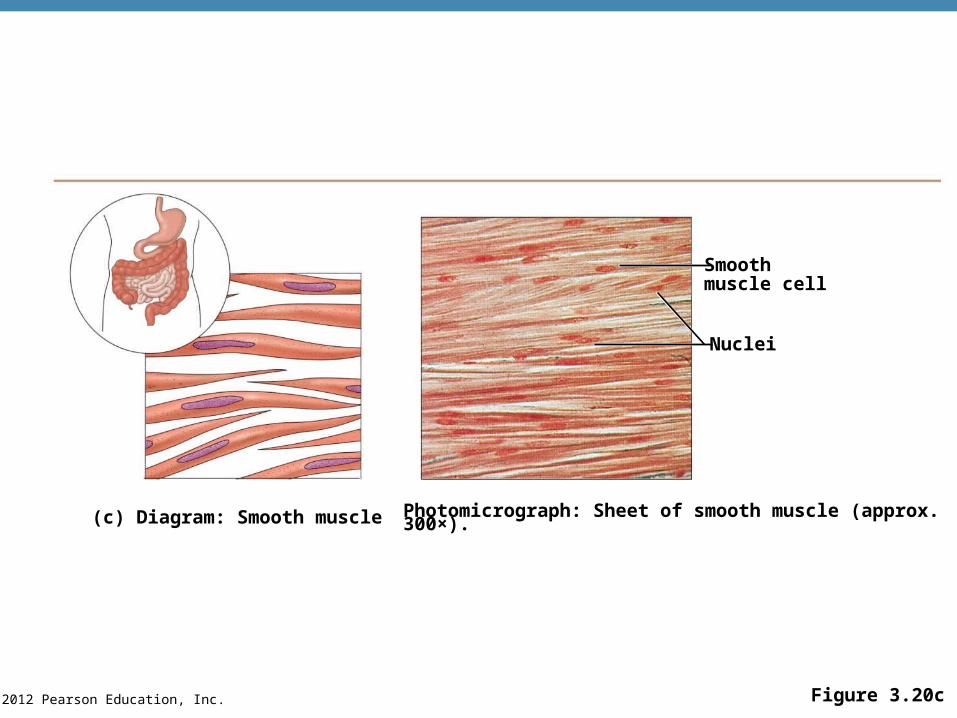
© 2012 Pearson Education, Inc. Figure 3.20c
Smoothmuscle cell
Nuclei
(c) Diagram: Smooth muscle Photomicrograph: Sheet of smooth muscle (approx. 300×).
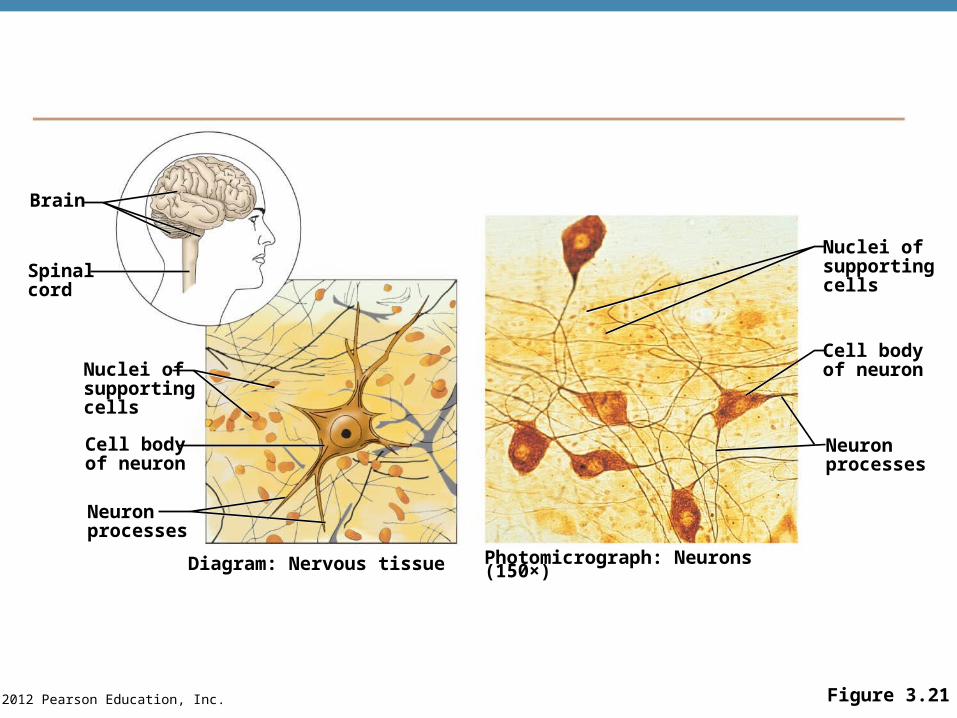
© 2012 Pearson Education, Inc. Figure 3.21
Brain
Spinalcord
Nuclei ofsupportingcells
Cell bodyof neuron
Neuronprocesses
Diagram: Nervous tissue Photomicrograph: Neurons (150×)
Nuclei ofsupportingcells
Cell bodyof neuron
Neuronprocesses
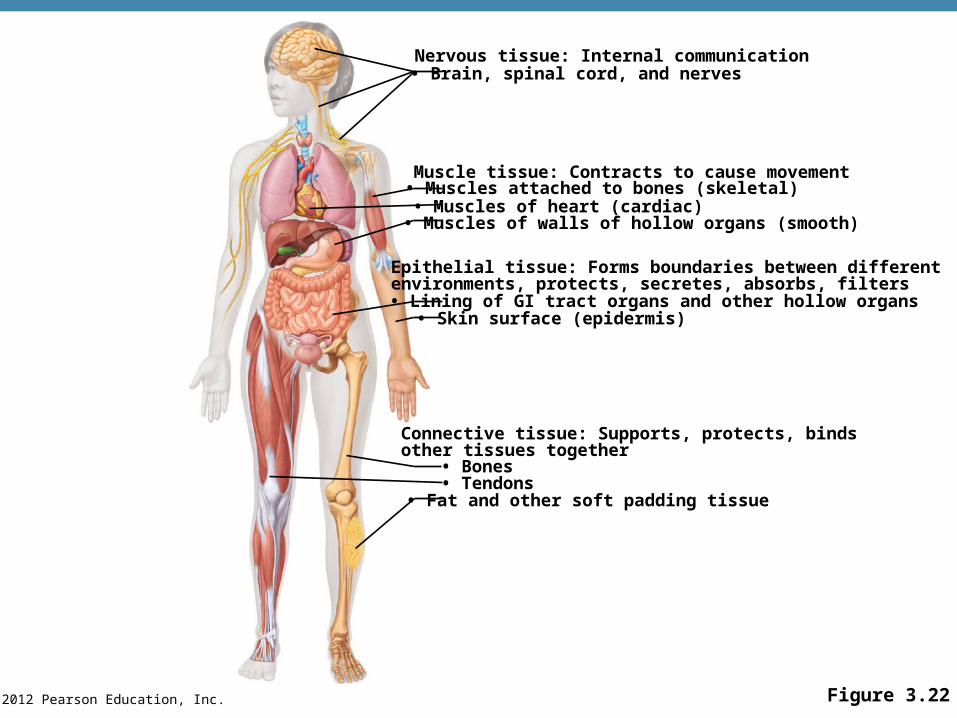
© 2012 Pearson Education, Inc.
• Brain, spinal cord, and nervesNervous tissue: Internal communication
Muscle tissue: Contracts to cause movement• Muscles attached to bones (skeletal)• Muscles of heart (cardiac)• Muscles of walls of hollow organs (smooth)
Epithelial tissue: Forms boundaries between differentenvironments, protects, secretes, absorbs, filters• Lining of GI tract organs and other hollow organs• Skin surface (epidermis)
Connective tissue: Supports, protects, bindsother tissues together• Bones• Tendons• Fat and other soft padding tissue
Figure 3.22