triaxial consolidated undrained (cu) test - sofistik.de · triaxial consolidated undrained (cu)...
TRANSCRIPT

Benchmark Example No. 48
Triaxial Consolidated Undrained (CU) Test
SOFiSTiK | 2018
VERiFiCATiON MANUALBE48: Triaxial Consolidated Undrained (CU) Test
VERiFiCATiON MANUAL, Version 2018-8Software Version: SOFiSTiK 2018
Copyright © 2019 by SOFiSTiK AG, Oberschleissheim, Germany.
SOFiSTiK AG
HQ Oberschleissheim Office NurembergBruckmannring 38 Burgschmietstr. 40
85764 Oberschleissheim 90419 NurembergGermany Germany
T +49 (0)89 315878-0 T +49 (0)911 39901-0
F +49 (0)89 315878-23 F +49(0)911 397904
www.sofistik.com
This manual is protected by copyright laws. No part of it may be translated, copied or reproduced, in any form or by any means,without written permission from SOFiSTiK AG. SOFiSTiK reserves the right to modify or to release new editions of this manual.
The manual and the program have been thoroughly checked for errors. However, SOFiSTiK does not claim that either one iscompletely error free. Errors and omissions are corrected as soon as they are detected.
The user of the program is solely responsible for the applications. We strongly encourage the user to test the correctness of allcalculations at least by random sampling.
Front Cover
Project: New SOFiSTiK Office, Nuremberg | Contractor: WOLFF & MLLER, Stuttgart | Architecture: WABE-PLAN ARCHITEKTUR, Stuttgart |Structural Engineer: Boll und Partner. Beratende Ingenieure VBI, Stuttgart | MEP: GM Planen + Beraten, Griesheim | Lead Architect: Gerhard P.
Wirth gpwirtharchitekten, Nuremberg | Vizualisation: Armin Dariz, BiMOTiON GmbH

Triaxial Consolidated Undrained (CU) Test
Overview
Element Type(s): CAXI
Analysis Type(s): MNL
Procedure(s): LSTP
Topic(s): SOIL
Module(s): TALPA
Input file(s): triaxial cu test.dat, triaxial cu test 200.dat
1 Problem Description
In this example a consolidated undrained (CU) triaxial test on a loose Hostun-RF sand is simulated. Thespecimen is subjected to different levels of triaxial confining stresses and the results are compared tothose of the experimental tests and numerical simulations, as described in Wehnert [1].
D
Hσ3
σ1
Figure 1: Problem Description
2 Reference Solution
In this example two soil models are utilised, the Mohr-Coulomb (MC) and the Hardening Soil (HS) model.Further details on these two models can be found in Benchmarks 20 and 21.
The choice of the appropriate model for the soil is of a significant importance. For example, MC modelcan significantly overestimate the undrained shear strength for a normally consolidated soil. More ad-vanced models can provide better estimate for the undrained strength than the MC model. In partic-ular, the HS model is able to represent the change of the excess pore water pressure occurring un-der undrained shear loading conditions, providing more realistic effective stress paths and values forundrained shear strength. However, the results of the analysis with the Hardening Soil model are verysensitive to the used model parameters and the choice of the dilatancy model. Therefore, in this examplefor the HS model different dilatancy formulations are tested and their influence on the result examined.
A well-established stress dilatancy theory is described by Rowe [2], where the so-called mobilized dila-tancy angle ψm is defined as
sinψm =sinφm − sinφcs1 − sinφm sinφcs
(1)
SOFiSTiK 2018 | Benchmark No. 48 3

Triaxial Consolidated Undrained (CU) Test
Therein, the critical state friction angle φcs marks the transition between contractive (small stress ratioswith φm < φcs) and dilatant (higher stress ratios with φm > φcs) plastic flow. The mobilized frictionangle φm in Equation 1 is computed according to
sinφm =σ′1− σ′
3
2c · cotφ − σ′1 − σ′3
(2)
At failure, when φm ≡ φ, also the dilatancy angle reaches its final value ψm ≡ ψ. Accordingly, fromEquation 1 the critical state friction angle can be derived as
sinφcs =sinφ − sinψ
1 − sinφ sinψ(3)
It has been recognized that in some cases the Rowe’s model for dilatancy angles (Eq. 1) can overes-timate the contractive behavior of the soil at low mobilized friction angles, φm < φcs. As a remedy,several researchers have developed modified formulations based on the original Rowe’s model. Someof these models which are implemented in SOFiSTiK are described below.
One of the models which does not require additional input parameters is the model according to Soreide[3] which modifies the Rowe’s formulation by using the scaling factor sinφm/ sinφ
sinψm =sinφm − sinφcs1 − sinφm sinφcs
·sinφm
sinφ. (4)
Wehnert [1] proposed a model based on a lower cut-off value ψ0 for the modification of the Rowe’sformulation from Eq. 1 at low mobilized friction angles
sinψm =
sinψ0 ; 0 < ψm ≤ ψRoemsinφm − sinφcs1 − sinφm sinφcs
; ψRoem
< ψm ≤ ψ. (5)
This dilatancy model obviously requires a specification of an additional parameter, ψ0.
5 15 25 φ = 35
-20
-10
0
ψ = 10
20
ψ0
φcsφm[◦]
ψm[◦]
RoweSoreideWehnert, ψ0 = −3◦
Constant
Figure 2: Comparison of models for mobilized dilatancy angle ψm implemented in SOFiSTiK for φ = 35◦and ψ = 10◦
4 Benchmark No. 48 | SOFiSTiK 2018
Triaxial Consolidated Undrained (CU) Test
3 Model and Results
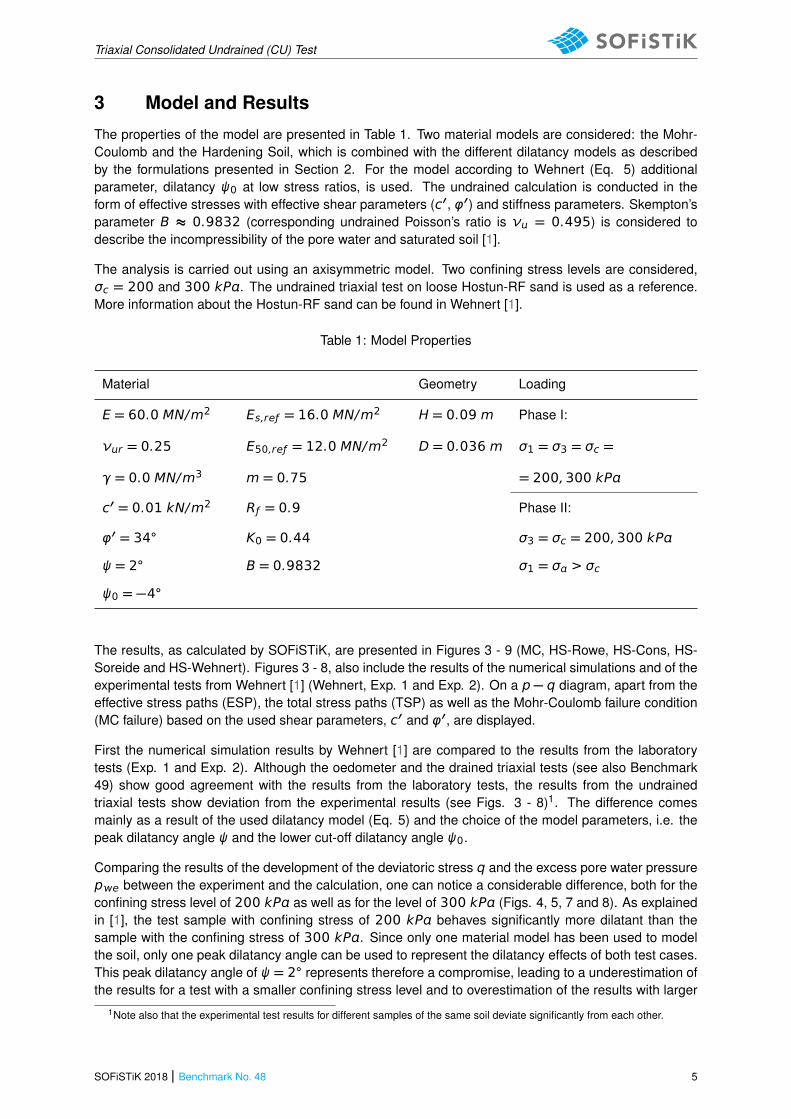
The properties of the model are presented in Table 1. Two material models are considered: the Mohr-Coulomb and the Hardening Soil, which is combined with the different dilatancy models as describedby the formulations presented in Section 2. For the model according to Wehnert (Eq. 5) additionalparameter, dilatancy ψ0 at low stress ratios, is used. The undrained calculation is conducted in theform of effective stresses with effective shear parameters (c′, φ′) and stiffness parameters. Skempton’sparameter B ≈ 0.9832 (corresponding undrained Poisson’s ratio is ν = 0.495) is considered todescribe the incompressibility of the pore water and saturated soil [1].
The analysis is carried out using an axisymmetric model. Two confining stress levels are considered,σc = 200 and 300 kP. The undrained triaxial test on loose Hostun-RF sand is used as a reference.More information about the Hostun-RF sand can be found in Wehnert [1].
Table 1: Model Properties
Material Geometry Loading
E = 60.0 MN/m2 Es,reƒ = 16.0 MN/m2 H = 0.09 m Phase I:
νr = 0.25 E50,reƒ = 12.0 MN/m2 D = 0.036 m σ1 = σ3 = σc =
γ = 0.0 MN/m3 m = 0.75 = 200,300 kP
c′ = 0.01 kN/m2 Rƒ = 0.9 Phase II:
φ′ = 34◦ K0 = 0.44 σ3 = σc = 200,300 kP
ψ = 2◦ B = 0.9832 σ1 = σ > σc
ψ0 = −4◦
The results, as calculated by SOFiSTiK, are presented in Figures 3 - 9 (MC, HS-Rowe, HS-Cons, HS-Soreide and HS-Wehnert). Figures 3 - 8, also include the results of the numerical simulations and of theexperimental tests from Wehnert [1] (Wehnert, Exp. 1 and Exp. 2). On a p − q diagram, apart from theeffective stress paths (ESP), the total stress paths (TSP) as well as the Mohr-Coulomb failure condition(MC failure) based on the used shear parameters, c′ and φ′, are displayed.
First the numerical simulation results by Wehnert [1] are compared to the results from the laboratorytests (Exp. 1 and Exp. 2). Although the oedometer and the drained triaxial tests (see also Benchmark49) show good agreement with the results from the laboratory tests, the results from the undrainedtriaxial tests show deviation from the experimental results (see Figs. 3 - 8)1. The difference comesmainly as a result of the used dilatancy model (Eq. 5) and the choice of the model parameters, i.e. thepeak dilatancy angle ψ and the lower cut-off dilatancy angle ψ0.
Comparing the results of the development of the deviatoric stress q and the excess pore water pressurepe between the experiment and the calculation, one can notice a considerable difference, both for theconfining stress level of 200 kP as well as for the level of 300 kP (Figs. 4, 5, 7 and 8). As explainedin [1], the test sample with confining stress of 200 kP behaves significantly more dilatant than thesample with the confining stress of 300 kP. Since only one material model has been used to modelthe soil, only one peak dilatancy angle can be used to represent the dilatancy effects of both test cases.This peak dilatancy angle of ψ = 2◦ represents therefore a compromise, leading to a underestimation ofthe results for a test with a smaller confining stress level and to overestimation of the results with larger
1Note also that the experimental test results for different samples of the same soil deviate significantly from each other.
SOFiSTiK 2018 | Benchmark No. 48 5

Triaxial Consolidated Undrained (CU) Test
confining stress level at higher mobilized friction angels.
Further differences arise from the chosen dilatancy model and the used lower cut-off dilatancy angleψ0 = −4◦2. Due to the presence of the negative mobilized dilatancy angle (ψm < 0) at low stress levels,the soil has the tendency to decrease its volume (contraction) under increase of the deviatoric stress q(shear). However, since the soil is under undrained conditions, the volumetric strains cannot develop,and as a result the excess pore pressure increases under shear. The increase of the excess porepressure means that the effective stresses will reduce (ESP lines curve to the left in the p− q plot, Figs.3 and 6). With the increase of the stress level, the contractive behavior turns to dilatant, meaning that thenegative rate of excess pore pressures (pore water under-pressure) will arise, excess pore pressuresdecrease and hence the effective stresses increase. This transition from contractant to dilatant behavioroccurs when the mobilized friction angle φ′
mbecomes larger than the phase transition angle φ′
ƒwhich is
approximately equal to the critical state friction angle φ′cs
(see Fig. 2). As further noted by Wehnert [1],due to the fact that mobilized dilatancy angle at low stress levels is slightly heigher and kept constant(ψm = ψ0 for 0 ≤ ψm ≤ ψRoem
, Eq. 5), the pore water under-pressures are overestimated.
Next the SOFiSTiK results obtained using the same soil model and dilatancy formulation as in [1] (HS-Wehnert) can be compared with the reference numerical simulation results (Wehnert). They show goodagreement.
Finally, in other to illustrate the effect that the chosen dilatancy model can have on the results of theundrained soil, the results of the computation using the hardening soil model with different dilatancyformulations from Section 2 are included.
3.1 Hostun-RF Sand, σc = 200 kN/m2
0 50 100 150 200 250 3000
50
100
150
200
250
300
350
400
p, p′ [kN/m2]
q[kN/m
2]
MC failureTSPESP, MCESP, HS-RoweESP, HS-ConsESP, HS-SoreideESP, HS-WehnertESP, Wehnert [1]ESP, Exp. 1 [1]ESP, Exp. 2 [1]
Figure 3: Effective stress path curve (q-p)
2The used value ψ0 = −4◦ is much higher than the values obtained from experimental tests, which range from −13◦ to −21◦.The reason for choosing this higher value is due to the fact that the experimental test used to obtain the dilatancy parametersinvolve not only shear but also some normal stress application to the test samples [1].
6 Benchmark No. 48 | SOFiSTiK 2018

Triaxial Consolidated Undrained (CU) Test
0 5 10 150
50
100
150
200
250
300
350
400
ϵ1[%]
q[kN/m
2]
MCHS-RoweHS-ConsHS-SoreideHS-WehnertWehnert [1]Exp.1 [1]Exp.2 [1]
Figure 4: Deviatoric stress - axial strain curve (q-ϵ1)
0 5 10 150
50
100
150
200
ϵ1[%]
pe[kN/m
2]
MCHS-RoweHS-ConsHS-SoreideHS-WehnertWehnert [1]Exp. 1 [1]Exp. 2 [1]
Figure 5: Excess porewater pressure - axial strain curve (pe-ϵ1)
SOFiSTiK 2018 | Benchmark No. 48 7

Triaxial Consolidated Undrained (CU) Test
3.2 Hostun-RF Sand, σc = 300 kN/m2
0 50 100 150 200 250 300 350 400 4500
50
100
150
200
250
300
350
400
p, p′ [kN/m2]
q[kN/m
2]
MC failureTSPESP, MCESP, HS-RoweESP, HS-ConsESP, HS-SoreideESP, HS-WehnertESP, Wehnert [1]ESP, Exp. 1 [1]
Figure 6: Effective stress path curve (q-p)
0 5 10 15 200
50
100
150
200
250
300
350
400
450
ϵ1[%]
q[kN/m
2]
MCHS-RoweHS-ConsHS-SoreideHS-WehnertWehnert [1]Exp.1 [1]
Figure 7: Deviatoric stress - axial strain curve (q-ϵ1)
8 Benchmark No. 48 | SOFiSTiK 2018

Triaxial Consolidated Undrained (CU) Test
0 5 10 150
50
100
150
200
250
300
ϵ1[%]
pe[kN/m
2]
MCHS-RoweHS-ConsHS-SoreideHS-WehnertWehnert [1]Exp. 1 [1]
Figure 8: Excess porewater pressure - axial strain curve (pe-ϵ1)
0 5 10 15 20 25 30 35
−30
−20
−10
0
φm [◦]
ψm[◦]
HS-RoweHS-ConsHS-SoreideHS-Wehnert
Figure 9: Mobilised dilatancy angle - friction angle curve (ψm-φm)
4 Conclusion
This example concerning the consolidated undrained triaxial test of a loose sand soil verifies that theHardening Soil material model in combination with an appropriate choice of model parameters anddilatancy model is able to capture important behavior characteristics of the undrained soil. The numericalresults are in a good agreement with the reference solution provided by Wehnert [1].
5 Literature
[1] M. Wehnert. Ein Beistrag zur dreainerten und undrainerten Analyse in der Geotechnik. Institut furGeotechnik, Universitat Stuttgart: P. A. Vermeer, 2006.
SOFiSTiK 2018 | Benchmark No. 48 9

Triaxial Consolidated Undrained (CU) Test
[2] P.W. Rowe. “The stress-dilatancy relation for static equilibrium of an assembly of particles in con-tact”. In: Proceedings of the Royal Society of London. Series A. Mathematical and Physical Sci-ences 269.1339 (1962), pp. 500–527.
[3] O. K. Soreide. “Mixed hardening models for frictional soils”. PhD thesis. NTNU Norges teknisk-naturvitenskapelige universitet, 2003.
10 Benchmark No. 48 | SOFiSTiK 2018