prediction of drained and undrained cyclic behaviour … · prediction of drained and undrained ......
TRANSCRIPT
5th International Conference on Earthquake Geotechnical Engineering,
January 2011, 10-13, Santiago, Chile.
PREDICTION OF DRAINED AND UNDRAINED CYCLIC
BEHAVIOUR OF A FINE SAND USING A HIGH-CYCLE
ACCUMULATION MODEL
Torsten WICHTMANNi), Benjamin ROJAS ii), Andrzej NIEMUNISiii),
Theodor TRIANTAFYLLIDISiv)
ABSTRACT
The paper presents an experimental study in order to quantify the isotropic hypoelastic stiff-ness tensor E of the high-cycle accumulation (HCA) model proposed by Niemunis et al. [1]. E
interrelates stress and strain accumulation rates and not stress and strain increments. A pressure-dependent bulk modulus K and a constant Poisson’s ratio ν are assumed. The bulk modulus ofmedium-dense fine uniform sand was determined from 12 pairs of drained and undrained cyclictriaxial tests. It is demonstrated that, within the investigated range, K does not depend onthe amplitude-pressure-ratio. The bulk modulus measured for the fine sand is of similar magni-tude as the K-values obtained in an earlier study on a medium coarse sand. The drained andundrained cyclic tests were recalculated using the HCA model. The good agreement betweenpredicted and experimental data is demonstrated in the paper.
Keywords: high-cycle accumulation model, stiffness E, drained and undrained cyclic triaxial tests
INTRODUCTION
The high-cycle accumulation (HCA) model proposed by Niemunis et al. [1] can be used for theprediction of settlements or stress relaxation (e.g. excess pore water pressure accumulation) innon-cohesive soils due to a large number (N > 103) of cycles with relative small strain amplitudes(εampl < 10−3) (so-called high- or polycyclic loading). The HCA model may be applied forexample to foundations of on- and offshore wind power plants, to machine foundations or tofoundations subjected to traffic loading. The HCA model is based on an extensive laboratorytesting program with drained cyclic triaxial and multiaxial DSS tests (Wichtmann [3]).
The experimental study presented in the paper is dedicated to the isotopic hypoelastic stiffnesstensor E in the basic constitutive equation of the HCA model:
σ′ = E : (ε − ε
acc − εpl) (1)
In Eq. (1) the superposed dot means a rate with respect to the number of cycles N (i.e. anincrement per cycle). The colon denotes a double contraction (Gibbs notation). σ
′ is the rate
i)Research assistant, Institute of Soil Mechanics and Rock Mechanics, Karlsruhe Institute of Technology, Karl-
sruhe, Germany, e-mail: [email protected])Student, Universidad de Santiago de Chile, Santiago, Chile, e-mail: [email protected])Research assistant, Institute of Soil Mechanics and Rock Mechanics, Karlsruhe Institute of Technology, Karl-
sruhe, Germany, e-mail: [email protected])Professor and Director, Institute of Soil Mechanics and Rock Mechanics, Karlsruhe Institute of Technology,
Karlsruhe, Germany, e-mail: [email protected]
1
2 Wichtmann et al.
of effective stress, ε the strain rate, εacc the prescribed rate of strain accumulation and ε
pl aplastic strain rate preventing stress paths from passing the yield surface. The rate of strainaccumulation is calculated as a product of a scalar intensity of accumulation εacc and a directionof accumulation m (unit tensor):
εacc = εaccm (2)
The intensity of accumulation is calculated as the product of six functions each considering aseparate influencing parameter:
εacc = fampl fe fp fY fN fπ (3)
The functions fampl, fe, fp and fN describing the influences of strain amplitude, void ratio,average mean pressure and cyclic preloading are introduced in the section on the test results.The function fY capturing the dependece of εacc on average stress ratios ηav = qav/pav and thefunction fπ considering the effect of polarization changes are unimportant here because the testswere performed with isotropic average stresses (η = 0 = const., i.e. fY = 1) and with a constantpolarization (fπ = 1).
Depending on the boundary conditions (e.g. stress or strain control in element tests), Eq. (1)predicts a change of the average stress (σ′ 6= 0) and/or an accumulation of residual strain(ε 6= 0). The stiffness E in Eq. (1) is important for boundary value problems showing a significantstress relaxation due to cyclic loading (e.g. pile foundations). At present an isotropic hypo-elastictensor is used for E. Therefore, two elastic constants, e.g. bulk modulus K and Poisson’s ratioν have to be determined.
In elastoplastic models E would be determined experimentally from a small unloading (at theabsence of plastic strain ∆ε
pl), comparing the stress increment ∆σ′ with the strain increment
∆ε:
∆σ′ = E : (∆ε − ∆ε
pl︸︷︷︸
0
) (4)
This procedure is not applicable to HCA models. E has to be determined from cyclic tests, inparticular from a comparison of cyclic creep and cyclic relaxation tests performed with the sameaverage stress and density.
A first experimental study on K has been documented by Wichtmann et al. [5]. The pressure-dependent bulk modulus of medium dense, medium coarse uniform quartz sand (mean grainsize d50 = 0.55 mm, coefficient of uniformity Cu = d60/d10 = 1.8, obtained from a sand pit nearDorsten, Germany) was quantified from 15 pairs of drained and undrained cyclic triaxial testsand described by:
K = A patm1−n pn (5)
with the reference pressure patm = 100 kPa and with constants A = 467 and n = 0.46. However,due to the coarse grains the undrained test data had to be corrected with respect to membranepenetration effects. The method proposed by Tokimatsu et al. [2] was applied. An inaccuracyof the parameters A and n proposed for Eq. (5) may be caused by uncertainties associated withthis correction.
Therefore, a new experimental study has been performed on a fine uniform quartz sand (d50 =0.14 mm, Cu = 1.5, obtained from a sand pit near Ludwigshafen, Germany) for which membranepenetration effects are negligible. The present paper reports on the experimental results of thisstudy.
Prediction of drained and undrained cyclic behaviour of a fine sand using a high-cycleaccumulation model 3
EXPERIMENTAL DETERMINATION OF K AND ν
The bulk modulus K can be obtained from a pair of drained and undrained cyclic tests withsimilar initial conditions and with similar cyclic loading. In the axisymmetric case, Eq. (1) canbe rewritten with Roscoe’s invariants:
[pq
]
=
[K 00 3G
] [εv − εaccmv
εq − εaccmq
]
(6)
[mv
mq
]
=1
√13(p − q2
M2p)2 + 6( q
M2 )2
[
p − q2
M2p
2 qM2
]
(7)
with mean pressure p = (σ′
1+2σ′
3)/3, deviatoric stress q = σ′
1−σ′
3, volumetric strain εv = ε1+2ε3
and deviatoric strain εq = 2/3(ε1−ε3). σ′
1, σ′
3 and ε1, ε3 are the axial and the horizontal effectivestress or strain components, respectively. G is the shear modulus, mv and mq are the volumetricand the deviatoric portions of the flow rule m, respectively. Omitting ε
pl in Eq. (1) is legitimatefor homogeneous stress fields if the cyclic loading is not overlaid by monotonic loading. Thecritical stress ratio M is defined as
M =
Mc for η ≥ 0(1 + η/3)Mc for Me < η < 0Me for η ≤ Me
(8)
with Mc =6 sinϕc
3 − sinϕc
and Me = − 6 sinϕc
3 + sinϕc
(9)
wherein ϕc is the critical friction angle and η = q/p. For isotropic average stress conditions (q= 0, q = 0, mq = 0), Eq. (6) takes either the form of isotropic relaxation
p = −K εacc mv ↔ u = K εacc mv (10)
under undrained conditions (εv = 0) or the form of volumetric creep
εv = εacc mv (11)
under drained conditions (p = 0). Comparing these equations one may eliminate εacc mv andobtain
K = u/εv (12)
Therefore, the bulk modulus K can be calculated from Eq. (12) with the rate u of pore pressureaccumulation obtained from an undrained cyclic test and with the rate εv = εacc
v of volumetricstrain accumulation from a drained cyclic test with similar initial conditions and with similarcyclic loading.
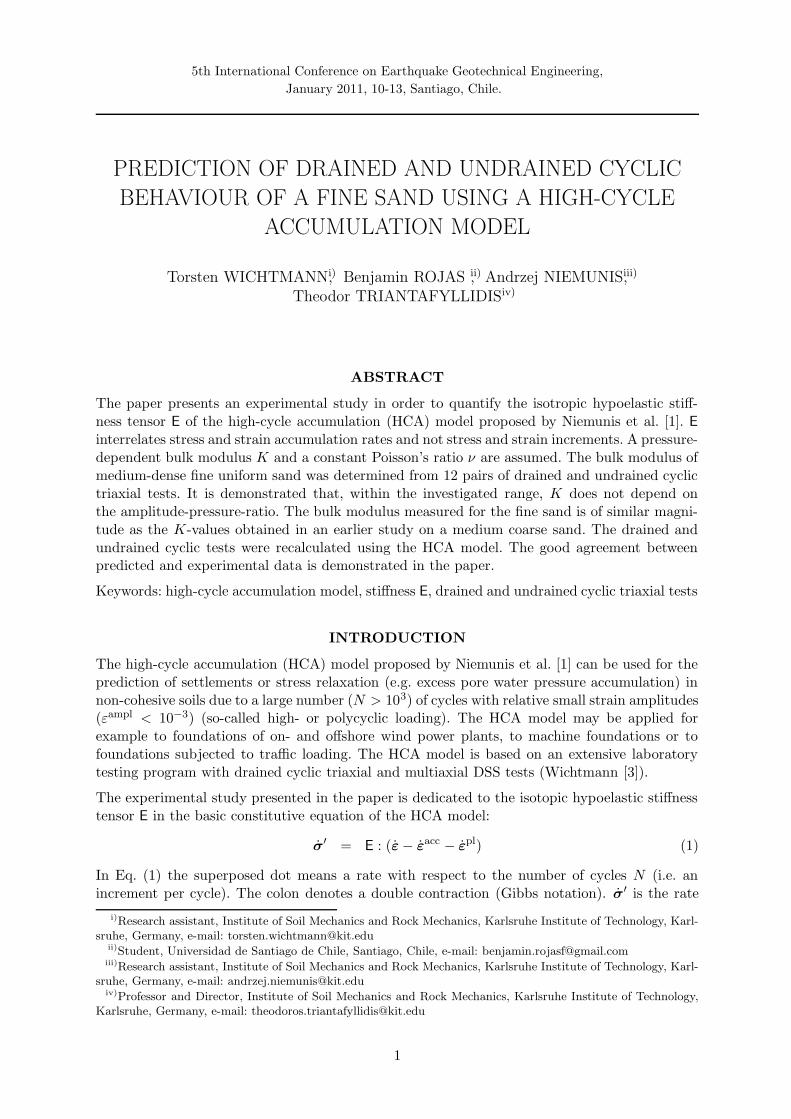
Poisson’s ratio ν can be determined from the evolution of the average effective stress in anundrained cyclic triaxial test with constant strain amplitude commenced at an anisotropic initialstress (see the example in Figure 1). For εv = 0 and ε1 = 0 and therefore εq = 0 one obtains:
[pq
]
=
[K 00 3G
] [−εaccmv
−εaccmq
]
(13)
The ratio of the relaxation rates q/p, that means the inclination of the average effective stresspath depends on ν:
q
p=
3G
K
mq
mv
=9(1 − 2ν)
2(1 + ν)
1
ω↔ ν =
9 − 2ω(q/p)
18 + 2ω(q/p)(14)
4 Wichtmann et al.
with the strain rate ratio
ω =εaccv
εaccq
=mv
mq
=M2 − (ηav)2
2ηav(15)
The index ”av” denotes the average value during a cycle. An experimental study on Poisson’sratio ν for the HCA model has been presented by Wichtmann et al. [6]. For fine sand, a valueof ν = 0.32 works well in most cases.
Mc
qav [k
Pa]
pav [kPa]
CSL
CSL
σ'0
σ'0
0 100 200
-100
0
100
200
1
1
� = 0.4 0.3 0.2 0.1
� = 0.1 0.2 0.3 0.4
�
1
t
�
v = const.
Me
qp
�
1
�
1�
3
Fig. 1: Average effective stress paths in undrainedcyclic triaxial tests with constant strain amplitudepredicted by the HCA model for different Poisson’sratios ν
0.35
0.30
0.25
0.20
0.15
0.10
0.05
0
-0.05 V
olum
etric
str
ain
ε v [%
]
0 1.0 1.5 0.5 2.0 2.5 3.0
Time t [104 s]
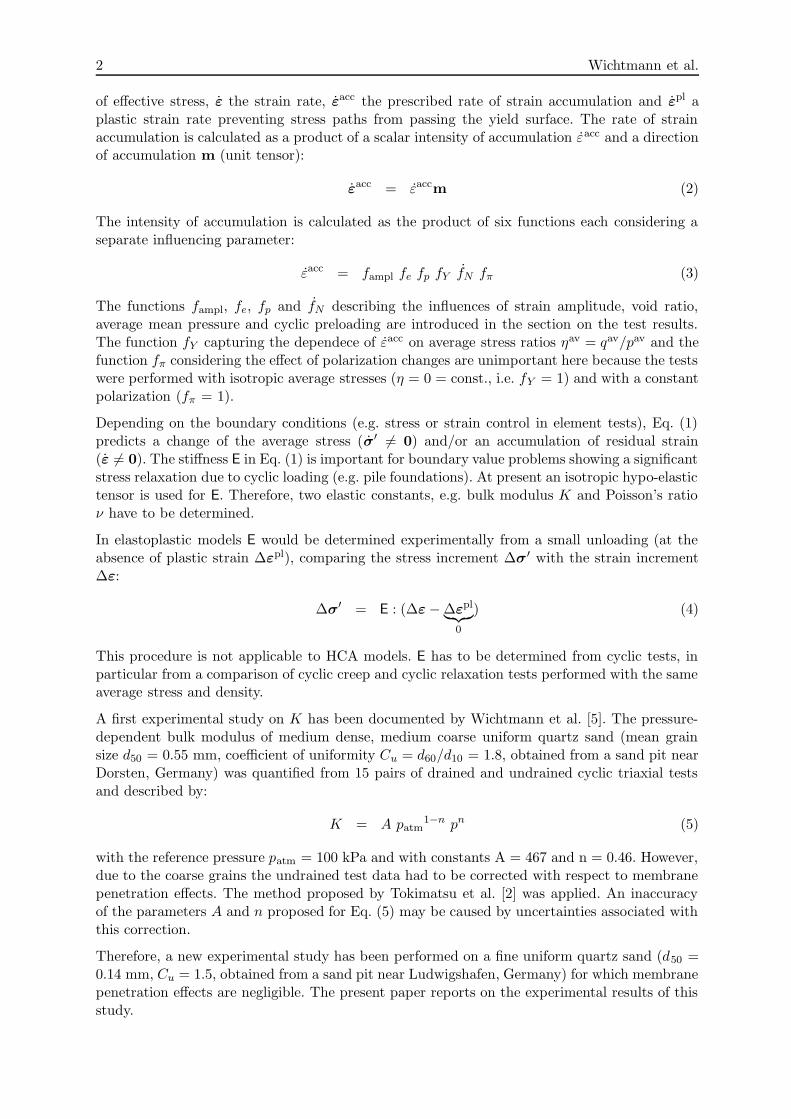
pav = 300 kPa ηav = 0 ζ = 0.3 ID0 = 0.57
Fig. 2: Volumetric strain versus time in a drainedcyclic triaxial test
SAMPLE PREPARATION AND TESTING PROCEDURE
Twelve pairs of drained and undrained cyclic triaxial tests were performed. The cylindrical sam-ples (diameter d = 10 cm, height h = 10 cm) were prepared by air pluviation and subsequentlysaturated with de-aired water. The two samples of a test pair were prepared with similar initialvoid ratios and consolidated under the same isotropic effective stress. The two samples wereloaded with the same deviatoric stress amplitude, one under drained and the other one underundrained conditions.
All samples were medium dense. Four different initial effective mean pressures (p0 = 50, 100, 200and 300 kPa) were tested. For each pressure, three test pairs with different amplitude-pressureratios ζ = qampl/p0 = 0.2, 0.25 or 0.3, respectively, were performed. The loading was appliedwith a constant displacement rate of 0.02 mm/min (strain rate ε1 ≈ 0.02 %/min).
In all tests (drained and undrained) the first cycle was applied drained due to the followingreasons. The first cycle may be irregular and may generate much more deformation than thesubsequent regular ones. The HCA model predicts the accumulation due to the regular cyclesonly. In numerical calculations with the HCA model the first cycle is calculated using a con-ventional incrementally nonlinear constitutive model (see Niemunis et al. [1]). Since the initialconditions at the beginning of the regular cycles were intended to be similar in the drained andin the undrained tests, the first cycle was applied drained in both types of tests.
TEST RESULTS
Drained tests
The data from the drained tests can be used for both, the quantification of bulk modulus Kand the determination of the parameters used in the functions fampl, fe, fp and fN of the HCA
Prediction of drained and undrained cyclic behaviour of a fine sand using a high-cycleaccumulation model 5
Parameter ϕc Campl Ce eref = emax Cp CN1 CN2 CN3
Value 33.1◦ 1.40 0.55 1.054 0.23 1.22 · 10−4 0.64 0
Table 1: HCA model parameters for the fine sand
model.
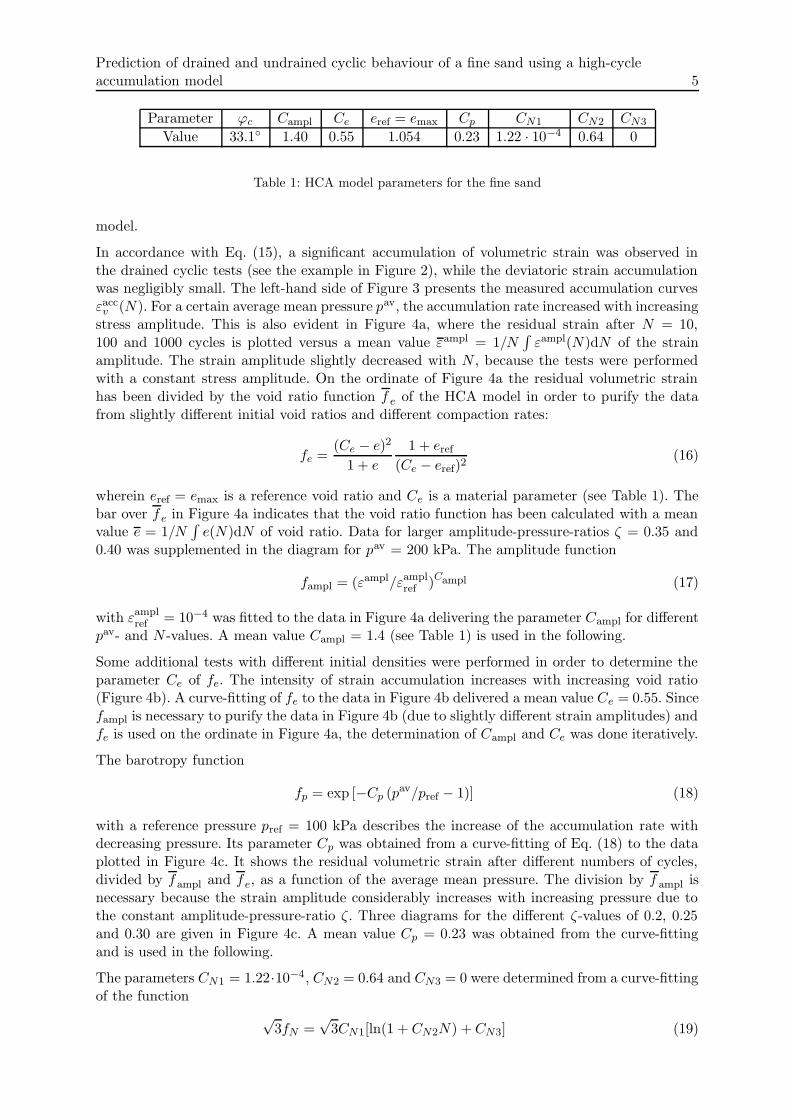
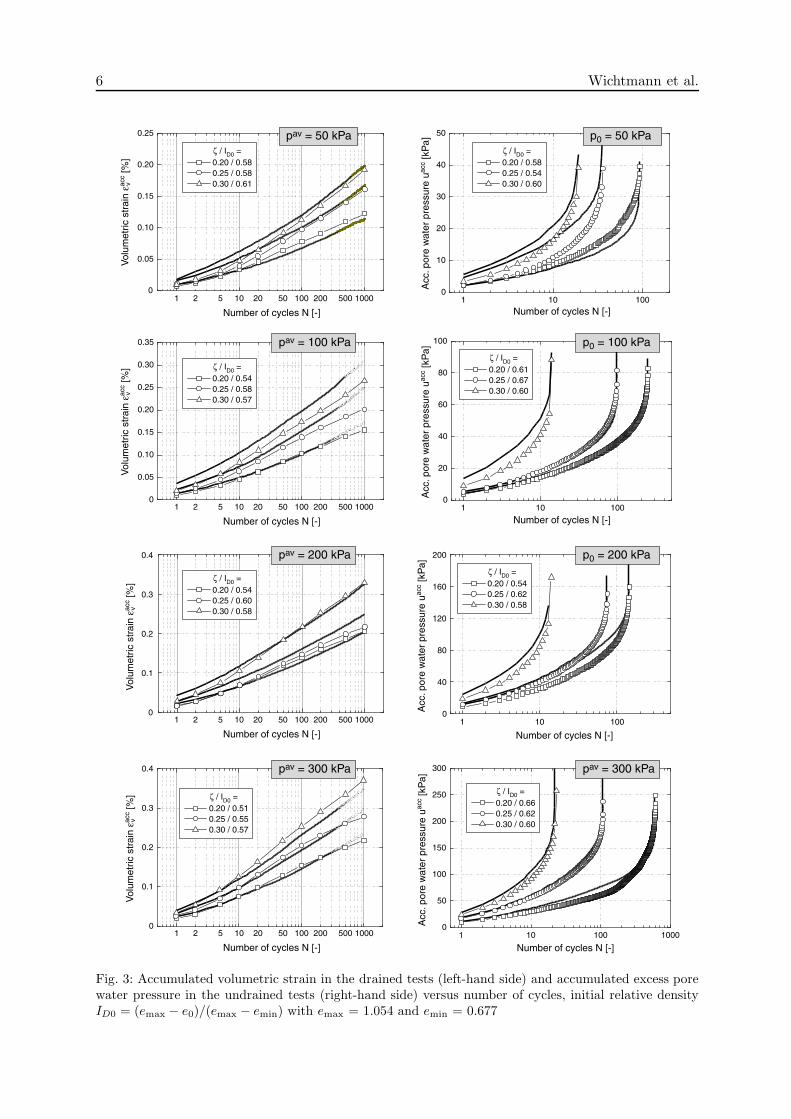
In accordance with Eq. (15), a significant accumulation of volumetric strain was observed inthe drained cyclic tests (see the example in Figure 2), while the deviatoric strain accumulationwas negligibly small. The left-hand side of Figure 3 presents the measured accumulation curvesεaccv (N). For a certain average mean pressure pav, the accumulation rate increased with increasing
stress amplitude. This is also evident in Figure 4a, where the residual strain after N = 10,100 and 1000 cycles is plotted versus a mean value εampl = 1/N
∫εampl(N)dN of the strain
amplitude. The strain amplitude slightly decreased with N , because the tests were performedwith a constant stress amplitude. On the ordinate of Figure 4a the residual volumetric strainhas been divided by the void ratio function f e of the HCA model in order to purify the datafrom slightly different initial void ratios and different compaction rates:
fe =(Ce − e)2
1 + e
1 + eref
(Ce − eref)2(16)
wherein eref = emax is a reference void ratio and Ce is a material parameter (see Table 1). Thebar over fe in Figure 4a indicates that the void ratio function has been calculated with a meanvalue e = 1/N
∫e(N)dN of void ratio. Data for larger amplitude-pressure-ratios ζ = 0.35 and
0.40 was supplemented in the diagram for pav = 200 kPa. The amplitude function
fampl = (εampl/εamplref )
Campl (17)
with εamplref = 10−4 was fitted to the data in Figure 4a delivering the parameter Campl for different
pav- and N -values. A mean value Campl = 1.4 (see Table 1) is used in the following.
Some additional tests with different initial densities were performed in order to determine theparameter Ce of fe. The intensity of strain accumulation increases with increasing void ratio(Figure 4b). A curve-fitting of fe to the data in Figure 4b delivered a mean value Ce = 0.55. Sincefampl is necessary to purify the data in Figure 4b (due to slightly different strain amplitudes) andfe is used on the ordinate in Figure 4a, the determination of Campl and Ce was done iteratively.
The barotropy function
fp = exp [−Cp (pav/pref − 1)] (18)
with a reference pressure pref = 100 kPa describes the increase of the accumulation rate withdecreasing pressure. Its parameter Cp was obtained from a curve-fitting of Eq. (18) to the dataplotted in Figure 4c. It shows the residual volumetric strain after different numbers of cycles,divided by f ampl and fe, as a function of the average mean pressure. The division by f ampl isnecessary because the strain amplitude considerably increases with increasing pressure due tothe constant amplitude-pressure-ratio ζ. Three diagrams for the different ζ-values of 0.2, 0.25and 0.30 are given in Figure 4c. A mean value Cp = 0.23 was obtained from the curve-fittingand is used in the following.
The parameters CN1 = 1.22·10−4, CN2 = 0.64 and CN3 = 0 were determined from a curve-fittingof the function
√3fN =
√3CN1[ln(1 + CN2N) + CN3] (19)
6 Wichtmann et al.
1 2 5 10 20 50 100 200 500 10000
0.05
0.10
0.15
0.20
0.25
ζ / ID0 = 0.20 / 0.58 0.25 / 0.58 0.30 / 0.61
Number of cycles N [-]
1 2 5 10 20 50 100 200 500 1000
Number of cycles N [-]
1 2 5 10 20 50 100 200 500 1000
Number of cycles N [-]
1 2 5 10 20 50 100 200 500 1000
Number of cycles N [-]
Vol
umet
ric s
trai
n εac
c [%]
vV
olum
etric
str
ain
εacc [%
]v
Vol
umet
ric s
trai
n εac
c [%]
vV
olum
etric
str
ain
εacc [%
]v
0
0.05
0.10
0.15
0.20
0.25
0.35
0.30
0
0.1
0.2
0.3
0.4
0
0.1
0.2
0.3
0.4
1 10 1000
10
20
30
40
50
Acc
. por
e w
ater
pre
ssur
e uac
c [kP
a]
Number of cycles N [-]
Acc
. por
e w
ater
pre
ssur
e uac
c [kP
a]
Number of cycles N [-]
Acc
. por
e w
ater
pre
ssur
e uac
c [kP
a]
Number of cycles N [-]
Acc
. por
e w
ater
pre
ssur
e uac
c [kP
a]
Number of cycles N [-]
1 10 1000
20
40
60
80
100
1 10 1000
40
80
120
160
200
1 10 100 10000
50
100
150
200
250
300
pav = 50 kPa
pav = 100 kPa
pav = 200 kPa
pav = 300 kPa
p0 = 50 kPa
p0 = 100 kPa
p0 = 200 kPa
pav = 300 kPa
ζ / ID0 = 0.20 / 0.61 0.25 / 0.67 0.30 / 0.60
ζ / ID0 = 0.20 / 0.54 0.25 / 0.58 0.30 / 0.57
ζ / ID0 = 0.20 / 0.54 0.25 / 0.60 0.30 / 0.58
ζ / ID0 = 0.20 / 0.51 0.25 / 0.55 0.30 / 0.57
ζ / ID0 = 0.20 / 0.66 0.25 / 0.62 0.30 / 0.60
ζ / ID0 = 0.20 / 0.54 0.25 / 0.62 0.30 / 0.58
ζ / ID0 = 0.20 / 0.58 0.25 / 0.54 0.30 / 0.60
Fig. 3: Accumulated volumetric strain in the drained tests (left-hand side) and accumulated excess porewater pressure in the undrained tests (right-hand side) versus number of cycles, initial relative densityID0 = (emax − e0)/(emax − emin) with emax = 1.054 and emin = 0.677
Prediction of drained and undrained cyclic behaviour of a fine sand using a high-cycleaccumulation model 7
0 1 2 30
0.2
0.4
0.6 N = 101001000
Strain amplitude εampl [10-4] Strain amplitude εampl [10-4] Strain amplitude εampl [10-4] Strain amplitude εampl [10-4]
εacc
/ f e
[%]
v
pav = 50 kPa
0 1 2 3 4 50
0.2
0.4
0.6
0.8
1.0
0 2 4 6 8 100
0.4
0.8
1.2
1.6
2.0
2.4
0 1 2 3 4 5 6 70
0.2
0.4
0.6
0.8
1.0
1.2
1.4
0.7 0.8 0.90
0.01
0.02
0.03
0.04
0.05
0.06
Void ratio e [-]
εacc
/ f a
mpl [%
]v
0 100 200 3000
0.04
0.08
0.12
0.16
0.20
0
0.04
0.08
0.12
0.16
0.20
εacc
/ (f
ampl f e
) [%
]v
Av. mean pressure pav [kPa]0 100 200 300
Av. mean pressure pav [kPa]0 100 200 300
Av. mean pressure pav [kPa]
ζ = qampl/pav = 0.20
εacc
/ (f
ampl f e
f p)
[%]
v
Number of cycles N [-]
pav = 100 kPa
N = 101001000
N = 101001000
N = 101001000
pav = 200 kPa pav = 300 kPaa)
b)
c)
d)
N = 101001000
N = 10
1001000
ζ = qampl/pav = 0.25
N = 10
1001000
0
0.04
0.08
0.12
0.16
0.20
0
0.04
0.08
0.12
0.16
0.20
ζ = qampl/pav = 0.30
N = 10
1001000
1 10 100 1000
pav = 50 kPapav = 100 kPapav = 200 kPapav = 300 kPaVariation of qampl
Variation of ID0
Fig. 4: Volumetric strain accumulated in the drained cyclic tests as a function of a) strain amplitude, b)void ratio, c) average mean pressure and d) number of cycles.
to the data in Figure 4d. In that figure, the accumulation curves εaccv (N) were divided by f ampl,
fe and fp in order to purify the data from the influences of amplitude, void ratio and pressure.For isotropic stress conditions, εacc
v (N) =√
3εacc(N) holds (compare the flow rule of the HCAmodel, Eq. (15)). The function fN in Eq. (19) represents the integral of the function fN of theHCA model
fN = CN1
[
CN2 exp
(
− gA
CN1 fampl
)
+ CN3
]
(20)
which describes the decrease of the accumulation rate with increasing cyclic preloading, quanti-fied by the historiotropic variable gA:
gA =
∫
fampl
[
CN1CN2 exp
(
− gA
CN1 fampl
)]
dN (21)
For uniform sands, the parameter CN3 influences the rate of strain accumulation for large num-bers of cycles (N > 104, Wichtmann et al. [4]) only. Therefore, CN3 was set to zero here.
The HCA model with the parameters summarized in Table 1 was used for recalculations ofthe drained cyclic tests. The initial void ratios and the measured strain amplitudes εampl(N)were used as input. The thick solid curves in the diagrams on the left-hand side of Figure 3were obtained from these recalculations. The experimental data and the prediction by the HCAmodel agree quite well.
8 Wichtmann et al.
0 0.2 0.4 0.6 0.8
0
100
400
500
200
300
Str
esses [kP
a]
Time t [105
s]
σ1 σ
3
σ3’
u p0 = 200 kPa
ζ = 0.25
ID0
= 0.62
Fig. 5: Total and effective stress components versustime in an undrained cyclic triaxial test
-6
-4
-2
0
2
4
6
0 0.5 1.0 1.5 2.0 2.5-8
Time t [105
s]
Axia
l S
train
ε1 [%
]
p0 = 300 kPa
ζ = 0.25
ID0
= 0.62
Fig. 6: Axial strain versus time in an undrainedcyclic triaxial test
Undrained tests
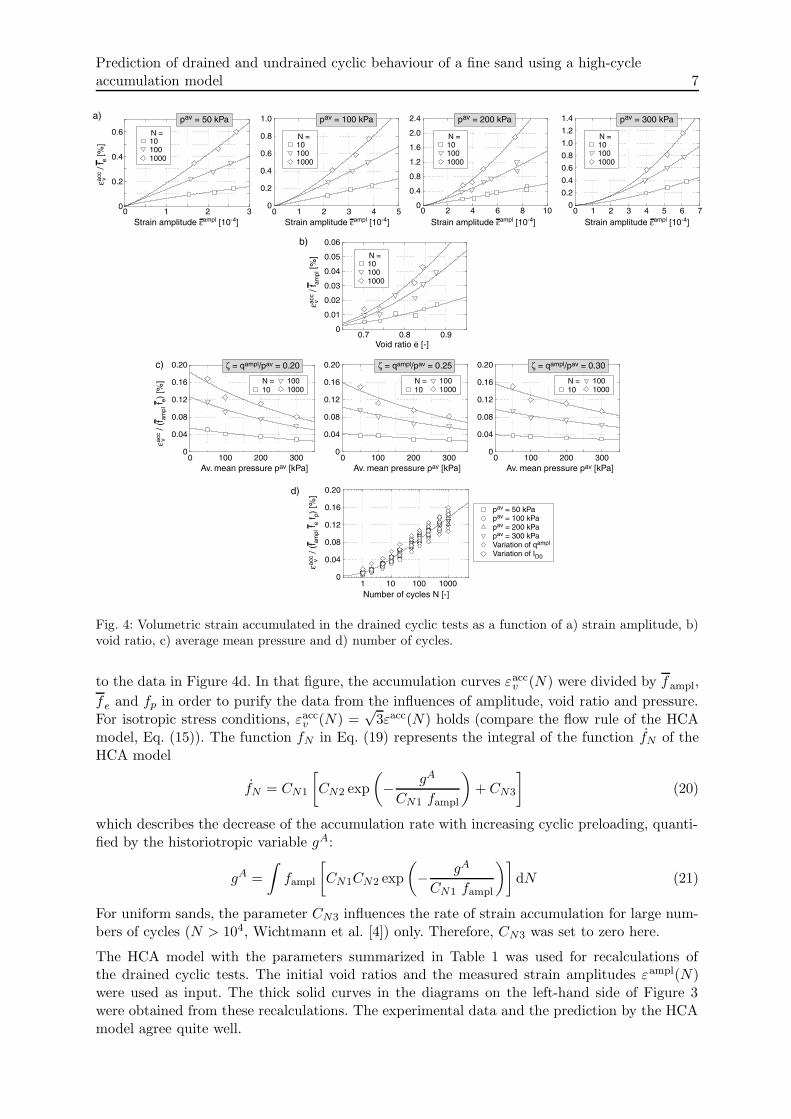
An accumulation of pore water pressure was observed in the undrained cyclic tests (see theexample in Figure 5). After ”initial liquefaction” (when σ ′
1 and σ′
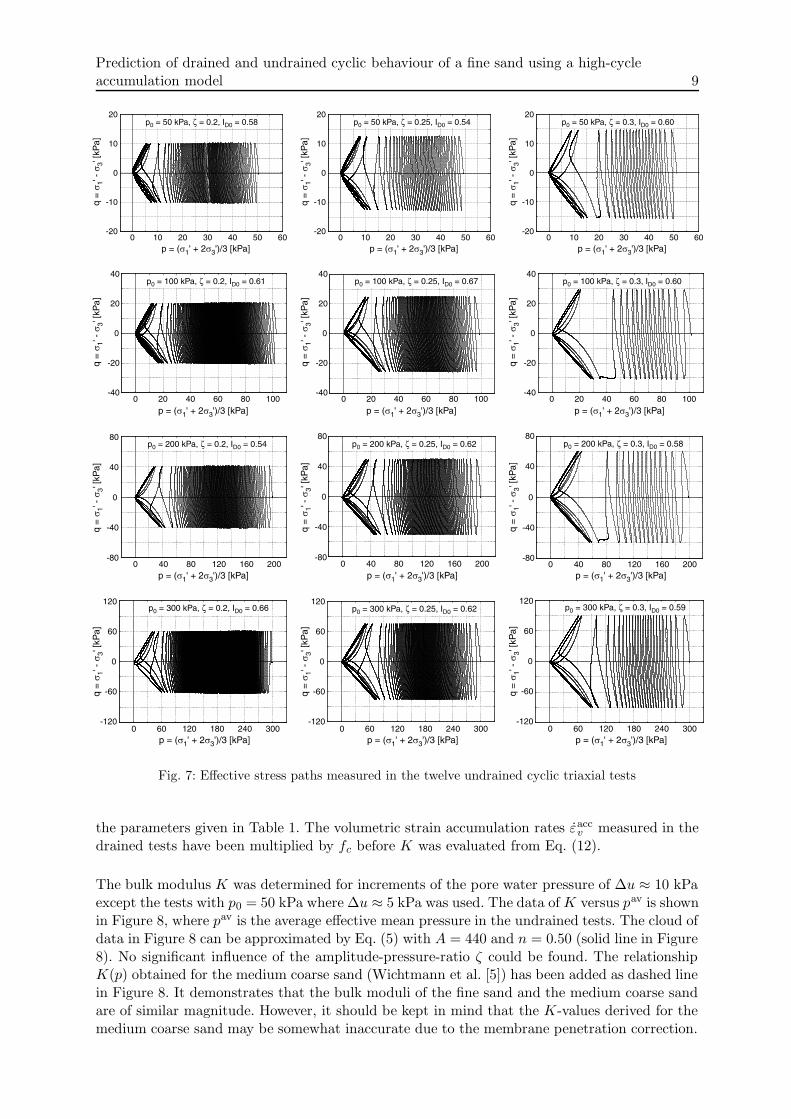
3 became temporarily zerofor the first time) the axial strain amplitude increased considerably with each subsequent cycle(Figure 6). In Figure 7, the effective stress paths from all twelve undrained cyclic tests arepresented in the p-q-plane.
The curves of the excess pore water pressure versus the number of cycles are given on theright-hand side of Figure 3. For a given initial pressure, the diagrams show the well-knownincrease of the rate of pore water pressure accumulation u with increasing amplitude-pressure-ratio ζ = qampl/p0.
Bulk modulus from a comparison of drained and undrained cyclic test data
For the twelve pairs of drained and undrained cyclic tests the bulk modulus K was calculatedfrom Eq. (12). The rate u ≈ ∆u/∆N of pore water pressure accumulation was obtained from theundrained tests while the rate εacc
v ≈ ∆εaccv /∆N of volumetric strain accumulation was derived
from the corresponding drained test data. In contrast to the study documented by Wichtmannet al. [5], the undrained test data were not corrected by membrane penetration effects sincethese effects are negligible for the tested fine sand.
In ideal case all state variables (average stress, density, cyclic preloading, strain amplitude)should be identical in the drained and in the undrained test. Otherwise Eq. (12) does not hold.However, despite similar values of the initial effective mean pressure p0, initial void ratio e0 anddeviatoric stress amplitude qampl, the conditions in the undrained and in the drained cyclic testsdiverged with increasing number of cycles. In the undrained tests the average effective meanpressure pav decreased and the strain amplitude εampl increased. In the drained tests the voidratio and the strain amplitude slightly decreased. In order to calculate K from Eq. (12) it isimportant to evaluate u and εacc
v for exactly the same state, that means same values of εampl, e,pav and cyclic preloading. The possible discrepancies must be corrected by a factor fc consistingof four multipliers:
fc =fUDampl
fDampl
fUDe
fDe
fUDp
fDp
fUDN
fDN
(22)
The indices ”UD” and ”D” indicate the undrained or drained test, respectively. The functionsfampl, fe, fp and fN of the HCA model have been introduced above. They were calculated with
Prediction of drained and undrained cyclic behaviour of a fine sand using a high-cycleaccumulation model 9
0
10
20
0 10 20 30
p = (σ1' + 2σ3')/3 [kPa]
q =
σ1' -
σ3' [
kP
a]
-20
-10
40 50 60
p0 = 50 kPa, ζ = 0.2, ID0 = 0.58
0
10
20
0 10 20 30
p = (σ1' + 2σ3')/3 [kPa]
q =
σ1' -
σ3' [
kP
a]
-20
-10
40 50 60
p0 = 50 kPa, ζ = 0.25, ID0 = 0.54
0
10
20
0 10 20 30
p = (σ1' + 2σ3')/3 [kPa]
q =
σ1' -
σ3' [
kP
a]
-20
-10
40 50 60
p0 = 50 kPa, ζ = 0.3, ID0 = 0.60
0
20
40
0 20 40 60-40
-20
80 100
p = (σ1' + 2σ3')/3 [kPa]
q =
σ1' -
σ3' [
kP
a]
p0 = 100 kPa, ζ = 0.2, ID0 = 0.61
0
20
40
0 20 40 60-40
-20
80 100
p = (σ1' + 2σ3')/3 [kPa]
q =
σ1' -
σ3' [
kP
a]
p0 = 100 kPa, ζ = 0.25, ID0 = 0.67
0
20
40
0 20 40 60-40
-20
80 100
p = (σ1' + 2σ3')/3 [kPa]
q =
σ1' -
σ3' [
kP
a]
p0 = 100 kPa, ζ = 0.3, ID0 = 0.60
0
40
80
0 40 80 120-80
-40
160 200
p0 = 200 kPa, ζ = 0.2, ID0 = 0.54
p = (σ1' + 2σ3')/3 [kPa]
q =
σ1' -
σ3' [
kP
a]
0
40
80
0 40 80 120-80
-40
160 200
p = (σ1' + 2σ3')/3 [kPa]
q =
σ1' -
σ3' [
kP
a]
p0 = 200 kPa, ζ = 0.25, ID0 = 0.62
0
40
80
0 40 80 120-80
-40
160 200
p0 = 200 kPa, ζ = 0.3, ID0 = 0.58
p = (σ1' + 2σ3')/3 [kPa]
q =
σ1' -
σ3' [
kP
a]
0
60
-60
0 60 120 180 240 300
120
-120
p = (σ1' + 2σ3')/3 [kPa]
q =
σ1' -
σ3' [
kP
a]
p0 = 300 kPa, ζ = 0.2, ID0 = 0.66
0
60
-60
0 60 120 180 240 300
120
-120
p = (σ1' + 2σ3')/3 [kPa]
q =
σ1' -
σ3' [
kP
a]
p0 = 300 kPa, ζ = 0.25, ID0 = 0.62
0
60
-60
0 60 120 180 240 300
120
-120
p = (σ1' + 2σ3')/3 [kPa]
q =
σ1' -
σ3' [
kP
a]
p0 = 300 kPa, ζ = 0.3, ID0 = 0.59
Fig. 7: Effective stress paths measured in the twelve undrained cyclic triaxial tests
the parameters given in Table 1. The volumetric strain accumulation rates εaccv measured in the
drained tests have been multiplied by fc before K was evaluated from Eq. (12).
The bulk modulus K was determined for increments of the pore water pressure of ∆u ≈ 10 kPaexcept the tests with p0 = 50 kPa where ∆u ≈ 5 kPa was used. The data of K versus pav is shownin Figure 8, where pav is the average effective mean pressure in the undrained tests. The cloud ofdata in Figure 8 can be approximated by Eq. (5) with A = 440 and n = 0.50 (solid line in Figure8). No significant influence of the amplitude-pressure-ratio ζ could be found. The relationshipK(p) obtained for the medium coarse sand (Wichtmann et al. [5]) has been added as dashed linein Figure 8. It demonstrates that the bulk moduli of the fine sand and the medium coarse sandare of similar magnitude. However, it should be kept in mind that the K-values derived for themedium coarse sand may be somewhat inaccurate due to the membrane penetration correction.
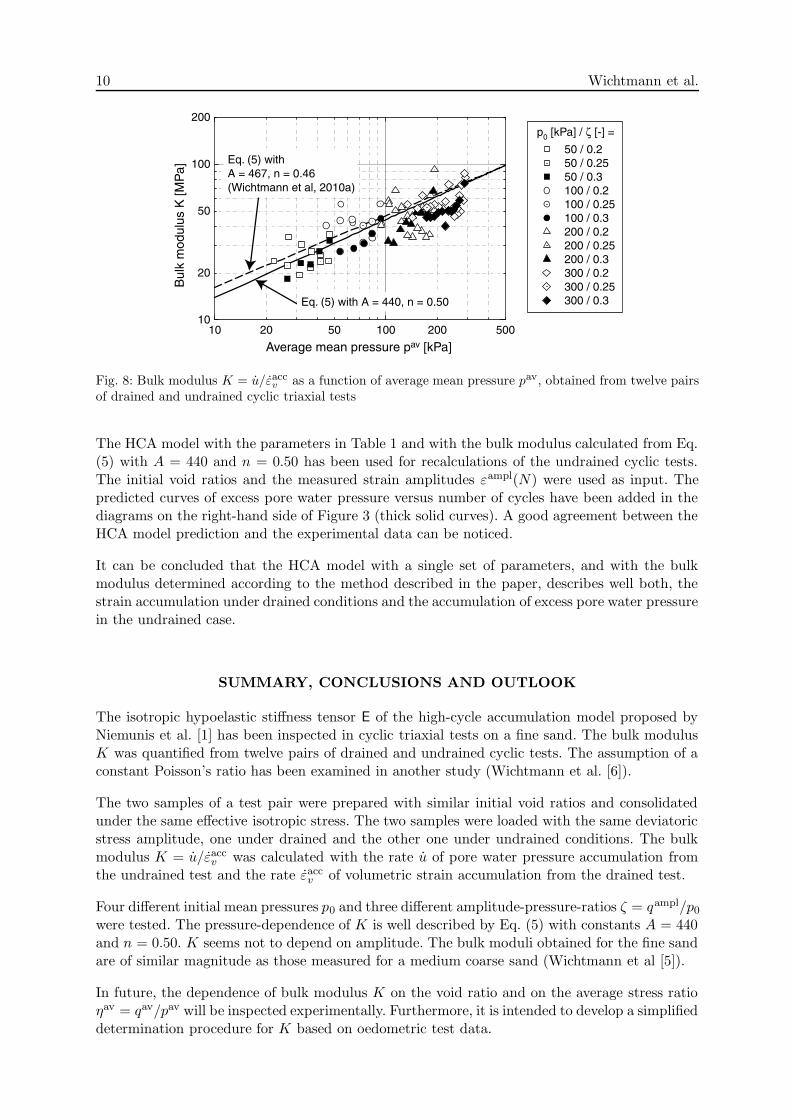
10 Wichtmann et al.
10 20 50 100 200 50010
20
50
100
200p0 [kPa] / ζ [-] =
50 / 0.2 50 / 0.25 50 / 0.3 100 / 0.2 100 / 0.25 100 / 0.3 200 / 0.2 200 / 0.25 200 / 0.3 300 / 0.2 300 / 0.25 300 / 0.3
Bul
k m
odul
us K
[MP
a]
Average mean pressure pav [kPa]
Eq. (5) with A = 440, n = 0.50
Eq. (5) with A = 467, n = 0.46 (Wichtmann et al, 2010a)
Fig. 8: Bulk modulus K = u/εaccv as a function of average mean pressure pav, obtained from twelve pairs
of drained and undrained cyclic triaxial tests
The HCA model with the parameters in Table 1 and with the bulk modulus calculated from Eq.(5) with A = 440 and n = 0.50 has been used for recalculations of the undrained cyclic tests.The initial void ratios and the measured strain amplitudes εampl(N) were used as input. Thepredicted curves of excess pore water pressure versus number of cycles have been added in thediagrams on the right-hand side of Figure 3 (thick solid curves). A good agreement between theHCA model prediction and the experimental data can be noticed.
It can be concluded that the HCA model with a single set of parameters, and with the bulkmodulus determined according to the method described in the paper, describes well both, thestrain accumulation under drained conditions and the accumulation of excess pore water pressurein the undrained case.
SUMMARY, CONCLUSIONS AND OUTLOOK
The isotropic hypoelastic stiffness tensor E of the high-cycle accumulation model proposed byNiemunis et al. [1] has been inspected in cyclic triaxial tests on a fine sand. The bulk modulusK was quantified from twelve pairs of drained and undrained cyclic tests. The assumption of aconstant Poisson’s ratio has been examined in another study (Wichtmann et al. [6]).
The two samples of a test pair were prepared with similar initial void ratios and consolidatedunder the same effective isotropic stress. The two samples were loaded with the same deviatoricstress amplitude, one under drained and the other one under undrained conditions. The bulkmodulus K = u/εacc
v was calculated with the rate u of pore water pressure accumulation fromthe undrained test and the rate εacc
v of volumetric strain accumulation from the drained test.
Four different initial mean pressures p0 and three different amplitude-pressure-ratios ζ = qampl/p0
were tested. The pressure-dependence of K is well described by Eq. (5) with constants A = 440and n = 0.50. K seems not to depend on amplitude. The bulk moduli obtained for the fine sandare of similar magnitude as those measured for a medium coarse sand (Wichtmann et al [5]).
In future, the dependence of bulk modulus K on the void ratio and on the average stress ratioηav = qav/pav will be inspected experimentally. Furthermore, it is intended to develop a simplifieddetermination procedure for K based on oedometric test data.
Prediction of drained and undrained cyclic behaviour of a fine sand using a high-cycleaccumulation model 11
ACKNOWLEDGEMENT
This experimental study has been performed within the framework of the project ”Geotechnicalrobustness and self-healing of foundations of offshore wind power plants” funded by the GermanFederal Ministry for the Environment, Nature Conservation and Nuclear Savety (BMU, ProjectNo. 0327618). The authors are grateful to BMU for the financial support. The cyclic triaxialtests have been performed by the laboratory technician H. Borowski.
References
[1] A. Niemunis, T. Wichtmann, and T. Triantafyllidis. A high-cycle accumulation model forsand. Computers and Geotechnics, 32(4):245–263, 2005.
[2] K. Tokimatsu. System compliance correction from pore pressure response in undrainedtriaxial tests. Soils and Foundations, 30(2):14–22, 1990.
[3] T. Wichtmann. Explicit accumulation model for non-cohesive soils under cyclic loading. PhDthesis, Publications of the Institute of Soil Mechanics and Foundation Engineering, Ruhr-University Bochum, Issue No. 38, available from www.rz.uni-karlsruhe.de/∼gn97/, 2005.
[4] T. Wichtmann, A. Niemunis, and T. Triantafyllidis. Validation and calibration of a high-cycle accumulation model based on cyclic triaxial tests on eight sands. Soils and Foundations,49(5):711–728, 2009.
[5] T. Wichtmann, A. Niemunis, and T. Triantafyllidis. On the ”elastic” stiffness in a high-cycleaccumulation model for sand: a comparison of drained and undrained cyclic triaxial tests.Canadian Geotechnical Journal, 47(7):791–805, 2010.
[6] T. Wichtmann, B. Rojas, A. Niemunis, and Th. Triantafyllidis. Stress- and strain-controlledundrained cyclic triaxial tests on a fine sand for a high-cycle accumulation model. In Proc.
of the Fifth International Conference on Recent Advances in Geotechnical Earthquake Engi-
neering and Soil Dynamics, San Diego, USA, 2010.