undrained stability of braced excavations in clay · drained shear strength in the retained soil....
TRANSCRIPT
izes theinclude
failurent andthe rangee for theyses forndrained
in literature
Undrained Stability of Braced Excavations in ClayBoonchai Ukritchon, M.ASCE1; Andrew J. Whittle, M.ASCE2; and Scott W. Sloan, M.ASCE3
Abstract: Short-term undrained stability often controls the design of braced excavations in soft clays. This paper summarformulation of numerical limit analyses that compute rigorous upper and lower bounds on the exact stability number andanisotropic yielding, typical ofK0-consolidated clays and bending failure of the wall. Calculations for braced cuts bound the actualconditions within65%, and highlight limitations of existing basal stability equations. The analyses clarify how wall embedmebending capacity improve the stability of well braced excavations. Careful selection of mobilized strengths at shear strains in0.6–1.0% are necessary to match the predictions of anisotropic limit analyses with nonlinear finite-element predictions of failurembedded walls. Two example applications from recent projects in Boston highlight the practicality of the numerical limit analmodeling realistic soil profiles and lateral earth support systems, but also focus attention on the need for careful selection of ustrength parameters. Credible estimates of stability have also been obtained in reanalyzing a series of case studies reportedusing isotropic strength parameters derived from field vane or laboratory simple shear tests.
DOI: 10.1061/~ASCE!1090-0241~2003!129:8~738!
CE Database subject headings: Braced excavation; Stability; Clays; Finite-element method.
rhenlo
r
inod
e
id
io
–an-
ivefor-, touc-heyve-hereanrate
s, orla-
nateent
hwerm-
theci-ap-
forheol-ctlytheh
canheand
rn
u-il:
r-
iob
ngos0
-
Introduction
For deep excavations in soft clay, the design of the lateral easupport system is often controlled by stability requirements. If tfactor of safety is below an acceptable level, expensive groumodification schemes may be necessary to stabilize the soil bethe final excavated grade~e.g., O’Rourke and O’Donnell 1997!.Hand calculations of basal stability are also used for preliminaestimation of ground deformations~after Mana and Clough 1981!and may form the basis for deciding whether or not to underpadjacent structures. In current practice, there are two methused to perform stability calculations for braced excavations:~1!limit equilibrium methods; and~2! nonlinear finite-element meth-ods.
Limit equilibrium methods are widely used in design practicand include separate calculations of basal stability~based on fail-ure mechanisms proposed by Terzaghi 1943; Bjerrum and E1956! or overall slope stability~using circular or noncircular arcmechanisms! based on well established methods~Bishop 1955;Spencer 1967; Morgenstern and Price 1967!. It is often difficult toassess the accuracy of these solutions due to ad hoc assumpt~1! in selecting the shape of the failure surface;~2! in the search
1Assistant Professor, Dept. of Civil Engineering. ChulalongkoUniv., Bangkok, Thailand.
2Professor, Dept. of Civil & Environmental Engineering, Massachsetts Institute of Technology, Cambridge, MA 02139. [email protected]
3Professor, Dept. of Civil, Surveying, and Environmental Engineeing, The Univ. of Newcastle, NSW 2308, Australia.
Note. Discussion open until January 1, 2004. Separate discussmust be submitted for individual papers. To extend the closing dateone month, a written request must be filed with the ASCE ManagiEditor. The manuscript for this paper was submitted for review and psible publication on September 6, 2000; approved on November 6, 20This paper is part of theJournal of Geotechnical and GeoenvironmentalEngineering, Vol. 129, No. 8, August 1, 2003. ©ASCE, ISSN 10900241/2003/8-738–755/$18.00.
738 / JOURNAL OF GEOTECHNICAL AND GEOENVIRONMENTAL ENGIN
th
dw
y
s
e
ns:
procedures used to locate the critical surface; and~3! the approxi-mations used to solve equilibrium calculations~i.e., intersliceforce assumptions!. Further complications arise in analyzing soilstructure interactions for embedded support walls, tiebackchors, etc.
Nonlinear finite-element methods provide a comprehensframework that can evaluate multiple facets of excavation permance ranging from the design of the wall and support systemthe prediction of ground movements, and the effects of constrtion activities such as dewatering, ground improvement, etc. Tare indispensable for predicting the distribution of ground moments caused by excavations, and for simulating processes wthere is partial drainage within the soil. Excavation stability cbe assessed by either exploring the depth required to genefailure or by factoring the strength parameters of the soil~e.g.,Brinkgreve and Bakker 1991!. However, finite-element methodare rarely used as a primary source of information on stabilityduring the initial phases of design. This situation reflects the retive simplicity of limit equilibrium methods, the uncertainties isite characterization, and the difficulties in selecting appropriconstitutive models and input parameters for the finite-elemanalyses.
An alternative method for calculating stability is througupper and lower bound limit analyses. Rigorous upper and lobound collapse loads are solved numerically by linear programing methods, while spatial discretization and interpolation offield variables~i.e., lower bound stresses and upper bound veloties! are accomplished using finite-element methods. Thisproach combines the advantages of finite-element methodshandling complex geometric and loading conditions, with tpower of the plastic limit theorems for bounding the exact clapse load. The numerical limit analyses assume rigid perfeplastic soil behavior~i.e., same input strength parameters aslimit equilibrium methods!, but do not require user-defined searcprocedures to locate the critical failure mechanisms, andreadily handle mechanisms involving combined failure of tsoil and structural elements. Thus, they are more flexible
nsy
-2.
EERING © ASCE / AUGUST 2003

Fig. 1. Conventional basal stability mechanisms and notation:~a! Without wall embedment~principal stress directions Clough and Hansen 1981!;and ~b! with wall embedment
en
fl
asin
e-
op
sosf
aie
e-
os
hat
heng
xc
n-
ori-
-
d
d
uretotyd-
eser-m,riainlars
nthatele-
e-
operationally more efficient than the existing limit equilibriummethods.
The numerical limit analyses described in this paper are bason upper and lower bound formulations presented by Sloan aKleeman~1995! and Sloan~1988a!, respectively. The applicationof these methods for braced excavations is summarized briefocusing on two new features~Ukritchon 1998!: ~1! implementa-tion of structural elements; and~2! representation of undrainedstrength anisotropy. Upper and lower bound solutions provideindependent method for evaluating the accuracy of existing bastability calculations. The main focus of the current analysesdeep excavations in clay where the support wall does not exteinto an underlying bearing stratum. Recent nonlinear finitelement analyses~Hashash and Whittle 1996! provide referencesolutions to these problems by incorporating realistic modelingthe anisotropic effective stress–strain–strength properties of tycal clays ~Whittle et al. 1994!. Comparisons with these finite-element calculations provide guidance on the selection of anitropic strength parameters in the numerical limit analyseParametric studies are then used to develop design chartsevaluating the stabilizing effects of wall embedment. Practicapplication of the method is demonstrated through case studusing data published in literature.
Calculation of Basal Stability
Fig. 1 summarizes the failure mechanisms assumed in convtional limit equilibrium calculations of basal stability after Terzaghi ~1943! and Bjerrum and Eide~1956!. For excavations in anhomogeneous clay, the stability of the excavation can be mconveniently expressed in terms of the stability number,N5gH/su , whereg andsu5the average total unit weight and un-drained shear strength in the retained soil. Table 1 shows tthere are subtle differences in these two basic solutions associwith assumed values of the bearing capacity factor,Nc , the loca-tion of the vertical shear surface in the retained soil, and tinclusion of shear tractions along this plane. Simple modificatioare widely used to account for the proximity of an underlyinbearing layer@db below the excavated grade, Fig. 1~a!# and forcontrasts in undrained shear strength above and below the evated grade (suu , sub ; Table 1!. Clough and Hansen~1981! pro-
JOURNAL OF GEOTECHNICAL AND
dd
y,
nalsd
fi-
-.orls
n-
t
ated
s
a-
posed further refinements to account for undrained strength aisotropy, a well known feature of soft clay behavior~e.g., Ladd1991!, based on reference shear strengths measured at threeentations of the major principal stress (su0 , su45, andsu90; Table1!.
The effects of wall embedment are usually computed following the approach proposed by Terzaghi~1943!, Fig. 1~b!, assum-ing that failure occurs below the base of the wall and is resisteby the weight of the interior soil plug and adhesion (f s5asu)acting along the plug–wall interface. A similar approach is useby Eide et al.~1972!, Table 1, and both methods implicitly as-sume that the wall is rigid~i.e., does not yield!. O’Rourke~1993!assumes that wall embedment does not alter the basal failmechanism in the soil, but does contribute to the stability duethe elastic strain energy stored in flexure. The resulting stabilinumbers are functions of the yield moment and assumed bounary conditions at the base of the wall~Table 1!.
Numerical Limit Analyses
Fig. 2 gives a schematic summary of the numerical limit analysused for braced excavations. The lower bound formulation genates a statically admissible stress field that satisfies equilibriustress boundary conditions, and does not violate the yield criteof either the soil or structural components. In these plane straanalyses, the soil mass is discretized into three-noded trianguelements @Fig. 2~b!# assuming that the unknown stresse(sx ,sy ,txy) vary linearly within each element
sx5(i 51
3
Nisxi ; sy5(i 51
3
Nisyi ; txy5(i 51
3
Nitxyi (1)
where Ni5standard linear shape functions~e.g., Zienkiewicz1983!; and (sxi ,syi ,txyi)5stress components at nodei.
In contrast to conventional displacement-based finite-elememethods, each node is unique to a particular element such tstress discontinuities can occur along shared edges betweenments@defined by pairs of nodes, e.g., 1, 4 and 2, 6; Fig. 2~a!#.The wall is modeled using a series of two-noded beam and onnoded joint elements, Fig. 2~c!. Each node has two unknownforces,Fx , Fy and one moment,Fz . It should be noted that joint
GEOENVIRONMENTAL ENGINEERING © ASCE / AUGUST 2003 / 739
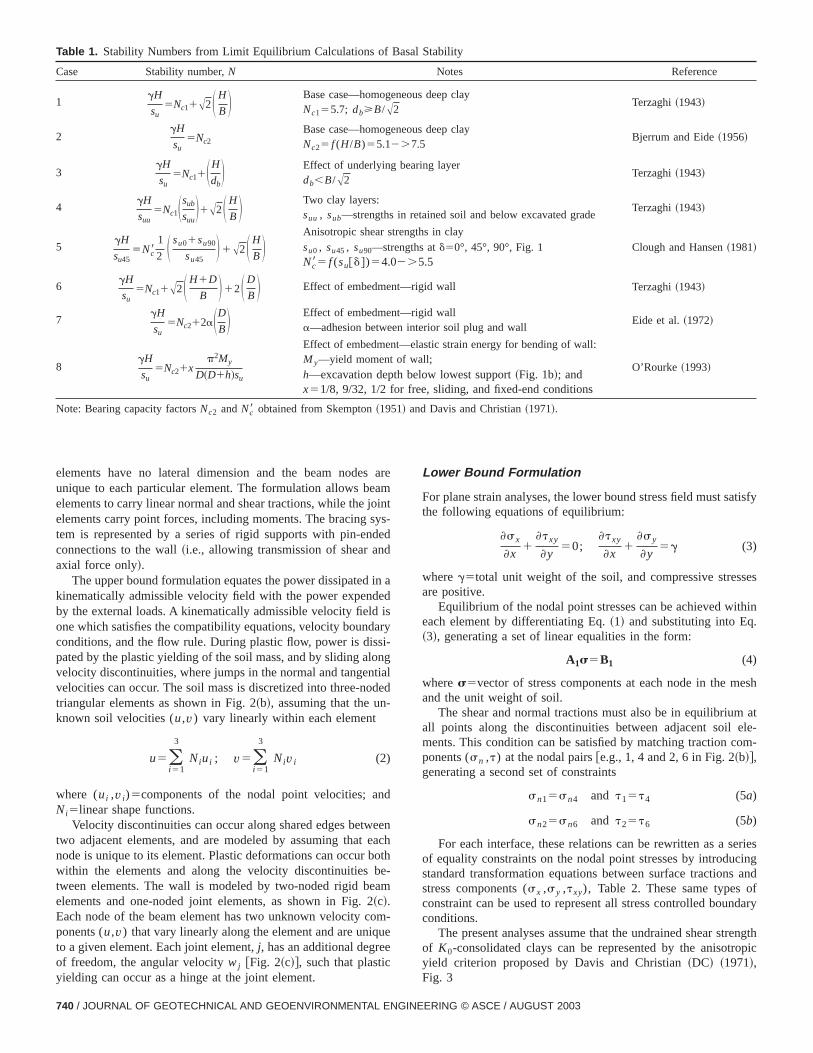
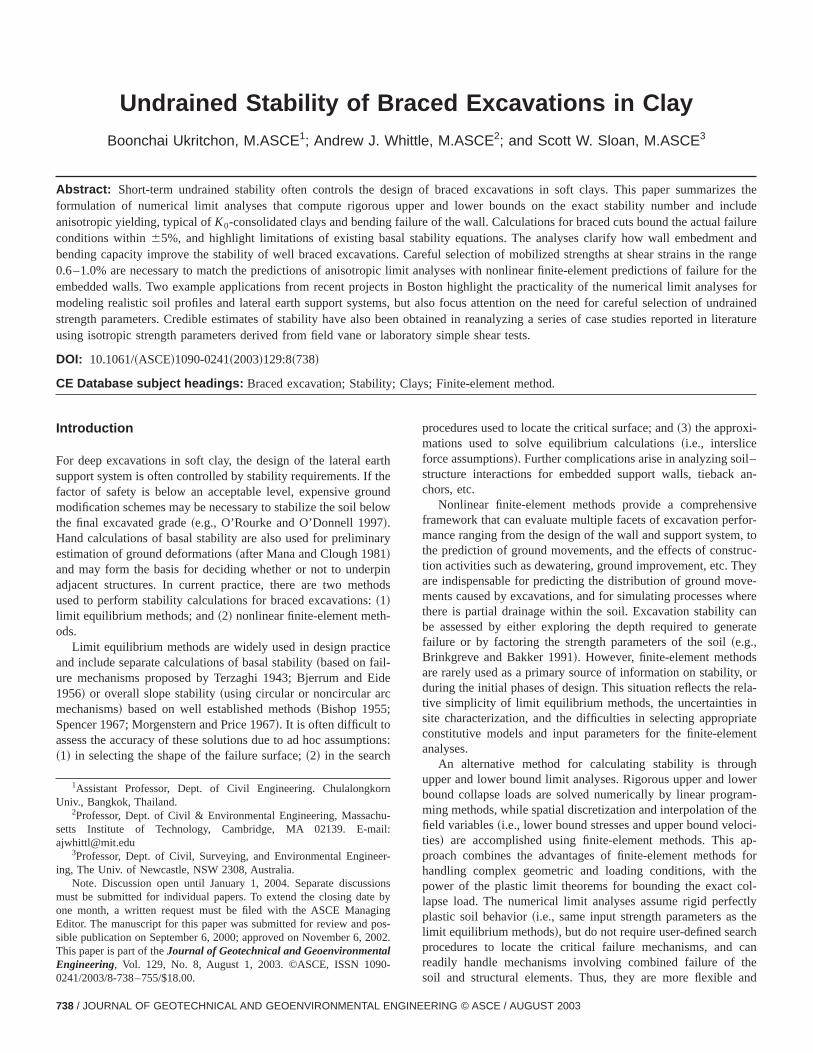
Table 1. Stability Numbers from Limit Equilibrium Calculations of Basal Stability
Case Stability number,N Notes Reference
1gH
su5Nc11A2S H
B D Base case—homogeneous deep clayNc155.7; db>B/A2
Terzaghi~1943!
2gH
su5Nc2
Base case—homogeneous deep clayNc25 f (H/B)55.12.7.5
Bjerrum and Eide~1956!
3gH
su5Nc11SH
dbD Effect of underlying bearing layer
db,B/A2Terzaghi~1943!
4gH
suu5Nc1Ssub
suuD1A2S H
B D Two clay layers:suu , sub—strengths in retained soil and below excavated grade
Terzaghi~1943!
5gH
su455Nc8
1
2 S su01su90
su45D1A2S H
B D Anisotropic shear strengths in claysu0 , su45, su90—strengths atd50°, 45°, 90°, Fig. 1Nc85 f (su@d#)54.02.5.5
Clough and Hansen~1981!
6gH
su5Nc11A2S H1D
B D12S D
B D Effect of embedment—rigid wall Terzaghi~1943!
7gH
su5Nc212aSDBD Effect of embedment—rigid wall
a—adhesion between interior soil plug and wallEide et al.~1972!
8gH
su5Nc21x
p2My
D~D1h!su
Effect of embedment—elastic strain energy for bending of wall:M y—yield moment of wall;h—excavation depth below lowest support~Fig. 1b!; andx51/8, 9/32, 1/2 for free, sliding, and fixed-end conditions
O’Rourke ~1993!
Note: Bearing capacity factorsNc2 andNc8 obtained from Skempton~1951! and Davis and Christian~1971!.
aminse
dsry-gae
ea
-m
e
isfy
es
in
sh
atle-m-
riesingandfary
ngthpic
elements have no lateral dimension and the beam nodesunique to each particular element. The formulation allows beaelements to carry linear normal and shear tractions, while the joelements carry point forces, including moments. The bracing sytem is represented by a series of rigid supports with pin-endconnections to the wall~i.e., allowing transmission of shear andaxial force only!.
The upper bound formulation equates the power dissipated inkinematically admissible velocity field with the power expendeby the external loads. A kinematically admissible velocity field ione which satisfies the compatibility equations, velocity boundaconditions, and the flow rule. During plastic flow, power is dissipated by the plastic yielding of the soil mass, and by sliding alonvelocity discontinuities, where jumps in the normal and tangentivelocities can occur. The soil mass is discretized into three-nodtriangular elements as shown in Fig. 2~b!, assuming that the un-known soil velocities (u,v) vary linearly within each element
u5(i 51
3
Niui ; v5(i 51
3
Niv i (2)
where (ui ,v i)5components of the nodal point velocities; andNi5linear shape functions.
Velocity discontinuities can occur along shared edges betwetwo adjacent elements, and are modeled by assuming that enode is unique to its element. Plastic deformations can occur bowithin the elements and along the velocity discontinuities between elements. The wall is modeled by two-noded rigid beaelements and one-noded joint elements, as shown in Fig. 2~c!.Each node of the beam element has two unknown velocity components (u,v) that vary linearly along the element and are uniquto a given element. Each joint element,j, has an additional degreeof freedom, the angular velocitywj @Fig. 2~c!#, such that plasticyielding can occur as a hinge at the joint element.
740 / JOURNAL OF GEOTECHNICAL AND GEOENVIRONMENTAL ENGIN
re
t-d
a
ld
nchth
-
Lower Bound Formulation
For plane strain analyses, the lower bound stress field must satthe following equations of equilibrium:
]sx
]x1
]txy
]y50;
]txy
]x1
]sy
]y5g (3)
whereg5total unit weight of the soil, and compressive stressare positive.
Equilibrium of the nodal point stresses can be achieved witheach element by differentiating Eq.~1! and substituting into Eq.~3!, generating a set of linear equalities in the form:
A1s5B1 (4)
wheres5vector of stress components at each node in the meand the unit weight of soil.
The shear and normal tractions must also be in equilibriumall points along the discontinuities between adjacent soil ements. This condition can be satisfied by matching traction coponents (sn ,t) at the nodal [email protected]., 1, 4 and 2, 6 in Fig. 2~b!#,generating a second set of constraints
sn15sn4 and t15t4 (5a)
sn25sn6 and t25t6 (5b)
For each interface, these relations can be rewritten as a seof equality constraints on the nodal point stresses by introducstandard transformation equations between surface tractionsstress components (sx ,sy ,txy), Table 2. These same types oconstraint can be used to represent all stress controlled boundconditions.
The present analyses assume that the undrained shear streof K0-consolidated clays can be represented by the anisotroyield criterion proposed by Davis and Christian~DC! ~1971!,Fig. 3
EERING © ASCE / AUGUST 2003

Fig. 2. Summary of numerical limit analyses for plane strain and structural elements:~a! Problem discretization;~b! plane elements of limitanalysis;~c! structural element of limit analysis; and~d! modeling for soil–structure interfaces
JOURNAL OF GEOTECHNICAL AND GEOENVIRONMENTAL ENGINEERING © ASCE / AUGUST 2003 / 741

Table 2. Linear Programming Forms for Solution of Numerical Lower and Upper Bounds
Lower bound method Upper bound method
Objective Function: Max.CTs Objective Function:
Min.
(C1Tl11C2
Tl21C3Tl32C41
T u1)
Subject to: Subject to:Equilibrium within elements A1s5B1 Linearized flow rule—soil elements A11u11A12l150Equilibrium—stress discontinuities A2s5B2 Flow rule—velocity discontinuities~soil–soil! A21u11A22l250Linearized DC yield criterion A3s<B3 Kinematics—rigid beam elements
Equilibrium structural elements A4F5B4 Flow rule—structural elements A3u250Equilibrium soil–structure interfaces A51F1A52s5B5 Flow rule—velocity discontinuities
~soil structure!A41u21A42l350
Yield of structural elements A6F<B6 Velocity boundary conditions A51u11A52u21A53l250Sign requirements A61u11A62u25B6
l1>0; l2>0; l3>0Note: s—global vector of nodal stresses and body forces~soil!. F—global vector of nodal forces and moments~structural elements!. DC—Davis–Christian~1971! anisotropic yield function.u1, u2—global vectors of nodal velocities for soil and structural elements.l1, l2, l3—global vectors of plasticmultipliers for triangular elements, velocity discontinuities~soil-soil, soil-structure!, and structural elements, respectively.
n
ynd
F5S ~sy2sx!/22h
a D 2
1S txy
b D 2
2150 (6)
where h51/2@su02su90#; a51/2@su01su90#; and b5asu45/Asu0su90.
Eq. ~6! presents the DC yield criterion as a circular locus in thetransformed stress space (X,Y)
F5X21Y22R250 (7a)
using the variables:
X51
a H 1
2~sx2sy!2hJ , Y5
txy
b, R51 (7b)
In the lower bound formulation, this nonlinear function is ap-proximated by an interior polygon, withp sides of equal length@after Lysmer~1970!#, such that statically admissible stress statessatisfy a series of linear inequality constraints
Fk5Aksx1Bksy1Cktxy2Dk<0, k51,2,...,p (8a)
Fig. 3. Anisotropic yield criterion in numerical limit analyses:~a! Anisotropic yield criterion Davis and Christian~1971!; and ~b! anisotropicshear resistance along discontinuities~parameters for BBC at OCR51.0!
742 / JOURNAL OF GEOTECHNICAL AND GEOENVIRONMENTAL ENGIN
Ak5cos~2pk/p!; Bk52cos~2pk/p!(8b)
Ck52~a/b!sin~2pk/p!; Dk52a cos~p/p!12h cos~2pk/p!
whereFk5yield function for thekth side of the polygon.Thus, the linearized yield surface introducesp constraints on
the stresses at each nodal point, written in matrix form as showin Table 2.
Equilibrium of the structural elements is readily achieved bbalancing the forces and moments within each beam element abetween the joint and beam elements
Fx j5( ~Fx,i ! (9a)
Fy j5( ~Fy,i ! (9b)
Fz j5( ~Fz,i ! (9c)
EERING © ASCE / AUGUST 2003

usnsanblend
a
ehe
thaty,a
ja-bico
ntsnts
yds
nea-d
mn
ercan
ad
d
attible
intstes
d
can
touitiesps
beiso-
ise
im-
where (Fx j ,Fy j ,Fz j) and (Fxi ,Fyi ,Fzi)5nodal forces and mo-ments of the joint element,j, and adjacent beam elements,i.
The unknown forces and moments at each joint element malso satisfy prescribed force and moment boundary conditioAll of the equilibrium equations for beam and joint elements cbe combined to form a set of equality constraints shown in Ta2 ~F is the vector of unknown forces and moments at all beam ajoint nodes!.
Fig. 2~d! summarizes the modeling of interaction betweenbeam element and two adjacent soil elements (L,R). The contacttractions from these triangular elements are (snL ,tL) and(snR ,tR) ~and vary linearly along the elements!. The lowerbound formulation requires that the net shear traction,St5tL
2tR , and the net normal tractions,Ssn5snL2snR , are appliedto the adjacent beam element. These net tractions must also bequilibrium with the unknown nodal forces and moments of tbeam element leading to a set of linear constraints
A51F1A52s5B5 (10)
Note that smooth interfaces are readily modeled by settingtL
5tR50.The current application for braced excavations assumes
failure of the wall is governed by its plastic moment capaciM p , leading to the two linear inequalities that must be satisfiedthe joints and at all points along the beam
FM15M2M p<0; FM252M2M p<0 (11)
Linear variations in the normal contact traction from the adcent soil produce internal bending moments that vary as cufunctions along each beam element. Therefore, linearizationthe yield criterion is achieved by subdividing the beam elemeinto n-internal nodes and satisfying a set of inequality constraiin the form
A6F<B6 (12)
Ukritchon ~1998! gives full details of the equation assemblfor the structural elements, together with linearization methofor yielding due to combined bending, axial and shear forces.
For braced excavations, the vertical pressure of the retaisoil, gH, is the driving force which causes failure of the excavtion. Thus, the objective function for the numerical lower bounanalysis is to minimize this vertical pressure, Min.$gH% ~orMin. $(g iHi%, for a profile withi sublayers!. The unit weightg islinked to the unknown nodal stresses through the equilibriuequations@Eqs. ~3! and ~4!#. Hence, the same objective functiocan be restated as
Max.$CTs% (13)
Table 2 summarizes the formulation of the numerical lowbound analyses in a standard linear programming form whichbe solved efficiently by an active set algorithm~Sloan 1988b!.
Upper Bound Formulation
In order to ensure a strict upper bound on the true collapse lothe DC yield function@Eq. ~7!# is approximated by an exteriorpolygon withp sides andp vertices
Fk5Aksx1Bksy1Cktxy2Dk50, k51,2,...,p (14a)
Ak5cos~2pk/p!; Bk52cos~2pk/p! (14b)Ck52~a/b!sin~2pk/p!; Dk52a12h cos~2pk/p!
This linearized form of the yield function can then be applie
JOURNAL OF GEOTECHNICAL AND
t.
in
t
t
f
d
,
to satisfy conditions of kinematic admissibility which require ththe plastic strain rates within each element must be compawith the velocity field and satisfy the associated flow rule
«x52]u
]x5l
]F
]sx5(
k51
p
lk
]Fk
]sx5(
k51
p
lkAk (15a)
«y52]v]y
5l]F
]sy5(
k51
p
lk
]Fk
]sy5(
k51
p
lkBk (15b)
gxy52S ]u
]y1
]v]xD5l
]F
]txy5(
k51
p
lk
]Fk
]txy5(
k51
p
lkCk
(15c)
where«x , «y , gxy5plastic strain rates~positive in compression!;and lk5non-negative plastic multiplier rates associated withFk .
By combining Eqs.~2! and ~15!, a kinematically admissiblevelocity field can be represented by a series of linear constraon the nodal point velocities and unknown plastic multiplier rawritten in a compact matrix form in Table 2 as
A11u11A12l150 (16)
where u1 and l15global vectors of nodal point velocities anplastic multipliers for triangular elements.
The internal power dissipation in each triangular elementalso be computed from the strain rate in Eq.~15!
Wele5EA~sx«x1sx«y1txygxy!dA5E
A(k51
p
@ lk~Aksx1Bksy
1Cktxy!#dA5EA(k51
p
@ lkDk#dA5A(k51
p
@ lkDk#5C1Tl1
(17)
whereA5area of each triangular element.The upper bound formulation allows velocity discontinuities
occur along shared edges between elements. These discontinare defined in terms of tangential and normal velocity jum(Dui j ,t ,Dui j ,n) between nodal pairs (i , j ), Fig. 2
Dui j ,t5~uj2ui !cosu1~v j2v i !sinu (18a)
Dui j ,n52~uj2ui !sinu1~v j2v i !cosu (18b)
where (ui ,uj) and (v i ,v j)5nodal velocities at nodesi and j inthe x and y directions, respectively; the sign convention foru isshown in Fig. 4.
The shear resistance along velocity discontinuities canfound by considering the associated flow directions. The antropic DC yield criterion is first written in the local (n,t) coordi-nate frame
F5S qtn cos 2u2t tn sin 2u2h
a D 2
1S qtn sin 2u1t tn cos 2u
b D 2
21
50 (19)
where the shear stress componentsqtn5(s tt2snn)/2 (s tt ,snn5normal stresses in thet and n directions! and t tn can befound by standard frame rotation.
Eq. ~19! represents an ellipse rotated counterclockwthrough 2u with respect to the (qtn ,t tn) frame. For undrainedanalyses, the incompressibility condition with associated flowposes an additional constraint on the normal velocity jump
GEOENVIRONMENTAL ENGINEERING © ASCE / AUGUST 2003 / 743

Fig. 4. Velocity discontinuities in upper bound analysis:~a! Notation; and~b! positive sign convention for slip (Dut)
is-nd
uitye-
ed
r
ity
na-ig.ntsree
stic
,
om-
y,
r
744 / JOURNAL OF GEOTECHNICAL AND GEOENVIRONMENTAL ENGIN
The internal dissipation of work along a velocity discontinucan then be computed as follows:
Wdis5E0
L
t tnDutdt5E0
L
t tn~ l12l2!dt
5E0
L
~ ut1ul11ut2ul2!dt5C2Tl2 (25)
whereL5length of the discontinuity.The upper bound formulation treats the wall using a combi
tion of two-noded rigid beam and one-noded joint elements, F2~c!. The beam nodes have two unknown velocity compone(u,v) that are unique to each element, while the joints have thdegrees of freedom (uj ,v j ,wj), wherewj is the angular velocity.Velocities vary linearly along the beam elements, and plabending failure can occur in the adjacent joints.
Rigid motions of a beam [email protected]., with nodes 1 and 2Fig. 2~c!#, with general orientationu, are ensured by specifyingthat there is no change in their longitudinal velocity~see Table 2!:
~cosuu11sinuv1!2~cosuu21sinuv2!50 (26)
while the angular velocity between nodes 1 and 2 can be cputed as
w1 – 251
L$2u2 sinu1v2 cosu1u1 sinu2v1 cosu% (27)
whereL5length of the beam element.In order to satisfy the conditions of kinematic admissibilit
the jump in velocities between beam–joint nodal [email protected]., j, 2,Fig. 2~c!# must satisfy the associated flow rule
Du2 j ,t5u2t2ujt50 (28a)
Du2 j ,n5u2n2ujn50 (28b)
Dw2 j5w1222wj5(k51
2
lk
]FMk
]M(28c)
whereDu2 j ,t , Du2 j ,n , andDw2 j5normal, tangential, and angulavelocity jumps between the joint–beam nodal pair;FMk and lk
Dui j ,n5 «nn50 (20a)
«nn1 « tt50; « tt50 (20b)
~ « tt2 «nn!
25l
]F
]qtn50 (20c)
where « tt , «nn5normal strain rates in thet and n directions,respectively.
Eq. ~20c! represents a condition for defining the shear restance along a velocity discontinuity. By solving this equation asubstituting back in Eq.~19!, anisotropic yield introduces twopossible values of shear resistance along a given discontin@Fig. 3~b!#: ~1! t tn5ut1u, corresponds to the slip in the positivdirection, while~2! t tn52ut2u, corresponds to slip in the negative direction, with sign convention shown in Fig. 4~b!:
ut1u5Uh sin 2u2Aa21b22a2 cos 4u1b2 cos 4u
2 U (21a)
ut2u5Uh sin 2u1Aa21b22a2 cos 4u1b2 cos 4u
2 U (21b)
Thus, two yield envelopes associated with these states are
Envelope No. 1: F15t tn2ut1u50 (22a)
Envelope No. 2: F252t tn2ut2u50 (22b)
The flow directions of these yield envelopes are given by
Dut5( li
]Fi
]t tn5l12l2 (23a)
Dun50 (23b)
where l1 , l25non-negative plastic multiplier rates associatwith the yield envelopes,F1 andF2 , respectively.
Eqs.~18! and ~23! can be combined to form a series of lineaconstraints, written in matrix form as
A21u11A22l250 (24)
wherel25vector of plastic multipliers for velocity discontinuities~i.e., soil–soil and soil–structure interfaces!.
EERING © ASCE / AUGUST 2003

q.oint
by
inth
atede--yain
d
nt
gachcity
ndel-
inerna
ni-o-
ralities
bying
tingions
ore
heresionsible
forser-butthefele-eo-
f ve-of
po-lem
tantu-rom
sta-
of
the
abletes
ility
idear-rumos.ven-In-cha-pth,tlso
rigid-
(>0)5yield criterion@positive and negative plastic moments, E~11!# and associated plastic multipliers that can occur at the jelement.
Eqs.~26!–~28! can be expressed in a compact matrix forma set of linear equality constraints
A3u250 (29a)
A41u21A42l350 (29b)
whereu25vector of velocity components for the beam and joelements; andl35vector of plastic multipliers associated witbending failure of these elements.
The interfaces between structural and soil elements are treas velocity discontinuities, following the same assumptionsscribed between soil elements~no restriction on sign of the tangential velocity jump!. Table 2 shows that kinematic admissibilitfor these interfaces can be achieved through a set of constranalogous to Eq.~24!
A51u11A52u21A53l250 (30)
whereu1 andu25vectors of velocity components for the soil anstructural elements, respectively; whilel25vector of plastic mul-tipliers for soil–soil and soil–structure interfaces.
Finally, the plastic work due to hinge formation in the joielements can be computed from
Ws5MDw2 j5M p~ l1k1l2k!5C3Tl3 (31)
The total internal power,Wi , can be computed by summinthe dissipation that occurs due to plastic deformation within eof the soil elements, plastic shearing along each of the velodiscontinuities~soil–soil and soil–structure interfaces!, and in theformation of plastic hinges at joint elements
Wi5Wele1Wdis1Ws5C1Tl11C2
Tl21C3Tl3 (32)
External work,We , is done by external surface tractions athe ~vertical! gravitational body forces that can be defined atemental and global levels as follows:
Element level: We5ELTiuidL2E
AgvdA (33a)
Global level: We5C41T u12gC42
T u1 (33b)
An upper bound on the true collapse load can then be obtaby equating the total internal power dissipation and the extework
2gC42T u15Wi2C41
T u1 (34)
Stability problems for braced excavations~no applied sur-charge! can be solved by setting the objective function to mimize the unit weight of the soil. This is accomplished by intrducing the constraint:
C42T u1521 (35)
Hence, the objective function can be stated as Min.$Wi
2C41T u1% as shown in Table 2, while Eq.~35! can be combined
with other velocity boundary conditions for soil and structuelements to form a set of constraints on the nodal point veloc
JOURNAL OF GEOTECHNICAL AND
d
ts
dl
A61u11A62u25B6 (36)
The solution of numerical upper bound analyses is solvedusing the active set algorithm to the standard linear programmform listed in Table 2.
Fig. 5 shows typical finite-element meshes used for compuupper and lower bounds on the stability of braced excavat~connections between soil and structural elements are mclearly shown in Fig. 2!. The lower bound analyses@Fig. 5~b!# usea very high density of elements around the base of the wall wrotations of principal stress directions are expected. Extenelements are introduced in order to ensure statically admissolutions at all points within a deep clay layer~half-space!. Theseelements require special forms of the constraint equationsequilibrium and yield~Sloan et al. 1990!. The current analyseuse two limiting values of adhesion along the soil–wall intfaces,a50 and 1 corresponding to smooth and rough walls,place no constraints on the normal tractions. The mesh forupper bound analysis@Fig. 5~a!# is based on a uniform density orectangular elements each subdivided into four triangularments. There is apparently little advantage in more complex gmetric arrangements, presumably due to the large number olocity discontinuities permitted in the analysis. The dimensionsthe discretized domain must only be sufficient to contain alltential failure mechanisms, enabling reductions in the probsize by truncating the far-field~zero-velocity! boundaries, Fig.5~a!. Both upper and lower bound calculations assume a consvalue,p524, for the yield surface linearization. Typical comptation times for the analyses reported in this paper range f10–30 min of CPU on a DEC workstation~Alpha 3000-300x!.
Results
Homogeneous Isotropic Clay
Fig. 6 summarizes upper and lower bound predictions of thebility number, N5gH/su , for well braced cuts~i.e., no failureconsidered for bracing system! in a deep homogeneous depositclay over a wide range of width to depth aspect ratios,B/H.These analyses describe isotropic yielding of the clay usingTresca [email protected]., h50, a5b50.5 in Eqs.~6! and ~7!#, andinclude calculations for rough~a51! and smooth~a50! soil–wall interfaces. In all cases, the numerical limit analyses areto bound the stability number within65%. The results show thafor narrow excavations (H/B>3), the interface roughness causa 5–10% increase in the predicted value ofN, but has minimaleffect on the stability of wide excavations (B/H>5). Fig. 6 alsoshows the stability numbers computed using the basal stabequations of Terzaghi~1943! and Bjerrum and Eide~1956! ~Table1!. The basal stability mechanism proposed by Terzaghi~1943!corresponds to an upper bound on the actual stability of wexcavations, but significantly overestimates the stability of nrow excavations. In contrast, the assumptions used by Bjerand Eide~1956! are conservative for all excavation aspect ratiDifferences between the numerical limit analyses and the contional basal stability calculations are not entirely surprising.spection of the upper bound results shows that the failure menisms in a deep clay layer depend on both the excavation deH, and its width@in contrast, Fig. 1~a! shows mechanisms thadepend only onB#, while increases in the interface adhesion aincrease the size of the failure zone in the retained soil.
Fig. 7 presents further comparisons for cases where abedrock layer is located at a depth,db /H51.0, below the exca
GEOENVIRONMENTAL ENGINEERING © ASCE / AUGUST 2003 / 745

Fig. 5. Finite-element meshes used in upper and lower bound limit analyses of braced excavations:~a! Typical upper bound mesh; and~b! typicallower bound mesh
it%
-enit
or
ed-
thet
unc-
ases,
ro-
vated grade. The numerical limit analyses show that the proximof the bedrock increases the stability number by up to 10–20for wide excavations (B/H52 – 5), but has no effect on the stability of narrow excavations. These effects are readily explainby the constraints of the bedrock on the extent of the failure zobeneath the excavation. The lower bound solutions coincide wthe modified stability number computed by Terzaghi~1943! forB/H>A2 ~case 3; Table 1!.
Effects of Wall Embedment
Fig. 8 illustrates the effects of wall embedment for an excavatiwith aspect ratio,B/H52.66 in a deep homogeneous clay laye
746 / JOURNAL OF GEOTECHNICAL AND GEOENVIRONMENTAL ENGIN
y
deh
n
~assuming full adhesion along the wall–soil interface,a51!. Nu-merical limit analyses are shown for two characteristic embment depths,D/H52/3 ~‘‘shallow’’ ! and 2.0~‘‘deep’’ !. In theseanalyses, the failure of the embedded wall is controlled byplastic bending moment,M p . Dimensional analyses show thathe stability number of the excavation can be expressed as a ftion of the relative strength parameter,M p /(suD2), and the em-bedment ratio,D/H. Upper and lower bound predictions coverwide range of the relative strength parameter and, in all cabound the true stability number within65%. The results showthat the stability number increases with embedment ratioD/Hand with the relative strength parameter,M p /(suD2). The solu-tions converge to a unique stability number, similar to the ze
EERING © ASCE / AUGUST 2003
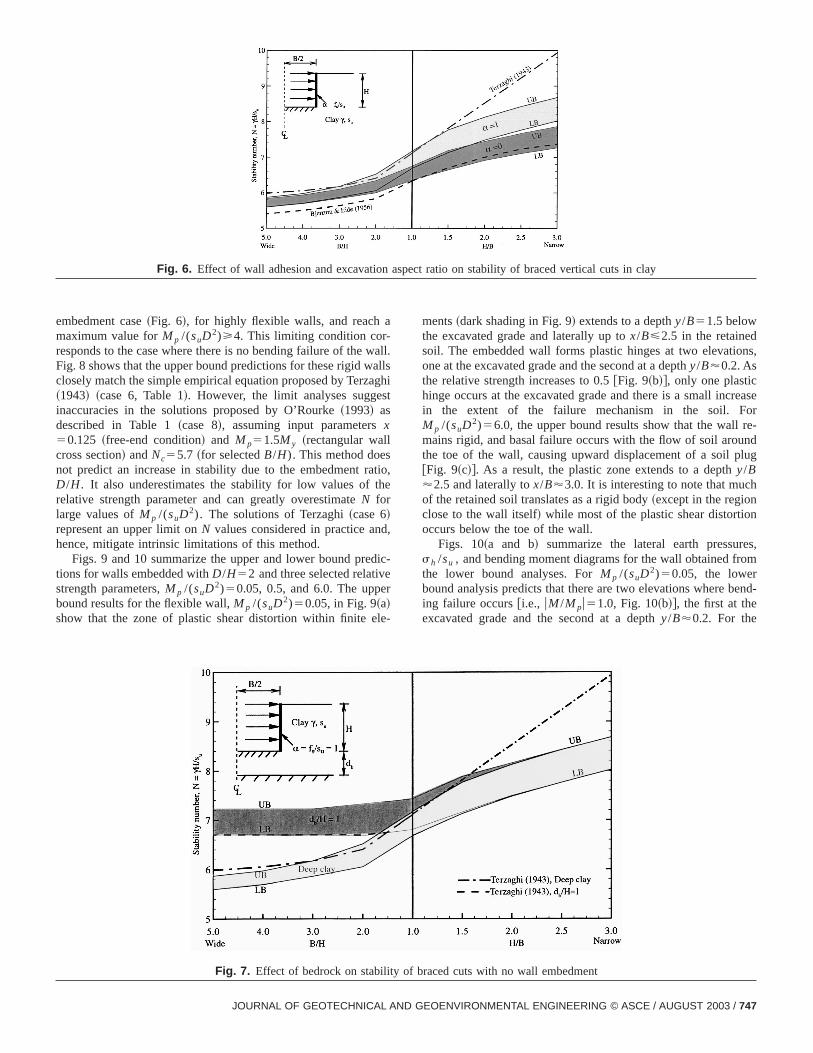
Fig. 6. Effect of wall adhesion and excavation aspect ratio on stability of braced vertical cuts in clay
allght
tioe
,
ic
e-
ns,
easer
e-d
ug
s,m
nd-
embedment case~Fig. 6!, for highly flexible walls, and reach amaximum value forM p /(suD2)>4. This limiting condition cor-responds to the case where there is no bending failure of the wFig. 8 shows that the upper bound predictions for these rigid waclosely match the simple empirical equation proposed by Terza~1943! ~case 6, Table 1!. However, the limit analyses suggesinaccuracies in the solutions proposed by O’Rourke~1993! asdescribed in Table 1~case 8!, assuming input parametersx50.125 ~free-end condition! and M p51.5M y ~rectangular wallcross section! andNc55.7 ~for selectedB/H). This method doesnot predict an increase in stability due to the embedment raD/H. It also underestimates the stability for low values of threlative strength parameter and can greatly overestimateN forlarge values ofM p /(suD2). The solutions of Terzaghi~case 6!represent an upper limit onN values considered in practice andhence, mitigate intrinsic limitations of this method.
Figs. 9 and 10 summarize the upper and lower bound predtions for walls embedded withD/H52 and three selected relativestrength parameters,M p /(suD2)50.05, 0.5, and 6.0. The upperbound results for the flexible wall,M p /(suD2)50.05, in Fig. 9~a!show that the zone of plastic shear distortion within finite el
Fig. 7. Effect of bedrock on stability of braced cuts with no wall embedment
JOURNAL OF GEOTECHNICAL AND
ll.si
,
-
ments~dark shading in Fig. 9! extends to a depthy/B51.5 belowthe excavated grade and laterally up tox/B<2.5 in the retainedsoil. The embedded wall forms plastic hinges at two elevatioone at the excavated grade and the second at a depthy/B'0.2. Asthe relative strength increases to 0.5@Fig. 9~b!#, only one plastichinge occurs at the excavated grade and there is a small incrin the extent of the failure mechanism in the soil. FoM p /(suD2)56.0, the upper bound results show that the wall rmains rigid, and basal failure occurs with the flow of soil arounthe toe of the wall, causing upward displacement of a soil pl@Fig. 9~c!#. As a result, the plastic zone extends to a depthy/B'2.5 and laterally tox/B'3.0. It is interesting to note that muchof the retained soil translates as a rigid body~except in the regionclose to the wall itself! while most of the plastic shear distortionoccurs below the toe of the wall.
Figs. 10~a and b! summarize the lateral earth pressuresh /su , and bending moment diagrams for the wall obtained frothe lower bound analyses. ForM p /(suD2)50.05, the lowerbound analysis predicts that there are two elevations where being failure [email protected]., uM /M pu51.0, Fig. 10~b!#, the first at theexcavated grade and the second at a depthy/B'0.2. For the
GEOENVIRONMENTAL ENGINEERING © ASCE / AUGUST 2003 / 747

Fig. 8. Effects of wall embedment on stability of braced excavations in deep clay layer
tass-re
re
e t
lieoill eho
cu-epam-eeter
ide
e
ritygseen
intermediate case (M p /(suD2)50.5), bending failure occurs athe excavated grade only, while there is no failure for the cwith M p /(suD2)56.0 (Mmax/Mp'0.7). These results are consitent with the locations of plastic hinges computed in the corsponding upper bound analyses@Figs. 9~a–c!#. Bending failure ofthe embedded wall causes a large reduction in the lateral psures transmitted from the retained soil@Fig. 10~a!#, but has littleeffect on the resisting pressures which are similar in magnitudconventional Rankine passive pressures~i.e., assumingshp
5@gy12su# wherey is the depth below the excavated grade!.
Development of Design Charts
The principal advantage of the proposed numerical analysesin their ability to compute stability for more complex layered sprofiles and lateral earth support systems. The computationaficiency of the technique also makes it a very attractive met
simple
gH
su5
~21p!S B
HD 1b21b3A4 M p
suD2S D
HD 1S M p
suD2D S D
HD 2H c2S D
HD S H
BD 2
1c3A~D/H !
~H/B!J
B
H1a21A M p
suD2S D
HD H a3S D
HD 1a4AS D
HD J
(37)
Although Eq.~37! is rather cumbersome, Fig. 11 shows that it produces an excellent fit to the numerical data and reduces to aformat for the zero-embedment case (D/H50):
gH
su5
~21p!~B/H !1b2
~B/H !1a2(37a)
whereb256.10 anda250.61.
748 / JOURNAL OF GEOTECHNICAL AND GEOENVIRONMENTAL ENGIN
e
-
s-
o
s
f-d
for developing design charts. For example, the preceding callations consider the effects of wall embedment in a dehomogeneous clay layer. There are three dimensionless pareters that govern the stability number for this situation: Thaspect and embedment ratios and the relative strength param~full adhesion is assumed along the wall–soil interfaces!. Upperand lower bound analyses have been performed over wranges of these parameters,H/B50.2– 3.0, D/H50 – 2, andM p /(suD2)50.001– 6 ~i.e., all cases involving bendingfailure!. In all cases, the numerical solutions bound thexact stability number within65% ~and in many cases aremore accurate than this!. The average of the upper and lowebound solutions provides the best estimate of the stabilnumber and can be interpreted using empirical curve fittintechniques based on dimensional analyses. In theexamples, the resulting empirical equations require sevcoefficients:
EERING © ASCE / AUGUST 2003

Fig. 9. Upper bound failure mechanisms predicted for walls with deep embedment,D/H52 in homogeneous, isotropic clay~with H/B50.375) ~arrows indicate velocity vectors, shaded region indicates plastic distortion within elements!
oe
t
ti
yi-
a
g,
ed
e
-a
Role of Anisotropy
The preceding results are based on the assumption that thedrained shear strength of the clay is isotropic. In reality, most sclays exhibit undrained strength anisotropy due to thK0-consolidation history. For example, Ladd~1991! reports mea-surements of undrained strength ratios measured in laboratriaxial ~compression and extension;suTC , suTE) and direct simpleshear tests (suDSS5th max) on a wide range ofK0-normally con-solidated clays. The results show that typical strength rasuTE /suTC50.50 to 0.75 andsuDSS/suTC50.65 to 0.85. More de-tailed measurements of undrained strength anisotropy can betained using sophisticated laboratory shear devices such astorsional shear hollow cylinder or directional shear cell~DSC!.
Fig. 12 shows data from a series of five DSC undrained plastrain shear tests onK0-normally consolidated Boston blue cla@~BBC!, Whittle et al. 1994#. The specimens were first consoldated underK0 conditions (K050.53; svc8 is the consolidationvertical effective stress! and then sheared by imposing princip
JOURNAL OF GEOTECHNICAL AND
un-ftir
ory
os
ob-the
ne
l
stress increments oriented at angle,d inc , to the original directionof deposition. Tests performed atd inc50 and 90° correspond tothe undrained plane strain active and passive modes of shearinwhile intermediate values ofd inc cause continuous rotation ofprincipal stress directions. The data are presented in a normalizshear stress space (t,q50.5$sv82sh8%) such that the undrainedshear strength,su5max$Aq21t2%. The undrained strength ratiosrange from a maximum,su0 /svc8 50.34, in plane strain activeshearing to a minimum,su90/svc8 50.17, in the plane strain pas-sive mode~d590°!. The peak shear strength in the active modeoccurs at small shear strains (g5@ «12 «3#'0.6%), while rela-tively large strains are required to mobilize the passive resistanc~g.5%!. Although the locus of peak strength conditions is verywell described by the three-parameter DC yield function~Fig.12!, it is not clear how the variations in strength mobilization withshear direction should be considered in the numerical limit analyses. One possibility is to consider the mobilized strengths atselected level of shear strain@similar to the ‘‘strain compatibility
GEOENVIRONMENTAL ENGINEERING © ASCE / AUGUST 2003 / 749

Fig. 10. Summary of lower bound predictions for deep wall embedment,D/H52 in homogeneous, isotropic clay~with H/B50.375): ~a!Contact normal traction,sh /su ; and ~b! moment diagram,M /M p
sloc
enldea
eaisonFof
g th
s of4
ah,r-
ts
approach’’ proposed by Ladd~1991!#. For example, Fig. 12 showthe measured data and corresponding best-fit DC yieldcorresponding to shear strain levels,g50.6 and 1.0%~see alsoSeah 1990!. Finally, one should note the large difference betwethe three anisotropic yield loci in Fig. 12 and the isotropic yiesurface selected as the ‘‘average’’ undrained strength ratio msured in laboratory direct simple shear tests,suDSS/svc8 50.21.
Comparisons With Nonlinear Finite-Element Analyses
One method for evaluating the selection of anisotropic shstrengths in the numerical limit analyses is through comparwith more comprehensive nonlinear finite-element analyses.example, Hashash and Whittle~1996! have presented results ofinite-element analyses for idealized braced excavations, usinMIT-E3 effective stress soil model~Whittle and Kavvadas 1994!
Fig. 11. Parametric representation of embedment depth effec
750 / JOURNAL OF GEOTECHNICAL AND GEOENVIRONMENTAL ENGIN
i
-
r
r
e
to describe the anisotropic stress–strain–strength propertiethe clay~BBC parameters were presented by Whittle et al. 199!.Their calculations consider an excavation with width,B540 m,in a deep layer of clay. The excavation is supported byheavily reinforced 0.9 m thick diaphragm wall with total deptL(5H1D)512.5 m– 60 m and braced by rigid struts. The cu
Fig. 12. Anisotropic yield ofK0 normally consolidated Boston BlueClay in undrained plane strain shearing
EERING © ASCE / AUGUST 2003

Fig. 13. Nonlinear finite-element analyses of idealized excavation using the MIT-E3 model~Hashash and Whittle 1996!
ntea
ad-
saster
rinxi-l
ons
ith
t
d in
the
eri-
der-ent
te-e
rent comparisons focus on finite-element calculations where:~1!the struts are installed at grade with a vertical spacing,h52.5 m; and~2! the soil profile is characterized by a constaoverconsolidation ratio of 1.0, such that the undrained shstrength varies linearly with depth as shown in Fig. 13~i.e., theundrained strength ratio is constant for a given direction of loing, d, and mobilized shear strain,g!. In the original finite-element analyses, the excavation was performed as a seriediscrete 2.5 m steps and the diaphragm wall modeled as an elmaterial. Failure was defined when there was inadequate numcal convergence~due to large incremental soil deformations!within a specified excavation step, and was refined by considethe maximum bending moment in the wall. Given these appromations, the failure depths,H f , can only be reported to a verticaresolution of 2.5 m.
Numerical limit analyses of these same idealized excavati
gth in
Fig. 14. Comparison of numerical limit analyses and finite-element predictions of failure depths as functions of diaphragm wall lennormally consolidated Boston blue clayJOURNAL OF GEOTECHNICAL AND
r
ofici-
g
have assumed that the diaphragm wall is heavily reinforced wM p52.0 MNm/m. Upper and lower bound predictions ofH f havebeen performed for four undrained strength profiles:~1! peak an-isotropic shear strengths;~2! anisotropic strengths mobilized ag50.6%; ~3! anisotropic strengths mobilized atg51%; and~4!isotropic strengths based on undrained strength ratios measuredirect simple shear~DDS! tests (suDSS/svc50.21; Fig. 12!. Fig.14 summarizes the computed failure depths as functions ofwall length, L. For the shorter walls (L,20 m), there is verygood matching between the finite-element results and the numcal limit analyses based on strength mobilized atg50.6%. How-ever, for the longer walls, the same assumption leads to an unestimate of the finite-element failure depths, and better agreemis achieved at a mobilized straing51.0%. This behavior is con-sistent with characteristic shear strains reported in the finielement analyses by Hashash~1992! since larger shear strains ar
GEOENVIRONMENTAL ENGINEERING © ASCE / AUGUST 2003 / 751

1.03
Table 3. Numerical Limit Analyses of Basal Stability for Braced Excavations Published in the Literature
ParametersVaterland
No. 3 Mexico City
Davidson Ave. HDR-4 Chicago
TaipeiNo. 1 No. 2 CD 152 CD 162
H (m) 9.0 9.0 9.1 7.3 7.9 12.2 13.45
B (m) 11.0 7.0 7.6 7.6 12.2 12.2 25.8
L (m) 11.0 18.2 13.7 13.7 19.2 19.2 24.0
db (m) 15.0 — — — 14.1 9.8 —
Wall: SPW SPW SPW SPW SPW SPW DWPZ32 Z section PZ32 PZ32 PZ40 PZ40 0.9 m
M p (MNm/m) 0.56 0.45 0.64 0.64 0.73 0.73 1.50
Factor of safety~lower boundto upper bound!Isotropic 1.27–1.38 1.20–1.31 1.15–1.12 0.88–0.96 1.09–1.18 1.12–1.22 0.95–Anisotropic 1.12–1.21 1.13–1.23 1.24–1.32Source forsu : Field vane CK0UDSS UU UU Field vane Field vane
~Covarrubias 1994! CK0UC/E CK0UC/E
~Finno and Chung 1992!Observed behavior No failure No failure No failure Failure No failure No failure Failure
dwall (cm) 10–13 cm 10–15 cm 10–25 cm 15–17 cm 15–17 cm
References Norwegian Technical Institute~1962!
Rodriguez and Flamand~1969!
Clough and Reed~1984!
Finno et al.~1989!
Su et al.~1998!
lsonise
th-
ne
w
SS
re
al.
-itysticbi-
mobilized prior to failure as wall length increases. Fig. 14 ashows that calculations of failure depths based on the peak atropic strength envelope grossly overestimate the finite-elempredictions. The isotropic limit analyses slightly overestimatereference values ofH f from these finite-element analyses. However, this happy coincidence does not substantiate the geapplication of isotropic strength approximations!
Fig. 14 includes predictions ofH f based on the empirical limitequilibrium calculations proposed by Terzaghi~1943!. These cal-culations use depth-averaged shear strengths above and belo
Fig. 15. Cross section and undrained strength profile of braced excavation in South Boston
752 / JOURNAL OF GEOTECHNICAL AND GEOENVIRONMENTAL ENGI
o-nte
ral
the
excavated grade, for reference undrained strength ratios in Dand plane strain passive modes of shearing (suDSS andsu90). It isnot surprising that these calculations overestimate the failudepths for very long walls~where wall flexibility and bendingfailure are ignored!. However, the results also show substantioverestimation for all wall lengths based on the DSS strengths
Overall, the results in Fig. 14 highlight the difficulties in selecting undrained strength parameters for anisotropic stabilanalyses of braced excavations. The results confirm that realipredictions can be obtained by considering the strengths mo
NEERING © ASCE / AUGUST 2003

bleisco.high
y by
rs
rent
hen:
-in
Fig. 16. Upper bound failure mechanism for braced excavationSouth Boston, isotropic strength profilen
bile
edosl-
o o
n
-ei
s of
nfail-sr
lee
va-
owoopicopics
eakm-un-
en-
JOURNAL OF GEOTECHNICAL AND
-
s-
f
-
cases, while UU triaxial tests were the only information availato reanalyze the two sections on Davidson Ave. in San FrancCalculations for the Mexico City case were based on recentquality DSS tests on undisturbed samples~Covarrubias 1994! inpreference to the more scattered UU tests published originallRodriguez and Flamand~1969!. Finno and Chung~1992! and Suet al. ~1998! published ~peak! anisotropic strength parametefrom laboratory triaxial tests (CK0UC and CK0UE) and thesehave been used to define the DC yield criterion in the curplane strain limit analyses~i.e., assumingsuTC5su0 and suTE
5su90, andsuFV5su45).The factor of safety~FS! against basal stability is based on t
definition conventionally defined in the slope stability calculatioFS5su /sum (5tanf8/tanfm8 5c8/cm8 , wherec8, f85the apparentcohesion and internal friction angle,cm8 , fm8 5the mobilized val-ues of these parameters for drained soil layers!. Numerical limitanalyses optimize the loading factor,L f for vertical pressure exerted by the retained soil,P5L f@(g ihi #, whereg i , hi are theunit weight and thickness of layer,i, in the retained soil~Fig. 1!,respectively. Iterative analyses are carried out using trial valueFS in order to obtain the conditionL f'1.00.
The computedFS values for isotropic strength profiles iTable 3 are consistent with the field observations regardingure. The calculations show FS51.1–1.4 for the five sectionwhich remained stable, while FS50.88–0.96 and 0.95–1.03 fothe two failed sections~Davidson Ave. No. 2 and Taipei!. Apartfrom Davidson Ave. No. 2~where the wall rotates about a singlevel of bracing! the predicted mechanisms of failure all involvformation of plastic hinges in the wall at approximately the eletion of the lowest level of bracing.
Both sections of the HDR-4 project in Chicago had very lmargins of safety~FS'1.1–1.2! against basal failure. It is alsinteresting to note that calculations using the peak anisotrstrength parameters give very similar values of FS as the isotrcases~field vane profile!. These results contrast with previouexample calculations for normally consolidated BBC, where panisotropic strength predicted substantially higher stability nubers. This reflects the relative magnitudes of field vane anddrained triaxial shear strengths~for HDR-4, suFV50.5@suTC
1suTE#; while for BBC the previous example usessuDSS
50.4@su01su90#). Anisotropic analysis for the Taipei failur~Table 3! show FS51.23–1.32 and are clearly producing an u
pus
Fig. 17. Cross section and strength parameters for raker supported excavation on Massachusetts Institute of Technology camlized at a characteristic level of shear strain~g50.6–1.0% inthese examples!. More extensive calculations~over a range of soilprofiles and bracing systems! are required before these results cabe generalized for design.
Practical Application of Limit Analyses
Published Case Studies
Numerical limit analyses have been used to reinterpret the staity of braced excavations in clay from five projects reported in thliterature as shown in Table 3. Four of these projects involvexcavations supported by sheet pile walls and prestressed crlot struts, while the fifth used a perimeter diaphragm wall. Athough relatively large wall movements~exceeding 10 cm! andsurface settlements occurred in each of these projects, only twthe seven cross sections actually failed~Davidson Ave. No. 2 andTaipei!. The selection of undrained shear strength profiles is coditioned by the availability of data~and the prevailing local siteinvestigation practice!. Field vane data were used to provide isotropic strength profiles for the Vaterland-3, HDR-4, and Taip
GEOENVIRONMENTAL ENGINEERING © ASCE / AUGUST 2003 / 753

Fig. 18. Upper bound failure mechanism for raker supported excavation, Massachusetts Institute of Technology campus
beva
for
axixi-epthe
ngt
gtedeaf th
ter-tesionalay
va-on
al
nedid
tionde
xca
ofreteemathe
ngy;rlayofof-
e
u-a-re
ub-
oredby
onut-trythe
bydp,
iso-it-offbe-
ivehentre-
safe estimate of basal stability. This result is consistent withhavior described in the previous section for the idealized excations in BBC ~see also Whittle and Ukritchon 2000!.
Design Applications
Fig. 15 shows the cross section and proposed support systeman 18 m deep, 33 m wide excavation in Boston. The suppsystem includes a diaphragm wall that extends 6 m below thefinal grade elevation, while cross-lot struts are installed at a mmum vertical spacing of 4 m. The soil profile consists of appromately 11 m of fill materials and silty sand overlying a 31 m delayer of BBC. Fig. 15 lists the shear strength parameters foroverlying soils and compares profiles of undrained shear strefrom an extensive program of laboratoryCK0UDSS andCK0UCtests~Ladd et al. 1999! using both SHANSEP~Ladd and Foott1974! and reconsolidation test procedures together with strenprofiles derived using the MIT-E3 model from the measurstress history profile. The data consistently show minimum shresistance at 26 m–28 m depth corresponding to the base ooverconsolidated clay crust~just below the toe of the diaphragmwall!.
Limit analyses have been performed using a variety of inpretations for the undrained strength profile. Fig. 16 illustratypical upper bound results using an isotropic strength criterthat matchessuDSS of the MIT-E3 model. The results showtypical failure mechanism which extends to the base of the cwith FS51.18–1.23, and a plastic hinge in the wall at the eletion of the fourth level of bracing. Further calculations basedanisotropic peak strengths predict FS51.29–1.36 and are likely tooverestimate stability, while calculations based ong51.0% mo-bilized strengths may be more realistic and predict only a smmargin of safety with FS51.05–1.13. In practice, it is difficult toachieve further resolution using the two-dimensional~2D! stabil-ity calculations given the uncertainties in representing undraistrength anisotropy. The limit analyses can provide useful guance on the effectiveness of berms, soil mix walls, etc.~Ukritchon1998!, but other strategies to improve stability, such as excavain short panel lengths, require much more computationallymanding three-dimensional analyses~e.g., Lyamin 1999!.
Fig. 17 shows the cross section through a 12.5 m deep evation planned on the MIT campus~Olsen 2001!. Part of this verywide ~110 m! excavation is to be supported by three levelsinclined rakers reacting against a 1.2 m thick central concbase slab. The design includes a perimeter diaphragm wallbedded almost 9 m below the final grade and within the crust of26 m thick layer of BBC. The undrained shear strengths of
754 / JOURNAL OF GEOTECHNICAL AND GEOENVIRONMENTAL ENGIN
--
ort
-
h
h
re
l
-
-
-
-
lower clay at this site are notably higher than in the precediexample~a consequence of local variability in the stress historcf., Ladd et al. 1999!. Fig. 18 shows that the predicted uppebound failure mechanism again extends to the base of the clayer but is constrained inside the excavation by the presencethe base slab. The analyses predict a relatively high factorsafety, FS51.70–2.05, which is consistent with independent results of nonlinear finite-element analyses~using c-f reductionmethods; Brinkgreve and Bakker 1991!. Much lower factors ofsafety~FS51.2–1.4! are computed by limit equilibrium methodsbased on Terzaghi basal heave calculations and circular arc~rigidbody! rotation mechanisms that do not explicitly consider thconstraints imposed by the proposed bracing system.
Conclusions
This paper has described the formulation of 2D plane strain, nmerical limit analyses for modeling the stability of braced excvations in clay. Upper and lower bound estimates of collapse aformulated as linear programming problems based on earlier plications by Sloan and Kleeman~1995! and Sloan~1988a!, re-spectively. The current application includes new contributions fincorporating structural elements and modeling undrainstrength anisotropy of clays using the yield criterion proposedDavis and Christian~1971!.
Results of the limit analyses provide an independent checkthe accuracy of long established empirical equations for comping the stability number of braced excavations. For each geomeand set of material properties, the analyses are able to boundexact stability number within65%. The analyses show clearlyhow mechanisms of failure for embedded walls are governedthe ratio of their plastic moment capacity to the undrainestrength of the clay, through the dimensionless grouM p /@suD2#, whereD is the depth of wall below the excavatedgrade.
In principle, the undrained strength anisotropy of claysreadily handled within the numerical limit analyses using apprpriate anisotropic yield functions. However, the selection of suable strength parameters is a difficult task due to different ratesstrength mobilization with the direction of shearing and level oshear strain. This issue is most clearly seen in comparisonstween the limit analyses and nonlinear~displacement based!finite-element analyses that incorporate a realistic constitutmodel of the anisotropic stress–strain–strength properties. Tlimit analyses predict similar failure depths as the finite-elemecalculations when using mobilized anisotropic strengths cor
EERING © ASCE / AUGUST 2003

ram
actl
actieri-o-iencme
rigira-
is
s
es,
es
m-
f
ing
sng
.’’
g.,
d
onn-
n
d
es.
s.,
g.
.
-
.,
-d
,
sponding to shear strain levels in the range,g50.6–1.0%. Furtherstudies are needed to develop more general guidelines on paeter selection for anisotropic calculations.
Limit analyses, using available undrained strength data~as-sumed isotropic!, provide credible estimates of the stability forseries of braced excavations reported in literature, and correpredict failure that occurred in two of these cases. Recent prcal applications in Boston highlight the capabilities of the numcal limit analyses for computing stability with realistic soil prfiles and lateral earth support systems. Robustness and efficof the analyses also serve to refocus attention on the measureand interpretation of undrained strength parameters.
Acknowledgment
The upper and lower bound codes used in this paper were onally developed by the third writer with support from the Austlian Research Council.
References
Bishop, A. W.~1955!. ‘‘The use of the slip circle in the stability analysof slopes.’’Geotechnique,5, 7–17.
Bjerrum, L., and Eide, O.~1956!. ‘‘Stability of strutted excavations inclay.’’ Geotechnique,6, 115–128.
Brinkgreve, R. B. J., and Bakker, H. L.~1991!. ‘‘Nonlinear finite-elementanalysis of safety factors.’’Proc., 7th Int. Conf. on Comp. Methodand Advances in Geomechanics, Cairns, Balkema, 2, 1117–1122.
Clough, G. W., and Hansen, L. A.~1981!. ‘‘Clay anisotropy and bracedwall behavior.’’ J. Geotech. Eng. Div., Am. Soc. Civ. Eng.,107~7!,893–913.
Clough, G. W., and Reed, M. W.~1984!. ‘‘Measured behavior of bracedwall in very soft clay.’’J. Geotech. Eng.,110~1!, 1–19.
Covarrubias, S.~1994!. ‘‘Characterization of the engineering propertiof Mexico City clay.’’ SM thesis, Dept. of Civil Engineering, MITCambridge, Mass.
Davis, E. H., and Christian, J. T.~1971!. ‘‘Bearing capacity of anisotropiccohesive soil.’’J. Soil Mech. Found. Div., Am. Soc. Civ. Eng.,97~5!,753–769.
Eide, O., Aas, G., and Josang, T.~1972!. ‘‘Special application of cast-in-place walls for tunnels in soft clay.’’Proc., 5th European Conf. onSoil Mechanics and Foundation Engineering, Madrid, Spain, 1, 485–498.
Finno, R. J., Atmatzidis, D. K., and Perkins, S. B.~1989!. ‘‘Observedperformance of a deep excavation in clay.’’J. Geotech. Eng.,115~8!,1045–1064.
Finno, R. J., and Chung, C. K.~1992!. ‘‘Stress–strain–strength responsof compressible Chicago glacial clays.’’J. Geotech. Eng.,118~10!,1607–1625.
Hashash, Y. M. A.~1992!. ‘‘Analysis of deep excavations in clay.’’ PhDthesis, Dept. of Civil and Environmental Engineering, MIT, Cabridge, Mass.
Hashash, Y. M. A., and Whittle, A. J.~1996!. ‘‘Ground movement pre-diction for deep excavations in soft clay.’’J. Geotech. Eng.,122~6!,474–486.
Ladd, C. C.~1991!. ‘‘Stability evaluation during staged construction.’’J.Geotech. Eng.,117~4!, 540–615.
Ladd, C. C., and Foott, R.~1974!. ‘‘New design procedure for stability osoft clays.’’ J. Geotech. Eng. Div., Am. Soc. Civ. Eng.,100~7!, 763–786.
JOURNAL OF GEOTECHNICAL AND
-
y-
ynt
-
Ladd, C. C., Young, G. A., Kraemer, S. R., and Burke, D. M.~1999!.‘‘Engineering properties of Boston Blue Clay from special testprogram.’’Proc., ASCE Geo-Congress’98, GSP 91, 1–24.
Lyamin, A. V. ~1999!. ‘‘Three dimensional lower bound limit analysiusing nonlinear programming.’’ PhD thesis, Dept. of Civil, Surveyiand Environmental Engineering, Univ. of Newcastle, NSW.
Lysmer, J.~1970!. ‘‘Limit analysis of plane problems in soil mechanicsJ. Soil Mech. Found. Div., Am. Soc. Civ. Eng.,96~SM4!, 1311–1334.
Mana, A. I., and Clough, G. W.~1981!. ‘‘Prediction of movements forbraced cuts in clay.’’J. Geotech. Eng. Div., Am. Soc. Civ. En107~6!, 759–777.
Morgenstern, N. R., and Price, V. E.~1965!. ‘‘The analysis of the stabilityof general slip surfaces.’’Geotechnique,15~1!, 79–93.
Norwegian Geotechnical Institute.~1962!. ‘‘Measurements at a strutteexcavation, Oslo Subway, Vaterland 3.’’Tech. Rep. No. 8, NorwegianGeotechnical Institute. Blindern, Norway.
Olsen, M. B.~2001!. ‘‘Measured performance of a large excavationthe MIT campus.’’ SM thesis, Dept. of Civil and Environmental Egineering, MIT, Cambridge, Mass.
O’Rourke, T. D.~1993!. ‘‘Base stability and ground movement predictiofor excavations in soft clay.’’Retaining structures, Thomas Telford,London, 131–139.
O’Rourke, T. D., and O’Donnell, C. J.~1997!. ‘‘Deep rotational stabilityof tieback excavations in clay.’’J. Geotech. Geoenviron. Eng.,123~6!,506–515.
Rodriguez, J. M., and Flamand, C. L.~1969!. ‘‘Strut loads recorded in adeep excavation in clay.’’Proc., 7th Int. Conf. on Soil Mechanics anFoundations Engineering, Mexico City, 2, 459–467.
Seah, T. H.~1990!. ‘‘Anisotropy of normally consolidated Boston bluclay.’’ ScD thesis, Dept. of Civil Engineering, MIT, Cambridge, Mas
Skempton, A. W.~1951!. ‘‘The bearing capacity of clays.’’Proc., Build-ing Research Congress, London, 180–189.
Sloan, S. W.~1988a!. ‘‘Lower bound limit analysis using finite elementand linear programming.’’Int. J. Numer. Analyt. Meth. Geomech12~1!, 61–77.
Sloan, S. W.~1988b!. ‘‘A steepest edge active set algorithm for solvinsparse linear programming problems.’’Int. J. Numer. Analyt. MethGeomech.,26~12!, 2671–2685.
Sloan, S. W., and Kleeman, P. W.~1995!. ‘‘Upper bound limit analysisusing discontinuous velocity fields.’’Comput. Methods Appl. MechEng.,127, 293–314.
Sloan, S. W., Assadi, A., and Purushothaman, N.~1990!. ‘‘Undrainedstability of a trapdoor.’’Geotechnique,40~1!, 45–62.
Spencer, E.~1967!. ‘‘A method of analysis of the stability of embankments assuming parallel interslice forces.’’Geotechnique,17~1!, 11–26.
Su, S. F., Liao, H. J., and Lin, Y. H.~1998!. ‘‘Base stability of deepexcavations in anisotropic soft clay.’’J. Geotech. Geoenviron. Eng124~9!, 809–819.
Terzaghi, K.~1943!. Theoretical soil mechanics, Wiley, New York.Ukritchon, B. ~1998!. ‘‘Application of numerical limit analyses for und
rained stability problems in clay.’’ PhD thesis, Dept. of Civil anEnvironmental Engineering, MIT, Cambridge, Mass.
Whittle, A. J., DeGroot, D. J., Ladd, C. C., and Seah, T. H.~1994!.‘‘Model prediction of anisotropic behavior of Boston blue clay.’’J.Geotech. Eng.,120~1!, 199–224.
Whittle, A. J., and Kavvadas, M.~1994!. ‘‘Formulation of the MIT-E3constitutive model for over-consolidated clays.’’J. Geotech. Eng.120~1!, 173–198.
Whittle, A. J., and Ukritchon, B.~2000!. ‘‘Discussion of paper by Suet al.’’ J. Geotech. Geoenviron. Eng.,126~8!, 757–760.
Zienkiewicz, O. C. ~1983!. The finite-element method, McGraw-Hill,New York.
GEOENVIRONMENTAL ENGINEERING © ASCE / AUGUST 2003 / 755