analysis of different equations of undrained shear...
TRANSCRIPT
46
Analysis of different equations of undrained shear strength estimations using Atterberg Limits on Pontianak Soft Clay
Slamet Widodo, Abdelazim Ibrahim, Shen Hong
Technische Universität Bergakademie Freiberg Gustav Zeuner Strasse 1, 09599 Freiberg, Sachsen, Germany; e-mail: [email protected] or [email protected]
Many researchers have done study to estimate the value of undrained shear strength for fi ne grained soils like clay or silt.
Determining of undrained shear strength and compressibility parameters in laboratory are really tedious and time consuming.
Th erefore, a correlation between undrained shear strength and Atterberg limits is useful for restraint of testing number and costs.
Central tendency parameters such as an average, deviation standard and coeffi cient of variation are performed to analyze the
data of soft clay in Pontianak, Indonesia. Based on analysis that undrained shear strength coincides with 50 percentile of
distribution data meanwhile undrained compressive strength is around twice of cohesion for testing using unconfi ned pressure.
Th is relationship is the most familiar equation. Moreover, undrained shear strength using mean value is more realistic for
correlation between undrained shear strength and Atterberg limits on some equations from previous fi ndings.
Keywords and phrases: undrained shear strength, Atterberg limit, cohesion, soft clay.
Introduction
Undrained shear strength is a very important parameter
in engineering. Undrained shear strength is a parameter
to the bearing capacity of soil that could bear on it. Some
laboratory tests needed to obtain these values are
expensive and time consuming, while soil properties like
moisture content and Atterberg limits can be performed
faster and cheaper.
Literature Review
Bearing capacity for subsoil can be stated in some
parameters. Several sources come from research in which
correlations of the parameters were proposed. Atterberg
limits can be employed to get bearing capacity of subsoil.
By using regression analysis and central tendency para-
me ters in statistical analysis we can obtain a correlation.
Bearing Capacity of Subsoil
Th ere are some approaches to know bearing capacity of
subsoil. Undrained shear strength shows capability or
bearing capacity of soil. Relations between undrained
shear strength of soil (su) and undrained cohesion (cu) in
the case without confi ning pressure called unconfi ned
compressive strength (qu), have been proposed by some
previous research results and used as subgrade failure
criteria for pavement design as depicted in Table 1.
Table 1. Undrained unconfined compressive strength.
Researchers and/or Sources Equation
Giroud and Noiray (1981)
Barenberg (1992)
Philips (1987 )
Rodin (1965)
Roadex III (2008 )
qu = 3.14 cu
qu = 3 cu
qu = 2.8 cu
qu = 3.14 cu
qu = 4 cu
Soil consistency can be estimated using value of
unconfi ned compressive strength (Terzhagi &Peck,
1967) as shown in Table 2.
Table 2. Soil consistency.
Consistency qu (kPa)
Very soft
Soft
Medium
Stiff
Very stiff
Firm
< 24
24 – < 48
48 – < 96
96 – < 192
192 – < 383
> 383
Tow
n an
d U
rban
Pla
nnin
g A
rchi
tect
ure
and
Build
ing
Engi
neer
ing
47
Analysis of different equations of undrained shear strength estimations using Atterberg Limits on Pontianak Soft ClayAnalysis of different equations of undrained shear strength estimations using Atterberg Limits on Pontianak Soft Clay
Mohr-Coulomb equation gives a linear correlation
between normal stress and shear stress. Th is line as
criteria of Mohr-Coulomb failure is shown below:
s = c + σ tan φ (1)
where: s — shear stress (kPa);
σ — normal stress (kPa);
c — cohesion (kPa);
φ — internal friction angle (o).
Unconfi ned compressive strength test in which confi ning
pressure is equal to zero, shear shear strength (s) is
independent from confi ning pressure (σ3), so that:
s = σ1/2 = qu/2 = c (2)
where: σ1 — vertical stress (kPa);
qu — unconfi ned compressive strength (kPa).
Undrained Shear Strength and Atterberg Limits
Th e ratio of undrained shear strength of clay to
overburden stress by many researchers have been
correlated to Atterberg limits. Results for this ratio
(su/σi) are often defi ned by in the following equations.
Normally consolidated clay with a plasticity index of
more than 5%, Skempton [8] gives a linear relationship
for this ratio value to the value of plasticity index.
su/σi = 0.11 + 0.0037 Ip (3)
Bjerrum and Simons [2] present a power equation for
correlation between undrained shear strength to plasticity
index.
su/σi = 0.045 Ip 0.5 (4)
In addition, Bjerrum and Simons [2] also present another
equation between this ratio to liquid index, IL which IL
= (Wn — Wp)/(WL — Wp) and consistency index,
IC = (WL — Wn)/WL — Wp)
su/σi = 0.18 / IL 0.5 (5)
Karlsson and Viberg [5] present a linear equation
for correlation for undrained shear strength and liquid
limit.
su/σi = 0.005 WL (6)
where: WL — liquid limit (%);
Ip — plasticity index (%);
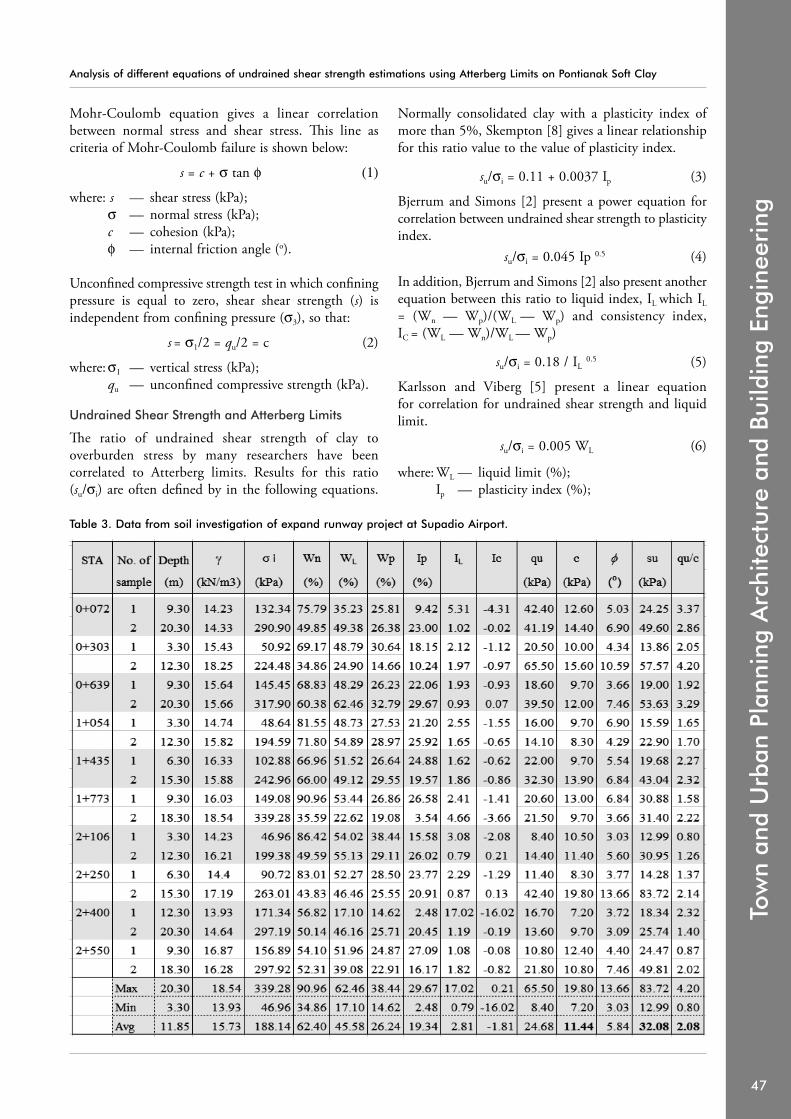
Table 3. Data from soil investigation of expand runway project at Supadio Airport.
48
Slamet Widodo, Abdelazim Ibrahim, Shen HongSlamet Widodo, Abdelazim Ibrahim, Shen Hong
su — undrained shear strength (kPa);
σi — overburden shear (kPa).
Central Tendency Parameters
Parameters of central tendency consist of the average
value, coeffi cient of variation and standard deviation [1].
Th ese parameters are relatively very familiar in calcu-
lating and analyzing of data and making conclusion
afterwards.
Average: X = Σ Xi / n (7)
Standard deviation for sample:
σ = [Σ (Xi — X)2/(n — 1)]0.5 (8)
Coeffi cient of variation: Cov = σ/X (9)
Regression analysis also will be performed to give
comparison from analysis using central tendency
parameter as mentioned above.
Data Collecting
Main data for calculation and analysis came from soil
investigation of the expand runway project of Supadio
airport in Pontianak, Indonesia. Th ere are 10 boreholes
along at left and right of existing runway having 2.250 m
length and 30 m width. It will be extended 2.550 m
length and 45 m width. Data of soil investigation for the
project is shown in Table 3.
Discussion for Analysis Results
Data shown in Table 3 above will be analyzed more
detail in the next paragraph. Herein bearing capacity of
subsoil namely unconfi ned compressive strength and
undrained shear strength are important parameters.
Bearing Capacity of Subsoil
Bearing capacity of subsoil can be expressed by using
undrained shear strength. Value of undrained shear
strength without confi ning pressure is equal to
unconfined compressive strength. This value is
theoretically twice as big as cohesion. Th e rightmost
column of Table 3 shows that the ratio unconfi ned
compressive strength to cohesion taken from laboratory
testing vary from 0.8 to 4.2 and arithmetic average is
2.08 while average of cohesion is 11.44 kPa. Based on
the data above we obtain the arithmetic average value of
unconfi ned compressive strength as bearing capacity of
this subsoil to be 23.8 kPa which it is 2.08 times as much
as cohesion. For value of unconfi ned compressive
strength around 23,8 kPa can be classifi ed as very soft
soil and almost soft soil. Standard deviation for this value
is 0.85 kPa and coeffi cient of variation is 40.86 percent.
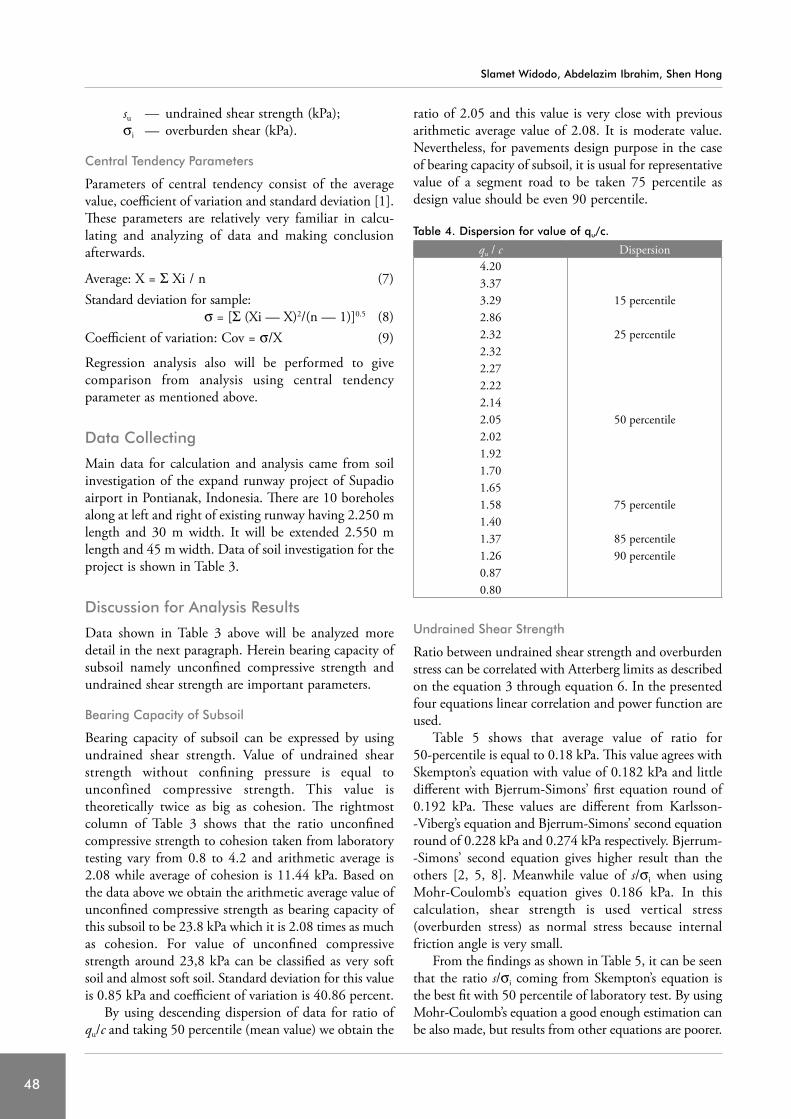
By using descending dispersion of data for ratio of
qu/c and taking 50 percentile (mean value) we obtain the
ratio of 2.05 and this value is very close with previous
arithmetic average value of 2.08. It is moderate value.
Nevertheless, for pavements design purpose in the case
of bearing capacity of subsoil, it is usual for representative
value of a segment road to be taken 75 percentile as
design value should be even 90 percentile.
Table 4. Dispersion for value of qu/c.
qu / c Dispersion
4.20
3.37
3.29
2.86
2.32
2.32
2.27
2.22
2.14
2.05
2.02
1.92
1.70
1.65
1.58
1.40
1.37
1.26
0.87
0.80
15 percentile
25 percentile
50 percentile
75 percentile
85 percentile
90 percentile
Undrained Shear Strength
Ratio between undrained shear strength and overburden
stress can be correlated with Atterberg limits as described
on the equation 3 through equation 6. In the presented
four equations linear correlation and power function are
used.
Table 5 shows that average value of ratio for
50-percentile is equal to 0.18 kPa. Th is value agrees with
Skempton’s equation with value of 0.182 kPa and little
diff erent with Bjerrum-Simons’ fi rst equation round of
0.192 kPa. Th ese values are diff erent from Karlsson-
-Viberg’s equation and Bjerrum-Simons’ second equation
round of 0.228 kPa and 0.274 kPa respectively. Bjerrum-
-Simons’ second equation gives higher result than the
others [2, 5, 8]. Meanwhile value of s/σi when using
Mohr-Coulomb’s equation gives 0.186 kPa. In this
calculation, shear strength is used vertical stress
(overburden stress) as normal stress because internal
friction angle is very small.
From the fi ndings as shown in Table 5, it can be seen
that the ratio s/σi coming from Skempton’s equation is
the best fi t with 50 percentile of laboratory test. By using
Mohr-Coulomb’s equation a good enough estimation can
be also made, but results from other equations are poorer.

Tow
n an
d U
rban
Pla
nnin
g A
rchi
tect
ure
and
Build
ing
Engi
neer
ing
49
Analysis of different equations of undrained shear strength estimations using Atterberg Limits on Pontianak Soft ClayAnalysis of different equations of undrained shear strength estimations using Atterberg Limits on Pontianak Soft Clay
factor (R2), we must collect more samples to fulfi ll
suffi cient data in other to achieve a certain signifi cant
level.
Conclusions
Th ere are two main conclusions from analyzing the data.
Firstly, undrained shear strength without the confi ned
pressure or undrained unconfi ned compressive strength
(qu) for Pontianak soft soil is around almost twice of
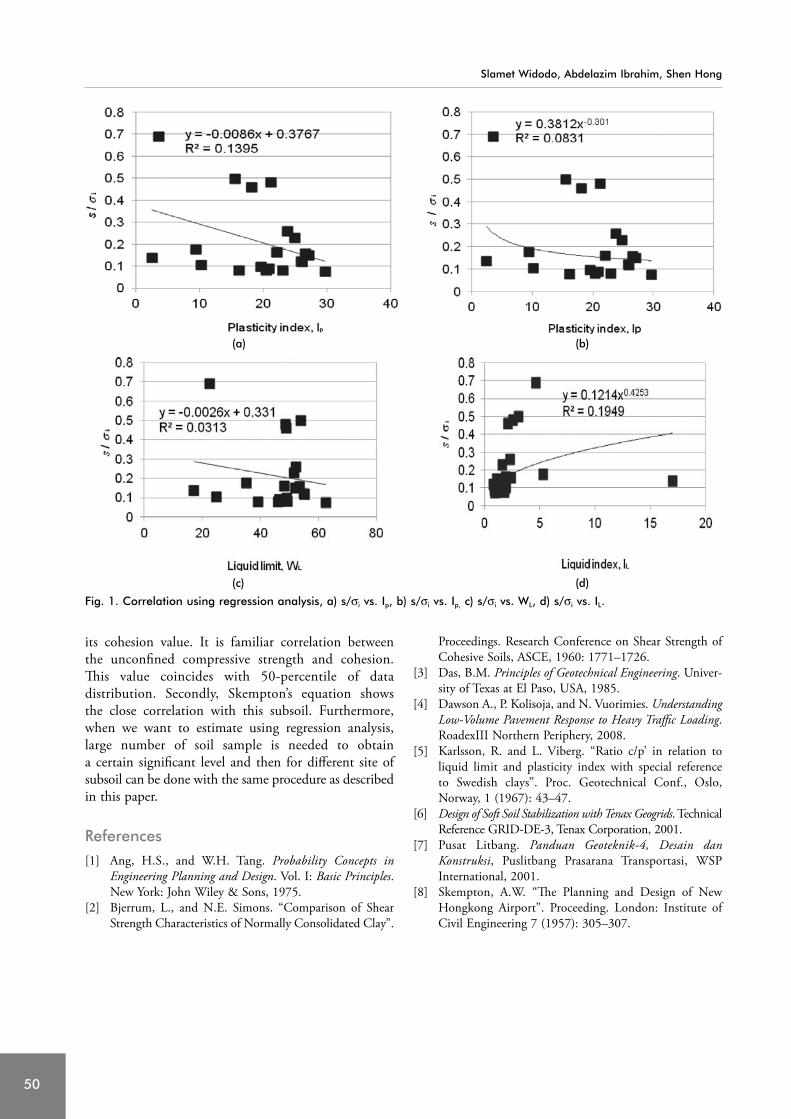
Equations using regression analysis as a comparison for
previous method gives diff erent equation. Figure 1(a)
through 1(d) show trend line of linear and power
function. Coeffi cient of determination (R2) for four
equations are very low correlation between dependent
variable (s/σi) and independent variables of Ip,WL, Ic
respectively.
Table 6 gives new some equations from labora-
tory test and equations are resulted from regression
analysis. When we look into the determination
Table 5. Ratio undrained shear strength to overburden stress.
Table 6. Corrected constant for equation.
Researchers Existing equations Equations from laboratory test Equations from regression analysis
Skempton
Bjerrum-Simons
Karlsson-Viberg
Bjerrum-Simons**
s/σi = 0.11 + 0.0037 Ip
s/σi = 0.045 Ip 0.5
s/σi = 0.005 WL
s/σi = 0.180 / IL 0.5
s/σi = 0.11 + 0.0037 Ip
s/σi = 0.0422 Ip 0.5
s/σi = 0.004 WL
s/σi = 0.118 / IL 0.5
s/σi = 0.37674 - 0.00856 Ip
s/σi = 0.38124 / Ip 0.30086
s/σi = 0.331 - 0.0026247 WL
s/σi = 0.12144 / IL 0.425287
50
Slamet Widodo, Abdelazim Ibrahim, Shen HongSlamet Widodo, Abdelazim Ibrahim, Shen Hong
Proceedings. Research Conference on Shear Strength of
Cohesive Soils, ASCE, 1960: 1771–1726.
[3] Das, B.M. Principles of Geotechnical Engineering. Univer-
sity of Texas at El Paso, USA, 1985.
[4] Dawson A., P. Kolisoja, and N. Vuorimies. Understanding
Low-Volume Pavement Response to Heavy Traffi c Loading.
RoadexIII Northern Periphery, 2008.
[5] Karlsson, R. and L. Viberg. “Ratio c/p’ in relation to
liquid limit and plasticity index with special reference
to Swedish clays”. Proc. Geotechnical Conf., Oslo,
Norway, 1 (1967): 43–47.
[6] Design of Soft Soil Stabilization with Tenax Geogrids. Technical
Reference GRID-DE-3, Tenax Corporation, 2001.
[7] Pusat Litbang. Panduan Geoteknik-4, Desain dan
Konstruksi, Puslitbang Prasarana Transportasi, WSP
International, 2001.
[8] Skempton, A.W. “Th e Planning and Design of New
Hongkong Airport”. Proceeding. London: Institute of
Civil Engineering 7 (1957): 305–307.
its cohesion value. It is familiar correlation between
the unconfi ned compressive strength and cohesion.
Th is value coincides with 50-percentile of data
distribution. Secondly, Skempton’s equation shows
the close correlation with this subsoil. Furthermore,
when we want to estimate using regression analysis,
large number of soil sample is needed to obtain
a certain signifi cant level and then for diff erent site of
subsoil can be done with the same procedure as described
in this paper.
References[1] Ang, H.S., and W.H. Tang. Probability Concepts in
Engineering Planning and Design. Vol. I: Basic Principles.
New York: John Wiley & Sons, 1975.
[2] Bjerrum, L., and N.E. Simons. “Comparison of Shear
Strength Characteristics of Normally Consolidated Clay”.
(a) (b)
(c) (d)
Fig. 1. Correlation using regression analysis, a) s/σi vs. Ip, b) s/σi vs. Ip, c) s/σi vs. WL, d) s/σi vs. IL.