stress- and strain-controlled undrained cyclic triaxial ...aniem/pap-zips/wk5.pdf · stress- and...
TRANSCRIPT

Paper No. 2.28 1
STRESS- AND STRAIN-CONTROLLED UNDRAINED CYCLIC TRIAXIAL TESTS ON A FINE SAND FOR A HIGH-CYCLE ACCUMULATION MODEL
Torsten Wichtmann Institute of Soil Mechanics and Rock Mechanics University of Karlsruhe, Germany
Benjamin Rojas Institute of Soil Mechanics and Rock Mechanics University of Karlsruhe, Germany
Andrzej Niemunis Institute of Soil Mechanics and Rock Mechanics University of Karlsruhe, Germany
Theodor Triantafyllidis Institute of Soil Mechanics and Rock Mechanics University of Karlsruhe, Germany
ABSTRACT The paper presents a discussion of the isotropic elastic stiffness E in the high-cycle accumulation (HCA) model proposed by Niemunis et al. (2005). The model may be used to predict permanent deformations or excess pore water pressures in non-cohesive soils due to cyclic loading. The stress-dependent bulk modulus K was determined from pairs of drained and undrained cyclic triaxial tests on a fine sand with constant stress amplitude and with similar initial conditions. K was found in good agreement with an earlier study on a medium coarse sand where a correction for membrane penetration effects had to be applied. Undrained cyclic triaxial tests with constant strain amplitude commenced at an anisotropic initial effective stress were performed for Poisson’s ratio ν. It is demonstrated that ν does not depend on amplitude, density and initial pressure. Its increase with the initial stress ratio may be disregarded for practical purposes. INTRODUCTION The high-cycle accumulation (HCA) model proposed by Niemunis et al. (2005) may be used for the prediction of settlements or stress relaxation (e.g. excess pore water pressure accumulation) in non-cohesive soils due to a large number (N > 103) of cycles with relative small strain amplitudes (εampl < 10-3) (so-called high- or polycyclic loading). The model may be applied for example to foundations of on- and offshore wind power plants, to machine foundations or to foundations subjected to traffic loading. The HCA model is based on an extensive laboratory testing program with drained cyclic triaxial and multiaxial DSS tests (Wichtmann, 2005). The present paper discusses the stress-dependent elastic stiffness E in the basic constitutive equation of the HCA model: (1) ' : ( acc pl= − −σ E ε ε ε ) In Eq. (1) the superposed dot means a rate with respect to the number of cycles N (i.e. an increment per cycle). The colon denotes a double contraction (Gibbs notation). is the rate of effective stress, the strain rate, the prescribed rate of
strain accumulation and
'σε accε
plε a plastic strain rate for stress paths touching the yield surface. The rate of strain accumulation is calculated as a product of a scalar intensity of accumulation
accε and a direction of accumulation m (unit tensor): (2) acc accε=ε m Depending on the boundary conditions, Eq. (1) predicts a change of the average stress ≠ 0 and/or an accumulation of residual strain ≠ 0. The stiffness E is important for boundary value problems with a significant stress relaxation due to cyclic loading (e.g pile foundations under cyclic loading). However, little is known about the magnitude of E yet.
'σε
In elastoplastic models E would be determined experimentally from a small unloading, comparing the stress increment Δσ' with the strain increment Δε at the absence of plastic strain Δεpl:
0
' : ( )plΔ = Δ − Δσ E ε ε (3)
Paper No. 2.28 2
v⎥
This procedure is not applicable to HCA models since these models do not describe monotonic processes, that means Eq. (1) does not make sense for an increment ΔN = 0 of the number of cycles. Therefore, E has to be determined from cyclic tests, for example from a comparison of creep and relaxation tests as described in the next section. At present an isotropic hypo-elasticity is used for E in our HCA model. Therefore, two elastic constants, e.g. bulk modulus K and Poisson’s ratio ν, have to be determined. The stress-dependent bulk modulus K for a medium coarse sand has been already determined by Wichtmann et al. (2009b) from 15 pairs of drained and undrained cyclic tests. However, due to the coarse grains, a correction for membrane penetration effects had to be applied. The accuracy of this correction is not clear. Therefore, a similar study on a fine sand has been performed afterwards. Membrane penetration effects are negligible for this sand. The present paper reports on the experimental results. Furthermore, Poisson’s ratio ν was also inspected for this sand. EXPERIMENTAL DETERMINATION OF K AND ν The bulk modulus K can be obtained from a pair of drained and undrained cyclic tests with similar initial conditions and with similar cyclic loading. For axisymmetric element tests Eq. (1) can be rewritten with Roscoe’s invariants:
(4) 0
0 3
accv
accq q
mp Kq G m
ε ε
ε ε
⎡ ⎤−⎡ ⎤ ⎡ ⎤= ⎢⎢ ⎥ ⎢ ⎥ −⎣ ⎦ ⎣ ⎦ ⎢ ⎥⎣ ⎦
with shear modulus G. Omitting plε in Eq. (1) is legitimate for homogeneous stress fields. For the triaxial case Roscoe’s stress invariants are p = (σ1’ + 2σ3’)/3 and q = σ1’ – σ3’ (5) with σ1’ and σ3’ being the axial and the horizontal stress components. The strain invariants are 1 2v 3ε ε ε= + and 1 32 / 3( )qε ε ε= − (6) The volumetric (mv) and deviatoric (mq) portions of the flow rule are:
2
2
2
22 22 21
3
1
2( ) 6( )
qv M p
qq qqMM p M
pmm p
⎡ ⎤−⎡ ⎤ ⎢=⎢ ⎥ ⎢ ⎥⎣ ⎦ − + ⎣ ⎦
⎥
η
(7)
with the critical stress ratio M defined as
(8) for 0
(1 / 3) for 0for
c
c e
e e
MM M M
M M
ηη
η
≥⎧⎪= + < <⎨⎪ ≤⎩
with
6sin( )3 sin( )
cc
c
M ϕϕ
=−
and 6sin( )3 sin( )
ce
c
M ϕϕ
= −+
(9)
wherein ϕc is the critical friction angle. For an isotropic stress (q = 0, = 0, mq q = 0) Eq. (4) takes either the form of isotropic relaxation (10) acc
vp K mε= − under undrained conditions ( 0vε = ) or the form of volumetric creep (11) acc
v mε ε= v
under drained conditions ( = 0). Comparing these equations one may eliminate and obtain
pacc
vmε / vK u ε= (12) Therefore, the bulk modulus K can be calculated from Eq. (12) with the rate u of pore pressure accumulation obtained from an undrained cyclic test and with the rate acc
v vε ε= of volumetric strain accumulation from a drained cyclic test with similar initial conditions and with similar cyclic loading.
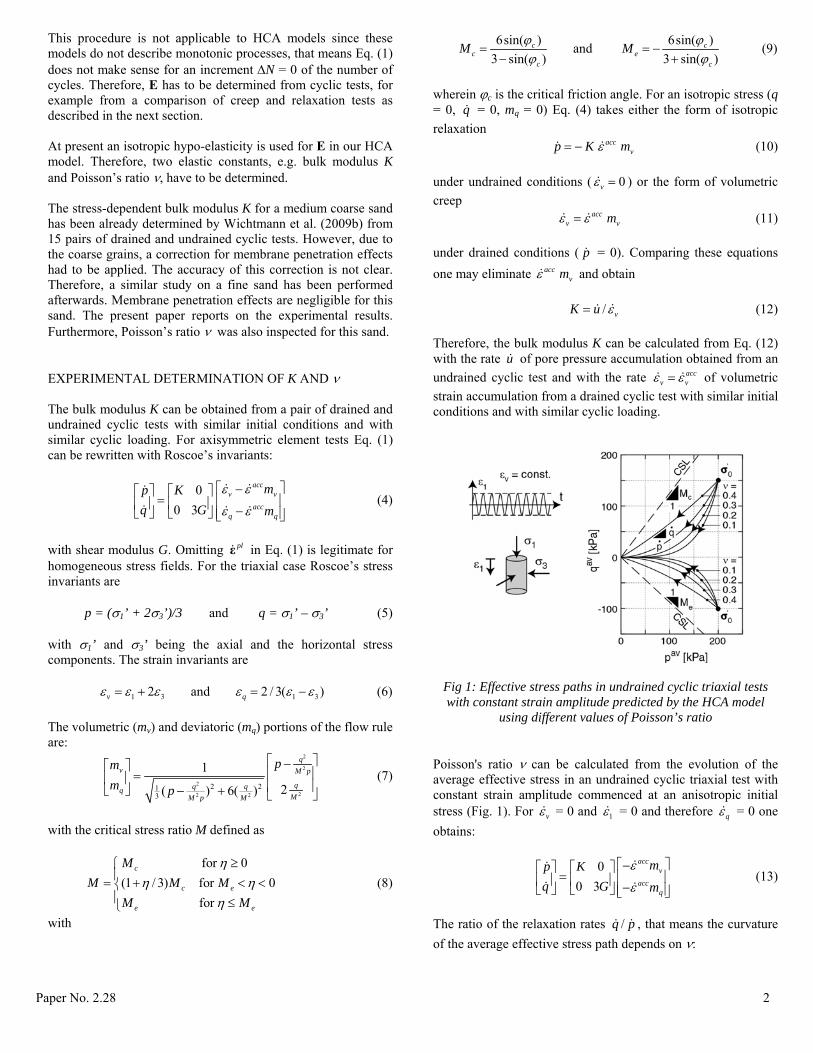
Fig 1: Effective stress paths in undrained cyclic triaxial tests with constant strain amplitude predicted by the HCA model
using different values of Poisson’s ratio Poisson's ratio ν can be calculated from the evolution of the average effective stress in an undrained cyclic triaxial test with constant strain amplitude commenced at an anisotropic initial stress (Fig. 1). For vε = 0 and 1ε = 0 and therefore qε = 0 one obtains:
(13) 0
0 3
accv
accq
mp Kq G m
ε
ε
⎡ ⎤−⎡ ⎤ ⎡ ⎤= ⎢⎢ ⎥ ⎢ ⎥ −⎣ ⎦ ⎣ ⎦ ⎢ ⎥⎣ ⎦
⎥
The ratio of the relaxation rates , that means the curvature of the average effective stress path depends on ν:
/q p

Paper No. 2.28 3
3 9(1 2 )2(1 )
q
v
mq Gp K m
ν 1ν ω
−= =
+ ↔ 9 2 ( / )
18 2 ( / )q pq p
ωνω
−=
+ (14)
with the strain rate ratio 2 2/ [ ( ) ] / 2av av
v qm m Mω η= = − η (15) depends on ν. The stress ratio is defined as η = q/p and the index “av” denotes the average value during a cycle. Fig. 1 presents the average effective stress paths in strain-controlled undrained cyclic triaxial tests predicted by the HCA model. The curvature of the stress paths increases with decreasing Poisson’s ratio ν. BULK MODULUS K FOR MEDIUM COARSE SAND Wichtmann et al. (2009b) compared 15 pairs of drained and undrained cyclic tests on a medium coarse sand in order to determine the bulk modulus K. The initial effective pressure p0 was varied between 50 and 300 kPa and the amplitude-pressure ratio ζ = qampl/p0 was chosen between 0.2 and 0.4. All specimens were medium dense (ID0 = 0.57 – 0.64) with the density index defined as ID = (emax – e)/(emax – emin) (16)
Fig 2: Bulk modulus K as a function of mean pressure pav, obtained from 15 pairs of drained and undrained cyclic tests on
a medium coarse sand (Wichtmann et al., 2009b) Fig. 2 reveals that the bulk modulus K is pressure-dependent. A curve-fitting of the function 1( ) n n
atmK A p p−= (17) with atmospheric pressure patm = 100 kPa to the data in Fig. 2 delivered the constants A = 467 and n = 0.46. The solid curve in
Fig. 2 was generated using Eq. (17) and these constants. The relative coarse grains implicate membrane penetration effects in the undrained tests. The rate of pore water pressure accumulation was purified from these effects using the correction method proposed by Tokimatsu (1990). However, the accuracy of this correction is not clear. Wichtmann et al. (2009b) demonstrated that for a simplified determination procedure, K can be estimated from the un- and reloading curve of an oedometric compression test (Fig. 2). TESTED MATERIAL AND SPECIMEN PREPARATION The grain size distribution curve of the fine sand used for the present study is shown in Fig. 3, along with the minimum and maximum densities determined according to German standard DIN 18126. The grain shape is subangular. All specimens had a diameter of d = 10 cm and a height of h = 10 cm. They were prepared by dry pluviation and after that saturated with de-aired water. A back pressure of 200 kPa was used in all tests.
Fig 3: Grain size distribution curve of the tested fine sand MONOTONIC TESTS Prior to the cyclic tests, undrained monotonic tests were performed on the fine sand in order to determine the “phase transformation” (PT) and the failure lines (FL). The effective stress paths of eight tests, four of them with triaxial compression and four with triaxial extension, consolidated at different initial effective pressures p0 between 100 and 400 kPa are given in Fig. 4. The inclination of the failure lines for triaxial compression and extension were determined as Mc = 1.4 and Me = -1.0, respectively. The PT-lines do not depend on pressure (Fig. 4). The density-dependence was examined in six tests with different initial relative densities in the range between ID0 = 0.29 and 0.98. The effective stress paths in Fig. 5 demonstrate that in the investigated range the failure lines are hardly affected by density. The inclination of the PT line decreases with increasing density.

Paper No. 2.28 4
Fig 4: Effective stress paths in eight undrained monotonic triaxial tests with different initial pressures and with triaxial
compression or extension, respectively
Fig 5: Effective stress paths in six undrained monotonic triaxial tests with different initial densities and with triaxial
compression or extension, respectively CYCLIC TESTS ON BULK MODULUS K For the determination of bulk modulus K drained and undrained cyclic tests with constant stress amplitude were performed on the fine sand. The initial stress was isotropic in all tests. The loading was applied with a constant displacement rate of 0.02 mm/min (strain rate 1ε ≈ 0.02 % /min). In all tests (drained and undrained) the first cycle was applied drained. The first cycle may be irregular and may generate much more deformation than the subsequent ones. The HCA model predicts only the accumulation due to the subsequent regular cycles. In numerical calculations with the HCA model the first cycle is calculated using a conventional incrementally nonlinear constititutive model (see Niemunis et al., 2005). Since the initial conditions at the beginning of the regular cycles were intended to be similar in the drained and in the undrained tests, the first cycle was applied drained in both types of tests.
Undrained tests In the undrained cyclic tests the pore water pressure u accumulated with each cycle (Fig. 6). During the cycle which lead to “initial liquefaction” (i.e. the effective stress components σ1’ and σ3’ became temporarily zero for the first time) the amplitude of the axial strain significantly increased (Fig. 7). It grew considerably with each subsequent cycle. A typical effective stress path in the p-q-plane and a shear stress – shear strain – hysteresis are given in Figs. 8 and 9. Tests with different initial mean presures p0 = 50, 100, 200 and 300 kPa were performed. For each pressure, three different amplitude-pressure ratios ζ = qampl/p0 = 0.2, 0.25 and 0.3 were tested. As expected, for a given initial pressure, the rate of pore water pressure accumulation increases with increasing amplitude (Fig. 10). Fig. 11 demonstrates that for a given amplitude-pressure ratio, the pore water pressure accumulation increases with increasing initial pressure.
/u u N≈ Δ Δ
Fig 6: Total and effective stress components versus time in an undrained cyclic triaxial test
Fig 7: Axial strain versus time in an undrained cyclic triaxial test

Paper No. 2.28 5
Fig 8: Effective stress path in an undrained cyclic triaxial test
Fig 9: Stress-strain-hysteresis in an undrained cyclic triaxial test
Fig 10: Residual pore water pressure as a function of the number of cycles in undrained cyclic triaxial tests with different
amplitudes
Fig 11: Residual pore water pressure as a function of the number of cycles in undrained cyclic triaxial tests with different
initial effective pressures Drained tests In the drained tests the volumetric strain accumulated with each cycle (Fig. 12). The amplitude of deviatoric strain slightly decreased with increasing N while the volumetric one remained almost constant (Fig. 13). From data of the residual volumetric strain as a function of N (Fig. 14), the rate /acc acc
v v Nε ε≈ Δ Δ was calculated. Despite similar values of the initial stress, the initial void ratio and the deviatoric stress amplitude, the conditions in the undrained and in the drained cyclic tests diverge with increasing number of cycles. While in the undrained test the average effective mean pressure pav decreases and the strain amplitude εampl increases, the void ratio and the strain amplitude slightly decrease in the drained tests. For the calculation of K from Eq. (12) it is important to evaluate and u acc
vε for exactly the same test conditions, that means same values of εampl, e, pav and cyclic preloading. For that purpose the rate acc
vε from the drained tests was corrected by a factor fc consisting of four multipliers:
UD UDUD UD
ampl pec D D D
ND
ampl e p N
f ff fff f f f
= (18)
The indices “UD” and “D” indicate the undrained or drained test, respectively. The functions fampl, fe, fp and Nf are used in the HCA model for the intensity of accumulation accε in Eq. (2). The functions consider separately the influences of strain amplitude, void ratio, average mean pressure and cyclic preloading on accε : ( )/ amplCampl ampl
ampl reff = ε ε (19)
( )( )
2
2
11
refee
e ref
eC ef
e C e
+−=
+ − (20)

Paper No. 2.28 6
Fig 12: Volumetric strain versus time in a drained cyclic test
Fig 13: Strain amplitudes as a function of the number of cycles
in a drained cyclic test
Fig 14: Residual volumetric strain as a function of the number
of cycles in three tests with different stress amplitudes
Fig 15: Accumulated volumetric strain after different numbers of cycles divided by the void ratio function and plotted versus a
mean value of the strain amplitude, fitting of function fampl ( )exp / 1av
p p reff C p p⎡ ⎤= − −⎣ ⎦ (21)
1 2 1 3exp( / / )AN N N N ampl Nf C C g C f C⎡ ⎤= − +⎣ ⎦ (22)
Therein 410ampl
ref−ε = , eref = emax and pref = 100 kPa are reference
quantities. In the HCA model cyclic preloading is quantified by the historiotropic variable 1 2 1[ exp( / / )]A A
ampl N N N amplg f C C g C f d= −∫ N (23)
in order to consider packages of cycles with different amplitudes (Wichtmann et al., 2009c). The material constants Campl, Ce, Cp, CN1, CN2 and CN3 for the fine sand have been determined from the drained cyclic tests. Since tests with different initial void ratios have not been performed yet, the constant Ce of the void ratio function fe was estimated from the correlation Ce = 0.96emin proposed by Wichtmann et al. (2009a) in the context of a simplified calibration procedure for the HCA model. With emin = 0.677 a constant Ce = 0.650 is obtained. The parameter Campl of the function fampl can be obtained from tests with different amplitudes (Fig. 14). Obviously, the rate of volumetric strain accumulation increases with increasing stress amplitude. In Fig. 15 the residual volumetric strain is plotted versus the strain amplitude. The bar over a symbol indicates that a mean value up to the number of cycles N is used. The volumetric strain has been divided by the void ratio function fe in order to consider different initial void ratios and different compaction rates. A curve-fitting of Eq. (19) to the data in Fig. 15 revealed an increase of Campl with N. A mean value Campl = 1.41 over 100 cycles is used in the following. The parameter Cp of the function fp was determined from four tests with different average mean pressures (Fig 16). While the residual strains in the tests with pav = 100, 200 and 300 kPa were similar, a significantly lower accumulation of strain was observed for pav = 50 kPa. The increase of the strain amplitude with increasing pressure due to the constant amplitude-pressure-

Paper No. 2.28 7
Fig 16: Residual volumetric strain as a function of the number
of cycles in drained cyclic tests with different average mean pressures
Fig 17: Accumulated volumetric strain after different numbers of cycles divided by the void ratio and amplitude functions and plotted versus average mean pressure pav, fitting of function fp
Fig 18: Accumulated volumetric strain divided by the void ratio, amplitude and pressure functions and plotted versus the number
of cycles, fitting of function fN
ratio is considered in Fig. 17 where the residual volumetric strain after different numbers of cycles is plotted versus pav. The division of acc
vε by fampl and fe is necessary in order to purify the data from the influence of strain amplitude and void ratio. A curve-fitting of Eq. (21) to the data in Fig. 17 delivered a mean value Cp = 0.21. The data from Fig. 17 has been divided by the function fp and is plotted versus the number of cycles in Fig. 18. The function [ ]1 23 3 ln(1 )N N Nf C C N C= + + 3N (24) with CN3 = 0 has been fitted to the data in Fig. 18 resulting in constants CN1 = 1.58 * 10-4 and CN2 = 0.51. Setting CN3 to zero is justified here since for uniform sands, this constant influences the rate of strain accumulation only for larger numbers of cycles (N > 104, Wichtmann et al. (2009a)). All material constants of the HCA model are summarized in Table 1. The HCA model with these material constants has been used for a recalculation of the drained cyclic tests in Fig. 16 (solid curves). Despite a deviation for the test with pav = 300 kPa, the experimental data and the recalculation agree quite well.
Constant Value Campl 1.41
Ce = 0.96 emin 0.650 eref = emax 1.054
Cp 0.21 CN1 1.58 * 10-4
CN2 0.51 CN3 0
Table 1: Constants of the HCA model for the fine sand Bulk modulus from a comparison of drained and undrained cyclic tests For six pairs of drained and undrained cyclic tests the bulk modulus K was calculated from Eq. (12). In contrast to the study documented by Wichtmann et al. (2009b), the rate from the undrained tests had not to be corrected by membrane penetration effects. The rate
u
accvε from the drained tests was corrected by
the factor fc calculated from Eq. (18). K was determined for increments of the pore water pressure of Δu ≈ 10 kPa except the test with p0 = 50 kPa where Δu ≈ 5 kPa was used. The data of K versus pav is shown in Fig. 19, where pav is the average effective mean pressure in the undrained tests. The stress-dependent bulk modulus for the fine sand is well described by Eq. (17) with the constants A = 467 and n = 0.46 (solid curve in Fig. 19) which were determined for the medium coarse sand. No clear tendency concerning the influence of the amplitude on K can be detected in Fig. 19. For each pair of tests larger values of K were observed during the first few cycles. Since the series with drained cyclic tests is not finished yet, Fig. 19 will be extended by further test pairs in future.

Paper No. 2.28 8
Fig 19: Bulk modulus K derived from six pairs of drained and undrained cyclic tests on fine sand
The HCA model with the constants in Table 1 and with the stiffness calculated from Eq. (17) with A = 467 and n = 0.46 has been used for recalculations of the undrained cyclic tests. A quite good agreement between the prediction (solid curves) and the experimental data can be observed in Figs. 10 and 11. CYCLIC TESTS ON POISSON’S RATIO Undrained cyclic tests with constant strain amplitude were performed in order to evaluate Poisson’s ratio ν for the elastic stiffness E used in the HCA model. The tests were commenced at an anisotropic initial stress. The loading was applied with a constant displacement rate of 0.02 mm/min (strain rate 1ε ≈ 0.02 % /min). The first irregular cycle was applied drained due to the reasons described above. The cycles caused an accumulation of pore water pressure (Fig. 20). For triaxial compression, the axial stress decreased (relaxation, Fig. 20a) while it increased in triaxial extension tests (Fig. 20b). Due to the pressure-dependence of the secant stiffness, the deviatoric stress amplitude qampl decreased with increasing number of cycles (Fig. 20). First, the influence of the amplitude and the void ratio on Poisson’s ratio was tested. Three tests with different strain amplitudes 1
amplε = 4, 6 and 8 * 10-4 were performed on medium dense specimens. The initial effective stress was p0 = 200 kPa and η0 = 0.75 in all tests. As expected, the relaxation of the effective lateral and axial stress components with increasing N was faster for larger amplitudes (Fig. 21). The effective stress paths for the smallest and the largest amplitude are shown in the p-q-plane in Fig. 22. In the tests with the two larger amplitudes the effective stress finally reached zero, that means the stress path merged to a point laying in the origin of the p-q-plane. For reasons of time the test with the smallest amplitude was stopped after one week without having reached zero effective stress. The paths of the average effective stress in the three tests coincide (Fig. 22). Therefore, the strain amplitude does not affect the
stress rate ratio . According to Eq. (14) the amplitude has thus no influence on Poisson’s ratio ν.
/q p
Fig 20: Total and effective stress components as a function of time in undrained cyclic triaxial tests with constant strain
amplitude and with an anisotropic initial stress in a) triaxial compression, b) triaxial extension
Fig 21: Effective stress components as a function of the number
of cycles in three tests with different strain amplitudes

Paper No. 2.28 9
Fig 22: Effective stress paths in two tests with different strain amplitudes
Fig 23: Paths of the average effective stress in three tests with
different strain amplitudes Three tests with different relative densities ID0 between 0.33 and 0.68 were performed in order to study the density-influence. The initial stress was p0 = 200 kPa and η0 = 0.75 and the strain amplitude was 1
amplε = 6 * 10-4 in all tests. As expected, the rate of stress relaxation increased with decreasing density (Fig. 24).
Fig 24: Effective stress components as a function of the number
of cycles in three tests with different densities
Fig 25: Effective stress paths in two tests with different densities The effective stress paths for the smallest and the largest density are given in Fig. 25. For all densities a zero effective stress was reached. The diagram in Fig. 26 reveals that the average effective stress paths for the three densities coincide. Therefore, the density does also not influence Poisson’s ratio.

Paper No. 2.28 10
Fig 26: Paths of the average effective stress in three tests with
different initial densities
Fig 27: Effective stress components as a function of the number
of cycles in four tests with different initial effective pressures and with the same initial stress ratio
The influence of the initial effective mean pressure was examined in four tests with different values of p0. The specimens were medium dense, the initial stress ratio was η0 = 0.75 and the strain amplitude was 1
amplε = 6 * 10-4 in all tests. With increasing initial pressure a larger number of cycles was necessary to reach zero effective stress (Fig. 27). The effective stress paths for p0 = 50 kPa and for p0 = 300 kPa are shown in Fig. 28. For all tested pressures the stress path finally reached the origin of the p-q-plane. The average effective stress paths are given in Fig. 29. The shape of the curves is similar for the different initial pressures. Eight tests with different initial stress ratios η0 between –0.75 (triaxial extension) and 1.15 (triaxial compression) were performed. All specimens were medium dense, consolidated under an initial effective pressure of p0 = 200 kPa and cyclically sheared with an amplitude 1
amplε = 6 * 10-4. With increasing
initial stress ratio, a larger number of cycles was necessary to reach zero effective stress (Fig. 30). Three effective stress paths for η0 = -0.75, 0 and 1.15 are given exemplary in Fig. 31. They all reach a zero effective stress, independently of their anisotropic consolidation stress. The average effective stress paths for all tests are shown in Fig. 32.
Fig 28: Effective stress paths in two tests with different initial effective pressures and with the same initial stress ratio
Fig 29: Paths of the average effective stress in four tests with different initial pressures and with the same initial stress ratio

Paper No. 2.28 11
Fig 30: Effective stress components as a function of the number
of cycles in eight tests with different initial stress ratios For each test a Poisson’s ratio ν could be found which approximates well the evolution of the average effective stress shown in Fig. 32. These ν-values are given beside the respective stress paths. The stress paths predicted by the HCA-model using these ν-values are given as the solid curves in Fig. 32. The change of the average stress during the first regular cycle was not as reliable as that for larger numbers of cycles (see e.g. the evolution of stress in the test with η0 ≈ 0). Therefore, the first regular cycle was excluded from the determination of ν and the recalculation of the experimental data was started from the average effective stress after this cycle. A comparison of the Poisson’s ratios obtained for the different initial stress ratios reveals (Fig. 32), that ν is approximately 0.30 for low to intermediate stress ratios –0.75 ≤ η0 ≤ 0.75. For larger stress ratios in triaxial compression (η0 = 1.0 and 1.15) larger Poisson’s ratios ν = 0.37 or 0.39 are necessary in order to reproduce the measured stress paths with the HCA model. The dashed curves in Fig. 32 were generated using a mean value ν = 0.32 from all tests in the HCA model. Obviously, the stress paths for low to intermediate stress ratios –0.75 ≤ η0 ≤ 0.75 are reproduced quite well while the stress relaxation for larger initial stress ratios is overestimated. These test results reveal that for larger stress ratios an isotropic elastic stiffness E may not be sufficient. It has to be considered that for the determination of the ν-values, the strain rate ratio ω in Eq. (14) was calculated from Eq. (15). Eq. (15) does not consider a slight increase of ω with the number of cycles which is usually observed in drained cyclic tests (Wichtmann, 2005).
Taking this rotation of the cyclic flow rule into account when evaluating ν could lead to Poisson’s ratios deviating from the values shown in Fig. 32, especially for larger initial stress ratios. The cyclic flow rule for the fine sand and its effect on ν will be studied in drained cyclic tests in future. However, in order to keep the HCA model as simple as possible, at present we recommend to use an isotropic elasticity with ν ≈ 0.30. For a simplified calibration, it seems sufficient to determine Poisson’s ratio from a single test commenced at a K0 initial stress (e.g. p0 = 200 kPa, η0 = 0.75, Fig. 32).
Fig 31: Effective stress paths in three tests with different initial
stress ratios

Paper No. 2.28 12
Fig 32: Paths of the average effective stress in eight tests with different initial stress ratios, determination of Poisson’s ratio ν
from recalculations with the HCA model SUMMARY, CONCLUSIONS AND OUTLOOK The isotropic elastic stiffness E of the high-cycle accumulation model proposed by Niemunis et al. (2005) has been inspected based on cyclic tests on a fine sand. The bulk modulus K was obtained from pairs of drained and undrained cyclic triaxial tests with constant stress amplitude and with similar initial condition. The stress-dependence of K is well described by Eq. (17) with constants A = 467 and n = 0.46. This equation was originally developed for a medium coarse sand where the test results had to be purified from membrane penetration effects. The amplitude- and void ratio-dependence of K will be studied in future. Poisson’s ratio ν was studied by means of undrained cyclic triaxial tests with constant strain amplitude commenced at an anisotropic initial stress. ν was found independent of amplitude and void ratio. For low to intermediate initial stress ratios –0.75
≤ η0 ≤ 0.75 Poisson’s ratio is approximately 0.30 while larger ν-values are necessary in order to reproduce the measured stress paths for larger stress ratios in triaxial compression (η0 ≥ 1.0). The test results reveal that for larger stress ratios an isotropic elastic stiffness E may not be sufficient. However, in order to keep the HCA model as simple as possible, at present we recommend to use an isotropic elasticity with ν ≈ 0.30 for calculations with the HCA model. ACKNOWLEDGEMENT The presented study has been performed within the framework of the project “Geotechnical robustness and self-healing of foundations of offshore wind power plants” funded by the German Federal Ministry for the Environment, Nature Conservation and Nuclear Savety (BMU). The authors are grateful to BMU for the financial support. REFERENCES Deutsches Institut für Normung [1996]. „DIN 18126: Soil, investigation and testing - Determination of density of non-cohesive soils for maximum and minimum compactness”. Niemunis, A., Wichtmann, T. and Triantafyllidis,T. [2005]. “ A high-cycle accumulation model for sand”, Computers and Geotechnics, Vol. 32, No. 4, pp. 245-263. Tokimatsu, K. [1990]. “System compliance correction from pore pressure response in undrained triaxial tests”, Soils and Foundations, Vol. 30, No. 2, pp. 14-22. Wichtmann, T., Niemunis, A. and Triantafyllidis, T. [2006]. “Experimental evidence of a unique flow rule of non-cohesive soils under high-cyclic loading”, Acta Geotechnica, Vol. 1, No. 1, pp. 59-73. Wichtmann, T, Niemunis, A. and Triantafyllidis, T. [2009a]: „Validation and calibration of a high-cycle accumulation model based on cyclic triaxial tests on eight sands”, Soils and Foundations, Vol. 49, No. 10 (in print). Wichtmann, T, Niemunis, A. and Triantafyllidis, T. [2009b]: “On the ‘elastic’ stiffness in a high-cycle accumulation model for sand: a comparison of drained and undrained cyclic triaxial tests”, Canadian Geotechnical Journal (submitted). Wichtmann, T, Niemunis, A. and Triantafyllidis, T. [2009c]: “Strain accumulation in sand due to drained cyclic loading: on the effect of monotonic and cyclic preloading (Miner’s rule)”, Soil Dynamics and Earthquake Engineering (submitted).