to reboot or not to reboot? analyzing the performance of ... · to reboot or not to reboot?...
TRANSCRIPT
To Reboot or Not to Reboot? Analyzing the Performance of Movie Franchises.
Alexander Spitz Mark Kurt Elon University Elon University
Working Paper (Do Not Cite) ABSTRACT
In 2011, the movie industry’s top ten worldwide grossing films where all extensions of successful entertainment franchises earning over $7.8 billion (Box Office Mojo, 2012). These new installments can be broken into the following categories: prequel, sequels, remakes, and a relatively new type, reboots. Reboots are unique in that they allow writers to “reset” the story, giving them much more freedom to create great stories, revive characters, and replace actors with a new cast. In theory, this allows for more appealing movies and thus more profitable films while maintaining key elements which originally appealed to audiences. This paper investigates what, if any, financial advantages of rebooting franchise over other forms of franchise installments and original works. Preliminary results indicate reboots generate less revenue than original movies. However, reboots tend to have less risky returns. Therefore, reboots are less risky investment for large budget movies.
INTRODUCTION
Movies have been a dominant source of entertainment for more than 100 years. Starting out as a novelty and evolving into a new medium for entertainment and communication. Given a global economic problem in the last decade, it is encouraging to see any industry grow. Since 2006, the worldwide box office has grown 30%, and the domestic box office has grown 15%. (Theatrical market statistics, 2010) Part of the magic of movies is they allow people to escape from their everyday lives for a few hours for relatively little money, often less than $10.
The market for movies is unique in that there is one market clearing ticket price. The price of a ticket to a blockbuster movie is exactly the same price as a ticket to a box office flop. Movie theaters have a fixed supply horizontal to the price. Given an increase in demand, the movie theater simply allocates more theater space, increasing the quantity with no effect on the price. This is important to think about given a blockbuster and a flop. Professional sports teams for example, take advantage of demand by adjusting ticket prices based on quality, dates and times (The economic history, 2010). Going to the movie theaters is based off of demand, any increase in it, will increase the amount of theaters and revenues.
Any firm in the movie industry’s primary goal is to maximize profits. Increasing, firms are migrating to franchise movies as a means to achieve this goal. There are many reasons for choosing to continue a franchise rather than developing an original screenplay into a movie. One can reuse a tested story-telling framework or universe. The universe may have captivating characters which fans want to watch more stories about; Batman is one successful example. It is also possible to create more intricate plots with sequels and prequels within the movie format: Indiana Jones. Moreover, it may be less expensive on a per movie basis to have a franchise. The Lord of the Rings trilogy was filmed continuously over 15 months in New Zealand. Marketing and distribution costs are likely lower as well.
Financial success of movies is far from certain before they enter the box office, but firms try to increase their chances of success by targeting an audience with an appropriate movie. Once a movie becomes successful, successive movies already have a target audience. Movies such as Star Wars have seen prequels and The Italian Job was remade.
There may be a tradeoff to continuing the franchise. Sequels and Prequels tend to lose some of their core audience. They also have difficulty attracting new followers who don’t know the entire story. One solution is to remake a successful movie franchise mainly because Hollywood has been trending towards remakes recently.
The remakes we use in our sample are both remade movies, and rebooted franchises. A reboot is starting the franchise over, and allows movie makers to create a new setting and a new plot. In essence, the franchised is being remade. Figure 1 displays how many reboots, sequels and prequels were made from 2002-2011. Overall, 24% of those movies were an adaptation of a story that viewers are already familiar with. At what point does the movie
industry recognize this? And more importantly is there a benefit to remake a movie rather than produce sequels or prequels. This is an important question for the movie industry to potentially increase revenue via the box office. By combining the right audience and the right timing with the right story you may think it would attract more of an audience because of interest and that’s what we are trying to figure out.
The purpose of this paper is to identify any financial benefits of remaking a movie compared to producing any other type of film whether it is a sequel, prequel or an original movie. We focus on two aspects, box office revenues, and measure of risk of those returns. We find that remakes have no effect on box office revenue, but tend to be less risky than other types of movies. The balance of the paper details the current state of the literature, theory, data, empirical model, results, and conclusions. LITERATURE REVIEW There is a small but informative literature on the determinants of box office revenues. De Vany and Walls (1999), for instance, look at whether star power reduces the risk in making a movie. They find no significant results, and conclude “anything can happen.” Essentially, there is no efficient way of predicting a movies’ success. The audience makes a movie a hit, not the actor, so it comes down to whether an audience is actually going. We improve on De Vany and Walls but using more recent data and control for more factors which help explain the unexplained variation in returns, we use more factors affecting movies in general.
Litman (2004) studying the relationship between the creativity of movies and box office success. He finds three crucial decisions contributing to success: the creative sphere, the scheduling and release pattern, and the marketing effort. Litman’s study doesn’t take into account the effect of remakes along with creativity.
Basuroy, Chatterjee, and Ravid (2003) discuss the role of critic reviews in the movie
industry. Critics have played an important role in consumers’ decisions in general. Basuroy et. al. investigate three issues related to how critics affect box office success. They realize that critics influence and predict a movie, they can affect a movie with a good or bad review, and finally the use of star power and budgets which would moderate the impact of a critic review. The authors find that negative and positive reviews are correlated with the success of a movie. More importantly, they find that a negative review has more of an impact than a positive review. Finally, they find star power lessens the impact of a negative review.
Terry and De’Armond (2008) look at what drives movie rentals. If movie rentals are high
and box office performance is low then maybe there was something going on economically that would have impacted the box office success. They found the primary determinants of video rentals are based on box office performances, academy award nominations, children movies, sequels and the amount of theaters that were showing the movie.
Sharda (2005) looks at forecasting the success of a movie. The author uses neural
networks, which are biology techniques, dealing with non-linear models that optimize
outcomes. There are nine movie categories, ranging from “flop” to “blockbuster.” The results range with 36.9% accuracy all the way to 75.2% prediction. However, major contributors to a movies’ success included high technical effects, and high star value. Sharda did not find that ratings and genre are significant contributors to the success of a movie.
Ginsburgh, Pestieau, and Weyers (2006) focused their research on remakes compared
to their originals. They compared original movies to their remakes from a few different standpoints. The first one being based on quality and the second one is their financial gains. They found that the majority of remakes have lower quality than originals. In addition they also found that on average, remakes with a lower quality have smaller financial returns than the original movies.
Finally, Terry, De’Armond, and Butler (2005) look at what drives the domestic box office
performance in general. Their model is most similar in flavor to our own. They find that critic reviews, sequels, award nominations, the release date and budget are positively correlated with the success of a movie, while R rated movies are negatively correlated with its success. However, they cannot capture the effect of rebooting a franchise on revenues. THEORY We first need to evaluate why the movie industry decides to produce the form of film that they do. Remaking movies is a less risky investment (compared to an original movie). People are familiar with the story so the cost of the movie is less. In addition, the downside to Hollywood is marketing costs. As the economy has weakened the last few years we have seen the movie industry move towards the “safe bets” of a movie industry. Today, any return on investment is more valuable than in past years and with each new movie, Hollywood is hampered by marketing costs. With these expensive problems, industries are forced to make commercials short, and to the point. When you continue a previous film adaptation this is relatively easy. The Hangover II had a “controversial” trailer that Warner Brothers demanded all movie theaters to stop running it. Many believed it was not actually controversial and that it was a marketing ploy. They first received a lot of press indicating the release date and a countdown to opening weekend. More importantly, a lot of people were searching on YouTube for this trailer which caused more traffic and attention to The Hangover. Most everyone knew of the original movie and all this did was add attention and draw new audiences (Port, 2011). At the end of the day Hollywood production studio’s primiary goal is to maximize profits.. Developing an original screenplay and produce a movie where the story is unfamiliar to potential audiences is financially risky.
There are many reasons. One reason is that there is an established audience. The universe for franchises tends to be rich with multiple plots and long story arcs. Batman is an
excellent example. There are many rich characters including the protagonist. People become invested in these characters and interested in how the story unfolds.
In 2010, the top 10 movies saw originals like Inception and Despicable Me thrive. However the rest of the of the top 10 films were: Toy Story 3, Iron Man 2, Shrek Forever After, Harry Potter, Twilight, and Alice in Wonderland. All these movies have a name most audiences are already familiar. This can explain why adaptations of Spiderman, X-Men and Batman, among others, will be seen once again in theaters (Harris, 2011).
Marketing expenses are also be lower. For example, a 30 second for a movie trailer about the a continuation of a successive franchise can transmit more about a movie than an original movie, as people know the characters and story arcs. Typically, millions of people have heard of the franchise which saves on marketing expenses. It is also easier to distribute as theater owners are dealing with a product in which they are familiar.
Do these advantages apply to reboots and do they have other advantages beyond sequels/prequels? Reboots do two things: resetting the story which allows writers much more latitude for character development and new stories while maintaining some continuity which ideally is what drew audiences to the franchise, and it allows for a new cast.
Let us focus on the first advantage. In Star Trek produced by J.J. Abrams, the story of James Kirk and his crew was completely reset. The planet Vulcan was destroyed and many characters were altered. In short, the movie was altered in such a way it was no longer directly related to previous movies. However, it did draw on the same universe and basic story lines. Therefore, it is not a new franchise but a reboot. Not only did it prove to be successful, but it rejuvenated a franchise that had not received much popularity as of late.
The second advantage is that you are allowed for an entirely new cast. You aren’t left with actors who have aged beyond the plausibility of the role. There is unlikely to be another Indiana Jones sequel as Harrison Ford is currently 69. A reboot would allow for a new Indiana Jones who would fit better into the fedora.
There are also some financial benefits to rebooting a franchise. Sony was in talks with
Tobey Maguire on a Spider-Man 4, before those discussions collapsed in January 2010. They were left with a few options: one being find a new Spiderman and continue the franchise. The other option, which they are now doing, is starting over. They are now rebooting the franchise focusing on Spiderman’s teenage life. There were also concerns of a budget upwards of $250 million with Spider-Man 4; by rebooting they are now going to spend less than $100 million. Finally, the original Spider-Man movies grossed over $2.5 billion worldwide, by rebooting they can create sequels afterwards that can potentially equal that revenue (Movie reboots, 2010).
Despite critics being weary of reboots, there is a benefit of making these films. They hold down costs, continue franchises that seem to be losing life, and they can work towards building a larger audience.
DATA
For our data set we used 462 movies. These were the top 100 grossing movies in the United States from 2005-2010. 138 movies were omitted from the sample due to not listing a budget. In addition to the domestic gross, we also measured overseas as well as worldwide revenues. The figures were according to Box Office Mojo, In addition, to obtain further data on movies such as critic reviews and nominations I used the International Movie Database. In addition, all monetary values were adjusted for inflation with 2010 being the base year.
Descriptive statistics are shown in Figure 5. The average worldwide movie revenue is $216 million, ranging from $1.16 billion (Pirates of the Caribbean: Dead Man’s Chest, 2006) and $26.7 million (Grindhouse, 2007). 5.6% of the sample contained reboots; the most successful being $646 million (Casino Royale, 2006) while the least successful was $57.8 million (Prom Night, 2008). Remakes made up of 4.1% of the sample. The highest revenue total was $1.02 billion (Alice in Wonderland, 2010), the least was $31.8 million (The Stepfather, 2009). Finally sequels and prequels made up 16.23% of the sample. The most successful movie was $1.16 billion (Pirates of the Caribbean: Dead Man’s Chest, 2006) and the least successful was $40.2 million (Halloween II, 2009). Lastly, 25.9% of the movies were released in the fall, 24.7% in the winter, 28.6% in the summer and 20.8% in the spring. Figure 5: ECONOMETRIC MODEL
My empirical model is designed to isolate the effects of remakes and reboots on total revenue from a movie within an OLS framework. In order to achieve this goal, we need to capture other influences on revenue such as budget, quality of the movie, genre, etc. Equation 1: lnTotalGross= β0+β1Reboot+ β2Remake+ β3SequelPrequel+β4PercentOpen+ β5Adult+ β6lnBudget+ β7lnCriticReview+ β8TimeSincePreviousFlim+ β9NumInFranchise+β10Nominations+ β11HolidayWeek+ β12lnTheaters+ β13lnOpenTheaters+ β14xiMonth+ β15xiYear
LnTotalGross is the dependent variable. This variable is logged to measure percentage increases or decreases in box office revenue. This captures the total worldwide box office revenues, inflation adjusted.
Reboot is our variable of interest. It is a dummy variable measuring whether the movie was rebooted or not. We expect this to have a positive correlation given the amount of recognizable franchises rebooted over the last few years.
Remake is also a dummy variable showing whether this movie was remade or not. Sequelprequel is a dummy variable that combines both sequels and prequels. We
expect this to be a positive correlation for the same reason as reboots. Movies are producing sequels and every few years to retain their current audience and attract more fans.
PercentOpen measures the percentage of the opening weekend revenue to the overall
revenue. This is likely to have a negative correlation given that most movies make the majority of their revenues on the opening weekend. After that opening weekend revenues start to drop off.
Adult is a dummy variable indicating whether the movie is rated R or not. We expect
this number to have a negative correlation because R-rated movies have a limited audience and can negatively impact revenue.
lnBudget is the logged version of the production budget used for the given movie,
inflation adjusted. This is likely to have a positive correlation because it is more likely to receive higher revenues if the movie spends more on actors, directors, special effects, etc. It is important to note this does not include marketing budgets.
LnCriticReview is the logged version of the critic reviews. The critic review is based off
of a “metascore,” this is pooled major critic reviews such as the Wall Street Journal, LA Times, New York Times. The score is based off a scale from 1-100.
TimeSincePreviousFilm is dependent upon whether the movie is a reboot sequel or a
prequel. This variable measures how much time there was in between the most recent film that was released in that franchise. If the movie was an original subsequently did not have a movie released beforehand, it received a zero.
NumInFranchise indicates what number movie it was in that franchise. If the movie
was an original the number received was a one. Nominations indicate how many Academy Award, Golden Globes, and Screen Actors
Guild Award nominations the movie received. This tries to capture “star power” within a movie. It is hard to measure A-level actors or directors and this attempts to measure that by accounting for strong performances.
HolidayWeek is a dummy variable signifying if the movie was released during a holiday
week, the holidays included are: New Year’s, Martin Luther King Day, Valentine’s Day, Easter,
Memorial Day, Independence Day, Columbus Day, Halloween, Veteran’s Day, President’s Day and Christmas.
LnTheaters measures the percentage change of theaters that movie played in. LnOpenTheaters measures the percentage change of theaters that movie played in for
its opening weekend. xiMonth is a dummy variable that controls for all months of the year. The results are
compared against January. The purpose is to show consumer tastes throughout the year (for example a summer time movie or winter movie).
xiYear is a dummy variable that controls for all the years in our sample. The results are
compared against 2005. The purpose of this variable is to control for the states of the economy and also the quality of movies that were released that year. As we came across econometric problems, we had to adjust our model and data. Different variations are seen in the Appendix and discussed further in the Econometric Results section.
ECONOMETRIC RESULTS
The final results are listed in Error! Reference source not found. and Error! Reference source not found.. Error! Reference source not found. shows the original model, while Table 2 tests for diminishing returns of movie franchises. The original data set includes the top 100 movies per year from 2002-2011. In addition, we ran separate models for domestic success, overseas success and worldwide success. This model came showed there was heteroscedasticity, rejecting the null hypothesis saying there was no heteroscedasticity; to correct for this we used White’s Test for Robust Standard Errors. The domestic model explains 65% of box office success, overseas shows 52% and worldwide explains 66%.
A t-value equal to or greater than ± 1.96 shows significance at the 95% level. Worldwide success is the main area of interest, as foreign revenue has driven movies as of late. There is a significant positive correlation with sequel/prequels, critic reviews, opening weekend, budgets, the number in a franchise, nominations, theaters, and the month of May. Significant negative correlations included the months of: April, September, October, and November. These results fit in well with theory. For every sequel or a prequel made, we see a 41.95% increase in revenue, compared to any other movie. These results are consistent with our theory, suggesting that there is a financial benefit of making a sequel or a prequel. There is a .75% increase in revenue for every time the critic review increases by 1%. The opening weekend has a 21.98% effect in revenue. There is a .204% increase in revenue every time the budget increases by 1%. To put that into perspective, the average budget was $70.6 million and the average revenue was $216 million. If the budget were to be increased to $71.3 million
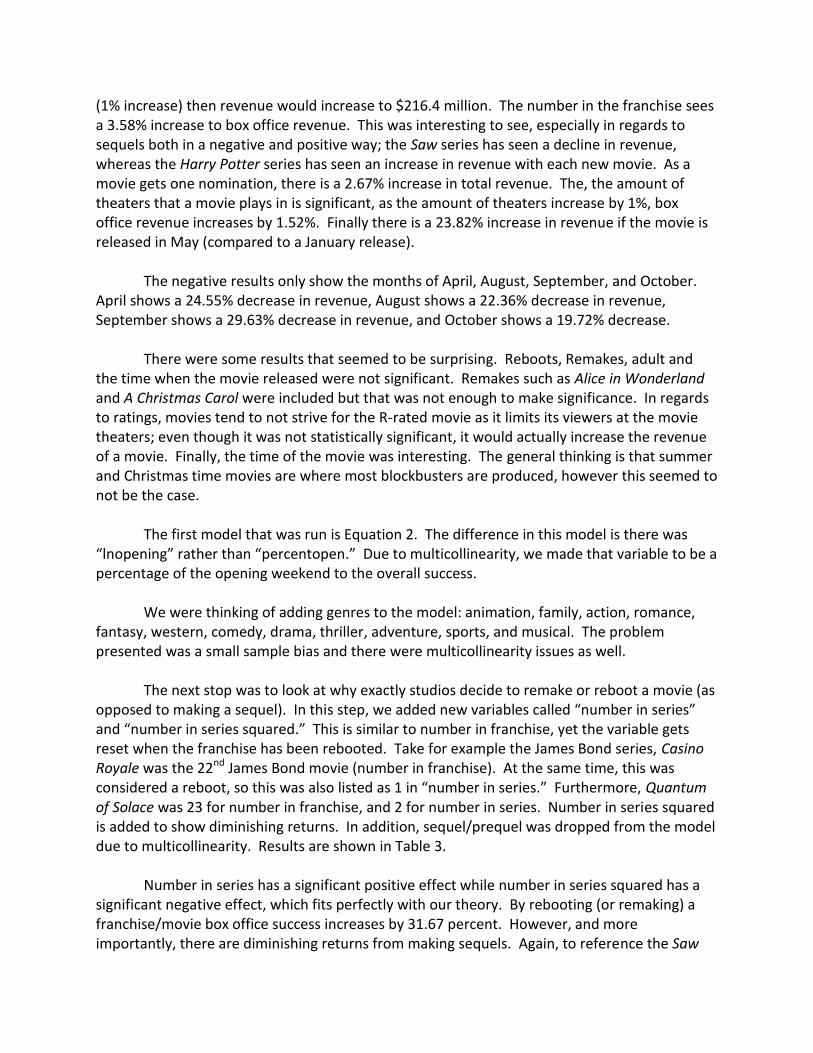
(1% increase) then revenue would increase to $216.4 million. The number in the franchise sees a 3.58% increase to box office revenue. This was interesting to see, especially in regards to sequels both in a negative and positive way; the Saw series has seen a decline in revenue, whereas the Harry Potter series has seen an increase in revenue with each new movie. As a movie gets one nomination, there is a 2.67% increase in total revenue. The, the amount of theaters that a movie plays in is significant, as the amount of theaters increase by 1%, box office revenue increases by 1.52%. Finally there is a 23.82% increase in revenue if the movie is released in May (compared to a January release). The negative results only show the months of April, August, September, and October. April shows a 24.55% decrease in revenue, August shows a 22.36% decrease in revenue, September shows a 29.63% decrease in revenue, and October shows a 19.72% decrease. There were some results that seemed to be surprising. Reboots, Remakes, adult and the time when the movie released were not significant. Remakes such as Alice in Wonderland and A Christmas Carol were included but that was not enough to make significance. In regards to ratings, movies tend to not strive for the R-rated movie as it limits its viewers at the movie theaters; even though it was not statistically significant, it would actually increase the revenue of a movie. Finally, the time of the movie was interesting. The general thinking is that summer and Christmas time movies are where most blockbusters are produced, however this seemed to not be the case. The first model that was run is Equation 2. The difference in this model is there was “lnopening” rather than “percentopen.” Due to multicollinearity, we made that variable to be a percentage of the opening weekend to the overall success. We were thinking of adding genres to the model: animation, family, action, romance, fantasy, western, comedy, drama, thriller, adventure, sports, and musical. The problem presented was a small sample bias and there were multicollinearity issues as well. The next stop was to look at why exactly studios decide to remake or reboot a movie (as opposed to making a sequel). In this step, we added new variables called “number in series” and “number in series squared.” This is similar to number in franchise, yet the variable gets reset when the franchise has been rebooted. Take for example the James Bond series, Casino Royale was the 22nd James Bond movie (number in franchise). At the same time, this was considered a reboot, so this was also listed as 1 in “number in series.” Furthermore, Quantum of Solace was 23 for number in franchise, and 2 for number in series. Number in series squared is added to show diminishing returns. In addition, sequel/prequel was dropped from the model due to multicollinearity. Results are shown in Table 3. Number in series has a significant positive effect while number in series squared has a significant negative effect, which fits perfectly with our theory. By rebooting (or remaking) a franchise/movie box office success increases by 31.67 percent. However, and more importantly, there are diminishing returns from making sequels. Again, to reference the Saw
series, it is a franchise that has died off over time. This is very enlightening as it can help create insight to movie franchises. If the franchise is good or entertaining, the majority of people enjoy sequels, yet at some point we, as an audience need a fresh start, and our results indicate this. As far as other problems in our model, there may be some unobserved heterogeneity in the model. As the literature suggests, there are so many other factors that influence a movies’ success. This can range anywhere from what actors or directors are in the movie, on demand viewing, the state of the economy, and geographic tastes, among others. COEFFICIENT OF VARIATION Now reboots and remakes were not significant. We were expecting to see that reboots would increase the revenues. So we need to look at a few factors regarding this decision. There were a good amount of reboots that were made in the last few years, and they were being released one after another. The economy as a whole was poor during the time in which all of these movies were released. We also separated our results between domestic revenue, overseas revenue and worldwide revenue and there were no real significant differences. Putting these facts together it could be that these movies were just considered to be a safe asset. Movie industries are flushing in tens and hundreds of million dollars, so there must be a return. This could show why movies were being rebooted.
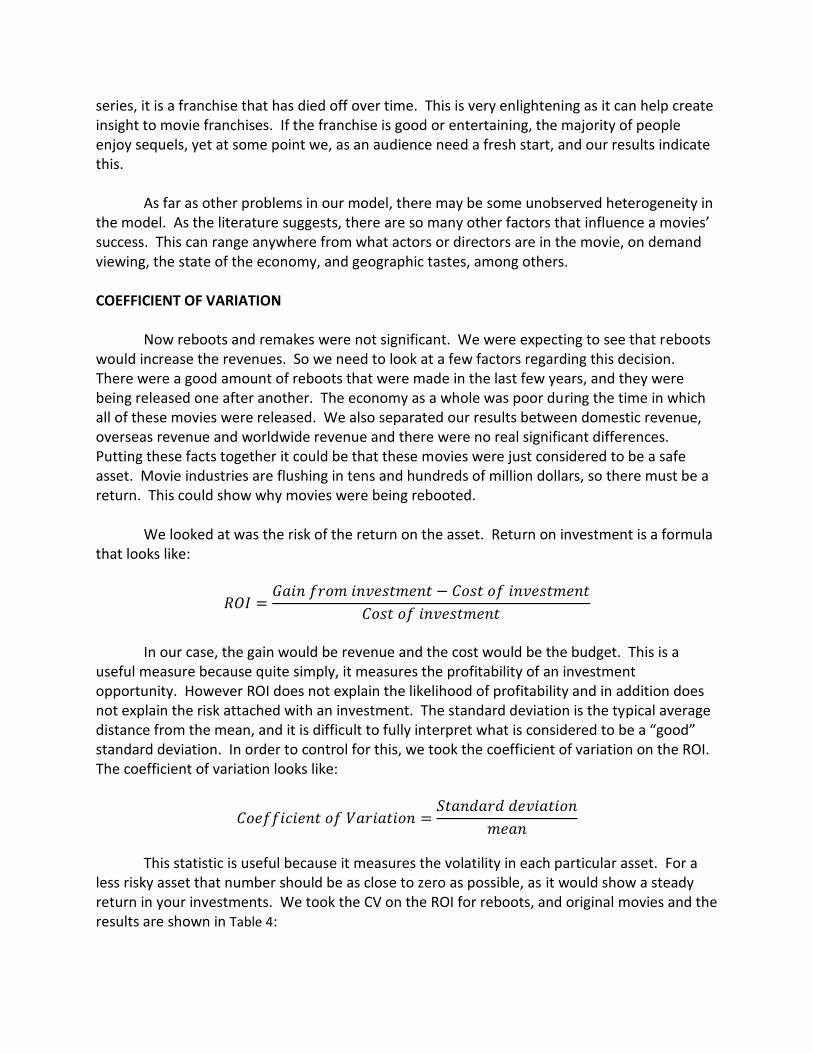
We looked at was the risk of the return on the asset. Return on investment is a formula that looks like:
In our case, the gain would be revenue and the cost would be the budget. This is a useful measure because quite simply, it measures the profitability of an investment opportunity. However ROI does not explain the likelihood of profitability and in addition does not explain the risk attached with an investment. The standard deviation is the typical average distance from the mean, and it is difficult to fully interpret what is considered to be a “good” standard deviation. In order to control for this, we took the coefficient of variation on the ROI. The coefficient of variation looks like:
This statistic is useful because it measures the volatility in each particular asset. For a less risky asset that number should be as close to zero as possible, as it would show a steady return in your investments. We took the CV on the ROI for reboots, and original movies and the results are shown in Table 4:
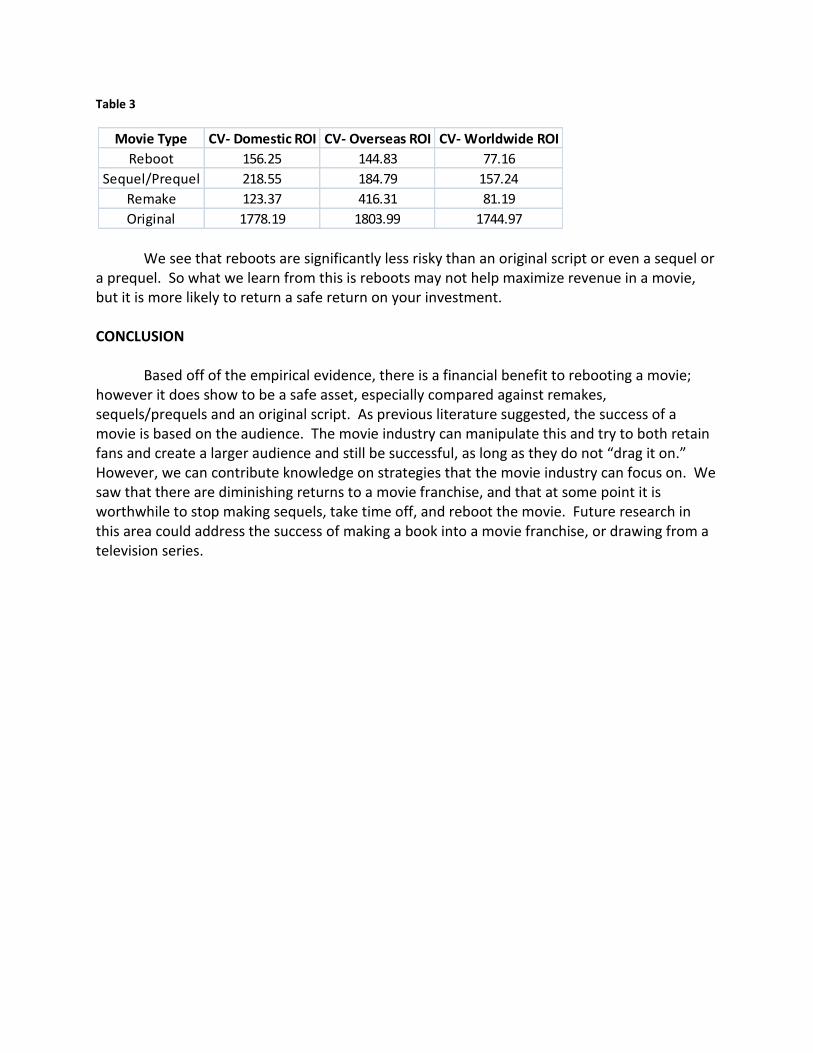
Table 3
We see that reboots are significantly less risky than an original script or even a sequel or a prequel. So what we learn from this is reboots may not help maximize revenue in a movie, but it is more likely to return a safe return on your investment. CONCLUSION Based off of the empirical evidence, there is a financial benefit to rebooting a movie; however it does show to be a safe asset, especially compared against remakes, sequels/prequels and an original script. As previous literature suggested, the success of a movie is based on the audience. The movie industry can manipulate this and try to both retain fans and create a larger audience and still be successful, as long as they do not “drag it on.” However, we can contribute knowledge on strategies that the movie industry can focus on. We saw that there are diminishing returns to a movie franchise, and that at some point it is worthwhile to stop making sequels, take time off, and reboot the movie. Future research in this area could address the success of making a book into a movie franchise, or drawing from a television series.
Movie Type CV- Domestic ROI CV- Overseas ROI CV- Worldwide ROI
Reboot 156.25 144.83 77.16
Sequel/Prequel 218.55 184.79 157.24
Remake 123.37 416.31 81.19
Original 1778.19 1803.99 1744.97

APPENDIX Figure 1:
Year Movie Franchise
2005 Batman Begins Batman
2005 The Legend of Zorro The Legend of Zorro
2005 Herbie: Fully Loaded Herbie
2005 Wallace and Gromit Wallace and Gromit
2005 King Kong King Kong
2005 The Amityville Horror The Amityville Horror
2005 Charlie and the Chocolate Factory Willie Wonka and the Chocolate Factory
2006 The Pink Panther Pink Panther
2006 Charlotte’s Web Charlotte’s Web
2006 Superman Superman
2006 Casino Royale James Bond
2007 Alvin and the Chipmunks Alvin and the Chipmunks
2007 TMN Teenage Mutant Ninja Turtles
2008 Prom Night Prom Night
2008 Death Race Death Race
2009 Friday the 13th Friday the 13th
2009 X-Men Origins: Wolverine X-Men
2009 Underworld: Rise of the Lycans Underworld
2009 Terminator: Salvation Terminator
2009 Star Trek Star Trek
2010 Clash of the Titans Clash of the Titans
2010 Predators Predators
2010 The Karate Kid The Karate Kid
2010 Robin Hood Robin Hood
2010 True Grit True Grit
2010 A Nightmare on Elm Street A Nightmare on Elm Street
Equation 1

Equation 2
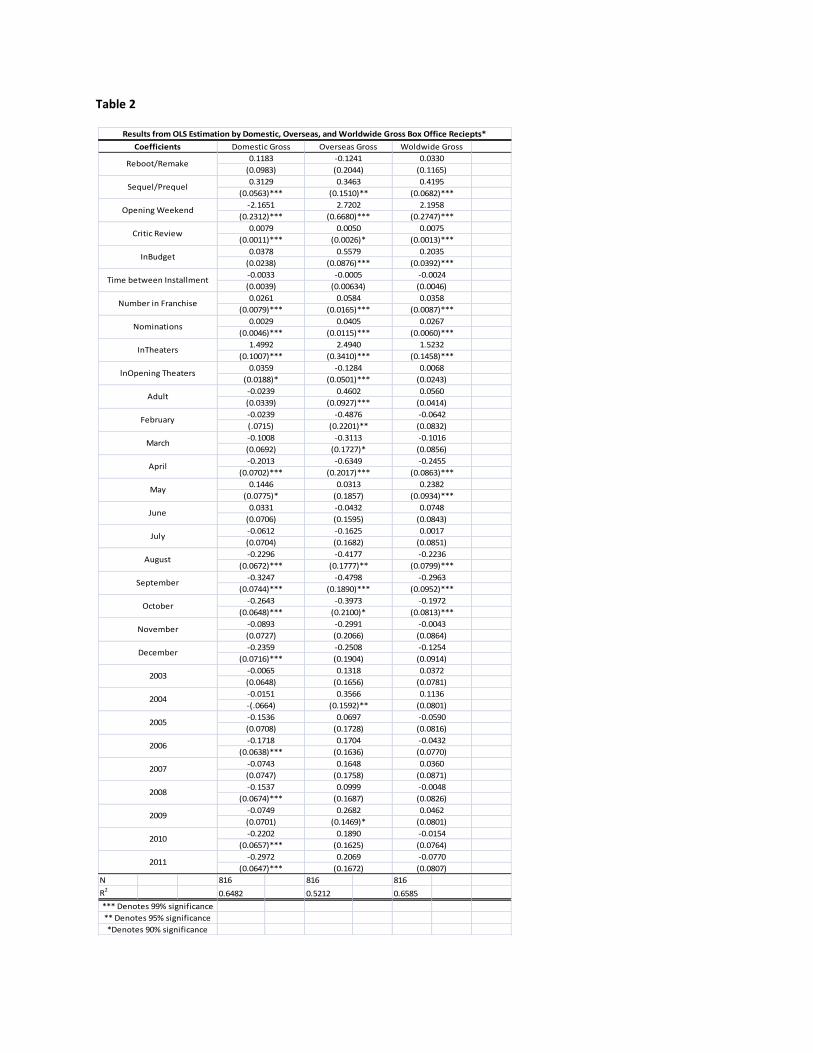
Table 2
N 816 816 816
R20.6482 0.5212 0.6585
*** Denotes 99% significance
** Denotes 95% significance
*Denotes 90% significance
(0.2044)
0.0330
(0.1165)Reboot/Remake
Woldwide Gross
(0.0039)
0.0261
(0.0079)***
0.0029
(0.2312)***
0.0079
(0.0011)***
0.0378
(0.0238)
-0.0033
Domestic Gross
0.1183
0.3463
(0.1510)**
2.7202
(0.6680)***
0.0050
(0.0026)*
(0.00634)
May
June
July
August
Results from OLS Estimation by Domestic, Overseas, and Worldwide Gross Box Office Reciepts*
Coefficients
InTheaters
lnOpening Theaters
Adult
February(.0715)
0.5579
(0.0876)***
-0.0005Time between Installment
Number in Franchise
Nominations
(0.0983)
Sequel/Prequel
Opening Weekend
Critic Review
InBudget
Overseas Gross
-0.1241
2011
0.3129
(0.0563)***
-2.1651
(0.1007)***
0.0359
(0.0188)*
-0.0239
-0.0239
(0.0339)
2005
2006
2007
2008
2009
2010
September
October
November
December
2003
2004
March
April
(0.0647)***
-0.2972
(0.0657)***
-0.2202
(0.0701)
-0.0749
(0.0674)***
-0.1537
(0.0747)
(0.0672)***
-0.3247
-0.1008
(0.0692)
-0.2013
(0.0702)***
0.1446
-0.0743
(0.0638)***
-0.1718
(0.0708)
-0.1536
-(.0664)
0.0331
-0.0151
(0.0744)***
-0.2643
(0.0648)***
-0.0893
(0.0727)
-0.2359
(0.0706)
0.0584
(0.0165)***
0.0405
(0.0115)***
2.4940
(0.0716)***
-0.0065
(0.0648)
(0.0775)*
(0.0046)***
1.4992
(0.1727)*
-0.6349
(0.2017)***
0.0313
(0.3410)***
-0.1284
(0.0501)***
0.4602
(0.0927)***
-0.4876
-0.0612
(0.0704)
-0.2296
0.4195
(0.0682)***
2.1958
(0.2747)***
0.0075
(0.0013)***
0.2035
(0.1758)
0.0999
(0.1592)**
0.0697
(0.1728)
0.1704
(0.1636)
0.1648
(0.2066)
-0.2508
(0.1904)
0.1318
(0.1656)
0.3566
(0.1777)**
-0.4798
(0.1890)***
(0.0392)***
-0.0024
(0.0046)
0.0358
(0.0087)***
0.0267
(0.1625)
0.2069
(0.1672)
(0.1687)
0.2682
(0.1469)*
0.1890
-0.3973
(0.2100)*
-0.2991
(0.1857)
-0.0432
(0.1595)
-0.1625
(0.1682)
-0.4177
(0.2201)**
-0.3113
(0.0414)
-0.0642
(0.0832)
-0.1016
(0.0856)
-0.2455
(0.0060)***
1.5232
(0.1458)***
0.0068
(0.0243)
0.0560
(0.0851)
-0.2236
(0.0799)***
-0.2963
(0.0952)***
-0.1972
(0.0863)***
0.2382
(0.0934)***
0.0748
(0.0843)
0.0017
(0.0781)
0.1136
(0.0801)
-0.0590
(0.0816)
-0.0432
(0.0813)***
-0.0043
(0.0864)
-0.1254
(0.0914)
0.0372
(0.0801)
-0.0154
(0.0764)
-0.0770
(0.0807)
(0.0770)
0.0360
(0.0871)
-0.0048
(0.0826)
0.0462
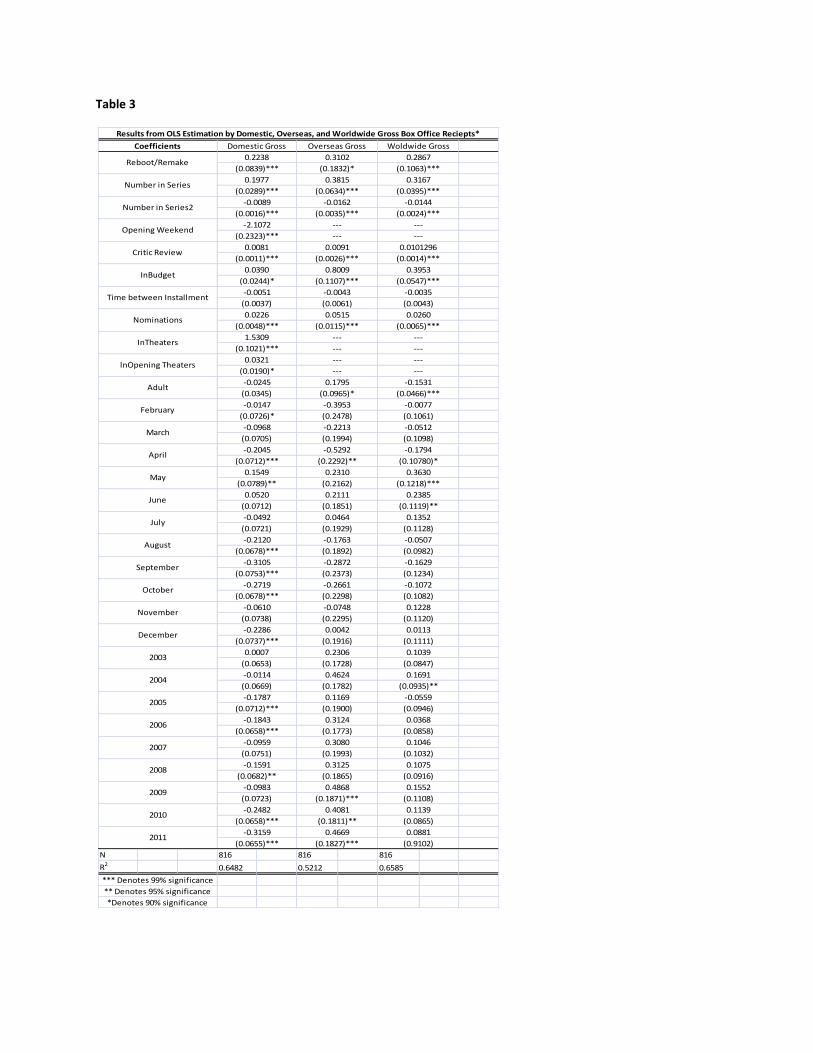
Table 3
N 816 816 816
R20.6482 0.5212 0.6585
*** Denotes 99% significance
** Denotes 95% significance
*Denotes 90% significance
Results from OLS Estimation by Domestic, Overseas, and Worldwide Gross Box Office Reciepts*
Coefficients Domestic Gross Overseas Gross Woldwide Gross
Reboot/Remake0.2238 0.3102 0.2867
(0.0839)*** (0.1832)* (0.1063)***
0.1977 0.3815 0.3167
(0.0289)*** (0.0634)*** (0.0395)***Number in Series
-2.1072 --- ---
(0.2323)*** --- ---Opening Weekend
-0.0089 -0.0162 -0.0144
(0.0016)*** (0.0035)*** (0.0024)***Number in Series2
0.0390 0.8009 0.3953
(0.0244)* (0.1107)*** (0.0547)***InBudget
0.0081 0.0091 0.0101296
(0.0011)*** (0.0026)*** (0.0014)***Critic Review
0.0226 0.0515 0.0260
(0.0048)*** (0.0115)*** (0.0065)***Nominations
-0.0051 -0.0043 -0.0035
(0.0037) (0.0061) (0.0043)Time between Installment
0.0321 --- ---
(0.0190)* --- ---lnOpening Theaters
1.5309 --- ---
(0.1021)*** --- ---InTheaters
-0.0147 -0.3953 -0.0077
(0.0726)* (0.2478) (0.1061)February
-0.0245 0.1795 -0.1531
(0.0345) (0.0965)* (0.0466)***Adult
-0.2045 -0.5292 -0.1794
(0.0712)*** (0.2292)** (0.10780)*April
-0.0968 -0.2213 -0.0512
(0.0705) (0.1994) (0.1098)March
0.0520 0.2111 0.2385
(0.0712) (0.1851) (0.1119)**June
0.1549 0.2310 0.3630
(0.0789)** (0.2162) (0.1218)***May
-0.2120 -0.1763 -0.0507
(0.0678)*** (0.1892) (0.0982)August
-0.0492 0.0464 0.1352
(0.0721) (0.1929) (0.1128)July
-0.2719 -0.2661 -0.1072
(0.0678)*** (0.2298) (0.1082)October
-0.3105 -0.2872 -0.1629
(0.0753)*** (0.2373) (0.1234)September
-0.2286 0.0042 0.0113
(0.0737)*** (0.1916) (0.1111)December
-0.0610 -0.0748 0.1228
(0.0738) (0.2295) (0.1120)November
-0.0114 0.4624 0.1691
(0.0669) (0.1782) (0.0935)**2004
0.0007 0.2306 0.1039
(0.0653) (0.1728) (0.0847)2003
-0.1843 0.3124 0.0368
(0.0658)*** (0.1773) (0.0858)2006
-0.1787 0.1169 -0.0559
(0.0712)*** (0.1900) (0.0946)2005
-0.1591 0.3125 0.1075
(0.0682)** (0.1865) (0.0916)2008
-0.0959 0.3080 0.1046
(0.0751) (0.1993) (0.1032)2007
2011
-0.2482 0.4081 0.1139
(0.0658)*** (0.1811)** (0.0865)2010
-0.0983 0.4868 0.1552
(0.0723) (0.1871)*** (0.1108)2009
-0.3159
(0.0655)***
0.4669
(0.1827)***
0.0881
(0.9102)
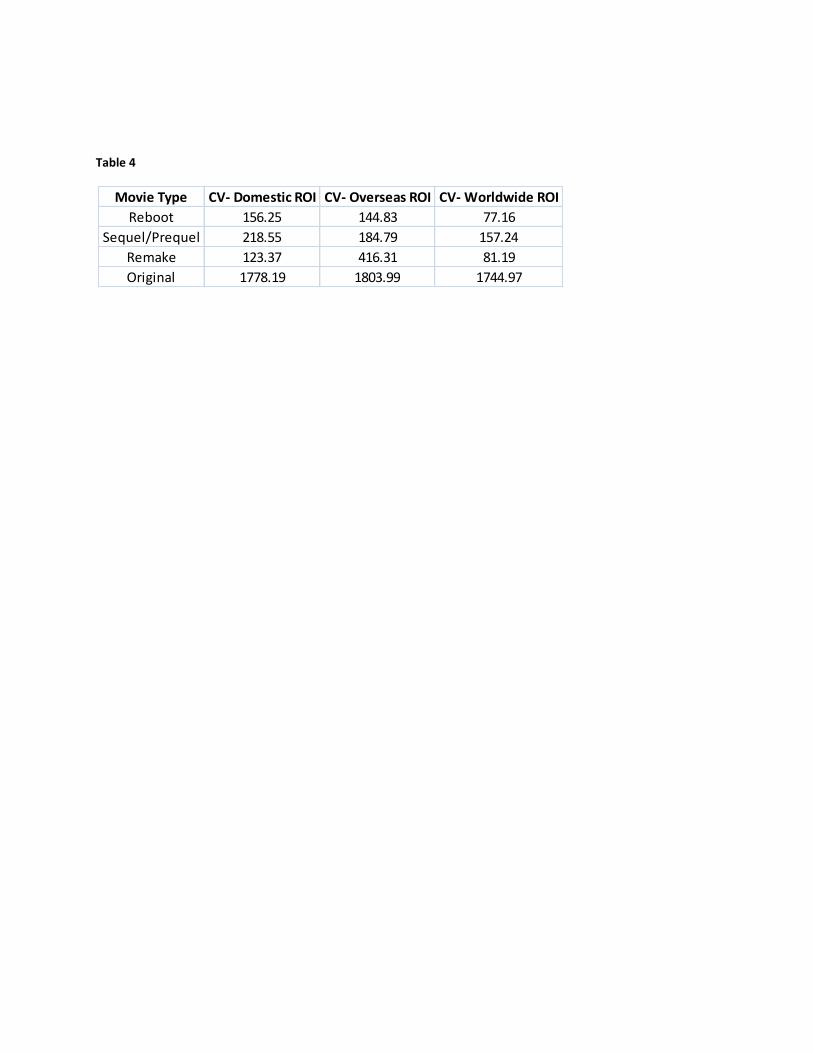
Table 4
Movie Type CV- Domestic ROI CV- Overseas ROI CV- Worldwide ROI
Reboot 156.25 144.83 77.16
Sequel/Prequel 218.55 184.79 157.24
Remake 123.37 416.31 81.19
Original 1778.19 1803.99 1744.97
REFERENCES Basuroy, S., Chatterjee, S., & Ravid, A. (2003). How critical are critical reviews? The box office effects of film critics, star power, and budgets. Journal of Marketing, 67, 103-117. Retrieved from http://www.jstor.org/stable/10.2307/30040552 Box office mojo. (2011). Retrieved from http://www.boxofficemojo.com De Vany, A., & Walls, D. (1999). Uncertainty in the movie industry: Does star power reduce the terror of the box office?. A, Retrieved from http://student.bus.olemiss.edu/files/ conlon/mis309/Lectures/Lecture9/Webpages/MIS309WebPage/Webpages_Summer10/ Papers_References/. Uncertainty in the movie industry_Does star power reduce the terror of the box office.pdf Ginsburgh, V., Pestieau, P., & Weyers, S. (2006). Are remakes doing as well as originals?. Retrieved from http://www.ecares.org/ecare/personal/ginsburgh/papers/004. remakes.pdf Harris, P. (2011, Jan 1). Hollywood takes a safe bet for 2011 with the year of the repeat. The Observer, Retrieved from http://www.guardian.co.uk/film/2011/jan/02/hollywood- remakes-sequels-weinstein International movie database. (2011). Retrieved from http://www.imdb.com Litman, B. R. (1983). Predicting success of theatrical movies: An empirical study. The Journal of Popular Culture, 16(4), 159–175. doi: 10.1111/j.0022-3840.1983.1604_159.x Movie 'reboots' are the latest fad in hollywood. (2010, Sep 18). Herald Review, Retrieved from http://www.herald-review.com/entertainment/movies/article_78400556-c1c1-11df- a838-001cc4c002e0.html Port, L. (2011, April 7). Monkey business and marketing genius: Why the hangover 2 trailer incident is worth studying. Legal Productivity, DOI: http://legalproductivity.rocketmatter.com/legal-marketing/monkey-business-and- marketing-genius-why-the-hangover-2-trailer-incident-is-worth-studying/ Sharda, R. (2005). Predicting box-office success of motion pictures with neural networks. Expert Systems with Applications, 30(2), 243-254. doi: http://dx.doi.org/10.1016/j.eswa.2005 .07.018 Terrry, N., Butler, M., & De'Armond, D. (2005). The determinants of domestic box office performance in the motion picture industry. Southwestern Economic Review, 137-148. Retrieved from http://www.ser.tcu.edu/2005/SER2005TerryButlerDeArmond137- 148.pdf
Terrry, N., & De'Armond, D. (2008). The determinants of movie rental revenue earnings. Academy of Marketing Studies Journal, Retrieved from http://findarticles.com/p/ articles/mi_hb6167/is_2_12/ai_n32103626/ Theatrical market statistics. (2010). Retrieved from http://www.mpaa.org/Resources/93bbeb 16-0e4d-4b7e-b085-3f41c459f9ac.pdf The economic history of major league baseball. In (2010). Retrieved from http://eh.net/ encyclopedia/article/haupert.mlb Wdw ticket increase guide. (2011). Retrieved from http://citationmachine.net/index2. php?reqstyleid=2&mode=form&reqsrcid=APAWebPage&srcCode=11&more=yes&name Cnt=1