tides and tide datums new york state association of professional land surveyors ... ·...
TRANSCRIPT

Tides and Tide Datums
New York State Association of
Professional Land Surveyors
Conference January 2019
1

Presented byPeter Borbas, PLS, PP
-NY and NJ licensed professional surveyor and NJ professional planner-Past President of the Geographic and Land Information Society-Past Chairman of the
American Congress on Surveying and Mapping-Past Chairman of the
New Jersey Society of Professional Land Surveyors GIS/LIS Committee-Serving on the advisory boards for the surveying degree programs at
Paul Smiths College and the New Jersey Institute of Technology
J. Peter Borbas, PLS, PPBorbas Surveying and Mapping, LLC
2

I wish to sincerely thank
Dr. Joshua Greenfeld
Professor Emeritus
New Jersey Institute of Technology
for his continuing guidance,
and contribution to this program
As well as NOAA and NGS for many of the photos and text content included here;
and the terrific tools and support they give us!!!

Introduction and Audience
◼ Who are we and why are we here?
◼ Surveyors? Boats? Water Work? GPS/GNSS? Sonar?
◼ Learn something new
◼ To benefit others
◼ Provide more services
◼ Reduce liability
◼ Teach others
◼ Increase revenue and profits
◼ What else, why are you here?
4

Workshop Outline
Introductions
Examples
Understanding Tides
Glossary for our discussion
Types of Tides
Datums
Tide Stations
Datum Determination
Laws Pertaining to Tides
Datum Conversions
Determining Land Boundaries
Resources
Vdatum 5

ExamplesHarlem River
Liberty Island
Egg Harbor
7


The Tide Phenomenon
The word
TIDE
is a generic term used to define the alternating rise and
fall in sea level with respect to the land.

The Main Factors Instigating Tides Are:
Gravitational attraction of the moon and the sun.
Configuration of the coastline
Local depth of the water
Ocean-floor topography
Hydrographic influences
Meteorological influences (including extreme conditions)
The Factors Could Impact the Tides
Magnitude and/or Time of Arrival
The Tide Phenomenon


A Lack of Understanding
◼ Betio Island in the Tarawa atoll 1943
◼ Lowest tide of the year was unexpected
◼ Landing craft (Higgins boats) could not pass the reef only the LVT’s could cross or Marines waded in to the beach
◼ Not understanding the tides meant LOSS OF LIFE
18

Marine battle planners had expected the normal rising tide to provide a water depth of 5 feet ,
the Higgins boats had a 4 foot draft.
This particular day the ocean experienced a neap tide,
and the tide did not rise.
Some said “the ocean just sat there“.
The mean depth was 3 feet.

Plum Island New YorkSuperstorm Sandy

Surveyor Schappell Studying the
Shifting Sands after Sandy
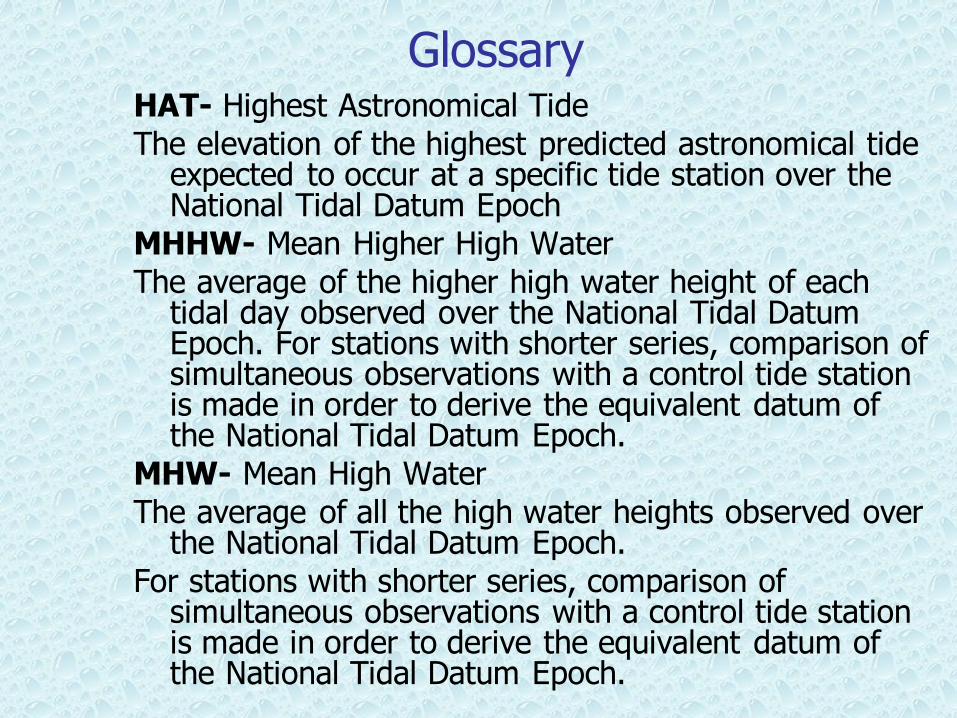
GlossaryHAT- Highest Astronomical TideThe elevation of the highest predicted astronomical tide
expected to occur at a specific tide station over the National Tidal Datum Epoch
MHHW- Mean Higher High WaterThe average of the higher high water height of each
tidal day observed over the National Tidal Datum Epoch. For stations with shorter series, comparison of simultaneous observations with a control tide station is made in order to derive the equivalent datum of the National Tidal Datum Epoch.
MHW- Mean High WaterThe average of all the high water heights observed over
the National Tidal Datum Epoch. For stations with shorter series, comparison of
simultaneous observations with a control tide station is made in order to derive the equivalent datum of the National Tidal Datum Epoch.

DTL- Diurnal Tide Level
The arithmetic mean of mean higher high water and mean lower low water.
MTL-Mean Tide Level
The arithmetic mean of mean high water and mean low water.
MSL- Mean Sea Level
The arithmetic mean of hourly heights observed over the National Tidal Datum Epoch. Shorter series are specified in the name; e.g. monthly mean sea level and yearly mean sea level.

MLW- Mean Low WaterThe average of all the low water heights observed over the
National Tidal Datum Epoch. For stations with shorter series, comparison of simultaneous
observations with a control tide station is made in order to derive the equivalent datum of the National Tidal Datum Epoch.
MLLW- Mean Lower Low WaterThe average of the lower low water height of each tidal day
observed over the National Tidal Datum Epoch. For stations with shorter series, comparison of simultaneous
observations with a control tide station is made in order to derive the equivalent datum of the National Tidal Datum Epoch.

LAT- Lowest Astronomical TideThe elevation of the lowest astronomical predicted tide expected to occur at a specific tide station over the National Tidal Datum Epoch.
GT- Great Diurnal RangeThe difference in height between mean higher high water and mean lower low water.
MN- Mean Range of TideThe difference in height between mean high water and mean low water.
DHQ- Mean Diurnal High Water InequalityThe difference in height of the two high waters of each tidal day for a mixed or semidiurnal tide.
DLQ- Mean Diurnal Low Water InequalityThe difference in height of the two low waters of each tidal day for a mixed or semidiurnal tide.

HWI- Greenwich High Water IntervalThe average interval (in hours) between the moon's transit over the Greenwich meridian and the following high water at a location.
LWI- Greenwich Low Water IntervalThe average interval (in hours) between the moon's transit over the Greenwich meridian and the following low water at a location.
Max Tide- Highest Observed TideThe maximum height reached by a rising tide. The high water is due to the periodic tidal forces and the effects of meteorological, hydrologic, and/or oceanographic conditions.
Min Tide- Lowest Observed TideThe minimum height reached by a falling tide. The low water is due to the periodic tidal forces and the effects of meteorological, hydrologic, and/or oceanographic conditions.

Station Datum- A fixed base elevation at a tide station to which all water level measurements are referred. The datum is unique to each station and is established at a lower elevation than the water is ever expected to reach. It is referenced to the primary bench mark at the station and is held constant regardless of changes to the water level gauge or tide staff. The datum of tabulation is most often at the zero of the first tide staff installed.
National Tidal Datum Epoch- The specific 19-year period adopted by the National Ocean Service as the official time segment over which tide observations are taken and reduced to obtain mean values (e.g., mean lower low water, etc.) for tidal datums.

Types of Tides
Tides are caused by gravitational pull of the moon and the sun
Some locations have diurnal tides:
one high tide and one low tide per day
Most locations have semidiurnal tides:
the tide cycles through a high and low twice each day
with one of the two high tides being higher than the other and one of the two low tides being lower than the other


For example: transitional tide areas, along parts of the Gulf Coast of Florida and along the west coast.
Tidal Period
HHW
LLW
HLW
LHW3
2
1
0
-1
-2
-3
-4
Datum
Tidal DayTidal Day
Tidal Period
Mixed tide - Two considerably unequal higher high and lower high waters and/or higher low and lower low waters that occur during a tidal day.


Tides During a Lunar Cycle
-2
-1
0
1
2
3
4
5
6
71 3 5 7 9
11
13
15
17
19
21
23
25
27
29
Day of the Lunar Cycle
Tid
e H
eig
ht
(ft)
High
Low

Tide Terminology
Tidal Period Tidal DayHigher
High Water
Lower
Low Water
Higher
Low Water
Lower
High Water3
2
1
0
-1
-2
-3
-4
Datum
Tid
al R
ange
Tid
al R
ise
Tid
al R
ange
Tidal Amplitude = ½ Range
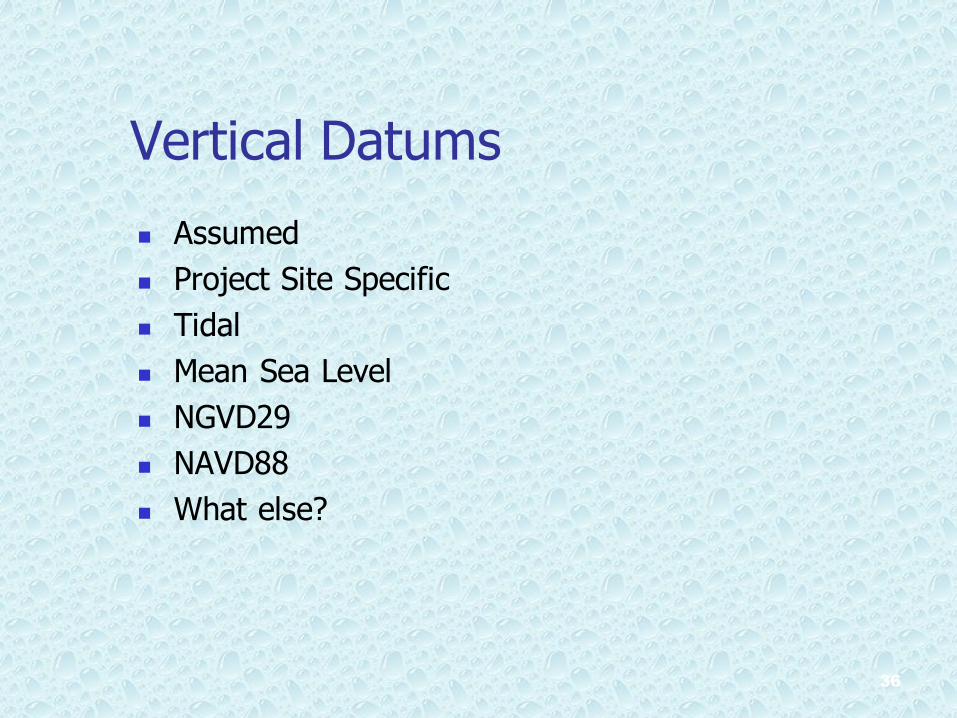
Vertical Datums
◼ Assumed
◼ Project Site Specific
◼ Tidal
◼ Mean Sea Level
◼ NGVD29
◼ NAVD88
◼ What else?
36
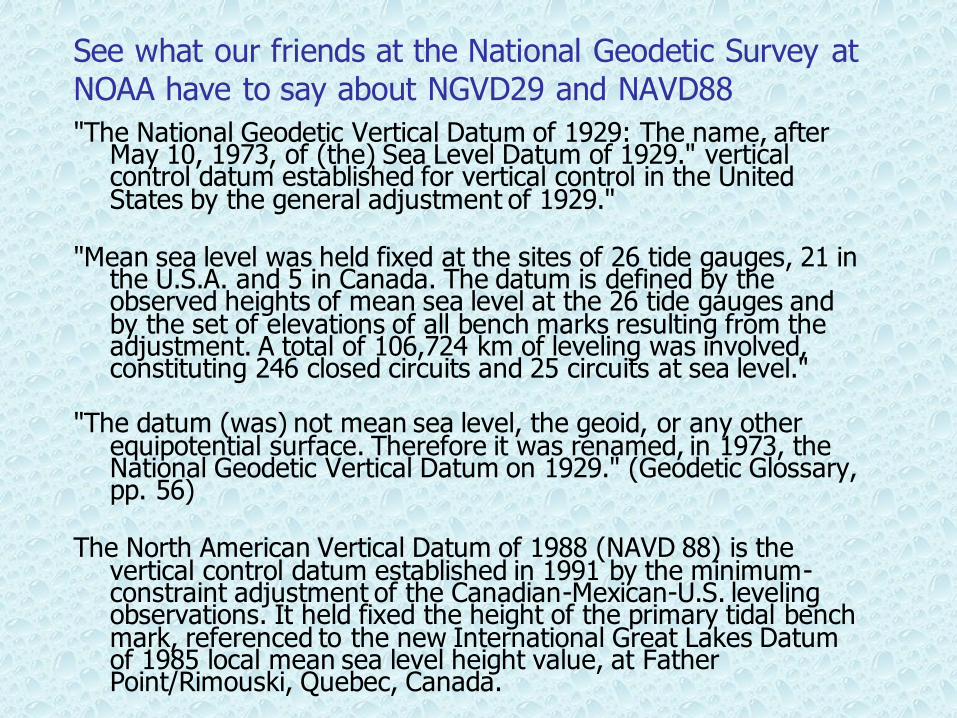
See what our friends at the National Geodetic Survey at NOAA have to say about NGVD29 and NAVD88
"The National Geodetic Vertical Datum of 1929: The name, after May 10, 1973, of (the) Sea Level Datum of 1929." vertical control datum established for vertical control in the United States by the general adjustment of 1929."
"Mean sea level was held fixed at the sites of 26 tide gauges, 21 in the U.S.A. and 5 in Canada. The datum is defined by the observed heights of mean sea level at the 26 tide gauges and by the set of elevations of all bench marks resulting from the adjustment. A total of 106,724 km of leveling was involved, constituting 246 closed circuits and 25 circuits at sea level."
"The datum (was) not mean sea level, the geoid, or any other equipotential surface. Therefore it was renamed, in 1973, the National Geodetic Vertical Datum on 1929." (Geodetic Glossary, pp. 56)
The North American Vertical Datum of 1988 (NAVD 88) is the vertical control datum established in 1991 by the minimum-constraint adjustment of the Canadian-Mexican-U.S. leveling observations. It held fixed the height of the primary tidal bench mark, referenced to the new International Great Lakes Datum of 1985 local mean sea level height value, at Father Point/Rimouski, Quebec, Canada.

Mean Sea Level – The average height of the surface of the sea for all stages of the tide over a 19 year period.
Mean Sea Level Datum- A determination of mean sea level that has been adopted as a standard datum for heights or elevations.
An example could be the Sea Level Datum of 1929.
You need to know what years the MSL was determined.
People tend to use the term loosely and incorrectly.
Frequently, people incorrectly refer to MSL as the 1929
adjustment or NGVD29.38
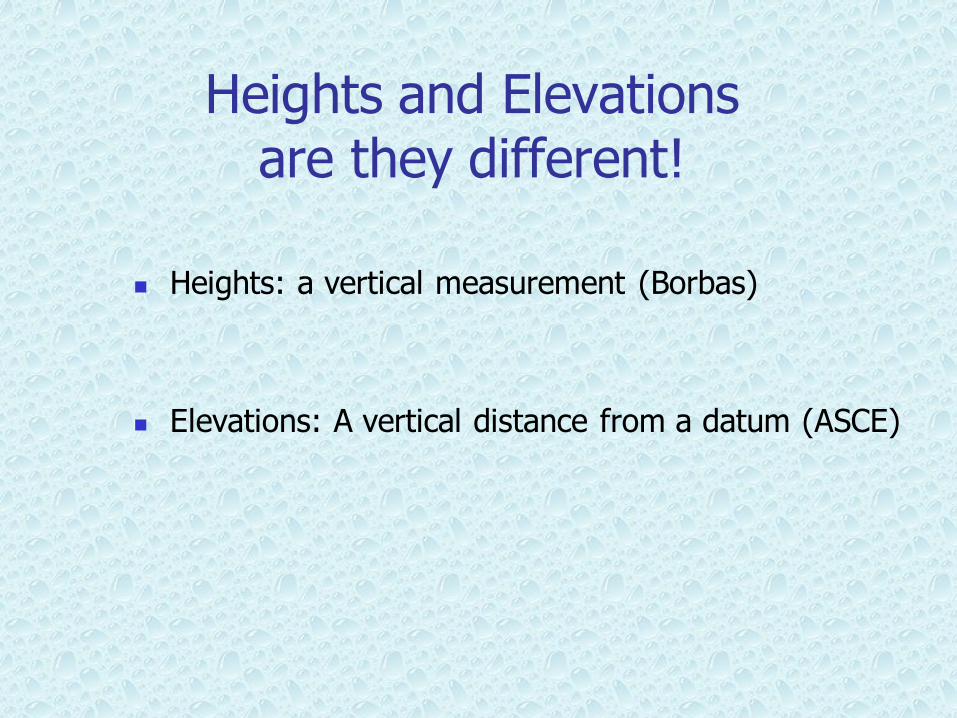
Heights and Elevationsare they different!
◼ Heights: a vertical measurement (Borbas)
◼ Elevations: A vertical distance from a datum (ASCE)

TM is the Time Meridian, it is the reference meridian used to calculate time.
An epoch is a 19-year tidal cycle used to calculate datums.
The present National Tidal Datum Epoch (NTDE) is 1983 through 2001.
Tidal datums in certain regions with anomalous sea level changes such as Alaska and the Gulf of Mexico are calculated on a Modified 5-Year Epoch.

NOAA San Francisco Tide Station, in operation for more than 150 years.
Before computers were used to record water levels (especially tides), special "tide houses" sheltered permanent tide gauges. Housed inside was the instrumentation—
including a well and a mechanical pen-and-ink (analog) recorder—while attached outside
was a tide or tidal staff. Essentially a giant measuring stick, the tide staff allowed scientists to manually observe tidal levels and then compare them to readings taken
every six minutes by the recorder. Tide houses and the data they recorded required
monthly maintenance, when scientists would collect the data tapes and mail them to headquarters for manual processing.
41

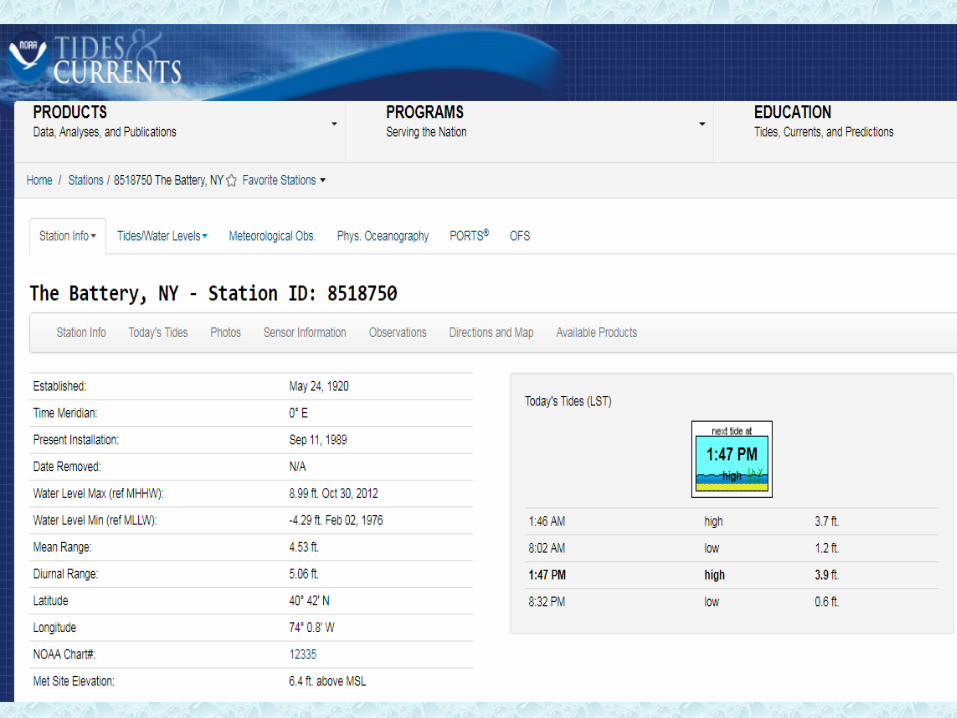
The Battery Tide Station
42

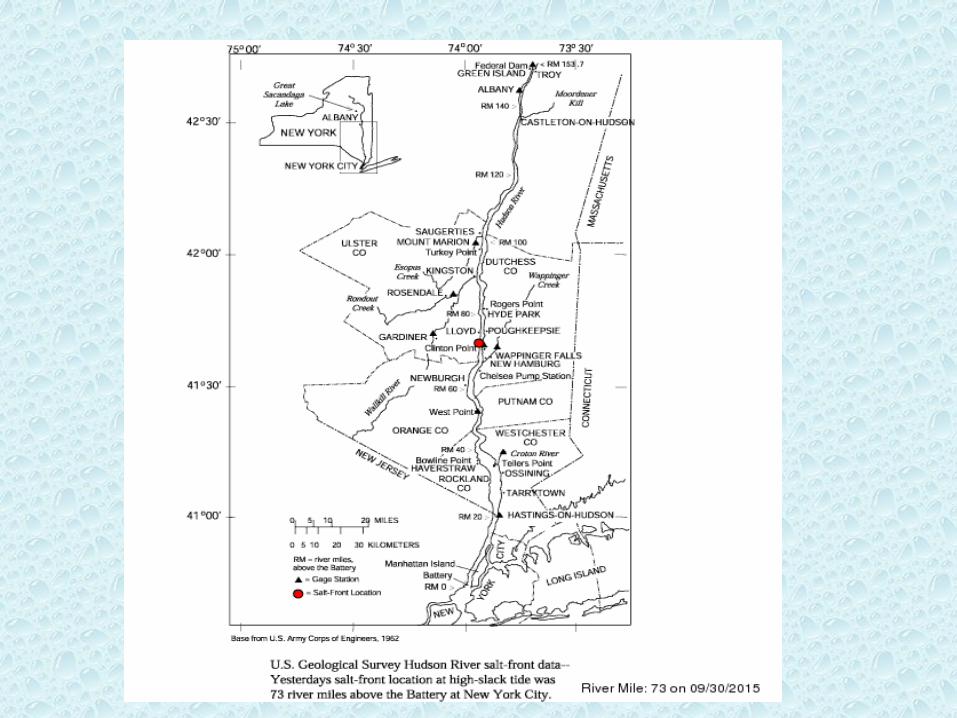
Turkey PointHudson RiverUlster County

The OldBefore computers, special "tide houses" were constructed to shelter permanent
water level recorders, protecting them from harsh environmental conditions. In this diagram, we can see how the analog data recorder is situated inside the house with
the float, and the stilling well located directly beneath it. Attached to one of the
piers' pilings is a tidal staff. This device would allow scientists to manually observe the tidal level and then compare it to the readings taken by the analog recorder.

The NewSimilar in design to older tide houses, newer tide station enclosures are designed to
protect sensitive electronics, transmitting equipment, and backup power and data storage devices. The older stilling well has been replaced with an acoustic sounding
tube and the tidal staff with a pressure sensor. The new field equipment is designed
to operate with the highest level of accuracy with a minimum of maintenance, transmitting data directly back to NOAA headquarters for analysis and distribution.

46
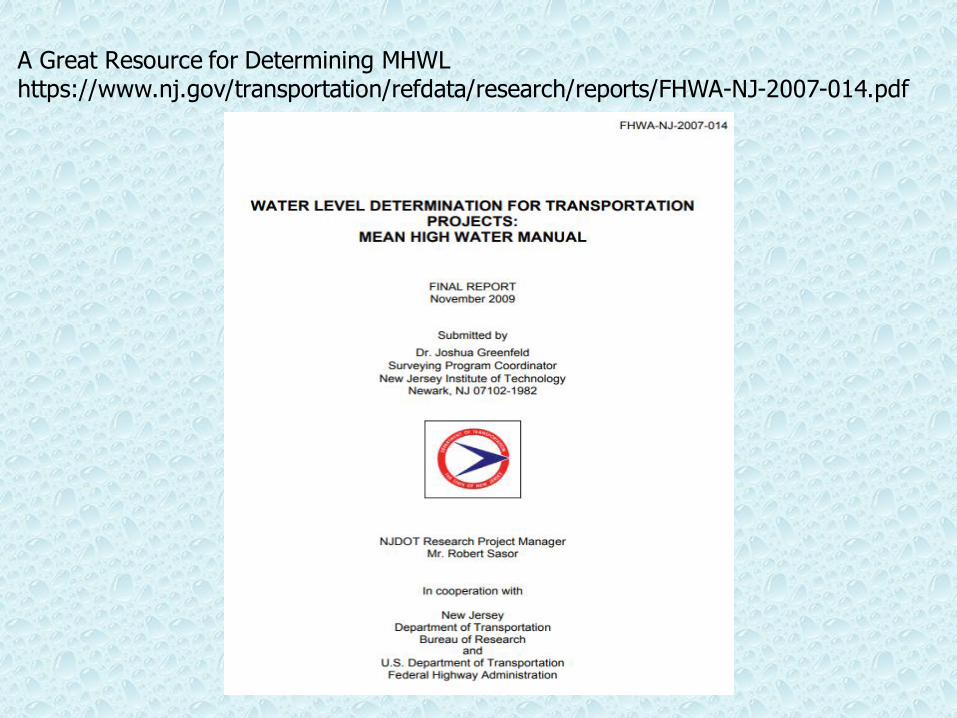
A Great Resource for Determining MHWL https://www.nj.gov/transportation/refdata/research/reports/FHWA-NJ-2007-014.pdf


Datums and Boundaries
49

Interpolating MHWL elevations
There is no tide station at my project site
Interpolate between two tide stations
(White board example)

Tidal Datums (from NOAA)
In general, a datum is a base elevation used as a reference from which to reckon heights or depths.
A tidal datum is a standard elevation defined by a certain phase of the tide.
Tidal datums are used as references to measure local water levels and should not be extended into areas having differing oceanographic characteristics without substantiating measurements.
In order that they may be recovered when needed, such datums are referenced to fixed points known as bench marks.
Tidal datums are also the basis for establishing privately owned land, state owned land, territorial sea, exclusive economic zone, and high seas boundaries.

Benchmarks
◼ Common network and reference systems
◼ Coordinate systems and datums
52

Access to theNational Spatial Reference
System
◼ NGS/NOAA Benchmarks
◼ NGS CORS
◼ New York DOT Real Time Network
◼ Pennsylvania/KeyNet VRS
◼ New Jersey Delaware SmartNet
53

54

55

56

57

58

59
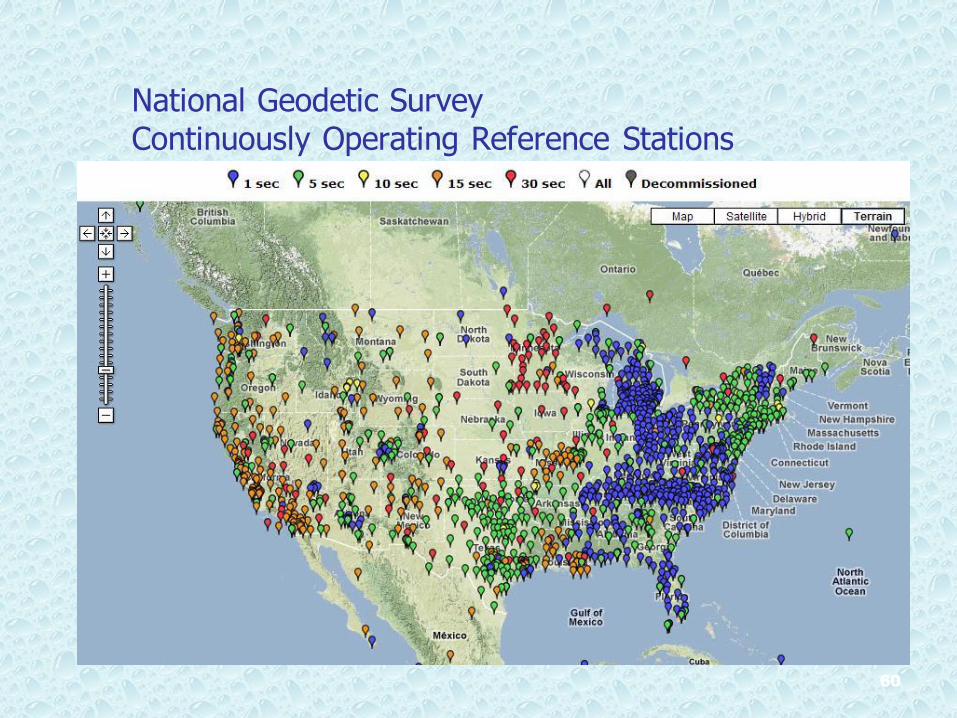
National Geodetic SurveyContinuously Operating Reference Stations
60


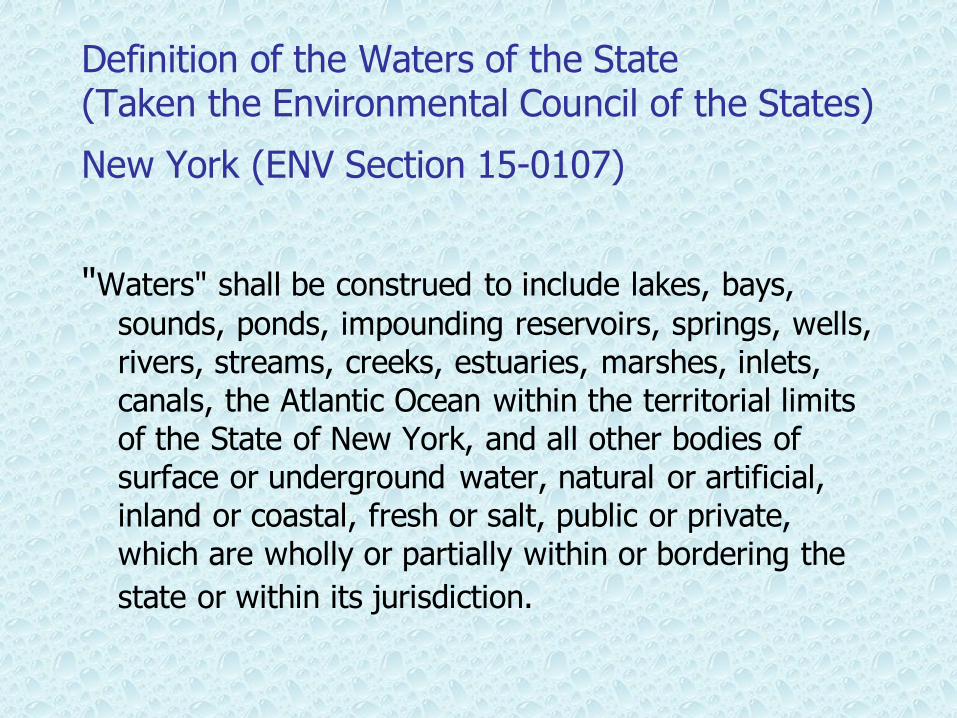
Definition of the Waters of the State(Taken the Environmental Council of the States)
New York (ENV Section 15-0107)
"Waters" shall be construed to include lakes, bays,
sounds, ponds, impounding reservoirs, springs, wells, rivers, streams, creeks, estuaries, marshes, inlets, canals, the Atlantic Ocean within the territorial limits of the State of New York, and all other bodies of surface or underground water, natural or artificial, inland or coastal, fresh or salt, public or private, which are wholly or partially within or bordering the
state or within its jurisdiction.

New York's Marine & Coastal District Waters

NOAA Measuring Stations

T I D A L D A T U M S
Tidal datums at THE BATTERY, NEW YORK HARBOR based on:
LENGTH OF SERIES: 19 YEARS
TIME PERIOD: January 1983 - December 2001
TIDAL EPOCH: 1983-2001
CONTROL TIDE STATION:
Elevations of tidal datums referred to Mean Lower Low Water (MLLW), in METERS:
HIGHEST OBSERVED WATER LEVEL (09/12/1960) = 3.052
MEAN HIGHER HIGH WATER (MHHW) = 1.541
MEAN HIGH WATER (MHW) = 1.443
NORTH AMERICAN VERTICAL DATUM-1988 (NAVD) = 0.847
MEAN SEA LEVEL (MSL) = 0.783
MEAN TIDE LEVEL (MTL) = 0.753
MEAN LOW WATER (MLW) = 0.063
MEAN LOWER LOW WATER (MLLW) = 0.000
LOWEST OBSERVED WATER LEVEL (02/02/1976) = -1.307
Bench Mark Elevation Information In METERS above:
Stamping or Designation MLLW MHW
NO 7 1975 4.468 3.025
NO 3 4.276 2.833
NO 6 1975 3.556 2.113
BM 5.720 4.277
851 8750 TIDAL 749 5.690 4.247
R 340 1952 2.847 1.404
72

Elevations of tidal datums referred to Mean Lower Low Water (MLLW), in METERS:
BENCHMARK NO 7 1975 = 4.468 (3.621 NAVD88)
HIGHEST OBSERVED WATER LEVEL (09/12/1960) = 3.052
MEAN HIGHER HIGH WATER (MHHW) = 1.541
MEAN HIGH WATER (MHW) = 1.443 (0.596 NAVD88)
NORTH AMERICAN VERTICAL DATUM-1988 (NAVD) = 0.847 (0.000 NAVD88)
MEAN SEA LEVEL (MSL) = 0.783
MEAN TIDE LEVEL (MTL) = 0.753
MEAN LOW WATER (MLW) = 0.063
MEAN LOWER LOW WATER (MLLW) = 0.000 (-0.847 NAVD88)
LOWEST OBSERVED WATER LEVEL (02/02/1976) = -1.307
Bench Mark Elevation Information In METERS above:
Stamping or Designation MLLW MHW
NO 7 1975 4.468 3.025
NO 3 4.276 2.833


Interpolating MHWL elevations
There is no tide station at my project site
Interpolate between two tide stations
(White board example)
Beacon to Turkey Point 21.7 miles
Beacon to Rhinecliff 16.3 miles
Rhinecliff to Turkey Point 5.4 miles


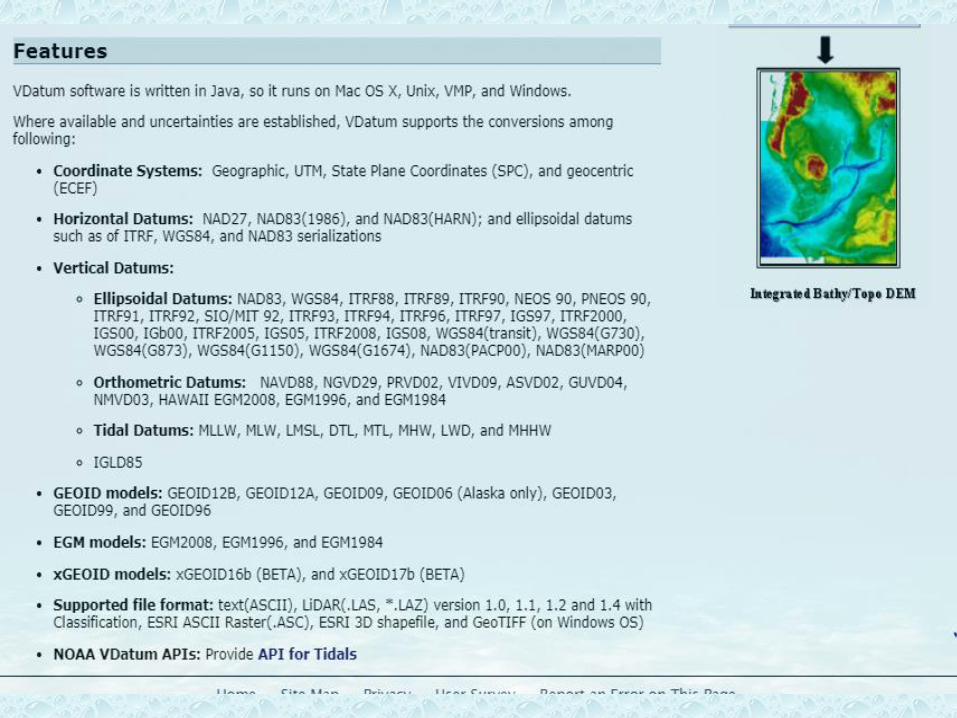
Internet NOAA NGS Vdatum


Internet Exercise
NOAA Tide Station
NOAA Vdatum


For a review of
Riparian and Littoral Law in
New York State
See NYSAPLS Presentation by
Laura Ayers, Esq.
At the NYSAPLS website

Key Take Aways
◼ Can the tide affect my project, and my clients?
◼ Where can I get tide data?
◼ What responsibilities do I have???
◼ What did I learn that I did not know before that can help me? What value can I add to my services
◼ What surprised me?
◼ What was my ahh hah?
◼ ?
◼ ?
90

You have just given up 90 minutes of your total life here on earth!
Thank you for the privilege of allowing me to share it with you.
Now go on and make that 90 minutes mean something to someone.
Peter [email protected]
Office 973-316-8743