the status of the education sector in sudan · the status of the education sector in sudan. ......
TRANSCRIPT
AFRICA HUMAN DEVELOPMENT SERIES
The Status of the Education Sectorin Sudan
Pub
lic D
iscl
osur
e A
utho
rized
Pub
lic D
iscl
osur
e A
utho
rized
Pub
lic D
iscl
osur
e A
utho
rized
Pub
lic D
iscl
osur
e A
utho
rized

The Status of the Education Sector in SudanAFRICA HUMAN
DEVELOPMENT SERIES


The Status of the Education Sector in SudanAFRICA HUMAN
DEVELOPMENT SERIES

© 2012 International Bank for Reconstruction and Development / International DevelopmentAssociation or The World Bank1818 H Street NWWashington DC 20433Telephone: 202-473-1000Internet: www.worldbank.org
1 2 3 4 15 14 13 12
This volume is a product of the staff of The World Bank with external contributions. Thefindings, interpretations, and conclusions expressed in this volume do not necessarilyreflect the views of The World Bank, its Board of Executive Directors, or the governmentsthey represent.
The World Bank does not guarantee the accuracy of the data included in this work. Theboundaries, colors, denominations, and other information shown on any map in this workdo not imply any judgment on the part of The World Bank concerning the legal status of anyterritory or the endorsement or acceptance of such boundaries.
Rights and PermissionsThe material in this work is subject to copyright. Because The World Bank encourages dis-semination of its knowledge, this work may be reproduced, in whole or in part, for non-commercial purposes as long as full attribution to the work is given.
For permission to reproduce any part of this work for commercial purposes, please send arequest with complete information to the Copyright Clearance Center Inc., 222 RosewoodDrive, Danvers, MA 01923, USA; telephone: 978-750-8400; fax: 978-750-4470; Internet:www.copyright.com.
All other queries on rights and licenses, including subsidiary rights, should be addressed tothe Office of the Publisher, The World Bank, 1818 H Street NW, Washington, DC 20433,USA; fax: 202-522-2422; e-mail: [email protected].
ISBN (paper): 978-0-8213-8857-0ISBN (electronic): 978-0-8213-8867-9DOI: 10.1596/978-0-8213-8857-0
Library of Congress Cataloging-in-Publication DataThe status of the education sector in Sudan.
p. cm.“This report was prepared by the World Bank and the Government of National Unity
(GoNU) of the Republic of Sudan”—T.p. verso.Includes bibliographical references.ISBN 978-0-8213-8857-0 — ISBN 978-0-8213-8867-91. Education—Sudan—Evaluation. I. World Bank. II. Sudan.
LA1651.S83 2011370.9624—dc23
2011029392
Cover photo: Amir Abdallah, Blue Nile State © Hassan Zakaria / Sudanese Organization forEducation Development (SOED).

v
Foreword xiii
Acknowledgments xvii
Abbreviations xix
Map: States Featured in This Study, Sudan, 2010 xxi
OVERVIEW 1The Main Findings 2Equity-Oriented Education Spending 14Conclusion 15Notes 16References 16
CHAPTER 1. SETTING THE SCENE 19Scope of This Education Sector Status Report 19Administrative Structure of General Education in Northern Sudan 26Annex 1A: Population by Age in 2008 28Annex 1B: Administrative Structure of the Education System 30Notes 33References 34
CHAPTER 2. OVERALL ENROLLMENT PATTERNS 37Structure of the Education System and Enrollments 37Schools for Nomadic and Internally Displaced Populations 47The Gross Enrollment Rate 49Measuring Education Coverage More Precisely 53Summary 55Annex: Number of Basic Schools 56Notes 57References 58
Table of Contents
vi • Table of Contents
CHAPTER 3. PATTERNS OF STUDENT FLOW 59Schooling Profile and Distance from Universal Primary Completion 59Other Aspects of Student Flow Efficiency and Projections 68Projection of Access and Completion Rates for Basic Education 75Summary 77Annex: Basic and Secondary Education Enrollments 78Notes 79References 79
CHAPTER 4. DISPARITIES 81Regional Disparities 81Social Disparities 85Out-of-School Children in Urban and Rural Areas 92Structural Disparities 93Summary 97Annex 4A: Enrollment of Girls in Education in
Northern Sudan 99Annex 4B: Probability of Children Ever Enrolling in Basic School 99Notes 100References 101
CHAPTER 5. SERVICE DELIVERY AND LEARNING OUTCOMES IN BASIC SCHOOLS IN THREE STATES 103
Sample Description 105Characteristics of Government Basic Schools in the Sample 107Student Learning Outcomes 119Secondary Education Examination Results 125Summary 129Annex: Probability of Still Being in School by Grade 8 130Notes 131References 131
CHAPTER 6. TEACHERS 133Profile of Teachers in Northern Sudan 133Teacher Recruitment, Deployment, and Transfer 140Teacher Utilization 144School Record Keeping: Teacher Leave and Time/Attendance 147Teacher Supervision 150Teacher Salaries and Motivation 153Summary 155
Table of Contents • vii
Notes 156References 156
CHAPTER 7. EDUCATION FINANCE 159Background 159Analysis of Public Education Spending 161Public Per-Student Spending 168Analysis of State-Level Education Spending 174Summary 182Annex: Spending on Education 183Notes 187References 188
APPENDIX: STATE-LEVEL DATA SHEETS 191
GLOSSARY 237
BOXES
1.1 Education Sector Status Report Data Sources 207.1 State Visits to Collect Information on Education Spending 160
FIGURES
O.1 Average Annual Growth Rates for Basic School Enrollment, by State, 2004–05 to 2008–09 3
O.2 Educational Access: Probability of Ever Enrolling in Basic School, by Location, Income, and Gender, circa 2005 8
O.3 Share of Girls in Enrollments, by Type of Basic School, 2008–09 10
O.4 International Comparisons: Degree of Randomness in Teacher Allocations in Basic Education, by Country 12
O.5 Public Education Spending, by Administrative Level, 2000–09 141.1 Growth of GDP per Capita in Sudan, 1975–2008 221A.1 Raw Population Data in Sudan, Ages 0–24 Years, 2008 281A.2 Raw and Smoothed Population Data in Sudan,
Ages 2–24 Years, 2008 291B.1 Organizational Structure of the FMoGE 311B.2 Ministries Providing Technical and Vocational Training 322.1 Trends in Student Enrollments in Northern Sudan,
2000–01 to 2008–09 402.2 Evolution in Basic School Enrollments in Selected States,
2000–01 to 2008–09 412.3 Average Growth Rates for Basic School Enrollments,
by State, 2004–05 to 2008–09 41
viii • Table of Contents
2.4 Share of Students Enrolled in Nongovernment Schools, 2008–09 or Latest Available Year 44
2.5 Trends in Gross Enrollment Rates for General Education in Northern Sudan, 2000–01 to 2008–09 51
2.6 Comparing the Gross Enrollment Rate Calculated from Different Sources, 2005–06 to 2008–09 55
3.1 Schooling Profile for the Primary and Secondary Levels, 2008–09 603.2 Educational Pyramid for Northern Sudan, 2008–09 613.3 Access to Grade 1: Share of Population between Ages 5 and
29 Who Had Ever Accessed Basic School, 2005–06 633.4 Ages of Girls and Boys Attending Grade 1, 2005–06 643.5 Enrollment Status of Girls and Boys by Age, 2005–06 663.6 Schooling Status and Level of Education of Girls and Boys
by Age, 2005–06 673.7 School Life Expectancy in Sudan and Comparator Countries,
Latest Available Year 683.8 International Comparison of the Share of Repeaters in
Primary and Secondary Schools, Latest Available Year 713.9 Projection of the Rate of Access and Completion of Basic
Education to 2015 764.1 Access: Regional Disparities in the Share of Children between
Ages 5 and 17 Who Had Ever Accessed Basic School, 2005–06 844.2 Ratio of Boys to Girls in the Basic School-Age Population,
by State, 2008 874.3 Access: Probability of Ever Enrolling in Basic School (Grade 1)
according to Location, Income, and Gender, circa 2005 894.4 Retention: Probability of Still Being in School by Grade 8,
by Location, Income, and Gender, circa 2005 914.5 Schooling Status of Urban and Rural Children by Age, 2005–06 934.6 Lorenz Curve for the Distribution of Public Education
Spending, 2008–09 965.1 Grade 5 Student Learning Assessment Scores in Mathematics
and Reading in Kassala, North Kordofan, and River Nile, 2009 1205.2 International Comparison of Student Performance in
Mathematics between Morocco, Northern Sudan, Singapore, and Tunisia, 2008–09 122
5.3 International Comparison of Student Performance in Reading between Benin, Northern Sudan, and Singapore, 2008–09 123
5.4 Average Student Performance in Mathematics and Reading, by Household Wealth, 2009 126
5.5 Average Student Performance in Mathematics and Reading, by Father’s Education Level, 2009 127
6.1 Types of Staff in Northern Sudan, by Education Level, 2009 1356.2 Percentage of Female and Male Teachers in Basic Education in
Northern Sudan, by State, 2009 1366.3 Percentage of Female and Male Teachers in Secondary
Education in Northern Sudan, by State, 2009 136
Table of Contents • ix
6.4 Percentage of Trained and Untrained Teachers in Northern Sudan, by State, 2009 139
6.5 Full-Time Government Teachers’ Academic Qualifications and Preservice Training in Kassala, North Kordofan, and River Nile States, 2009 139
6.6 Number of Teachers in Relation to Student Enrollment in Basic Education Schools in Northern Sudan, 2008–09 141
6.7 Number of Teachers in Relation to Student Enrollment in Basic Education Schools, Red Sea State, 2008–09 142
6.8 International Comparisons: Randomness in Teacher Allocations in Basic Education, by Country 143
6.9 Average Number of Leave Days by Purpose over Six Months in Kassala, North Kordofan, and River Nile States, 2009 149
6.10 Local Supervision: Visits to the Teachers in Kassala, North Kordofan, and River Nile States, 2009 152
6.11 Payment of Teacher Salaries in Kassala, North Kordofan, and River Nile States, by Teacher Type, 2009 153
7.1 Recurrent Public Education Spending per School-Age Child, 2000–09 162
7.2 Comparison of Public Education Spending, by Country, 2005–08 1637.3 Development and Recurrent Public Education Spending
Shares, 2000–09 1647.4 Public Education Spending, by Administrative Level, 2000–09 1657.5 Composition of Recurrent Public Education Spending,
by Education Level, 2009 1687.6 State Education Spending as a Share of State Total Public
Spending, 2009 1767.7 Average Public Per-Student Spending, by GER Group, 2009 1777.8 Public Per-Student Spending, by Education Level and State, 2009 1787.9 Federal Transfers and State Own Revenues as a Share of
Total Revenues, 2008 1807.10 Federal Transfers per Capita and Average GER, by State, 2008–09 181
TABLES
O.1 Anthropometric Measures of Sudan’s Children 111.1 Trends in GoNU Revenues and Expenditures, 2000–09 231.2 Anthropometric Measures of Sudan’s Children 251A.1 Population of Sudan by Census Year and Average Growth in
Intervening Years, 1956–2008 281B.1 Availability of Job Descriptions in the FMoGE 312.1 Trends in Student Enrollments by Level of Education in
Northern Sudan, 2000–01 to 2008–09 382.2 Increase in the Number of Schools, Teachers, and Students
from 2004–05 to 2008–09 432.3 School Size and Student-Teacher Ratios in Government and
Nongovernment Schools, 2008–09 46
x • Table of Contents
2.4 Number of Schools and Enrollments in Government Nomadic, IDP, and Village Schools, 2007–08 and 2008–09 48
2.5 Primary Education GERs in Northern Sudan and Comparator Countries, 2008 or Latest Available Year 52
2.6 Upper Secondary Education GERs in Northern Sudan and Comparator Countries, 2008 or Latest Available Year 53
2.7 Higher Education Enrollments in Northern Sudan and Comparator Countries, 2008 or Latest Available Year 54
2A.1 Number of Basic Schools by State and Type of School, 2008–09 56
3.1 Gross Intake Rate and Primary Completion Rate, 2008–09 623.2 Basic School Intake and Completion Rates Based on Two
Data Sources, 2005–06 633.3 Share of Repeaters in Basic Schools from Different Sources,
2005–06 to 2008–09 693.4 Estimation of Repetition in Government and Nongovernment
Academic Secondary Schools, 2008–09 703.5 Retention and Other Indicators for Basic and Secondary
Education, 2000–01 to 2008–09 723.6 Internal Efficiency Coefficients in Basic and Secondary
Education, 2005–06 to 2008–09 743.7 International Comparison of Internal Efficiency Coefficients
in Basic Education 753.8 Gross Intake and Primary Completion Rates for Basic
Education, 2000–01 to 2008–09 763A.1 Enrollments by Grade in Basic and Secondary Education,
Northern Sudan, 2008–09 784.1 Comparison of GERs in Preschool, Basic, and Secondary
Schools across States, 2008–09 824.2 Share of Girls in Enrollments by Level of Education, 2000–01
and 2008–09 854.3 Share of Girls in Enrollments by Type of Basic School, 2008–09 864.4 Gender Disparities at All Levels of Education, 2008–09 874.5 International Comparison of Gender Parity Index by Level
of Education, Latest Available Year 884.6 Access: Interaction of Gender with Poverty and Rurality 904.7 Retention: Interaction of Gender with Poverty and Rurality 924.8 Estimated Number of 10- to 17-Year-Olds in Northern Sudan
Who Have Never Been in School, by Gender, 2008 944.9 Distribution of Public Education Spending among Members
of the Same Cohort, 2008–09 954.10 Distribution of Public Spending on Education within a
Cohort of Children, Northern Sudan Compared to Sub-Saharan Africa, 2008–09 97
4A.1 Share of Girls in Total Enrollments, by State and Level of Education, 2008–09 99
Table of Contents • xi
4B.1 Logistic Regression Results: Probability of Ever Enrolling in Basic School (Grade 1), by Location, Income, and Gender, circa 2005 99
5.1 Basic Education Indicators for the Three Surveyed States and the Northern Sudan Average, 2008–09 104
5.2 Sample Information for the Three Northern Sudan States Chosen, 2009 106
5.3 Rural/Peri-urban and Urban Composition of the School Sample, 2009 107
5.4 Availability of Chalkboards and Desks in Observed Classrooms, 2009 108
5.5 Availability of Textbooks in Observed Classrooms 1105.6 Syllabus Coverage in Observed Classrooms, 2009 1115.7 Class Size in Observed Classrooms, 2009 1135.8 Average Student Attendance in Observed Classrooms, 2009 1145.9 Official and Actual Number of School Days in the Academic
Year, State Averages, 2009 1155.10 School Record Keeping on Student Enrollment and
Performance, State Averages, 2009 1165.11 Characteristics of Education Councils, State Averages, 2009 1175.12 School Support Provided by Educational Councils, State
Averages, 2009 1185.13 Grade 5 Student Learning Assessment Scores in Mathematics
and Reading, 2009 1215.14 Average Student Learning Assessment Scores, by Gender, 2009 1245.15 Pass Rates for Secondary School Examinations in Northern
Sudan, by School Type and State, 2008 1285A.1 Logistic Regression Results: Probability of Still Being in
School by Grade 8, by Location, Income, and Gender, circa 2005 1306.1 Numbers of Education Staff in Northern Sudan, by
Education Level, 2009 1346.2 Sudan Open University Bachelor of Education Degree
Output, 2008–12 1386.3 Student-Teacher Ratios in Northern Sudan, by State, 2009 1456.4 Average Class Size in Northern Sudan, by School Type and
Grade, 2008–09 1466.5 Number of Hours Taught by Teachers in Different Salary Scales 1476.6 School Record Keeping in Kassala, North Kordofan, and
River Nile States State Averages, 2009 1506.7 Number of Teachers, Inspectors, Volunteers, and National
Service Staff in Basic and Secondary Education, by State, 2009 1516.8 Outside Jobs and Private Tutoring in Kassala, North Kordofan,
and River Nile States, by Teacher Type, 2009 1546.9 Teacher Incentives to Perform, or Not 1557.1 Estimated Total Public Education Spending, 2000–09 1617.2 Recurrent Public Education Spending, by Education Level, 2009 166

xii • Table of Contents
7.3 Comparison of Public Education Spending, by Region/Country and Education Level, 2005–08 167
7.4 Composition of Recurrent Public Education Spending, by Education Level, 2009 167
7.5 Composition of Per-Student Spending, by Education Level, 2009 1697.6 Comparison of Public Per-Student Spending, by Region and
Education Level, 2002–08 1707.7 Composition of Education Staff, by Education Level, 2009 1717.8 Average Salaries of School-Based Staff in Northern Sudan, by
Education Level, 2009 1727.9 Comparison of Average Primary Teacher Salaries, by
Region/Country, 2002–08 1737.10 Average Annual Household Out-of-Pocket Spending per
Student, Selected States, 2008–09 1747A.1 Comparison of Public Education Spending, by
Region/Country, 2005–08 1837A.2 Total, Recurrent, and Development Education Spending, by
Administrative Level, 2000–09 1837A.3 Preschool: Overview of State Education Spending and STRs,
by Group and State, 2009 1847A.4 Basic Education: Overview of State Education Spending and
STRs, by Group and State, 2009 1857A.5 Academic Secondary Education: Overview of State Education
Spending and STRs, by Group and State, 2009 1857A.6 Technical Secondary Education: Overview of State Education
Spending and STRs, by Group and State, 2009 186

xiii
As the Republic of Sudan embarks upon a new phase in its history,its government has reaffirmed its commitment to achieve the Edu-cation for All (EFA) targets and the Millennium Development
Goals (MDGs)—if not by 2015, then soon thereafter. This year, the Gov-ernment of National Unity is preparing a new education sector strategicplan, for 2012–16, that will set the direction for reform and investmentin basic, secondary, and higher education over the coming five years. Theaim of the current report is to contribute to the knowledge base thatinforms the preparation of this plan by providing a diagnostic of thecountry’s education system. With detailed data on enrollments, teachers,learning outcomes, and education financing, the report contextualizesvaluable information about the challenges and emerging priorities forSudan’s education sector.
The positive impact of peace on education following the Compre-hensive Peace Agreement (CPA) signed in 2005 is evidenced in the sub-stantial increase in basic school enrollments among those previouslyaffected by conflict. In absolute terms, enrollments in basic educationgrew by almost 1.6 million in the eight years since the 2000–01 aca-demic year. However, regional disparities in education access exist. Also,children in rural areas, children from poorer households, and girls are ata disadvantage in terms of access to schooling. The strongest predictor ofaccess to schooling is whether a child lives in an urban or rural area, withurban children being 17 percentage points more likely than rural chil-dren to access school. Preliminary estimates also suggest low basic education coverage of internally displaced persons and nomadic popu-lations. There are also indications of inadequate literacy and numeracyamong students based on a learning assessment administered as part ofthis analysis in 195 government schools across three states. These weak
Foreword
xiv • Foreword
learning outcomes could be linked to many factors, including wide-spread malnutrition among young children (which has consequences forlearning ability), too few instructional hours, and a lack of textbooks.Finally, primary school completion rates are low: whereas roughly80 percent of children were enrolled in grade 1 in 2008, only about50 percent of students completed basic education, indicating that alarge number of students are dropping out of school.
Secondary education also has a high number of students who dropout, and it has a large number of students who are repeaters. As many as36 percent of students in the final year of secondary school are estimatedto be repeaters, giving a repetition rate of 15 percent across the secondarylevel. Nevertheless, the estimated transition rates between basic andsecondary education and between secondary and higher education of74 percent and about 87 percent, respectively, are fairly high, and theyindicate that most pupils drop out of the education system within thebasic or secondary levels rather than between the levels. With such hightransition rates, the current expansion in basic school enrollments (andassuming that the dropout rate improves) is likely to result in considerablepressure on secondary education, technical and vocational training, andhigher education systems, which will need to accommodate a rapidlyincreasing number of basic school graduates seeking to continue theirstudies. Whether the system is able to respond to this increased pressurewill determine whether the transition rates can remain at these high lev-els in the years ahead.
From a regional perspective, enrollment in higher education is higherin Sudan than in other Sub-Saharan African countries and is similar tothat in Middle Eastern and North African countries. The gender parityindex for higher education in Sudan is also similar to that for countries inthe Middle East and North Africa, and accounted for 56 percent of enroll-ment in higher education in 2009. Given the relatively high enrollmentrate in higher education, it is important that while in the education sys-tem, students acquire the skills that match those needed by the labor mar-ket to contribute to economic growth and development in the country.Further research, including a labor market survey, is required to under-stand and strengthen the links between the skills imparted to higher edu-cation students and the skills required to support the expansion anddiversification of the economy.
The independence of South Sudan and the expiration of the CPA arelikely to lead to a significant decline in government financing. All sectors—including education—will be affected by this contraction, placing at riskthe significant gains of the last decade. Maintaining the momentum and
Foreword • xv
expanding the existing education system will require a commitment topromote a strong, efficient, equity-oriented approach to service deliv-ery. Sudan’s upcoming education sector plan will highlight prioritiesand can be used to mobilize both internal and external financing. Theanalytic foundation that this report provides and its identification ofthe key bottlenecks to progress are thus both timely and relevant.
This report was prepared in collaboration with a national team fromthe Ministry of General Education (MoGE) and partners active in the edu-cation sector in Sudan. The MoGE’s national team, led by the undersecre-tary of the federal MoGE, comprised representatives from both the federaland state levels. Over a period of 18 months, this collaboration facilitatedconsiderable capacity building in data collection and analysis, as well asregular dissemination of the analysis to a wider audience.
This publication is the first comprehensive overview of the educationsector in Sudan. The challenge that remains is to design policy responsesto the issues identified within the forthcoming education sector strategicplan. More important, these policies—already being discussed with theMoGE—must be effectively implemented so that Sudan can make fasterprogress toward achieving the EFA targets and MDGs. It is my hope thatthis report will serve as the basis for an evidence-based and equity- oriented approach to education planning and investment. This approachwill have positive repercussions for overall economic growth, poverty alle-viation, and human development in 21st-century Sudan.
Ritva ReinikkaDirector, Human DevelopmentAfrica RegionThe World Bank

xvii
This report was prepared by the World Bank and the Government ofNational Unity (GoNU) of Sudan. The GoNU team worked underthe overall guidance of a management committee headed by Dr. El
Mustassim El Hassan, undersecretary of the Ministry of General Educa-tion (MoGE).1 The GoNU team comprised Dr. El Tahir Hassan El Tahir,director general for the Planning Unit of the federal MoGE; Dr. Ibtissam M.Hassan, director general for the Teacher-Training Unit of the federalMoGE, and the director generals of all the state ministries of education.Other team members within the GoNU included Dr. Khaled El Amin ElMosharaf, Omar Alebied Ahmed, and Najla Basheer. The team wishes toexpress gratitude to Mrs. Souad Abelrazig, State Minister of the MoGE forher leadership in finalizing this book.
The World Bank team consisted of Elizabeth Ninan, task team leader;Yasser El-Gammal, task team leader for the concept note stage; RamahatraMam Rakotomalala; Kirsten Majgaard; Moctar Ould Djay; Gunilla Pettersson; Prema Clarke; Koffi Segniagbeto; Deepa Sankar; and Aymen AliMusmar. Michel Welmond, lead education specialist, provided overall tech-nical guidance on the report. The peer reviewers for the concept note, alsofrom the Bank, were Soren Nelleman, Linda English, and Peter Buckland.The peer reviewers for the final report were Alberto Begue, Education forAll Fast-Track Initiative secretariat; Peter Buckland, consultant; YasserEl-Gammal, lead social protection specialist and sector leader for Sudan,World Bank; Safaa El-Kogali, regional director, West Asia and North Africa,Population Council; and Cem Mete, senior economist, World Bank. Theteam would also like to thank the World Bank’s William Battaile, senioreconomist, and Michael Geiger, economist, for their inputs throughoutthe development of the report.
Acknowledgments

xviii • Acknowledgments
The report benefited substantially from the support provided by otherministries and development partners in northern Sudan. Staff participa-tion from the Ministry of Finance and National Economy (MoFNE)included Mirghani Golood and Sadia Alkhidir Ahmed. Donor partners inKhartoum contributed to the development of the report and includedCecilia Baldeh and Parvez Akhtar, United Nations Children’s Fund;Mauro Ghirotti, Italian Cooperation; Mustafa Yassin, European Commis-sion; and David Dean, Education Management Information System,European Commission.
The report also benefited from the support of World Bank staff inKhartoum, especially Alassane Sow, country manager for northern Sudan,and Isabel Soares, senior operations officer. Christopher Thomas, formersector manager for the Africa Region’s education team, and Peter NicolasMateru, acting sector manager, provided support to the team throughoutthe process.
The team is grateful for the excellent administrative support receivedfrom World Bank staff members Rosario Aristorenas in Washington, DC,and Enas Suleiman Mohammed in Sudan.
The team acknowledges with great appreciation the financial supportreceived from the Education Program Development Fund of the Fast-Track Initiative and the GoNU Multi-donor Trust Fund.
NOTE 1. Established under Administrative Order 22 in 2009, the management com-
mittee provided overall strategic guidance in the preparation of the education sec-tor report for northern Sudan.

xix
CPA Comprehensive Peace Agreement EFA-FTI Education for All Fast-Track InitiativeESPA Eastern Sudan Peace Agreement ESR education sector report ESSP Education Sector Strategic Plan EU European Union FMoGE Federal Ministry of General EducationGDP gross domestic productGER gross enrollment rateGIR gross intake rate GoNU Government of National Unity GoSS Government of Southern Sudan GPI gender parity indexIDP internally displaced person IEC internal efficiency coefficient ISETI in-service education training instituteMDG Millennium Development Goal MoFNE Ministry of Finance and National Economy MoGE Ministry of General EducationMoHESR Ministry of Higher Education and Scientific ResearchMoLPSHR Ministry of Labor, Public Service and Human Resource
Development NCTTE National Council for Technical and Technological
Education PCR primary completion rate PIRLS Progress in International Reading Literacy Study SDG Sudanese pound
Abbreviations
xx • Abbreviations
SDS service delivery survey (“Quality of Service Delivery inBasic Education Study”)
SHHS Sudan Household Health Survey SLE school life expectancySOU Sudan Open UniversitySTR student-teacher ratioTIMSS Trends in International Mathematics and Science Study UNHCR United Nations High Commissioner for Refugees UNICEF United Nations Children’s Fund

xxi
Map: States Featured in This Study,Sudan, 2010


1
Overview
The Sudan Government of National Unity (GoNU) has committeditself to achieving the Education for All (EFA) targets and the education-related Millennium Development Goals (MDGs) by
2015, which signals its readiness to continue to invest in education andexpand educational opportunities. The current five-year (2007–11) Edu-cation Sector Strategic Plan (ESSP) expresses the country’s commitmentto the EFA goals and outlines activities to meet the MDG education tar-gets. In developing its ESSP for 2012–16, the GoNU seeks to assess thestatus of the education system in order to identify priority areas for devel-opment in the sector.
This report is a diagnostic of the education system and provides aknowledge base to inform the GoNU’s preparation of the ESSP. It alsocontributes to the dialogue among relevant stakeholders on the chal-lenges and emerging strategic priorities for the education sector innorthern Sudan.
The report begins by setting the scene in historical and economic terms.It then provides an outline of the administrative setup, which is particu-larly important in northern Sudan’s decentralized education system. It alsoexamines trends in enrollments, followed by the schooling profile and anassessment of the efficiency of the education sector. Next, the reportdescribes existing disparities in the education system along several dimen-sions: rural-urban location, income, gender, nomadic population, inter-nally displaced persons (IDPs), and state. An analysis of education servicedelivery presents indicative findings on student learning outcomes and onresource availability and management in basic schools in three states; italso presents a brief overview of examination performance in secondaryeducation.1 The report then addresses teacher-related issues, includingrecruitment, deployment, utilization, and supervision. Finally, education
2 • The Status of the Education Sector in Sudan
spending is discussed, both at the national and state levels, and the com-position of education spending is explored for each subsector.
THE MAIN FINDINGS
There are 11 main findings of this diagnostic of the education system innorthern Sudan. They range from the peace dividend’s effect on enroll-ments and the high dropout rates in basic and secondary education to dis-parities in resources at the local level and low spending on education relative to similar countries in the region.
ACCESS TO EDUCATION
The peace dividend is especially apparent in the growth in student enroll-ments in basic education in states previously affected by conflict. Thenumber of students enrolled across subsectors has grown annually overthe past decade, with the fastest relative growth in enrollments since2000–01 occurring in preschool (10 percent), followed by higher educa-tion (7 percent), secondary education (6 percent), and basic education (5 percent). Basic education is by far the largest subsector of education interms of student enrollments and, in absolute terms, grew by almost 1.6 million in eight years. The growth in enrollments for basic educationis evidence of both strong demand for education and commitment by theGoNU to achieving the EFA goals and the MDGs.
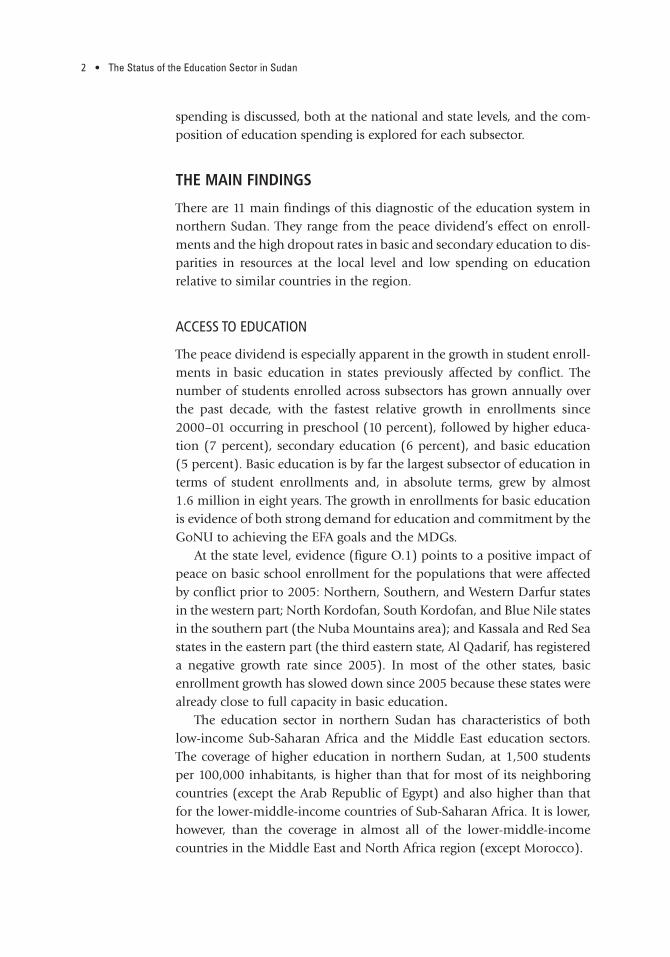
At the state level, evidence (figure O.1) points to a positive impact ofpeace on basic school enrollment for the populations that were affectedby conflict prior to 2005: Northern, Southern, and Western Darfur statesin the western part; North Kordofan, South Kordofan, and Blue Nile statesin the southern part (the Nuba Mountains area); and Kassala and Red Seastates in the eastern part (the third eastern state, Al Qadarif, has registereda negative growth rate since 2005). In most of the other states, basicenrollment growth has slowed down since 2005 because these states werealready close to full capacity in basic education.
The education sector in northern Sudan has characteristics of bothlow-income Sub-Saharan Africa and the Middle East education sectors.The coverage of higher education in northern Sudan, at 1,500 studentsper 100,000 inhabitants, is higher than that for most of its neighboringcountries (except the Arab Republic of Egypt) and also higher than thatfor the lower-middle-income countries of Sub-Saharan Africa. It is lower,however, than the coverage in almost all of the lower-middle-incomecountries in the Middle East and North Africa region (except Morocco).

Overview • 3
Northern Sudan also has a higher secondary school gross enrollmentrate (GER), 34 percent, than most of its neighbors (except Kenya), whichis comparable to other lower-middle-income countries in Sub-SaharanAfrica. However, its relatively high GER for secondary school is partly theresult of a large number of repeaters. Northern Sudan’s GER for second-ary schools is also similar to that for countries such as Morocco and theSyrian Arab Republic, but it is lower than the average for countries in theMiddle East and North Africa region.
However, basic education gross enrollment rate in northern Sudan (76percent) does not compare favorably to the average GER for basic educa-tion in lower-middle-income Sub-Saharan African countries (105 per-cent) and lower-middle-income Middle East and North African countries(106 percent). The GER for northern Sudan is higher only than that forEritrea and comparable to that for countries such as the Central AfricanRepublic, Chad, and Côte d’Ivoire.
DROPOUT RATES
Northern Sudan experiences a high number of dropouts in basic and sec-ondary education. While there was a fairly high rate of intake (80 percent)of new students to grade 1 of basic school in 2008, the primary completionrate (PCR) was low (54 percent), indicating that many students drop out ofschool before completing basic education. A study following a group of stu-dents that enrolled in grade 1 in 2000 until they reached grade 8 in 2007revealed that only 57 of every 100 students were still in school by grade 8.
–2%–1%
0% 0% 2%
5%6%
8% 8% 8%
11%12%
13% 14% 15%
6%
–5
state
Northe
rn
Al Qad
arif
Al Jazir
ah
River N
ile
Kharto
umSin
nar
Kassala
Red Se
a
White N
ile
South
Kordofa
n
North K
ordofa
n
South
ern Darf
ur
Northe
rn Darf
ur
Western
Darfur
north
ern Su
dan
Blue N
ile
0
5
10
15
perc
ent
Figure O.1 Average Annual Growth Rates for Basic School Enrollment, by State, 2004–05 to 2008–09
Source: Federal Ministry of General Education (FMoGE) statistical yearbooks for the years indicated; World Bank estimates.

4 • The Status of the Education Sector in Sudan
This means that the probability of a student’s dropping out before grade 8is 43 percent, indicating an average dropout rate of 6 percent per grade fromgrades 1 through 7.
In an optimistic scenario, if the observed increase in basic educationenrollment were to continue, then almost all children could be enrolling ingrade 1 around 2012 and 80 percent of children could be completing basicschool by 2015. Thus, even in the best of circumstances, northern Sudan isnot likely to reach universal primary completion by 2015. However, it couldsoon attain universal or almost universal access—a precondition for uni-versal completion. Because the basic schooling cycle is eight years, univer-sal primary completion can be achieved no earlier than eight years after uni-versal access to grade 1, that is, by 2020 or later. However, these outcomesare within reach only if efforts to ensure intake does not decline and only iftargeted interventions to enroll vulnerable populations and retain all stu-dents in school for the full cycle are put in place and sustained.2
The number of dropouts in secondary education is higher than thatin basic education when adjusted for the length of the cycles. A studyfollowing a group of students that enrolled in secondary 1 in 2005 untilthey reached secondary 3 in 2007 revealed that only 74 of every 100 stu-dents were still in school by secondary 3. This finding corresponds to adropout rate of 13 percent per year in the first two years of the second-ary cycle.
The high rates of dropout in both basic education and secondaryeducation are of serious concern in northern Sudan, yet there is insuffi-cient information to ascertain the main causes. However, internationalevidence suggests that students are at risk of dropping out of schoolwhen parents do not perceive that additional schooling is worth theinvestment in terms of time and money—when the cost of schoolingexceeds the expected benefits. High dropout rates could therefore indicatethat the quality of the schooling is too low to justify the student’s time andthe direct costs in terms of parental financial contributions or the opportu-nity costs of a child who would otherwise be contributing to the house-hold income or helping with chores. Other factors also put children atrisk of dropping out. For example, when schools do not offer all thegrades of the basic cycle (as is the case for village and nomadic schools innorthern Sudan) and children have to change schools to access the highergrades, the students’ travel time to school increases, which may lead totheir dropping out. Also, late entry to school by overage children isstrongly associated with dropout, which seems to be the case in northernSudan, where 40 percent of children entering grade 1 in 2005 were over-age (that is, 8 years or older).
Overview • 5
Going forward, as the GoNU moves to design appropriate policies toimprove student retention, more research will be required to determinethe main causes of the high dropout rates.
LEARNING OUTCOMES
The education sector shows weak learning outcomes. A student learningassessment administered in 195 schools across three states (Kassala,North Kordofan, and River Nile) in 2009 found that student learning out-comes were generally weak: the average male student in the sampleanswered only 35 percent of the mathematics questions correctly and 38 percent of the reading questions compared to 37 percent and 41 per-cent, respectively, for the average female student. Within the sample, girlson average performed significantly better than boys, which is consistentwith findings from both developing and developed countries. Studentsamong the richest 20 percent performed better on average than students inthe middle 60 percent, who in turn performed better than students in thepoorest 20 percent. From a regional perspective, students in the three statesperformed similarly to their counterparts in Morocco and Tunisia andsomewhat better than students in Benin. However, it should be noted thatthe students in northern Sudan were assessed in grade 5 rather than grade4, as was the case in Morocco and Tunisia, meaning that Sudanese stu-dents had the advantage of roughly one additional year of schooling.
Northern Sudan does not currently have a system to continuouslyassess student learning in order to determine whether public investmentsin basic education translate into the provision of quality education andlearning for all students. The GoNU should consider instituting a nationalstudent learning assessment system, which can be combined with data onschool resources from the new Education Management Information Sys-tem, in order to identify factors that promote or hinder learning. Such sys-tems already exist or are being introduced in many developed and devel-oping countries.
INSTRUCTIONAL TIME
The weak learning outcomes may also be partly related to inadequateinstructional time. Unlike many other countries in the region, teachers innorthern Sudan specialize by subject area from grade 4 onward. Thismeans that even though the average student-teacher ratio for basic educa-tion is 34 to 1, the average class size is 48 students. The official instruc-tional time for basic schooling is 25 hours per week, but based on the

6 • The Status of the Education Sector in Sudan
number of teachers in the system, students receive an average of only 17hours. Put another way, students fail to receive about 30 percent of instruc-tional time. Compounding the problem is the fact that senior teachers,who are more experienced, teach fewer hours than junior teachers. Thereare several additional reasons for the loss in instructional time, such asteacher absenteeism, in-service teacher training, strikes, conflict, the use ofschools as polling stations, and closures due to weather conditions.
The 2009 basic education service delivery study in Kassala, NorthKordofan, and River Nile states also showed students receiving fewerinstructional hours than the official policy; it showed incomplete syllabuscoverage as well. The official school year in northern Sudan is 210 days,but in the sample schools in the three states, the average number of actualschool days was 189. This result implies that students are missing aboutone month of teaching each year, which has negative implications for stu-dent learning outcomes. As for syllabus coverage, of the 195 sampleschools, the average coverage was 72 percent in mathematics and 75 per-cent in reading when 80 percent of the syllabus should have been covered.Going beyond averages, however, reveals notable differences in syllabuscoverage across schools. For example, 4 percent of urban schools and 11 percent of rural and peri-urban schools in Kassala had covered only40–59 percent of the syllabus. These schools are of particular concernbecause a complete catch-up in terms of syllabus coverage would benearly impossible.
These findings strongly suggest the need to put standards into placethat clearly communicate official policy on the length of the school year,make up for lost days, and enable schools (for example, by constructingdurable school buildings) to be open as intended.
SCHOOL RESOURCES
Studies indicate that resources are inadequate at the school level in north-ern Sudan. According to the United Nations Children’s Fund (UNICEF)baseline survey conducted in 2008, 42 percent of classrooms in basicschools in northern Sudan were in need of repairs, and 9 percent requiredreplacement. The UNICEF survey also found wide variation in the qualityof school infrastructure by state: 29 percent of classrooms in Khartoum stateneeded to be renovated or replaced, whereas the figure rose to 66 percentfor classrooms in South Kordofan. In addition, many schools are built withlocal materials and are either unsuitable for learning (no light, insufficientspace, no roof) or inaccessible during the rainy season. Despite the lack ofadequate infrastructure, development spending remains low in northern

Overview • 7
Sudan at 9 percent of total public education spending in 2009. Althoughthis is an increase from 2000, when its share was 1 percent of total publiceducation spending, the lack of school infrastructure remains a significantchallenge.
Aside from problems with infrastructure, the findings of the 2009basic education service delivery study and a 2008 European Union (EU2008) study point to the lack of textbooks within the classroom. The aver-age student-textbook ratio for mathematics and reading in the three statessurveyed through the service delivery study was 3 to 1, compared to theofficial policy of 2 to 1. At the extreme, rural sample schools in NorthKordofan had a 9 to 1 student-textbook ratio. Considering that educationcouncils provided textbooks for students in several of the survey schools,the higher-than-recommended average student-textbook ratio points to aserious failure of the public education system, with negative conse-quences for student learning. The EU study, based on visits to 71 govern-ment basic schools in seven states, also documents the lack of textbookswith an average student-textbook ratio of 4 to 1.
Spending on goods and services by the government is generally low,and particularly so for basic education. This situation means that house-holds have to contribute to a school’s running costs, such as mainte-nance, water and electricity, and supplementary teacher payments. Theaverage estimated out-of-pocket spending by households each year onoperating costs was 15 Sudanese pounds (SDG) per student in2008–09, higher than the SDG 12 public spending per student on suchcosts.3 Whereas the official policy of the GoNU is free basic education,the available data suggest that households pay a large share of schoolrunning costs in addition to other costs, such as uniforms, textbooks,and meals.
DISPARITIES
Substantial disparities exist in the education system, by region, rural-urban location, gender, and income. At all three levels of education, theGER varies enormously from one state to another, ranging from 13 per-cent to 65 percent for preschool, about 65 percent to 94 percent for basicschool, and 15 percent to 61 percent for secondary school. As notedearlier, the states with the highest GERs were the central states, whichwere largely unaffected by the conflict, whereas the states with the low-est GERs were those previously affected by conflict, such as Northern andSouthern Darfur; Kassala and Red Sea, which were part of the Easternstates conflict; and Blue Nile, at the border of south Sudan.

8 • The Status of the Education Sector in Sudan
Aside from regional disparities in access to education, children in ruralareas, those from poorer households, and girls are at a disadvantage (seefigure O.2). Of the three dimensions—rural-urban location, income, andgender—the strongest predictor of access to schooling is whether a childlives in an urban or rural area, with urban children being 17 percentagepoints more likely than rural children to have access to education. Over-all, boys are 8 percentage points more likely than girls to have access, andrich children are 2 percentage points more likely than poor children tohave access to school. A poor rural girl is the most disadvantaged of alland is about 25 percentage points less likely to ever access basic schoolthan a rich urban boy. In village schools, which are rural by nature, only41 percent of students enrolled are girls.
When northern Sudan is compared with its neighbors, the gender par-ity indexes (GPIs) for academic secondary and higher education are 0.97and 1.27, respectively, and are more similar to the average GPIs seen inEgypt, the Islamic Republic of Iran, Jordan, and Tunisia (1.02 and 1.25,respectively) than to the averages for Cameroon, Kenya, Nigeria, andUganda (0.84 and 0.74, respectively). However, the average GPI of 0.90for basic education is lower than the average for Egypt, the Islamic Repub-lic of Iran, Jordan, and Tunisia, which is 1.09, and also lower than theaverage for Cameroon, Kenya, Nigeria, and Uganda, which is 0.93.
Out of the population of 6 million 10–17-year-olds in northernSudan, it is estimated that one in six, that is, close to 1 million, never hadaccess to school in 2010. Among this group of children, 62 percent weregirls and 84 percent were from rural areas. A UNICEF study conducted in
77%
94%82%
90%85% 87%
0
20
40
60
80
100
perc
ent
rural urbanlocation genderincome
girls boyspoor rich
Figure O.2 Educational Access: Probability of Ever Enrolling in Basic School, byLocation, Income, and Gender, circa 2005
Source: Authors’ analysis of the 2006 Sudan Household Health Survey (GoNU and GoSS 2006). The figureis based on responses of children ages 11–15. Note: The figure gives the probability of ever enrolling in grade 1 of basic school. For this chart, poormeans belonging to the lowest income quintile and rich means belonging to the two richest quintiles ofthe population.

Overview • 9
southern Sudan may provide some insights into why some girls are beingheld back in rural areas of Sudan (UNICEF/GoSS 2008). One of themain conclusions of the study is that parents generally do want toeducate their daughters, but many are not sending them to school outof concern for their safety as they walk to school or even in the schoolsthemselves. The study concludes that safer and more child-friendlyschool environments—for girls as well as for boys—can be achieved bymaking fairly modest changes. Such actions as increasing parentinvolvement in school management or providing tuition waivers forgirls are likely to be enough to convince parents to send their daughtersto school. The study also emphasizes the need for teaching life skillsboth in schools and in the community.
POPULATIONS IN TRANSIT
Education access for vulnerable populations (nomads, internally displacedpersons [IDPs]) needs to be expanded. Providing education services forIDPs and nomads in northern Sudan remains a significant challengebecause they are perpetually on the move. Data on the size of these pop-ulation groups are scarce, and there is great variation in available esti-mates. For example, according to the United Nations High Commissionerfor Refugees (UNHCR), there were 4.9 million IDPs in Sudan (includingSouth Sudan), with 2.6 million located in the Darfur region alone and 1.7million in Khartoum state. However, according to the 2008 populationcensus, there are approximately 780,000 IDPs, and the difference in num-bers is probably a result of the definitions used. Nomads also make up alarge share of the population in northern Sudan. According to the exist-ing estimates, nomads account for 8.5–8.7 percent of the total population(GoS and others 2005; UNHCR 2010).
In 2008–09, 8.7 percent of basic schools in northern Sudan werenomadic and 1.6 percent were IDP (Education Yearbook 2009). IDPschools are large. Their average enrollment was 815 students in 2008–09,with an average of 92 students per class, which potentially results in lowerlearning levels. Nomadic schools, on the other hand, are smaller, multi-grade schools, though teachers follow the general curriculum.
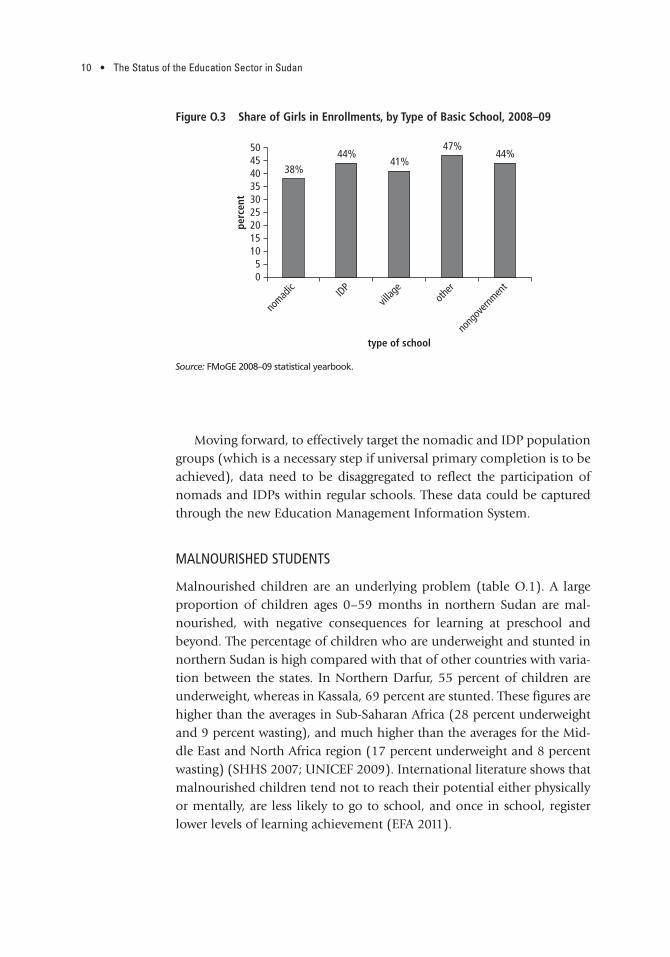
Among these vulnerable groups, the share of girls in basic educationis smaller than that in regular schools (figure O.3). The share of girls innomadic schools is 38 percent and in IDP schools, 44 percent comparedwith 47 percent in regular government schools. These figures suggest thatgirls are at a greater disadvantage within the vulnerable populationgroups, particularly nomads.
10 • The Status of the Education Sector in Sudan
Moving forward, to effectively target the nomadic and IDP populationgroups (which is a necessary step if universal primary completion is to beachieved), data need to be disaggregated to reflect the participation ofnomads and IDPs within regular schools. These data could be capturedthrough the new Education Management Information System.
MALNOURISHED STUDENTS
Malnourished children are an underlying problem (table O.1). A largeproportion of children ages 0–59 months in northern Sudan are mal-nourished, with negative consequences for learning at preschool andbeyond. The percentage of children who are underweight and stunted innorthern Sudan is high compared with that of other countries with varia-tion between the states. In Northern Darfur, 55 percent of children areunderweight, whereas in Kassala, 69 percent are stunted. These figures arehigher than the averages in Sub-Saharan Africa (28 percent underweightand 9 percent wasting), and much higher than the averages for the Mid-dle East and North Africa region (17 percent underweight and 8 percentwasting) (SHHS 2007; UNICEF 2009). International literature shows thatmalnourished children tend not to reach their potential either physicallyor mentally, are less likely to go to school, and once in school, registerlower levels of learning achievement (EFA 2011).
38%44%
41%47%
44%
05
101520253035404550
nomad
ic IDPvil
lage
other
nong
overn
ment
perc
ent
type of school
Figure O.3 Share of Girls in Enrollments, by Type of Basic School, 2008–09
Source: FMoGE 2008–09 statistical yearbook.

Overview • 11
STAFFING NEEDS
Attracting teachers to hardship areas and remote schools remains a chal-lenge. In northern Sudan, basic education teachers are not effectivelydeployed based on school needs. Specifically, the number of teachersallocated to a school frequently does not increase with the number ofstudents enrolled in that school, and teachers tend to be concentratedin urban areas. The degree of randomness in the allocation of teachersin northern Sudan is only about 49 percent (see figure O.4), which isworse than all Sub-Saharan African countries shown except Liberia.Two of the main constraints to effective deployment of teachers appearto be (a) the policy that deploys female teachers close to their spouses
Table O.1 Anthropometric Measures of Sudan’s Childrenpercent
State Underweight Stunted Wasted
Northern 41.6 38.7 26.3
River Nile 34.5 40.0 15.2
Red Sea 43.3 45.2 19.8
Kassala 53.9 68.5 23.7
Al Qadarif 42.5 55.2 11.4
Khartoum 24.5 37.2 13.1
Al Jazirah 28.5 41.3 9.7
Sinnar 38.0 50.4 14.0
Blue Nile 46.5 59.8 14.5
White Nile 40.2 48.7 15.3
North Kordofan 42.9 51.0 15.5
South Kordofan 35.3 43.0 14.9
Northern Darfur 55.0 48.6 28.5
Western Darfur 51.3 44.8 23.2
Southern Darfur 41.6 47.3 11.4
Sub-Saharan Africa (2000–07) 28 38 9
Middle East and North Africa (2000–07) 17 26 8
Source: For northern Sudan, the data are from the World Bank staff calculations (World Bank forthcom-ing) using data from the SHHS 2006 (GoNU and GoSS 2006). For Sub-Saharan Africa and the Middle Eastand North Africa, the data are from the National Center for Health Statistics of the U.S. Centers for
Disease Control and Prevention and from the World Health Organization.

0
São T
omé a
nd Pr
íncipe
Guinea
Mozam
bique
Namibi
aLe
sotho Nige
rSe
nega
l
Guinea
-Bissau
Zambia
Rwanda
Burkina
Faso
Maurita
nia
Centra
l Afric
an Rep
ublic
Gabon Mali
Madag
ascar
Ghana
Ethiop
iaSie
rra Le
one
Côte d’
Ivoire
Chad
Ugand
aTo
goCon
go, R
ep.
Benin
Congo
, Dem
. Rep
.Mala
wiCam
eroon
Burund
iLib
eria
Suda
n (no
rthern
)
10
country
perc
ent
20
30
40
50
60
Figure O.4 International Comparisons: Degree of Randomness in Teacher Allocations in Basic Education, by Country
Source: Authors’ estimates from the various country status reports.
12
Overview • 13
(67 percent of teachers are female) and (b) the fact that there are noincentives (financial or otherwise) provided by the government to workin rural or remote schools.
One of the critical areas to be addressed moving forward is how toattract teachers to hardship or remote areas. Some of the solutions couldinclude recruiting teachers from those areas and providing financialincentives such as bonuses, faster promotions, or housing for teachers inremote schools.
FEDERAL EDUCATION SPENDING
Although government spending on education has increased, it remains lowcompared with other countries, particularly for basic education. Between2000 and 2009, there was a substantial increase in education spending—from SDG 660 million in real terms to SDG 2.4 billion—which indicatedthe government’s commitment to expand and improve education. Theshare of gross domestic product (GDP) allocated to education doubled to2.7 percent over this period, but northern Sudan still spends less on educa-tion compared with similar lower-middle-income countries in Africa andthe Middle East. Furthermore, average spending on basic education as ashare of total education spending, that is, 37 percent, is lower than that inEgypt, Kenya, and Morocco, which allocate 40 percent, 55 percent, and 46 percent, respectively. It is evident therefore that more resources areneeded in the sector.4 This need will become an increasing challenge if eco-nomic growth slows down or government revenues decline, making theshift to efficiency in the use of resources all the more urgent.
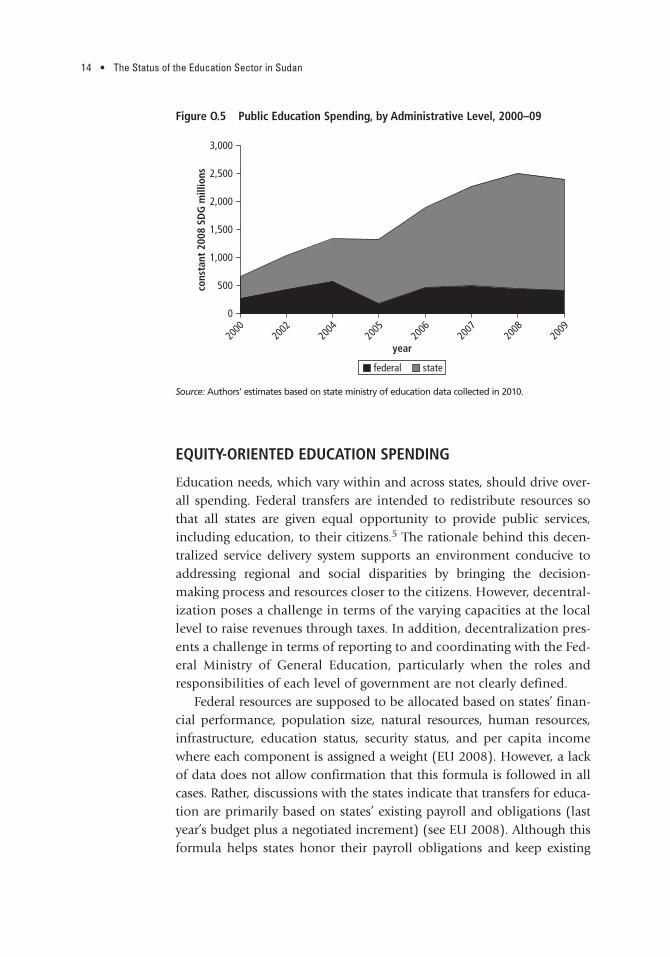
Following the government’s decentralization policy, the responsibili-ties of the states have increased significantly since the 2005 Comprehen-sive Peace Agreement. Education spending at the state level has followedthis pattern: in 2009, states covered 83 percent of total public educationspending (see figure O.5). In practice, however, the fiscal autonomy ofsome states has been limited because they rely heavily on federal transfersdriven by federal policies that influence areas such as salary determina-tion (World Bank 2007).
Government spending on goods and services in the education sectorhas been low, particularly for basic education, where goods and servicesaccount for only 5 percent of total recurrent spending. This relativelysmall share of public spending is offset by household spending on schoolrunning costs (EU 2008), which in 2009 were estimated to be an annualaverage of SDG 84 per person among urban households and SDG 24 perperson among rural households World Bank 2010).
14 • The Status of the Education Sector in Sudan
EQUITY-ORIENTED EDUCATION SPENDING
Education needs, which vary within and across states, should drive over-all spending. Federal transfers are intended to redistribute resources sothat all states are given equal opportunity to provide public services,including education, to their citizens.5 The rationale behind this decen-tralized service delivery system supports an environment conducive toaddressing regional and social disparities by bringing the decision-
making process and resources closer to the citizens. However, decentral-ization poses a challenge in terms of the varying capacities at the locallevel to raise revenues through taxes. In addition, decentralization pres-ents a challenge in terms of reporting to and coordinating with the Fed-eral Ministry of General Education, particularly when the roles andresponsibilities of each level of government are not clearly defined.
Federal resources are supposed to be allocated based on states’ finan-cial performance, population size, natural resources, human resources,infrastructure, education status, security status, and per capita incomewhere each component is assigned a weight (EU 2008). However, a lackof data does not allow confirmation that this formula is followed in allcases. Rather, discussions with the states indicate that transfers for educa-tion are primarily based on states’ existing payroll and obligations (lastyear’s budget plus a negotiated increment) (see EU 2008). Although thisformula helps states honor their payroll obligations and keep existing
0
500
1,000
1,500
2,000
2,500
3,000
2000
2002
2004
2005
year20
0620
0720
0820
09
cons
tant
200
8 SD
G m
illio
ns
federal state
Figure O.5 Public Education Spending, by Administrative Level, 2000–09
Source: Authors’ estimates based on state ministry of education data collected in 2010.

Overview • 15
education services running, it tends to perpetuate existing inequalitiesand reduce states’ spending autonomy.
Further, the analysis of education spending in northern Sudan is ham-pered by several challenges. A consolidated budget for the three levels ofgovernment (federal, state, and local) is lacking; spending is not classifiedby function and purpose; data exist typically for budget allocations ratherthan executed amounts; and financial management capacity is weak at thestate and local levels, which results in the incomplete reporting of spend-ing at these levels (World Bank 2007).
Although the GoNU supports a strong equity-orientated approach toeducation service delivery in the ESSP, there is an urgent need to link theplanning and budgeting processes with the education resource needs ofdifferent regions and vulnerable populations. A prerequisite for an equity-orientated approach to education service delivery is the regular collectionand analysis of data on (a) key educational outcomes by region and pop-ulation groups, (b) past trends in investments and outcomes, and (c) gapsthat need to be bridged in terms of key education outcomes (Jhingran andSankar 2009). Moving forward, the Education Management InformationSystem, currently being instituted by the Ministry of General Educationin collaboration with the EU, will be critical in capturing such disaggre-gated educational input and output data. However, the collection of state-level education spending data remains an issue that needs to be dealt withmore broadly to improve the public financial management system withinthe Ministry of Finance and National Economy.
CONCLUSION
The GoNU has made great efforts to increase access to education for chil-dren in northern Sudan across education subsectors over the past decade.In particular, educational access for children in areas previously affected byconflict has improved substantially since the signing of the peace agree-ments of 2005 and 2006. Estimates suggest that, on average, 90 percent ofall children in northern Sudan had access to a formal school in 2010.However, inequities in access to schooling by gender and location persist.There continue to be regional disparities in access by children in ruralareas, with girls facing the greatest disadvantage.
The challenges ahead relate not only to reducing these inequities inaccess but also to improving the efficiency of the education system toproduce young adults equipped with the skills and knowledge tosecure their livelihoods and contribute to society. If northern Sudan isto achieve its target of Education for All, it needs to focus on three
16 • The Status of the Education Sector in Sudan
things: enrolling all children, keeping them in school, and creating anenvironment that facilitates learning. The critical constraints facing theefficiency of the system in northern Sudan include the large number ofdropouts at both basic and secondary levels, the ineffective deploy-ment of teachers across schools (and the inability to attract teachers toremote schools), insufficient resources (particularly textbooks) for stu-dents, and inadequate instructional time.
Finally, two critical risks face the education sector. One is a contrac-tion in public spending—because of the heavy reliance of the countryon oil revenues—resulting in reduced transfers to the states. The otheris the lack of alignment between the educational needs of a state and theresources provided.
NOTES 1. A similar learning assessment and service delivery study for secondary edu-
cation was being conducted by the United Nations Educational, Scientific, andCultural Organization/United Nations Children’s Fund (UNESCO/UNICEF) atthe time this report was being compiled, as well as an early childhood develop-ment (ECD) assessment by UNICEF. A separate higher education learning paperwas also being prepared by the World Bank at the time.
2. In 2007–08, there was a government campaign encouraging parents tosend their children to school, and as a result, grade 1 enrollments increased. In2008–09, there was no such campaign, and grade 1 enrollments dropped.
3. For the purpose of this comparison, public spending per student on school operating costs is defined as spending on goods and services.
4. Calculations were made after adjusting for the fact that basic education innorthern Sudan is eight years rather than six.
5. The rules governing fiscal transfers are scattered in many documents,including the Comprehensive Peace Agreement of 2005, the Darfur Peace Agree-ment of 2006, and the Eastern Sudan Peace Agreement of 2006.
REFERENCES EFA (Education for All). 2011. EFA Global Monitoring Report 2011. The Hidden Cri-
sis: Armed Conflict and Education. Paris: United Nations Educational, Scientific,and Cultural Organization. Available at http://unesdoc.unesco.org/images/0019/001907/190743e.pdf.
EU (European Union). 2008. Cost and Financing Study.FMoGE (Federal Ministry of General Education). Various years. “Statistical Year-
books.” Khartoum.———. 2008. “Baseline Survey on Basic Education in the Northern States of Sudan:
Final Report June 2008.” Online document available at http://planipolis.iiep.unesco.org/epiweb/E029336e.pdf.
GoNU (Government of National Unity). 2010. “Poverty in Northern Sudan: Esti-mates from the National Baseline Household Survey of 2009.” Khartoum.

Overview • 17
GoNU (Government of National Unity) and GoSS (Government of SouthernSudan). 2006. Sudan Household Health Survey (SHHS) 2006. Khartoum/Juba:Central Bureau of Statistics and Southern Sudan Center for Census, Statisticsand Evaluation.
GoS (Government of Sudan), SPLM (Sudan Peoples Liberation Movement),World Bank, and UNDP (United Nations Development Programme). 2005.Joint Assessment Mission: Framework for Sustained Peace, Development, andPoverty Eradication. Vols. I–III. Available at http://www.unsudanig.org/docs/Joint%20Assessment%20Mission %20(JAM)%20Volume%20I.pdf.
Interim Constitution of the Republic of Sudan. 2005. Available at http://www.sudan-embassy.de/c_Sudan.pdf.
Jhingran, Dhir, and Deepa Sankar. 2009. “Addressing Educational Disparity:Using District Level Education Development Indices for Equitable ResourceAllocations in India.” Policy Research Working Paper 4955, South AsiaRegion, Human Development Network, World Bank, Washington, DC.
UNHCR (United Nations High Commissioner for Refugees). 2010. Available athttp://www.unhcr.org/cgi-bin/texis/vtx/home/opendocPDFViewer.html?docid=4dfdbf480&query=IDPs%20Sudan%202010.
UNICEF (United Nations Children’s Fund). 2009. The State of the World’s Children2009: Maternal and Newborn Health. New York: UNICEF. Available athttp://www.unicef.org/sowc09/report/report.php.
UNICEF/GoSS (United Nations Children’s Fund/Government of SouthernSudan). 2008. Socio-Economic and Cultural Barriers to Schooling in SouthSudan. Juba.
World Bank. 2007. “Sudan. Public Expenditure Review. Synthesis Report.” Report41840-SD. World Bank, Washington, DC.
———. Forthcoming. “Public Expenditure Tracking Survey (PETS) for NorthernSudan: From Spending More to Spending Smart–Case Study of the HealthSector.” Poverty Reduction and Ecomonic Management Network, World Bank,Washington, DC.


19
CHAPTER
Setting the Scene
This chapter provides the context for education in Sudan. It begins withan overview of the demographic, macroeconomic, and socioeconomicenvironment and is followed by a brief description of the administra-
tive structure of education. The six subsequent chapters focus on detailsrelated to (a) overall enrollment trends, (b) patterns in student flow, (c) dis-parities in education provision, (d) status of educational service delivery inthree states, (e) management of teachers, and (f) financing of the educationsystem.
SCOPE OF THIS EDUCATION SECTOR STATUS REPORT
Sudan is committed to the Education for All (EFA) Initiative and the edu-cation Millennium Development Goals (MDGs) and to providing uni-versal access to quality education in both primary and secondary educa-tion. The five-year (2007–11) Education Sector Strategic Plan (ESSP)based on the 2001 Education Act of the Government of National Unity(GoNU) directs activities in the education sector. In developing its newESSP, for 2012–16, the GoNU sought to assess the status of the educationsystem in order to identify priority areas for development in the sector.This Education Sector Status Report is a diagnostic of the system for thatpurpose. It provides the knowledge base (box 1.1) that will inform thepreparation of the 2012–16 ESSP and contribute to dialogue among rel-evant stakeholders on the continuing challenges and emerging strategicpriorities for the education sector. The focus of this report is northernSudan, which encompasses 15 states.1
The period since 2005 has been characterized by relative peacebetween northern and southern Sudan. Following decades of civil war, theComprehensive Peace Agreement (CPA) was signed on January 9, 2005.
1
20 • The Status of the Education Sector in Sudan
Through the institutionalization of autonomy for southern Sudan and thesharing of resources, the agreement offered an environment for both sidesto concentrate their efforts on reconstruction and development. The East-ern Sudan Peace Agreement in 2006 brought peace to that region, thoughconflict has continued in the Darfur region after the Darfur Peace Agree-ment in 2006.
DEMOGRAPHIC CONTEXT
Sudan is a multicultural society and is undergoing rapid change. Locatedat the crossroads between North and East Africa and the Middle East, itwas Africa’s largest country by area prior to the secession of South Sudanon July 9, 2011. Sudan is characterized by cultural, ethnic, and religiousdiversity and is home to numerous tribes, languages, and dialects. Theofficial languages of Sudan are Arabic and English, though Arabic is thedominant language in northern Sudan. As in most African countries,
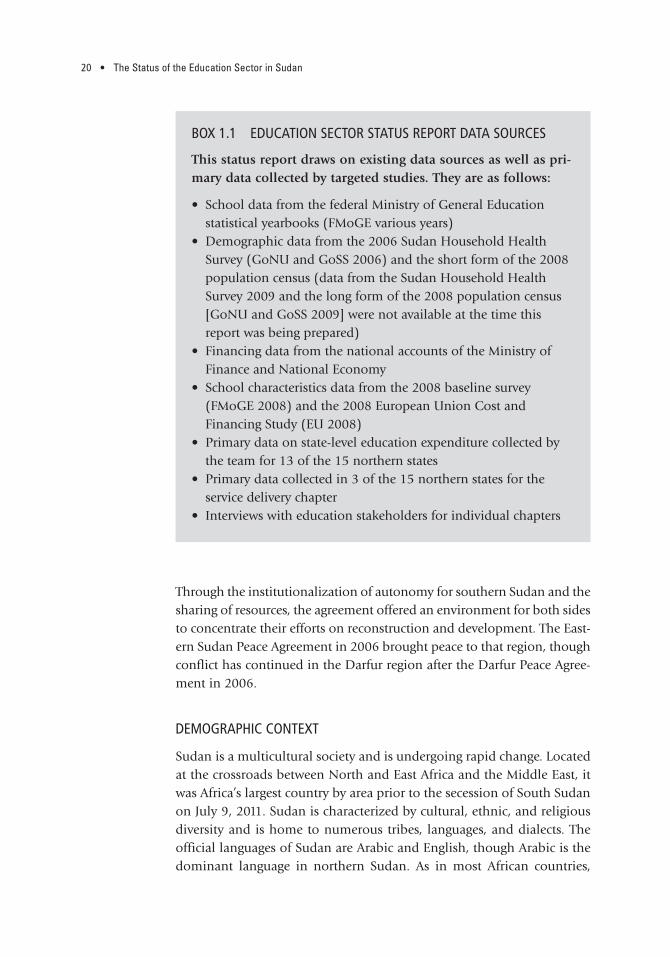
BOX 1.1 EDUCATION SECTOR STATUS REPORT DATA SOURCES
This status report draws on existing data sources as well as pri-mary data collected by targeted studies. They are as follows:
• School data from the federal Ministry of General Education statistical yearbooks (FMoGE various years)
• Demographic data from the 2006 Sudan Household Health Survey (GoNU and GoSS 2006) and the short form of the 2008population census (data from the Sudan Household Health Survey 2009 and the long form of the 2008 population census[GoNU and GoSS 2009] were not available at the time thisreport was being prepared)
• Financing data from the national accounts of the Ministry ofFinance and National Economy
• School characteristics data from the 2008 baseline survey(FMoGE 2008) and the 2008 European Union Cost and Financing Study (EU 2008)
• Primary data on state-level education expenditure collected bythe team for 13 of the 15 northern states
• Primary data collected in 3 of the 15 northern states for theservice delivery chapter
• Interviews with education stakeholders for individual chapters

Setting the Scene • 21
Sudan is undergoing rapid urbanization, with 43 percent of the popula-tion living in urban areas in 2008, which is up from 36 percent in 2000and 27 percent in 1990.2 The strong rural-urban migration is in partdriven by drought and desertification, as well as insecurity in rural areas(World Bank 2009).
The accuracy of demographic data has always been an issue in Sudan.The combination of a vast territory, a large nomadic population, civil con-flict, and security concerns makes it difficult to count the population.Much effort was therefore invested in the 2008 population census (GoNUand GoSS 2009), the first postwar census in Sudan.3 The census estimatedthe total population of Sudan at 39.2 million. The population of just the15 northern states was 30.9 million, corresponding to 79 percent of thetotal population of Sudan.
The 15 northern states vary widely in population size. Khartoum Stateand neighboring Al Jazirah State are the main centers of economic activ-ity in Sudan (World Bank 2009). They are also among the largest states interms of population: Khartoum State is home to 5.3 million inhabitantsand Al Jazirah State to 3.6 million. Other large states include SouthernDarfur (4.1 million), North Kordofan (2.9 million), and Northern Darfur(2.1 million), whereas the remaining 10 states have fewer than 2 millioninhabitants each.
The demographic context for providing universal basic education innorthern Sudan is more advantageous than that for Sub-Saharan Africagenerally. The share of 5–16-year-olds in the total population of northernSudan in 2008 was 31.9 percent compared with the average across Sub-Saharan Africa of 34.4 percent. The share of 5–16-year-olds in the popu-lations of some of Sudan’s neighbors was larger, notably Ethiopia, with36 percent, and Chad, with 37 percent. Thus, northern Sudan will be in abetter position to shoulder the cost of providing basic education to allchildren than will several of its African neighbors.
The pace of population growth has declined. This fact suggests thatSudan is nearing a demographic transition, where the size of the genera-tions will stabilize, which has positive implications for the affordability ofthe education system. The pattern of slowing population growth is mostpronounced in Kassala, Northern, and Red Sea states; however, it is notpresent in all states.
MACROECONOMIC CONTEXT
The past 15 years have been a period of unprecedented economicgrowth in Sudan. Between 1975 and 1995, GDP per capita—a measure ofaverage income per person—remained within a narrow band of

22 • The Status of the Education Sector in Sudan
US$600–US$800 (in real terms). During this period, Sudan was a low-income country with an average income similar to that of Chad or Kenyain 2010. Since 1995, and especially since 1999 when Sudan startedexporting oil in significant amounts, the country has experienced strongeconomic growth. Between 1995 and 2008, GDP per capita almost dou-bled in real terms, from US$780 to more than US$1,400 (figure 1.1).
The economic expansion has brought with it increased investmentand improved macroeconomic management. A 2009 World Bank reportargues that Sudan’s oil wealth has led to considerable investment in infra-structure and utilities. For example, the length of the Sudanese road net-work grew by 80 percent between 2000 and 2008, and electricity genera-tion doubled over the same period. There are also improvements inmacroeconomic management since the discovery of oil; for example,inflation was reduced from an average of 33 percent per year during the1970s and 1980s to 8 percent per year since 1999.
In spite of the benefits, Sudan’s overdependence on oil revenues threat-ens the stability of the economy. In the short term, the volatility of oilprices and uncertainties about oil production present challenges for fiscalmanagement. In the long term, Sudan’s oil reserves are not unlimited, sofuture economic growth will depend on the development of nonoil sectors.
GOVERNMENT REVENUE AND EXPENDITURE
The strong economic growth in Sudan has been accompanied by an evenstronger expansion of the public sector. Total GoNU spending grew from11 percent of GDP in 2000 to 17 percent in 2009 (table 1.1). However, the
$746 $716$631
$692$780
$941
$1,137
$1,413
400
600
800
1,000
1,200
1,400
1,600
1970 1975 1980 1985 1990year
1995 2000 2005 2010
cons
tant
200
8 U
S$
Figure 1.1 Growth of GDP per Capita in Sudan, 1975–2008
Source: Adapted from World Bank 2009.

23
Table 1.1 Trends in GoNU Revenues and Expenditures, 2000–09
Indicator
Actual Budgeted
2000 2002 2004 2005 2006 2007 2008 2009
Total GoNU revenuea 6,901 8,800 15,152 16,071 18,569 20,768 24,274 16,591
As percentage of GDP 11 12 18 18 19 19 21 15
Percentage from oil 43 42 49 50 51 56 66 43
Total GoNU expenditurea 7,277 9,657 16,333 18,906 22,597 24,275 25,985 19,442
As percentage of GDP 11 13 20 21 23 23 22 17
Federal government expenditurea 6,665 9,044 15,087 13,564 14,481 15,318 14,413 11,028
Transfer to northern statesa 612 613 1,246 2,832 4,453 5,078 5,411 5,555
Transfer to GoSSa 0 0 0 2,510 3,664 3,880 6,161 2,858
Memo item: GDPa 65,696 73,484 82,761 87,999 97,933 107,886 116,887 112,209
Source: Data for 2007–10 are from the Ministry of Finance and National Economy revenue and expenditure accounts. Data for earlier years are from World Bank (2007). Estimatedfigures for GDP for 2009 and 2010 are from EIU (2010).Note: Current prices are shown in annex 1A to this chapter. GDP = gross domestic product; GoNU = Government of National Unity; GoSS = Government of Southern Sudan.a. Figures are in 2008 constant million Sudanese pounds (SDG).

GoNU expenditure figures do not include all public spending. Theyexclude spending by other levels of government, notably states and local-ities, which draw from their own locally generated sources of revenue. Inabsolute terms, GoNU revenues and expenditures were at their highestin 2008 as a result of that year’s spike in oil prices. Similarly, the declinein overall GoNU revenues and expenditures in 2009 can be attributed tothe precipitous drop in oil export revenues (World Bank 2010a).
Public spending in Sudan is still relatively modest relative to the sizeof its economy. In Sub-Saharan Africa, public spending of middle-incomecountries averages 35 percent of GDP, whereas public spending of low-income countries averages 25 percent of GDP, compared to 17 percent inSudan.
Since the 2005 CPA, the structure of the GoNU budget reflects theincreasing level of decentralization in northern Sudan. Both the Govern-ment of Southern Sudan (GoSS) and the 15 northern states now receivevery significant transfers from the GoNU. Transfers to the northern stateshave grown from 8 percent of total GoNU spending in 2004 to as muchas 29 percent in 2009.
Economic development has been unbalanced between the centerand the periphery. Sudan’s growth process has historically been unbal-anced because the majority of its manufacturing firms and irrigatedland were concentrated in Khartoum and Al Jazirah states. The capitalcity consumes nearly one-third of the total electricity produced in thecountry, whereas less than 7 percent of households in the country haveaccess to the national grid (CEM 2010). Within northern Sudan, povertyis significantly higher in rural areas: one out of four urban dwellers ispoor, as defined by the national poverty line, but three out of five arepoor in rural areas. Poverty levels also vary by state, with the incidenceof poverty ranging from one-fourth of the population in KhartoumState to more than two-thirds of the population in Northern Darfur(GoNU 2010).
SOCIOECONOMIC BACKGROUND
Despite the economic gains and increased government spending inrecent years, socioeconomic indicators for northern Sudan remain weak.Poverty is widespread, with almost half the population (46.5 percent) innorthern Sudan living below the national poverty line (GoNU 2010).4
Table 1.2 shows that anthropometric measures for children are worse in sev-eral states in Sudan compared to the regional average. In 12 of the15 northern Sudan states, more than 34 percent of children are considered
24 • The Status of the Education Sector in Sudan

Setting the Scene • 25
underweight compared with the Sub-Saharan African average of 28 per-cent. Similarly, table 1.2 shows that except for Khartoum and Al Jazirahstates, the average percentages of stunted and wasted children in northernSudan are consistently higher than the 26 percent and 8 percent, respec-tively, in Sub-Saharan Africa. The prevalence of HIV/AIDS among 15–49-year-olds in all of Sudan is estimated to be 1.4 percent, which is below the5 percent average in Sub-Saharan Africa and above the 0.3 percent averagein the Middle East and North Africa region. However, the Joint UnitedNations Programme on HIV/AIDS (UNAIDS 2009) estimates that theHIV prevalence rate for adults in northern Sudan is 0.67 percent, which islower than the average for all of Sudan.
Sudan’s population includes the largest number of internally dis-placed persons (IDPs) in Africa.5 Out of the total 11.6 million IDPs in 19countries on the continent, there are an estimated 4.1 million IDPs in
Table 1.2 Anthropometric Measures of Sudan’s Children percent
State Underweight Stunted Wasted
Northern 41.6 38.7 26.3
River Nile 34.5 40.0 15.2
Red Sea 43.3 45.2 19.8
Kassala 53.9 68.5 23.7
Al Qadarif 42.5 55.2 11.4
Khartoum 24.5 37.2 13.1
Al Jazirah 28.5 41.3 9.7
Sinnar 38.0 50.4 14.0
Blue Nile 46.5 59.8 14.5
White Nile 40.2 48.7 15.3
North Kordofan 42.9 51.0 15.5
South Kordofan 35.3 43.0 14.9
Northern Darfur 55.0 48.6 28.5
Western Darfur 51.3 44.8 23.2
Southern Darfur 41.6 47.3 11.4
Sub-Saharan Africa (2000–07) 28 38 9
Middle East and North Africa (2000–07) 17 26 8
Source: For northern Sudan, the data are from the World Bank staff calculations (World Bank forth-coming) using data from the SHHS 2006 (GoNU and GoSS 2006). For Sub-Saharan Africa and theMiddle East and North Africa, the data are from the National Center for Health Statistics of the U.S.Centers for Disease Control and Prevention and from the World Health Organization.

26 • The Status of the Education Sector in Sudan
Sudan, including South Sudan, (UNHCR 2010) as a result of conflictand instability. Of these, the United Nations High Commissioner forRefugees (UNHCR) estimates that 2.6 million are located in the Darfurregion alone, with another 1.7 million in Khartoum State. About400,000 of the IDPs in Khartoum State reside in four sites recognizedby the authorities, while the rest live in informal squatter areas in andaround the city. Children who have been displaced often do not haveaccess to education because it is not considered a priority humanitarianor early reconstruction response.
Sudan also has a large nomadic population. The total number ofnomads in Sudan is not clear, but the Joint Assessment Mission (GoSand others 2005) estimated that 8.5 percent of both northern andSouth Sudan’s population were nomads at the time. Providing educa-tion services for nomads remains a significant challenge because theyare perpetually on the move, they often attach little value to education,and old traditions require girls to marry young (UNICEF 2009).
ADMINISTRATIVE STRUCTURE OF GENERAL EDUCATION IN NORTHERN SUDAN
General education in northern Sudan is 13 years, including 2 years of pre-school, 8 years of basic school, and 3 years of secondary school.6 The offi-cial length of the academic year at all levels of general education is 210working days, and the year is divided into two semesters. The length of theacademic year and the timing of the secondary school certificate exami-nation are determined by the federal Ministry of General Education(FMoGE), while the states decide on a suitable school calendar (see annex1B for details).
Basic education in northern Sudan is intended to be free and com-pulsory.7 According to the Interim Constitution of the Republic of Sudan(2005), basic education is compulsory and should be provided by thestate free of charge. Similar clauses are documented within the EasternFront Peace Agreement and the Darfur Peace Agreement.
The CPA has necessitated the development of a national curriculumframework that addresses the multicultural, multiethnic, and multireli-gious context of Sudan. The National Center for Curriculum and Educa-tion Research (NCCER), which is responsible for all aspects of developingand supporting the national curriculum framework for basic and second-ary education, is currently undertaking an assessment of the curricu-lum across Sudan in order to propose a framework for developing anew curriculum in line with the requirements of the CPA. Curriculum

Setting the Scene • 27
development for preschools and IDP schools is the responsibility of thestate ministries of education. Nomadic schools operate with the same cur-riculum as that used in regular schools.
There are five core areas in the basic education curriculum and nine inthe secondary school curriculum. The five areas in basic education arereligion, language, mathematics, man and the universe, and applied arts.Rather than a subject-oriented approach, the basic education curriculumfocuses on thematic areas; for example, the area of man and the universeincludes instruction in science, history, geography, and religion. With theassistance of the United Nations Children’s Fund (UNICEF), a compre-hensive life skills curriculum was also introduced in 2008 and is beingrapidly implemented across schools. The life skills curriculum includesdeveloping self-confidence and dealing with conflict, HIV/AIDS, and
gender issues. In secondary education, there are nine core subjects includ-ing Arabic, Islamic studies, English, mathematics, physics, chemistry, biology, geography, and history. Optional subjects include computers, agri-cultural and animal protection, commercial science, family studies, mili-tary studies, and engineering studies.
As a result of the CPA and the Interim Constitution of the Republic ofSudan (2005), northern Sudan has a decentralized system of education serv-ice delivery. Within the education sector, the federal government, throughthe FMoGE in Khartoum, is in charge of planning, coordinating, and moni-toring across the three general education levels. In addition, the FMoGEdirects policy development in three key areas: secondary school certification,the qualification framework for teachers, and development of the basic andsecondary education curricula. Policies related to human resource manage-ment and certification for basic education fall under the purview of the stategovernment. Further, the states and mahalyas (localities) are responsible forthe delivery of preschool, basic, and secondary education. In contrast, highereducation is managed (both policies and service delivery) by the federalMinistry of Higher Education and Scientific Research (MoHESR).
On the one hand, a decentralized service delivery system supports thecreation of an environment conducive to addressing regional and socialdisparities by bringing the decision-making process and the resourcescloser to the people of a region. On the other hand, decentralizationposes a challenge in terms of the varying capacities that exist at the locallevel to raise revenue through taxes and design and to implement policies.In addition, decentralization presents a challenge for subnational govern-ments in terms of reporting to and coordinating with the FMoGE, partic-ularly because the roles and responsibilities of each level of governmentare not clearly defined.
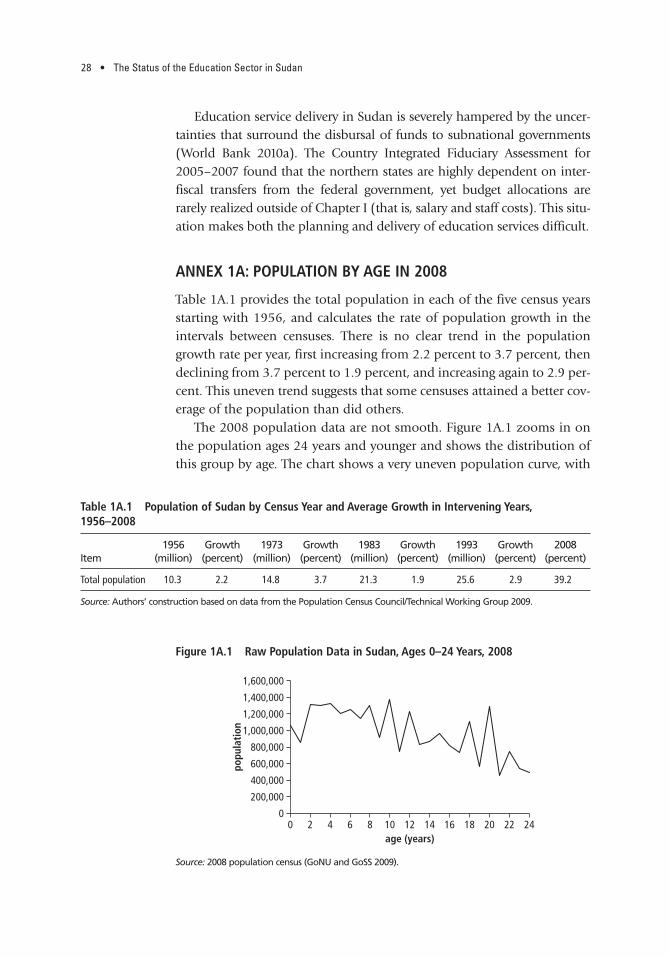
28 • The Status of the Education Sector in Sudan
Education service delivery in Sudan is severely hampered by the uncer-tainties that surround the disbursal of funds to subnational governments(World Bank 2010a). The Country Integrated Fiduciary Assessment for2005–2007 found that the northern states are highly dependent on inter-fiscal transfers from the federal government, yet budget allocations arerarely realized outside of Chapter I (that is, salary and staff costs). This situ-ation makes both the planning and delivery of education services difficult.
ANNEX 1A: POPULATION BY AGE IN 2008
Table 1A.1 provides the total population in each of the five census yearsstarting with 1956, and calculates the rate of population growth in theintervals between censuses. There is no clear trend in the populationgrowth rate per year, first increasing from 2.2 percent to 3.7 percent, thendeclining from 3.7 percent to 1.9 percent, and increasing again to 2.9 per-cent. This uneven trend suggests that some censuses attained a better cov-erage of the population than did others.
The 2008 population data are not smooth. Figure 1A.1 zooms in onthe population ages 24 years and younger and shows the distribution ofthis group by age. The chart shows a very uneven population curve, with
Table 1A.1 Population of Sudan by Census Year and Average Growth in Intervening Years,1956–2008
Item1956
(million)Growth(percent)
1973(million)
Growth(percent)
1983(million)
Growth(percent)
1993(million)
Growth(percent)
2008(percent)
Total population 10.3 2.2 14.8 3.7 21.3 1.9 25.6 2.9 39.2
Source: Authors’ construction based on data from the Population Census Council/Technical Working Group 2009.
0
200,000
400,000
600,000
800,000
1,000,000
1,200,000
1,400,000
1,600,000
0 2 4 6 8 10 12 14 16 18 20 22 24
popu
lati
on
age (years)
Figure 1A.1 Raw Population Data in Sudan, Ages 0–24 Years, 2008
Source: 2008 population census (GoNU and GoSS 2009).

Setting the Scene • 29
the numbers for most of the even ages (6, 8, 12, and so on) being higherthan those for the uneven ages (7, 9, 11, and so on), as well as very highnumbers of 10- and 20-year-olds. These peaks reflect errors, or biases, inthe data that arise because parents may not know the exact ages of theirchildren and find it easier to report the approximate ages (which tends tobe easier, rounded numbers, such as 10, 20, and the like). If the raw cen-sus data are used to calculate age-specific indicators—such as the grossintake rate or the primary completion rate—the errors in the populationdata will translate into errors in the analysis of, in this example, educationcoverage. For these errors in the data to be corrected, the population databy single ages therefore need to be smoothed.
There appears to be an underreporting of infants in the census data.8
Figure 1A.1 also shows that the number of infants, that is, children ages0 and 1 year, in the population data is very low. This finding could havetwo explanations: (a) a sudden drop in fertility in Sudan or (b) an under-reporting of infants in the census. According to Ahmed (2008), it is com-monly known that some tribes in Sudan “report lesser number of theirchildren believing that the evil eyes of the enumerators will kill their chil-dren if they report many.” Therefore (and because there are no othersources to suggest a sudden drop in fertility), we may conclude that thereare errors in the data on the number of infants.
For the purposes of this study, population data for the 2–24 age groupwere smoothed. That choice was made because of the two data issuesmentioned. Here, smoothing simply means redistributing populationacross single ages while holding the total population constant. Thesmoothing was done at the level of each state and then aggregated tonational-level smoothed population data. In the following, figure 1A.2shows the smoothed population data for all of Sudan.
0
500,000
1,000,000
1,500,000
2 4 6 8 10 12 14 16 18 20 22 24
popu
lati
on
age (years)
smoothed dataraw data
Figure 1A.2 Raw and Smoothed Population Data in Sudan, Ages 2–24 Years, 2008
Source: Authors’ construction based on the 2008 population census (GoNU and GoSS 2009).

30 • The Status of the Education Sector in Sudan
Although it is hard to see this trend in figure 1A.2, the shape of thesmoothed curve indicates a deceleration in the pace of growth in the sizeof each generation born in Sudan. This finding suggests that Sudan is near-ing a demographic transition, where the size of the generations will stabi-lize (with obvious implications for the education system). This patternof slowing population growth—which is most pronounced in Kassala,Northern, and Red Sea states—is not present in all states, however.
ANNEX 1B: ADMINISTRATIVE STRUCTURE OF THE EDUCATION SYSTEM
The Ministry of General Education (MoGE) functions according to five-year sector strategic plans. The current strategic plan runs from 2007 to2011. The National Council for General Education approves the plansand then the Council of Ministers ratifies the strategy to be implementedby federal, state, and local governments. States develop plans that aresubmitted to the FMoGE for incorporation into a national strategic plan.Based on the five-year strategic plan, annual work plans and budgets aredeveloped at the national and state levels.
STRUCTURE OF THE FEDERAL MINISTRY OF GENERAL EDUCATION9
As seen in figure 1B.1, there are four entities that report directly to the min-ister, which include the UNESCO (United Nations Educational, Scientificand Cultural Organization) National Committee, the National Center forCurricula and Educational Research (NCCER), the National Center forLanguages (SELTI), and the general secretariat for the National Councilof Illiteracy and Adult Education. There are nine general directorates and49 specialist directorates under the supervision of the undersecretary. Thegeneral directorates include (a) educational planning, (b) technical educa-tion, (c) educational external relations, (d) services and administrativeaffairs, (e) information center, (f) media and public relations, (g) educa-tional training and qualifications, (h) examinations, and (i) student activ-ities. Excluding the four entities reporting directly to the minister, the totalnumber of positions in the FMoGE administrative offices is 915.10
According to the recently completed organizational review (FMoGE2010), there is considerable overlap and duplication of functional units.The review found that 70 percent of FMoGE staff members who wereinterviewed had not seen formal job descriptions for their respectivepositions (table 1B.1). Despite the small percentage of employees who

Setting the Scene • 31
Under Secretary
Finance and Accounts
Minister of General EducationState Minister of Education
Social Services Monitoring Unit
UNESCONational
National Council for Illiteracyand Adult Education
Sudan National Centerfor Languages
National Center for Curriculum and Research
• General Directorate of Educational Planning
• General Directorate of Media and Public Relations
• General Directorate of Educational Training and Qualifications
• Information Centre
• General Directorate of Technical Education
• General Directorate of Examinations • General Directorate of
Student Activities
• General Directorate of Educational External Relations
• General Directorate of Services and Administrative Affairs Headquarters Affairs Directorate Directorate of Self Security Directorate of Logistics
South-North Coordination Directorate
Directorate of Records Directorate of Archives Service Affairs Directorate Transportation Directorate Clerk Directorate
School Feeding Directorate Secondment and Missions Directorate Cultural Relations Directorate Organisations Directorate
Friendship Schools Directorate Warehouse Unit Transportation Unit
Non-governmental and Foreign Education Directorate
Educational Media Directorate Public Relations Directorate
Physical Education and School Sports Directorates Cultural Education and Enrichment Program School Health Directorate
Information Technology Projects and Technical Training Database and Documentation
Educational Evaluation Directorate Educational Technology Directorate Statistics, Assessment and Certificates Directorate
Examinations Directorate
Directorate of Educational Advisory
Government Scholarship Directorate
Educational Studies and Research Directorate
In-service Training Directorate
Food Culture and School Farming
Leadership Training Directorate
Strategic Planning and Monitoring Directorate Preschool Education Directorate Nomadic Education Directorate Implementation of Educational Projects Directorate Educational Documentation Directorate Educational Studies and Renovations Directorate Girls Education Directorate Educational Economics Directorate Special Education Directorate Religious Education Directorate
Technical Education and Curricula Directorate Industrial and Handcraft Education Directorate Commercial Education Directorate Directorate of Statistics and Monitoring Service and Administrative Affairs Directorate Directorate of Female Education Directorate of Media and External Relations Equipments and Maintenance
Figure 1B.1 Organizational Structure of the FMoGE
Table 1B.1 Availability of Job Descriptions in the FMoGE percent
Question Yes No
Availability of formal job descriptions 17 70
Incumbent read his or her job description 17 47
Source of information and learning
Briefed by senior staff
Experience and colleagues
40
60
Source: FMoGE 2010. Note: Because job descriptions only exist for 17 percent, the rest could only be perceived roles and responsibilities and may not correspond to what is actually expected.

32 • The Status of the Education Sector in Sudan
had seen formal job descriptions, 94 percent of respondents claimed theyknew their duties and responsibilities well. When asked how they learnedabout their roles and responsibilities, 40 percent said they had beenbriefed about their duties by a senior member of the organization, whereasthe remaining 60 percent said they learned about their duties, roles, andresponsibilities over time and from their colleagues and senior staff. Con-sidering the devolution of school education to the states, staffing levels inthe FMoGE’s administration are considered to be inflated. As a result ofthe CPA, a revised organizational structure for the education sector wassubmitted to the Council of Ministers in 2007 by the Ministry of Labor,Public Service and Human Resources Development. The revised structurereduces the number of staff members from 915 to 603. However, this pro-posal has yet to be formally endorsed by the council.
ADMINISTRATION OF TECHNICAL AND VOCATIONAL EDUCATION
There are three ministries involved in the administration of technical andvocational education in northern Sudan (figure 1B.2): the MoHESR offersdegree courses in technical education in higher education institutions; theMoGE and state ministries offer courses in technical secondary education;and the Ministry of Labor, Public Service and Human Resource Develop-ment (MoLPSHR) offers apprenticeships and vocational training programsthrough private enterprises, nongovernmental organizations, and thepublic sector. The difference between courses offered by the MoGE andthe MoLPSHR is defined by their relative proportion of technical andpractical content. Technical secondary education offered by the MoGEhas 50 percent theoretical and 50 percent practical courses, whereas thevocational training offered by the MoLPSHR has 30 percent theoreticaland 70 percent practical courses.
FMoGESMoGEs
52 vocationalschools 115 technicalschools(secondary level)
MoHESR
19 publictechnical colleges(higher educationinstitutions)
MoLPSHR
5 types ofapprenticeshipsand trainingprograms
Figure 1B.2 Ministries Providing Technical and Vocational Training
Note: FMoGE = Federal Ministry of General Education; MoHESR = Ministry of Higher Educationand Scientific Research; MoLPSHR = Ministry of Labor, Public Service and Human Resource Devel-opment; SMoGE = State Ministry of General Education.

Setting the Scene • 33
The National Council for Technical and Technological Education(NCTTE) was established in December 2005 to consolidate all programsdealing with technical and vocational education under one accreditationbody. The council consists of 38 members headed by the vice president ofnorthern Sudan. One duputy chairman represents the MoHESR andanother, the MoGE. The purpose of the NCTTE is to improve the qualityof technical and vocational education and to ensure that the courses andprograms offered correspond with the needs of the labor market.
ADMINISTRATION OF HIGHER EDUCATION
The MoHESR has overall responsibility for higher education in the entirenation, both northern and southern Sudan. There are five types of highereducation institutions in Sudan: public universities, public technical col-leges, private universities, philanthropic universities, and private colleges.Universities confer degrees and colleges confer diplomas. Philanthropicuniversities are not-for-profit private institutions established by communi-ties and funded by philanthropists. They differ from other private universi-ties in that the communities that establish them actively participate in themanagement and the programs offered by the institutions.
NOTES1. A parallel study was undertaken for the semiautonomous region of south-
ern Sudan, see GoSS/World Bank (forthcoming). 2. Based on World Development Indicators (World Bank 1990; 2000). 3. For the purposes of this study, population data from the 2008 population
census (GoNU and GoSS 2009) for the 2–24 age group were smoothed becausethe census data reflected an uneven population curve and underreporting ofinfants. Smoothing simply means that the population was redistributed acrosssingle ages while holding the total population constant (see annex 1A for details).
4. The poverty line is defined as SDG 114 per person per month.5. Internally displaced persons are “persons or groups of persons who have
been forced or obliged to flee or leave their homes or places of habitual resi-dences, in particular as a result of or in order to avoid the effects of armed con-flict, situations of generalized violence, violations of human rights or natural orhuman-made disasters, and who have not crossed an internationally recognizedState border” (Guiding Principles of Internal Displacement 1998).
6. Preschools include khalwas, which are traditional Islamic schools that teachthe Quran, and public and private preschools.
7. Basic education refers to primary education in Sudan.8. During the preparation of this report, these two issues were discussed with
the Central Bureau of Statistics in both Khartoum and Juba and with the coun-terparts in the ministries of education.
9. As a result of the Comprehensive Peace Agreement, a revised organizationalstructure for the education sector was submitted to the Council of Ministers in

34 • The Status of the Education Sector in Sudan
2007 by the Ministry of Labor, Public Service and Human Resources Develop-ment. This proposal has yet to be formally endorsed by the council.
10. According to the FMoGE organizational review (2010), this includes 304posts with shared responsibilities across units (twinning), 50 posts for the “friend-ship” schools in Chad, and an additional 300 posts for ancillary personnel suchas drivers and cleaners.
REFERENCESAhmed, Awad Hag Ali. 2008. “The Fifth Population Census in Sudan: A Census with
a Full Coverage and a High Accuracy.” Al Neelain University, Khartoum. http://unstats.un.org/unsd/demographic/sources/census/country_impl.htm.
EIU (Economic Intelligence Unit). 2010. Available at http://country.eiu.com/Sudan.EU (European Union). 2008. Cost and Financing Study.FMoGE (Federal Ministry of General Education). Various years. Statistical Year-
books. Khartoum.———. 2008. “Baseline Survey on Basic Education in the Northern States of
Sudan: Final Report June 2008.” Khartoum. Online document available athttp://planipolis.iiep.unesco.org/epiweb/E029336e.pdf
———. 2010. “Organizational Review and Training and Development NeedsAssessment.” Education Management Information System Project Implemen-tation Unit, Khartoum.
GoNU (Government of National Unity). 2010. “Poverty in Northern Sudan: Esti-mates from the NBHS 2009.” Draft, Central Bureau for Statistics, Khartoum.
GoNU (Government of National Unity) and GoSS (Government of SouthernSudan). 2006. Sudan Household Health Survey (SHHS) 2006. Khartoum/Juba:Central Bureau of Statistics and Southern Sudan Center for Census, Statisticsand Evaluation.
———. 2009. Fifth Sudan Population and Housing Census: 2008. Khartoum andJuba: Central Bureau of Statistics and Southern Sudan Center for Census, Sta-tistics, and Evaluation.
GoS (Government of Sudan), SPLM (Sudan Peoples Liberation Movement),World Bank, and UNDP (United Nations Development Programme). 2005.Joint Assessment Mission: Framework for Sustained Peace, Development, andPoverty Eradication. Vols. I–III. Available at http://www.unsudanig.org/docs/Joint%20Assessment%20Mission% 20(JAM)%20Volume%20I.pdf.
GoSS (Government of South Sudan) and World Bank. Forthcoming. “Educationin South Sudan: Status and Challenges for a New System.” World Bank, Wash-ington, DC.
Guiding Principles of Internal Displacement. 1998. Available at http://daccess-dds-ny.un.org/doc/UNDOC/GEN/G98/104/93/PDF/G9810493.pdf? OpenElement.
Interim Constitution of the Republic of Sudan. 2005. Available at http://www.sudan-embassy.de/c_Sudan.pdf.
Population Census Council/Technical Working Group. 2009. Priority resultsof the Fifth Sudan Population and Housing Census: 2008 submitted to the Population Census Council by the Technical Working Group. Powerpointpresentation.
UNAIDS (Joint United Nations Programme on HIV/AIDS). 2009. Available athttp://www.unaids.org/es/dataanalysis/monitoringcountryprogress/2010progressreportssubmittedbycountries/file,33666,es.pdf.

Setting the Scene • 35
UNHCR (United Nations High Commissioner for Refugees). 2010. Available athttp://www.unhcr.org/cgi-bin/texis/vtx/home/opendocPDFViewer.html?docid=4dfdbf480&query=IDPs%20Sudan%202010.
UNICEF (United Nations Children’s Fund). 2009. The State of the World’s Children2009: Maternal and Newborn Health. New York: UNICEF. Available at http://www.unicef.org/sowc09/report/report.php.
World Bank. 1990. World Development Indicators. Washington, DC: World Bank.———. 2000. World Development Indicators. Washington, DC: World Bank.———. 2007. “Sudan. Public Expenditure Review. Synthesis Report.” Report
41840-SD. World Bank, Washington, DC.———. 2009. World Development Indicators. Washington, DC: World Bank.———. 2010a. “Northern States Budget Review Notes.” Draft. World Bank,
Washington, DC.———. 2010b. “Sudan. Country Economic Memorandum.” World Bank,
Washington, DC.


37
CHAPTER
Overall Enrollment Patterns
This chapter reviews the trends in student enrollments in northernSudan over the past nine years, and contrasts these trends with theevolution in the numbers of schools and teachers. It goes on to assess
the trends in coverage at the various levels of education. Finally, the chap-ter compares the educational coverage in northern Sudan with that ofsimilar countries, and draws on alternative sources of data to cross-checkexisting estimates of the coverage of basic school education.1
STRUCTURE OF THE EDUCATION SYSTEM AND ENROLLMENTS
The formal education system in northern Sudan has four levels. These lev-els include (a) two years of preschool education in kindergartens or khal-was,2 (b) eight years of basic school, (c) three years of secondary schooldivided into an academic and a technical track, and (d) higher educationin universities and higher institutes.3 Since 1993, teacher education hasbeen part of higher education.
As mentioned in chapter 1, the system offers 13 years of general edu-cation. Because the formal age of entry to basic school is 6 years, it followsthat preschool is targeted to 4–5-year-olds, basic school to 6–13-year-olds, and secondary school to 14–16-year-olds—thus, a total of 13 yearsof general education systemwide.
The federal Ministry of General Education (FMoGE) publishes statisti-cal yearbooks with data on preschool, basic, and secondary schools. TheMinistry of Higher Education and Scientific Research (MoHESR) main-tains data on higher education.4 Table 2.1 provides data on the trends instudent enrollments between 2000–01 and 2008–09 based on these twodata sources.
2
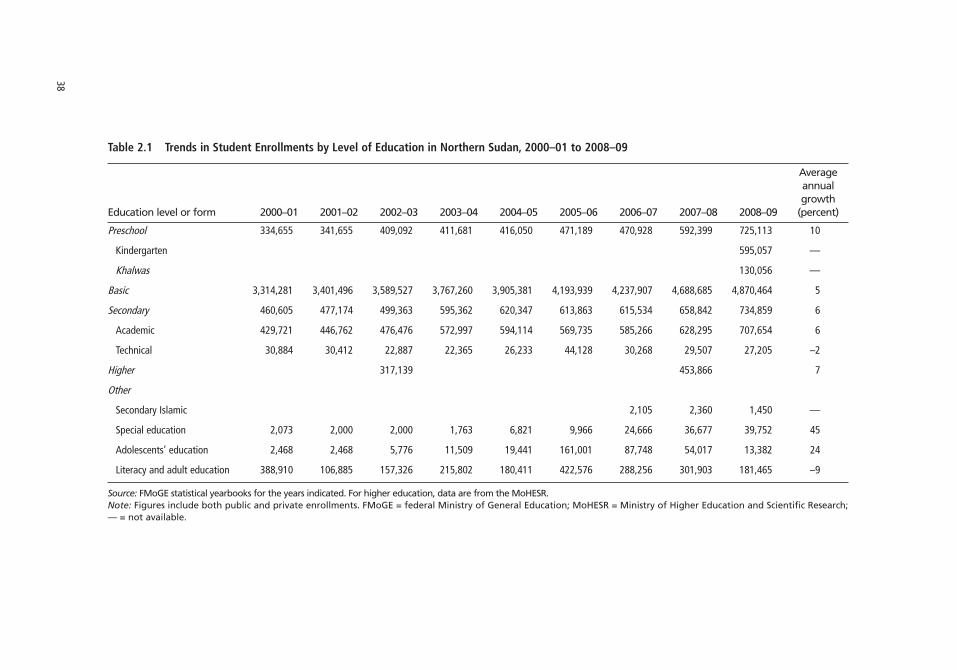
Table 2.1 Trends in Student Enrollments by Level of Education in Northern Sudan, 2000–01 to 2008–09
Education level or form 2000–01 2001–02 2002–03 2003–04 2004–05 2005–06 2006–07 2007–08 2008–09
Averageannualgrowth
(percent)
Preschool 334,655 341,655 409,092 411,681 416,050 471,189 470,928 592,399 725,113 10
Kindergarten 595,057 —
Khalwas 130,056 —
Basic 3,314,281 3,401,496 3,589,527 3,767,260 3,905,381 4,193,939 4,237,907 4,688,685 4,870,464 5
Secondary 460,605 477,174 499,363 595,362 620,347 613,863 615,534 658,842 734,859 6
Academic 429,721 446,762 476,476 572,997 594,114 569,735 585,266 628,295 707,654 6
Technical 30,884 30,412 22,887 22,365 26,233 44,128 30,268 29,507 27,205 –2
Higher 317,139 453,866 7
Other
Secondary Islamic 2,105 2,360 1,450 —
Special education 2,073 2,000 2,000 1,763 6,821 9,966 24,666 36,677 39,752 45
Adolescents’ education 2,468 2,468 5,776 11,509 19,441 161,001 87,748 54,017 13,382 24
Literacy and adult education 388,910 106,885 157,326 215,802 180,411 422,576 288,256 301,903 181,465 –9
Source: FMoGE statistical yearbooks for the years indicated. For higher education, data are from the MoHESR. Note: Figures include both public and private enrollments. FMoGE = federal Ministry of General Education; MoHESR = Ministry of Higher Education and Scientific Research;— = not available.
38

Overall Enrollment Patterns • 39
Enrollments have greatly increased at all four levels of the system. Pre-school enrollments more than doubled from 2000–01 to 2008–09; theygrew from 335,000 to 725,000 students. Basic school enrollments grewfrom 3.3 million in 2000–01 to 4.9 million students in 2008–09. Sec-ondary school enrollments grew from 461,000 students in 2000–01 to735,000 in 2008–09 because of an increase in enrollments in the aca-demic track, but enrollments in the much smaller technical track con-tracted.5 Higher education enrollments grew from 317,000 students in2002–03 to 454,000 students in 2007–08.
Few students attend adolescents’ education, special education, andliteracy and adult education. The yearbooks also report a small num-ber of students attending Islamic secondary education: 1,450 in2008–09. That same year, a fairly small number of students attendedadolescents’ education: about 14,000. Some 40,000 students attendedspecial education in 2008–09, up from only about 2,000 students atthe beginning of the decade. Literacy and adult education is the largestsubsector outside the structure of the formal system, but enrollmentsfluctuate greatly from one year to the next without exhibiting a cleartrend: in 2008–09, enrollments were about 180,000 students, downfrom 300,000 a year earlier and almost 400,000 at the beginning ofthe decade.
The fastest relative growth in enrollments has taken place in pre-school and higher education. As shown in table 2.1, the fastest relativegrowth in enrollments since 2000–01 occurred in preschool (10 per-cent per year), higher education (7 percent per year), secondary school(6 percent per year), and basic school (5 percent per year). However,basic education is the level that accounts for the largest absoluteincrease in enrollments. As illustrated in figure 2.1, basic education isby far the largest subsector of education in terms of student enroll-ments. That is why—although basic education experienced the lowestrelative growth in enrollments—basic schools still account for thelargest absolute increase in student numbers since 2000–01. Enroll-ments in basic schools grew by almost 1.6 million students in justeight years.
Overall, growth in basic school enrollments accelerated after 2005.These enrollments increased by almost a million students between2004–05 and 2008–09, which corresponds to an average annual growthof 5.7 percent. In comparison, there was an average annual increase of4.2 percent between 2000–01 and 2004–05. Several events occurred in2005 that explain this acceleration: (a) the signing of the Comprehen-sive Peace Agreement (CPA) between northern and southern Sudan,

40 • The Status of the Education Sector in Sudan
(b) a large increase in the transfer of resources to the states, and (c) apolicy declaration within the Interim Constitution of 2005 stating thatbasic schooling should be free. The Darfur Peace Agreement and theEastern Sudan Peace Agreement were signed a year later, in May 2006.
Some states now have close to full enrollment in basic school. As illus-trated in figure 2.2, which provides such enrollments in selected statesfrom 2001–01 to 2008–09, Northern and River Nile enrollments were flatover this period. In these states, as we see in chapter 4, almost all childrenalready have access to basic school, and had access even during the con-flict years. Because these states are fairly close to enrolling all children inbasic school, enrollment growth has slowed and is now largely driven bydemographic growth. In other states, such as Southern Darfur and West-ern Darfur, there was a surge in enrollments after 2005. These states weremore affected by conflict and are now benefiting from the more peacefulcircumstances.
Thus, there is evidence of a positive impact of peace on basic schoolenrollments for the populations that were disadvantaged and affected byconflict prior to 2005. Figure 2.3 shows the average annual growth inbasic school enrollments from the 2004–05 to the 2008–09 academic
0
1,000,000
2,000,000
3,000,000
4,000,000
5,000,000
6,000,000
7,000,000
2000
–01
2001
–02
2002
–03
2003
–04
2004
–05
2005
–06
2006
–07
2007
–08
2008
–09
enro
llmen
t
preschool basic secondary (academic and technical) higher education
academic year
Figure 2.1 Trends in Student Enrollments in Northern Sudan, 2000–01 to 2008–09
Source: Authors’ calculations based on FMoGE statistical yearbooks for the years indicated.Note: Data on aggregate higher education enrollments were available for only the two years shown.
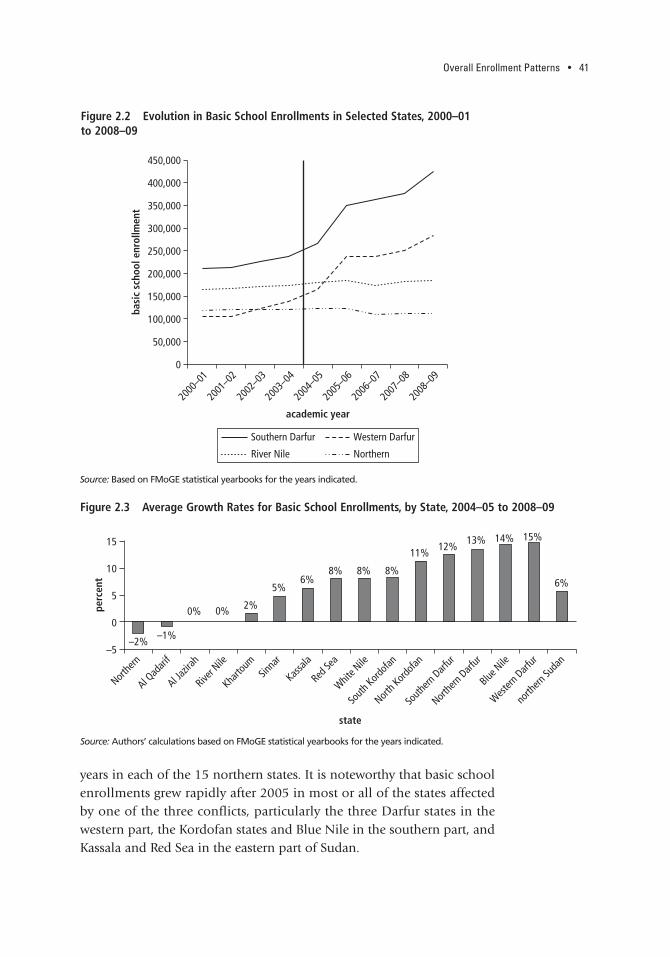
Overall Enrollment Patterns • 41
0
academic year
2000
–01
2001
–02
2002
–03
2003
–04
2004
–05
2005
–06
2006
–07
2007
–08
2008
–09
50,000
100,000
150,000
200,000
250,000
300,000
350,000
400,000
450,000
basi
c sc
hool
enr
ollm
ent
Southern Darfur Western Darfur
River Nile Northern
Figure 2.2 Evolution in Basic School Enrollments in Selected States, 2000–01 to 2008–09
Source: Based on FMoGE statistical yearbooks for the years indicated.
years in each of the 15 northern states. It is noteworthy that basic schoolenrollments grew rapidly after 2005 in most or all of the states affectedby one of the three conflicts, particularly the three Darfur states in thewestern part, the Kordofan states and Blue Nile in the southern part, andKassala and Red Sea in the eastern part of Sudan.
–2%–1%
0% 0% 2%
5%6%
8% 8% 8%
11%12%
13% 14% 15%
6%
–5
state
Northe
rn
Al Qad
arif
Al Jazir
ah
River N
ile
Kharto
umSin
nar
Kassala
Red Se
a
White N
ile
South
Kordofa
n
North K
ordofa
n
South
ern Darf
ur
Northe
rn Darf
ur
Western
Darfur
north
ern Su
dan
Blue N
ile
0
5
10
15
perc
ent
Figure 2.3 Average Growth Rates for Basic School Enrollments, by State, 2004–05 to 2008–09
Source: Authors’ calculations based on FMoGE statistical yearbooks for the years indicated.
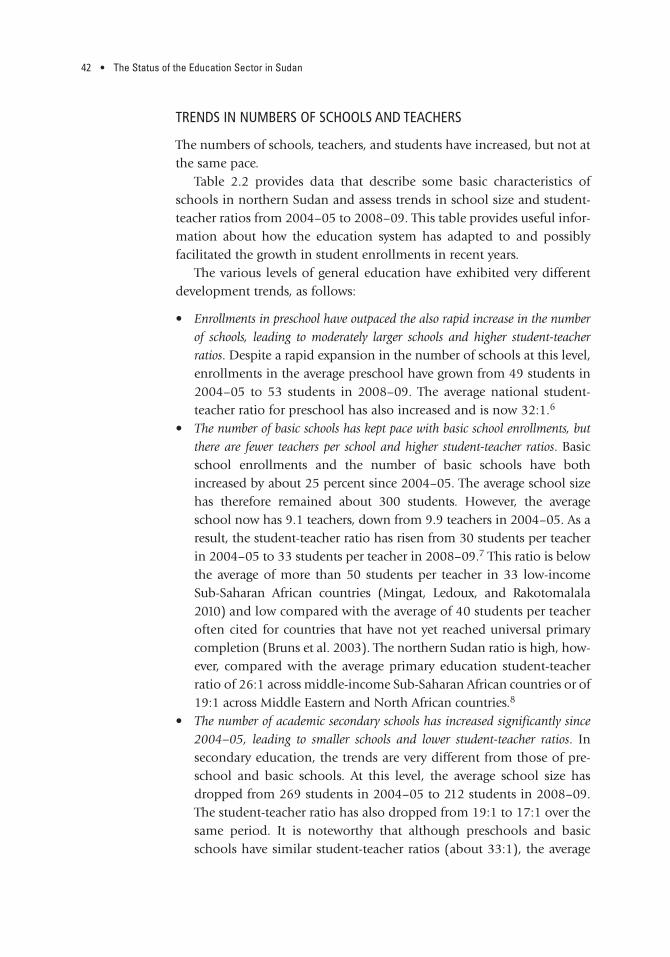
42 • The Status of the Education Sector in Sudan
TRENDS IN NUMBERS OF SCHOOLS AND TEACHERS
The numbers of schools, teachers, and students have increased, but not atthe same pace.
Table 2.2 provides data that describe some basic characteristics ofschools in northern Sudan and assess trends in school size and student-teacher ratios from 2004–05 to 2008–09. This table provides useful infor-mation about how the education system has adapted to and possiblyfacilitated the growth in student enrollments in recent years.
The various levels of general education have exhibited very differentdevelopment trends, as follows:
• Enrollments in preschool have outpaced the also rapid increase in the numberof schools, leading to moderately larger schools and higher student-teacherratios. Despite a rapid expansion in the number of schools at this level,enrollments in the average preschool have grown from 49 students in2004–05 to 53 students in 2008–09. The average national student-teacher ratio for preschool has also increased and is now 32:1.6
• The number of basic schools has kept pace with basic school enrollments, butthere are fewer teachers per school and higher student-teacher ratios. Basicschool enrollments and the number of basic schools have bothincreased by about 25 percent since 2004–05. The average school sizehas therefore remained about 300 students. However, the averageschool now has 9.1 teachers, down from 9.9 teachers in 2004–05. As aresult, the student-teacher ratio has risen from 30 students per teacherin 2004–05 to 33 students per teacher in 2008–09.7 This ratio is belowthe average of more than 50 students per teacher in 33 low-incomeSub-Saharan African countries (Mingat, Ledoux, and Rakotomalala2010) and low compared with the average of 40 students per teacheroften cited for countries that have not yet reached universal primarycompletion (Bruns et al. 2003). The northern Sudan ratio is high, how-ever, compared with the average primary education student-teacherratio of 26:1 across middle-income Sub-Saharan African countries or of19:1 across Middle Eastern and North African countries.8
• The number of academic secondary schools has increased significantly since2004–05, leading to smaller schools and lower student-teacher ratios. Insecondary education, the trends are very different from those of pre-school and basic schools. At this level, the average school size hasdropped from 269 students in 2004–05 to 212 students in 2008–09.The student-teacher ratio has also dropped from 19:1 to 17:1 over thesame period. It is noteworthy that although preschools and basicschools have similar student-teacher ratios (about 33:1), the average

Table 2.2 Increase in the Number of Schools, Teachers, and Students from 2004–05 to 2008–09
Indicator
Preschool Basic Academic secondary Technical secondary
2004–05 2008–09Percentage
change 2004–05 2008–09Percentage
change 2004–05 2008–09Percentage
change 2004–05 2008–09Percentage
change
Number of Schools 8,452 13,657 62 13,125 16,290 24 2,209 3,339 51 114 170 49
Teachers 14,834 22,990 55 130,048 147,833 14 31,348 41,249 32 1,363 1,915 40
Students 416,050 725,113 74 3,905,381 4,870,464 25 594,114 707,654 19 26,233 27,205 4
Average number of Students perschool 49 53 8 298 299 0 269 212 –21 230 160 –30
Teachers perschool 1.8 1.7 –6 9.9 9.1 –8 14.2 12.4 –13 12.0 11.3 40
Students perteacher 28 32 14 30 33 10 19 17 –11 19 14 –26
Source: FMoGE statistical yearbooks for the years indicated. Note: This table is based on all schools, both government and nongovernment. Annex table 2A.1 provides data on the number of basic schools in each state by type of school.
43

44 • The Status of the Education Sector in Sudan
ratio in secondary school is only about half, with 17 students perteacher. The low student-teacher ratio in secondary schools is likely aresult of the greater use of specialized teachers at this level.
• The numbers of technical secondary schools and teachers have expandedgreatly, but there has been no growth in enrollments. Although the num-ber of schools has grown rapidly, available statistics show that stu-dent enrollments have remained flat. However, these contradictorytrends suggest that data on technical secondary education may beincomplete.
PUBLIC-PRIVATE SHARES OF ENROLLMENTS
The share of students enrolled in nongovernment schools variesacross levels of education. These schools include fee-charging as wellas not-for-profit institutions run by religious, community, and othernongovernmental organizations (NGOs). At the preschool level, thiscategory also includes the khalwa schools; and at the secondary level,it includes tutorial classes organized by the Teachers’ Union. Figure 2.4shows the proportion of students who are enrolled in nongovernmentschools according to the FMoGE statistical yearbooks.
20%
5%
18%
0%
11%
18%
6%
0 10 20 30 40
preschool
basic
educ
atio
n le
vel
academic secondary
technical secondary
higher
percent
private or NGO schools khalwa schools
Teachers’ Union classes
Figure 2.4 Share of Students Enrolled in Nongovernment Schools, 2008–09 or Latest Available Year
Source: FMoGE 2008–09 statistical yearbook. Data for higher education relate to the 2007–08 academicyear. Note: NGO = nongovernmental organization.
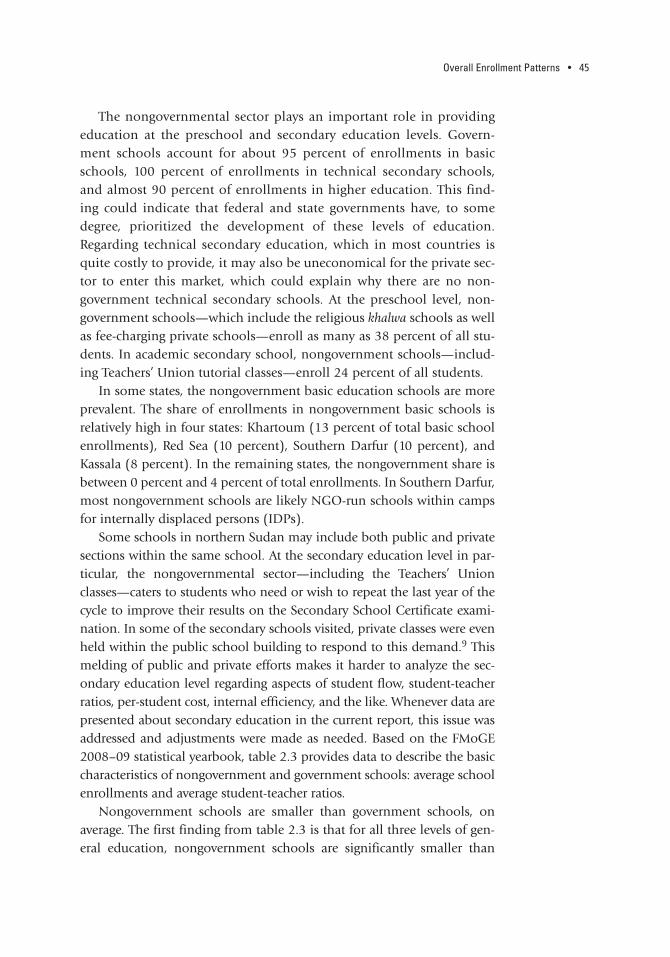
Overall Enrollment Patterns • 45
The nongovernmental sector plays an important role in providingeducation at the preschool and secondary education levels. Govern-ment schools account for about 95 percent of enrollments in basicschools, 100 percent of enrollments in technical secondary schools,and almost 90 percent of enrollments in higher education. This find-ing could indicate that federal and state governments have, to somedegree, prioritized the development of these levels of education.Regarding technical secondary education, which in most countries isquite costly to provide, it may also be uneconomical for the private sec-tor to enter this market, which could explain why there are no non-government technical secondary schools. At the preschool level, non-government schools—which include the religious khalwa schools as wellas fee-charging private schools—enroll as many as 38 percent of all stu-dents. In academic secondary school, nongovernment schools—includ-ing Teachers’ Union tutorial classes—enroll 24 percent of all students.
In some states, the nongovernment basic education schools are moreprevalent. The share of enrollments in nongovernment basic schools isrelatively high in four states: Khartoum (13 percent of total basic schoolenrollments), Red Sea (10 percent), Southern Darfur (10 percent), andKassala (8 percent). In the remaining states, the nongovernment share isbetween 0 percent and 4 percent of total enrollments. In Southern Darfur,most nongovernment schools are likely NGO-run schools within campsfor internally displaced persons (IDPs).
Some schools in northern Sudan may include both public and privatesections within the same school. At the secondary education level in par-ticular, the nongovernmental sector—including the Teachers’ Unionclasses—caters to students who need or wish to repeat the last year of thecycle to improve their results on the Secondary School Certificate exami-nation. In some of the secondary schools visited, private classes were evenheld within the public school building to respond to this demand.9 Thismelding of public and private efforts makes it harder to analyze the sec-ondary education level regarding aspects of student flow, student-teacherratios, per-student cost, internal efficiency, and the like. Whenever data arepresented about secondary education in the current report, this issue wasaddressed and adjustments were made as needed. Based on the FMoGE2008–09 statistical yearbook, table 2.3 provides data to describe the basiccharacteristics of nongovernment and government schools: average schoolenrollments and average student-teacher ratios.
Nongovernment schools are smaller than government schools, onaverage. The first finding from table 2.3 is that for all three levels of gen-eral education, nongovernment schools are significantly smaller than

46 • The Status of the Education Sector in Sudan
government schools. This finding is particularly pronounced at the aca-demic secondary level, where nongovernment schools are almost half thesize of government schools. Regarding student-teacher ratios, nongovern-ment preschools have a much lower student-teacher ratio (19:1) than dogovernment preschools (35:1) or khalwas (58:1). At the basic and academicsecondary levels, however, there is not a big difference between nongovern-ment and government schools in the statistics.
In basic and academic secondary education, enrollments in non-government schools are growing faster than those in government schools,albeit from a much lower base. In basic education, enrollments innongovernment schools grew by 8 percent per year from 2000–01 to2008–09; that figure is 3 percentage points more than the rate of growthin government school enrollments over the same period. In academic sec-ondary education, nongovernment school enrollments grew by 7 percent
Table 2.3 School Size and Student-Teacher Ratios in Government and Nongovernment Schools,2008–09
Education level Government
schools
Nongovernmentschools (excludingkhalwas/Teachers’
Union classes)Khalwas/Teachers’
Union classes All schools
Preschool, average number of students per
(Khalwa)
Schools 54 47 56 53
Teachers 35 19 58 32
Basic, average number of students per
Schools 309 186 n.a. 299
Teachers 33 32 n.a. 33
Academic secondary, averagenumber of students per
(Teachers’ Union)
Schools 231 125 n.a. 212
Teachers 16 18 n.a. 17
Technical secondary, averagenumber of students per
Schools 160 0 n.a. 160
Teachers 14 0 n.a. 14
Source: Authors’ construction based on data from the FMoGE 2008–09 statistical yearbook.Note: Khalwa is treated as a separate category to be consistent with the FMoGE 2008–09 statistical yearbook. The Teachers’ Uniondoes not have its own schools, but organizes secondary-level classes using teachers and classrooms of the public school systemin a second, private shift—hence the n.a. (not applicable) designation. Including Teachers’ Union data with either public or private schools would distort the calculation of students per school and students per teacher in these two categories.
Overall Enrollment Patterns • 47
per year from 2000–01 to 2008–09; that figure is 1 percentage point morethan the rate of growth in government school enrollments during thattime. Again, this is evidence of a strong demand for children’s educa-tion—a demand that may be growing faster than the government canrespond to it. In Khartoum State, which is home to most of the country’snongovernment schools, the number of nongovernment schools hasgrown from 140 to more than 750 over a period of eight years. In thethree Darfur states again, the surge in nongovernment schools is a resultof the involvement of NGOs in providing education to IDPs.
Government secondary schools have the lowest student-teacher ratios ofthe three levels of general education, with 16 students per teacher in aca-demic secondary schools and 14 students per teacher in technical second-ary schools. Government secondary schools in northern Sudan have lowstudent-teacher ratios compared with the average of 27:1 across low-incomeSub-Saharan African countries (Mingat, Ledoux, and Rakotomalala 2010).However, they are similar to the average student-teacher ratio of 19:1 acrossmiddle-income Sub-Saharan African countries and of 15:1 across MiddleEastern and North African countries.
SCHOOLS FOR NOMADIC AND INTERNALLY DISPLACED POPULATIONS
In 2008–09, more than 12 percent of all basic education schools in north-ern Sudan were either nomadic, IDP, or village schools. According to theFMoGE statistical yearbooks, government or village schools specificallyserve nomadic or displaced populations. Village schools are rural multi-grade schools that usually offer only the first four grades of the basic edu-cation cycle (FMoGE 2008).
Table 2.4 provides the number of schools in these three categories andtheir enrollments during the 2007–08 and 2008–09 academic years. In2008–09, nomadic schools accounted for 8.7 percent, IDP schools for1.6 percent, and village schools for 2.1 percent of 12.4 percent compo-nent of all basic education. According to the FMoGE 2008–09 statisticalyearbook, these schools accounted for 8 percent of total enrollments inbasic education, although this figure may have been underestimatedbecause the FMoGE report (2008) includes a much higher number ofvillage schools.
Nomadic schools are small, mobile, and multigrade, and they arefairly spread out across the peripheral states. During the 1990s, therewas a push for the education of nomadic communities through theestablishment of the mobile school system. According to the FMoGE

48 • The Status of the Education Sector in Sudan
2007–08 and 2008–09 statistical yearbooks, there were more than1,400 government nomadic schools, and they existed in all states exceptAl Jazirah and Khartoum. Almost a third of the basic schools in Kassalabelonged in this category, compared with 15–20 percent of the basicschools in the three Darfur states and Red Sea. Nomadic school enroll-ments typically are small. With an average enrollment of 103 studentsin 2008–09, these schools enrolled only about 147,000 children intotal, or 3 percent of basic school enrollments across northern Sudan.As may be seen in table 2.4, enrollment in nomadic schools declined in2008–09. According to the FMoGE report (2008), nomadic schools aredivided into mobile, multigrade schools for grades 1–4 and collectiveschools for grades 5–8.10
A case study of two nomadic tribes that have partially settled inNorthern Darfur reported that more than 90 percent of the families inthese tribes have one or more family members who are literate; thus,they have had access to some education (Al Fashir University / IOM2010). However, the study highlighted that although these tribes areno longer practicing “whole-family” movement, one or more familymembers are still moving with the animals, even if only within thetribal territory. The youth are sometimes involved in this work, which
Table 2.4 Number of Schools and Enrollments in Government Nomadic, IDP, and Village Schools, 2007–08 and 2008–09
Schools 2007–08 2008–09Percentage
increase
Nomadic
Number 1,431 1,422 –1
Number of students 220,535 146,826 –33
Average number of students per school 154 103 –33
IDP
Number 339 261 –23
Number of students 109,508 212,602 94
Average number of students per school 323 815 152
Village
Number 286 338 18
Number of students 22,644 32,757 45
Average number of students per school 79 97 23
Source: Authors’ construction based on data from the FMoGE 2008–09 statistical yearbook. Annex table2A.1 includes data on the number of nomadic, IDP, and village basic schools in each state.Note: IDP = internally displaced person.

Overall Enrollment Patterns • 49
potentially has negative implications for their schooling. The studyalso emphasized that the schools in these communities were barelyfunctioning.
Unlike nomadic schools, IDP schools are typically large and mainlylocated in the three Darfur states. According to government statistics,there were 261 government IDP schools in 2008–09.11 With the exceptionof three IDP schools in Northern State, all are located in the Darfurs—although in the 2007–08 school year, there were also IDP schools in BlueNile and Kassala. IDP schools have large enrollments. With an averageenrollment of 815 students in 2008–09, these schools enrolled as manyas 213,000 students, or 4 percent of total basic school enrollments innorthern Sudan.
Data on the school enrollment of IDP children are incomplete. How-ever, this enrollment is quite small if we consider that there are an esti-mated 2.7 million IDPs in the Darfur states alone and that almost700,000 of these, or 25.7 percent, are between the ages of 6 and 13.12
Many IDP children could, however, be enrolled in regular schools, so it isnot possible on this basis to conclude what share of IDP children haveaccess to basic schooling. Chapter 3 in this report presents the grossenrollment rates for each state, including the three Darfur states, but it hasnot been possible to further break down these numbers into IDP andnon-IDP schools within the states.
Finally, village schools are small, multigrade, and rural, and theyare located primarily in the Kordofan states. More than 10 percent ofschools in North and South Kordofan are multigrade village schools.As with nomadic schools, the average enrollment in village schools issmall. With an average of just 97 students per school in 2008–09,these schools accounted for only 3 percent of basic enrollments inNorth Kordofan and 6 percent in South Kordofan. Village schoolsoffer only the first grades of the basic education cycle, up to grade 4 inNorth Kordofan and grade 5 in South Kordofan. The number ofschools and their enrollments increased between 2007–08 and2008–09. According to the FMoGE report (2008), there were also vil-lage schools in Al Jazirah, Kassala, Red Sea, and Southern Darfur, butthese schools were not captured in government statistics for thatperiod (or reported as regular basic schools).
THE GROSS ENROLLMENT RATE
By contrasting data on enrollments with data on the population of rele-vant school age, we can calculate the gross enrollment rate (GER) for each

50 • The Status of the Education Sector in Sudan
level of education.13 This calculation requires making a choice aboutwhich population data to use, and for the latest school year, 2008–09, the2008 population census is the obvious choice.14 The result is a GER of37 percent for preschool, 72 percent for basic school, and 34 percentfor secondary school. It is important to stress that the GER is mainlyan indicator of the capacity of the education system vis-à-vis the popula-tion of school-age children, but it is inadequate for measuring the shareof this population who are currently in school. For example, we can inter-pret the GER as showing that basic schools in northern Sudan hadenough school places to enroll 72 percent of 6–13-year-olds, but not that72 percent of 6–13-year-olds were actually in school during the 2008–09school year.
In higher education, there were 1,500 students per 100,000 inhabi-tants in the 2007–08 academic year. Because higher education usuallyencompasses a series of degree programs of differing lengths, it is difficultto define a reference population for this level, which would be needed tocalculate a GER.15 Instead, another indicator is commonly used to meas-ure the coverage of higher education: the number of students attendinghigher education (enrollments) per 100,000 inhabitants. The value of thisindicator was 1,500 students per 100,000 population in the 2007–08school year.
TRENDS IN GERs FOR GENERAL EDUCATION
Figure 2.5 shows the trends in GERs between 2000–01 and 2008–09.Because there was no population census in Sudan between 1993 and2008, it is not obvious what population data to use for calculating theGER for the years prior to 2008. For this report, we chose to project pop-ulation data backward in time (backcasting) from the 2008 populationcensus for the best consistency of the analysis over time. Annex table 1A.1in chapter 1 lists the population data used for this report.
Since 2000–01, the GER has increased by 17 percentage points for pre-school, 15 percentage points for basic school, and 8 percentage points forsecondary school. Thus, school enrollments have increased at all threelevels compared with the size of the relevant age groups. The gains in theGER for secondary schools, however, are fairly modest, at only about1 percentage point per year. The strong increase in the GER for preschooleducation may partly be attributed to improvements in the data on pre-school enrollments, but the increase is also thought to reflect an expan-sion of coverage at this level.16

Overall Enrollment Patterns • 51
The number of higher education students per 100,000 inhabitantsincreased by 5 percent per year in five years. The figures are 1,161 in2002–03 and 1,500 in 2007–08 and reflect a very considerable gain.
INTERNATIONAL COMPARISON OF THE GER
The GER-6 is a more standardized indicator for international compar-isons of primary, or basic, coverage. In the previous section, we calcu-lated the basic school GER at 72 percent, which is the GER for the wholeeight-year primary cycle. For the purpose of international comparability,however, the GER for the first six years of basic schooling is a more stan-dardized measure. The GER-6 is 76 percent for northern Sudan.
Table 2.5 compares this value to the GERs for three groups of com-parator countries. Based on its level of GDP per capita, northern Sudan isclassified by the World Bank as a lower-middle-income country for oper-ational purposes; therefore, table 2.5 lists the primary education GERs fora number of lower-middle-income countries in Sub-Saharan Africa aswell as the Middle East and North Africa. The table also compares the pri-mary school GER with those of northern Sudan’s immediate neighbors,which are typically low-income countries.
20% 20%23% 23% 23%
academic year
25% 25%31%
37%
57% 58% 59% 61% 62%65% 65%
70% 72%
26% 26% 27% 31% 32% 31% 30% 31%
34%
0
10
20
30
40
50
60
70
80
2000
–01
2001
–02
2002
–03
2003
–04
2004
–05
2005
–06
2006
–07
2007
–08
2008
–09
perc
ent
preschool basic secondary (academic and technical)
Figure 2.5 Trends in Gross Enrollment Rates for General Education in Northern Sudan, 2000–01 to 2008–09
Source: Authors’ construction based on enrollment data in table 2.1 and population data in annex table 1A.1.

The basic school GER for northern Sudan is considerably lower thanthose for the chosen comparator countries.
Table 2.5 indicates that northern Sudan’s GER-6 of 76 percent exceedsthe GER only of Eritrea and is comparable to the GERs for countries suchas the Central African Republic, Chad, and Côte d’Ivoire. All other coun-tries in the table have higher primary GERs. The GER-6 in south Sudan isalso 76 percent.
The secondary school GER for northern Sudan is similar to those forcomparator countries. Table 2.6 indicates that northern Sudan’s sec-ondary school GER of 34 percent is comparatively high, although—aswe see in chapter 3—this is the result of a large number of repeaters.The GER is higher than those for most of northern Sudan’s neighbors,except Kenya, and is comparable to those for other lower-middle-income countries in Sub-Saharan Africa. Its secondary school GER isalso similar to those for countries such as Morocco and the Syrian ArabRepublic but lower than the average for countries in the Middle Eastand North Africa.
52 • The Status of the Education Sector in Sudan
Table 2.5 Primary Education GERs in Northern Sudan and Comparator Countries, 2008 or Latest Available Yearpercent
Selected neighboring countriesa
Lower-middle-income countries
GER Sub-Saharan Africa GERMiddle East and
North Africa GER
Central African Republic 77 Cameroon 111 Egypt, Arab Rep. 100
Chad 75 Cape Verde 101 Iran, Islamic Rep. 128
Congo, Dem. Rep. 90 Congo, Rep. 114 Jordan 96
Eritrea 57 Côte d’Ivoire 74 Morocco 107
Ethiopia 98 Lesotho 108 Syrian Arab Republic 124
Kenya 112 Nigeria 93 Tunisia 108
Uganda 117 São Tomé and Principe 130 West Bank and Gaza 80
Swaziland 108
Average 89 105 106
northern Sudan (GER-6) 76
southern Sudan (GER-6) 76
All of Sudan (GER-6) 76
Source: World Bank EdStats database, which draws on data from the UNESCO (United Nations Educational, Scientific, and Cultural Organization) Institute of Statistics and other agencies. Note: The GERs shown in this table are all based on primary cycles standardized to 5, 6, or 7 years. GER = gross enrollment rate.a. Egypt is not included here because it is included in the group of lower-middle-income countries.
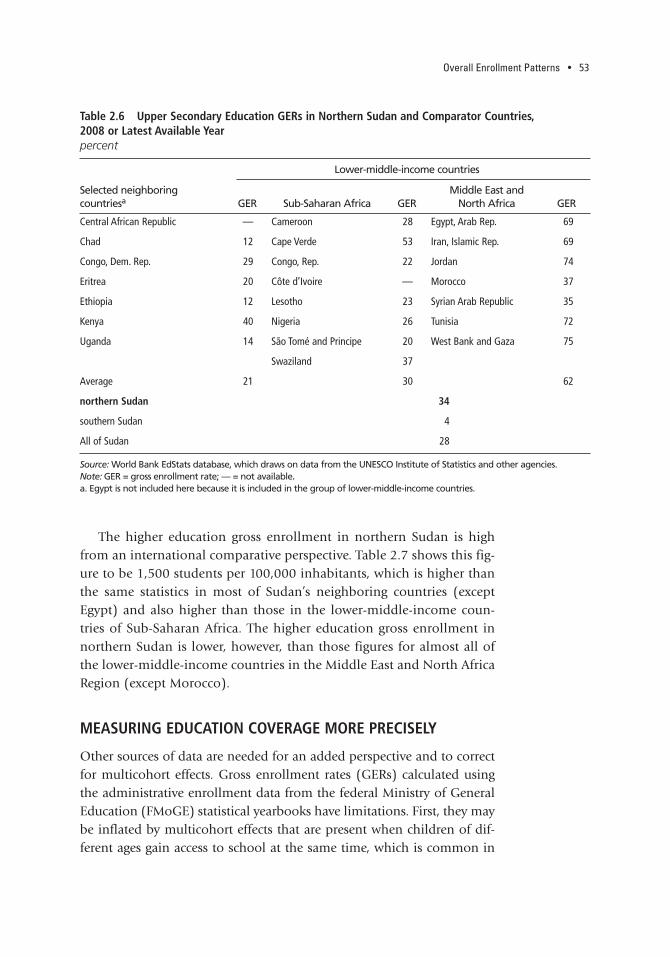
Overall Enrollment Patterns • 53
The higher education gross enrollment in northern Sudan is highfrom an international comparative perspective. Table 2.7 shows this fig-ure to be 1,500 students per 100,000 inhabitants, which is higher thanthe same statistics in most of Sudan’s neighboring countries (exceptEgypt) and also higher than those in the lower-middle-income coun-tries of Sub-Saharan Africa. The higher education gross enrollment innorthern Sudan is lower, however, than those figures for almost all ofthe lower-middle-income countries in the Middle East and North AfricaRegion (except Morocco).
MEASURING EDUCATION COVERAGE MORE PRECISELY
Other sources of data are needed for an added perspective and to correctfor multicohort effects. Gross enrollment rates (GERs) calculated usingthe administrative enrollment data from the federal Ministry of GeneralEducation (FMoGE) statistical yearbooks have limitations. First, they maybe inflated by multicohort effects that are present when children of dif-ferent ages gain access to school at the same time, which is common in
Table 2.6 Upper Secondary Education GERs in Northern Sudan and Comparator Countries, 2008 or Latest Available Yearpercent
Selected neighboring countriesa
Lower-middle-income countries
GER Sub-Saharan Africa GERMiddle East and
North Africa GER
Central African Republic — Cameroon 28 Egypt, Arab Rep. 69
Chad 12 Cape Verde 53 Iran, Islamic Rep. 69
Congo, Dem. Rep. 29 Congo, Rep. 22 Jordan 74
Eritrea 20 Côte d’Ivoire — Morocco 37
Ethiopia 12 Lesotho 23 Syrian Arab Republic 35
Kenya 40 Nigeria 26 Tunisia 72
Uganda 14 São Tomé and Principe 20 West Bank and Gaza 75
Swaziland 37
Average 21 30 62
northern Sudan 34
southern Sudan 4
All of Sudan 28
Source: World Bank EdStats database, which draws on data from the UNESCO Institute of Statistics and other agencies.Note: GER = gross enrollment rate; — = not available. a. Egypt is not included here because it is included in the group of lower-middle-income countries.

54 • The Status of the Education Sector in Sudan
rapidly expanding school systems. This situation can occur when newschools are opened in places where there were none before or whenschool fees are eliminated.17 It is reasonable to believe that there is somemulticohort effect in Sudan, a postconflict country with a rapidly growingnumber of schools.18 Second, if the administrative data are not completeor if the population data used in the denominator have a large margin oferror, then the GER will also be inaccurate. To improve the measurementof access and retention, it is helpful to compare administrative enroll-ment data with other sources of data. An alternative is provided by house-hold surveys that include questions on the schooling status of all chil-dren, both those currently in school and those out of school.
Enrollment indicators based on statistical yearbook data may beunderestimated. Household survey data can also be used to calculate ameasure of the gross enrollment rate for basic school. Figure 2.6 com-pares GERs based on different data sources and finds that in recent years,household surveys have generally produced higher estimates of basicschool coverage than have data from FMoGE statistical yearbooks and thepopulation census. This finding underlines the need to improve data on
Table 2.7 Higher Education Enrollments in Northern Sudan and Comparator Countries, 2008 or Latest Available Yearnumber of students per 100,000 people
Selected neighboring countriesa
Lower-middle-income countries
GER Sub-Saharan Africa GERMiddle East and
North Africa GER
Central African Republic 218 Cameroon 780 Egypt, Arab Rep. 3,362
Chad 171 Cape Verde 1,335 Iran, Islamic Rep. 4,698
Congo, Dem. Rep. 379 Congo, Rep. — Jordan 4,000
Eritrea 193 Côte d’Ivoire 779 Morocco 1,274
Ethiopia 328 Lesotho 426 Syrian Arab Republic —
Kenya 424 Nigeria 984 Tunisia 3,190
Uganda 340 São Tomé and Principe — West Bank and Gaza 4,714
Swaziland 501
Average 293 801 3,540
northern Sudan 1,500
southern Sudan 258
All of Sudan 1,233
Source: World Bank EdStats database, which draws on data from the UNESCO Institute of Statistics and other agencies.Note: GER = gross enrollment rate; — = not available. a. Egypt is not included here because it is included in the group of lower-middle-income countries.

Overall Enrollment Patterns • 55
school enrollments, a process that is under way with the implementationof a comprehensive Education Management Information System.
SUMMARY
• Overall, student enrollments have grown rapidly from 2000 to 2009 atall four levels of the formal education system preschool, basic, sec-ondary, and higher education. This growth demonstrates both a sig-nificant government commitment to the development of the sectorand a significant demand for education among its citizens.
• The private provision of education is fairly large at some levels, partic-ularly in preschool and academic secondary education. In basic edu-cation, where private provision is still rare, it is generally growing fasterthan public provision.
• In the peripheral states of northern Sudan, basic school enrollmentsaccelerated rapidly after the peace agreements of 2005 and 2006. Inthe central states, growth in basic school enrollments is leveling offbecause these states are edging closer to universal primary education.
• As a result of these positive trends, the coverage of basic education hasincreased significantly, although the eight-year basic school GER—at 72percent in 2008–09—was still low from an international comparativeperspective. This situation may partly be explained by data issues, how-ever. Household surveys suggest that the conventional GER based on
65% 65% 70%
academic year
72%
86%
0
20
40
60
80
100
2005
–06
2006
–07
2007
–08
2008
–09
% o
f pop
ulat
ion
ages
6–1
3
FMoGE statistical yearbooks2006 SHHS
Figure 2.6 Comparing the Gross Enrollment Rate Calculated from DifferentSources, 2005–06 to 2008–09
Source: Analysis of the 2006 Sudan Household Health Survey (GoNU and GoSS 2006); FMoGE statisticalyearbook for the years indicated.

56 • The Status of the Education Sector in Sudan
relating enrollment data to population figures may be underestimated.More work is therefore needed to improve the reliability of educationsector statistics and their comparability to population data. In statesthat have experienced large changes in population size, new householdsurveys may need to be analyzed to appropriately determine actuallevels of school participation.
• From a comparative perspective, participation in secondary education isclose to the average of similar countries. However, enrollments in highereducation are high in northern Sudan compared with those in Africancountries, although they are comparable with Middle East and NorthAfrican (MENA) countries.
ANNEX: NUMBER OF BASIC SCHOOLS
Table 2A.1 Number of Basic Schools by State and Type of School, 2008–09
State
Government schoolsPrivateschools
Governmentand private
schoolsRegular Villagea IDP Nomadic Total
Northern 445 0 3 16 464 3 467
River Nile 689 0 0 65 754 14 768
Khartoum 1,583 0 0 0 1,583 753 2,336
Al Jazirah 1,891 0 0 0 1,891 31 1,922
Blue Nile 381 0 0 39 420 2 422
Sinar 627 0 0 50 677 14 691
White Nile 874 0 0 49 923 57 980
North Kordofan 1,524 213 0 126 1,863 64 1,927
South Kordofan 844 125 0 108 1,077 23 1,100
Northern Darfur 837 0 65 164 1,066 36 1,102
Southern Darfur 997 0 135 252 1,384 207 1,591
Western Darfur 877 0 58 213 1,148 21 1,169
Red Sea 348 0 0 69 417 42 459
Kassala 422 0 0 208 630 47 677
Al Qadarif 595 0 0 63 658 21 679
Percentage of allschools 79 2 2 9 92 8 100
Total 12,934 338 261 1,422 14,955 1,335 16,290
Source: FMoGE 2008–09 statistical yearbooks.Note: IDP = internally displaced person.a. Village school is a school for grades 1–4 with a multigrade teacher.

Overall Enrollment Patterns • 57
NOTES 1. This chapter includes only aggregate data on higher education enrollments
because a World Bank–sponsored study on higher education was being developedat the same time as this report.
2. Khalwas are traditional Islamic schools that teach the Quran. They enrollchildren of all ages, but the FMoGE 2008–09 statistical yearbook reports enroll-ments only in the preschool section of khalwas.
3. There are other public schools and institutes that are not part of this hier-archy: religious institutes, vocational institutes, national industries institutes, andvocational training centers, which are all under the Ministry of Public Service andAdministrative Reform. The current study does not include information on theseschools.
4. Their website, www.mohe.gov.sd, includes data on university enrollments,personnel, number of graduates, and so on.
5. However, the year-on-year fluctuations in technical secondary enrollmentsare so large as to suggest that these enrollment data may not be comparable overtime, possibly because of the incompleteness of the data or a redefinition of whatconstitutes technical secondary versus academic secondary education.
6. The student-teacher ratios (STRs) in table 2.2 include teachers not on thegovernment payroll—for example, volunteer teachers financed by communities.If these teachers are excluded, the average STRs remain virtually the same for allsubsectors except preschool, where volunteer teachers account for a large share ofteachers in certain states. See annex table 7A.3 for preschool STRs that excludeteachers not on the government payroll by state.
7. As discussed in chapter 6, because of subject specialization of teachersfrom grade 3 onward, student-teacher ratios do not translate directly to classsizes.
8. These ratios were calculated based on data from the World Bank EdStatsdatabase.
9. The observation is based on a field visit to Red Sea State in February 2010.10. The collective schools for older children are possibly recorded in govern-
ment statistics as regular basic schools.11. This figure does not include the nongovernment IDP schools. The
FMoGE 2008–09 statistical yearbook reports more than 250 nongovernmentschools in the Darfurs. It is likely that many of these schools are also IDPschools.
12. This observation is made according to the population structure for thethree Darfur states, as reported by the 2008 population census.
13. The gross enrollment rate is calculated as total enrollments in the level ofeducation divided by the population of relevant age for that level. The relevant agegroups are 4–5 for preschool, 6–13 for basic school, and 14–16 for secondaryschool.
14. See annex table 1A.1 in chapter 1 for the population data used in thisreport.
15. If we insist on calculating a GER for higher education, we may use the17–20-year-olds as the reference population, and assuming that the average dura-tion is about four years, this results in a GER of 18 percent for 2007–08.
16. Since 2008, the FMoGE statistical yearbooks also report the enrollment inreligious preschools, khalwas, in addition to government and nongovernmentkindergarten.
58 • The Status of the Education Sector in Sudan
17. See, for example, Avenstrup, Liang, and Nellemann (2004) for a descrip-tion of the surges in enrollments in Kenya, Lesotho, Malawi, and Uganda, whenschool fees were eliminated.
18. The number of basic schools increased by 24 percent from 2004–05 to2008–09 (see table 2.2).
REFERENCES Al Fashir University/IOM (International Organization for Migration). 2010.
“Nomadic Population Baseline Survey. Case of Kuma and Malha Localities,North Darfur, Sudan. Analysis, Results and Recommendations.” Al Fashir Uni-versity, Faculty of Environmental Sciences and Natural Resources, in collabo-ration with the IOM.
Avenstrup, R., X. Liang, and S. Nellemann. 2004. “Kenya, Lesotho, Malawi, andUganda: Universal Primary Education and Poverty Reduction.” Scaling UpPoverty Reduction: A Global Learning Process and Conference. Shanghai: WorldBank.
Bruns, Barbara, Alain Mingat, and Ramahatra Rakotomalala. 2003. Achieving Uni-versal Primary Education by 2015: A Chance for Every Child. Washington, DC:World Bank.
FMoGE (Federal Ministry of General Education). 2008. “Baseline Survey on BasicEducation in the Northern States of Sudan: Final Report June 2008.” Khar-toum. Online document available at http://planipolis.iiep.unesco.org/epiweb/E029336e.pdf
GoNU (Government of National Unity) and GoSS (Government of SouthernSudan). 2006. Sudan Household Health Survey (SHHS) 2006. Khartoum/Juba:Central Bureau of Statistics and Southern Sudan Center for Census, Statisticsand Evaluation.
Mingat, A., B. Ledoux, and R. Rakotomalala. 2010. Developing Post-Primary Educa-tion in Sub-Saharan Africa: Assessing the Financial Sustainability of AlternativePathways. Africa Human Development Series. Washington, DC: World Bank.

59
CHAPTER
Patterns of Student Flow
This chapter presents a more detailed analysis of student enrollmentpatterns than does chapter 2 by focusing on student flow throughthe four levels of the education system. However, the analysis gives
most attention to basic and secondary schooling, as these are the levelsfor which data on student flow are most readily available.1
The chapter opens with a presentation and discussion of the schoolingprofile by grade and the education pyramid. It then provides an assess-ment of the distance from attaining the goal of universal primary com-pletion, which is a Millennium Development Goal, and of the pace ofprogress toward this goal in recent years. The chapter also looks at theschooling status of individuals of different ages to offer a better under-standing of issues such as under- and overage enrollment, dropout, andout-of-school children.
SCHOOLING PROFILE AND DISTANCE FROM UNIVERSAL PRIMARY COMPLETION
THE SCHOOLING PROFILE AND EDUCATION PYRAMID
Figure 3.1 shows the schooling profile for northern Sudan from grade 1of basic school to the last grade of secondary school, which is based onstudent enrollment data from the federal Ministry of General Education(FMoGE). The profile illustrates the progression of students through thegrades and the transition between basic and secondary education (in thefollowing discussion, secondary refers to both the academic and the tech-nical tracks). Unlike the gross enrollment rate, the profile is calculatedbased on the number of nonrepeaters in each grade and is therefore notinflated by repetition.
3
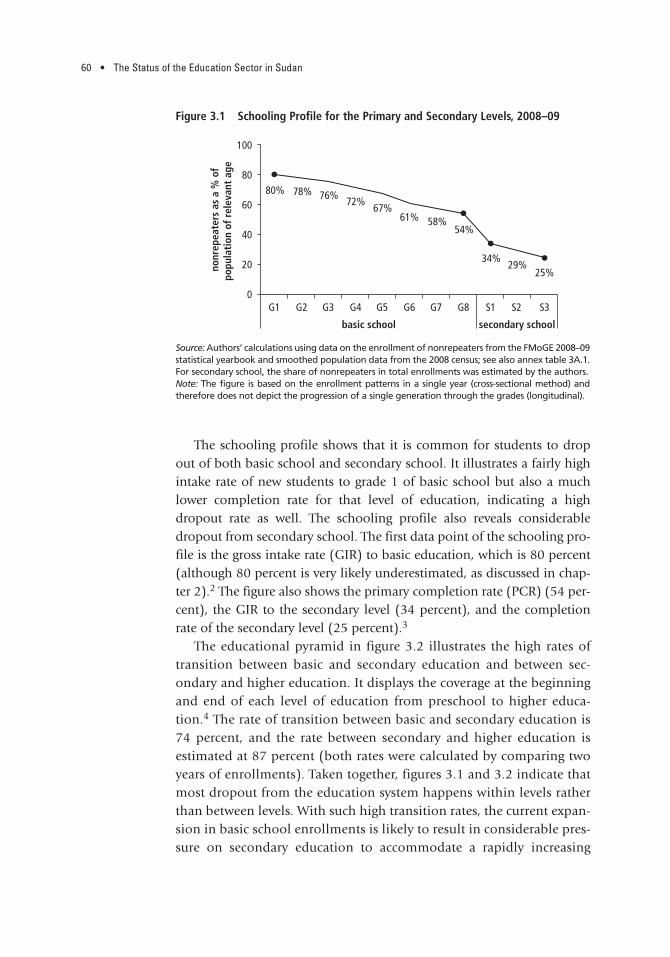
60 • The Status of the Education Sector in Sudan
The schooling profile shows that it is common for students to dropout of both basic school and secondary school. It illustrates a fairly highintake rate of new students to grade 1 of basic school but also a muchlower completion rate for that level of education, indicating a highdropout rate as well. The schooling profile also reveals considerabledropout from secondary school. The first data point of the schooling pro-file is the gross intake rate (GIR) to basic education, which is 80 percent(although 80 percent is very likely underestimated, as discussed in chap-ter 2).2 The figure also shows the primary completion rate (PCR) (54 per-cent), the GIR to the secondary level (34 percent), and the completionrate of the secondary level (25 percent).3
The educational pyramid in figure 3.2 illustrates the high rates oftransition between basic and secondary education and between sec-ondary and higher education. It displays the coverage at the beginningand end of each level of education from preschool to higher educa-tion.4 The rate of transition between basic and secondary education is74 percent, and the rate between secondary and higher education isestimated at 87 percent (both rates were calculated by comparing twoyears of enrollments). Taken together, figures 3.1 and 3.2 indicate thatmost dropout from the education system happens within levels ratherthan between levels. With such high transition rates, the current expan-sion in basic school enrollments is likely to result in considerable pres-sure on secondary education to accommodate a rapidly increasing
100
80
60
40
20
0G1 G2
80% 78%
nonr
epea
ters
as
a %
of
popu
lati
on o
f rel
evan
t ag
e
76% 72%67%
basic school secondary school
61% 58%54%
34%29%
25%
G3 G4 G5 G6 G7 G8 S1 S2 S3
Figure 3.1 Schooling Profile for the Primary and Secondary Levels, 2008–09
Source: Authors’ calculations using data on the enrollment of nonrepeaters from the FMoGE 2008–09statistical yearbook and smoothed population data from the 2008 census; see also annex table 3A.1.For secondary school, the share of nonrepeaters in total enrollments was estimated by the authors. Note: The figure is based on the enrollment patterns in a single year (cross-sectional method) andtherefore does not depict the progression of a single generation through the grades (longitudinal).

Patterns of Student Flow • 61
number of basic school graduates seeking to continue their studies.Whether the system is able to respond to this increased pressure willdetermine whether the transition rates remain at these high levels inthe years ahead.
INTAKE, COMPLETION, AND DISTANCE TO UNIVERSAL PRIMARY COMPLETION
Only about 54 percent of children attain the last grade of basic education.Table 3.1 summarizes the intake and completion rates for basic and sec-ondary education. A measure of access to grade 1, the basic education GIRis 80 percent. The PCR, 54 percent, measures the access to grade 8 of basicschool (not actual graduation or completion of the grade 8 year, simplyenrollment in the grade). Similarly for secondary education, the GIR to thesecondary level is 34 percent, and the completion rate is 25 percent. ThePCR is an important indicator of the share of children completing primary,or basic, education. The globally agreed-upon Millennium DevelopmentGoals call for a full course of schooling for all children. In most countries,this goal is interpreted as six years of primary schooling. Table 3.1 alsoshows the completion rate for the first six years of basic school in northernSudan, which is 61 percent or 7 percentage points higher than the PCR, butstill far from 100 percent. For a country to achieve a PCR of 100 percent,
22
higher transition rate 87%
transition rate 74%secondary
basic
preschool
20
18
theo
reti
cal a
ge (y
ears
)
16
14
12
10
8
6
4
2
00 20 40 60
% of relevant age group80 100
Figure 3.2 Educational Pyramid for Northern Sudan, 2008–09
Source: Authors’ construction using enrollment data from the FMoGE 2008–09 statistical yearbook andpopulation data from the 2008 census.Note: The pyramid is based on the enrollment patterns in a single year. The transition rates, however, arebased on comparing enrollments in two different years.
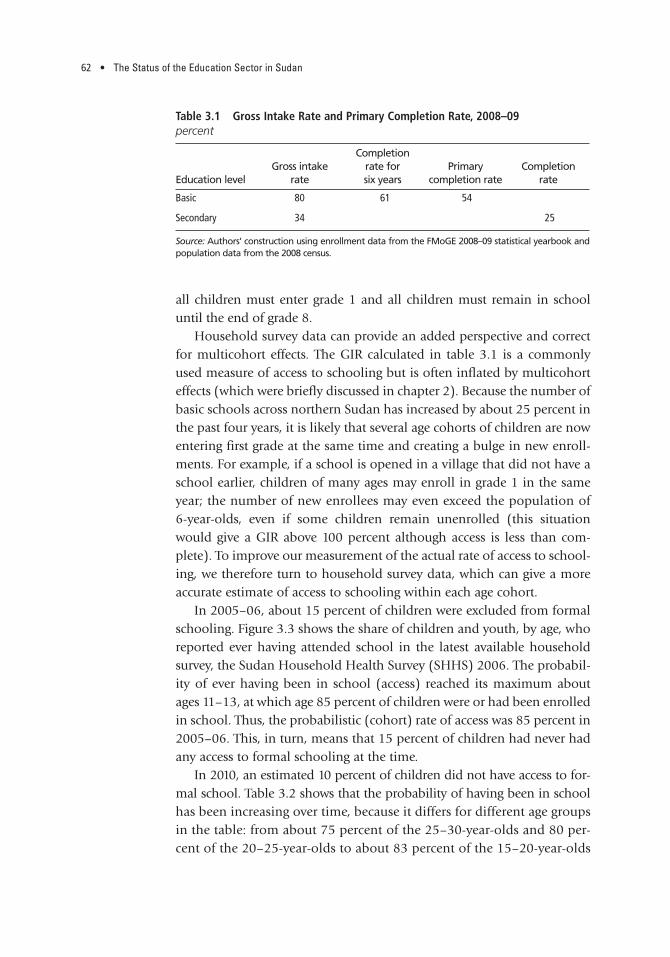
62 • The Status of the Education Sector in Sudan
all children must enter grade 1 and all children must remain in schooluntil the end of grade 8.
Household survey data can provide an added perspective and correctfor multicohort effects. The GIR calculated in table 3.1 is a commonlyused measure of access to schooling but is often inflated by multicohorteffects (which were briefly discussed in chapter 2). Because the number ofbasic schools across northern Sudan has increased by about 25 percent inthe past four years, it is likely that several age cohorts of children are nowentering first grade at the same time and creating a bulge in new enroll-ments. For example, if a school is opened in a village that did not have aschool earlier, children of many ages may enroll in grade 1 in the sameyear; the number of new enrollees may even exceed the population of6-year-olds, even if some children remain unenrolled (this situationwould give a GIR above 100 percent although access is less than com-plete). To improve our measurement of the actual rate of access to school-ing, we therefore turn to household survey data, which can give a moreaccurate estimate of access to schooling within each age cohort.
In 2005–06, about 15 percent of children were excluded from formalschooling. Figure 3.3 shows the share of children and youth, by age, whoreported ever having attended school in the latest available householdsurvey, the Sudan Household Health Survey (SHHS) 2006. The probabil-ity of ever having been in school (access) reached its maximum aboutages 11–13, at which age 85 percent of children were or had been enrolledin school. Thus, the probabilistic (cohort) rate of access was 85 percent in2005–06. This, in turn, means that 15 percent of children had never hadany access to formal schooling at the time.
In 2010, an estimated 10 percent of children did not have access to for-mal school. Table 3.2 shows that the probability of having been in schoolhas been increasing over time, because it differs for different age groupsin the table: from about 75 percent of the 25–30-year-olds and 80 per-cent of the 20–25-year-olds to about 83 percent of the 15–20-year-olds
Table 3.1 Gross Intake Rate and Primary Completion Rate, 2008–09percent
Education levelGross intake
rate
Completionrate for six years
Primary completion rate
Completionrate
Basic 80 61 54
Secondary 34 25
Source: Authors’ construction using enrollment data from the FMoGE 2008–09 statistical yearbook andpopulation data from the 2008 census.

Patterns of Student Flow • 63
and 85 percent of the 10–15-year-olds. This finding means that the cohortaccess rate has been improving at a rate of between 0.5 and 1 percentagepoint per year over the past 20 years. It is therefore reasonable to expect avalue of about 90 percent for a 10-year-old in 2010, which would mean that10 percent of children did not receive formal schooling at that time.
The GIR is underestimated in northern Sudan. Table 3.2 compares thecohort measure of access to grade 1 and attainment of grade 8 based onhousehold survey data with the corresponding measures calculated fromyearbook enrollment data for the same year. The two measures of com-pletion of the basic education level are almost identical, at 46 percent and47 percent, respectively. Surprisingly, the GIR, which was only 79 percentin 2005–06, is actually lower than the cohort measure of access, 85 per-cent (in most countries, the GIR is much higher than the cohort accessrate because of multicohort effects). This finding means that the actual
100
80
60
perc
ent
40
20
05 6 7 8 9 10 11 12 13 14 15 16 17
age (years)18 19 20 21 22 23 24 25 26 27 28 29
Figure 3.3 Access to Grade 1: Share of Population between Ages 5 and 29 WhoHad Ever Accessed Basic School, 2005–06
Source: Authors’ analysis of the 2006 Sudan Household Health Survey (GoNU and GoSS 2006).
Table 3.2 Basic School Intake and Completion Rates Based on Two Data Sources, 2005–06percent
Household survey dataa Administrative datab
Cohort access to grade 1c
Cohort attainment ofgrade 8d
Gross intake rate
Primary completion rate
85 46 79 47
Source: Cohort measures are based on the authors’ analysis of the 2006 Sudan Household Health Survey (GoNU and GoSS 2006).The gross intake rate and primary completion rate were calculated based on enrollment data from the FMoGE statisticalyearbook for the year indicated and population data shown in annex table 1A.1 in chapter 1. a. Data are cohort measures for 2005–06.b. Data are cross-sectional measures for the 2005–06 school year.c. Share of respondents ages 11–13 who report having ever attended basic education.d. This figure is based on the responses of children ages 15–19.
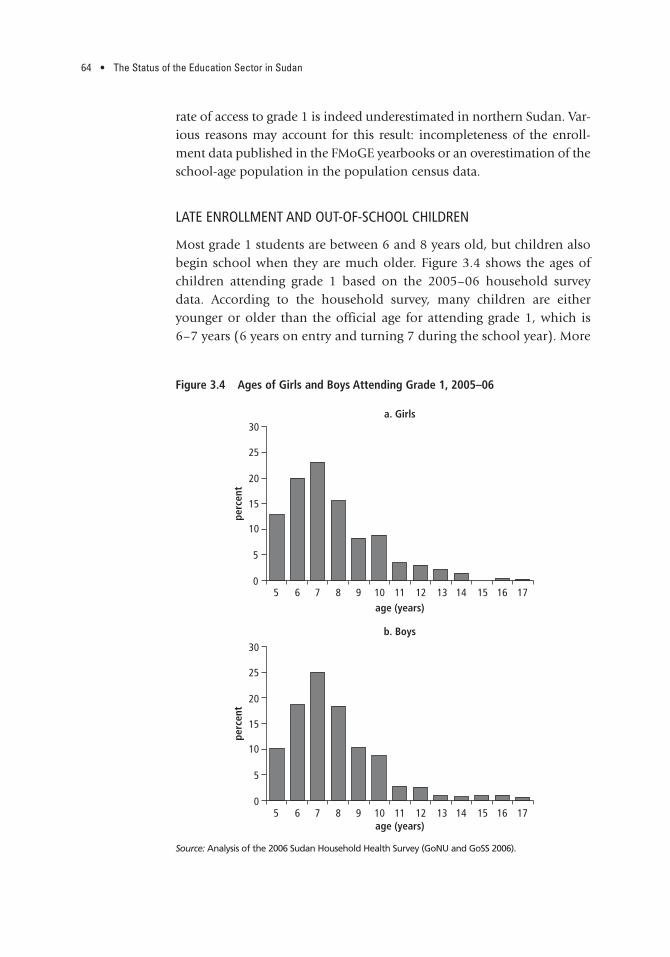
64 • The Status of the Education Sector in Sudan
rate of access to grade 1 is indeed underestimated in northern Sudan. Var-ious reasons may account for this result: incompleteness of the enroll-ment data published in the FMoGE yearbooks or an overestimation of theschool-age population in the population census data.
LATE ENROLLMENT AND OUT-OF-SCHOOL CHILDREN
Most grade 1 students are between 6 and 8 years old, but children alsobegin school when they are much older. Figure 3.4 shows the ages ofchildren attending grade 1 based on the 2005–06 household surveydata. According to the household survey, many children are eitheryounger or older than the official age for attending grade 1, which is6–7 years (6 years on entry and turning 7 during the school year). More
30a. Girls
b. Boys
perc
ent
perc
ent
25
20
15
10
5
0
30
25
20
15
10
5
0
5 6 7 8 9 10 11age (years)
age (years)
12 13 14 15 16 17
5 6 7 8 9 10 11 12 13 14 15 16 17
Figure 3.4 Ages of Girls and Boys Attending Grade 1, 2005–06
Source: Analysis of the 2006 Sudan Household Health Survey (GoNU and GoSS 2006).

Patterns of Student Flow • 65
than 10 percent were only 5 years old, whereas more than 40 percent were8 years or older. Girls tend to be a little younger than boys when attend-ing grade 1, but the difference is not very large. Once they are 15, girls nolonger enroll in first grade, whereas some boys enroll even at 16 and 17.This pattern may start to change, however, once the expansion of access toschooling is complete. Based on experience from other countries, once allchildren have access to a school in their village or neighborhood, theytend to enroll closer to the correct age.
With so many children entering school late, the age-based net intakerate and net enrollment rate are not good measures of access and cover-age in Sudan.5,6 The net intake rate, which is calculated as the number ofnew entrants in grade 1 who are age 6 divided by the age 6 population,would clearly underestimate the extent of access to schooling in Sudan.
In the 8–15 age group, an estimated 30 percent of girls and 22 percentof boys were out of school in 2005–06. Figure 3.5 presents the schoolingstatus, by age and gender, of all individuals between the ages of 5 and24 years at a given time (2005–06, when the SHHS was conducted). Inparticular, it shows the proportion of each age group that is enrolled ineducation (any level) and, inversely, the proportion of each age groupthat is out of school. There are clearly many more girls than boys not inschool. For both girls and boys, school participation peaks at age 11, at78 percent for girls and 84 percent for boys. This finding, however, meansthat 22 percent of 11-year-old girls and 16 percent of 11-year-olds boys arenot in school (any level). For other ages, this proportion is higher. On thewhole, 30 percent of girls and 22 percent of boys would be considered outof school.7 The chart also distinguishes between two groups of out-of-school children: (a) those who have never attended school and (b) thosewho have attended school in the past. This distinction is importantbecause these two groups may need different types of support to enrolland remain in school.
The pattern of late enrollment is prevalent throughout the educationsystem, particularly for boys.
Figure 3.6 focuses on the children and youth who are enrolled and dis-tinguishes between the levels of education in which they are enrolled. Asdiscussed earlier, it is clear that many children access basic school at a rel-atively late age. This is also the case for secondary school. Interestingly,secondary school enrollment peaks at age 17 for girls (32 percent of theage group) and age 19 for boys (30 percent of the age group), and girlstend to be a little younger than boys in higher education. Thus, the agegap between girls and boys that starts in basic school persists throughsecondary and into higher education.
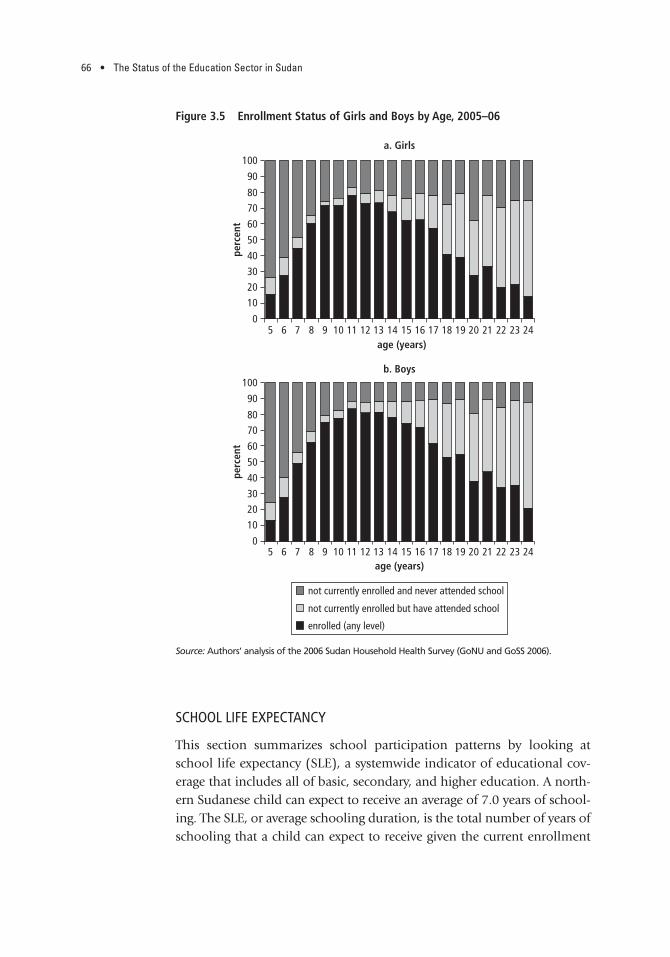
66 • The Status of the Education Sector in Sudan
SCHOOL LIFE EXPECTANCY
This section summarizes school participation patterns by looking atschool life expectancy (SLE), a systemwide indicator of educational cov-erage that includes all of basic, secondary, and higher education. A north-ern Sudanese child can expect to receive an average of 7.0 years of school-ing. The SLE, or average schooling duration, is the total number of years ofschooling that a child can expect to receive given the current enrollment
100a. Girls
b. Boys
90
8070
60
50
40
302010
perc
ent
perc
ent
05 6 7 8 9 10 11 12 13 14 15 16 17 18 19 20
age (years)21 22 23 24
5 6 7 8 9 10 11 12 13 14 15 16 17 18 19 20age (years)
21 22 23 24
100
90
8070
60
50
40
302010
0
not currently enrolled and never attended school
not currently enrolled but have attended school
enrolled (any level)
Figure 3.5 Enrollment Status of Girls and Boys by Age, 2005–06
Source: Authors’ analysis of the 2006 Sudan Household Health Survey (GoNU and GoSS 2006).
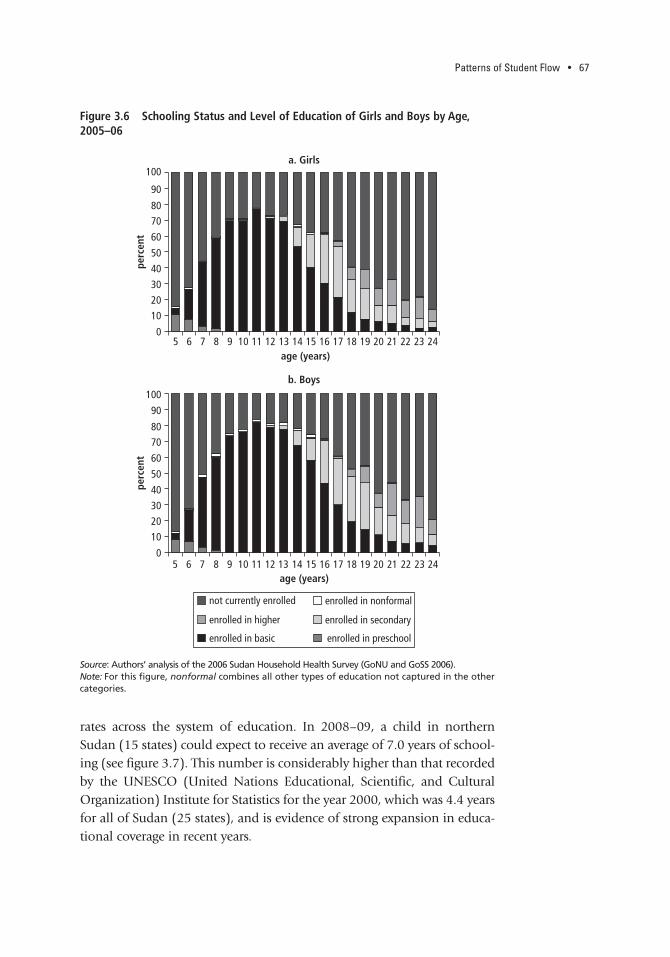
Patterns of Student Flow • 67
rates across the system of education. In 2008–09, a child in northernSudan (15 states) could expect to receive an average of 7.0 years of school-ing (see figure 3.7). This number is considerably higher than that recordedby the UNESCO (United Nations Educational, Scientific, and CulturalOrganization) Institute for Statistics for the year 2000, which was 4.4 yearsfor all of Sudan (25 states), and is evidence of strong expansion in educa-tional coverage in recent years.
a. Girls
b. Boys
90
100
8070
60
50
40
302010
perc
ent
perc
ent
05 6 7 8 9 10 11 12 13 14 15 16 17 18 19 20
age (years)21 22 23 24
5 6 7 8 9 10 11 12 13 14 15 16 17 18 19 20age (years)
21 22 23 24
100
90
8070
60
50
40
302010
0
not currently enrolled enrolled in nonformal
enrolled in higher enrolled in secondary
enrolled in basic enrolled in preschool
Figure 3.6 Schooling Status and Level of Education of Girls and Boys by Age,2005–06
Source: Authors’ analysis of the 2006 Sudan Household Health Survey (GoNU and GoSS 2006). Note: For this figure, nonformal combines all other types of education not captured in the othercategories.

68 • The Status of the Education Sector in Sudan
Figure 3.7 also compares the Sudan’s SLE with that of a number ofcountries in Sub-Saharan Africa and the Middle East and North Africa. Itis evident that despite recent progress, northern Sudan’s SLE is still lowfrom an international perspective. For example, the indicator is about10 years in several neighboring or comparator countries (Arab Republic ofEgypt, Kenya, Morocco, and Uganda). The gap with comparator countries,however, may partly be explained by the fact that some of the enrollmentindicators—and therefore also the SLE—for northern Sudan appear to besomewhat underestimated, as discussed earlier.
OTHER ASPECTS OF STUDENT FLOW EFFICIENCY AND PROJECTIONS
REPETITION
Repetition in basic schools was fairly low in 2008–09. Three sources ofinformation on repetition in basic schools are compared in Table 3.3.The FMoGE’s administrative data (statistical yearbooks) suggest that theshare of repeaters is between 4 percent and 7 percent—a fairly low level
18
5
910
11 11
13 13 1314
15
17
6 67
8 89
country
10 10 10
4
7
16
14
12
year
s 10
8
6
4
2
0
Djibou
ti
Yemen
, Rep
.
Morocco
Egyp
t, Arab
Rep.
United
Arab Em
irates
Algeria
Jorda
n
Saud
i Arab
ia
Leba
non
Tunis
iaLib
yaEri
treaCha
d
Centra
l Afric
an Rep
ublic
Congo
, Dem
. Rep
.
Ethiop
ia
Congo
, Rep
.Ke
nya
Camero
on
Ugand
a
Suda
n (all
) 200
0
Suda
n (no
rthern
) 200
8
Figure 3.7 School Life Expectancy in Sudan and Comparator Countries, LatestAvailable Year
Source: Authors’ calculations for northern Sudan; UNESCO Institute for Statistics database (various years)for all other countries.Note: Latest year available is as of 2011.
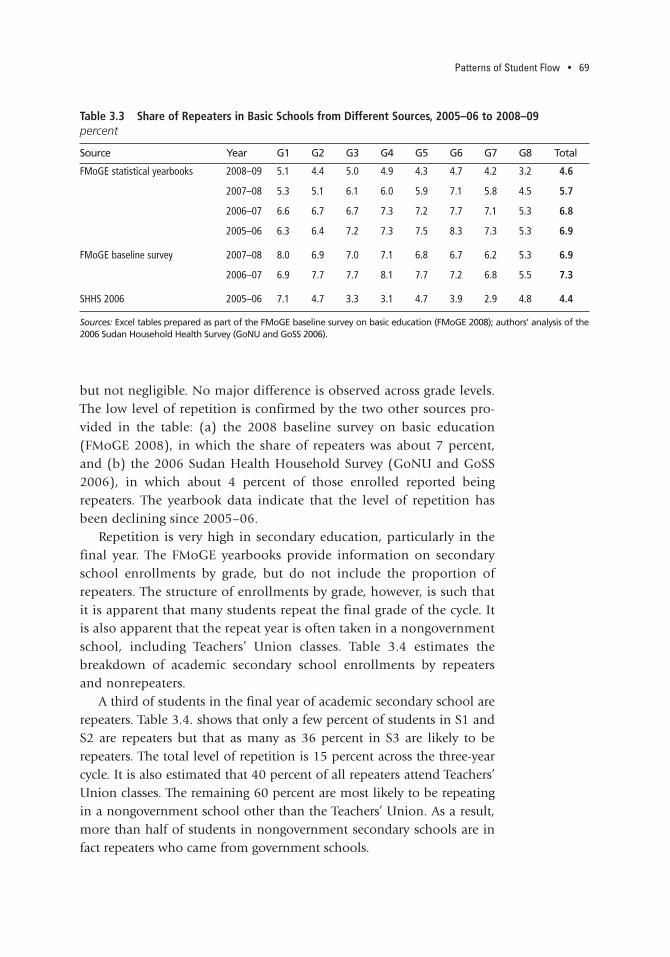
Patterns of Student Flow • 69
but not negligible. No major difference is observed across grade levels.The low level of repetition is confirmed by the two other sources pro-vided in the table: (a) the 2008 baseline survey on basic education(FMoGE 2008), in which the share of repeaters was about 7 percent,and (b) the 2006 Sudan Health Household Survey (GoNU and GoSS2006), in which about 4 percent of those enrolled reported beingrepeaters. The yearbook data indicate that the level of repetition hasbeen declining since 2005–06.
Repetition is very high in secondary education, particularly in thefinal year. The FMoGE yearbooks provide information on secondaryschool enrollments by grade, but do not include the proportion ofrepeaters. The structure of enrollments by grade, however, is such thatit is apparent that many students repeat the final grade of the cycle. Itis also apparent that the repeat year is often taken in a nongovernmentschool, including Teachers’ Union classes. Table 3.4 estimates thebreakdown of academic secondary school enrollments by repeatersand nonrepeaters.
A third of students in the final year of academic secondary school arerepeaters. Table 3.4. shows that only a few percent of students in S1 andS2 are repeaters but that as many as 36 percent in S3 are likely to berepeaters. The total level of repetition is 15 percent across the three-yearcycle. It is also estimated that 40 percent of all repeaters attend Teachers’Union classes. The remaining 60 percent are most likely to be repeatingin a nongovernment school other than the Teachers’ Union. As a result,more than half of students in nongovernment secondary schools are infact repeaters who came from government schools.
Table 3.3 Share of Repeaters in Basic Schools from Different Sources, 2005–06 to 2008–09percent
Source Year G1 G2 G3 G4 G5 G6 G7 G8 Total
FMoGE statistical yearbooks 2008–09 5.1 4.4 5.0 4.9 4.3 4.7 4.2 3.2 4.6
2007–08 5.3 5.1 6.1 6.0 5.9 7.1 5.8 4.5 5.7
2006–07 6.6 6.7 6.7 7.3 7.2 7.7 7.1 5.3 6.8
2005–06 6.3 6.4 7.2 7.3 7.5 8.3 7.3 5.3 6.9
FMoGE baseline survey 2007–08 8.0 6.9 7.0 7.1 6.8 6.7 6.2 5.3 6.9
2006–07 6.9 7.7 7.7 8.1 7.7 7.2 6.8 5.5 7.3
SHHS 2006 2005–06 7.1 4.7 3.3 3.1 4.7 3.9 2.9 4.8 4.4
Sources: Excel tables prepared as part of the FMoGE baseline survey on basic education (FMoGE 2008); authors’ analysis of the2006 Sudan Household Health Survey (GoNU and GoSS 2006).

70 • The Status of the Education Sector in Sudan
Repetition in technical secondary schools appears to be low. Theseschools have a very different pattern of student flow. This pattern does notindicate the presence of a high rate of repetition but rather a high numberof dropouts, because S3 enrollments are less than half of S1 enrollments.
From a comparative perspective, northern Sudan has a low level ofrepetition in basic schools but a high level of repetition in secondaryschools. When compared to selected countries in Sub-Saharan Africa andthe Middle East and North Africa (figure 3.8), the level of repetition inbasic schools in northern Sudan is similar to the levels in countries suchas Egypt, Mauritius, Botswana, and the Republic of Yemen but signifi-cantly lower than the levels found in Djibouti, Morocco, Swaziland, andNamibia. For secondary education, however, northern Sudan is amongthe countries in the selected group with the highest rate of repetition.
In basic education, we are concerned with repetition because it is acostly practice that does not usually provide substantial benefits. Chil-dren who repeat grades are at risk of dropping out of school entirely,and if they stay in school, generally do not benefit much from theadditional year of schooling. To lower repetition rates, some Sub-Saharan African countries have been successful in putting into practiceautomatic promotion between grades. In secondary school, if repeti-tion occurs in the final year to improve the result on the final exam,as is the case in northern Sudan, and the cost of repeating is borne bythe parents, then the issues are different. There may be governanceissues if public school teachers earn an additional salary from teach-ing private shifts of repeaters and are then more frequently absent,tired, or unprepared during their regular shifts. Also, this system maynot be satisfactory to students; and there could be equity issues if notall students who need it can pay for the extra year.
Table 3.4 Estimation of Repetition in Government and Nongovernment Academic SecondarySchools, 2008–09
Grade Nonrepeaters Repeaters Nonrepeaters Repeaters
Total share ofrepeaters insecondary
enrollments(percent)
Share of allrepeaters who
attend Teachers’Union classes
(percent)
S1 214,709 4,382 24,062 491 2 n.a.
S2 175,799 3,588 23,581 3,718 4 n.a.
S3 140,798 1,422 23,109 91,995 36 n.a.
Total 531,306 9,392 70,752 96,204 15 40
Source: Authors’ construction based on data from the FMoGE 2008–09 statistical yearbook and the database of secondary schoolsfrom Khartoum State that includes information on enrollments and repeaters. Note: n.a. = not applicable.
NongovernmentGovernment

Patterns of Student Flow • 71
RETENTION
Retention to grade 8 of basic education was only about 57 percent in2008–09. Table 3.5 shows the evolution in the gross intake and pri-mary completion rates from 2000–01 to 2008–09 in basic education,and calculates a simple measure of retention by dividing the PCR bythe GIR each year (transversal method). The transversal retention rateoscillated between a high of about 70 percent and a low of 53 percentin 2007–08. These large fluctuations are, in part, evidence of weak-nesses in the educational statistics.
25a. Primary
b. Secondary
1% 2% 3%6%
8%11%
12%
country
country
4% 5%8%
18%18%
7%5%
20
perc
ent
perc
ent
15
10
5
0
25
20
15
10
51%
5%7%
6%
13%
6%
16%
12%
1%
14%
8% 9%
15%
0
Jorda
n
United
Arab Em
irates
Egyp
t, Arab
Rep.
Yemen
, Rep
.
Algeria
Djibou
ti
Morocco
Mauriti
us
Botswan
a
South
Africa
Swaz
iland
Namibi
a
north
ern Su
dan 2
005
north
ern Su
dan 2
008
Jorda
n
United
Arab Em
irates
Egyp
t, Arab
Rep.
Yemen
, Rep
.
Algeria
Djibou
ti
Morocco
Mauriti
us
Botswan
a
South
Africa
Swaz
iland
Namibi
a
north
ern Su
dan 2
005
north
ern Su
dan 2
008
Figure 3.8 International Comparison of the Share of Repeaters in Primary and Secondary Schools, Latest Available Year
Source: UNESCO Institute for Statistics database for all countries other than Sudan.Note: Latest year available is as of 2011.

Table 3.5 Retention and Other Indicators for Basic and Secondary Education, 2000–01 to 2008–09
Education level 2000–01 2001–02 2002–03 2003–04 2004–05 2005–06 2006–07 2007–08 2008–09
Basic
GIR 66 68 — 66 67 79 80 88 80
PCR 49 46 — 46 49 47 44 46 54
Retention (transversal) 73 68 — 69 73 59 54 53 68
Retention (longitudinal) 57
Secondary
GIR 29 30 31 34
CR 21 21 22 25
Retention (transversal) 72 71 72 72
Retention (longitudinal) 74
Source: FMoGE statistical yearbooks for the years indicated and authors’ calculations. Note: The transversal retention rate is based on a single year and calculated as PCR/GIR. The longitudinal retention rate is calculated by dividing nonrepeaters in grade 8 in 2007–08 bynonrepeaters in grade 1 in 2000–01. CR = completion rate; GIR = gross intake rate; PCR = primary completion rate; — = not available.
72

Patterns of Student Flow • 73
Table 3.5 also provides a longitudinal retention rate by following thecohort that enrolled in grade 1 in 2000–01 until they reached grade 8 in2007–08. This retention rate is 57 percent, so it is within the range indi-cated by the transversal retention rate. A retention rate of 57 percent indi-cates that only 57 of every 100 students who enroll in grade 1 are still inschool by grade 8. This means that the probability of dropping out beforegrade 8 is about 43 percent, indicating a dropout rate of 6 percent pergrade for grades 1–7. Student dropout is therefore a serious concern inbasic education.
Students are at risk of dropping out of school when parents andstudents do not perceive that additional schooling is worth the invest-ment of time and money—when the costs of schooling exceed theexpected benefits. A high rate of dropout could indicate that studentsare not learning enough, that is, that the quality of schooling is sim-ply too low to justify students’ time and the direct cost in terms ofparental contributions. Other factors can also put children at risk ofdropping out of schools. For example, when schools do not offer allthe grades of the basic cycle and children have to change schools toreach the higher grades, thereby likely increasing their travel time toschool, there is an increased risk of dropout. More research is neededto understand the main causes and risk factors for dropout in north-ern Sudan so that appropriate measures to improve retention can beput into place.
Retention is lower in secondary than in basic education when adjustedfor the length of the cycles. Similarly, Table 3.5 presents the transversalretention rate for secondary education, 72 percent, and the longitudinalretention rate, 74 percent. A retention rate of 74 percent means that 26percent of those who enrolled in the first year have dropped out beforereaching the final year, corresponding to a dropout rate of 13 percent peryear in the first two years of the secondary cycle. Thus, retention appearsto be very low in secondary education, and dropout is a very serious issue.It should be noted, however, that these results assume that the enrollmentdata in the yearbooks are correct, but the analysis indicates even moreweaknesses in the secondary school enrollment data than in the basicschool data.8
INTERNAL EFFICIENCY COEFFICIENT
Table 3.6 calculates an index of the internal efficiency in basic and secondary education. As a function of the pattern of repetition anddropout, the index measures the efficiency of the system in terms of

74 • The Status of the Education Sector in Sudan
producing completers using as few inputs, or student years, as possible.This efficiency is calculated by comparing the number of student yearsit actually takes to produce one completer as a result of dropout andrepetition patterns to the number of student years needed if there wereno dropout or repetition (eight years for basic and three for second-ary). An education system with no dropout and no repetition wouldhave a coefficient of 100 percent.
It took 10.5 student years to produce a basic school completer and4.2 student years to produce a secondary school completer in2008–09. In basic education, the internal efficiency coefficient (IEC)was 76 percent in 2008–09; and, on average, it took 10.5 studentyears, instead of 8, to produce one completer. An IEC of 76 percentimplies that 23 percent of the inputs, or student years, are used on stu-dents who do not complete the cycle. In secondary education, the IECwas 71 percent in 2008–09; and, on average, it took 4.2 student years,instead of 3, to produce a completer.
Compared with many Sub-Saharan African countries, the internalefficiency in basic education in northern Sudan is higher. Table 3.7compares the IEC for basic education with that statistic for selectedcountries in Sub-Saharan Africa and finds that northern Sudan is per-forming quite well, although not as well as Kenya and Tanzania. Thismostly positive result stems from the comparatively low rate of repeti-tion in northern Sudan. Still, there is room for improvement in bothdropout and repetition rates.
Table 3.6 Internal Efficiency Coefficients in Basic and Secondary Education,2005–06 to 2008–09
Education level 2005–06 2006–07 2007–08 2008–09
Basic
IEC (percent) 72 68 67 76
Student years to produce onecompleter
11.2 11.7 12.0 10.5
Secondary
IEC (percent) 76 74 74 71
Student years to produce onecompleter 3.9 4.1 4.1 4.2
Source: Authors’ calculations based on information about repetition and retention by grade from theFMoGE statistical yearbooks for the years indicated. Note: IEC = internal efficiency coefficient.

Patterns of Student Flow • 75
PROJECTION OF ACCESS AND COMPLETION RATES FOR BASIC EDUCATION
The GIR has grown fast since 2004–05, but the PCR has improved moreslowly. Table 3.8 presents the average rates of increase in the GIR and PCRfor basic education from 2000–01 to 2008–09. The GIR has grown at 1.7 percentage points per year, and the PCR, at 0.7 percentage point peryear. Focusing on 2004–05 to 2008–09, although both indicators increasedtheir pace of growth, the GIR has still been growing much faster (3.2 per-centage points per year) than the PCR (1.3 percentage points per year).
This pattern will most likely change in coming years. As northernSudan gets closer to universal access to basic education, the growth in theGIR will slow down. Further growth in this indicator is not possible onceall children are in school. However, as the many new students movethrough the grades of basic school and begin to reach the last grades,growth in the PCR is likely to pick up. Figure 3.9 illustrates what mighthappen in the coming years, based on a continuation of the recentimprovement trend. The figure uses the data in table 3.8 and depicts theevolution in the GIR and PCR over time. It shows a third indicator, thecohort access rate, which is our best estimate from table 3.8 of the actualextent of access to basic school It is constructed by moving the GIRupward to reach a value of 85 percent in 2005–06.
In an optimistic scenario, 80 percent of children could complete thebasic education cycle by 2015. As shown in figure 3.9, if the past trend
Table 3.7 International Comparison of Internal EfficiencyCoefficients in Basic Education
Country Year IEC
Tanzania 2006 0.85
Kenya 2005 0.83
Sudan (northern) 2008 0.76
Eritrea 2006 0.74
Ethiopia 2006 0.71
Uganda 2005 0.61
Central African Republic 2006 0.40
Chad 2005 0.35
Malawi 2006 0.35
Source: UNESCO Pôle de Dakar database for the years indicated.Note: IEC = internal efficiency coefficient.
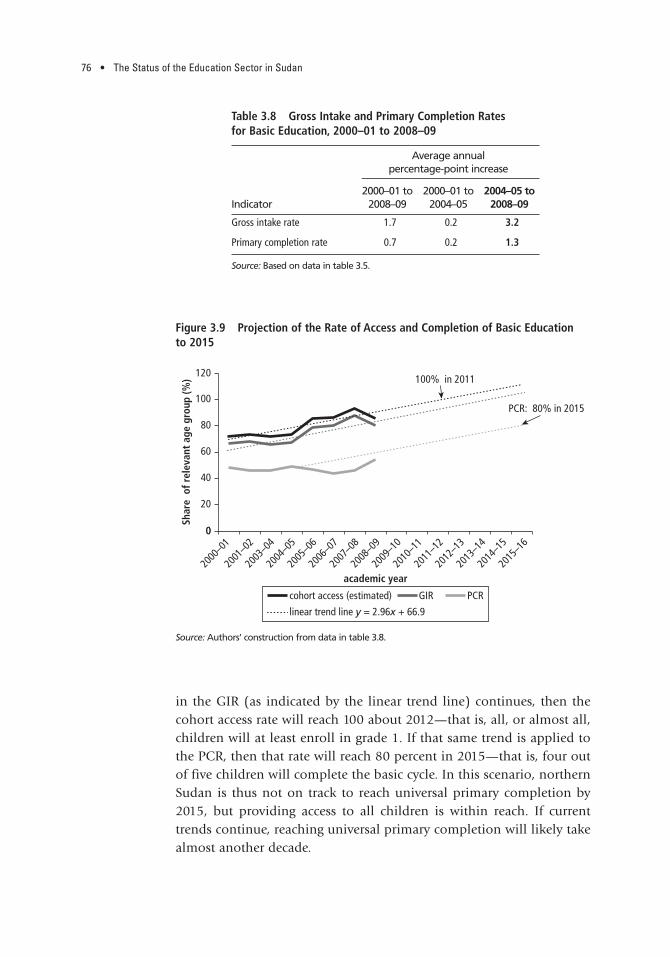
76 • The Status of the Education Sector in Sudan
in the GIR (as indicated by the linear trend line) continues, then thecohort access rate will reach 100 about 2012—that is, all, or almost all,children will at least enroll in grade 1. If that same trend is applied tothe PCR, then that rate will reach 80 percent in 2015—that is, four outof five children will complete the basic cycle. In this scenario, northernSudan is thus not on track to reach universal primary completion by2015, but providing access to all children is within reach. If currenttrends continue, reaching universal primary completion will likely takealmost another decade.
Table 3.8 Gross Intake and Primary Completion Rates for Basic Education, 2000–01 to 2008–09
Indicator
Average annual percentage-point increase
2000–01 to2008–09
2000–01 to2004–05
2004–05 to2008–09
Gross intake rate 1.7 0.2 3.2
Primary completion rate 0.7 0.2 1.3
Source: Based on data in table 3.5.
0
20
40
60
80
100
120
Shar
e o
f rel
evan
t ag
e gr
oup
(%) 100% in 2011
PCR: 80% in 2015
0
2000
–01
2001
–02
2003
–04
2004
–05
2005
–06
2006
–07
2007
–08
2008
–09
2009
–10
2010
–11
2011
–12
2012
–13
2013
–14
2014
–15
2015
–16
cohort access (estimated) GIR PCR
linear trend line y = 2.96x + 66.9
academic year
Figure 3.9 Projection of the Rate of Access and Completion of Basic Education to 2015
Source: Authors’ construction from data in table 3.8.

Patterns of Student Flow • 77
Despite reason for optimism, there is a risk that indicators will stag-nate. There is no guarantee, however, that the trends shown in figure 3.9can be accomplished in the years ahead. First, as shown in the figure, theGIR actually declined in 2008–09, the latest year.9 Second, figure 3.9shows that there has not been any improvement in boys’ access rate inmany years. This finding could indicate that there are populationgroups in northern Sudan who remain largely excluded from the edu-cation system. These groups could be hard to reach using traditionalmeasures such as merely making schools available, because this meas-ure has clearly not worked so far. Other measures may be needed, suchas adjusting schools better to the needs of the population groups or pro-viding more incentives to increase their demand for schooling.
SUMMARY
The analysis of student flow patterns in northern Sudan resulted in thefollowing findings:
• According to our best estimate, about 90 percent of children cur-rently access grade 1 of basic education (2010 estimate). However,many of them enter school early or late: more than 10 percent wereonly 5 years old, whereas more than 40 percent were 8 years orolder.
• On average, a child can expect 7.0 years of basic schooling. Despiterecent growth in school life expectancy, northern Sudan is behindmany comparator countries with regard to this indicator. Also,given that the basic cycle is eight years, a school life expectancy ofonly 7 years is clearly insufficient.
• There is a fairly low level of repetition in basic schools—only about4–5 percent—but 36 percent of students repeat the final year of secondary school.
• There is considerable student dropout from the basic and secondaryeducation cycles. Dropping out from a cycle before obtaining adiploma or certificate seems to be the most common way of exitingthe education system. As a result, in the 8–15 age group, an estimated30 percent of girls and 22 percent of boys were out of school in2005–06.
• Also, as a result of repetition and dropout patterns, an input of 10.5student years (instead of 8) is required to produce one basic schoolcompleter and 4.2 student years (instead of 3) is required to producea secondary school completer.

78 • The Status of the Education Sector in Sudan
• Transition rates between the cycles are very high: about 74 percent ofbasic school completers continue on to secondary education, andabout 87 percent of secondary school completers continue on tohigher education. Thus, relatively few students complete a cycle with-out continuing on to the next cycle.
• In 2008–09, only about 54 percent of children completed the basiccycle (61 percent completed the first six years). In an optimistic sce-nario, if recent years’ strong pace of improvement in basic schoolenrollments continues, almost all children may access at least grade 1by about 2012, and 80 percent of children may complete basic schoolby 2015. There are risks, however, and accomplishing these resultswill require sustained efforts to continue improvements in basicschool access and retention.
ANNEX: BASIC AND SECONDARY EDUCATION ENROLLMENTS
Table 3A.1 Enrollments by Grade in Basic and Secondary Education, Northern Sudan, 2008–09
GradeSchool-agepopulation Enrollment
Repeaters(estimated)
Nonrepeaters(estimated)
Schooling profile/accessa
(percent)Retention
within cycle
G1 934,516 785,777 39,196 746,581 80 100
G2 905,574 736,540 31,107 705,433 78 98
G3 881,916 701,368 33,745 667,623 76 95
G4 857,918 645,384 30,561 614,823 72 90
G5 833,680 584,953 24,764 560,189 67 84
G6 809,303 516,718 23,712 493,006 61 76
G7 784,884 474,225 19,422 454,803 58 73
G8 760,525 425,499 13,359 412,140 54 68
All basic 6,768,317 4,870,464 215,866 4,654,598 n.a. n.a.
S1 736,325 255,939 5,119 250,820 34 100
S2 712,384 217,286 7,518 209,768 29 86
S3 688,801 263,084 93,475 169,609 25 72
All secondary 2,137,510 736,309 106,112 630,197 n.a. n.a.
Source: FMoGE 2008–09 statistical yearbook. Note: n.a. = not applicable.a. Rate was determined by enrollment excluding repeaters divided by the population of relevant ages for that grade.

Patterns of Student Flow • 79
NOTES 1. The main sources of data are the yearbooks of educational statistics pre-
pared by the federal Ministry of General Education (FMoGE) and when indicated,the 2006 Sudan Health Household Survey (SHHS) (GoNU and GoSS 2006).
2. The gross intake rate is calculated as the nonrepeaters in grade 1 divided bythe age 6 population.
3. The primary completion rate is calculated as the nonrepeaters in grade8 divided by the age 13 population.
4. Preschool and higher education are shown as rectangular shapes becausewe have no information on their intake and completion rates, only their totalenrollments.
5. The net intake rate is calculated as the nonrepeaters in grade 1 who are age6 divided by the age 6 population.
6. The net enrollment rate is calculated as the enrollment of 6–13-year-olds inbasic school divided by the population of 6–13-year-olds.
7. These data are based on 8–15-year-olds, which is the eight-year-long cohortwith the highest rate of school participation; an eight-year cohort was chosenbecause the basic education cycle is eight years.
8. In particular, as discussed in chapter 2, the fact that secondary schoolenrollments increased little from 2004 to 2009, even though the number ofschools grew by 50 percent, suggests a problem with the enrollment data.
9. In 2007–08, there was a government campaign informing parents of theimportance of sending their children to school, and grade 1 enrollmentsincreased. The following year, there was no campaign, and grade 1 enrollmentsdecreased.
REFERENCES FMoGE (Federal Ministry of General Education). 2008. “Baseline Survey on
Basic Education in the Northern States of Sudan: Final Report June 2008.”Khartoum. Online document available at http://planipolis.iiep.unesco.org/epiweb/E029336e.pdf
———. Various years. “Statistical Yearbooks.” Khartoum.GoNU (Government of National Unity) and GoSS (Government of Southern
Sudan). 2006. Sudan Household Health Survey (SHHS) 2006. Khartoum/Juba:Central Bureau of Statistics and Southern Sudan Center for Census, Statisticsand Evaluation.

81
CHAPTER
Disparities
This chapter investigates three types of disparities in the rates ofschooling across the 15 states of northern Sudan. It first examinesregional disparities in the indicators of school enrollment and then
turns to various social disparities. Finally, the chapter looks into theextent of structural disparities in the distribution of public spending oneducation across individuals of the same generation. Wherever relevant,the extent of the disparities in school participation in northern Sudan isplaced in an international comparative context.
REGIONAL DISPARITIES
GROSS ENROLLMENT RATE
Because general education is managed by the states, the analysis ofregional disparities necessarily involves examining the disparities acrossall 15. We start by comparing the gross enrollment rates (GERs) of pre-school, basic, and secondary education, as shown in table 4.1.1
There are large disparities in the GER across states at all three levels ofeducation. The GER spans 13–65 percent for preschool, 65–94 percent forbasic school, and 15–61 percent for secondary school.2 The wide bands inthese ranges, particularly the one for basic school—which is supposed to befree and compulsory and therefore should not have such a large variation—indicates that some states have quite advanced education systems and others are far behind in terms of even enrolling children in basic school.
However, there are also considerable inconsistencies in the data. Asmentioned in chapter 2, the basic school GER based on yearbook datais low compared with the same indicator based on the 2006 SudanHousehold Health Survey. Not surprisingly, this is also the case when
4

82 • The Status of the Education Sector in Sudan
Table 4.1 Comparison of GERs in Preschool, Basic, and Secondary Schools across States, 2008–09percent
Enrollmentlevel
Preschool BasicSecondary
(academic and technical)
Gross enrollment
rate
Averageannual
percentage-point changesince 2005–06
Grossenrollment
rate
Averageannual
percentage-point changesince 2005–06
Grossenrollment
rate
Average annual percentage-point
change since2005–06
High
Khartoum 43 1 94 5 61 7
River Nile 65 6 89 –1 7 1
Al Jazirah 44 3 90 0 57 3
Northern 64 4 85 –3 50 2
White Nile 43 5 85 5 37 1
5-state average 52 4 89 1 50 3
Medium
South Kordofan 52 9 82 2 32 3
Western Darfur 26 5 88 2 25 3
Sinnar 13 0 80 3 31 1
North Kordofan 23 — 78 4 23 0
Al Qadarif 36 6 70 3 31 1
5-state average 30 5 80 3 28 2
Low
Northern Darfur 32 4 67 4 21 –2
Red Sea 64 — — 1 17 –1
Blue Nile 20 0 65 4 20 1
Southern Darfur 38 8 — 1 17 –1
Kassala 17 0 — –2 15 0
5-state average 34 3 66 2 18 0
15-state average 37 4 72 2 34 2
Source: Authors’ construction based on enrollment data from the FMoGE statistical yearbooks from 2005–06 to 2008–09.Note: The states are listed in order of their weighted average GERs across the three education levels using the cycle lengths asweights (two, eight, and three years, respectively, for preschool, basic school, and secondary school). — = not available.
comparing the same two statistics by state, but the discrepancy betweenthe two sources of data is much larger for some states than for others.For Kassala, Red Sea, and Southern Darfur states, in particular, the dis-crepancies are so large that we cannot easily reconcile the numbers;therefore, they are not shown in table 4.1, although the table does

Disparities • 83
place these three states among those with comparatively low schoolenrollment.3
Khartoum State has the highest GER overall, as shown in table 4.1.When the states are ordered in terms of their average GERs across thethree levels of general education, Khartoum State is at the top of thelist. It has very strong GERs in preschool (43 percent), basic school(94 percent), and secondary school (61 percent). The five states withthe highest levels of school enrollment—Khartoum, River Nile, AlJazirah, Northern, and White Nile—are, not surprisingly, the stateswith the highest levels of economic development in northern Sudan.The five states with the lowest levels of school enrollment—NorthernDarfur, Red Sea, Blue Nile, Southern Darfur, and Kassala—were allaffected by conflict and presumably have a ways to go to “catch up”with the other states.
States with low GERs are falling even further behind. Table 4.1 alsoprovides the average percentage-point increase in the GER across thethree levels of education between 2005 and 2009. On average across all15 states, the GER increased by 2 percentage points per year in both basicand secondary schools (and 4 percentage points per year in preschool). Inthe five states with low GERs, however, the basic school GER grew by 2percentage points per year, but the secondary school GER did not increaseover the three years. This finding suggests on the one hand, that thesestates prioritize expanding basic schooling coverage at this moment intime, which is appropriate given their low coverage, but on the otherhand, that their overall coverage of schooling is growing slower than otherstates’ coverage. These states may need additional assistance to increasethe pace of growth in school enrollments, as detailed in chapter 7, oneducation finance.
The higher the basic school GER is, the faster the growth in the sec-ondary school GER. The GERs are generally growing fast in the groupsdesignated high and medium in table 4.1. In the intermediate-GERgroup, coverage is expanding rapidly in both basic schools (3 percentagepoints per year) and secondary schools (2 percentage points per year). Inthe high-GER group, coverage in basic schools is expanding at a slower pace(1 percentage point per year) than in secondary schools (3 percentagepoints per year) for an obvious reason: these states are closer to full basiceducation coverage.
ACCESS TO GRADE 1 OF BASIC SCHOOL
Household surveys provide another source of data on the regional dis-parities in school enrollment.4 For selected states, figure 4.1 depicts the

84 • The Status of the Education Sector in Sudan
share of children ages 5–17 who reported in the 2006 Sudan HouseholdHealth Survey having ever been enrolled in basic school (whether theywere still enrolled or not).
In Khartoum and River Nile states, almost all children access schoolat some point, although not at age 6 for most of them. For these toptwo states in table 4.1, the share of children enrolled or having beenenrolled in school rose from 40–50 percent of 5-year-olds and 65–70percent of 6-year-olds to 80–85 percent of 7-year-olds and 90–95 per-cent of 8-year-olds only to level out around 95–99 percent for childrenages 9 and up. Thus, some 95–99 percent of children reportedlyentered basic school at some point in their lives. This statistic is alsoknown as the cohort access rate. However, only about 10–20 percent ofchildren entered school at the exact age of 6, the official age of entry tograde 1.
In Southern Darfur and Kassala, about 70 percent of childrengained access to school in 2006, but most did so after age 6. Similarly,for Southern Darfur and Kassala, the bottom two states in table 4.1, thecohort access rate can be estimated as the share of children in the10–13 age group who have ever accessed school. In these two states, thevalue of this statistic is about 70 percent based on household surveydata. It is noteworthy that it is much less common in these two statesfor 5-year-olds to be enrolled in school but more common to enterschool late.
0
20
40
60
80
100
5 6 7 8 9 10 11 12 13 14 15 16 17
perc
ent
age (years)
Khartoum River Nile average northern Sudan
Southern Darfur Kassala
Figure 4.1 Access: Regional Disparities in the Share of Children between Ages 5 and 17 Who Had Ever Accessed Basic School, 2005–06
Source: Authors’ analysis of the 2006 Sudan Household Health Survey (GoNU and GoSS 2006).

Disparities • 85
SOCIAL DISPARITIES
This section looks at social disparities in the rates of school participation.It is severely limited by the availability of data, and therefore considersonly three dimensions: boys versus girls, urban versus rural children, andrich versus poor children.
Statistical information is missing about vulnerable groups. First, thereis insufficient information to assess the school enrollment (and nonen-rollment) rates of internally displaced persons (IDPs) and nomads, whomake up two of the most vulnerable groups in northern Sudan.5 Second,there are no available data on orphans, neither on the number oforphans, potentially high given that it is a postconflict country, nor ontheir rates of school participation or barriers to their access to schooling.These are areas that need further research.
GENDER DISPARITIES
We start the analysis of social disparities by looking at the effect of genderon school enrollments. Based on data from the yearbooks, table 4.2 pro-vides information on the share of girls in total enrollments by level ofeducation.
In the formal system, the share of girls increases with rising levelsof schooling. In 2008–09, girls made up 47 percent of enrollments inpreschool, 46 percent in basic school, 49 percent in academic second-ary school, and 56 percent in higher education (and 25 percent intechnical secondary school), according to table 4.2. Thus, with theexception of the technical track of secondary school, the proportion ofgirls increases with rising levels of education, indicating better reten-tion of girls than boys in the system. The table also shows that the pro-portion of girls in total enrollments has fluctuated only slightly sincethe 2000–01 academic year.
Table 4.3 shows nomadic and village schools have higher gender gapsthan do other basic schools. Government schools that are not nomadic,
Table 4.2 Share of Girls in Enrollments by Level of Education, 2000–01 and 2008–09
Academic year Preschool Basic
Secondary
HigherAcademic Technical
2000–01 50 46 52 36 52
2008–09 47 46 49 25 56
Source: FMoGE statistical yearbooks for years indicated.

86 • The Status of the Education Sector in Sudan
IDP, or village schools have higher shares of girls (47 percent) than donomadic schools (38 percent), IDP schools (44 percent), multigrade villageschools (41 percent), or even nongovernment schools (44 percent). Thisfinding suggests that girls are at a greater disadvantage among marginalizedor vulnerable population groups than in the population as a whole.
More adult women than men attend literacy education. In special edu-cation, girls make up 36 percent of enrollments, whereas girls make up57 percent of enrollments in adolescents education and 76 percent ofenrollments in literacy and adult education. The higher enrollment ofwomen in literacy education may be explained by a greater need for catch-up education for women as a result of lower rates of schooling for girls inpast generations, as indicated by the lower literacy rates for women(52 percent) than for men (71 percent).6
In order to assess the extent of gender disparities in education moreprecisely, adjustments are needed in the population data for girls and boys.Specifically, it is necessary to calculate the GER for girls and boys separatelyto take into account that the population may not include equal numbersof girls and boys. This calculation is not simple for northern Sudan, how-ever, because 4 out of the 15 states have gender ratios far outside the nat-ural range, according to data from the 2008 census.7 As shown in figure4.2, Northern Darfur, Southern Darfur, Kassala, and Red Sea have between113 and 146 boys per 100 girls in the 6–13 age groups, numbers normallyseen only in countries with a strong preference for sons, such as China andparts of India (Das Gupta and others 2002). For the calculation of separateGERs for girls and boys, the breakdown of the population by gender istherefore adjusted to reflect the average ratios for northern Sudan (whenexcluding the four states) for the age group, which are 104 boys per 100girls in the 4–5 age group, 106 boys per 100 girls in the 6–13 age group,and finally, 100 boys per 100 girls in the 14–16 age group.
Overall, the slight advantage for boys in preschool and basic schoolis no longer present by secondary school. Table 4.4 compares the GERfor girls with that of boys and calculates the gender parity index (GPI)by level of education.8 Both preschool and basic school have GPIs of
Table 4.3 Share of Girls in Enrollments by Type of Basic School, 2008–09percent
Academic year
Government schoolNongovernment
schoolNomadic IDP Village Other
2008–09 38 44 41 47 44
Source: FMoGE 2008–09 statistical yearbook. Note: IDP = internally displaced person.

Disparities • 87
0.90, which indicates that slight disadvantages are present for girls atthese education levels. In academic secondary school, the GPI is almost1.00 (and the GER for girls, 33 percent, is almost equal to that for boys,34 percent).
Interestingly, by the time they enter higher education, boys are at aconsiderable disadvantage. This reversal is indicated by the GPI of 1.27 intable 4.4. The better retention of girls in the system may be explained bygreater incentives for girls to stay in school to delay marriage and to delayentrance into an uncertain labor market. However, boys may have better
80 90 100 110 120 130 140 150
Al Jazirah
Sinnar
White Nile
Khartoum
Al Qadarif
South Kordofan
North Kordofan
Blue Nile
Western Darfur
Northern
River Nile
Northern Darfur
Southern Darfur
Kassala
Red Sea
number of boys per 100 girls, 6–13 age group
Figure 4.2 Ratio of Boys to Girls in the Basic School-Age Population, by State, 2008
Source: Authors’ analysis of the 2008 population census data.
Table 4.4 Gender Disparities at All Levels of Education, 2008–09
Indicator Preschool Basic
Secondary
HigherAcademic Technical
Gross enrollment rate(percent)
Girls 35 68 33 0.6 20
Boys 39 76 34 1.9 16
Gender parity index 0.90 0.90 0.97 0.33 1.27
Source: FMoGE 2008–09 statistical yearbook.

88 • The Status of the Education Sector in Sudan
opportunities in the labor market and therefore fewer incentives to stayin school. In secondary and higher education, the GPI for northernSudan is closer to the GPI for countries in the Middle East and NorthAfrica than it is to the GPI for most countries in Sub-Saharan Africa, asshown in Table 4.5.
In spite of promising statistics for girls’ education, pockets of disad-vantage for girls persist. As we see in the following section, some groupsof girls may still be at a considerable disadvantage in terms of their accessto schooling, although the aggregate data for northern Sudan show thatthe differences are small at the national aggregate level.
COMPARISON OF DISPARITIES ACCORDING TO LOCATION, INCOME, AND GENDER
The availability of household survey data for northern Sudan makes itpossible to compare the extent of social disparities in education acrossseveral social dimensions. The 2006 Sudan Household Health Surveywas the most recent survey available at the time of preparing this reportand thus the source of the data (GoNU and GoSS 2006). Figure 4.3presents the probability of a child’s ever enrolling in basic school basedon the following variables: urban or rural location, level of householdincome, and gender. However, because the survey was conducted in
Table 4.5 International Comparison of Gender Parity Index by Level of Education,Latest Available Year
Country Preschool BasicAcademic secondary Higher
Northern Sudan 0.90 0.90 0.97 1.27
Cameroon 1.02 0.86 0.80 0.79
Kenya 0.96 0.98 0.92 0.70
Nigeria 0.99 0.88 0.77 0.70
Uganda 1.05 1.01 0.85 0.80
Four-country average (SSA) 1.01 0.93 0.84 0.74
Egypt, Arab Rep. 0.94 0.95 0.94 —
Iran, Islamic Rep. 0.96 1.40 0.98 1.14
Jordan 0.94 1.02 1.04 1.11
Tunisia 0.99 0.97 1.10 1.50
Four-country average (MENA) 0.96 1.09 1.02 1.25
Source: World Bank EdStats database.Note: MENA = Middle East and North Africa; SSA = Sub-Saharan Africa.

Disparities • 89
2006 and because the probabilities were computed based on theresponses of children a few years after they enrolled (or not) in basicschool, the figures may be taken as indicative of the social disparities inthe system around 2000–05.
The urban or rural location is the best predictor of a child’s chanceof ever going to school, but gender and poverty also matter. Figure 4.3clearly shows that children in rural areas, children from poorer house-holds, and girls are at a disadvantage in terms of access to schooling.Of the three variables, the strongest predictor of access to schooling islocation. Urban children are 17 percentage points more likely than ruralchildren to access school. Overall, boys are 8 percentage points morelikely than girls to access school, and rich children are 2 percentagepoints more likely than poor children to access school.
Gender matters even more for children in rural areas. Table 4.6 goes astep further by illustrating the total disadvantage resulting from all thepossible combinations of rich-poor, urban-rural, and boy-girl. It showsthat there are compounding effects from gender and rurality, so that beinga girl is more of a disadvantage in a rural than in an urban setting:girls are 4 percentage points less likely than boys to attend school inurban areas but 11–12 percentage points less likely than boys toattend school in rural areas. Therefore, the poor rural girl is the mostdisadvantaged of all. She is about 25 percentage points less likely toever access basic school than the rich urban boy.
More child-friendly schools can attract more girls. A joint Governmentof Southern Sudan (GoSS) and UNICEF study conducted in southern
77%
94%82%
90%85% 87%
0
20
40
60
80
100
perc
ent
rural urbanlocation genderincome
girls boyspoor rich
Figure 4.3 Access: Probability of Ever Enrolling in Basic School (Grade 1) according to Location, Income, and Gender, circa 2005
Source: Authors’ analysis of the 2006 Sudan Household Health Survey (GoNU and GoSS 2006). The figureis based on responses of children ages 11–15. Annex table 4B.1 provides the details of the regressionanalysis on which this chart is based. Note: For this figure, poor means belonging to the lowest income quintile and rich means belonging tothe two richest quintiles of the population.

90 • The Status of the Education Sector in Sudan
Sudan in 2008 may provide insights into why some girls are being heldback in rural areas of northern Sudan (MoEST/GoSS 2009).9 One of themain conclusions of the study was that parents generally do want toeducate their daughters, but many are not sending them to school outof concern for their safety on the way to and from school or even in theschool itself. The study concludes that safer and more child-friendlyschool environments—for girls as well as for boys—can be achieved bymaking fairly modest changes, such as increasing parent involvementin school management or providing tuition waivers for girls, and thatthese changes are likely to be enough to persuade parents to send theirdaughters to school. The study also emphasizes the need for teaching lifeskills in schools and in the community.
Longer distances to schools in rural areas may be more of a prob-lem for girls than for boys. The 2008 baseline survey (FMoGE 2008)found a declining GPI with increasing distance to school: 0.84 for stu-dents with a school less than 1 km from home, 0.78 for students with1–3 km between school and home, and 0.66 for students with morethan 3 km between home and school. Because of the correlations inthe data between rurality and distance to school, the results may justbe showing that rural girls have less access to school than do urbangirls, confirming what was discussed previously. However, they mayalso indicate that distance to school can explain a part of the problemof girls’ low access to school in rural areas.
Girls are almost as likely as boys to stay in school once enrolled.Figure 4.4 shows a similar analysis of the probability of staying inschool until the final grade for those who enrolled in grade 1 (reten-tion). Again, location is the best predictor of retention in basic school,with urban children having a 20 percentage-point higher chance thanrural children of still being in school by grade 8. However, even for
Table 4.6 Access: Interaction of Gender with Poverty and Rurality
Indicator
Rich Poor
Urban Rural Urban Rural
Boy (percent) 96 84 95 82
Girl (percent) 92 72 91 70
Gap (percentage points) 4 11 4 12
Source: Regression analysis of the 2006 Sudan Household Health Survey (GoNU andGoSS 2006). The figure is based on responses of children ages 11–15. Annex table 4B.1provides the details of the regression analysis on which this chart is based. Note: The table gives the probability of still being in school by the final grade (for thosewho have attended grade 1).
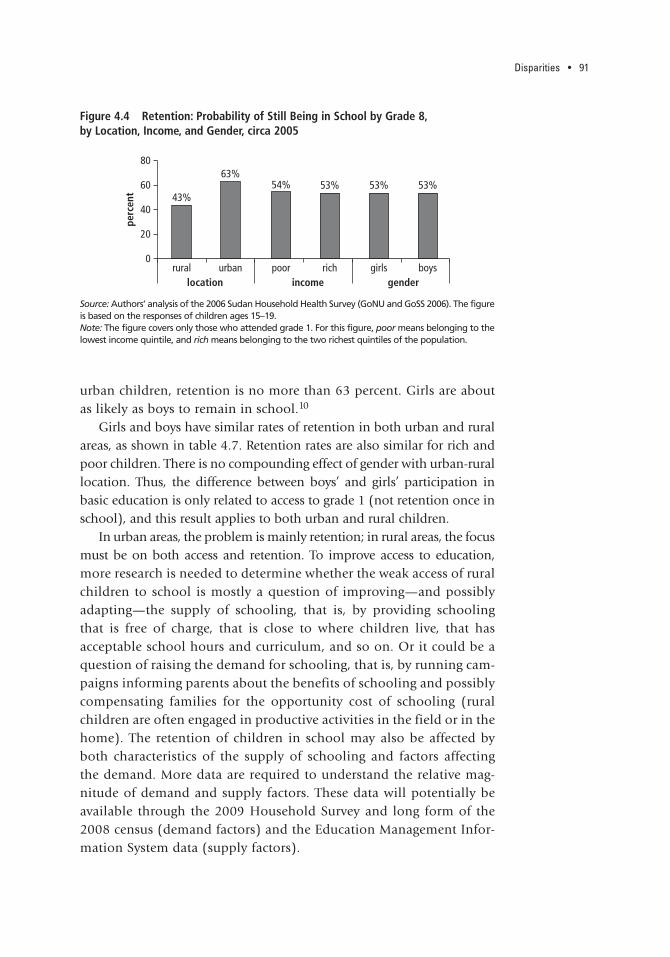
Disparities • 91
urban children, retention is no more than 63 percent. Girls are aboutas likely as boys to remain in school.10
Girls and boys have similar rates of retention in both urban and ruralareas, as shown in table 4.7. Retention rates are also similar for rich andpoor children. There is no compounding effect of gender with urban-rurallocation. Thus, the difference between boys’ and girls’ participation inbasic education is only related to access to grade 1 (not retention once inschool), and this result applies to both urban and rural children.
In urban areas, the problem is mainly retention; in rural areas, the focusmust be on both access and retention. To improve access to education,more research is needed to determine whether the weak access of ruralchildren to school is mostly a question of improving—and possiblyadapting—the supply of schooling, that is, by providing schoolingthat is free of charge, that is close to where children live, that hasacceptable school hours and curriculum, and so on. Or it could be aquestion of raising the demand for schooling, that is, by running cam-paigns informing parents about the benefits of schooling and possiblycompensating families for the opportunity cost of schooling (ruralchildren are often engaged in productive activities in the field or in thehome). The retention of children in school may also be affected byboth characteristics of the supply of schooling and factors affectingthe demand. More data are required to understand the relative mag-nitude of demand and supply factors. These data will potentially beavailable through the 2009 Household Survey and long form of the2008 census (demand factors) and the Education Management Infor-mation System data (supply factors).
43%
63%53% 53%54% 53%
0
20
40
60
80
perc
ent
rural urbanlocation genderincome
girls boyspoor rich
Figure 4.4 Retention: Probability of Still Being in School by Grade 8, by Location, Income, and Gender, circa 2005
Source: Authors’ analysis of the 2006 Sudan Household Health Survey (GoNU and GoSS 2006). The figureis based on the responses of children ages 15–19.Note: The figure covers only those who attended grade 1. For this figure, poor means belonging to thelowest income quintile, and rich means belonging to the two richest quintiles of the population.

92 • The Status of the Education Sector in Sudan
OUT-OF-SCHOOL CHILDREN IN URBAN AND RURAL AREAS
Overall, all of the access and student flow issues are magnified in therural areas. Figure 4.5 provides an illustration of the schooling statusfor urban and rural children and youth in northern Sudan around2005–06.11 The two panels confirm many of the findings that havebeen discussed in this and previous chapters: (a) the relatively late (orin some cases, early) age at which many children enter basic school,(b) the low level of retention from one grade to the next throughoutbasic and secondary education, and (c) the fact that enrollment inschool seems to peak about ages 10–11. Although these basic patternsappear to be the same for urban and rural children, a comparison ofthe two panels also shows that these issues are, for the most part, muchmore severe in rural areas.
Not surprisingly, the share of out-of-school children is higher in ruralthan in urban areas. The two panels also show the proportion of childrenwho are out of school by single age from 5 to 24 years, and provide abreakdown of the out-of-school children into two groups: (a) those whohave never had access to school and (b) those who have been enrolled butare no longer in school. Clearly, there are many more out-of-school chil-dren in rural areas; and in particular, the share of children who have neverhad access to schooling is relatively much larger in rural than in urbanareas (this “never access” group appears at the top of each panel).
An estimated 1 million children and youth between the ages of 10and 17 have never been to formal school (and likely never will). Forthe education policy makers and planners, it is important to know howmany children and youth belong to this particular group because theywill likely need other forms of education in the years to come if theyare to become literate adults. For the 10–17 age range, the number is
Table 4.7 Retention: Interaction of Gender with Poverty and Rurality
Indicator
Rich Poor
Urban Rural Urban Rural
Boy (percent) 63 44 64 45
Girl (percent) 62 43 64 44
Gap (percentage point) 1 1 1 1
Source: Regression analysis of the 2006 Sudan Household Health Survey (GoNU andGoSS 2006). The table is based on the responses of children ages 15–19.Note: The table gives the probability of still being in school by the final grade (forthose who have attended grade 1).

Disparities • 93
estimated in table 4.8 by combining the cohort access rates provided intable 4.6 with the total 10–17 population in northern Sudan. Table 4.8 pro-vides a breakdown of this group by gender and urban-rural location. Morethan 800,000 are in rural areas, and more than 500,000 are rural girls.
STRUCTURAL DISPARITIES
Structural disparities refer to the way in which educational resources aredistributed among people belonging to the same generation. Children
0102030405060708090
100
perc
ent
perc
ent
5 6 7 8 9 10 11 12 13 14 15 16 17 18 19 20 21 22 23 24age (years)
a. Urban
0102030405060708090
100
5 6 7 8 9 10 11 12 13 14 15 16 17 18 19 20 21 22 23 24age (years)
b. Rural
not currently enrolled and never attended school
not currently enrolled but have attended school
enrolled in nonformal enrolled in higher
enrolled in secondary enrolled in basic
enrolled in preschool
Figure 4.5 Schooling Status of Urban and Rural Children by Age, 2005–06
Source: Authors’ analysis of the 2006 Sudan Household Health Survey (GoNU and GoSS 2006).Note: For this figure, nonformal combines all other types of education not captured in the othercategories.
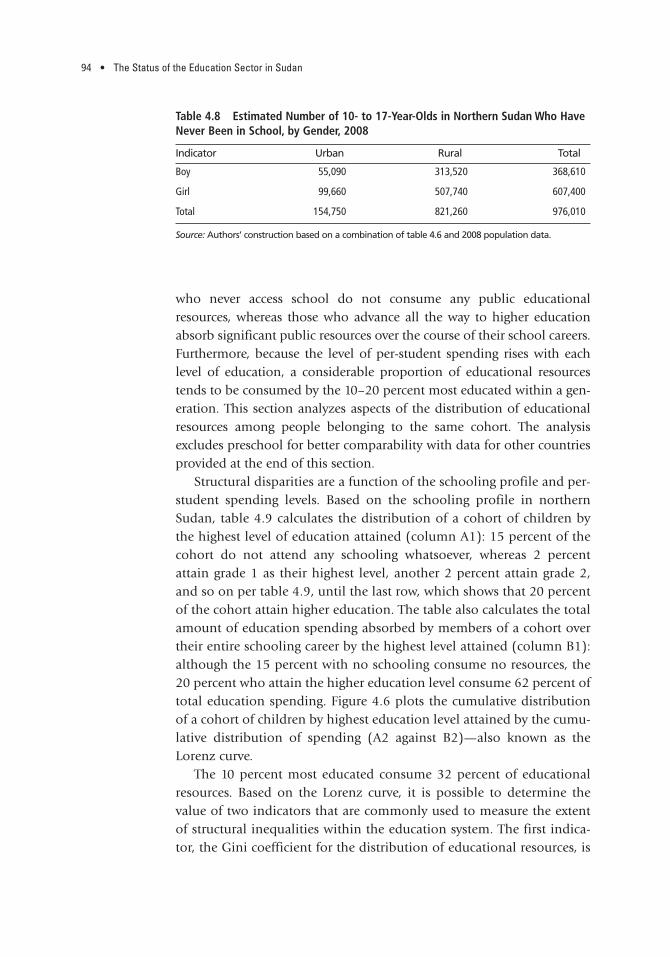
94 • The Status of the Education Sector in Sudan
who never access school do not consume any public educationalresources, whereas those who advance all the way to higher educationabsorb significant public resources over the course of their school careers.Furthermore, because the level of per-student spending rises with eachlevel of education, a considerable proportion of educational resourcestends to be consumed by the 10–20 percent most educated within a gen-eration. This section analyzes aspects of the distribution of educationalresources among people belonging to the same cohort. The analysisexcludes preschool for better comparability with data for other countriesprovided at the end of this section.
Structural disparities are a function of the schooling profile and per-student spending levels. Based on the schooling profile in northernSudan, table 4.9 calculates the distribution of a cohort of children bythe highest level of education attained (column A1): 15 percent of thecohort do not attend any schooling whatsoever, whereas 2 percentattain grade 1 as their highest level, another 2 percent attain grade 2,and so on per table 4.9, until the last row, which shows that 20 percentof the cohort attain higher education. The table also calculates the totalamount of education spending absorbed by members of a cohort overtheir entire schooling career by the highest level attained (column B1):although the 15 percent with no schooling consume no resources, the20 percent who attain the higher education level consume 62 percent oftotal education spending. Figure 4.6 plots the cumulative distributionof a cohort of children by highest education level attained by the cumu-lative distribution of spending (A2 against B2)—also known as theLorenz curve.
The 10 percent most educated consume 32 percent of educationalresources. Based on the Lorenz curve, it is possible to determine thevalue of two indicators that are commonly used to measure the extentof structural inequalities within the education system. The first indica-tor, the Gini coefficient for the distribution of educational resources, is
Table 4.8 Estimated Number of 10- to 17-Year-Olds in Northern Sudan Who HaveNever Been in School, by Gender, 2008
Indicator Urban Rural Total
Boy 55,090 313,520 368,610
Girl 99,660 507,740 607,400
Total 154,750 821,260 976,010
Source: Authors’ construction based on a combination of table 4.6 and 2008 population data.

Table 4.9 Distribution of Public Education Spending among Members of the Same Cohort, 2008–09
Education level
Basic dataDistribution of cohort by
highest level attained Public spending by highest level attained
Schooling profile ofcohorta
percent)
Public per student
spending bylevel (SDG/year)
A1: percentageof total
A2: Cumulativedistribution of
cohort (percent)
Per student(SDG)
Per cohortb
(SDG)B1: Distribution
(percent)
B2: Cumulativedistribution of
spending (percent)
No schooln.a. 0 15 15 0 0 0 0
BasicG1
85 260 2 17 260 553 0 0G2
83 260 2 19 520 1,217 0 0G3
81 260 4 24 780 3,319 1 1G4
76 260 5 29 1,040 4,979 1 3G5
71 260 7 35 1,300 8,713 2 5G6
65 260 3 38 1,560 4,979 1 7G7
62 260 4 42 1,820 7,164 2 9G8
58 260 21 64 2,080 44,477 12 21Secondary
S136 756 5 69 2,836 14,180 4 25
S231 756 5 74 3,592 18,342 5 30
S326 756 7 80 4,348 28,678 8 38
Higher (four years) 20 1,730 20 100 11,268 220,565 62 100
Source: Authors’ calculations based on the FMoGE 2008–09 statistical yearbook.a. The “schooling profile” was calculated in chapter 2: in each grade, it is the enrollment excluding repeaters divided by the population of relevant age. Because the schooling profilebased on yearbook data is likely to be underestimated in northern Sudan, the schooling profile shown in this table was adjusted upward by about 5 percentage points to match thehigher cohort access rate from the SHHS 2006.b. This value was calculated for a hypothetical cohort of 100 children.
95
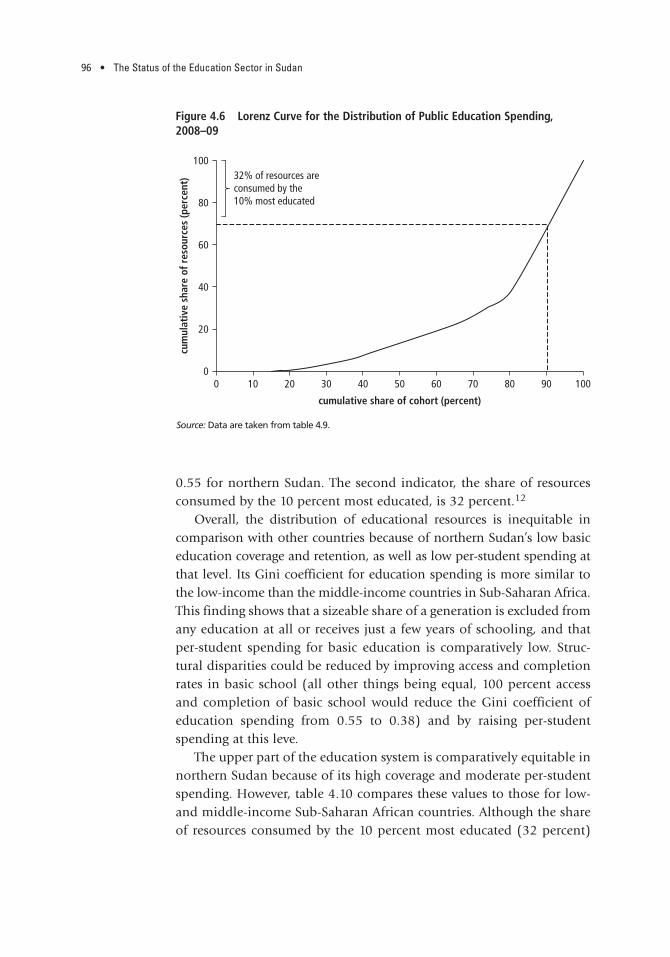
96 • The Status of the Education Sector in Sudan
0.55 for northern Sudan. The second indicator, the share of resourcesconsumed by the 10 percent most educated, is 32 percent.12
Overall, the distribution of educational resources is inequitable incomparison with other countries because of northern Sudan’s low basiceducation coverage and retention, as well as low per-student spending atthat level. Its Gini coefficient for education spending is more similar tothe low-income than the middle-income countries in Sub-Saharan Africa.This finding shows that a sizeable share of a generation is excluded fromany education at all or receives just a few years of schooling, and thatper-student spending for basic education is comparatively low. Struc-tural disparities could be reduced by improving access and completionrates in basic school (all other things being equal, 100 percent accessand completion of basic school would reduce the Gini coefficient ofeducation spending from 0.55 to 0.38) and by raising per-studentspending at this leve.
The upper part of the education system is comparatively equitable innorthern Sudan because of its high coverage and moderate per-studentspending. However, table 4.10 compares these values to those for low-and middle-income Sub-Saharan African countries. Although the shareof resources consumed by the 10 percent most educated (32 percent)
0
20
40
60
80
100
0 10 20 30 40 50 60 70 80 90 100
cum
ulat
ive
shar
e of
res
ourc
es (p
erce
nt)
cumulative share of cohort (percent)
32% of resources areconsumed by the10% most educated
Figure 4.6 Lorenz Curve for the Distribution of Public Education Spending,2008–09
Source: Data are taken from table 4.9.

Disparities • 97
compares favorably to the average for low-income African countries (43 percent), it does not quite meet the mark of the middle-incomecountries (25 percent). This finding shows that secondary schoolingand particularly higher education enjoy fairly high levels of coverageand that per-student spending is fairly moderate at these levels.
SUMMARY
The education system in northern Sudan is characterized by consider-able disparities, although there are also encouraging signs that thesegaps are diminishing. The following list summarizes, by order of impor-tance, this chapter’s analysis of regional, social, and structural dispari-ties in the system:
• Very large gaps in school enrollment exist between rural and urbanchildren. For example, urban children are 17 percentage points morelikely than rural children to ever enroll in basic school. Within therural segment of the population, girls are less likely than boys toenroll in school.
• Overall, more research is needed to identify the main barriers to accessto schooling—whether they are associated with characteristics of the
Table 4.10 Distribution of Public Spending on Education within a Cohort of Children, Northern Sudan Compared to Sub-Saharan Africa, 2008–09
Country Gini coefficient
Percentage of public spending to 10 percent
most educated
Northern Sudan (2008–09) 0.55 32
Cape Verde — 25
Chad — 67
Congo, Rep. — 46
Ethiopia — 65
Kenya — 34
Morocco — 26
Low-income-country average (2003) 0.52 43
Middle-income-country average (2003) 0.30 25
Source: Mingat and Majgaard 2010; UNESCO BREDA 2007.Note: — = not available.
98 • The Status of the Education Sector in Sudan
supply of schooling (such as distance to school, school fees, qualityand relevance of schooling) or with weak demand for schoolingrelated to poverty and opportunity costs.
• An estimated 1 million youth between ages 10 and 17 in northernSudan have never attended basic school. This group needs support inthe form of literacy programs if they are to become literate adults.
• The data on school performance of girls—after enrollment, areencouraging. The share of girls in school enrollments increases withrising levels of education, which indicates a better retention for girlsonce they are enrolled. This result holds even in rural areas.
• The 15 states can be divided into three groups based on their GERsacross the three levels of general education. The five states withintermediate levels of GER are experiencing very strong growth inenrollments and schooling coverage. However, the five low-GERstates—which are all postconflict states—are not seeing the samerapid progress and may need additional support. These states areNorthern Darfur, Red Sea, Blue Nile, Southern Darfur, and Kassala.
• There is a need for more research about the rates of school enrollmentof vulnerable groups—particularly nomads, IDPs, and orphans—andof the barriers to their school participation. The regional analysis,which shows that postconflict states are lagging behind other states,indicates that some of the vulnerable groups, particularly IDPs, arepotentially at a serious disadvantage.
• All across northern Sudan, children access grade 1 at different ages,not necessarily at the prescribed age of 6. In Khartoum and RiverNile states, they often access school before age 6, and in the moreperipheral, postconflict states, most children access school afterage 6.
• The education system in northern Sudan is more inequitable than theeducation systems in comparator countries, which are the middle-income countries of Sub-Saharan Africa and the Middle East andNorth Africa. Too many children within a cohort benefit minimallyfrom public education spending in northern Sudan, whereas the 20 percent most educated within a cohort—which are essentiallythose who attain a university-level education—consume more than60 percent of public education spending. Improving access to andcompletion of basic education would significantly reduce theinequality in the use of education resources and thereby close the gapin this indicator between northern Sudan and other middle-incomecountries.
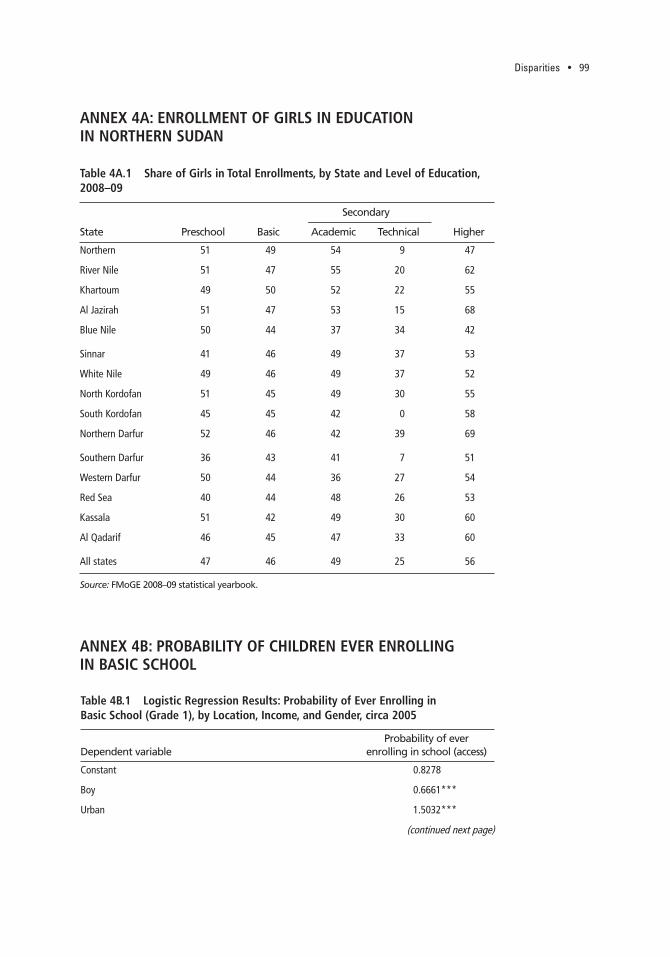
Disparities • 99
ANNEX 4A: ENROLLMENT OF GIRLS IN EDUCATION IN NORTHERN SUDAN
Table 4A.1 Share of Girls in Total Enrollments, by State and Level of Education,2008–09
State Preschool Basic
Secondary
HigherAcademic Technical
Northern 51 49 54 9 47
River Nile 51 47 55 20 62
Khartoum 49 50 52 22 55
Al Jazirah 51 47 53 15 68
Blue Nile 50 44 37 34 42
Sinnar 41 46 49 37 53
White Nile 49 46 49 37 52
North Kordofan 51 45 49 30 55
South Kordofan 45 45 42 0 58
Northern Darfur 52 46 42 39 69
Southern Darfur 36 43 41 7 51
Western Darfur 50 44 36 27 54
Red Sea 40 44 48 26 53
Kassala 51 42 49 30 60
Al Qadarif 46 45 47 33 60
All states 47 46 49 25 56
Source: FMoGE 2008–09 statistical yearbook.
Table 4B.1 Logistic Regression Results: Probability of Ever Enrolling in Basic School (Grade 1), by Location, Income, and Gender, circa 2005
Dependent variableProbability of ever
enrolling in school (access)
Constant 0.8278
Boy 0.6661***
Urban 1.5032***
ANNEX 4B: PROBABILITY OF CHILDREN EVER ENROLLING IN BASIC SCHOOL
(continued next page)

100 • The Status of the Education Sector in Sudan
NOTES1. As in chapter 2, the GER is calculated by contrasting enrollment data from
the 2008–09 school year with population data from the 2008 population census.2. The range for basic school excludes those states for which it has not been
possible to determine a realistic GER, because of problems with either enrollmentor population data.
3. In table 4.1, Red Sea State and Southern Darfur State have been placedamong the states with low schooling coverage based on a low basic school GER(about 40 percent) according to the yearbook data, although the 2006 SudanHousehold Health Survey suggests that their schooling coverage is considerablyhigher (in the 70–90 percent range).
4. As mentioned earlier, household surveys are often more reliable sources ofdata on the effective rate of schooling coverage because they are not affected bymulticohort effects or measurement errors in the school census or populationdata.
5. Although, as reported in chapter 2 and as follows, some data on enroll-ments in so-called IDP and nomadic schools are available; however, this infor-mation is not enough to determine rates of schooling coverage for these twogroups because we don’t have their population data and because some IDP chil-dren and nomadic children may be attending regular schools.
6. These data are from 2000 and were found in the World Bank EdStats data-base. The data are for a population of 15 years and older.
7. At birth, the natural range for the gender ratio is 100–106 boys per 100 girls.Among teens, the ratio of boys to girls is close to 100:100 in most populations,according to Das Gupta and others (2002).
8. The GPI is here calculated as GER girls/GER boys.9. A rights-based, child-friendly school has two basic characteristics:
• It is child seeking—actively identifying excluded children to get themenrolled in school and included in learning; treating children as subjectswith rights that the states are duty-bound to fulfill; and demonstrating,promoting, and helping to monitor the rights and well-being of allchildren in the community.
• It is child centered—acting in the best interests of the individual child,leading to the realization of the child’s full potential, and concerned both
Wealth quintile 2 and 3 (second-poorest and middle quintile) 0.0647***
Wealth quintile 4 and 5 (richest two quintiles) 0.1133***
Memo items:
Age group Ages 11–15
Number of observations 10,959
“R2” (Sommer’D statistic) 0.34
Source: Authors’ analysis of the Sudan Household Health Survey 2006 (GoNU 2006). *** Statistically significant at the 1% level.
Table 4B.1 (continued)
Dependent variableProbability of ever
enrolling in school (access)

Disparities • 101
about the “whole” child (including her health, nutritional status, andwell-being) and about what happens to that child (in her family and com-munity) before she enters school and after she leaves it.
10. Poor children are as likely as rich children to remain in school onceenrolled; this surprising result again suggests that income may be poorly deter-mined in the survey.
11. A similar figure that shows the average for all of northern Sudan was pro-vided in chapter 3 (figure 3.5).
12. The Gini coefficient is a measure of the inequality of distribution. It is cal-culated as the ratio of the area between the diagonal and the Lorenz curve to thearea of the triangle beneath the diagonal. A value of zero expresses total equalityand a value of one expresses maximum inequality.
REFERENCESDas Gupta, M., World Bank Development Research Group, Public Services, and
Rural Development. 2002. Why Is Son Preference So Persistent in East and SouthAsia? A Cross-Country Study of China, India, and the Republic of Korea. PolicyResearch Working Paper 2942. Washington, DC: World Bank.
FMoGE (Federal Ministry of General Education). 2008. “Baseline Survey onBasic Education in the Northern States of Sudan: Final Report June 2008.”Khartoum. Online document available at http://planipolis.iiep.unesco.org/epiweb/E029336e.pdf
———. Various years. “Statistical Yearbooks.” Khartoum.GoNU (Government of National Unity) and GoSS (Government of Southern
Sudan). 2006. Sudan Household Health Survey (SHHS) 2006. Khartoum/Juba:Central Bureau of Statistics and Southern Sudan Center for Census, Statisticsand Evaluation.
Mingat, A., and Majgaard, K. 2010. Education in Sub-Saharan Africa: A ComparativeAnalysis. Washington, DC: World Bank.
MoEST/GoSS (Ministry of Education, Science, and Technology/Government ofSouthern Sudan). 2009. A Report of the Study on Socio-Economic and CulturalBarriers to Schooling in South Sudan. Juba: MoEST/GoSS & United NationsChildren’s Fund.
UNESCO BREDA (United Nations Educational, Scientific, and Cultural Organi-zation Regional Office for Education in Africa). 2007. Education for All inAfrica 2007: Top Priority for Integrated Sector-Wide Policies. Dakar � 7 Report.Dakar, Senegal: UNESCO BREDA. Available at http://www.poledakar.org/spip.php?article255.


103
CHAPTER
Service Delivery and LearningOutcomes in Basic Schools in Three States
This chapter focuses on the delivery of basic education services bythe government and on student learning outcomes in govern-ment basic schools in Kassala, North Kordofan, and River Nile
states. These three states were surveyed for this chapter, or more com-monly known as the service delivery survey (SDS) in 2009, as part ofthe current report on the status of the education sector in northernSudan. Both supply and demand factors affect student learning out-comes. On the supply side, school and classroom resources such astextbooks, chalkboards, class size, and teachers are necessary but notsufficient for student learning (Case and Deaton 1999; Das and oth-ers 2007). The effectiveness of service delivery—that is, how availableresources are used—is also crucial to student learning outcomes (Min-gat and Majgaard 2010). On the demand side, parental education andincome and individual student characteristics affect learning out-comes (Glewwe and Jacoby 1994). Therefore, this chapter examinesseveral specific issues: school and classroom resources and their useplus school management, which are all part of service delivery; stu-dent learning achievement, the ultimate objective of education sys-tems; and selected factors outside of school that affect learning outcomes.1
The main purposes of the SDS are to gain an understanding of stu-dent learning outcomes, provide insights into education service deliv-ery, and complement and add to existing studies on basic education innorthern Sudan. Previous studies on basic education in this area pro-vide useful information on the education system, but they do notassess student learning outcomes within the existing education system(EU 2008; FMoGE 2008).2 Moreover, northern Sudan currently does
5

104 • The Status of the Education Sector in Sudan
not have an institutionalized learning assessment through which tomonitor student learning.
Regular assessments of student learning levels are a useful tool for pol-icy makers. Such assessments provide a guide both to how well the systemis doing in promoting learning and, when coupled with a service deliverycomponent, to factors that may contribute to or hinder the student learn-ing process. Assessments can also be used to compare learning perform-ance over time, across schools within a country, and internationally toinform priority setting and investment in education to ensure maximumlearning outcomes in a climate of limited resources. The SDS conducteda learning assessment comprising both a mathematics and a reading com-ponent for grade 5 students in the three states to provide a snapshot ofgrade 5 student learning levels in the sample schools. (For details on thelearning assessment, see the Student Learning Outcomes section later inthis chapter.)
The three survey states were chosen to provide examples of states withhigh, intermediate, and low performance levels on the selected basic edu-cation indicators shown in table 5.1. For basic education, River Nile Statehas a high gross enrollment rate (GER), gross intake rate (GIR), primarycompletion rate (PCR), and retention rate; spends significantly more on
Table 5.1 Basic Education Indicators for the Three Surveyed States and the Northern Sudan Average, 2008–09
Indicator KassalaNorth
Kordofan River Nile
NorthernSudan
average
Number of students enrolled 182,372 529,762 183,605 n.a.
Gross enrollment rate (percent) 46 78 89 72
Gross intake rate in grade 1 (percent) 80 76 92 80
Grade 8 completion rate (percent) 25 54 70 54
Retention rate (percent) 31 72 76 68
Percentage of girls in total enrollment 42 45 47 46
Percentage of students enrolled in nomadic schools 17 2 4 3
Per-student spending (SDG) 298 174 426 240
Student-teacher ratio 31 42 22 33
Source: FMoGE 2008–09 statistical yearbook; staff estimates.Note: n.a. = not applicable; SDG = Sudanese pounds.
Service Delivery and Learning Outcomes in Basic Schools in Three States • 105
education per student; and has a lower student-teacher ratio (STR) thanthe national average. By comparison, for North Kordofan State, theselected education indicators are quite similar to the national average. InKassala State, the gross enrollment, completion, and retention rates are allmuch lower than the national average and those of the two other states.The share of students enrolled in nomadic schools in Kassala is notablylarger (17 percent), which may partly explain the relatively low retentionrate and high per-student spending.
The rest of the chapter unfolds in logical order. It begins by describ-ing the sample. Because the school and classroom environment pro-vides the context for student learning, the subsequent section describesand discusses the results for this indicator based on the data collectedby the SDS, and when possible, the findings are compared with those ofprevious studies. Then student learning outcomes across the threestates, internationally, and for rural/peri-urban and urban schools areexamined and compared before a discussion of the potential reasons fordifferences in student performance, in addition to school and classroomfactors, begins. The penultimate section provides a brief review of stu-dent performance in secondary education, which was not covered bythe SDS because the United Nations Educational, Scientific, and Cul-tural Organization (UNESCO) and the United Nations Children’s Fund(UNICEF) are currently conducting a similar study of this subsector.Finally, the main findings are summarized.
SAMPLE DESCRIPTION
After the three states were chosen, 195 government basic schools wereselected for the sample, equivalent to 5–7 percent of government schoolsin each state. Cost and time constraints dictated the use of a conveniencesample, and mainly single-sex schools were included, which means thatit is not possible to generalize the survey findings outside the schools andgrade 5 students in the sample.
To collect the data, the SDS used five questionnaires. A head teacherquestionnaire contained school-level questions. A classroom question-naire was based on enumerators’ observations of one grade 3, one grade4, and one grade 5 classroom in each school. A teacher questionnaireasked three to six teachers in each school about their backgrounds andteaching. And a student background questionnaire and learning assess-ment consisted of one mathematics and one reading component, and wasadministered to 20 students in each school.

106 • The Status of the Education Sector in Sudan
Table 5.2 presents the sample information. Of the 195 basic schools sur-veyed, 44 were in Kassala, 99 in North Kordofan, and 52 in River Nile. Thehead teacher in each school was interviewed to collect school-level data. Inaddition, 232 teachers in Kassala, 484 teachers in North Kordofan, and 296teachers in River Nile were interviewed. The final student sample consistedof 3,893 students, and all of these students completed the backgroundquestionnaire and learning assessment.3 Finally, three classrooms (onegrade 3, one grade 4, and one grade 5) were observed by the enumeratorsin each of the 195 schools for a total of 585 observed classrooms.
Table 5.3 shows the shares of rural/peri-urban and urban schools inthe sample. In Kassala, 43 percent of sample schools are rural or peri-urban and 57 percent are urban. The corresponding shares for NorthKordofan are 42 percent rural or peri-urban and 58 percent urban, and forRiver Nile, 52 percent rural or peri-urban and 48 percent urban. Therural/peri-urban and urban classifications are based on the interviewedhead teachers’ categorizations of their schools. Urban schools are thosereported as being located in an urban area (that is, in the main locality).For the purposes of the analysis in this chapter, the peri-urban and rural
Table 5.2 Sample Information for the Three Northern Sudan States Chosen, 2009
Basic educationa KassalaNorth
Kordofan River NileThree states
(average)
Number of schools
Total for state 630 1,863 754 3,247
Sample 44 99 52 195
Sample as percentage of total 7.0 5.3 6.9 (6.0)
Number of teachers
Total for state 5,468 12,445 8,404 26,317
Sample 232 484 296 1,012
Sample as percentage of total 4.2 3.9 3.5 (3.8)
Tested 88 198 103 389
Number of grade 5 students
Total for state 16,943 62,887 21,840 101,670
Sample 878 1,977 1,038 3,893
Sample as percentage of total 5.2 3.1 4.8 (3.8)
Number of observed classroomsb 132 297 156 585
Source: Service delivery survey; FMoGE 2008–09 statistical yearbook. a. Government schools only. b. One grade 3, one grade 4, and one grade 5 classroom were observed in each school.
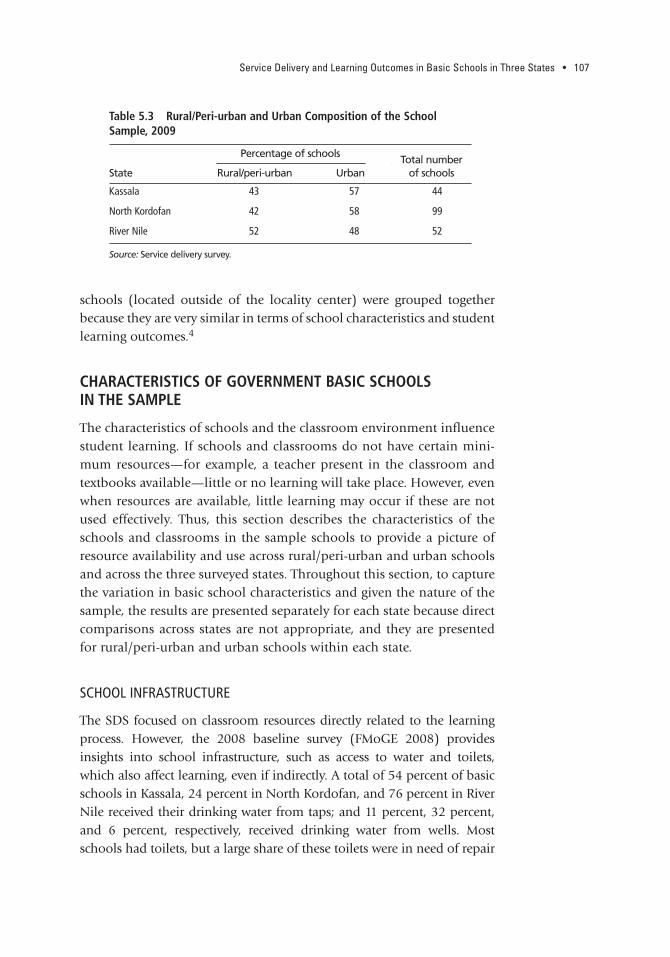
Service Delivery and Learning Outcomes in Basic Schools in Three States • 107
schools (located outside of the locality center) were grouped togetherbecause they are very similar in terms of school characteristics and studentlearning outcomes.4
CHARACTERISTICS OF GOVERNMENT BASIC SCHOOLS IN THE SAMPLE
The characteristics of schools and the classroom environment influencestudent learning. If schools and classrooms do not have certain mini-mum resources—for example, a teacher present in the classroom andtextbooks available—little or no learning will take place. However, evenwhen resources are available, little learning may occur if these are notused effectively. Thus, this section describes the characteristics of theschools and classrooms in the sample schools to provide a picture ofresource availability and use across rural/peri-urban and urban schoolsand across the three surveyed states. Throughout this section, to capturethe variation in basic school characteristics and given the nature of thesample, the results are presented separately for each state because directcomparisons across states are not appropriate, and they are presentedfor rural/peri-urban and urban schools within each state.
SCHOOL INFRASTRUCTURE
The SDS focused on classroom resources directly related to the learningprocess. However, the 2008 baseline survey (FMoGE 2008) providesinsights into school infrastructure, such as access to water and toilets,which also affect learning, even if indirectly. A total of 54 percent of basicschools in Kassala, 24 percent in North Kordofan, and 76 percent in RiverNile received their drinking water from taps; and 11 percent, 32 percent,and 6 percent, respectively, received drinking water from wells. Mostschools had toilets, but a large share of these toilets were in need of repair
Table 5.3 Rural/Peri-urban and Urban Composition of the School Sample, 2009
State
Percentage of schools Total numberof schoolsRural/peri-urban Urban
Kassala 43 57 44
North Kordofan 42 58 99
River Nile 52 48 52
Source: Service delivery survey.
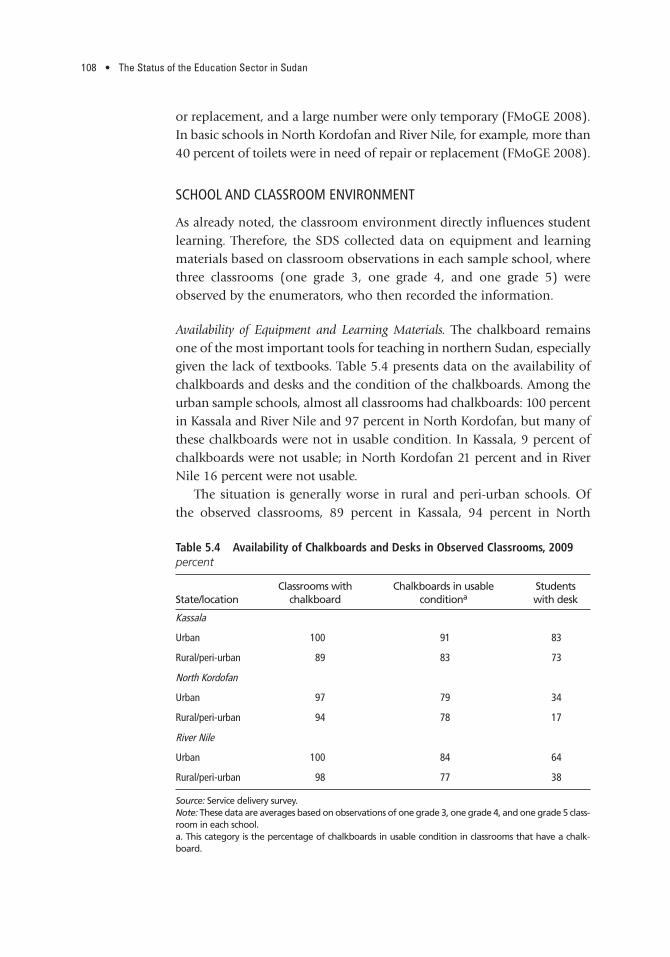
108 • The Status of the Education Sector in Sudan
or replacement, and a large number were only temporary (FMoGE 2008).In basic schools in North Kordofan and River Nile, for example, more than40 percent of toilets were in need of repair or replacement (FMoGE 2008).
SCHOOL AND CLASSROOM ENVIRONMENT
As already noted, the classroom environment directly influences studentlearning. Therefore, the SDS collected data on equipment and learningmaterials based on classroom observations in each sample school, wherethree classrooms (one grade 3, one grade 4, and one grade 5) wereobserved by the enumerators, who then recorded the information.
Availability of Equipment and Learning Materials. The chalkboard remainsone of the most important tools for teaching in northern Sudan, especiallygiven the lack of textbooks. Table 5.4 presents data on the availability ofchalkboards and desks and the condition of the chalkboards. Among theurban sample schools, almost all classrooms had chalkboards: 100 percentin Kassala and River Nile and 97 percent in North Kordofan, but many ofthese chalkboards were not in usable condition. In Kassala, 9 percent ofchalkboards were not usable; in North Kordofan 21 percent and in RiverNile 16 percent were not usable.
The situation is generally worse in rural and peri-urban schools. Ofthe observed classrooms, 89 percent in Kassala, 94 percent in North
Table 5.4 Availability of Chalkboards and Desks in Observed Classrooms, 2009percent
State/location Classrooms with
chalkboardChalkboards in usable
conditionaStudents with desk
Kassala
Urban 100 91 83
Rural/peri-urban 89 83 73
North Kordofan
Urban 97 79 34
Rural/peri-urban 94 78 17
River Nile
Urban 100 84 64
Rural/peri-urban 98 77 38
Source: Service delivery survey.Note: These data are averages based on observations of one grade 3, one grade 4, and one grade 5 class-room in each school.a. This category is the percentage of chalkboards in usable condition in classrooms that have a chalk-board.

Service Delivery and Learning Outcomes in Basic Schools in Three States • 109
Kordofan, and 98 percent in River Nile had chalkboards, but of thesechalkboards, 17 percent, 22 percent, and 23 percent, respectively, werenot in usable condition. The findings are similar to those of the 2008baseline survey, which did not distinguish between rural and urbanschools but found that more than 40 percent of chalkboards were in needof repair or replacement (FMoGE 2008).
Based on the 2009 SDS, on average, 83 percent, 34 percent, and 64 percent of students in urban schools in Kassala, North Kordofan, andRiver Nile, respectively, had a desk. The shares of students with a deskwere lower in rural and peri-urban schools, that is, 73 percent, 17 percent,and 38 percent, respectively. This finding means, for instance, that lessthan one in five students in the rural/peri-urban sample schools in NorthKordofan had a desk and the remaining students sat on a chair without adesk, or on the floor or ground. These results are in line with the 2008baseline survey, which found that more than 40 percent of students inNorth Kordofan were seated on the ground (FMoGE 2008).
In addition to a usable chalkboard and desks for students, a class-room conducive to learning needs to have textbooks. The official policyon the student–textbook ratio is 2:1 (FMoGE 2008). However, the shareof students with textbooks in the observed classrooms in the three sur-veyed states was generally small. Students in observed classrooms inRiver Nile were more likely to have textbooks, with the average stu-dent–textbook ratio close to 2:1 for mathematics and 1.6:1 for reading,which is in line with or better than the official policy. The average stu-dent–textbook ratio in Kassala was 3:1 for mathematics and 2.5:1 forreading, which is higher than the official policy. Students in observedclassrooms in North Kordofan had it the worst: the average student–text-book ratio in rural/peri-urban classrooms was 9:1 and in urban classroomswas 5:1. Considering that education councils also provided textbooks forstudents in several of these schools (see table 5.5), the higher-than-recom-mended average student–textbook ratios in Kassala and the very highratios in North Kordofan point to a serious failure of the public educationsystem, with negative consequences for student learning.
Another study, based on visits to 71 government basic schools inseven states also documents the lack of textbooks when it found anaverage student–textbook ratio of 4:1 (EU 2008).That study also discov-ered significant differences in textbook availability across states, withbasic schools in River Nile being particularly well provided for in termsof textbooks, similar to the findings of the SDS.
In contrast, the vast majority of students in the observed classroomshad other learning materials. In each of the three states and in both

rural/peri-urban and urban schools, between 90 and 99 percent of stu-dents had notebooks for mathematics and reading and had pens andpencils. Unlike textbooks, these learning materials are generally pro-vided by families or education councils.
Instruction Characteristics. It is difficult for students to learn without accessto textbooks and more challenging for teachers to teach the required syl-labus. To gauge syllabus coverage, the enumerators recorded approxi-mately how much of the syllabus had been covered at the time of theirvisit, which was at a point about 80 percent into the school year. Thus, 80 percent of the syllabus should have been covered by then. However,teachers in North Kordofan were on strike during the month before the SDSwas conducted, which implies a loss of instruction time to be consideredwhen comparing the findings presented in table 5.6. In addition, eight ofthe sample schools in Kassala started their school year in April rather thanJune, so were potentially even further behind in terms of syllabus coverage.
Average syllabus coverage in mathematics for grade 3, 4, and 5 class-rooms was 76 percent in sample schools in Kassala, 67 percent in NorthKordofan, and 78 percent in River Nile. For reading, average syllabus cov-erage was generally somewhat higher but followed the same state andrural/peri-urban versus urban patterns.
Going beyond averages reveals notable variations in syllabus coverageacross schools. In about half of the schools in Kassala and River Nile,
Table 5.5 Availability of Textbooks in Observed Classroomspercent
State/location
Students in grade 3, 4, and 5 classrooms with textbooks
Mathematics Reading
Kassala
Urban 33 43
Rural/peri-urban 32 39
North Kordofan
Urban 11 21
Rural/peri-urban 11 18
River Nile
Urban 56 64
Rural 58 61
Source: Service delivery survey.Note: These data are averages based on observations of one grade 3, one grade 4, andone grade 5 classroom in each school.
110 • The Status of the Education Sector in Sudan

Table 5.6 Syllabus Coverage in Observed Classrooms, 2009
State/location
Percentage of schools for which average share of mathematics syllabus coverage is
Average mathematics
syllabus coverage
Percentage of schools for which average share of reading syllabus coverage is
Average reading syllabus
coverage 40–59 60–79 >80 40–59 60–79 >80
Kassala
Urban 4 52 44 78 4 40 56 79
Rural/peri-urban 11 37 53 74 0 33 67 80
North Kordofana
Urban 9 71 18 70 6 59 33 73
Rural/peri-urban 37 51 12 64 33 50 17 66
River Nileb
Urban 0 29 67 79 0 16 80 81
Rural/peri-urban 0 48 52 78 7 44 48 78
Source: Service delivery survey.Note: These data are averages based on observations of one grade 3, one grade 4, and one grade 5 classroom in each school.a. In 2 percent of observed classrooms in urban schools in North Kordofan, less than 40 percent of the syllabus had been covered, which is not shown in the table.b. In 4 percent of observed classrooms in urban schools in River Nile, less than 40 percent of the syllabus had been covered, which is not shown in the table.
111

112 • The Status of the Education Sector in Sudan
80 percent or more of the syllabus had been covered at the time of thevisits, both in mathematics and in reading (table 5.6). The vast majorityof the remaining schools had covered 60–79 percent of the syllabus. Syl-labus coverage was generally lower in rural and peri-urban classroomsthan in urban classrooms. For example, 4 percent of urban schools inKassala had covered only 40–59 percent of the syllabus compared with11 percent of rural and peri-urban schools. These schools in NorthKordofan did even less well, with 37 percent and 33 percent, respec-tively, having covered only 40–59 percent of the syllabus for mathemat-ics and reading, which is low even after taking into account teachingtime lost because of the teacher strike. Rural and peri-urban schools areof particular concern because a complete catch-up in terms of syllabuscoverage would be nearly impossible.
Both the lack of textbooks and the failure to cover the complete syl-labus affect the amount of instruction to which students are exposed.5
Two other factors that also influence exposure to instruction are averageclass size and student attendance. The average student–teacher ratio forbasic education was 31:1 in Kassala, 42:1 in North Kordofan, and 22:1 inRiver Nile (see chapter 7, on finance). These ratios are below or close tothe benchmark of 40:1 for basic education prescribed by the Educationfor All Fast-Track Initiative, and they are much lower than the average stu-dent–teacher ratios for neighboring countries such as Ethiopia and Kenya(also see chapter 6, on teacher management). However, in many of thesample schools, although student–teacher ratios were relatively low, classsizes tended to be fairly large.
The data on class size presented in table 5.7 are based on the enumera-tors’ recording of the number of students present in the three classroomsobserved in each sample school on the day of the school visit. Therefore, ifmany students were absent on the day of the school visit, these class sizeswould be smaller than true class sizes. However, the majority of studentswere present in the majority of schools on the day of the visit, which sug-gests that the class size data provide a fair approximation of actual class size.
Generally, class sizes are larger in urban than in rural schools, whichmakes sense given the lower population density in rural areas. The averageclass size in the observed classrooms was 55 students in urban sampleschools compared with 44 in rural/peri-urban schools in Kassala, 50 inurban schools compared with only 28 in rural/peri-urban sample schoolsin North Kordofan, and 48 in urban schools and 38 in rural/peri-urbanschools in River Nile (table 5.7).
That rural class sizes tend to be smaller than urban class sizes is alsosupported by the findings in the 2008 baseline survey (FMoGE 2008). To

Service Delivery and Learning Outcomes in Basic Schools in Three States • 113
take two extreme examples, no urban sample schools in Kassala had classsizes smaller than 34 students, whereas 47 percent of rural schools did;and in River Nile, 16 percent of urban sample schools had class sizeslarger than 65 students, whereas no rural schools did.
Student absenteeism reduces the amount of student-teacher contacttime, which in turn affects learning (the issue of school functional days isdiscussed below, and teacher attendance is discussed in chapter 6, onteacher management). Based on the classroom observations, studentattendance in the sample schools was high in Kassala and River Nile butlower in North Kordofan, and it was similar across rural/peri-urban andurban schools (table 5.8). Between 92 and 95 percent of students in bothrural/peri-urban and urban schools were present on the day of the schoolvisits in Kassala, 84–85 percent were present in North Kordofan, and98 percent were present in River Nile. Again, the teacher strike in NorthKordofan the month before the SDS might have affected attendance if stu-dents and parents were uncertain as to whether the schools were openagain after the strike.
The 2008 baseline survey investigated student absenteeism by askingteachers what they considered the main reasons for students not comingto school. The most frequently cited reasons were health, bad weather,lack of textbooks, teacher absenteeism, and lack of school uniforms(FMoGE 2008). This finding relates to the issue of the quality of educa-tion. If parents think their children are unlikely to learn while in school(for example, because of the lack of textbooks and teachers being absent),then arguably they are less likely to send them to school. Further study isneeded to understand if the observed higher student absenteeism in
Table 5.7 Class Size in Observed Classrooms, 2009
State/location
Percentage of observed classrooms with class size ofAverageclass size15–34 35–50 51–65 >65
Kassala
Urban 0 36 44 20 55
Rural/peri-urban 47 11 21 21 44
North Kordofan
Urban 26 25 26 23 50
Rural/peri-urban 71 19 10 0 28
River Nile
Urban 20 32 32 16 48
Rural/peri-urban 41 44 15 0 38
Source: Service delivery survey.Note: These data are averages based on observations of one grade 3, one grade 4, and one grade 5 classroom in each school.

114 • The Status of the Education Sector in Sudan
North Kordofan may be because of the lower, or perceived lower, qualityof education in these schools.
SCHOOL MANAGEMENT
The previous sections examined the availability of resources in the sam-ple schools, whereas this section examines how the existing resources areused. The data presented here are based on interviews with the headteacher at each of the 195 sample schools.
School Functional Days. Directly related to resource management is thenumber of days a school operates in a year. If a school is closed when itshould be open, then students receive fewer teaching hours, with detri-mental results for learning outcomes.6 The official school year in north-ern Sudan is 210 days per year (FMoGE 2008). For reference, the averageofficial school year in primary education across countries is 200 days,with a range of 175–210 days (UNESCO 2007). The average length of theofficial school year reported by head teachers in the sample schools in thethree states lies within the range of 200–214 days. However, these are aver-ages, which means that some head teachers report a notably shorter andothers a notably longer school year than the official 210 days. This find-ing suggests that many school heads are not aware of the official policy of210 school days per year.
Table 5.8 Average Student Attendance in Observed Classrooms,2009percent
State/locationStudents present in observed classrooms
on day of school visit
Kassala
Urban 95
Rural/peri-urban 92
North Kordofan
Urban 84
Rural/peri-urban 85
River Nile
Urban 98
Rural/peri-urban 98
Source: Service delivery survey.Note: These data are averages based on observations of one grade 3, one grade 4, andone grade 5 classroom in each school.

Service Delivery and Learning Outcomes in Basic Schools in Three States • 115
In the sample schools, the average length of the actual school yearis shorter than the official school year in each state. The final columnin table 5.9 shows the difference between the official school year of210 days and the average actual school year. In River Nile, the averagenumber of actual school days is close to the official number of days inboth rural/peri-urban schools and urban schools (7 and 5 days’ dif-ference, respectively). But for Kassala and North Kordofan, the averageactual school year is substantially shorter than the official schoolyear—about 26 days shorter in Kassala and North Kordofan.7 The2008 baseline survey also found that the actual school year wasshorter than the official school year in the majority of basic schools(FMoGE 2008).
Overall, this finding implies that students are missing, on average,more than one month of teaching each year, which has notable implica-tions for student learning outcomes. To ameliorate this situation, poli-cies need to be put into place that clearly communicate official policy onthe length of the official school year, make up for lost days, and enableschools to be open as intended.
School Record Keeping: Student Enrollment and Performance. To assessresource needs and effectively manage these resources, schools need to
Table 5.9 Official and Actual Number of School Days in the Academic Year, State Averages, 2009
State/location
Reported number of school days
Official Actual
Difference inaverage official
(210 days) and actual
Kassala
Urban 208 186 24
Rural/peri-urban 202 182 28
North Kordofan
Urban 211 184 26
Rural/peri-urban 212 184 26
River Nile
Urban 210 203 7
Rural/peri-urban 212 205 5
Source: Service delivery survey.Note: These data are based on the responses by the head teachers interviewed in eachsample school.

116 • The Status of the Education Sector in Sudan
have up-to-date information on students (record keeping on teacher-related issues is discussed in the chapter 6, on teacher management).The majority of sample schools (80–84 percent) were able to showtheir student enrollment records to the enumerators during the schoolvisits, and there was no notable difference between rural/peri-urbanand urban schools in Kassala and River Nile (table 5.10).8 In NorthKordofan, 98 percent of rural and peri-urban sample schools couldshow their records of student enrollment compared with 91 percent ofurban sample schools.
Many schools also keep records of student performance based on theirown continuous assessment of student learning throughout the academicyear. School record keeping on student performance was weaker thanrecord keeping on enrollments in North Kordofan and River Nile, andwas much weaker in Kassala. In River Nile and North Kordofan, themajority of rural/peri-urban and urban schools (89–95 percent) were ableto show their student performance records on the day of the school visits.In Kassala, only 58 percent of the rural/peri-urban sample schools and 76 percent of the urban schools could show their student performancerecords to the enumerators.
Education Councils. The participation of communities and parents in pro-viding support to schools, often through education councils, is strongly
Table 5.10 School Record Keeping on Student Enrollment and Performance, State Averages, 2009percent
State/location
Schools able to show records of student
Enrollment Performance
Kassala
Urban 84 76
Rural/peri-urban 84 58
North Kordofan
Urban 91 88
Rural/peri-urban 98 95
River Nile
Urban 80 92
Rural/peri-urban 81 89
Source: Service delivery survey.Note: These data are based on the head teacher in each school showing the relevantrecords to the enumerator.
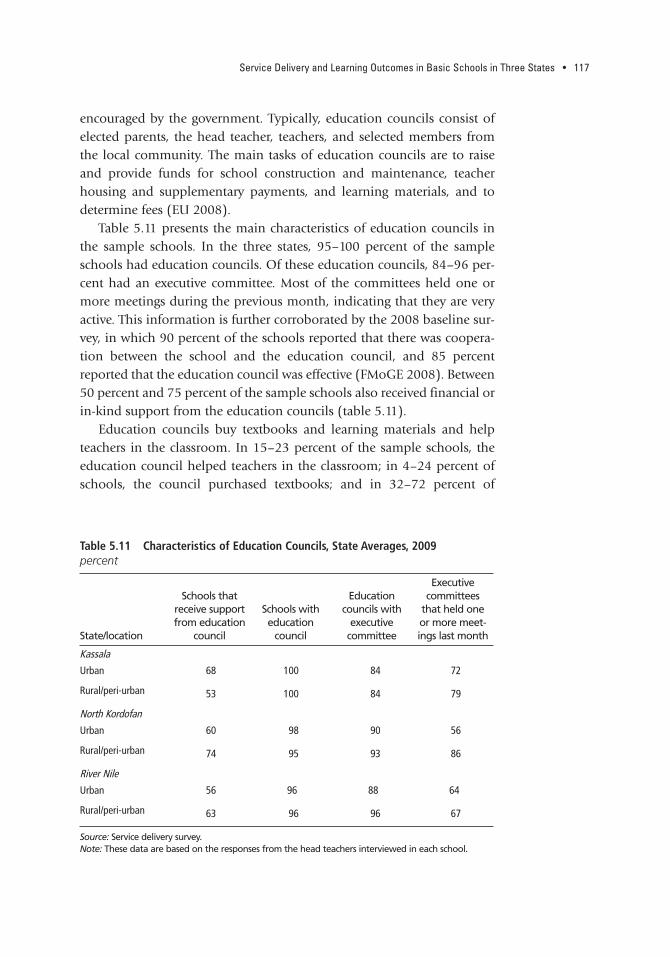
Service Delivery and Learning Outcomes in Basic Schools in Three States • 117
encouraged by the government. Typically, education councils consist ofelected parents, the head teacher, teachers, and selected members fromthe local community. The main tasks of education councils are to raiseand provide funds for school construction and maintenance, teacherhousing and supplementary payments, and learning materials, and todetermine fees (EU 2008).
Table 5.11 presents the main characteristics of education councils inthe sample schools. In the three states, 95–100 percent of the sampleschools had education councils. Of these education councils, 84–96 per-cent had an executive committee. Most of the committees held one ormore meetings during the previous month, indicating that they are veryactive. This information is further corroborated by the 2008 baseline sur-vey, in which 90 percent of the schools reported that there was coopera-tion between the school and the education council, and 85 percentreported that the education council was effective (FMoGE 2008). Between50 percent and 75 percent of the sample schools also received financial orin-kind support from the education councils (table 5.11).
Education councils buy textbooks and learning materials and helpteachers in the classroom. In 15–23 percent of the sample schools, theeducation council helped teachers in the classroom; in 4–24 percent ofschools, the council purchased textbooks; and in 32–72 percent of
Table 5.11 Characteristics of Education Councils, State Averages, 2009percent
State/location
Schools thatreceive supportfrom education
council
Schools witheducation
council
Educationcouncils with
executive committee
Executive committees
that held oneor more meet-ings last month
Kassala
Urban 68 100 84 72
Rural/peri-urban 53 100 84 79
North Kordofan
Urban 60 98 90 56
Rural/peri-urban 74 95 93 86
River Nile
Urban 56 96 88 64
Rural/peri-urban 63 96 96 67
Source: Service delivery survey.Note: These data are based on the responses from the head teachers interviewed in each school.

118 • The Status of the Education Sector in Sudan
schools, it bought learning materials (table 5.12). This suggests that inmany schools, education councils are complementing insufficient gov-ernment education spending (also see chapter 7, on education finance).
In many of the sample schools, education councils supplementteacher salaries. For instance, in North Kordofan, the executive commit-tees helped to pay teacher salaries in 20 percent of the rural/peri-urbansample schools, and in River Nile, it was 15 percent of salaries inrural/peri-urban schools. It is noteworthy that North Kordofan also hasa large share of volunteer teachers (see chapter 6, on teacher manage-ment), implying that there may be a teacher shortage in rural schoolsthat is being met by education councils’ paying volunteer teachers to fillthe gaps. Education councils may also be topping off salaries to attractteachers to schools in remote areas, but more evidence is needed to bet-ter understand exactly which types of teachers education councils arepaying for and why.
However, not only do school and classroom resources and their useaffect student learning outcomes, but also family background andhousehold characteristics matter. The next section examines householdcharacteristics and learning outcomes based on the data collected by the SDS.
Table 5.12 School Support Provided by Educational Councils, State Averages,2009percent
State/location
Schools in which the education councils
Help teachersin the
classroomBuy
textbooksBuy learning
materialsPay teacher
salaries
Kassala
Urban 16 16 72 4
Rural/peri-urban 16 11 32 0
North Kordofan
Urban 23 14 40 0
Rural/peri-urban 21 24 67 21
River Nile
Urban 16 4 44 0
Rural/peri-urban 15 7 56 15
Source: Service delivery survey.Note: These data are based on the responses from the head teachers interviewed in each school.

Service Delivery and Learning Outcomes in Basic Schools in Three States • 119
STUDENT LEARNING OUTCOMES
The findings in this section are based on the data collected by the studentbackground questionnaire and the learning assessment completed by20 grade 5 students in each sample school. The section begins by describ-ing the two learning assessments used to test student learning outcomesin the three states. It then presents the findings on learning outcomes forthe sample of students before providing an international comparison andexamining differences in learning outcomes among boys and girls, respec-tively, in rural/peri-urban and urban schools. Finally, potential reasons atthe household level for differences in learning outcomes are explored.
ASSESSMENTS AND FINDINGS
The learning assessment administered to the students consisted of a math-ematics component with 30 questions and a reading component with25 questions, which the students were given 90 minutes to complete.9 Themathematics questions were selected from the 1995 and 2003 Trends inInternational Mathematics and Science Study (TIMSS) grade 4 assessment,and the reading questions were taken from the 1991 and 2001 Progress inInternational Reading Literacy Study (PIRLS) grade 4 assessment. All ques-tions included in the assessment were reviewed by the SDS Steering Com-mittee to ensure suitability given the national curriculum. An advantage ofusing questions from the TIMSS and PIRLS is the potential for interna-tional comparisons of student learning achievements. However, studentsin northern Sudan were assessed in grade 5 instead of grade 4 because theSDS Steering Committee considered it more appropriate given the post-conflict situation, which needs to be taken into account for the purpose ofthe international comparisons.
The average student in the sample for the three states only answered 34percent of the mathematics and 39 percent of the reading questions cor-rectly (figure 5.1). This is low, especially considering that the questions aremultiple choice. With four answer options, if a student simply guessed, heor she would respond correctly 25 percent of the time.10 The lowest scoresin both mathematics and reading were zero, and no student answered allquestions on either component correctly. Of the 3,893 students who tookthe learning assessment, the vast majority of students (84 percent formathematics and 72 percent for reading) answered less than half the ques-tions correctly, further underlining the fact that student learning outcomesare very weak. Finally, in general, students performed better on the readingthan on the mathematics component of the learning assessment.

a. Mathematics scores
0
2
4
6
8
10%
of s
tude
nts
0 20 40 60 80 100student assessment scores (percent)
b. Reading scores
0
2
4
6
8
10
% o
f stu
dent
s
0 20 40 60 80 100student assessment scores (percent)
Figure 5.1 Grade 5 Student Learning Assessment Scores in Mathematics and Reading in Kassala, North Kordofan, and River Nile, 2009percent
Source: Service delivery survey.
Table 5.13 shows the summary statistics for the grade 5 student scoreson the learning assessment for the each of the three surveyed states.Although the student scores lie within roughly the same 0–96 percentrange for all the states, the average scores were highest in Kassala, with
120 • The Status of the Education Sector in Sudan

45 percent for mathematics and 53 percent for reading. These scorescompare to 39 percent for mathematics and 45 percent for reading inRiver Nile, and 31 percent for both mathematics and reading in NorthKordofan. However, these scores are simple averages, which do notaccount for differences in school and classroom resources or for stu-dent background.
INTERNATIONAL COMPARISON OF STUDENT PERFORMANCE
The learning assessment scores for students in northern Sudan cannotbe compared directly with those of students in other countriesbecause the former were assessed using a subset of questions from thefull versions of the TIMSS and PIRLS. Instead, to enable an interna-tional comparison, the shares of students in northern Sudan thatanswered each question on the mathematics component correctly arecompared with the corresponding shares of students in Morocco, Singapore, and Tunisia, and on the reading component, comparedwith the corresponding shares in Benin and Singapore. Not all 30mathematics questions and all 25 reading questions were used in thelearning assessments in these countries. Therefore, figure 5.2 showsonly the 24 questions of the mathematics assessment that were askedin Morocco, Northern Sudan, Singapore, and Tunisia; and figure 5.3shows only the 24 questions of the reading assessment that were askedin Benin, northern Sudan, and Singapore.
Figure 5.2 illustrates that students in northern Sudan performed simi-larly to their counterparts in Morocco and Tunisia in terms of the relativenumber of mathematics questions students answered correctly. However,compared with Singapore, one of the top-performing TIMSS countries,
Table 5.13 Grade 5 Student Learning Assessment Scores in Mathematics and Reading, 2009 percent
State
Student learning assessment scores
Mathematics Reading
AverageStandarddeviation Lowest Highest Average
Standarddeviation Lowest Highest
Kassala 45 17 3 93 53 21 4 96
North Kordofan 31 13 0 90 31 15 0 92
River Nile 39 15 0 93 45 21 0 96
Source: Service delivery survey.Note: The maximum score is 100 percent (all questions answered correctly).
121
Service Delivery and Learning Outcomes in Basic Schools in Three States • 121

122
0
10
20
30
40
50
60
70
80
90
100
1 2 3 4 5 6 7 8 9 10 11 12 13 14 15 16 17question number
18 19 20 21 22 23 24
% o
f stu
dent
s w
ho a
nsw
ered
eac
h qu
esti
on c
orre
ctly
northern Sudan Morocco Tunisia Singapore
Figure 5.2 International Comparison of Student Performance in Mathematics between Morocco, Northern Sudan, Singapore, and Tunisia, 2008–09
Source: IAEEA 2008; service delivery survey.

0
10
20
30
40
50
60
70
80
90
100
1 2 3 4 5 6 7 8 9 10 11 12 13 14 15 16question number
17 18 19 20 21 22 23 24
% o
f stu
dent
s w
ho a
nsw
ered
eac
h qu
esti
on c
orre
ctly
northern Sudan Benin Singapore
Figure 5.3 International Comparison of Student Performance in Reading between Benin, Northern Sudan, and Singapore, 2008–09
Source: IAEEA 2008; service delivery survey.
123

124 • The Status of the Education Sector in Sudan
students in northern Sudan performed significantly worse. Moreover, asdiscussed previously, the learning assessments are geared to grade 4 stu-dents, but the students in the three states in northern Sudan were testedin grade 5, so they had approximately one additional year of schooling.
Figure 5.3 compares student performance in the three states of north-ern Sudan with that in Benin, a low-income country, which administeredthe same reading component to students also in grade 5, and again, Sin-gapore. Similar to mathematics, the results for reading show that testedstudents in northern Sudan performed significantly worse compared withstudents in Singapore. But relative to students in Benin, the students innorthern Sudan performed better on average. Overall, student perform-ance on the reading assessment is weak and shows low learning levels.
STUDENT PERFORMANCE AND INDIVIDUAL CHARACTERISTICS
Examining student scores on the learning assessment by gender, we seethat girls, on average, perform significantly better than boys, and thestronger performance of girls is more pronounced in reading than inmathematics (table 5.14). That girls perform better than boys (when
Table 5.14 Average Student Learning Assessment Scores, by Gender,2009 percent
State/gender
Student learning assessment scores
Mathematics Reading
Kassala
Boys 43 51
Girls 47 54
North Kordofan
Boys 30 29
Girls 32 33
River Nile
Boys 38 43
Girls 40 48
Three-state average
Boys 35 38
Girls 37 41
Source: Service delivery survey.Note: The maximum score is 100 percent (all questions answered correctly).

Service Delivery and Learning Outcomes in Basic Schools in Three States • 125
they have equal access to education) is a general finding across bothdeveloping and developed countries and is generally linked to attitudestoward learning (EFA 2006).
To capture the relative wealth of the assessed students’ families, anasset index was constructed based on the students’ responses to which ofthe following assets were present in their homes: refrigerator, electricity,tap water, TV, radio, computer, mobile phone, gas or electric cooker, andcar.11 Figure 5.4 shows the average student scores on the mathematicsand reading components of the learning assessment by wealth as meas-ured by the asset index. For both components, students among the rich-est 20 percent performed better on average than students in the middle60 percent, who in turn performed better than students among the poor-est 20 percent. That is, students from richer households on average tendto perform better in both mathematics and reading than students frompoorer households.
Another main determinant of student learning is parents’ education.Average student mathematics and reading scores and the education levelof fathers are presented in figure 5.5.12 On average, students whose fathershave completed higher education scored better on both the mathematicsand reading components, but there is no significant difference in per-formance between students whose fathers have some or have completedbasic education and those whose fathers have completed secondary edu-cation, except in River Nile State. The results for mothers’ education levelare highly similar to those for fathers’ education level, so they are notshown here.13
Thus, in line with existing studies on learning achievement, the SDSfindings indicate that family background variables such as wealth andparental education and household characteristics including location arerelated to student learning outcomes.
SECONDARY EDUCATION EXAMINATION RESULTS
This final section of the chapter provides only a brief overview of passrates for secondary school examinations (which leads to the Sudan Sec-ondary School Certificate) because UNESCO and UNICEF are currentlyconducting a study on secondary education in northern Sudan. Theirresults should be able to complement these findings and enable furtheranalysis of this subsector.
The total number of candidates from general, vocational, and religioussecondary schools sitting for the Secondary School Certificate examinationsincreased from about 260,000 in 2004 to 363,000 in 2008 (BoSE 2009). In

126 • The Status of the Education Sector in Sudan
a. Mathematics
state
state
43%
30%
36%
46%
31%
37%
48%
32%
42%
0
5
10
15
20
25
30
35
40
45
50
Kassala
North K
ordofa
n
River N
ile
Kassala
North K
ordofa
n
River N
ile
aver
age
stud
ent
scor
e (p
erce
nt)
aver
age
stud
ent
scor
e (p
erce
nt)
b. Reading
52%
28%
33%
50%
31%
42%
60%
38%
51%
0
10
20
30
40
50
60
70
poorest 20% middle 60% richest 20%
Figure 5.4 Average Student Performance in Mathematics and Reading, by Household Wealth, 2009
Source: Service delivery survey.
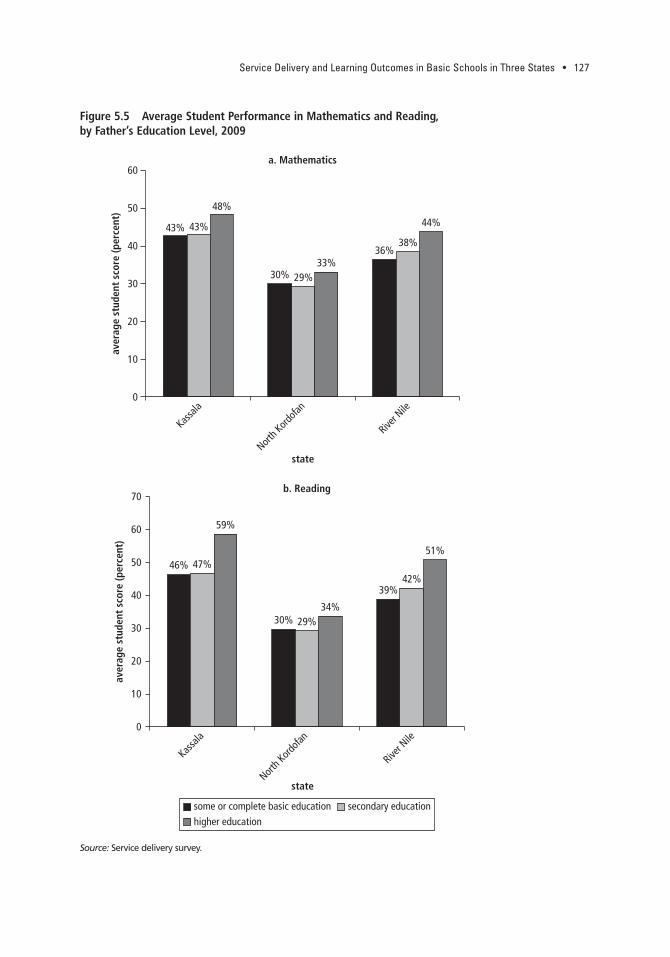
Service Delivery and Learning Outcomes in Basic Schools in Three States • 127
a. Mathematics
b. Reading
43%
30%
36%
43%
29%
38%
48%
33%
44%
0
state
state
10
20
30
40
50
60
Kassala
North K
ordofa
n
River N
ile
Kassala
North K
ordofa
n
River N
ile
aver
age
stud
ent
scor
e (p
erce
nt)
46%
30%
39%
47%
29%
42%
59%
34%
51%
0
10
20
30
40
50
60
70
aver
age
stud
ent
scor
e (p
erce
nt)
some or complete basic education secondary educationhigher education
Figure 5.5 Average Student Performance in Mathematics and Reading, by Father’s Education Level, 2009
Source: Service delivery survey.

128 • The Status of the Education Sector in Sudan
2008, 39 percent of the students came from public schools, 21 percent fromprivate schools, 29 percent from Teachers’ Union programs, and 11 percentwere “informal” candidates (table 5.15).
On average, girls performed better than boys on the examinations.Close to 74 percent of girls passed, compared with 69 percent of boys(BoSE 2009). The average national pass rate was 74–75 percent for stu-dents from public and private schools and for informal candidates, com-pared with 65 percent for students from Teachers’ Union programs, a pat-tern that has remained stable since 2004 (BoSE 2009). The lower averagepass rate for students from Teachers’ Union programs is primarily theresult of the role served by these schools.14 They tend to cater to studentswho want to repeat the final grade of the secondary cycle in order toimprove their results on the Secondary School Certificate examinationand to students who previously failed the examinations while attendingone of the other types of schools.15
Table 5.15 Pass Rates for Secondary School Examinations in Northern Sudan, by School Type and State, 2008
State
School type
Public PrivateTeachers’
Union Informal
Blue Nile 56 75 59 60
Al Qadarif 73 76 69 78
Al Jazirah 76 80 74 87
Kassala 84 64 52 79
Khartoum 84 75 62 69
Northern Darfur 59 83 63 67
North Kordofan 71 76 49 67
Northern 93 75 66 72
Red Sea 62 81 60 66
River Nile 92 84 63 75
Sinnar 76 73 69 81
Southern Darfur 55 62 67 70
South Kordofan 50 63 57 67
Western Darfur 53 65 60 56
White Nile 74 81 65 76
Average 70 74 62 71
Number of candidates 127,459 70,008 102,578 33,183
Source: BoSE 2009.

Service Delivery and Learning Outcomes in Basic Schools in Three States • 129
Students from Kassala and River Nile who attended public schoolshave, on average, higher pass rates than the national average, whereas stu-dents from public schools in North Kordofan have pass rates below thenational average. In particular, in Kassala and River Nile, pass rates for stu-dents from public schools were 84 percent and 92 percent, respectively,compared with 64 percent and 84 percent, respectively, for students fromprivate schools. By contrast, in North Kordofan, students from privateschools had higher average pass rates than did students from publicschools, 76 percent compared with 71 percent, respectively. This findinglends further support to the result from the SDS that students in Kassalaand River Nile performed better, on average, than students from NorthKordofan on the grade 5 learning assessment.
In most states, when pass rates for students from public schools arelow (below average), pass rates for private school students are relativelyhigh, and conversely, when public pass rates are high, private school passrates tend to be lower. This pattern may be an indication that privateschools serve to meet the demand for an education that will enable stu-dents to pass the Secondary School Certificate examinations when publicschools fail to do so.
SUMMARY
Based on the data collected by the SDS (2009), student learning levelsin the sample schools in Kassala, North Kordofan, and River Nile statesare generally low. The findings also highlight the lack of resources inmany basic schools and room for improvement in how resources aremanaged. The results also indicate that family background variables,such as wealth and parental education, are related to student learningoutcomes in line with existing evidence. The main findings of the SDSare summarized as follows:
• Classroom resources were generally scarce, with shortages of text-books, desks, and functional chalkboards in many of the sampleschools.
• Textbooks are meant to be provided by the government, but a largeshare of students in the sample schools did not have textbooks evenafter education councils purchased them to make up for the shortfalls.
• The chalkboard is one of the most important teaching tools, espe-cially given the shortage of textbooks, and most observed classroomshad chalkboards; however, in many cases, they were not in usablecondition.

130 • The Status of the Education Sector in Sudan
• Many students did not have desks, but instead sat on chairs withoutdesks or on the ground, particularly in rural sample schools.
• Most students in all three states had learning materials, such as note-books and pens/pencils. In many of the sample schools, educationcouncils provided support for these learning materials.
• Syllabus coverage was low in many of the sample schools, which tendsto have adverse consequences for student learning.
• Despite the relatively low average student-teacher ratios in the threestates, a substantial share of sample schools had large class sizes, whichcan also affect student-teacher contact time.
• Student learning outcomes as measured by the learning assessment formathematics and reading were generally poor in the sample schools inall three states.
• Girls performed significantly better on both the mathematics andreading learning assessments than did boys, and both boys and girlstended to do better on reading.
• Students from richer households and whose fathers had completedtertiary education relative to basic or secondary education performedbetter on the learning assessments, which indicates the importance ofhousehold and family background for student performance, in addi-tion to school and classroom environment.
ANNEX: PROBABILITY OF STILL BEING IN SCHOOL BY GRADE 8
Table 5A.1 Logistic Regression Results: Probability of Still Being in School byGrade 8, by Location, Income, and Gender, circa 2005
Dependent variableProbability of still being in
school by grade 8 (retention)
Constant –0.2299
Boy 0.0313***
Urban 0.786***
Wealth quintile 2 and 3 (second-poorest and middle quintile) –0.1469***
Wealth quintile 4 and 5 (richest two quintiles) 0.00328***
Memo items:
Age group
Number of observations
“R2” (Sommer’D statistic)
Ages 15–19
6,950
0.20
Source: Authors’ analysis of the 2006 Sudan Household Health Survey (GoNU and GoSS 2006). Note: These data apply to those students who have attended grade 1.***Statistically significant at the 1% level.

Service Delivery and Learning Outcomes in Basic Schools in Three States • 131
NOTES 1. The SDS collected a large amount of data. This chapter presents a subset of
these data, which are considered highly relevant for student learning outcomesand service delivery in basic education schools in the three states.
2. The 2008 baseline survey on basic education in the northern states ofSudan (FMoGE 2008) surveyed all 15 states, and the main findings of that surveyare corroborated and complemented by the findings of the SDS (2009).
3. A total of 3,900 students were interviewed and tested, but 7 were removedbecause of incorrect student identifiers.
4. Peri-urban and rural schools are similarly resource constrained, but peri-urban schools tend to be larger than rural schools. The number of peri-urbanschools in the sample is too small for these to be analyzed separately in a mean-ingful way.
5. This chapter does not deal with the quality of instruction time.6. This is the case unless schools compensate for lost time.7. This finding is not affected by taking into account schools that report that
they are closed two months or more per year because of inaccessibility.8. The SDS (2009) did not assess whether the records shown were up-to-date
or complete.9. The same test was used to assess learning achievements of grade 5 students
in Benin.10. On the mathematics component, 25 of 30 questions had four answer
options and the rest of the questions had five answer options. On the readingcomponent, all questions had four answer options.
11. For the construction of the asset index, each of the nine assets was assigneda weight equal to the fraction of students who owned the asset. If a student’s homehad none of the nine assets, then the asset index was zero.
12. Of the 3,893 students, 66 percent responded to the questions on theirfather’s education level; therefore, the results should be interpreted with somecaution. A larger share of students responded to the question in North Kordofan(77 percent) than in Kassala (62 percent) and River Nile (57 percent).
13. Fewer students answered the question on their mother’s education levelthan on their father’s education level; therefore, the results on father’s educationare presented.
14. Six percent of all students in secondary education are enrolled in Teachers’Union programs (see chapter 2, on enrollment).
15. It is estimated that about 40 percent of all repeaters in the secondary cycleattend Teachers’ Union programs (see chapter 3, on student flow).
REFERENCES BoSE (Board of Sudan Examinations). 2009. “General Results for 2008 Second-
ary School Examinations.” Khartoum: Republic of Sudan Board of SudanExaminations.
Case, Anne, and Angus Deaton. 1999. “School Inputs and Educational Outcomesin South Africa.” Quarterly Journal of Economics 114 (3): F1047–84.
Das, Jishnu, Stefan Dercon, James Habyarimana, and Pramila Krishnan. 2007.“Teacher Shocks and Student Learning: Evidence from Zambia.” Journal ofHuman Resources 42: 820–62.
EFA (Education for All). 2006. EFA Global Monitoring Report 2006. Literacy for Life.Paris: United Nations Educational, Scientific, and Cultural Organization.Available at http://unesdoc.unesco.org/images/0014/001416/141639e.pdf
EU (European Union). 2008. Cost and Financing Study. European Union. FMoGE (Federal Ministry of General Education). 2008. “Baseline Survey on
Basic Education in the Northern States of Sudan: Final Report June 2008.”Khartoum.
———. Various years. “Statistical Yearbooks.” KhartoumGlewwe, Paul, and Hanan Jacoby. 1994. “Student Achievement and Schooling
Choice in Low-Income Countries: Evidence from Ghana.” The Journal ofHuman Resources 29(3): 843–64.
GoNU (Government of National Unity) and GoSS (Government of SouthernSudan). 2006. Sudan Household Health Survey (SHHS) 2006. Khartoum/Juba:Central Bureau of Statistics and Southern Sudan Center for Census, Statistics,and Evaluation.
IAEEA (International Association for the Evaluation of Educational Attainment).2008. “Report from Test Administration in Benin.” IAEEA, Hamburg, Germany.
Mingat, A., and K. Majgaard. 2010. Education in Sub-Saharan Africa: A ComparativeAnalysis. Washington, DC: World Bank.
UNESCO (United Nations Educational, Scientific, and Cultural Organization).2007. Education Counts: Benchmarking Progress in 19 WEI Countries: World Education Indicators. Paris: UNESCO.
132 • The Status of the Education Sector in Sudan

133
CHAPTER
Teachers
This chapter provides an overview of the status of teachers in northernSudan. The first section profiles teachers and includes total numbers,types of teachers, gender, qualifications, and training. Next is a descrip-
tion of how teachers are recruited, deployed, and utilized. The chapter thenexamines teacher supervision, including school record keeping of time andattendance. Information is provided on teacher remuneration and incen-tives before the chapter ends with a summary of the main conclusions. Thethree sources of data for this chapter are (a) the federal Ministry of GeneralEducation (FMoGE) statistical yearbooks for 2000–09; (b) data collectedfrom state visits (excluding the two Darfur states); and (c) the service deliv-ery survey (SDS) conducted in Kassala, North Kordofan, and River Nilestates in 2009, which was referred to in chapter 5.
PROFILE OF TEACHERS IN NORTHERN SUDAN
The performance of teachers is one of the most important determinantsof student learning outcomes. Evidence shows that students of betterteachers consistently achieve better learning outcomes (Hanushek andothers 2003; Rivkin, Hanushek, and Kain 2005; Vegas and Umansky2005). Given this fact, the effective functioning of the system for manag-ing teachers in terms of recruitment, deployment, utilization, remunera-tion, and supervision is critical to the efficiency and performance of theeducation sector.
NUMBERS OF TEACHERS
A total of 94 percent of public education sector staff in 13 states of north-ern Sudan are school based. Teachers constitute the main staff category
6

134 • The Status of the Education Sector in Sudan
across all levels of education, but there are also nonteaching staff, such asadministrators and inspectors, as well as drivers, guards, and janitors.To provide a complete picture, table 6.1 includes the numbers for allstaff categories in the public education system in the 13 states. In total,there are 216,824 education staff on the government’s payroll and17,458 national service, or volunteer, teachers.1
The composition of education staff differs across education levels. Atthe preschool level, government teachers account for 62 percent of totalstaff, and national service and volunteer teachers account for 33 percent(figure 6.1). Literacy programs have an ever-larger share of national serv-ice and volunteer teachers (64 percent), with government teachersaccounting for only 27 percent of total staff.
In basic education, by contrast, government teachers account for 80percent of all staff. Government nonteaching staff constitute 12 percentof all staff, whereas non-school-based staff and national service and vol-unteer teachers compose 4 percent each. Similarly, at the secondarylevel, 4 percent of staff are national service and volunteer teachers, and6 percent are non–school-based staff. Government teachers are thelargest group (63 percent), followed by government nonteaching staff(27 percent).
GENDER
The teaching profession for basic education in northern Sudan com-prises mainly female teachers, who account for roughly two-thirds of
Table 6.1 Numbers of Education Staff in Northern Sudan, by Education Level, 2009
Educationlevel
School based
Total educationstaff on
governmentpayroll
(a)+(b)+(c)
(a) Centraland
decentralizededucation
staff
(b) Govern-ment
nonteachingstaff
(c) Govern-ment
teachers
(d) Nationalservice andvolunteerteachers
Total teachers (c) + (d)
Preschool 9,592 444 327 8,821 4,196 13,017
Basic 153,010 8,415 18,486 126,109 5,388 131,497
Secondary 50,857 3,790 13,515 33,552 1,964 35,516
Literacy programs 3,365 756 110 2,499 5,910 8,409
Total 216,824 13,405 32,438 170,981 17,458 188,439
Source: FMoGE 2008–09 statistical yearbook; state visits. Note: Southern Darfur and Western Darfur are not included.

Teachers • 135
the workforce (67 percent), as shown in figure 6.2. Female teachers con-stitute more than 60 percent of teachers in most states. The exceptionsare South Kordofan, which has an equal number of male and femaleteachers, and Western Darfur and Northern Darfur, which have 54 per-cent and 57 percent female teachers, respectively. This finding couldindicate that the teaching profession, at least with regard to basic edu-cation, is not as attractive to men as to women; men may find betterearning opportunities in other professions. For women, however, theteaching profession seems to be quite attractive. Research shows that thepresence of more female teachers in schools has a positive influence onattracting girls to schools.
In secondary education, female teachers constitute 56 percent of theteaching workforce in northern Sudan, as shown in figure 6.3. Somepotential reasons why secondary education, compared with basic educa-tion, is able to attract more male teachers are the following: (a) averagesalaries for government secondary education teachers are higher thanthose for basic education and are possibly more competitive with otherprofessions; and (b) fewer female teachers may be qualified to teach sec-ondary education.2 Interestingly, all three Darfur states have fewer femalethan male secondary education teachers (40 percent female secondaryteachers in Northern Darfur, 33 percent female in Southern Darfur, and22 percent female in Western Darfur). Al Qadarif and South Kordofanalso have fewer female than male secondary education teachers, with 48 percent and 42 percent female teachers, respectively.
4% 6% 8%3% 12%27%
1%
62%
80%63%
27%
33%
4% 4%
64%
010203040pe
rcen
t
5060708090
100
preschool basiceducation level
secondary literacy program
central and decentralized education staff government nonteaching staffgovernment teachers national service and volunteer teachers
3%
Figure 6.1 Types of Staff in Northern Sudan, by Education Level, 2009
Source: Staff estimates based on state data.

136 • The Status of the Education Sector in Sudan
71%
Blue N
ile
Al Qad
arif
Al Jazir
ah
Kassala
Kharto
um
Northe
rn Darf
ur
North K
ordofa
n
Northe
rn
Red Se
a
River N
ile
South
ern Darf
ur
South
Kordofa
nSin
nar
Western
Darfur
White N
ile
north
ern Su
dan
62%73% 66%
state
perc
ent
67%57%
69% 69% 65% 71%61%
50%63%
54%
75%67%
29%38%
27%34% 33%
43%31% 31% 35% 29%
39%50%
37%46%
25%33%
0
10
20
30
40
50
60
70
80
90
100
female male
Figure 6.2 Percentage of Female and Male Teachers in Basic Education in Northern Sudan, by State, 2009
Source: FMoGE 2008–09 statistical yearbook.
54% 48%62% 64% 57%
40%53%
67% 61%
state
65%
33%42%
59%
22%
52% 56%
46% 52%38% 36% 43%
60%47%
33% 39% 35%
67%58%
41%
78%
48% 44%
0
20
40
60
80
100
perc
ent
Blue N
ile
Al Qad
arif
Al Jazir
ah
Kassala
Kharto
um
Northe
rn Darf
ur
North K
ordofa
n
Northe
rn
Red Se
a
River N
ile
South
ern Darf
ur
South
Kordofa
nSin
nar
Western
Darfur
White N
ile
north
ern Su
dan
female male
Figure 6.3 Percentage of Female and Male Teachers in Secondary Education in Northern Sudan, by State, 2009
Source: FMoGE 2008–09 statistical yearbook.
Teachers • 137
TEACHER QUALIFICATIONS AND TRAINING
In 1993, the preservice qualification for basic education teachers wasrevised from a two-year teaching diploma to a four-year bachelor of edu-cation (B.Ed.) degree. The two-year diploma course was offered by a net-work of 73 in-service education training institutes (ISETI) across northernSudan. Teachers attended the institutes one day per week and taught inthe schools for the remainder of the work week. Funding for the ISETIdiploma ceased in 1993, and the staff of the larger training institutes wereabsorbed into the universities as faculties of education, which would ulti-mately be responsible for qualifying basic education teachers through theB.Ed. degree.
The preservice qualification for a secondary school teacher in northernSudan is a four-year bachelor of education (B.Ed.) degree offered by fac-ulties of education in universities. These faculties are responsible fordeveloping both the content of the training and the accreditation processfor teachers in secondary schools.
As part the education sector reform in 1993, responsibility for preserviceteacher training was transferred from the Ministry of General Education(MoGE) to the Ministry of Higher Education and Scientific Research(MoHESR). At the time, few students were enrolling in the B.Ed. degree pro-gram, and even fewer were successfully graduating and eventually teaching.This situation may have occurred because teachers were still being hiredregardless of whether they had a B.Ed. In addition, the relatively high costto students (both fees and opportunity costs) resulted in low numbersenrolling and eventually teaching (UNICEF 2008). In 2003, the SudanOpen University (SOU) introduced a partial B.Ed. degree course for teach-ers who were in service and had no B.Ed. The SOU also introduced a one-year diploma in education for graduates of other disciplines. By 2004, theMoGE stopped funding teachers through faculties of education and fundedthem solely through the SOU.
In 2008, it was estimated that only 10 percent of basic educationteachers were officially qualified, though these numbers have presumablyincreased since the graduation of three years of B.Ed. students, from2008 through 2010 (UNICEF 2008). Assuming that 75 percent of theteachers admitted completed the course, the estimated number whowould have graduated with a B.Ed. from the SOU by the end of 2010 is alittle over 56,000 (see table 6.2), which is about 31 percent of the totalnumber of teachers in northern Sudan and does not include those whoalready had a B.Ed. from the faculties of education.

138 • The Status of the Education Sector in Sudan
The 2008–09 FMoGE statistical yearbook does not capture the num-ber of teachers who are qualified according to the B.Ed. requirement,though it does disaggregate teachers by those who received educationtraining (through the ISETI diploma, Sudan Open Learning OrganizationTeacher Assistance Course, or the B.Ed.), who are considered trained, andthose who did not receive any teacher training, who are considereduntrained.3 It should be noted that untrained teachers could include indi-viduals who have a university degree that is not focused on education, forexample, a bachelor or master of science.
As figure 6.4 illustrates, 38 percent of the teachers in northern Sudanhad not received any formal education training in 2009. Only a subset ofthose classified as trained had earned the prerequisite B.Ed. degree.Notably, 82 percent of the teachers in Western Darfur were consideredtrained, though it is not known what percentage of these teachers had theminimum requirement of the B.Ed. degree. Blue Nile had the highest per-centage of untrained teachers (73 percent), while Al Qadarif, Kassala, andSouthern Darfur had approximately 50 percent untrained teachers.
Figure 6.5 shows the academic qualifications and preservice trainingof the 819 full-time government teachers in service delivery survey.Across the three states studied (Kassala, North Kordofan, and River Nile),the most common qualifications and training were the following: com-pletion of secondary school only, 7–38 percent; attainment of a bache-lor of arts (B.A.) or bachelor of science degree (B.Sc.), 11–26 percent; andattainment of a B.A. or B.Sc. degree and a B.Ed. degree, 9–37 percent.There were some differences across regular teachers in rural and urbanschools. Two general observations are worth noting. First, there is an ageeffect: older teachers, who were trained before the new B.Ed. policy wasintroduced, did not have a B.Ed. (unless they had gone back to a univer-sity). Second, in the sample, it was primarily regular teachers with a B.A.or B.Sc. who also had a B.Ed.
Table 6.2 Sudan Open University Bachelor of Education Degree Output, 2008–12
Year of intake Number admitted Number or estimated number due to
graduate (year of graduation)
2003 6,006 4,547 (2008)
2004 14,645 10,984 (2009)
2005 53,983 40,487 (2010)
2006 15,560 11,670 (2011)
2007 8,379 6,284 (2012)
Source: FMoGE 2008.

Teachers • 139
27%
50%
83%
47%57% 61%
51% 58%
state
67% 71%
49% 57% 52%
82%71%
62%
73%
50%
17%
53%43% 39%
49% 42%33% 29%
51% 43% 48%
18%29%
38%
0
20
40
60
80
100
perc
ent
Blue N
ile
Al Qad
arif
Al Jazir
ah
Kassala
Kharto
um
Northe
rn Darf
ur
North K
ordofa
n
Northe
rn
Red Se
a
River N
ile
South
ern Darf
ur
South
Kordofa
nSin
nar
Western
Darfur
White N
ile
north
ern Su
dan
trained untrained
Figure 6.4 Percentage of Trained and Untrained Teachers in Northern Sudan, by State, 2009
Source: FMoGE 2008–09 statistical yearbook.
0
5
10
15
20
25
30
35
40
academicdiploma
secondary B.A./B.Sc. academicand
teachingdiploma
secondaryand
teachingdiploma
qualifications and training
B.A./B.Sc.and
teachingdiploma
secondaryand
B.Ed.
B.A./B.Sc.and B.Ed.
other
% o
f reg
ular
tea
cher
s
Kassala North Kordofan River Nile
Figure 6.5 Full-Time Government Teachers’ Academic Qualifications and Preservice Training in Kassala, North Kordofan, and River Nile States, 2009
Source: Service delivery survey.Note: The number of regular teachers in the service delivery survey was 819.

140 • The Status of the Education Sector in Sudan
It appears that the opportunities for additional qualifications had pri-marily been provided to teachers who had already earned a universitydegree. This situation begs the questions, What professional developmentopportunities are available for teachers with less than a university degree(for example, those with a secondary education or those with an aca-demic diploma), and can the education system sustain training, hiring,and retaining teachers with a high level of qualifications in the short tomedium term?
Although funding from the government for ISETIs was severelyreduced after the 1993 reforms, ISETI headquarters in the FMoGE and itsstate branches continue to organize in-service training courses. Apart fromthe 36-day certificate course, training courses are generally between 3 and14 days and focus on informing teachers about curricula changes, as wellas specific subjects. The responsibility for funding in-service training isdecentralized to the states, but the United Nations Children’s Fund(UNICEF) and the multidonor-financed Basic Education Project makesignificant contributions in this regard.
TEACHER RECRUITMENT, DEPLOYMENT, AND TRANSFER
In northern Sudan, the process of forecasting teacher requirements(regular, full-time, government school teachers) is based on assess-ments of the situation in each school and the level of financing avail-able. The service delivery survey in Kassala, North Kordofan, and RiverNile found that head teachers were requested to assess the need foradditional teachers in their own schools and to submit a request to thelocal government for basic education schools and to the state govern-ment for secondary schools. Based on these requests and the availabil-ity of funding, a committee comprising state and local representativesconducted annual reviews to determine the number of new recruits.Decisions on transfers were made by the same committees during theannual meeting.
The recruitment and transfer of teachers for secondary education isthe responsibility of the state government. However, these tasks for basiceducation are the responsibility of either the state or the local govern-ment, and the decision as to which one depends on the capacity of thelocal government as well the state’s willingness to devolve responsibilityto the locality. The recruitment of volunteer teachers is the responsibilityof the education council because the council covers the costs for theseteachers. Although information on the number of volunteer teachers is
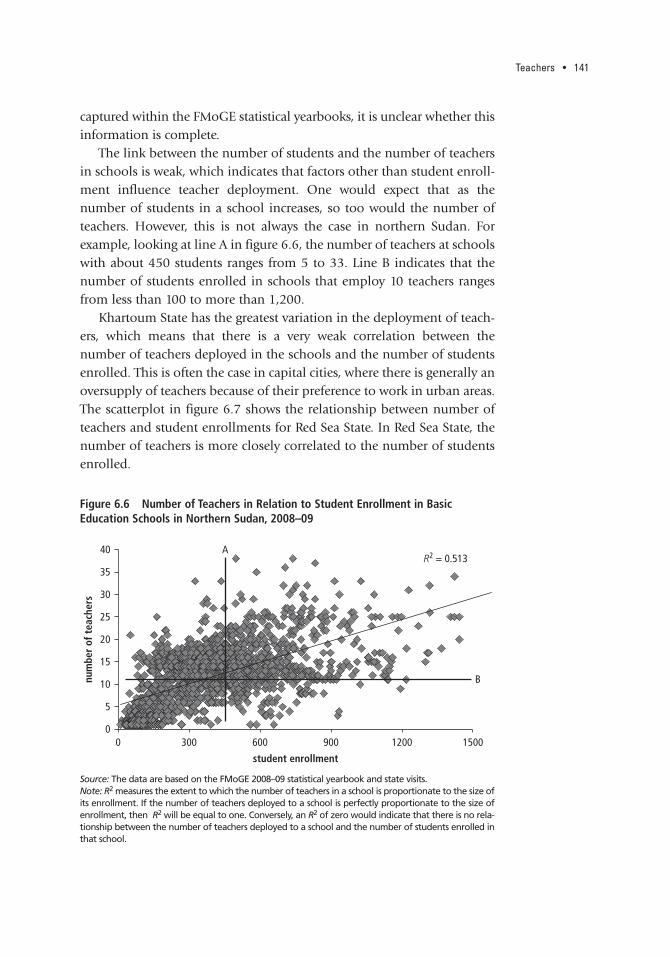
Teachers • 141
captured within the FMoGE statistical yearbooks, it is unclear whether thisinformation is complete.
The link between the number of students and the number of teachersin schools is weak, which indicates that factors other than student enroll-ment influence teacher deployment. One would expect that as the number of students in a school increases, so too would the number ofteachers. However, this is not always the case in northern Sudan. Forexample, looking at line A in figure 6.6, the number of teachers at schoolswith about 450 students ranges from 5 to 33. Line B indicates that thenumber of students enrolled in schools that employ 10 teachers rangesfrom less than 100 to more than 1,200.
Khartoum State has the greatest variation in the deployment of teach-ers, which means that there is a very weak correlation between the number of teachers deployed in the schools and the number of studentsenrolled. This is often the case in capital cities, where there is generally anoversupply of teachers because of their preference to work in urban areas.The scatterplot in figure 6.7 shows the relationship between number ofteachers and student enrollments for Red Sea State. In Red Sea State, thenumber of teachers is more closely correlated to the number of studentsenrolled.
R2 = 0.513
0
5
10
15
20
25
30
35
40
0 300 600 900 1200 1500
num
ber
of t
each
ers
student enrollment
A
B
Figure 6.6 Number of Teachers in Relation to Student Enrollment in Basic Education Schools in Northern Sudan, 2008–09
Source: The data are based on the FMoGE 2008–09 statistical yearbook and state visits.Note: R2 measures the extent to which the number of teachers in a school is proportionate to the size ofits enrollment. If the number of teachers deployed to a school is perfectly proportionate to the size ofenrollment, then R2 will be equal to one. Conversely, an R2 of zero would indicate that there is no rela-tionship between the number of teachers deployed to a school and the number of students enrolled inthat school.
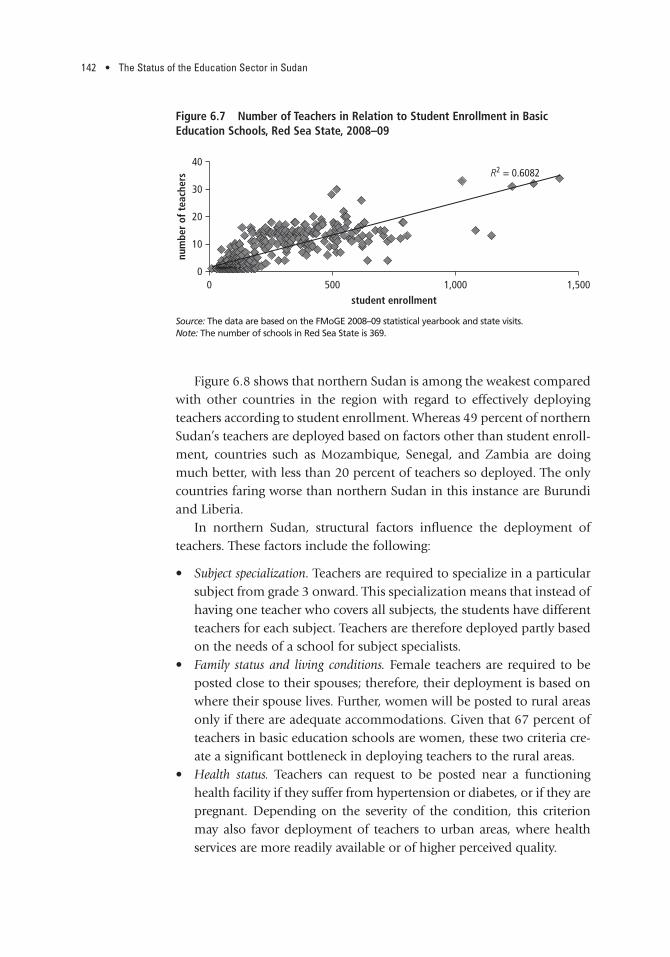
142 • The Status of the Education Sector in Sudan
Figure 6.8 shows that northern Sudan is among the weakest comparedwith other countries in the region with regard to effectively deployingteachers according to student enrollment. Whereas 49 percent of northernSudan’s teachers are deployed based on factors other than student enroll-ment, countries such as Mozambique, Senegal, and Zambia are doingmuch better, with less than 20 percent of teachers so deployed. The onlycountries faring worse than northern Sudan in this instance are Burundiand Liberia.
In northern Sudan, structural factors influence the deployment ofteachers. These factors include the following:
• Subject specialization. Teachers are required to specialize in a particularsubject from grade 3 onward. This specialization means that instead ofhaving one teacher who covers all subjects, the students have differentteachers for each subject. Teachers are therefore deployed partly basedon the needs of a school for subject specialists.
• Family status and living conditions. Female teachers are required to beposted close to their spouses; therefore, their deployment is based onwhere their spouse lives. Further, women will be posted to rural areasonly if there are adequate accommodations. Given that 67 percent ofteachers in basic education schools are women, these two criteria cre-ate a significant bottleneck in deploying teachers to the rural areas.
• Health status. Teachers can request to be posted near a functioninghealth facility if they suffer from hypertension or diabetes, or if they arepregnant. Depending on the severity of the condition, this criterionmay also favor deployment of teachers to urban areas, where healthservices are more readily available or of higher perceived quality.
R2 = 0.6082
0
10
20
30
40
0 500 1,000 1,500
num
ber
of t
each
ers
student enrollment
Figure 6.7 Number of Teachers in Relation to Student Enrollment in Basic Education Schools, Red Sea State, 2008–09
Source: The data are based on the FMoGE 2008–09 statistical yearbook and state visits.Note: The number of schools in Red Sea State is 369.

0
São T
omé a
nd Pr
íncipe
Guinea
Mozam
bique
Namibi
aLe
sotho Nige
rSe
nega
l
Guinea
-Bissau
Zambia
Rwanda
Burkina
Faso
Maurita
nia
Centra
l Afric
an Rep
ublic
Gabon Mali
Madag
ascar
Ghana
Ethiop
iaSie
rra Le
one
Côte d’
Ivoire
Chad
Ugand
aTo
goCon
go, R
ep.
Benin
Congo
, Dem
. Rep
.Mala
wiCam
eroon
Burund
iLib
eria
north
ern Su
dan
10
country
perc
ent
20
30
40
50
60
Figure 6.8 International Comparisons: Randomness in Teacher Allocations in Basic Education, by Country
Source: The data are compiled from various World Bank country status reports.
143

144 • The Status of the Education Sector in Sudan
• Decentralization of deployment decisions. The decentralization of recruit-ment and transfer decisions to the state and local levels makes thedeployment of teachers across states difficult to implement. This isbecause the federal level is not part of the informal review meetings ofthe committees at the state level, so there is no formal mechanism tocoordinate transfers and recruitment across states.
TEACHER UTILIZATION
For basic education, the average student-teacher ratio (STR) in northernSudan is 34:1 (national service and volunteer teachers not included),though there is notable variation in STRs at the state level (see table 6.3and annex tables at the end of chapter 7). The Education for All Fast-TrackInitiative benchmark STR is 40:1 for basic education in Sub-SaharanAfrica, though STRs are not a good measure of the human resourcesinvestment in education for northern Sudan given that teachers are sub-ject specialists from grade 3 onward.
The average STR for preschool is 85:1 for northern Sudan, though thevariation across states is extremely large, ranging from 18:1 in NorthernState to 198:1 in Red Sea State. High STRs explain the reliance ofpreschools on national service and volunteer staff, both of which accountfor a third of all education staff within this subsector. For secondary edu-cation, the average student-teacher ratio is 16:1 for both the academic andthe technical tracks, with a small degree of variation across states (stan-dard deviations of 4 and 5 for the academic and the technical tracks,respectively).
STRs are not the same as class size. The relationship between STRsand average class size is affected by many factors including the num-ber of classes or students for whom a teacher is responsible, the num-ber of hours that a student attends class each day, the length of ateacher’s working day, the division of a teacher’s time between instruc-tion and noninstructional activities (that is, planning or preparinginstruction), and whether a school runs multiple shifts with the sameteachers (UNESCO 2007).
CLASS SIZE
The average class size for basic education in northern Sudan is approxi-mately 48 students per class, according to the FMoGE 2008–09 statisti-cal yearbooks. Available empirical studies show that class sizes withinthe range of 30–60 students per teacher have a relatively equal level of

Teachers • 145
student learning (Behaghel and Coustère 1999; Bernard 2003). Classeswith fewer than 30 students do tend to produce better learning outcomes,but such small class sizes are uncommon and financially unsustainablein most countries in Sub-Saharan Africa (World Bank forthcoming).Class sizes above 60 students, however, tend to have a negative impacton student learning.
Class sizes for basic education vary according to school type andgrade. Schools for internally displaced persons (IDPs) have an averageof 92 students per class, whereas village schools have an average of 30 students, and nomadic schools 33 students, per class (see table 6.4).The average class size also decreases in the higher grades, except in IDPand village schools. Within small schools, such as village and nomadicschools, which have correspondingly small class sizes, the practice ofsubject specialization by teachers is inefficient, and in many cases, it maynot be possible given the potentially insufficient numbers of teachers in
Table 6.3 Student-Teacher Ratios in Northern Sudan, by State, 2009
State
Student-teacher ratios
Preschool Basic
Secondary
Academic Technical
Northern 18 17 10 11
River Nile 175 22 13 10
Khartoum 15 30 16 21
Al Jazirah 25 30 17 16
Blue Nile 71 24 7 8
Sinnar 31 33 13 13
White Nile 75 30 17 18
North Kordofan 76 42 16 12
South Kordofan 153 39 22 26
Northern Darfur 60 47 18 14
Southern Darfur 64 44 20 15
Western Darfur 195 64 23 21
Red Sea 198 27 18 14
Kassala 76 31 14 23
Al Qadarif 47 38 16 14
Average 85 34 16 16
Standard deviation 63 12 4 5
Source: FMoGE 2008–09 statistical yearbook.
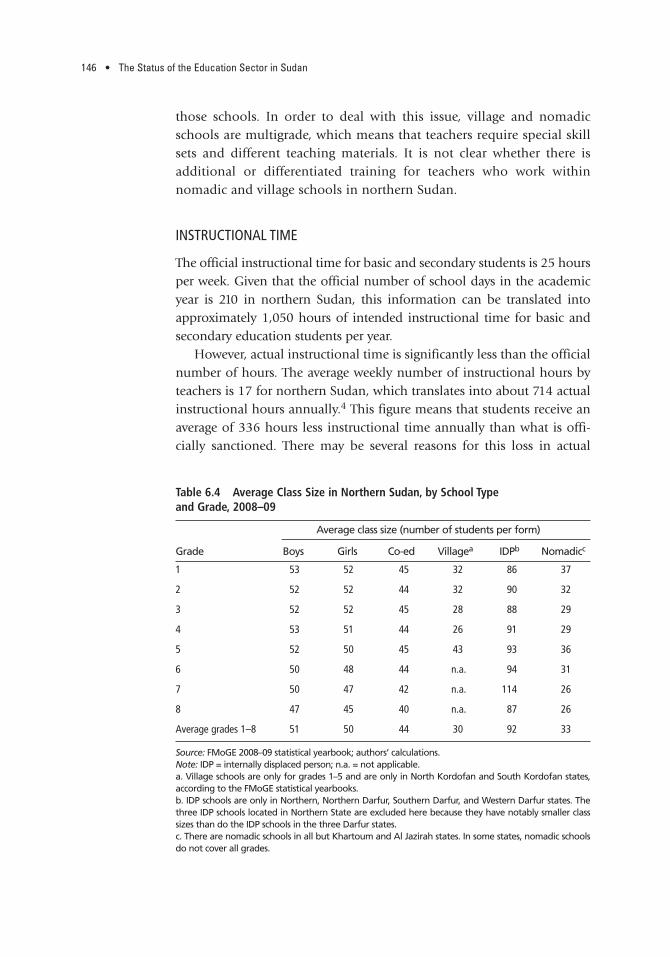
146 • The Status of the Education Sector in Sudan
those schools. In order to deal with this issue, village and nomadicschools are multigrade, which means that teachers require special skillsets and different teaching materials. It is not clear whether there isadditional or differentiated training for teachers who work withinnomadic and village schools in northern Sudan.
INSTRUCTIONAL TIME
The official instructional time for basic and secondary students is 25 hoursper week. Given that the official number of school days in the academicyear is 210 in northern Sudan, this information can be translated intoapproximately 1,050 hours of intended instructional time for basic andsecondary education students per year.
However, actual instructional time is significantly less than the officialnumber of hours. The average weekly number of instructional hours byteachers is 17 for northern Sudan, which translates into about 714 actualinstructional hours annually.4 This figure means that students receive anaverage of 336 hours less instructional time annually than what is offi-cially sanctioned. There may be several reasons for this loss in actual
Table 6.4 Average Class Size in Northern Sudan, by School Type and Grade, 2008–09
Grade
Average class size (number of students per form)
Boys Girls Co-ed Villagea IDPb Nomadicc
1 53 52 45 32 86 37
2 52 52 44 32 90 32
3 52 52 45 28 88 29
4 53 51 44 26 91 29
5 52 50 45 43 93 36
6 50 48 44 n.a. 94 31
7 50 47 42 n.a. 114 26
8 47 45 40 n.a. 87 26
Average grades 1–8 51 50 44 30 92 33
Source: FMoGE 2008–09 statistical yearbook; authors’ calculations.Note: IDP = internally displaced person; n.a. = not applicable. a. Village schools are only for grades 1–5 and are only in North Kordofan and South Kordofan states,according to the FMoGE statistical yearbooks.b. IDP schools are only in Northern, Northern Darfur, Southern Darfur, and Western Darfur states. Thethree IDP schools located in Northern State are excluded here because they have notably smaller classsizes than do the IDP schools in the three Darfur states.c. There are nomadic schools in all but Khartoum and Al Jazirah states. In some states, nomadic schoolsdo not cover all grades.
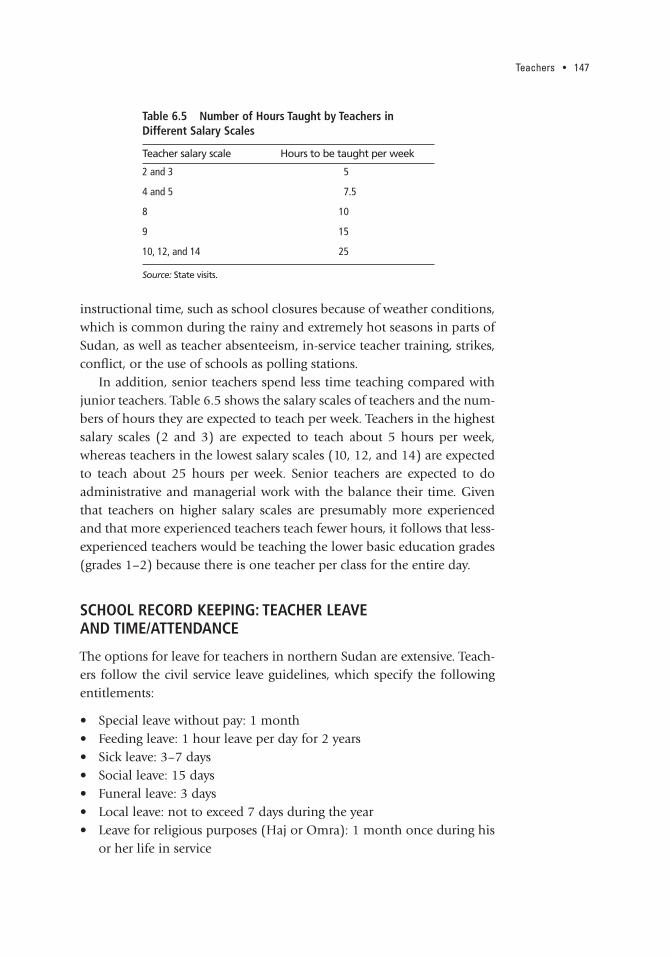
Teachers • 147
instructional time, such as school closures because of weather conditions,which is common during the rainy and extremely hot seasons in parts ofSudan, as well as teacher absenteeism, in-service teacher training, strikes,conflict, or the use of schools as polling stations.
In addition, senior teachers spend less time teaching compared withjunior teachers. Table 6.5 shows the salary scales of teachers and the num-bers of hours they are expected to teach per week. Teachers in the highestsalary scales (2 and 3) are expected to teach about 5 hours per week,whereas teachers in the lowest salary scales (10, 12, and 14) are expectedto teach about 25 hours per week. Senior teachers are expected to doadministrative and managerial work with the balance their time. Giventhat teachers on higher salary scales are presumably more experiencedand that more experienced teachers teach fewer hours, it follows that less-experienced teachers would be teaching the lower basic education grades(grades 1–2) because there is one teacher per class for the entire day.
SCHOOL RECORD KEEPING: TEACHER LEAVE AND TIME/ATTENDANCE
The options for leave for teachers in northern Sudan are extensive. Teach-ers follow the civil service leave guidelines, which specify the followingentitlements:
• Special leave without pay: 1 month• Feeding leave: 1 hour leave per day for 2 years • Sick leave: 3–7 days• Social leave: 15 days• Funeral leave: 3 days • Local leave: not to exceed 7 days during the year • Leave for religious purposes (Haj or Omra): 1 month once during his
or her life in service
Table 6.5 Number of Hours Taught by Teachers in Different Salary Scales
Teacher salary scale Hours to be taught per week
2 and 3 5
4 and 5 7.5
8 10
9 15
10, 12, and 14 25
Source: State visits.
148 • The Status of the Education Sector in Sudan
• Leave to represent northern Sudan in international conferences anddelegations: not to exceed the period stated
• Leave for union members for union activities: not to exceed 30days
• Maternity leave:1. 8 weeks with full pay at delivery 2. 1 year with basic salary 3. 2 years without pay, and it can be divided
• Widow leave: 1. 4 months and 10 days if not pregnant with full pay 2. If pregnant, will be given the 4 months and 10 days, and if she
delivers a baby before the end of the period, the leave will end andshe will be entitled to maternity leave
• Sick leave up to1. First 6 months with full pay2. Next 6 months with half pay (terms and conditions apply)
• Sick leave outside the country: case-by-case basis • Leave to accompany sick member of employee’s family: up to 90 days
with full pay; after which the employee can take leave without pay(terms and conditions apply)
• Work injury leave (terms and conditions apply): case-by-case basis
According to the service delivery survey, the average number of daystaken for personal leave (all types) by school for the six months priorto the survey was 30 in Kassala, 17 in North Kordofan, and 18 in RiverNile (figure 6.9). Within the personal leave category, the largest num-ber of days were taken for sick leave in all three states. Other reasonsfor personal leave included family illness, emergencies, and socialevents. The reported average official leave during six months in 2009was lower: 15 days in Kassala, 13 days in North Kordofan, and 6 daysin River Nile. For official leave, the most common reasons were the fol-lowing: training in Kassala and River Nile, and to collect salary inNorth Kordofan.
Many schools do not maintain adequate leave records, or any otherrecords, for teachers. Given the large number of leave days teachers aretaking, it is important that leave records are properly maintained toensure accountability. However the service delivery survey shows thatonly 37 percent of rural schools and 76 percent of urban schools inKassala kept leave records. In North Kordofan, 79 percent of rural and70 percent of urban schools were able to show their records on teacherleave, and in River Nile, the corresponding shares were 70 percent forrural schools and 68 percent for urban schools.

Teachers • 149
However, most rural and urban schools in Kassala and North Kordo-fan recorded when teachers arrived and departed, whereas less than halfof the rural schools in River Nile kept similar records (table 6.6). In RiverNile, a much smaller share of schools was required to keep such time and
2 1 2
10
2
7
2 2
0.2 0.41
4
0
2
4
6
8
10
12b. Official
15
5 5
purpose
purpose
5
10
32 2
10
2
4
2
0
2
4
6
8
10
12
14
16
sickn
ess
family
sickn
ess
emerg
ency
socia
l eve
nts
admini
strati
ve du
ties
colle
ct sal
ary
officia
l duti
es
traini
ng
num
ber
of d
ays
num
ber
of d
ays
a. Personal
Kassala North Kordofan River Nile
Figure 6.9 Average Number of Leave Days by Purpose over Six Months in Kassala, North Kordofan, and River Nile States, 2009
Source: Service delivery survey.Note: These data are based on the responses by the head teachers interviewed in each school.

150 • The Status of the Education Sector in Sudan
attendance records: 44–48 percent of urban schools and 74 percent ofrural schools required teachers to report their arrival and departure times.In line with this reporting requirement, 44 percent of urban schools and67 percent of rural schools in River Nile were able to present their teacherarrival/departure records.
TEACHER SUPERVISION
Management control and oversight are necessary to establish account-ability by teachers and thereby improve their performance. Realaccountability hinges on having well-defined standards and adequateinformation about performance in education provision to enable pol-icy makers and program administrators to improve service delivery(Lewis and Pettersson 2009). In northern Sudan, the ratio of regularteachers to inspectors is 36:1 for basic education and 41:1 for second-ary education (see data in table 6.7).
In northern Sudan, teachers are supervised by head teachers, educationcouncils, and local or state (depending on the available capacity) inspec-tors. However, supervision by the local or state inspectors is the mainavenue for promoting or disciplining teachers, though the inspectors seek
Table 6.6 School Record Keeping in Kassala, North Kordofan, and River NileStates State Averages, 2009 percent
Country/location
Schools able to show records of
Schools where teachers must report
Teacher leave
Teacher arrivals/
departures
When arriving at
school
When departing
school
Kassala
Urban 76 88 96 92
Rural 37 84 89 89
North Kordofan
Urban 70 96 98 98
Rural 79 95 100 98
River Nile
Urban 68 44 48 44
Rural 70 67 74 74
Source: Service delivery survey. Note: These data are based on the head teacher in each school showing the relevant records to the enumerator.
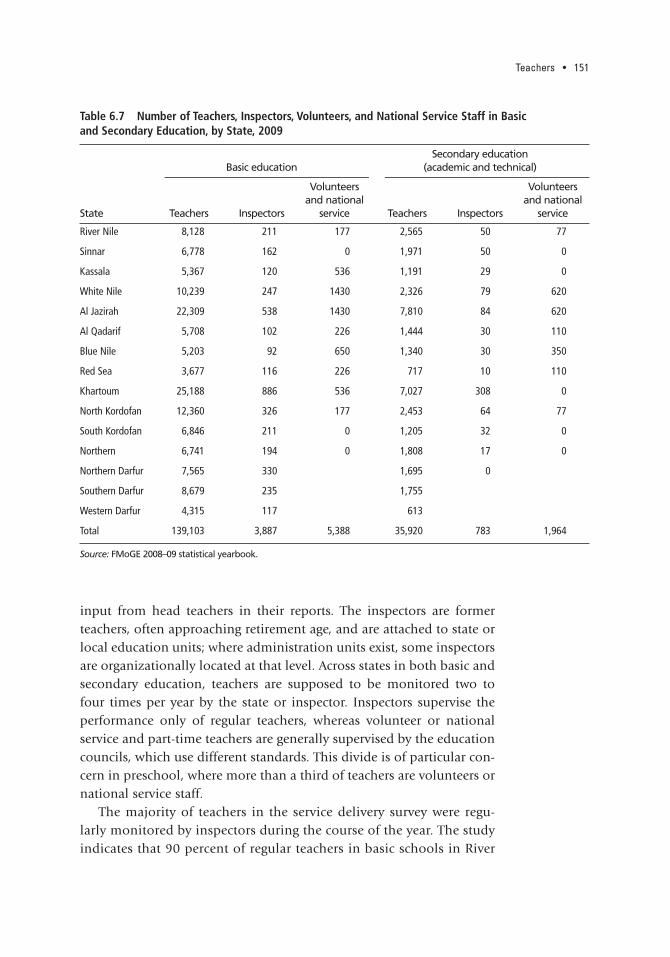
Teachers • 151
input from head teachers in their reports. The inspectors are formerteachers, often approaching retirement age, and are attached to state orlocal education units; where administration units exist, some inspectorsare organizationally located at that level. Across states in both basic andsecondary education, teachers are supposed to be monitored two tofour times per year by the state or inspector. Inspectors supervise theperformance only of regular teachers, whereas volunteer or nationalservice and part-time teachers are generally supervised by the educationcouncils, which use different standards. This divide is of particular con-cern in preschool, where more than a third of teachers are volunteers ornational service staff.
The majority of teachers in the service delivery survey were regu-larly monitored by inspectors during the course of the year. The studyindicates that 90 percent of regular teachers in basic schools in River
Table 6.7 Number of Teachers, Inspectors, Volunteers, and National Service Staff in Basic and Secondary Education, by State, 2009
State
Basic educationSecondary education
(academic and technical)
Teachers Inspectors
Volunteersand national
service Teachers Inspectors
Volunteersand national
service
River Nile 8,128 211 177 2,565 50 77
Sinnar 6,778 162 0 1,971 50 0
Kassala 5,367 120 536 1,191 29 0
White Nile 10,239 247 1430 2,326 79 620
Al Jazirah 22,309 538 1430 7,810 84 620
Al Qadarif 5,708 102 226 1,444 30 110
Blue Nile 5,203 92 650 1,340 30 350
Red Sea 3,677 116 226 717 10 110
Khartoum 25,188 886 536 7,027 308 0
North Kordofan 12,360 326 177 2,453 64 77
South Kordofan 6,846 211 0 1,205 32 0
Northern 6,741 194 0 1,808 17 0
Northern Darfur 7,565 330 1,695 0
Southern Darfur 8,679 235 1,755
Western Darfur 4,315 117 613
Total 139,103 3,887 5,388 35,920 783 1,964
Source: FMoGE 2008–09 statistical yearbook.

152 • The Status of the Education Sector in Sudan
Nile, 89 percent in North Kordofan, and 71percent in Kassala were vis-ited by state or local inspectors within the last three months during2009 (see figure 6.10). However, the study did not reach many remoterural schools. Evidence from other countries shows that costs related totime and transport restrict regular supervision of teachers in remoteschools.
Inspectors use supervision instruments to rate teachers on a scalebased on technical aspects, as well as other facets that can influenceteaching and learning in the classroom. The ratings are based oninspector observation of teachers. In some states, however, the super-vision is more participatory because it includes a self-evaluation bythe teacher. In River Nile State, 60 percent of the supervision instru-ment is completed by the inspector, and the balance is completed bythe head teacher.
Depending on the state, 68–80 percent of teachers surveyed in theservice delivery survey were also visited by head teachers within themonth prior. As for education council supervision, 38–58 percent of theregular teachers had received a visit within the last month. However, it isnot clear what role education council supervision plays in terms ofteacher promotions, transfers, and training.
34%37%
24%
5%
31%
58%
7%
visit
5%
62%
28%
4% 6%
0
10
20
30
40
50
60
70
past
3 mon
ths
past
1 mon
th
past
6–12
mon
thsne
ver
% o
f reg
ular
tea
cher
svi
site
d by
loca
lity
offic
ial
Kassala North Kordofan River Nile
Figure 6.10 Local Supervision: Visits to the Teachers in Kassala, North Kordofan,and River Nile States, 2009 percent
Source: Service delivery survey.
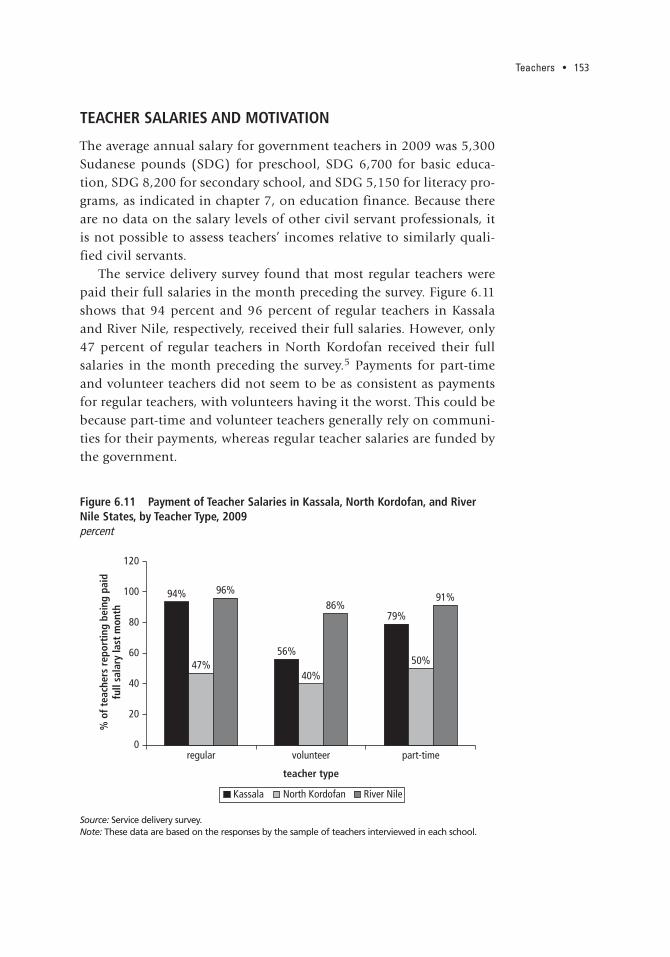
Teachers • 153
TEACHER SALARIES AND MOTIVATION
The average annual salary for government teachers in 2009 was 5,300Sudanese pounds (SDG) for preschool, SDG 6,700 for basic educa-tion, SDG 8,200 for secondary school, and SDG 5,150 for literacy pro-grams, as indicated in chapter 7, on education finance. Because thereare no data on the salary levels of other civil servant professionals, itis not possible to assess teachers’ incomes relative to similarly quali-fied civil servants.
The service delivery survey found that most regular teachers werepaid their full salaries in the month preceding the survey. Figure 6.11shows that 94 percent and 96 percent of regular teachers in Kassalaand River Nile, respectively, received their full salaries. However, only47 percent of regular teachers in North Kordofan received their fullsalaries in the month preceding the survey.5 Payments for part-timeand volunteer teachers did not seem to be as consistent as paymentsfor regular teachers, with volunteers having it the worst. This could bebecause part-time and volunteer teachers generally rely on communi-ties for their payments, whereas regular teacher salaries are funded bythe government.
94%
56%
79%
47%40%
50%
96%86%
91%
0
20
40
60
80
100
120
regular volunteer
teacher type
part-time
% o
f tea
cher
s re
port
ing
bein
g pa
idfu
ll sa
lary
last
mon
th
Kassala North Kordofan River Nile
Figure 6.11 Payment of Teacher Salaries in Kassala, North Kordofan, and RiverNile States, by Teacher Type, 2009percent
Source: Service delivery survey.Note: These data are based on the responses by the sample of teachers interviewed in each school.

154 • The Status of the Education Sector in Sudan
Data from the service delivery survey also show that depending on thestate, between 6 and 20 percent of regular teachers had outside jobs or pro-vided private tutoring to students, indicating a need for supplementaryincome (table 6.8). In North Kordofan, 6 percent of regular teachers hadoutside jobs, whereas in Kassala and River Nile, 11 percent and 13 percent,respectively, had outside jobs. Those regular teachers who provided tutoringwere as follows: 13 percent in Kassala, 17 percent in North Kordofan, and21 percent in River Nile. As expected, compared with regular teachers agreater number of volunteer and part-time teachers had outside jobs to supplement their incomes. Although the study did not ascertain the typesof jobs teachers were undertaking outside of school or the amount ofincome earned through these sources, the data suggest that some teachersare seeking to supplement their salaries.
Teachers working in rural, IDP, and nomadic schools do not receive anyadditional benefits from the government. Communities in some ruralschools provide additional incentives (either in cash or in kind) for teach-ers to attract them to those areas. This means that the poorest rural com-munities cannot compete with other, more wealthy rural communities thatoffer a better standard of living. In some states (such as South Kordofan),teachers in nomadic schools receive additional remuneration fromUNICEF. Evidence from the baseline survey (FMoGE 2008) show that therewere more untrained teachers in nomadic (63.9 percent) and IDP(62.1 percent) schools than in any other type of school.
Although financial incentives may influence teacher performanceand thus student learning, there are other, nonfinancial incentives thatcan be used to attract experienced and qualified teachers. For example,teachers may exert more effort if doing so improves their standing in thelocal community. A good work environment also tends to improve
Table 6.8 Outside Jobs and Private Tutoring in Kassala, North Kordofan, and River Nile States, by Teacher Type, 2009
State
Percentage of teachers who report
Having outside job Providing private tutoring
Regular Volunteer Part-time Regular Volunteer Part-time
Kassala 11 0.3 12 13 0.2 0.0
North Kordofan 6 18 14 17 14 26
River Nile 13 14 22 21 0 9
Total number of teachers 833 65 114 833 65 114
Source: Service delivery survey. Note: These data are based on the responses by the sample of teachers interviewed in each school.
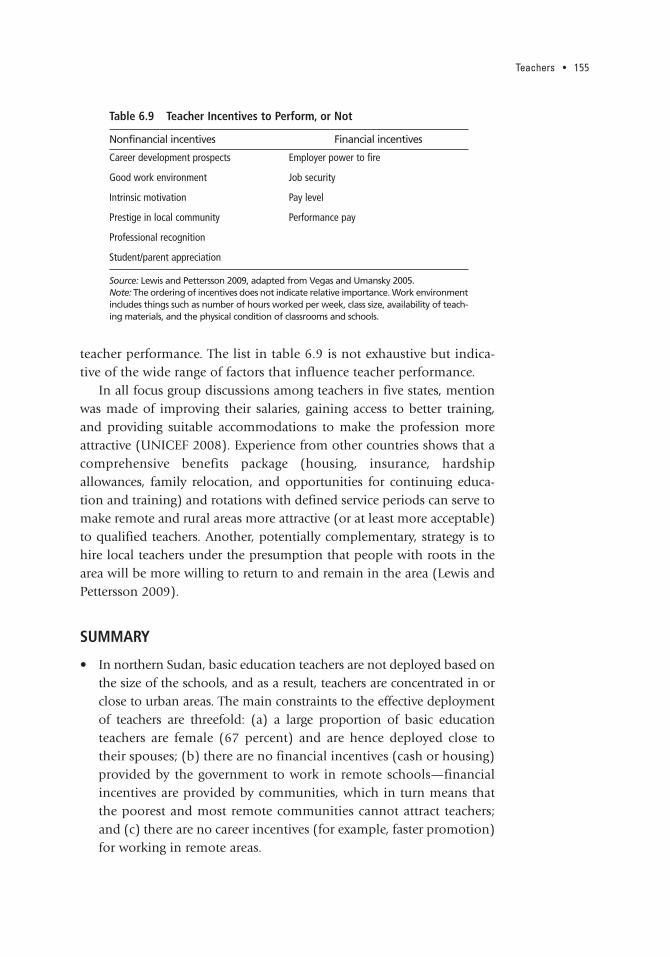
Teachers • 155
teacher performance. The list in table 6.9 is not exhaustive but indica-tive of the wide range of factors that influence teacher performance.
In all focus group discussions among teachers in five states, mentionwas made of improving their salaries, gaining access to better training,and providing suitable accommodations to make the profession moreattractive (UNICEF 2008). Experience from other countries shows that acomprehensive benefits package (housing, insurance, hardshipallowances, family relocation, and opportunities for continuing educa-tion and training) and rotations with defined service periods can serve tomake remote and rural areas more attractive (or at least more acceptable)to qualified teachers. Another, potentially complementary, strategy is tohire local teachers under the presumption that people with roots in thearea will be more willing to return to and remain in the area (Lewis andPettersson 2009).
SUMMARY
• In northern Sudan, basic education teachers are not deployed based onthe size of the schools, and as a result, teachers are concentrated in orclose to urban areas. The main constraints to the effective deploymentof teachers are threefold: (a) a large proportion of basic educationteachers are female (67 percent) and are hence deployed close totheir spouses; (b) there are no financial incentives (cash or housing)provided by the government to work in remote schools—financialincentives are provided by communities, which in turn means thatthe poorest and most remote communities cannot attract teachers;and (c) there are no career incentives (for example, faster promotion)for working in remote areas.
Table 6.9 Teacher Incentives to Perform, or Not
Nonfinancial incentives Financial incentives
Career development prospects Employer power to fire
Good work environment Job security
Intrinsic motivation Pay level
Prestige in local community Performance pay
Professional recognition
Student/parent appreciation
Source: Lewis and Pettersson 2009, adapted from Vegas and Umansky 2005. Note: The ordering of incentives does not indicate relative importance. Work environmentincludes things such as number of hours worked per week, class size, availability of teach-ing materials, and the physical condition of classrooms and schools.

156 • The Status of the Education Sector in Sudan
• The average size of a class in basic education is 48 students, but classsize varies significantly by the type of school and by grade level. Ofparticular concern are IDP schools, which have an average of 92 stu-dents per class and thus have the potential for poor learning out-comes.
• On average, students receive 336 fewer hours of annual instructionaltime than the government-mandated number. This deficit results ininsufficient time for learning.
• There is not sufficient evidence yet to ascertain whether the new pre-qualification requirements yield better performance by teachers. Moreresearch is needed to determine the cost-effectiveness of the new pro-gram compared to the old program.
NOTES 1. Government teachers, administrators, inspectors, and other nonteaching
staff are on the government payroll, whereas national service and volunteer teach-ers are not.
2. The average annual salary at the secondary level is 8,184 Sudanese pounds(SDG), as opposed to SDG 6,708 at the basic level (per chapter 7, on educationfinance).
3. The Teacher Assistance Course is a nine-month open learning course devel-oped and delivered by the Sudan Open Learning Organization, a national non-governmental organization.
4. The average actual instructional time is calculated by dividing the intendednumber of instructional hours by the number of teachers and multiplying thisratio by the total number of classes.
5. The survey was conducted one month after a teacher’s strike, which was ini-tiated because of a lack of salary payments to teachers in October 2009.
REFERENCES Behaghel, L., and P. Coustère. 1999. Les facteurs d’efficacité de l’apprentissage dans
l’enseignement primaire: les résultats du programme PASEC sur huit pays d’Afrique.Dakar, Senegal: PASEC (Programme d’analyse des systèmes éducatifs de laCONFEMEN [Conférence des ministres de l’éducation des pays ayant lefrançais en partage]).
Bernard, Jean-Marc. 2003. “Elements to Assess the Quality of Primary Educa-tion in French-Speaking Africa: Programme for the Analysis of EducationalSystems of the CONFEMEN countries (PASEC).” ADEA (Association for theDevelopment of Education in Africa) biennial meeting, Grand Baie, Mauritius,December 3–6, 2003.
FMoGE (Federal Ministry of General Education). 2008. “Baseline Survey onBasic Education in the Northern States of Sudan: Final Report June 2008.”Online document available at http://planipolis.iiep.unesco.org/epiweb/E029336e.pdf.
———. Various years. “Statistical Yearbooks.” Khartoum.

Teachers • 157
Hanushek, Eric A., John F. Kain, Jacob M. Markman, and Steven G. Rivkin. 2003.“Does Peer Ability Affect Student Achievement?” Journal of Applied Econometrics18: 527–44.
Lewis, Maureen, and Gunilla Pettersson. 2009. “Governance in Education: RaisingPerformance in the Sector.” Draft. Development Economics Vice Presidencyand Human Development Network,World Bank, Washington, DC. Available athttp://siteresources.worldbank.org/EXTHDOFFICE/Resources/5485726-1239047988859/Governance-in-education-master-22Dec09-GP.pdf.
Rivkin, Steven G., Eric A. Hanushek, and John F. Kain. 2005. “Teachers, Schools,and Academic Achievement.” Econometrica 73 (2): 417–58.
UNESCO (United Nations Educational, Scientific, and Cultural Organization).2007. Education Counts: Benchmarking Progress in 19 WEI Countries: World Education Indicators. Paris: UNESCO.
UNICEF (United Nations Children’s Fund). 2008. “Teacher Training Assessmentfor Northern States of Sudan.” Khartoum.
Vegas, Emiliana, and Ilana Umansky. 2005. Improving Teaching and Learningthrough Effective Incentives: What Can We Learn from Education Reforms in LatinAmerica? Washington, DC: World Bank.
World Bank. Forthcoming. “Education in Sub-Saharan Africa: A ComparativeAnalysis.” Africa Region Technical Department, Education, World Bank, Wash-ington, DC.

159
CHAPTER
Education Finance
This chapter provides an overview and analysis of public educationspending in northern Sudan, with the objective of guiding futurespending and informing resource allocation to promote progress in
achieving the education Millennium Development Goals and Educationfor All targets.1 This examination is particularly important in the contextof northern Sudan because the education system is decentralized, withvarying capacities to deliver education services across states, and becausethere are significant state differences in education inputs, outputs, andoutcomes.
After a brief introduction, the chapter examines trends in public
education spending, spending on education by administrative level andeducation level (preschool, basic, secondary, and tertiary), and the com-position of recurrent education spending.2 It then analyzes the composi-tion of public per-student spending and spending on education staff. Abrief discussion of household out-of-pocket, per-student spending is alsoprovided. This discussion is followed by an analysis at the state level ofthe share of education spending in total public spending, of per-studentspending, and of the composition of recurrent education spending. Fed-eral transfers and the size of transfers received by each state are also exam-ined. The chapter concludes with a summary of the main findings. For theanalysis in this chapter, it was necessary to collect primary data; seebox 7.1.3 Regional comparisons are provided throughout the chapterwhenever possible.
BACKGROUND
There are three administrative levels in the education system in northernSudan: federal, state, and local government (localities). The provision of
7

160 • The Status of the Education Sector in Sudan
preschool, basic education, and secondary education is decentralized tothe states, whereas the federal government is responsible for higher edu-cation (World Bank 2003). States receive transfers from the federal gov-ernment that are intended to match resources to education needs acrossstates. The federal transfers consist of block transfers (part of which thestates allocate to education) and earmarked transfers (for specific pur-poses including higher education and graduate salaries).
As a result of the government’s decentralization policy, the respon-sibilities of the states have increased significantly since the 2005 Com-prehensive Peace Agreement, together with education spending at thestate level. However, in practice, the fiscal autonomy of the states is stilllimited because they continue to rely heavily on federal transfers, and
BOX 7.1 STATE VISITS TO COLLECT INFORMATION ON EDUCATION SPENDING
Between December 2009 and February 2010, a team composed offederal Ministry of General Education (FMoGE) and World Bankstaff visited 10 of the 15 states of northern Sudan to collect data forthis chapter. Prior to the visits, the team designed a template tocollect the financial data. The team visited Al Qadarif, Al Jazirah,Blue Nile, Kassala, Khartoum, North Kordofan, Red Sea, River Nile,South Kordofan, and White Nile states. Of the five remaining states,three—Northern, Northern Darfur, and Sinnar—sent the requestedinformation to the team. For the other two, Southern Darfur andWestern Darfur, the team made multiple efforts to obtain data, butthese states were unable to provide the information.
During each visit, the team met with the state ministry ofeducation, the state ministry of finance, and in some cases, the stateministry of local government. Financial information was generallycollected for the two years 2008 and 2009, and more-detailedpayroll data were collected for one month of 2009. The team alsovisited two to three localities in each state to verify the consistencyacross state-level and local-level information, and to collectinformation about community spending on schools. Data fromthe different state ministries and localities were cross-checked forconsistency, and were found to be of generally good quality. Insome states, donors helped to finance the education system, butdata on these contributions were not available at the time of thecompletion of this report.
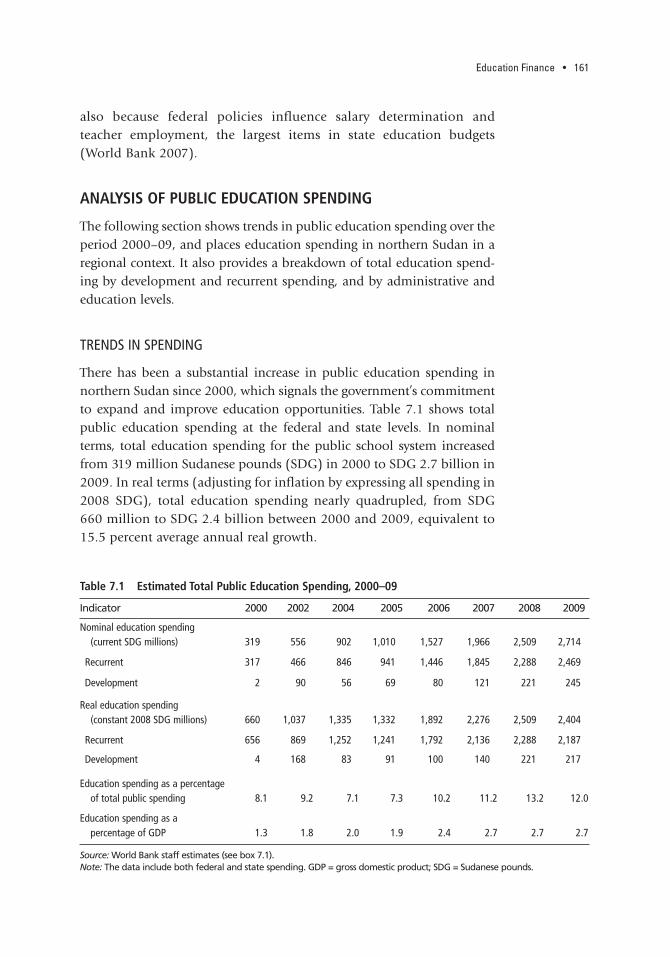
Education Finance • 161
also because federal policies influence salary determination andteacher employment, the largest items in state education budgets(World Bank 2007).
ANALYSIS OF PUBLIC EDUCATION SPENDING
The following section shows trends in public education spending over theperiod 2000–09, and places education spending in northern Sudan in aregional context. It also provides a breakdown of total education spend-ing by development and recurrent spending, and by administrative andeducation levels.
TRENDS IN SPENDING
There has been a substantial increase in public education spending innorthern Sudan since 2000, which signals the government’s commitmentto expand and improve education opportunities. Table 7.1 shows totalpublic education spending at the federal and state levels. In nominalterms, total education spending for the public school system increasedfrom 319 million Sudanese pounds (SDG) in 2000 to SDG 2.7 billion in2009. In real terms (adjusting for inflation by expressing all spending in2008 SDG), total education spending nearly quadrupled, from SDG660 million to SDG 2.4 billion between 2000 and 2009, equivalent to15.5 percent average annual real growth.
Table 7.1 Estimated Total Public Education Spending, 2000–09
Indicator 2000 2002 2004 2005 2006 2007 2008 2009
Nominal education spending (current SDG millions) 319 556 902 1,010 1,527 1,966 2,509 2,714
Recurrent 317 466 846 941 1,446 1,845 2,288 2,469
Development 2 90 56 69 80 121 221 245
Real education spending (constant 2008 SDG millions) 660 1,037 1,335 1,332 1,892 2,276 2,509 2,404
Recurrent 656 869 1,252 1,241 1,792 2,136 2,288 2,187
Development 4 168 83 91 100 140 221 217
Education spending as a percentage of total public spending 8.1 9.2 7.1 7.3 10.2 11.2 13.2 12.0
Education spending as a percentage of GDP 1.3 1.8 2.0 1.9 2.4 2.7 2.7 2.7
Source: World Bank staff estimates (see box 7.1).Note: The data include both federal and state spending. GDP = gross domestic product; SDG = Sudanese pounds.
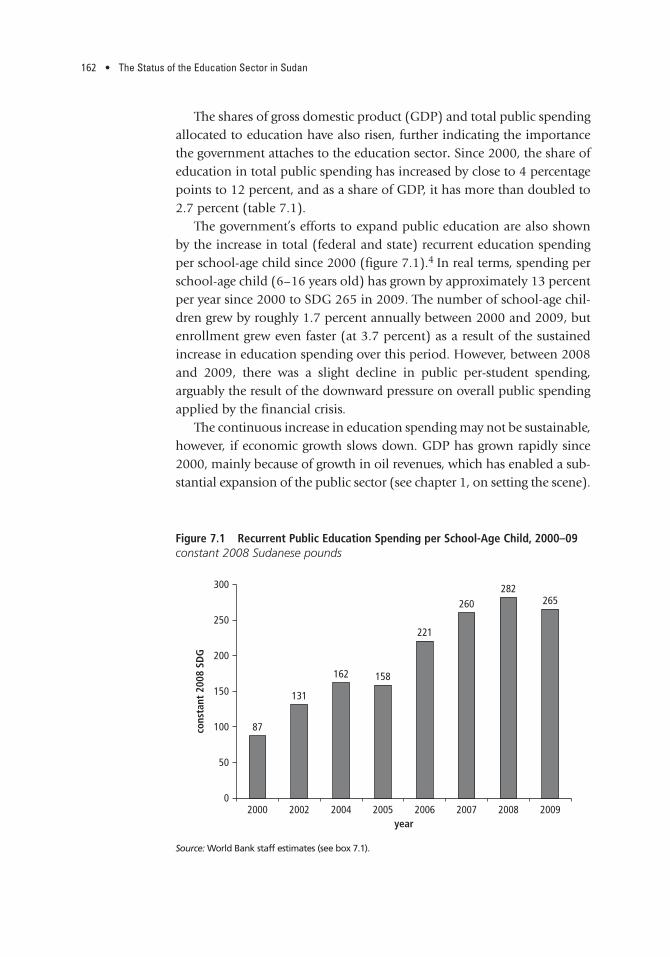
162 • The Status of the Education Sector in Sudan
The shares of gross domestic product (GDP) and total public spendingallocated to education have also risen, further indicating the importancethe government attaches to the education sector. Since 2000, the share ofeducation in total public spending has increased by close to 4 percentagepoints to 12 percent, and as a share of GDP, it has more than doubled to2.7 percent (table 7.1).
The government’s efforts to expand public education are also shownby the increase in total (federal and state) recurrent education spendingper school-age child since 2000 (figure 7.1).4 In real terms, spending perschool-age child (6–16 years old) has grown by approximately 13 percentper year since 2000 to SDG 265 in 2009. The number of school-age chil-dren grew by roughly 1.7 percent annually between 2000 and 2009, butenrollment grew even faster (at 3.7 percent) as a result of the sustainedincrease in education spending over this period. However, between 2008and 2009, there was a slight decline in public per-student spending,arguably the result of the downward pressure on overall public spendingapplied by the financial crisis.
The continuous increase in education spending may not be sustainable,however, if economic growth slows down. GDP has grown rapidly since2000, mainly because of growth in oil revenues, which has enabled a sub-stantial expansion of the public sector (see chapter 1, on setting the scene).
87
131
162 158
221
260282
265
0
50
100
150
200
250
300
2000 2002 2004 2005year
2006 2007 2008 2009
cons
tant
200
8 SD
G
Figure 7.1 Recurrent Public Education Spending per School-Age Child, 2000–09constant 2008 Sudanese pounds
Source: World Bank staff estimates (see box 7.1).

Education Finance • 163
But available estimates suggest that oil production will peak in 2012(World Bank 2010a), and if oil production or oil prices decline, lower gov-ernment revenues may put downward pressure on education spending.
Despite the increase in education spending since 2000, northernSudan spends less as a share of total public spending and of GDP than docountries with similar incomes and other countries in the region withcomparable dependency ratios (see annex table 7A.1).5 In 2008, educa-tion spending as a share of total public spending was roughly 13 percent(figure 7.2). By comparison, other countries spent more—includingneighboring Chad, Ethiopia, and Kenya; other lower-middle-incomecountries in the Sub-Saharan African region; and Morocco and Tunisia.
Northern Sudan also spent relatively less on education as a share ofGDP: 2.7 percent compared with 3–7 percent of GDP for neighboringcountries Chad, Ethiopia, and Kenya (figure 7.2). Other lower-middle-income countries also spent more by this measure: Cape Verde, Côted’Ivoire, and Lesotho in Sub-Saharan Africa, and the Arab Republic ofEgypt, Morocco, and Tunisia in North Africa.
Recurrent spending accounts for the vast majority of total educationspending (figure 7.3 and annex table 7A.2).6 In 2000, real recurrent edu-
0
5
country country
10
15
20
25
30
35
40
north
ern Su
dan
Chad
Ethiop
iaKe
nya
Cape V
erde
Côte d’
Ivoire
Leso
tho
Egyp
t, Arab
Rep.
Morocco
Tunis
ia
EFA-FT
I ind.
framew
ork
% o
f tot
al p
ublic
spe
ndin
g
0
2
4
6
8
10
12
14
north
ern Su
dan
Chad
Ethiop
iaKe
nya
Cape V
erde
Côte d’
Ivoire
Leso
tho
Egyp
t, Arab
Rep.
Morocco
Tunis
ia
% o
f GD
P
Figure 7.2 Comparison of Public Education Spending, by Country, 2005–08
Sources: World Bank staff estimates (see box 7.1); Pôle de Dakar database 2010; World Bank 2010b; HNP Database 2010.Note: The data are for the latest year available for 2005–08.

164 • The Status of the Education Sector in Sudan
cation spending was SDG 656 million and accounted for more than 99percent of total education spending. By 2009, its share had declined to 91percent of total education spending, but in absolute terms, it had risen toSDG 2.2 billion because of the overall expansion of education spending.
Development spending has increased over the period but remains low(figure 7.3 and annex table 7A.3).7 In real terms, it was SDG 4 million in2000, constituting less than 1 percent of total education spending. How-ever, development spending has increased over time to SDG 217 million in2009, equivalent to 9 percent of total public education spending. The largershare of development spending in 2002 (16 percent) was the result of atemporary rise in development spending in Khartoum State (World Bank2010b). The generally low spending on development poses a challengebecause many schools in northern Sudan are of very poor quality.8 Forinstance, in 2007, 42 percent of classrooms in basic schools were in need ofrepairs, and 9 percent required complete replacement (FMOGE 2008).
Education spending at the state level has increased since 2000, and 83 percent of total public education spending took place at the state levelin 2009 (figure 7.4 and annex table 7A.2). In 2000, state-level educationspending in real terms was SDG 380 million, which by 2009, had risen to
99%
84%94% 93% 95% 94% 91% 91%
1%
16%6% 7% 5% 6% 9% 9%
0
10
20
30
40
50
60
70
80
90
100
2000 2002 2004year
2005 2006 2007 2008 2009
% o
f tot
al p
ublic
edu
cati
on s
pend
ing
recurrent development
Figure 7.3 Development and Recurrent Public Education Spending Shares,2000–09percent
Source: World Bank staff estimates (see box 7.1).

Education Finance • 165
almost SDG 2 billion. Spending at the federal level also increased over theperiod, from SDG 280 million in 2000 to SDG 420 million in 2009. Butthere was a decline in education spending at both the federal and the statelevels between 2008 and 2009, which was likely the result of a tighteningof overall public spending, including that for education, caused by thefinancial crisis.9
The share of recurrent education spending assigned to each educationlevel provides an indication of government education priorities, withbasic education accounting for the largest share at 49 percent in 2009(table 7.2). Because basic education in northern Sudan is eight years longrather than six years, after adjusting for length, the share of basic educa-tion in total education spending was even lower at 37 percent. Technicalsecondary education constituted only 1 percent of recurrent educationspending, whereas academic secondary accounted for 16 percent. Giventhe increase in enrollment in basic education, demand for secondary edu-cation is likely to rise, thereby requiring more spending at this level toaccommodate a larger number of students while also maintaining thequality of education. The share of total recurrent education spending allo-cated to higher education was 30 percent in 2009. By contrast, preschoolspending accounted for just 2 percent, and literacy programs for 1 percent,of total recurrent education spending. The relatively small spending sharefor literacy programs contrasts with the large share of children who havenever attended school (see chapter 4, on disparities).
Figure 7.4 Public Education Spending, by Administrative Level, 2000–09
0
500
1,000
1,500
2,000
2,500
3,000
2000
2002
2004
2005
year20
0620
0720
0820
09
cons
tant
200
8 SD
G m
illio
ns
federal state
Source: World Bank staff estimates (see box 7.1).

166 • The Status of the Education Sector in Sudan
The share of basic education in total education spending in northernSudan was lower than that in most countries in Sub-Saharan Africa andNorth Africa, as shown in table 7.3.10 For instance, Egypt, Kenya, andMorocco spent 40 percent, 55 percent, and 46 percent, respectively, oftotal public education spending on primary education, compared with 37percent in northern Sudan (after adjusting for eight years, rather than six,of basic education).
On academic secondary education, northern Sudan spent a smallershare of total recurrent education spending (16 percent) than did thelower-middle-income countries of Morocco (19 percent) and Tunisia (22 percent). The spending share for higher education in northern Sudanwas 30 percent, compared with 39 percent in Egypt, 22 percent in Tunisia,and 16 percent in Morocco.
COMPOSITION OF RECURRENT EDUCATION SPENDING
Teacher salaries accounted for the largest share of total recurrent educa-tion spending at an average of 75 percent, excluding higher education(table 7.4 and figure 7.5).11 In 2009, teacher salary spending ranged from 62 percent for literacy programs to 81 percent for preschool. Non-teaching staff salaries and spending on goods and services each accountedfor an average of 11 percent of recurrent education spending. In highereducation, teacher and nonteaching staff salaries jointly accounted for 69 percent of recurrent spending. The share of nonteaching staff salaries
Table 7.2 Recurrent Public Education Spending, by Education Level, 2009
Education level
Recurrent education spending (constant 2008 SDG millions)
Share of total recurrent education spending (percent)
Share of total public enrollment
(percent)
Preschool 54 2 7
Basic 1,068 49 74
Secondary
Academic 359 16 9
Technical 20 1 0.4
Literacy program 22 1 3
Highera 663 30 7
Total 2,187 100 100
Source: World Bank staff estimates (see box 7.1).Note: The data include both federal and state spending. SDG = Sudanese pounds.a. The 2009 budget allocation with the 2008 percentage execution rate; excludes Juba University.

Education Finance • 167
Table 7.3 Comparison of Public Education Spending, by Region/Country and Education Level, 2005–08percent
Subsector Primary Upper secondary Higher
Northern Sudan 37 (49)a 16 30
Neighboring countries
Chad 48 12 23
Ethiopia 51 8 20
Kenya 55 12 16
Lower-middle-income countries in Sub-Saharan Africa
Cape Verde 39 16 12
Côte d’Ivoire 43 10 21
Lesotho 36 11 37
Lower-middle-income countries in North Africa
Egypt, Arab Rep. 40 — 39
Morocco 46 19 16
Tunisia 35 22 22
Sources: World Bank staff estimates (see box 7.1); Pôle de Dakar database 2010; World Bank 2010b; HNP Database 2010.Note: The data are for the latest year available for 2005–08; — = not available.a. The share of primary education in total public education spending is adjusted to six years for northernSudan, and the data are for six years of primary education for all other countries shown. The 49 percentin parentheses is for eight years of basic education.
Table 7.4 Composition of Recurrent Public Education Spending, by Education Level, 2009constant 2008 SDG millions
SubsectorTeacher salaries
Nonteaching staff salaries
Goods and services
Student subsidy Total
Preschool 44 6 4 n.a. 54
Basic 827 192 50 n.a. 1,068
Academic secondary 247 83 29 n.a. 359
Technical secondary 14 5 2 n.a. 20
Literacy program 13 5 4 n.a. 22
Higher 460 108 96 663
Total 2,187
Source: World Bank staff estimates (see box 7.1).Note: The data include both federal and state spending; n.a. = not applicable.

168 • The Status of the Education Sector in Sudan
was smallest for preschool (11 percent) and largest for academic second-ary and technical secondary education (each 23 percent). For higher edu-cation, student subsidies made up 14 percent of total spending.
Spending on goods and services is generally low, and particularly sofor basic education. Goods and services accounted for only 5 percent ofrecurrent spending for basic education, 16 percent for higher education,and up to 17 percent for literacy programs. The relatively small share ofgoods and services in basic education is frequently supplemented byhousehold spending for school running costs (see annex table 7A.1; EU2008; and chapter 5, on service delivery).
PUBLIC PER-STUDENT SPENDING
The next section examines per-student spending to provide insights intothe allocation of resources across different education levels and into the
Figure 7.5 Composition of Recurrent Public Education Spending, by Education Level, 2009percent
81% 77%69% 67% 62%
69%
11% 18%23%
education level
23%21%
7% 5% 8% 10% 17%
16%
14%
0
10
20
30
40
50
60
70
80
90
100
presch
ool
basic
acad
emic
secon
dary
techn
ical se
cond
ary
literac
yhig
her
% o
f rec
urre
nt e
duca
tion
spe
ndin
g
teachers salaries nonteaching staff salaries
goods and services student subsidy
Source: World Bank staff estimates (see box 7.1).Note: The data include both federal and state spending. Teacher salaries for higher education includenonteaching staff salaries.

Education Finance • 169
composition of spending for the average student at each education level.Per-student spending in northern Sudan in 2009 was computed as recur-rent public education spending per student enrolled at each educationlevel for 13 of the 15 states (Southern Darfur and Western Darfur wereexcluded because of data limitations).
COMPOSITION OF PER-STUDENT SPENDING
The more advanced the education level, the higher the per-studentspending. As shown in table 7.5, average per-student spending was low-est for preschool (SDG 119) and basic education (SDG 231) and highestfor higher education (SDG 1,532), with academic secondary and techni-cal secondary education falling in between (SDG 664 and SDG 709,respectively).
For basic education, average per-student spending in northern Sudanin 2009 equaled just over 8 percent of GDP per capita compared with theSub-Saharan African regional average of 12 percent (table 7.6). Publicper-student spending as a share of GDP per capita in northern Sudan wasalso lower than that share in all other regions, including the Middle Eastand North Africa, which spent a much higher share (17 percent of GDPper capita) on basic education.
Average spending per student in secondary education in northernSudan (25 percent) was roughly in line with that of other regions(table 7.6). For instance, the Middle East and North Africa spent, onaverage, 20 percent of GDP per capita for each student in secondaryeducation, and South Asia spent 19 percent. Average per-student
Table 7.5 Composition of Per-Student Spending, by Education Level, 2009
Educationlevel
Percentage ofGDP per capita Teachers
Nonteachingstaffa
Goods andservices
Studentsubsidy
Total spending (constant 2008 SDG)
Preschool 4.3 96 14 9 n.a 119
Basic 8.4 179 42 11 n.a 231
Secondary
Academic 24.1 456 154 54 n.a 664
Technical 25.7 471 166 71 n.a 709
Higher 55.6 1,062 249 221 1,532
Source: World Bank staff estimates (see box 7.1). Note: Per-student spending excludes development spending and the states of Southern Darfur and Western Darfur; n.a. = notapplicable.a. Nonteaching staff includes, for example, administrators, inspectors, cleaners, and guards.

170 • The Status of the Education Sector in Sudan
spending in Sub-Saharan Africa for both low-income and lower-middle-income countries was higher at 30 percent and 33 percent, respectively.
Northern Sudan spent roughly 56 percent of GDP per capita for eachstudent in higher education, which placed it between the average of 40percent of GDP per capita for the Middle East and North Africa region and97 percent for middle-income countries in Sub-Saharan Africa. Per-
student spending as a share of GDP per capita in other regions rangedfrom 23 percent in Eastern Europe and Central Asia to 359 percent in low-income Sub-Saharan African countries. In absolute terms, per-studentspending in northern Sudan (US$950) was higher than such spending inSouth Asia (US$285), similar to it in the Eastern Europe and Central Asiaregion (US$1,040), but lower than per-student spending in the MiddleEast and North Africa region (US$1,240).
ANALYSIS OF SPENDING ON EDUCATION STAFF
The public education system has non–school-based and school-basedstaff. Non–school-based staff includes administrators and inspectors atthe central and decentralized levels. The school-based staff consists ofgovernment teachers, national service and volunteer teachers, and non-teaching staff.12 Of the school-based staff, government teachers, adminis-trators, inspectors, and other nonteaching staff are on the governmentpayroll, whereas national service and volunteer teachers are not.13 In2009, there was a total of approximately 217,000 education staff on thegovernment payroll in 13 of the 15 states in northern Sudan (table 7.7).14
In terms of school-based staff, the majority were government teachers
Table 7.6 Comparison of Public Per-Student Spending, by Region and Education Level, 2002–08
Country/region
Percentage of GDP per capita
Higher (2005 US$, current prices)Basic Secondary Higher
Northern Sudan 8 25 56 950
Sub-Saharan Africa 12 30 322 1,780
Low-income countries 12 33 359 1,460
Lower-middle-income countries 12 18 97 3,700
East Asia and Pacific 13 14 59 1,530
Eastern Europe and Central Asia 15 18 23 1,040
Middle East and North Africa 17 20 40 1,240
South Asia 14 19 61 285
Sources: World Bank staff estimates (see box 7.1); Mingat and Majgaard 2010; World Bank 2010b.

Education Finance • 171
(170,981) followed by government nonteaching staff (32,438), andnational service and volunteer teachers (17,458). There were alsoabout 13,405 non–school-based education staff at the central anddecentralized levels.
An oversupply of teachers is costly because salaries constitute by farthe largest spending component; however, an insufficient number ofteachers can affect the quality of education services. According to the Edu-cation for All Fast-Track Initiative (EFA-FTI), the recommended student-teacher ratio (STR) for primary education in Sub-Saharan Africa is 40:1.The average STR for basic education in northern Sudan is 34:1 (excludingnational service and volunteer teachers), which is below the EFA-FTI rec-ommendation. However, there is notable variation in STRs at the statelevel (see Analysis of State-Level Education Spending later in this chap-ter), and given teacher subject specialization, class sizes are sometimeslarge (see chapter 6, on teachers).
In 2009, the average salary for school-based education staff wasapproximately SDG 6,400 per year, the equivalent of 2.1 times GDP percapita (table 7.8).15,16 Examining average annual salaries by staff typeshows that administrators had the highest salaries, at about SDG 8,800(2.6 times GDP per capita), followed by inspectors, at SDG 7,600 (2.4 times GDP per capita). By comparison, government teachers earnedan average of SDG 6,900 (2 times GDP per capita), and other nonteachingstaff (that is, cleaners, drivers, and guards) earned SDG 3,200 (1.1 timesper capita income). The relatively high salaries of administrators andinspectors were mainly the result of higher qualifications and greater
Table 7.7 Composition of Education Staff, by Education Level, 2009
School based
Education level
(a) + (b) + (c) Total education
staff on government
payroll
(a) Central and
decentralized education staff
(b) Government nonteaching
staff
(c) Government
teachers
(d) National
service and volunteer teachersa
(c) + (d) Total teach-
ers
Preschool 9,592 444 327 8,821 4,196 13,017
Basic 153,010 8,415 18,486 126,109 5,388 131,497
Secondary 50,857 3,790 13,515 33,552 1,964 35,516
Literacy program 3,365 756 110 2,499 5,910 8,409
Total 216,824 13,405 32,438 170,981 17,458 188,439
Source: World Bank staff estimates (see box 7.1).Note: The data exclude Southern Darfur and Western Darfur.a. These teachers are not on the government payroll.

172 • The Status of the Education Sector in Sudan
experience than teachers (EU 2008). To assess whether teacher salaries arecomparable to those of other professionals with similar educationalattainment requires labor market data on earnings, which were not avail-able at the time of the preparation of this report.
For administrators, inspectors, and teachers, average salaries rose withthe education level at which they worked (table 7.8). This suggests thatteachers with more training were paid more, as would be expected. Othernonteaching staff, which exclude administrators and inspectors, earnedroughly the same salaries at each education level because they performedsimilar tasks and had similar training regardless of the education level atwhich they worked.
Average salaries for primary teachers in northern Sudan measured asa multiple of GDP per capita were lower than those in neighboringcountries and lower-middle-income countries in Sub-Saharan Africa(table 7.9). In neighbors Chad, Ethiopia, and Kenya, primary schoolteachers earned about 5–7 times GDP per capita compared with 2 timesGDP per capita in northern Sudan in 2009. In the lower-middle-incomecountries of Côte d’Ivoire and Lesotho, teacher salaries were roughly 5 times GDP per capita, and in Morocco, they were 3.4 times larger. By
Table 7.8 Average Salaries of School-Based Staff in Northern Sudan, by Education Level, 2009
Nonteaching staff
Education levelGovernment
teachers Administrators Inspectors
Other nonteaching
staffa Total
Average salary (current SDG) 6,892 8,828 7,621 3,173 6,385
Preschool 5,160 6,790 6,271 3,750 5,162
Basic 6,708 8,320 7,298 3,238 6,325
Secondary 8,184 9,691 9,390 3,062 6,885
Literacy program 5,091 7,665 7,240 3,424 5,143
Average salary (multiple of GDP per capita) 2.0 2.6 2.4 1.1 2.1
Preschool 1.7 2.2 2.0 1.2 1.7
Basic 2.2 2.7 2.3 1.0 2.0
Secondary 2.6 3.1 3.0 1.0 2.2
Literacy program 1.6 2.5 2.3 1.1 1.7
Source: World Bank staff estimates (see box 7.1).Note: The table excludes Southern Darfur and Western Darfur and national service and volunteer teachers because of data limitations.a. Other nonteaching staff includes, for example, cleaners, drivers, gardeners, guards, and janitors.

Education Finance • 173
contrast, primary teacher salaries in Egypt and Tunisia were 0.5 and 1.8 times GDP per capita, respectively.
HOUSEHOLD OUT-OF-POCKET EDUCATION SPENDING
Basic education in northern Sudan is supposed to be provided for free,but when public education spending is insufficient, households pay out-of-pocket to make up for shortfalls. The data presented in this section aredrawn from several small-scale surveys because data on household edu-cation spending are not collected on a regular basis in northern Sudan.Table 7.10 presents some of the data available for students enrolled inpublic schools. These household out-of-pocket payments are only forschool running costs, including school maintenance, water and electricity,and supplementary teacher salary payments. Other school costs incurredby households—for uniforms, transport, and textbooks, for example—areexcluded.
In North Kordofan State, household out-of-pocket spending per stu-dent was SDG 13 for preschool, SDG 19 for basic education, and SDG 20
Table 7.9 Comparison of Average Primary Teacher Salaries, by Region/Country, 2002–08
Region/countryAverage primary teacher salary
(multiple of GDP per capita)
Northern Sudan 2.2
Neighboring countries
Chad 5.4
Ethiopia 7.3
Kenya 5.3
Lower-middle-income countries in Sub-Saharan Africa
Cape Verde —
Côte d’Ivoire 4.9
Lesotho 5.0
Lower-middle-income countries in North Africa
Egypt, Arab Rep. 0.5
Morocco 3.4
Tunisia 1.8
Sources: World Bank staff estimates (see box 7.1); Pôle de Dakar database2010; UNESCO Institute for Statistics 2006. Note: The data are for the latest year available for 2002–08; — = not available.

174 • The Status of the Education Sector in Sudan
for academic secondary education in 2008–09. In Al Qadarif, Kassala,South Kordofan, and White Nile states, average household out-of-pocketspending was SDG 15 per student for basic education; and in Kassala,North Kordofan, and River Nile, the average was SDG 13 per student.
The average SDG 15 per student spent by households on basic schoolrunning costs in 2009 was higher than the government spending per stu-dent for school running costs, which was SDG 12.17 This means that inmany schools, household out-of-pocket payments provided the mainsource of financing for everyday school running costs. The householdspending in table 7.10 was only for school operating costs, but house-holds incur additional costs for uniforms, textbooks, meals, and so on.
In 2009, urban households reported spending an average of SDG 84,and rural households SDG 24, per person on education per year (Castro2010). Although rural households notably spent less, on average, thanurban households in absolute terms, education accounted for 2 percentof consumption for rural households compared with 3 percent for urbanhouseholds.
Education accounted for a larger share of consumption for poor ruralhouseholds (2 percent) than for nonpoor rural households (1 percent)(Castro 2010). For urban households, both poor and nonpoor, educationspending accounted for 3 percent of consumption. Thus, for the pooresthouseholds, out-of-pocket costs pose a barrier to education, and evenmore so when a family has many children, with implications for studentattendance and dropout (EU 2008).
ANALYSIS OF STATE-LEVEL EDUCATION SPENDING
The education system in northern Sudan is decentralized, with largedifferences in education spending and capacities to deliver education
Table 7.10 Average Annual Household Out-of-Pocket Spending per Student,Selected States, 2008–09current SDG
Source (year) Preschool Basic education Secondary education
State visits (2009)a — 15 46
Service delivery study (2008–09)b — 13 —
North Kordofan data (2008–09) 13 19 20
Note: The data exclude household spending on uniforms, transport, textbooks, and the like; — = notavailable. a. These are the averages for Al Qadarif, Kassala, South Kordofan, and White Nile states.b. This is the average for Kassala, North Kordofan, and River Nile, states.

Education Finance • 175
services across the 15 states. This section provides an overview of thesedifferences.
STATE EDUCATION SPENDING
Most states allocated a large share of their total public spending to edu-cation, 31 percent, on average, in 2009 (figure 7.6).18 Dividing states intogroups based on gross enrollment rates (GERs)—high (Al Jazirah, Khar-toum, Northern, River Nile, and White Nile), intermediate (Al Qadarif,North Kordofan, Sinnar, South Kordofan, and Western Darfur), and low(Blue Nile, Kassala, Northern Darfur, Red Sea, and Southern Darfur)—asin chapter 4 on disparities, shows that some states spent a larger share oftheir total public spending on education.
In the high-GER group, the education share in total state public spend-ing ranged from 22 to 48 percent compared with 14–37 percent for the intermediate-GER group and 12–47 percent for the low-GER group. Thesedata suggest that some states, given their available resources, prioritize edu-cation more highly. However, certain states arguably have to spend moreon other sectors, such as security, leaving fewer resources for education.
PER-STUDENT SPENDING BY STATE
Public per-student spending also varied widely across states. Again,grouping them into high-, intermediate-, and low-GER states illustratesthe big differences in average per-student spending across educationlevels for the three groups (figure 7.7). The high-GER group, on aver-age, spent more per student at each education level than did the inter-mediate- and low-GER groups.19
In individual states, there is no clear pattern in per-student spendingby education level (figure 7.8). Some states had relatively low per-studentspending across the three education levels, whereas others had relativelyhigh per-student spending for one education level and low spending foranother. For instance, both Al Qadarif and South Kordofan spent aboutSDG 200 per student in basic education, yet Al Qadarif spent much morethan South Kordofan in secondary education, about SDG 741 per studentcompared with SDG 416.
At the preschool level, average per-student spending was SDG 121 andranged from a low of SDG 31 in Western Darfur to a high of SDG 329 inKhartoum State (see annex table 7A.3). The education systems in thethree Darfur states were also supported by the donor community, andnongovernmental organizations (NGOs) played a substantial role, which
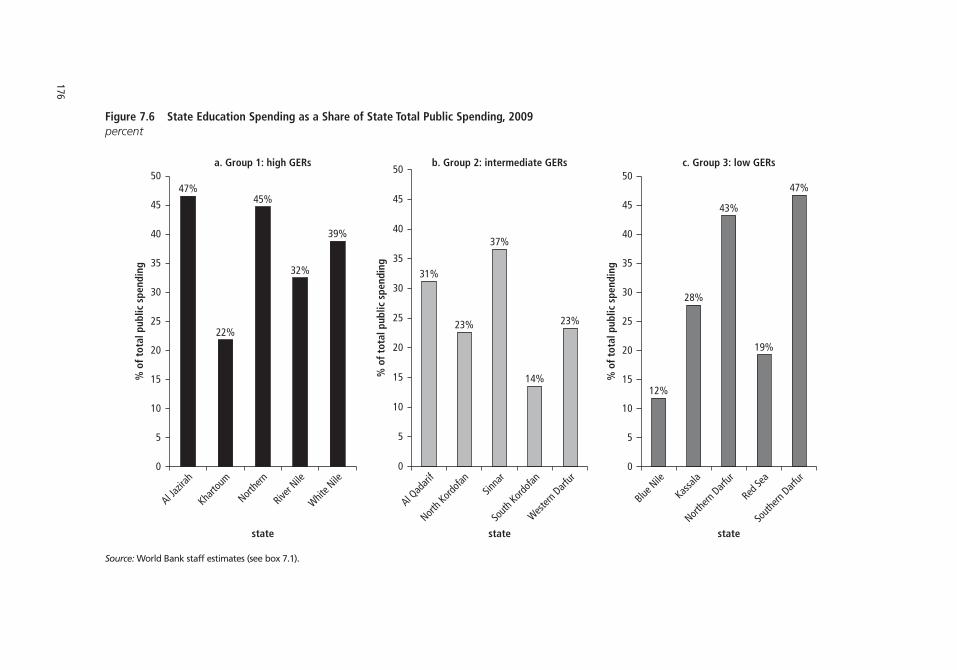
47%
22%
state state state
45%
32%
39%
0
5
10
15
20
25
30
35
40
45
50
Al Jazir
ahKha
rtoum
Northe
rnRive
r Nile
White N
ile
% o
f tot
al p
ublic
spe
ndin
g
a. Group 1: high GERs
31%
23%
37%
14%
23%
0
5
10
15
20
25
30
35
40
45
50
Al Qad
arif
North K
ordofa
n
Sinna
rSo
uth Kord
ofan
Western
Darfur
% o
f tot
al p
ublic
spe
ndin
g
b. Group 2: intermediate GERs
12%
28%
43%
19%
47%
0
5
10
15
20
25
30
35
40
45
50
Blue N
ile
Kassala
Northe
rn Darf
urRed
Sea
South
ern Darf
ur
% o
f tot
al p
ublic
spe
ndin
g
c. Group 3: low GERs
Figure 7.6 State Education Spending as a Share of State Total Public Spending, 2009percent
Source: World Bank staff estimates (see box 7.1).
176

Education Finance • 177
potentially compensated for the relatively low public per-student spend-ing at the state level. However, data on donor and NGO financing for edu-cation were not available during the preparation of this report.
An example of the variation in preschool spending per student wasprovided by Northern and Red Sea states. They had quite similar num-bers of students, but per-student spending was four times higher inNorthern State, and teacher salaries as a multiple of GDP per capitawere lower (1.2 times GDP per capita in Northern compared with 2.2times GDP per capita in Red Sea). This information may partly explainthe large difference in average student-teacher ratios (STRs), whichwere 18:1 in Northern State and 198:1 in Red Sea State. Another rea-son for the big variation in STRs is that in some states, teachers not onthe government payroll—for instance, volunteer teachers paid by thecommunity—constituted a large share of preschool teachers. Whenthese teachers were included, the STRs across states were more similar.That certain states relied to a large extent on communities to financepreschool teachers raises questions about their training and utilizationas compared with government teachers.
Figure 7.7 Average Public Per-Student Spending, by GER Group, 2009
Source: World Bank staff estimates (see box 7.1).
184
347
767
87
183
602
92
255
823
0
100
200
300
400
500
600
700
800
900
presch
ool
basic
education levelac
adem
ic sec
onda
ry
curr
ent
SDG
s, g
roup
ave
rage
group 1: high GERs group 2: intermediate GERs group 3: low GERs

Figure 7.8 Public Per-Student Spending, by Education Level and State, 2009
Source: World Bank staff estimates (see box 7.1).Note: The data exclude national service and volunteer teachers and federal spending.
0
200
400
600
800
1,000
1,200
1,400
1,600
0
200
400
600
800
1,000
1,200
1,400
1,600
0
200
400
600
800
1,000
1,200
1,400
1,600
curr
ent
SDG
curr
ent
SDG
curr
ent
SDG
state state state
Al Jazir
ahKha
rtoum
Northe
rnRive
r Nile
White N
ile
Al Qad
arif
North K
ordofa
n
Sinna
rSo
uth Kord
ofan
Western
Darfur
Blue N
ile
Kassala
Northe
rn Darf
urRed
Sea
South
ern Darf
ura. Group 1: high GERs b. Group 2: intermediate GERs c. Group 3: low GERs
preschool basic academic and technical secondary
178

Education Finance • 179
For basic education, average per-student spending across states wasSDG 262, but varied from SDG 124 in Western Darfur to SDG 542 inNorthern State (see annex table 7A.4). Teacher salaries were fairly sim-ilar across states because they are centrally determined, which impliesthat the variation in spending per student was largely driven by dif-ferences in spending on nonteaching staff and goods and services, andin the number of teachers. There was also less variation in averageSTRs in basic education than in preschool, with STRs ranging from17:1 in Northern State to 64:1 in Western Darfur.
Per-student spending for academic secondary education started atSDG 417 in South Kordofan and rose to SDG 1,416 in Blue Nile State(see annex table 7A.5). For technical secondary education, spendingper student was generally somewhat higher than for the academictrack. It ranged from SDG 354 in South Kordofan to SDG 1,194 in RedSea (see annex table 7A.6). Secondary education STRs varied less acrossstates than did those for either preschool or basic education.
FEDERAL TRANSFERS TO STATES
Since 2005, northern Sudan has undergone a process of fiscal decentral-ization, which is seen as key to addressing regional inequalities in thepostconflict environment. The 15 states receive transfers from the federalgovernment, and the states in turn transfer resources to local governments(localities). The federal transfers consist primarily of nonsector-specificblock transfers, and the states determine how much of these to allocate toeducation; but some transfers are also earmarked for specific items.
Federal transfers constitute a substantial share of state and local rev-enues in most states. In 2009, the share of federal transfers in total rev-enues by state ranged from a high of 91 percent in Blue Nile State to 51percent in Kassala and Red Sea states and a low of 27 percent in KhartoumState (figure 7.9).
Given the importance of federal transfers in state budgets, the unpre-dictability of transfers (in terms of discrepancies between budgeted andrealized transfers and delays in disbursements) makes it difficult for statesto plan their education spending. There are notable differences in transferrealization rates across items. For instance, the budget execution rate forearmarked transfers for higher education goods and services spendingranged from a low of 6 percent to a high of 92 percent, and for salaries,from 93 percent to 118 percent during the period 2005 to 2008 (WorldBank 2007).

180 • The Status of the Education Sector in Sudan
The intention behind federal transfers is to redistribute resources sothat all states are given equal opportunity to provide public services,including education, to their citizens.20 The federal transfers are meant tobe determined according to a formula based on a state’s financial per-formance, population size, natural resources, human resources, infra-structure, education status, security status, and per capita income, whereeach component is assigned a weight that indicates the importance givento it by the government (EU 2008).
However, in practice, the basis on which federal transfers are allocatedis not clear. Although the formula is known, the computations used todetermine the size of actual federal transfers to each state are not avail-able, which makes it impossible to assess whether the intent of providinglarger transfers to states with larger needs occurs in practice. Rather, dis-cussions with the states indicate that transfers for education are primarilybased on a state’s existing payroll and obligations (last year’s budget plusa negotiated increment) (also see EU 2008). Although this system helpsstates honor their payroll obligations and keep existing education servicesrunning, it also tends to perpetuate existing inequalities and reduce states’spending autonomy. For example, states need approval from the federallevel before they can hire more teachers, or they risk not being able to
91% 89% 89% 89% 88% 85% 82% 79%
state
78%70% 67% 65%
51% 51%
27%
9% 11% 11% 11% 12% 15% 18% 21% 22%30% 33% 35%
49% 49%
73%
0
20
40
60
perc
ent
80
100
Blue N
ile
Western
Darfur
River N
ile
Northe
rn Darf
ur
South
Kordofa
nSin
nar
South
ern Darf
ur
Northe
rn
Al Jazir
ah
North K
ordofa
n
Al Qad
arif
White N
ile
Kassala
Red Se
a
Kharto
um
federal transfers state own revenues
Figure 7.9 Federal Transfers and State Own Revenues as a Share of Total Revenues, 2008percent
Source: World Bank Poverty Reduction and Economic Management, Africa Region, preliminary estimates.

Education Finance • 181
honor their payroll, particularly if their own revenues are small. Thus,although the provision of public education is decentralized, the federalgovernment agencies that negotiate the recurrent transfers with stateslargely determine the pace of growth in the provision of services in stateswith fewer own resources.
States with higher average GERs received, on average, larger federaltransfers per capita, which suggests that the states with greater educationneeds may not be receiving the larger federal transfers (figure 7.10).21,22
Some high-GER states (group 1)—for instance, River Nile and Northernstates—with relatively high per-student spending and GERs, received rel-atively large transfers. At the same time, some low-GER states (group 3)with relatively low per-student spending—such as Southern Darfur,Northern Darfur, and Kassala—received smaller per capita transfers.
Group 1: Al Jazirah
Group 1: Northern
Group 1: River Nile
Group 1: White Nile
Group 2: Al Qadarif
Group 2: North Kordofan
Group 2: Sinnar
Group 2: South Kordofan
Group 2: Western Darfur
Group 3: Blue Nile
Group 3: Kassala Group 3: Northern Darfur
Group 3: Red Sea
Group 3: Southern Darfur50
100
150
200
250
fede
ral t
rans
fer
per
capi
ta (c
urre
nt S
DG
), 20
08
20 30 40 50 60 70average GER, 2008–09
Source: World Bank Poverty Reduction and Economic Management, Africa Region, preliminary estimates. Note: The federal transfers refer to all sectors. The average GER (gross enrollment rate) applies to preschool, basic school, and secondary school.
Figure 7.10 Federal Transfers per Capita and Average GER, by State, 2008–09

182 • The Status of the Education Sector in Sudan
SUMMARY
• Total public education spending in northern Sudan has increased sub-stantially over time and so has public spending per student, whichindicates the commitment and effort of the government to expandeducational opportunities. But total public education spending wasrelatively low from a regional perspective, both as a share of GDP andas a share of total public spending. Public per-student spending wasalso generally low compared with that in other countries in the regionfor each education level.
• The share of public spending on basic education in northern Sudanwas smaller than the share in neighboring countries and lower- middle-income countries in both Sub-Saharan and North Africa. Itwas also smaller than the EFA-FTI benchmark. The steady rise inenrollment in basic education will also put pressure on secondaryeducation spending to accommodate rising demand for secondaryeducation over the next few years.
• Teacher salaries constituted the largest spending component, onaverage 76 percent of total recurrent spending (excluding highereducation). The 24 percent spent on goods and services and the non-teaching staff is notably less than the 33 percent EFA-FTI benchmark.In basic education, in particular, public spending on goods and serv-ices was low and accounted for only 5 percent of total recurrentspending.
• Household out-of-pocket payments covered a large share of schoolrunning costs, especially for basic education, implying that basic edu-cation is not always free in practice. Moreover, education accounted fora larger share of consumption for poor rural households than for non-poor rural households, which has implications for equity in access toeducation.
• Most states allocated a large share of their total public spending toeducation, on average, 31 percent. However, there were notable differ-ences in public per-student spending across the 15 states. Federaltransfers constitute the bulk of state revenues, and are intended toassist lagging states to catch up in terms of public service provision,including education. But in practice, federal transfers seem to be deter-mined largely by a state’s payroll obligations plus an increment, andtherefore tend to perpetuate existing disparities.

Education Finance • 183
ANNEX: SPENDING ON EDUCATION
Table 7A.1 Comparison of Public Education Spending, by Region/Country,2005–08
Public education spending
Region/country
Percentage of total public
spendingPercentage
of GDP
School-age population over total population
(percent)
GDP per capita (PPP US$)
Northern Sudan 13.2 2.7 26 1,990
Neighboring countries
Chad 15.6 3.1 29 1,342
Ethiopia 18.8 5.5 28 740
Kenya 29.1 7.0 25 1,432
Lower-middle-income countries in Sub-Saharan Africa
Cape Verde 22.5 5.7 23 2,957
Côte d’Ivoire 25.8 4.4 26 1,526
Lesotho 33.8 13.2 22 1,444
Lower-middle-income countries in North Africa
Egypt, Arab Rep. 12.6 3.7 20 4,212
Morocco 29.3 5.5 19 3,722
Tunisia 34.6 7.1 15 6,743
Sources: World Bank staff estimates (see box 7.1); Pôle de Dakar database 2010; World Bank 2010b; HNP Database (2010).Note: The data for the latest year available for 2005–08. GDP = gross domestic product; PPP US$ = pur-chasing power parity in U.S. dollars.
Table 7A.2 Total, Recurrent, and Development Education Spending, by Administrative Level,2000–09
Administrative level/type of spending 2000 2002 2004 2005 2006 2007 2008 2009
Federal
Total 280 438 584 183 468 498 447 420
Recurrent 280 438 529 135 433 451 400 374
Development 0 0 55 48 36 47 47 46
State
Total 380 599 752 1,149 1,423 1,778 2,062 1,984
Recurrent 376 431 723 1,105 1,359 1,685 1,889 1,813
Development 4 168 28 44 64 93 174 171
(continued next page)

184 • The Status of the Education Sector in Sudan
Federal and state combined
Total 660 1,037 1,335 1,332 1,892 2,276 2,509 2,404
Recurrent 656 869 1,252 1,241 1,792 2,136 2,288 2,187
Development 4 168 83 91 100 140 221 217
Source: World Bank staff estimates (see box 7.1).
Table 7A.2 (continued)
Administrative level/type of spending 2000 2002 2004 2005 2006 2007 2008 2009
Table 7A.3 Preschool: Overview of State Education Spending and STRs, by Group and State, 2009
Group/state
Per-student spending
(current SDG)
Teacher salaries as a multiple of GDP per capita
Student-teacher
ratioNumber ofstudents
Group 1: high GERs 184 1.6 62
Al Jazirah 264 2.0 25 83,263
Khartoum 329 1.3 15 12,362
Northern 210 1.2 18 19,910
River Nile 44 2.1 175 37,012
White Nile 73 1.6 75 43,936
Group 2: intermediate GERs 87 1.6 100
Al Qadarif 138 1.9 47 28,182
North Kordofan 65 1.3 76 42,347
Sinnar 160 1.3 31 7,355
South Kordofan 41 1.9 153 29,450
Western Darfur 31 1.7 195 24,571
Group 3: low GERs 92 1.7 94
Blue Nile 106 1.9 71 9,497
Kassala 136 1.5 76 13,841
Northern Darfur 77 1.3 59 45,498
Red Sea 52 2.2 198 17,777
Southern Darfur 93 1.7 64 36,946
Total 451,947
Source: Staff estimates.Note: The table excludes national service and volunteer teachers and federal spending.

Education Finance • 185
Table 7A.4 Basic Education: Overview of State Education Spending and STRs, by Group and State, 2009
Group/state
Per-student spending
(current SDG)
Teacher salaries as a multiple of
GDP per capita
Student-teacher
ratioNumber ofstudents
Group 1: high GERs 347 2.3 26
Al Jazirah 278 2.3 30 660,747
Khartoum 274 2.2 30 751,053
Northern 542 2.3 17 111,528
River Nile 425 2.6 22 181,569
White Nile 216 1.9 30 306,663
Group 2: intermediate GERs 183 2.1 43
Al Qadarif 204 2.1 38 216,709
North Kordofan 174 2.0 42 515,927
Sinnar 212 2.1 33 226,895
South Kordofan 202 2.0 39 265,455
Western Darfur 124 2.2 64 277,882
Group 3: low GERs 255 2.1 34
Blue Nile 305 1.9 24 122,409
Kassala 297 2.3 31 167,951
Northern Darfur 185 2.1 44 335,905
Red Sea 305 2.2 27 100,062
Southern Darfur 182 2.2 44 381,098
Total 4,621,853
Source: Staff estimates.Note: The table excludes national service and volunteer teachers and federal spending.
Table 7A.5 Academic Secondary Education: Overview of State Education Spending and STRs, by Group and State, 2009
Group/state
Per-student spending
(current SDG)
Teacher salaries as a multiple of
GDP per capita
Student-teacher
ratioNumber ofstudents
Group 1: high GERs 767 2.6 15
Al Jazirah 662 2.9 17 126,513
Khartoum 739 2.5 16 107,422
(continued next page)

186 • The Status of the Education Sector in Sudan
Northern 965 2.4 10 17,634
River Nile 872 2.7 13 30,183
White Nile 598 2.6 17 36,429
Group 2: intermediate GERs 602 2.7 18
Al Qadarif 724 2.8 17 21,086
North Kordofan 630 2.6 16 37,361
Sinnar 774 3.0 13 25,158
South Kordofan 417 2.4 22 26,357
Western Darfur 463 2.6 23 13,684
Group 3: low GERs 823 2.5 16
Blue Nile 1,416 2.2 7 8,435
Kassala 773 2.4 14 15,801
Northern Darfur 480 2.3 18 28,745
Red Sea 910 3.1 19 12,051
Southern Darfur 537 2.6 20 33,839
Total 540,698
Source: Staff estimates.Note: The table excludes national service and volunteer teachers and federal spending.
Table 7A.5 (continued)
Group/state
Per-student spending
(current SDG)
Teacher salaries as a multiple of
GDP per capita
Student-teacher
ratioNumber ofstudents
Table 7A.6 Technical Secondary Education: Overview of State Education Spending and STRs, by Group and State, 2009
Group/state
Per-student spending
(current SDG)
Teacher salaries as a multiple of GDP per capita
Student-teacher ratio
Number ofstudents
Group 1: high GERs 777 2.6 15
Al Jazirah 669 2.9 16 3,302
Khartoum 567 2.5 21 7,336
Northern 911 2.4 11 1,256
River Nile 1,174 2.7 10 1,968
White Nile 564 2.6 18 2,507
Group 2: intermediate GERs 681 2.7 17
Al Qadarif 881 2.8 14 2,409
North Kordofan 848 2.6 12 2,211
(continued next page)
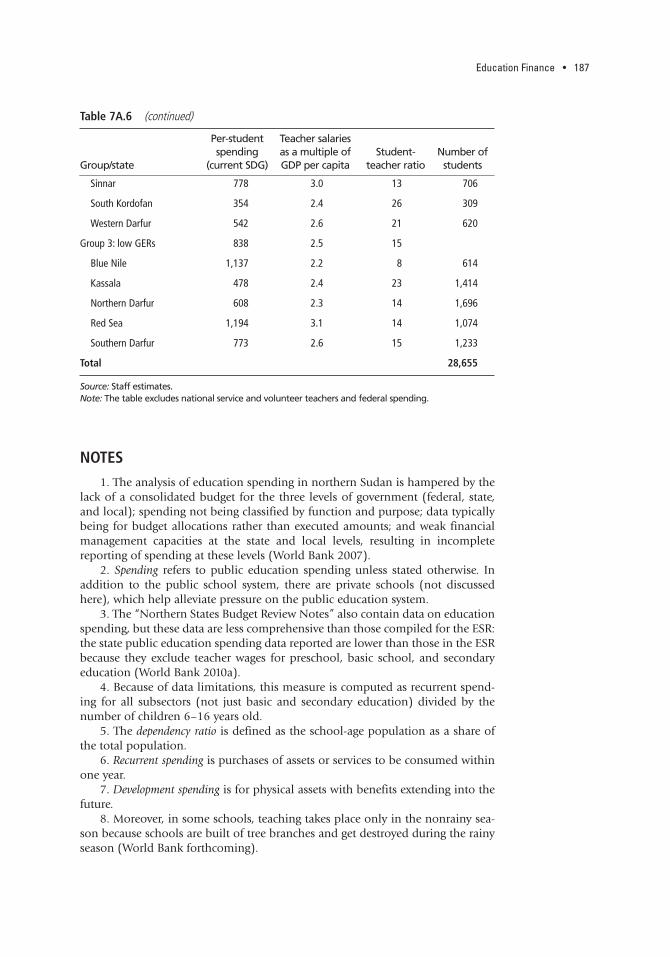
Education Finance • 187
NOTES 1. The analysis of education spending in northern Sudan is hampered by the
lack of a consolidated budget for the three levels of government (federal, state,and local); spending not being classified by function and purpose; data typicallybeing for budget allocations rather than executed amounts; and weak financialmanagement capacities at the state and local levels, resulting in incompletereporting of spending at these levels (World Bank 2007).
2. Spending refers to public education spending unless stated otherwise. Inaddition to the public school system, there are private schools (not discussedhere), which help alleviate pressure on the public education system.
3. The “Northern States Budget Review Notes” also contain data on educationspending, but these data are less comprehensive than those compiled for the ESR:the state public education spending data reported are lower than those in the ESRbecause they exclude teacher wages for preschool, basic school, and secondaryeducation (World Bank 2010a).
4. Because of data limitations, this measure is computed as recurrent spend-ing for all subsectors (not just basic and secondary education) divided by thenumber of children 6–16 years old.
5. The dependency ratio is defined as the school-age population as a share ofthe total population.
6. Recurrent spending is purchases of assets or services to be consumed withinone year.
7. Development spending is for physical assets with benefits extending into thefuture.
8. Moreover, in some schools, teaching takes place only in the nonrainy sea-son because schools are built of tree branches and get destroyed during the rainyseason (World Bank forthcoming).
Table 7A.6 (continued)
Group/state
Per-student spending
(current SDG)
Teacher salaries as a multiple of GDP per capita
Student-teacher ratio
Number ofstudents
Sinnar 778 3.0 13 706
South Kordofan 354 2.4 26 309
Western Darfur 542 2.6 21 620
Group 3: low GERs 838 2.5 15
Blue Nile 1,137 2.2 8 614
Kassala 478 2.4 23 1,414
Northern Darfur 608 2.3 14 1,696
Red Sea 1,194 3.1 14 1,074
Southern Darfur 773 2.6 15 1,233
Total 28,655
Source: Staff estimates.Note: The table excludes national service and volunteer teachers and federal spending.

188 • The Status of the Education Sector in Sudan
9. Total recurrent public spending for all sectors declined between 2008 and2009.
10. This observation is for the spending share of 37 percent adjusted to sixyears rather than eight years of basic education.
11. Spending on teaching and nonteaching staff salaries cannot be separatedfor higher education; therefore, these salaries are excluded when computing theaverage 75 percent salary share in recurrent education spending. When salaries areincluded, the share remains very similar.
12. The term nonteaching staff includes administrators, inspectors, cleaners,drivers, guards, and janitors.
13. The limited information available suggests that in several cases, volunteerteachers are paid by communities, but also in some cases, work for free.
14. The two states excluded were Southern Darfur and Western Darfur.15. This figure excludes national service and volunteer teachers.16. Average salaries were computed as total salary spending for each staff type
divided by the total number of such staff.17. For the purposes of this comparison, public per-student spending on
school running costs is defined as spending on goods and services.18. This figure is for 13 states, excluding Southern Darfur and Western Darfur
because of data limitations.19. The high average spending for academic secondary education for the low-
GER group was driven by Blue Nile State; when excluding this state, we see thatthe high-GER group spends more.
20. The rules governing fiscal transfers are scattered throughout many docu-ments, including the Comprehensive Peace Agreement of 2005, the Darfur PeaceAgreement of 2006, and the Eastern Sudan Peace Agreement of 2006.
21. Whether Blue Nile State was included did not affect this relationship,because it is not an influential observation. For the 14 states, excluding Khar-toum, having a higher average GER was significantly associated with higherfederal transfers.
22. The data are for one year only, and it could be that states with relativelyhigh GERs achieved these rates because of receiving large federal transfers inprevious years. Also, states with more of their own revenues may have beenusing these revenues in the education sector in addition to federal transfers.However, social sector outputs tend to be correlated; thus, states that performrelatively well in the education sector may also be more likely to perform betterin the other sectors.
REFERENCESCastro, Martín, Cumpa. 2010. “Poverty in Northern Sudan. Estimates from the
NBHS 2009.” Draft. World Bank, Washington, DC. EU (European Union). 2008. Cost and Financing Study. European Union. FMoGE (Federal Ministry of General Education). 2008. “Baseline Survey on Basic
Education in the Northern States of Sudan: Final Report June 2008.” Khar-toum. Online document available at http://planipolis.iiep.unesco.org/epiweb/E029336e.pdf.
HNP Stats. 2010. Health, Nutrition and Population Unit, World Bank,Washington,DC. Available at http://databank.worldbank.org/ddp/home.do?Step=12&id=4&CNO=311.

Education Finance • 189
Mingat, A., and K. Majgaard. 2010. Education in Sub-Saharan Africa: A ComparativeAnalysis. Washington, DC: World Bank.
UNESCO Institute for Statistics. 2006. “Teachers and Educational Quality:Monitoring Global Needs for 2015.” UNESCO Institute for Statistics report,Montreal.
World Bank. 2003. “Sudan. Stabilization and Reconstruction.” Country Eco-nomic Memorandum, Volume 1: Main text. Report 24620-SU. PovertyReduction and Economic Management 2, Africa Region, World Bank,Washington, DC.
———. 2007. “Sudan. Public Expenditure Review. Synthesis Report.” Report41840-SD. Poverty Reduction and Economic Management Unit, Africa Region,World Bank, Washington, DC.
———. 2010a. “Northern States Budget Review Notes.” Draft. Poverty Reductionand Economic Management Unit, Africa Region, World Bank, Washington,DC.
———. 2010b. World Development Indicators. World Bank, Washington, DC.Available at http://data.worldbank.org/data-catalog/world-development-indicators.
———. Forthcoming. “Service Delivery in Basic Schools in Four States inNorthern Sudan: Findings from the 2010/11 Service Delivery Survey.” Draft.Education, Africa Region, World Bank, Washington, DC.

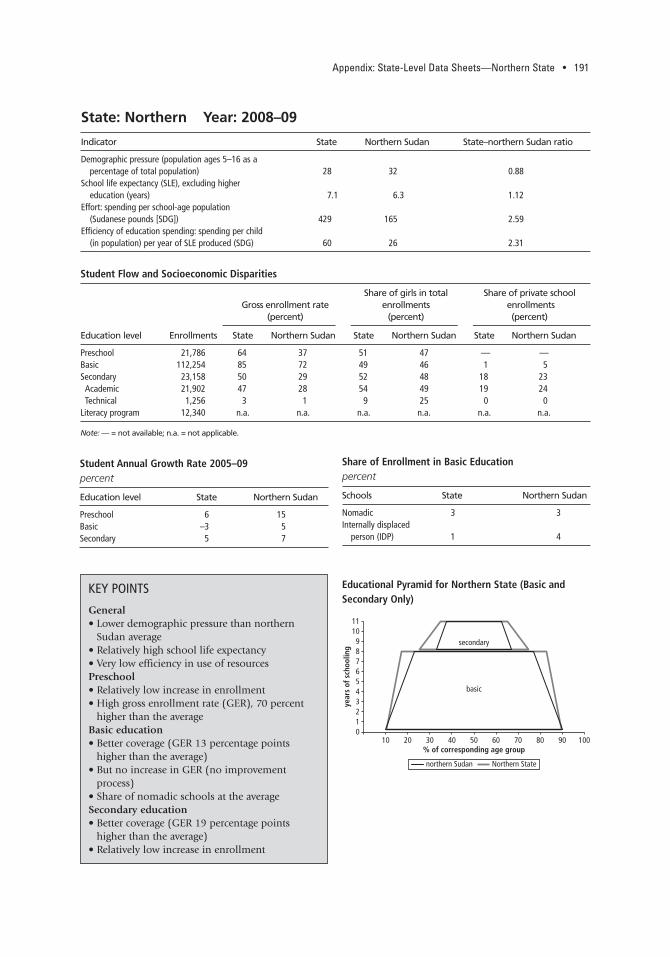
Appendix: State-Level Data Sheets—Northern State • 191
Indicator State Northern Sudan State–northern Sudan ratio
Demographic pressure (population ages 5–16 as a percentage of total population) 28 32 0.88
School life expectancy (SLE), excluding higher education (years) 7.1 6.3 1.12
Effort: spending per school-age population (Sudanese pounds [SDG]) 429 165 2.59
Efficiency of education spending: spending per child (in population) per year of SLE produced (SDG) 60 26 2.31
Student Flow and Socioeconomic Disparities
Share of girls in total Share of private schoolGross enrollment rate enrollments enrollments
(percent) (percent) (percent)
Education level Enrollments State Northern Sudan State Northern Sudan State Northern Sudan
Preschool 21,786 64 37 51 47 — —Basic 112,254 85 72 49 46 1 5Secondary 23,158 50 29 52 48 18 23Academic 21,902 47 28 54 49 19 24Technical 1,256 3 1 9 25 0 0
Literacy program 12,340 n.a. n.a. n.a. n.a. n.a. n.a.
Note: — = not available; n.a. = not applicable.
Student Annual Growth Rate 2005–09percent
Education level State Northern Sudan
Preschool 6 15Basic –3 5Secondary 5 7
Share of Enrollment in Basic Educationpercent
Schools State Northern Sudan
Nomadic 3 3Internally displaced
person (IDP) 1 4
State: Northern Year: 2008–09
0123456789
1011
10 20 30 40 50 60 70 80 90 100% of corresponding age group
year
s of
sch
oolin
g
basic
secondary
northern Sudan Northern State
KEY POINTS
General • Lower demographic pressure than northern
Sudan average• Relatively high school life expectancy • Very low efficiency in use of resources Preschool • Relatively low increase in enrollment • High gross enrollment rate (GER), 70 percent
higher than the average Basic education • Better coverage (GER 13 percentage points
higher than the average) • But no increase in GER (no improvement
process)• Share of nomadic schools at the average Secondary education • Better coverage (GER 19 percentage points
higher than the average) • Relatively low increase in enrollment
Educational Pyramid for Northern State (Basic and Secondary Only)
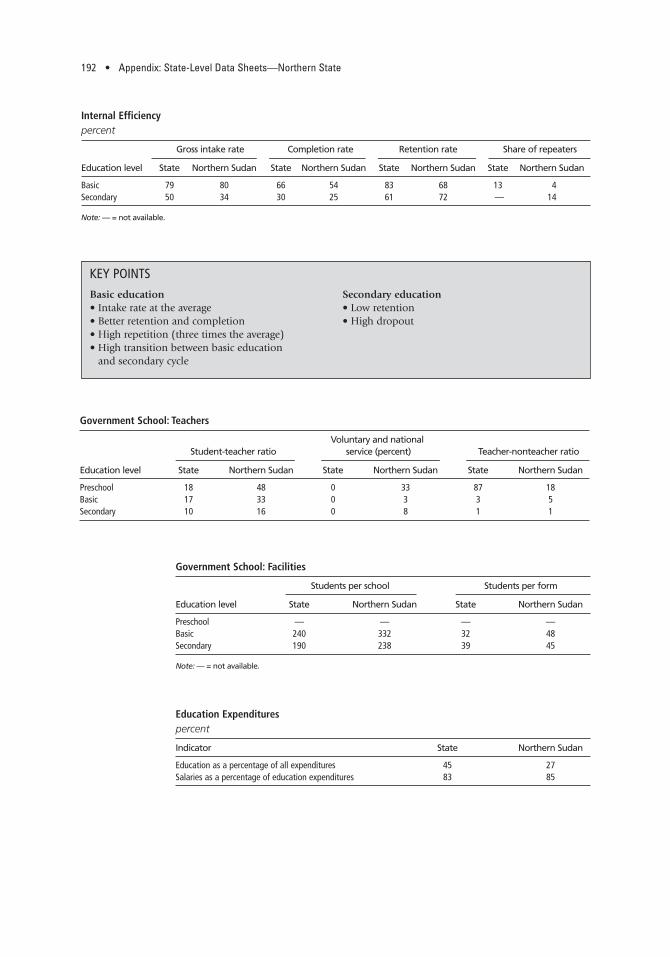
192 • Appendix: State-Level Data Sheets—Northern State
Internal Efficiencypercent
Gross intake rate Completion rate Retention rate Share of repeaters
Education level State Northern Sudan State Northern Sudan State Northern Sudan State Northern Sudan
Basic 79 80 66 54 83 68 13 4Secondary 50 34 30 25 61 72 — 14
Note: — = not available.
Government School: Teachers
Voluntary and nationalStudent-teacher ratio service (percent) Teacher-nonteacher ratio
Education level State Northern Sudan State Northern Sudan State Northern Sudan
Preschool 18 48 0 33 87 18Basic 17 33 0 3 3 5Secondary 10 16 0 8 1 1
Government School: Facilities
Students per school Students per form
Education level State Northern Sudan State Northern Sudan
Preschool — — — —Basic 240 332 32 48Secondary 190 238 39 45
Note: — = not available.
Education Expenditurespercent
Indicator State Northern Sudan
Education as a percentage of all expenditures 45 27Salaries as a percentage of education expenditures 83 85
Basic education • Intake rate at the average • Better retention and completion • High repetition (three times the average)• High transition between basic education
and secondary cycle
Secondary education • Low retention • High dropout
KEY POINTS
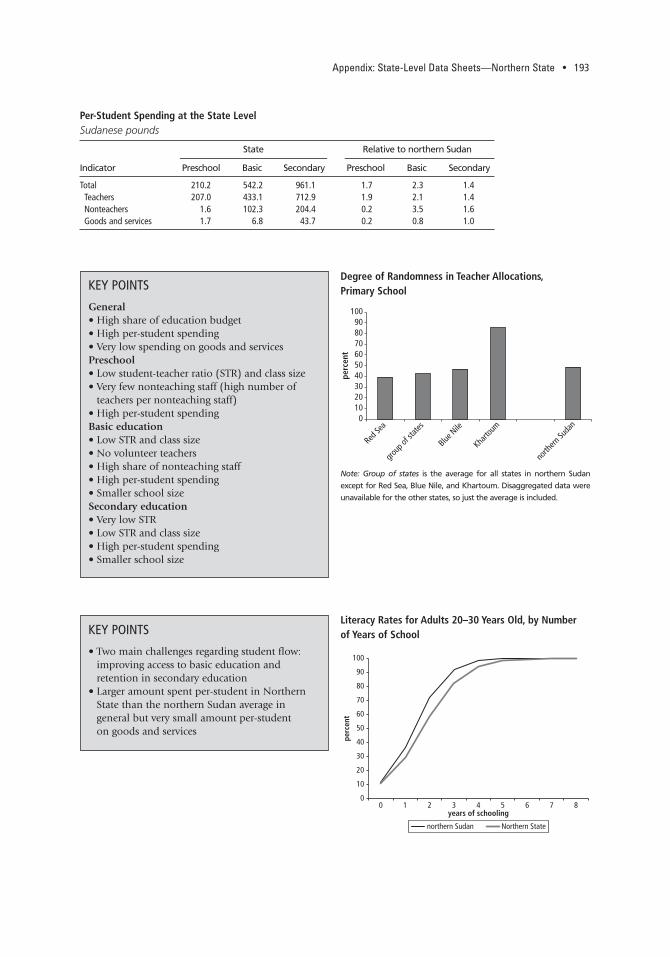
Appendix: State-Level Data Sheets—Northern State • 193
KEY POINTS
General • High share of education budget • High per-student spending• Very low spending on goods and services Preschool • Low student-teacher ratio (STR) and class size• Very few nonteaching staff (high number of
teachers per nonteaching staff)• High per-student spending Basic education • Low STR and class size • No volunteer teachers • High share of nonteaching staff• High per-student spending • Smaller school sizeSecondary education • Very low STR • Low STR and class size • High per-student spending • Smaller school size
KEY POINTS
• Two main challenges regarding student flow:improving access to basic education and retention in secondary education
• Larger amount spent per-student in NorthernState than the northern Sudan average in general but very small amount per-student on goods and services
0102030405060
perc
ent
708090
100
Red Se
a
group
of st
ates
Blue N
ile
Kharto
um
north
ern Su
dan
0
10
20
30
40
50
60
perc
ent
70
80
90
100
0 1 2 3 4 5 6 7 8years of schooling
northern Sudan Northern State
Degree of Randomness in Teacher Allocations, Primary School
Note: Group of states is the average for all states in northern Sudan
except for Red Sea, Blue Nile, and Khartoum. Disaggregated data were
unavailable for the other states, so just the average is included.
Literacy Rates for Adults 20–30 Years Old, by Number of Years of School
Per-Student Spending at the State LevelSudanese pounds
State Relative to northern Sudan
Indicator Preschool Basic Secondary Preschool Basic Secondary
Total 210.2 542.2 961.1 1.7 2.3 1.4Teachers 207.0 433.1 712.9 1.9 2.1 1.4Nonteachers 1.6 102.3 204.4 0.2 3.5 1.6Goods and services 1.7 6.8 43.7 0.2 0.8 1.0
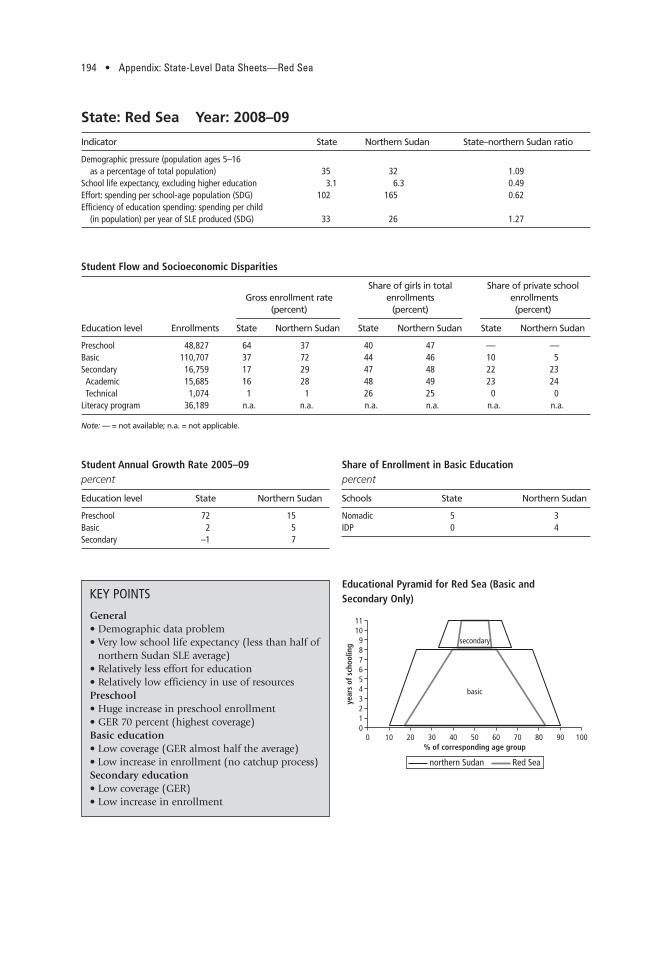
194 • Appendix: State-Level Data Sheets—Red Sea
Indicator State Northern Sudan State–northern Sudan ratio
Demographic pressure (population ages 5–16 as a percentage of total population) 35 32 1.09
School life expectancy, excluding higher education 3.1 6.3 0.49Effort: spending per school-age population (SDG) 102 165 0.62Efficiency of education spending: spending per child
(in population) per year of SLE produced (SDG) 33 26 1.27
Student Flow and Socioeconomic Disparities
Share of girls in total Share of private schoolGross enrollment rate enrollments enrollments
(percent) (percent) (percent)
Education level Enrollments State Northern Sudan State Northern Sudan State Northern Sudan
Preschool 48,827 64 37 40 47 — —Basic 110,707 37 72 44 46 10 5Secondary 16,759 17 29 47 48 22 23Academic 15,685 16 28 48 49 23 24Technical 1,074 1 1 26 25 0 0
Literacy program 36,189 n.a. n.a. n.a. n.a. n.a. n.a.
Note: — = not available; n.a. = not applicable.
Student Annual Growth Rate 2005–09percent
Education level State Northern Sudan
Preschool 72 15Basic 2 5Secondary –1 7
Share of Enrollment in Basic Educationpercent
Schools State Northern Sudan
Nomadic 5 3IDP 0 4
State: Red Sea Year: 2008–09
0123456789
1011
0 10 20 30 40 50 60 70 80 90 100% of corresponding age group
year
s of
sch
oolin
g
basic
secondary
northern Sudan Red Sea
KEY POINTS
General• Demographic data problem• Very low school life expectancy (less than half of
northern Sudan SLE average)• Relatively less effort for education• Relatively low efficiency in use of resourcesPreschool• Huge increase in preschool enrollment • GER 70 percent (highest coverage)Basic education• Low coverage (GER almost half the average) • Low increase in enrollment (no catchup process)Secondary education • Low coverage (GER) • Low increase in enrollment
Educational Pyramid for Red Sea (Basic and Secondary Only)

Appendix: State-Level Data Sheets—Red Sea • 195
Internal Efficiencypercent
Gross intake rate Completion rate Retention rate Share of repeaters
Education level State Northern Sudan State Northern Sudan State Northern Sudan State Northern Sudan
Basic 66 80 20 54 31 68 9 4Secondary 16 34 13 25 79 72 — 14
Note: — = not available.
Government School: Teachers
Voluntary and national Student-teacher ratio service (percent) Teacher-nonteacher ratio
Education level State Northern Sudan State Northern Sudan State Northern Sudan
Preschool 198 48 87 33 6 18Basic 27 33 6 3 5 5Secondary 18 16 32 8 1 1
Basic education• Low intake• Very low retention, low completion• High dropout (occurring mainly within the cycle)• High transition between basic education and
secondary cycle
Secondary education• High retention
Government School: Facilities
Students per school Students per form
Education level State Northern Sudan State Northern Sudan
Preschool — — — —Basic 240 332 41 48Secondary 274 238 41 45
Note: — = not available.
KEY POINTS
Education Expenditurespercent
Indicator State Northern Sudan
Education as a percentage of all expenditures 19 27Salaries as a percentage of education expenditures 59 85

196 • Appendix: State-Level Data Sheets—Red Sea
KEY POINTS
General • Low share of education budget• Intensive use of volunteer teachers • High share of goods and services spending Preschool• Very high STR Basic education • Smaller STR • Smaller school size Secondary education• Slightly high STR • Bigger school size
KEY POINTS
• Very low on both access and retention • Very small secondary education coverage • Low effort on education• Intensive use of volunteers teachers
0102030405060
perc
ent
708090
100
Red Se
a
group
of st
ates
Blue N
ile
Kharto
um
north
ern Su
dan
0
10
20
30
40
50
60
70
perc
ent
80
90
100
0 1 2 3 4 5 6 7 8years of schooling
northern Sudan Red Sea
Degree of Randomness in Teacher Allocations, Primary School
Per-Student Spending at the State LevelSudanese pounds
State Relative to northern Sudan
Indicator Preschool Basic Secondary Preschool Basic Secondary
Total 51.7 304.5 933.4 0.4 1.3 1.3Teachers 33.9 248.6 529.9 0.3 1.2 1.0Nonteachers 14.5 30.3 163.6 2.2 1.0 1.2Goods and services 3.3 25.6 239.8 0.4 2.9 5.4
Note: Group of states is the average for all states in northern Sudan
except for Red Sea, Blue Nile, and Khartoum. Disaggregated data were
unavailable for the other states, so just the average is included.
Literacy Rates for Adults 20–30 Years Old, by Number of Years of School

Appendix: State-Level Data Sheets—River Nile • 197
Indicator State Northern Sudan State–northern Sudan ratio
Demographic pressure (population ages 5–16 as a percentage of total population) 28 32 0.86
School life expectancy, excluding higher education 7.8 6.3 1.24Effort: spending per school-age population (SDG) 360 165 2.18Efficiency of education spending: spending per child
(in population) per year of SLE produced (SDG) 46 26 1.76
State: River Nile Year: 2008–09
0123456789
1011
0 10 20 30 40 50 60 70 80 90 100% of corresponding age group
year
s of
sch
oolin
g
basic
secondary
northern Sudan River Nile
KEY POINTS
General • Relatively low demographic pressure • Relatively high school life expectancy • High level of spending per school-age population • Less efficient use of resources • Very low share of private schools Preschool • High GER• More girls than boys enrolled Basic education • Better coverage (GER 12 percentage points
higher than the average) • But no increase in GER (no improvement process) • Higher share of nomadic schools than the
average Secondary education • Better coverage (GER 16 percentage points
higher than the average) • Relatively low increase in enrollment
Educational Pyramid for River Nile (Basic and Secondary Only)
Student Flow and Socioeconomic Disparities
Share of girls in total Share of private schoolGross enrollment rate enrollments enrollments
(percent) (percent) (percent)
Education level Enrollments State Northern Sudan State Northern Sudan State Northern Sudan
Preschool 37,878 65 37 51 47 — —Basic 183,605 89 72 47 46 1 5Secondary 33,875 47 29 53 48 5 23Academic 31,907 44 28 55 49 5 24Technical 1,968 3 1 20 25 0 0
Literacy program 5,335 n.a. n.a. n.a. n.a. n.a. n.a.
Note: — = not available; n.a. = not applicable.
Student Annual Growth Rate 2005–09percent
Education level State Northern Sudan
Preschool 14 15Basic 0 5Secondary 4 7
Share of Enrollment in Basic Educationpercent
Schools State Northern Sudan
Nomadic 4 3IDP 0 4

198 • Appendix: State-Level Data Sheets—River Nile
Internal Efficiencypercent
Gross intake rate Completion rate Retention rate Share of repeaters
Education level State Northern Sudan State Northern Sudan State Northern Sudan State Northern Sudan
Basic 92 80 70 54 76 68 7 4Secondary 49 34 36 25 73 72 — 14
Note: — = not available.
Government School: Teachers
Voluntary and national Student-teacher ratio service (percent) Teacher-nonteacher ratio
Education level State Northern Sudan State Northern Sudan State Northern Sudan
Preschool 175 48 86 33 24 18Basic 22 33 0 3 5 5Secondary 13 16 0 8 0 1
Basic education • High intake rate • Low retention• High dropout• Relatively high completion rate• High transition between basic education and
secondary cycle
Secondary education• Low retention • High dropout
Government School: Facilities
Students per school Students per form
Education level State Northern Sudan State Northern Sudan
Preschool — — — —Basic 241 332 37 48Secondary 199 238 41 45
Note: — = not available.
KEY POINTS
Education Expenditurespercent
Indicator State Northern Sudan
Education as a percentage of all expenditures 32 27Salaries as a percentage of education expenditures 96 85
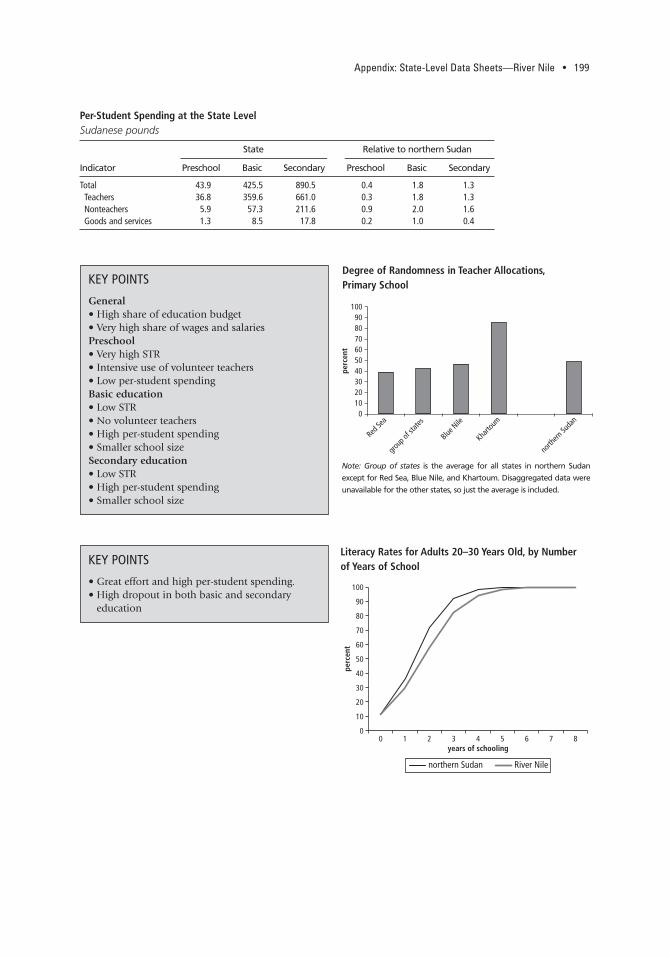
Appendix: State-Level Data Sheets—River Nile • 199
KEY POINTS
General • High share of education budget • Very high share of wages and salaries Preschool • Very high STR • Intensive use of volunteer teachers• Low per-student spending Basic education • Low STR • No volunteer teachers• High per-student spending • Smaller school size Secondary education• Low STR • High per-student spending • Smaller school size
KEY POINTS
• Great effort and high per-student spending.• High dropout in both basic and secondary
education
0102030405060
perc
ent
708090
100
Red Se
a
group
of st
ates
Blue N
ile
Kharto
um
north
ern Su
dan
0
10
20
30
40
50
60
70
80
90
100
perc
ent
0 1 2 3 4 5 6 7 8years of schooling
northern Sudan River Nile
Degree of Randomness in Teacher Allocations, Primary School
Note: Group of states is the average for all states in northern Sudan
except for Red Sea, Blue Nile, and Khartoum. Disaggregated data were
unavailable for the other states, so just the average is included.
Literacy Rates for Adults 20–30 Years Old, by Number of Years of School
Per-Student Spending at the State LevelSudanese pounds
State Relative to northern Sudan
Indicator Preschool Basic Secondary Preschool Basic Secondary
Total 43.9 425.5 890.5 0.4 1.8 1.3Teachers 36.8 359.6 661.0 0.3 1.8 1.3Nonteachers 5.9 57.3 211.6 0.9 2.0 1.6Goods and services 1.3 8.5 17.8 0.2 1.0 0.4

200 • Appendix: State-Level Data Sheets—Khartoum
Indicator State Northern Sudan State–northern Sudan ratio
Demographic pressure (population ages 5–16 as a percentage of total population) 32 32 0.99
School life expectancy, excluding higher education 8.8 6.3 1.40Effort: spending per school-age population (SDG) 216 165 1.31Efficiency of education spending: spending per child
(in population) per year of SLE produced (SDG) 24 26 0.94
Student Flow and Socioeconomic Disparities
Share of girls in total Share of private schoolGross enrollment rate enrollments enrollments
(percent) (percent) (percent)
Education level Enrollments State Northern Sudan State Northern Sudan State Northern Sudan
Preschool 111,497 43 37 49 47Basic 862,170 94 72 50 46 13 5Secondary 205,801 61 29 51 48 44 23Academic 198,465 59 28 52 49 46 24Technical 7,336 2 1 22 25 0 0
Literacy program 0 n.a. n.a. n.a. n.a. n.a. n.a.
Note: — = not available; n.a. = not applicable.
Student Annual Growth Rate 2005–09percent
Education level State Northern Sudan
Preschool 4 15Basic 6 5Secondary 14 7
Share of Enrollment in Basic Educationpercent
Schools State Northern Sudan
Nomadic 0 3IDP 0 4
State: Khartoum Year: 2008–09
0123456789
1011
0 10 20 30 40 50 60 70 80 90 100% of corresponding age group
year
s of
sch
oolin
g
basic
secondary
northern Sudan Khartoum
KEY POINTS
General • Relatively high school life expectancy • High level of spending per school-age population • Very high share of private schools Preschool • High GER• Very small increase over the past 5 years • More girls than boys enrolled Basic education • Better coverage (GER 22 percentage points
higher than the average) • Steady increase in GER Secondary education • Better coverage (more than two times higher
than the average) • Rapid and sharp increase in enrollment and GER
Educational Pyramid for Khartoum (Basic and Secondary Only)

Appendix: State-Level Data Sheets—Khartoum • 201
Internal Efficiencypercent
Gross intake rate Completion rate Retention rate Share of repeaters
Education level State Northern Sudan State Northern Sudan State Northern Sudan State Northern Sudan
Basic 97 80 88 54 91 68 1 4Secondary 53 34 40 25 75 72 — 14
Note: — = not available.
Basic education • High intake rate • High retention • Relatively high completion rate • Limited transition between basic education and
secondary cycle
Secondary education• Low retention • High dropout
KEY POINTS
Government School: Teachers
Voluntary and national Student-teacher ratio service (percent) Teacher-nonteacher ratio
Education level State Northern Sudan State Northern Sudan State Northern Sudan
Preschool 15 48 0 33 50 18Basic 30 33 0 3 5 5Secondary 16 16 0 8 0 1
Government School: Facilities
Students per school Students per form
Education level State Northern Sudan State Northern Sudan
Preschool — — — —Basic 474 332 51 48Secondary 313 238 47 45
Note: — = not available.
Education Expenditurespercent
Indicator State Northern Sudan
Education as a percentage of all expenditures 23 27Salaries as a percentage of education expenditures 80 85

202 • Appendix: State-Level Data Sheets—Khartoum
Per-Student Spending at the State LevelSudanese pounds
State Relative to northern Sudan
Indicator Preschool Basic Secondary Preschool Basic Secondary
Total 329.2 274.4 727.9 2.6 1.1 1.0Teachers 261.8 233.4 467.3 2.4 1.2 0.9Nonteachers 4.5 25.9 198.0 0.7 0.9 1.5Goods and services 62.9 15.1 62.5 8.5 1.7 1.4
KEY POINTS
General • Low STR for all levels of education • No volunteers teachers• Smaller share of resources allocated to education Preschool • Large number of teachers per nonteaching staff
(2.5 times larger than the average) • High per-student spending (2.6 times higher
than the average)• More spending on goods and services (8.5 times
larger than the average) Basic education • No volunteer teachers• Bigger school size• Larger class size • High per-student spending (2.4 times higher
than the average) • More spending on goods and services Secondary education• Bigger school size • More spending on goods and services
KEY POINTS
Basic education • Very weak relationship between number of
teachers and number of students
0102030405060
perc
ent
708090
100
Red Se
a
group
of st
ates
Blue N
ile
Kharto
um
north
ern Su
dan
0
10
20
30
40
50
60
70
80
90
100
perc
ent
0 1 2 3 4 5 6 7 8years of schooling
northern Sudan Khartoum
Degree of Randomness in Teacher Allocations, Primary School
Note: Group of states is the average for all states in northern Sudan
except for Red Sea, Blue Nile, and Khartoum. Disaggregated data were
unavailable for the other states, so just the average is included.
Literacy Rates for Adults 20–30 Years Old, by Number of Years of School

Appendix: State-Level Data Sheets—Al Jazirah • 203
Indicator State Northern Sudan State–northern Sudan ratio
Demographic pressure (population ages 5–16 as a percentage of total population) 33 32 1.03
School life expectancy, excluding higher education 8.6 6.3 1.35Effort: spending per school-age population (SDG) 272 165 1.65Efficiency of education spending: spending per child
(in population) per year of SLE produced (SDG) 32 26 1.22
State: Al Jazirah Year: 2008–09
0123456789
1011
0 10 20 30 40 50 60 70 80 90 100% of corresponding age group
year
s of
sch
oolin
g
basic
secondary
northern Sudan Al Jazirah
KEY POINTS
General • Relatively low demographic pressure • Relatively high school life expectancy • High level of spending per school-age
population • Less efficient use of resources • Low share of private schools Preschool • High GER • More girls than boys enrolled Basic education • High GER (18 percentage points higher than the
average) • No increase in GER Secondary education • High GER (two times the average) • No enrollment increase
Educational Pyramid for Al Jazirah (Basic and Secondary Only)
Student Flow and Socioeconomic Disparities
Share of girls in total Share of private schoolGross enrollment rate enrollments enrollments
(percent) (percent) (percent)
Education level Enrollments State Northern Sudan State Northern Sudan State Northern Sudan
Preschool 92,878 44 37 51 47 — —Basic 667,422 90 72 47 46 1 5Secondary 144,578 57 29 52 48 10 23Academic 141,276 56 28 53 49 10 24Technical 3,302 1 1 15 25 0 0
Literacy program 13,354 n.a. n.a. n.a. n.a. n.a. n.a.
Note: — = not available; n.a. = not applicable.
Student Annual Growth Rate 2005–09percent
Education level State Northern Sudan
Preschool 11 15Basic 0 5Secondary 6 7
Share of Enrollment in Basic Educationpercent
Schools State Northern Sudan
Nomadic 0 3IDP 0 4

204 • Appendix: State-Level Data Sheets—Al Jazirah
Internal Efficiencypercent
Gross intake rate Completion rate Retention rate Share of repeaters
Education level State Northern Sudan State Northern Sudan State Northern Sudan State Northern Sudan
Basic 94 80 70 54 75 68 2 4Secondary 62 34 47 25 75 72 — 14
Note: — = not available.
Basic education • High intake rate • High retention • Relatively high completion rate • Limited transition between basic education and
secondary cycle
Secondary education • Low retention • High dropout
KEY POINTS
Government School: Teachers
Voluntary and national Student-teacher ratio service (percent) Teacher-nonteacher ratio
Education level State Northern Sudan State Northern Sudan State Northern Sudan
Preschool 15 48 0 33 50 18Basic 30 33 0 3 5 5Secondary 16 16 0 8 0 1
Government School: Facilities
Students per school Students per form
Education level State Northern Sudan State Northern Sudan
Preschool — — — —Basic 474 332 51 48Secondary 313 238 47 45
Note: — = not available.
Education Expenditurespercent
Indicator State Northern Sudan
Education as a percentage of all expenditures 47 27Salaries as a percentage of education expenditures 92 85

Appendix: State-Level Data Sheets—Al Jazirah • 205
Per-Student Spending at the State LevelSudanese pounds
State Relative to northern Sudan
Indicator Preschool Basic Secondary Preschool Basic Secondary
Total 264.0 277.7 662.1 2.1 1.2 1.0Teachers 250.2 238.3 545.4 2.3 1.2 1.1Nonteachers 10.5 35.2 99.8 1.6 1.2 0.8Goods and services 3.3 4.1 16.9 0.4 0.5 0.4
KEY POINTS
Preschool • Low STR • Low share of volunteers• Large number of teachers per nonteaching staff Basic education • Large share of volunteer teachers (two times the
average) • Relatively high per-student spending (1.2 times
higher than the average) • Very low spending on goods and services Secondary education• Smaller school size • Smaller class size • Very low spending on goods and services
0102030405060
perc
ent
708090
100
Red Se
a
group
of st
ates
Blue N
ile
Kharto
um
north
ern Su
dan
0
10
20
30
40
50
60
70
80
90
100
perc
ent
0 1 2 3 4 5 6 7 8years of schooling
northern Sudan Al Jazirah
Degree of Randomness in Teacher Allocations, Primary School
Note: Group of states is the average for all states in northern Sudan
except for Red Sea, Blue Nile, and Khartoum. Disaggregated data were
unavailable for the other states, so just the average is included.
Literacy Rates for Adults 20–30 Years Old, by Number of Years of School

206 • Appendix: State-Level Data Sheets—Blue Nile
Indicator State Northern Sudan State–northern Sudan ratio
Demographic pressure (population ages 5–16 as a percentage of total population) 34 32 1.06
School life expectancy, excluding higher education 5.6 6.3 0.88
Effort: spending per school-age population (SDG) 201 165 1.22Efficiency of education spending: spending per child
(in population) per year of SLE produced (SDG) 36 26 1.39
Student Flow and Socioeconomic Disparities
Share of girls in total Share of private schoolGross enrollment rate enrollments enrollments
(percent) (percent) (percent)
Education level Enrollments State Northern Sudan State Northern Sudan State Northern Sudan
Preschool 12,248 20 37 50 47 — —Basic 122,786 65 72 44 46 0 5Secondary 10,835 20 29 37 48 16 23Academic 10,221 19 28 37 49 17 24Technical 614 1 1 34 25 0 0
Literacy program 0 n.a. n.a. n.a. n.a. n.a. n.a.
Note: — = not available; n.a. = not applicable.
Student Annual Growth Rate 2005–09percent
Education level State Northern Sudan
Preschool 26 15Basic 7 5Secondary 8 7
Share of Enrollment in Basic Educationpercent
Schools State Northern Sudan
Nomadic 2 3IDP 0 4
State: Blue Nile Year: 2008–09
0123456789
1011
0 10 20 30 40 50 60 70 80 90 100% of corresponding age group
year
s of
sch
oolin
g
basic
secondary
northern Sudan Blue Nile
KEY POINTS
General• Relatively low school life expectancy • High level of spending per school-age
population • Less efficient use of resources • Low share of private schools Preschool • Low GER • No increase in GER over the past 5 years • More girls than boys enrolled Basic education • Lower GER (7 percentage points lower than
the average) • Rapid increase in GER Secondary education • Very low GER • No increase in enrollment
Educational Pyramid for Blue Nile (Basic and Secondary Only)
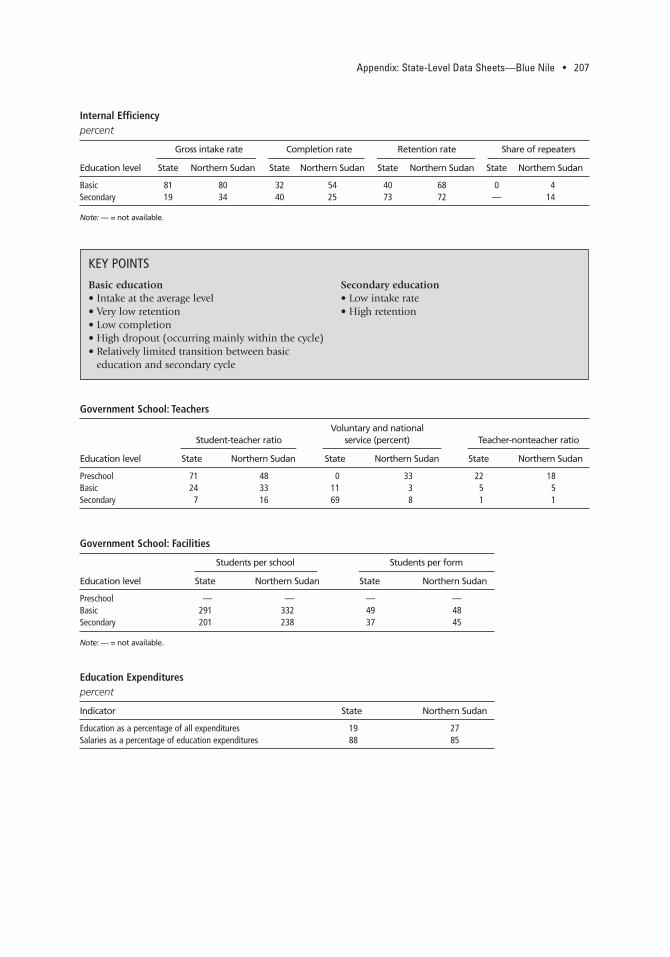
Appendix: State-Level Data Sheets—Blue Nile • 207
Internal Efficiencypercent
Gross intake rate Completion rate Retention rate Share of repeaters
Education level State Northern Sudan State Northern Sudan State Northern Sudan State Northern Sudan
Basic 81 80 32 54 40 68 0 4Secondary 19 34 40 25 73 72 — 14
Note: — = not available.
Basic education • Intake at the average level • Very low retention• Low completion • High dropout (occurring mainly within the cycle) • Relatively limited transition between basic
education and secondary cycle
Secondary education• Low intake rate • High retention
KEY POINTS
Government School: Teachers
Voluntary and national Student-teacher ratio service (percent) Teacher-nonteacher ratio
Education level State Northern Sudan State Northern Sudan State Northern Sudan
Preschool 71 48 0 33 22 18Basic 24 33 11 3 5 5Secondary 7 16 69 8 1 1
Government School: Facilities
Students per school Students per form
Education level State Northern Sudan State Northern Sudan
Preschool — — — —Basic 291 332 49 48Secondary 201 238 37 45
Note: — = not available.
Education Expenditurespercent
Indicator State Northern Sudan
Education as a percentage of all expenditures 19 27Salaries as a percentage of education expenditures 88 85

208 • Appendix: State-Level Data Sheets—Blue Nile
Per-Student Spending at the State LevelSudanese pounds
State Relative to northern Sudan
Indicator Preschool Basic Secondary Preschool Basic Secondary
Total 105.5 304.6 1,397.4 0.8 1.3 2.0Teachers 82.0 255.6 998.9 0.7 1.3 1.9Nonteachers 2.7 36.0 207.8 0.4 1.2 1.6Goods and services 20.8 13.0 190.7 2.8 1.5 4.3
KEY POINTS
General • Smaller school size Preschool • High STR• No volunteer teachers • Large number of teachers per nonteaching staff • Low per-student spending • More spending on goods and services (2.8 times
the average) Basic education • Low STR • Relatively high per-student spending
(30 percent higher than the average) • More spending on goods and services Secondary education• High per-student spending (2 times the average)• More spending on goods and services (4.3 times
the average)
0102030405060
perc
ent
708090
100
Red Se
a
group
of st
ates
Blue N
ile
Kharto
um
north
ern Su
dan
0
10
20
30
40
50
60
70
80
90
100
perc
ent
0 1 2 3 4 5 6 7 8years of schooling
northern Sudan Blue Nile
Degree of Randomness in Teacher Allocations, Primary School
Note: Group of states is the average for all states in northern Sudan
except for Red Sea, Blue Nile, and Khartoum. Disaggregated data were
unavailable for the other states, so just the average is included.
Literacy Rates for Adults 20–30 Years Old, by Number of Years of School

Appendix: State-Level Data Sheets—Sinnar • 209
Indicator State Northern Sudan State–northern Sudan ratio
Demographic pressure (population ages 5–16 as a percentage of total population) 26 32 0.82
School life expectancy, excluding higher education 6.8 6.3 1.08Effort: spending per school-age population (SDG) 175 165 1.06Efficiency of education spending: spending per child
(in population) per year of SLE produced (SDG) 26 26 0.98
State: Sinnar Year: 2008–09
0123456789
1011
0 10 20 30 40 50 60 70 80 90 100% of corresponding age group
year
s of
sch
oolin
g
basic
secondary
northern Sudan Sinnar
KEY POINTS
General • Relatively low demographic pressure • Low share of private schoolsPreschool • Low GER • Disparity against girls Basic education • GER at the average level • Steady increase in GER Secondary education • GER at the average level • No GER increase
Educational Pyramid for Sinnar (Basic and Secondary Only)
Student Flow and Socioeconomic Disparities
Share of girls in total Share of private schoolGross enrollment rate enrollments enrollments
(percent) (percent) (percent)
Education level Enrollments State Northern Sudan State Northern Sudan State Northern Sudan
Preschool 11,260 13 37 41 47 — —Basic 228,286 80 72 46 46 1 5Secondary 27,940 31 29 48 48 7 23Academic 27,234 30 28 49 49 8 24Technical 706 1 1 37 25 0 0
Literacy program 9,946 n.a. n.a. n.a. n.a. n.a. n.a.
Note: — = not available; n.a. = not applicable.
Student Annual Growth Rate 2005–09percent
Education level State Northern Sudan
Preschool 5 15Basic 6 5Secondary 7 7
Share of Enrollment in Basic Educationpercent
Schools State Northern Sudan
Nomadic 2 3IDP 0 4

210 • Appendix: State-Level Data Sheets—Sinnar
Internal Efficiencypercent
Gross intake rate Completion rate Retention rate Share of repeaters
Education level State Northern Sudan State Northern Sudan State Northern Sudan State Northern Sudan
Basic 75 80 63 54 83 68 7 4Secondary 37 34 22 25 58 72 — 14
Note: — = not available.
Basic education • Intake rate lower than the average • High retention • Relatively high completion rate • Limited transition between basic education and
secondary cycle
Secondary education • Low intake rate • Low retention• High dropout• Low completion
KEY POINTS
Government School: Teachers
Voluntary and national Student-teacher ratio service (percent) Teacher-nonteacher ratio
Education level State Northern Sudan State Northern Sudan State Northern Sudan
Preschool 31 48 0 33 4 18Basic 33 33 0 3 8 5Secondary 13 16 0 8 5 1
Government School: Facilities
Students per school Students per form
Education level State Northern Sudan State Northern Sudan
Preschool — — — —Basic 335 332 50 48Secondary 149 238 53 45
Note: — = not available.
Education Expenditurespercent
Indicator State Northern Sudan
Education as a percentage of all expenditures 37 27Salaries as a percentage of education expenditures 92 85

Appendix: State-Level Data Sheets—Sinnar • 211
Per-Student Spending at the State LevelSudanese pounds
State Relative to northern Sudan
Indicator Preschool Basic Secondary Preschool Basic Secondary
Total 160.1 211.6 774.1 1.3 0.9 1.1Teachers 132.3 190.7 708.8 1.2 0.9 1.4Nonteachers 21.6 17.0 51.2 3.3 0.6 0.4Goods and services 6.2 3.9 14.2 0.8 0.4 0.3
KEY POINTS
General • No volunteer teachers • High share of resources allocated to education• Very high share of wages and salaries within the
education budget Preschool • Small number of teacher per nonteaching staff • High per-student spending (30 percent higher
than the average) • Very small spending on goods and services Basic education• Large class size • STR and per-student spending similar to country
average• Very small spending on goods and services Secondary education• Smaller school size• Smaller STR • Bigger class size
0102030405060
perc
ent
708090
100
Red Se
a
group
of st
ates
Blue N
ile
Kharto
um
north
ern Su
dan
0
10
20
30
40
50
60
70
80
90
100
perc
ent
0 1 2 3 4 5 6 7 8years of schooling
northern Sudan Sinnar
Degree of Randomness in Teacher Allocations, Primary School
Note: Group of states is the average for all states in northern Sudan
except for Red Sea, Blue Nile, and Khartoum. Disaggregated data were
unavailable for the other states, so just the average is included.
Literacy Rates for Adults 20–30 Years Old, by Number of Years of School
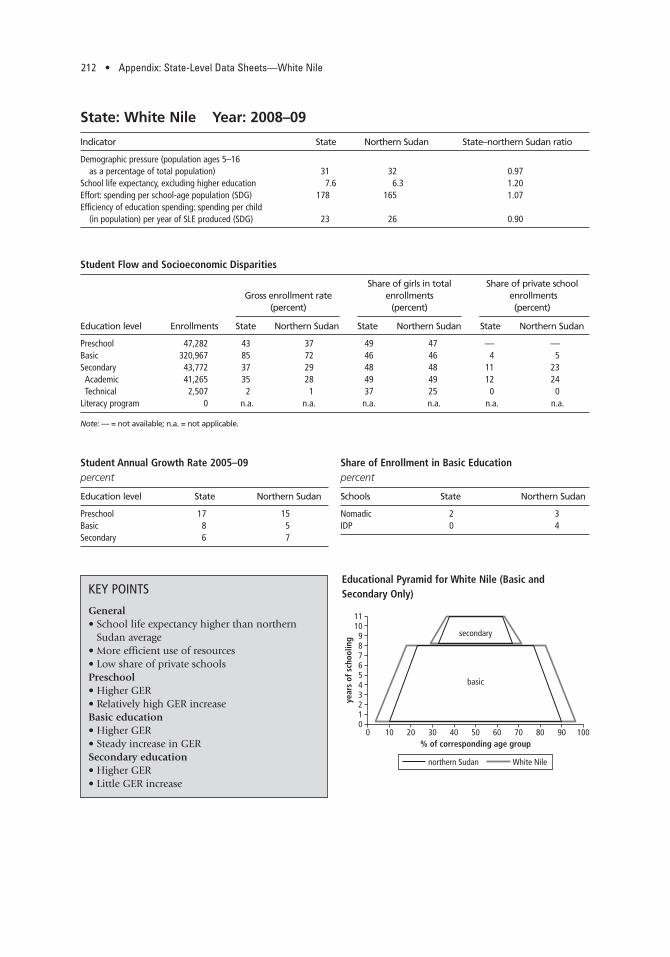
212 • Appendix: State-Level Data Sheets—White Nile
Indicator State Northern Sudan State–northern Sudan ratio
Demographic pressure (population ages 5–16 as a percentage of total population) 31 32 0.97
School life expectancy, excluding higher education 7.6 6.3 1.20Effort: spending per school-age population (SDG) 178 165 1.07Efficiency of education spending: spending per child
(in population) per year of SLE produced (SDG) 23 26 0.90
State: White Nile Year: 2008–09
0123456789
1011
0 10 20 30 40 50 60 70 80 90 100% of corresponding age group
year
s of
sch
oolin
g
basic
secondary
northern Sudan White Nile
KEY POINTS
General• School life expectancy higher than northern
Sudan average • More efficient use of resources • Low share of private schools Preschool • Higher GER • Relatively high GER increase Basic education • Higher GER • Steady increase in GER Secondary education • Higher GER • Little GER increase
Educational Pyramid for White Nile (Basic and Secondary Only)
Student Flow and Socioeconomic Disparities
Share of girls in total Share of private schoolGross enrollment rate enrollments enrollments
(percent) (percent) (percent)
Education level Enrollments State Northern Sudan State Northern Sudan State Northern Sudan
Preschool 47,282 43 37 49 47 — —Basic 320,967 85 72 46 46 4 5Secondary 43,772 37 29 48 48 11 23Academic 41,265 35 28 49 49 12 24Technical 2,507 2 1 37 25 0 0
Literacy program 0 n.a. n.a. n.a. n.a. n.a. n.a.
Note: — = not available; n.a. = not applicable.
Student Annual Growth Rate 2005–09percent
Education level State Northern Sudan
Preschool 17 15Basic 8 5Secondary 6 7
Share of Enrollment in Basic Education percent
Schools State Northern Sudan
Nomadic 2 3IDP 0 4
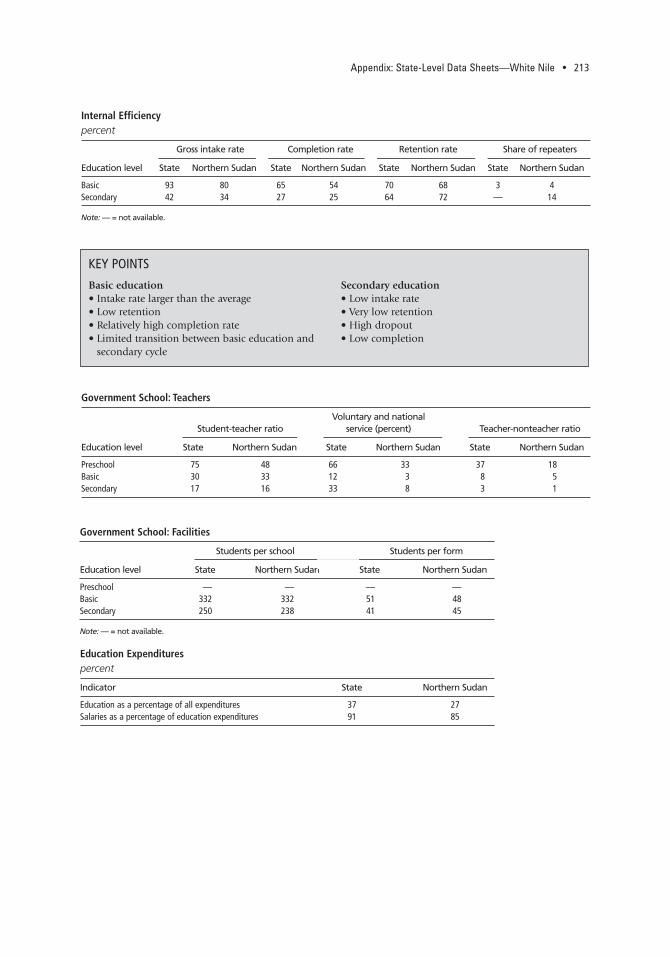
Appendix: State-Level Data Sheets—White Nile • 213
Internal Efficiencypercent
Gross intake rate Completion rate Retention rate Share of repeaters
Education level State Northern Sudan State Northern Sudan State Northern Sudan State Northern Sudan
Basic 93 80 65 54 70 68 3 4Secondary 42 34 27 25 64 72 — 14
Note: — = not available.
Basic education • Intake rate larger than the average • Low retention • Relatively high completion rate • Limited transition between basic education and
secondary cycle
Secondary education• Low intake rate • Very low retention • High dropout • Low completion
KEY POINTS
Government School: Teachers
Voluntary and national Student-teacher ratio service (percent) Teacher-nonteacher ratio
Education level State Northern Sudan State Northern Sudan State Northern Sudan
Preschool 75 48 66 33 37 18Basic 30 33 12 3 8 5Secondary 17 16 33 8 3 1
Government School: Facilities
Students per school Students per form
Education level State Northern Sudan State Northern Sudan
Preschool — — — —Basic 332 332 51 48Secondary 250 238 41 45
Note: — = not available.
Education Expenditurespercent
Indicator State Northern Sudan
Education as a percentage of all expenditures 37 27Salaries as a percentage of education expenditures 91 85
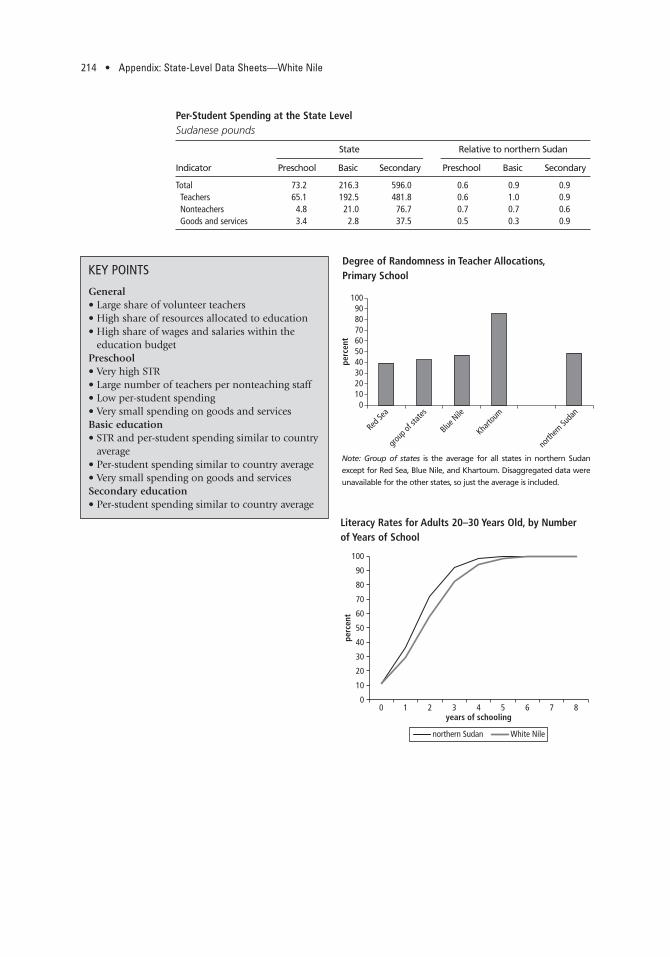
214 • Appendix: State-Level Data Sheets—White Nile
Per-Student Spending at the State LevelSudanese pounds
State Relative to northern Sudan
Indicator Preschool Basic Secondary Preschool Basic Secondary
Total 73.2 216.3 596.0 0.6 0.9 0.9Teachers 65.1 192.5 481.8 0.6 1.0 0.9Nonteachers 4.8 21.0 76.7 0.7 0.7 0.6Goods and services 3.4 2.8 37.5 0.5 0.3 0.9
KEY POINTS
General • Large share of volunteer teachers • High share of resources allocated to education • High share of wages and salaries within the
education budget Preschool • Very high STR • Large number of teachers per nonteaching staff • Low per-student spending• Very small spending on goods and services Basic education • STR and per-student spending similar to country
average• Per-student spending similar to country average • Very small spending on goods and services Secondary education• Per-student spending similar to country average
0102030405060
perc
ent
708090
100
Red Se
a
group
of st
ates
Blue N
ile
Kharto
um
north
ern Su
dan
0
10
20
30
40
50
60
70
80
90
100
perc
ent
0 1 2 3 4 5 6 7 8years of schooling
northern Sudan White Nile
Degree of Randomness in Teacher Allocations, Primary School
Note: Group of states is the average for all states in northern Sudan
except for Red Sea, Blue Nile, and Khartoum. Disaggregated data were
unavailable for the other states, so just the average is included.
Literacy Rates for Adults 20–30 Years Old, by Number of Years of School
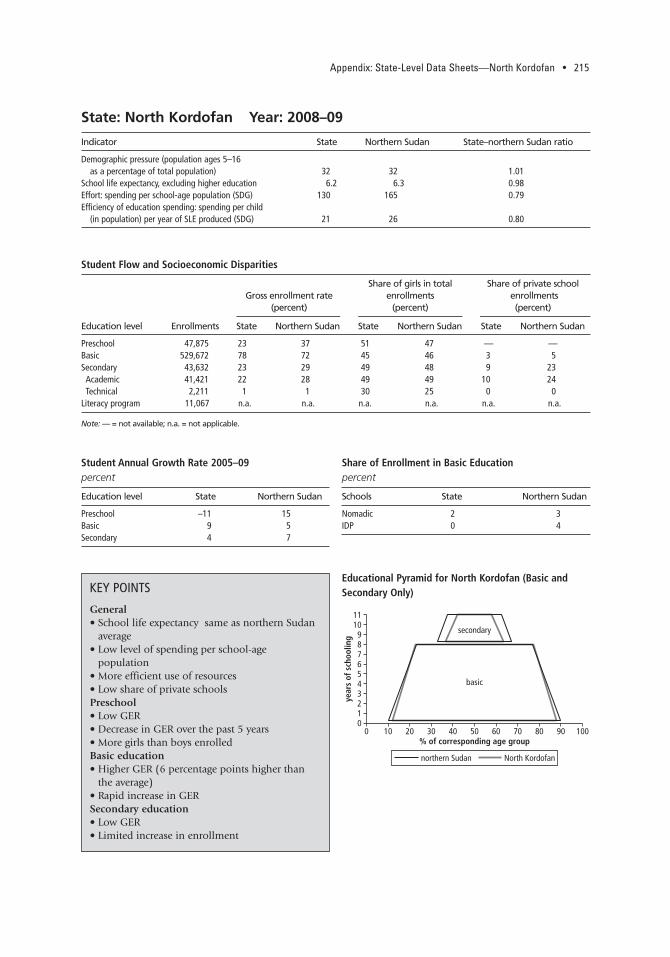
Appendix: State-Level Data Sheets—North Kordofan • 215
Indicator State Northern Sudan State–northern Sudan ratio
Demographic pressure (population ages 5–16 as a percentage of total population) 32 32 1.01
School life expectancy, excluding higher education 6.2 6.3 0.98Effort: spending per school-age population (SDG) 130 165 0.79Efficiency of education spending: spending per child
(in population) per year of SLE produced (SDG) 21 26 0.80
State: North Kordofan Year: 2008–09
0123456789
1011
0 10 20 30 40 50 60 70 80 90 100% of corresponding age group
year
s of
sch
oolin
g
basic
secondary
northern Sudan North Kordofan
KEY POINTS
General • School life expectancy same as northern Sudan
average • Low level of spending per school-age
population • More efficient use of resources • Low share of private schools Preschool • Low GER • Decrease in GER over the past 5 years • More girls than boys enrolled Basic education • Higher GER (6 percentage points higher than
the average) • Rapid increase in GER Secondary education • Low GER • Limited increase in enrollment
Educational Pyramid for North Kordofan (Basic and Secondary Only)
Student Flow and Socioeconomic Disparities
Share of girls in total Share of private schoolGross enrollment rate enrollments enrollments
(percent) (percent) (percent)
Education level Enrollments State Northern Sudan State Northern Sudan State Northern Sudan
Preschool 47,875 23 37 51 47 — —Basic 529,672 78 72 45 46 3 5Secondary 43,632 23 29 49 48 9 23Academic 41,421 22 28 49 49 10 24Technical 2,211 1 1 30 25 0 0
Literacy program 11,067 n.a. n.a. n.a. n.a. n.a. n.a.
Note: — = not available; n.a. = not applicable.
Student Annual Growth Rate 2005–09percent
Education level State Northern Sudan
Preschool –11 15Basic 9 5Secondary 4 7
Share of Enrollment in Basic Education percent
Schools State Northern Sudan
Nomadic 2 3IDP 0 4

216 • Appendix: State-Level Data Sheets—North Kordofan
Internal Efficiencypercent
Gross intake rate Completion rate Retention rate Share of repeaters
Education level State Northern Sudan State Northern Sudan State Northern Sudan State Northern Sudan
Basic 76 80 54 54 72 68 9 4Secondary 27 34 16 25 58 72 — 14
Note: — = not available.
Basic education • Intake rate a bit lower than the average • Better retention than the average • Completion rate at the average level • Limited transition between basic education
and secondary cycle
Secondary education• Low intake rate • Low retention• High dropout • Low completion
KEY POINTS
Government School: Teachers
Voluntary and national Student-teacher ratio service (percent) Teacher-nonteacher ratio
Education level State Northern Sudan State Northern Sudan State Northern Sudan
Preschool 76 48 53 33 15 18Basic 42 33 1 3 5 5Secondary 16 16 6 8 1 1
Government School: Facilities
Students per school Students per form
Education level State Northern Sudan State Northern Sudan
Preschool — — — —Basic 277 332 46 48Secondary 271 238 48 45
Note: — = not available.
Education Expenditurespercent
Indicator State Northern Sudan
Education as a percentage of all expenditures 29 27Salaries as a percentage of education expenditures 86 85

Appendix: State-Level Data Sheets—North Kordofan • 217
Per-Student Spending at the State LevelSudanese pounds
State Relative to northern Sudan
Indicator Preschool Basic Secondary Preschool Basic Secondary
Total 64.8 174.3 642.0 0.5 0.7 0.9Teachers 52.5 146.5 497.5 0.5 0.7 1.0Nonteachers 7.6 24.2 115.1 1.1 0.8 0.9Goods and services 4.7 3.7 29.4 0.6 0.4 0.7
KEY POINTS
General • Close to the northern Sudan average on
percentage of education expenditure Preschool • Very high student-teacher ratio• Intensive use of volunteers• Low per-student spending (half the average) Basic education • STR larger than the average but close to
benchmark • Low per-student spending compared to country
average • Very small spending on goods and services Secondary education• Bigger school size than the country average • Per-student spending close to country average
0102030405060
perc
ent
708090
100
Red Se
a
group
of st
ates
Blue N
ile
Kharto
um
north
ern Su
dan
0
10
20
30
40
50
60
70
80
90
100
perc
ent
0 1 2 3 4 5 6 7 8years of schooling
northern Sudan North Kordofan
Degree of Randomness in Teacher Allocations, Primary School
Note: Group of states is the average for all states in northern Sudan
except for Red Sea, Blue Nile, and Khartoum. Disaggregated data were
unavailable for the other states, so just the average is included.
Literacy Rates for Adults 20–30 Years Old, by Number of Years of School
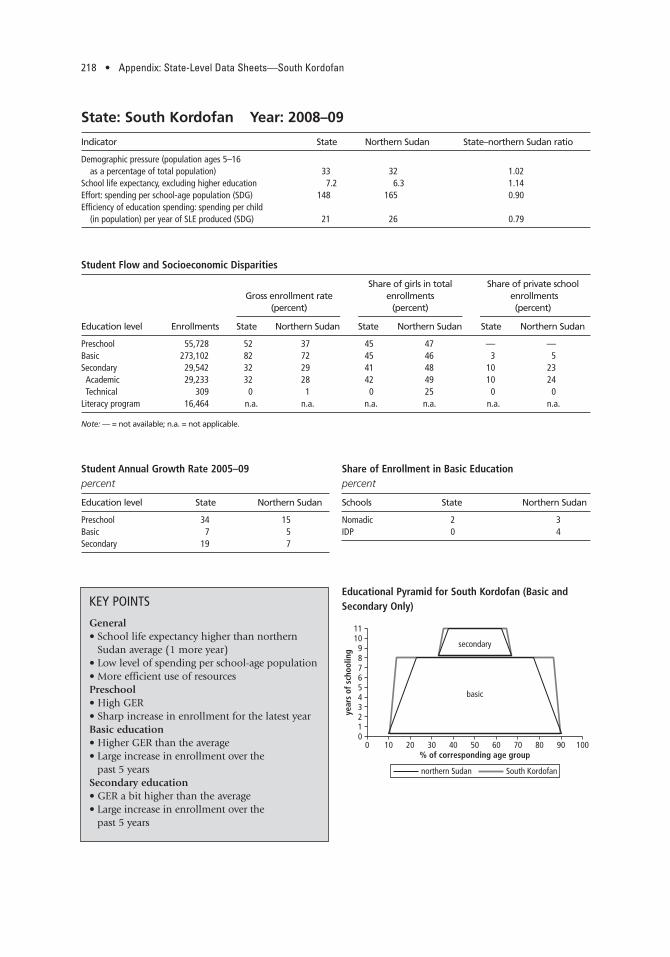
218 • Appendix: State-Level Data Sheets—South Kordofan
Indicator State Northern Sudan State–northern Sudan ratio
Demographic pressure (population ages 5–16 as a percentage of total population) 33 32 1.02
School life expectancy, excluding higher education 7.2 6.3 1.14Effort: spending per school-age population (SDG) 148 165 0.90Efficiency of education spending: spending per child
(in population) per year of SLE produced (SDG) 21 26 0.79
State: South Kordofan Year: 2008–09
0123456789
1011
0 10 20 30 40 50 60 70 80 90 100% of corresponding age group
year
s of
sch
oolin
g
basic
secondary
northern Sudan South Kordofan
KEY POINTS
General• School life expectancy higher than northern
Sudan average (1 more year)• Low level of spending per school-age population • More efficient use of resourcesPreschool • High GER • Sharp increase in enrollment for the latest year Basic education • Higher GER than the average • Large increase in enrollment over the
past 5 years Secondary education • GER a bit higher than the average • Large increase in enrollment over the
past 5 years
Educational Pyramid for South Kordofan (Basic and Secondary Only)
Student Flow and Socioeconomic Disparities
Share of girls in total Share of private schoolGross enrollment rate enrollments enrollments
(percent) (percent) (percent)
Education level Enrollments State Northern Sudan State Northern Sudan State Northern Sudan
Preschool 55,728 52 37 45 47 — —Basic 273,102 82 72 45 46 3 5Secondary 29,542 32 29 41 48 10 23Academic 29,233 32 28 42 49 10 24Technical 309 0 1 0 25 0 0
Literacy program 16,464 n.a. n.a. n.a. n.a. n.a. n.a.
Note: — = not available; n.a. = not applicable.
Student Annual Growth Rate 2005–09percent
Education level State Northern Sudan
Preschool 34 15Basic 7 5Secondary 19 7
Share of Enrollment in Basic Educationpercent
Schools State Northern Sudan
Nomadic 2 3IDP 0 4
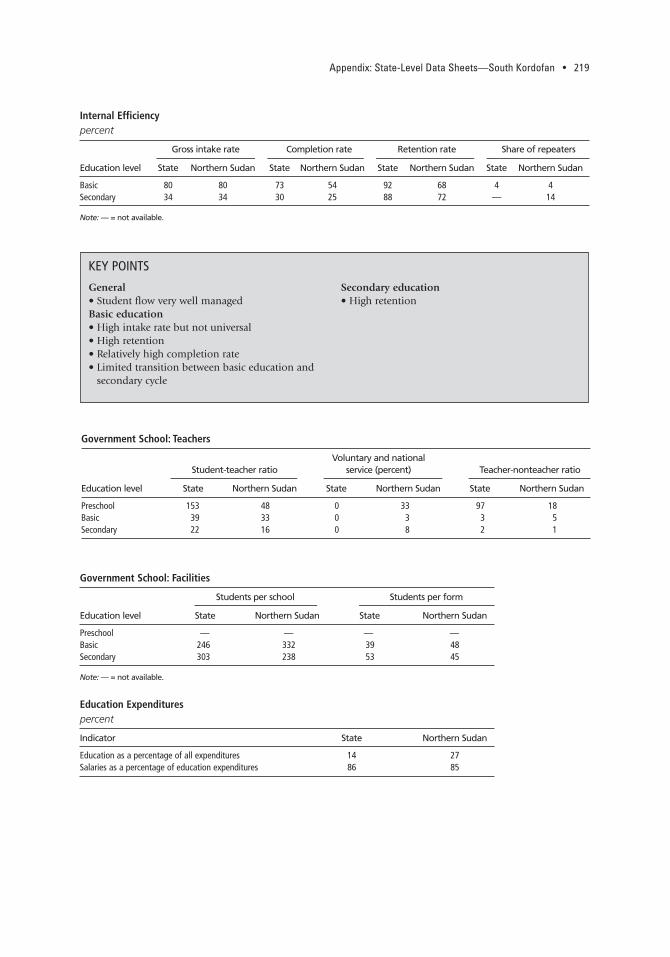
Appendix: State-Level Data Sheets—South Kordofan • 219
Internal Efficiencypercent
Gross intake rate Completion rate Retention rate Share of repeaters
Education level State Northern Sudan State Northern Sudan State Northern Sudan State Northern Sudan
Basic 80 80 73 54 92 68 4 4Secondary 34 34 30 25 88 72 — 14
Note: — = not available.
General• Student flow very well managedBasic education • High intake rate but not universal • High retention • Relatively high completion rate • Limited transition between basic education and
secondary cycle
Secondary education• High retention
KEY POINTS
Government School: Teachers
Voluntary and national Student-teacher ratio service (percent) Teacher-nonteacher ratio
Education level State Northern Sudan State Northern Sudan State Northern Sudan
Preschool 153 48 0 33 97 18Basic 39 33 0 3 3 5Secondary 22 16 0 8 2 1
Government School: Facilities
Students per school Students per form
Education level State Northern Sudan State Northern Sudan
Preschool — — — —Basic 246 332 39 48Secondary 303 238 53 45
Note: — = not available.
Education Expenditurespercent
Indicator State Northern Sudan
Education as a percentage of all expenditures 14 27Salaries as a percentage of education expenditures 86 85
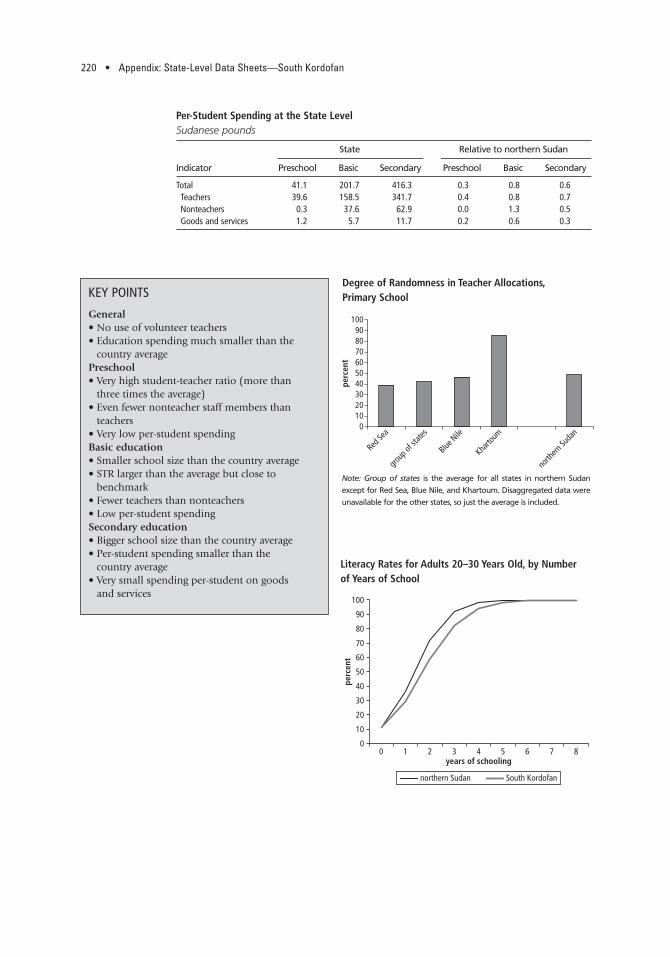
220 • Appendix: State-Level Data Sheets—South Kordofan
Per-Student Spending at the State LevelSudanese pounds
State Relative to northern Sudan
Indicator Preschool Basic Secondary Preschool Basic Secondary
Total 41.1 201.7 416.3 0.3 0.8 0.6Teachers 39.6 158.5 341.7 0.4 0.8 0.7Nonteachers 0.3 37.6 62.9 0.0 1.3 0.5Goods and services 1.2 5.7 11.7 0.2 0.6 0.3
KEY POINTS
General • No use of volunteer teachers• Education spending much smaller than the
country average Preschool • Very high student-teacher ratio (more than
three times the average) • Even fewer nonteacher staff members than
teachers • Very low per-student spending Basic education• Smaller school size than the country average • STR larger than the average but close to
benchmark • Fewer teachers than nonteachers• Low per-student spending Secondary education• Bigger school size than the country average • Per-student spending smaller than the
country average• Very small spending per-student on goods
and services
0102030405060
perc
ent
708090
100
Red Se
a
group
of st
ates
Blue N
ile
Kharto
um
north
ern Su
dan
0
10
20
30
40
50
60
70
80
90
100
perc
ent
0 1 2 3 4 5 6 7 8years of schooling
northern Sudan South Kordofan
Degree of Randomness in Teacher Allocations, Primary School
Note: Group of states is the average for all states in northern Sudan
except for Red Sea, Blue Nile, and Khartoum. Disaggregated data were
unavailable for the other states, so just the average is included.
Literacy Rates for Adults 20–30 Years Old, by Number of Years of School
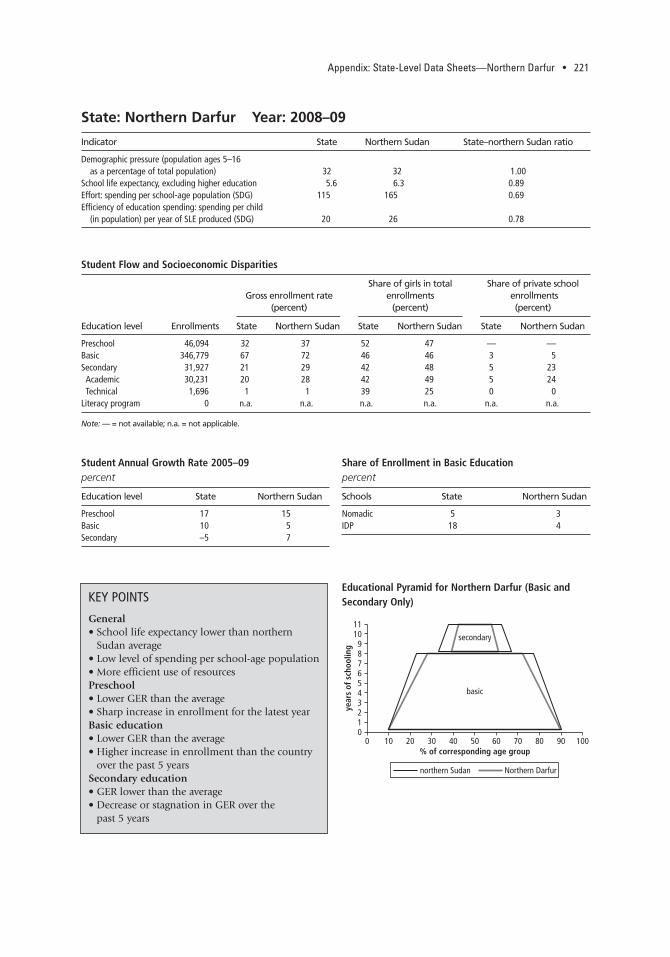
Appendix: State-Level Data Sheets—Northern Darfur • 221
Indicator State Northern Sudan State–northern Sudan ratio
Demographic pressure (population ages 5–16 as a percentage of total population) 32 32 1.00
School life expectancy, excluding higher education 5.6 6.3 0.89Effort: spending per school-age population (SDG) 115 165 0.69Efficiency of education spending: spending per child
(in population) per year of SLE produced (SDG) 20 26 0.78
State: Northern Darfur Year: 2008–09
0123456789
1011
0 10 20 30 40 50 60 70 80 90 100% of corresponding age group
year
s of
sch
oolin
g
basic
secondary
northern Sudan Northern Darfur
KEY POINTS
General • School life expectancy lower than northern
Sudan average • Low level of spending per school-age population • More efficient use of resources Preschool • Lower GER than the average • Sharp increase in enrollment for the latest year Basic education • Lower GER than the average • Higher increase in enrollment than the country
over the past 5 years Secondary education • GER lower than the average • Decrease or stagnation in GER over the
past 5 years
Educational Pyramid for Northern Darfur (Basic and Secondary Only)
Student Flow and Socioeconomic Disparities
Share of girls in total Share of private schoolGross enrollment rate enrollments enrollments
(percent) (percent) (percent)
Education level Enrollments State Northern Sudan State Northern Sudan State Northern Sudan
Preschool 46,094 32 37 52 47 — —Basic 346,779 67 72 46 46 3 5Secondary 31,927 21 29 42 48 5 23Academic 30,231 20 28 42 49 5 24Technical 1,696 1 1 39 25 0 0
Literacy program 0 n.a. n.a. n.a. n.a. n.a. n.a.
Note: — = not available; n.a. = not applicable.
Student Annual Growth Rate 2005–09percent
Education level State Northern Sudan
Preschool 17 15Basic 10 5Secondary –5 7
Share of Enrollment in Basic Educationpercent
Schools State Northern Sudan
Nomadic 5 3IDP 18 4
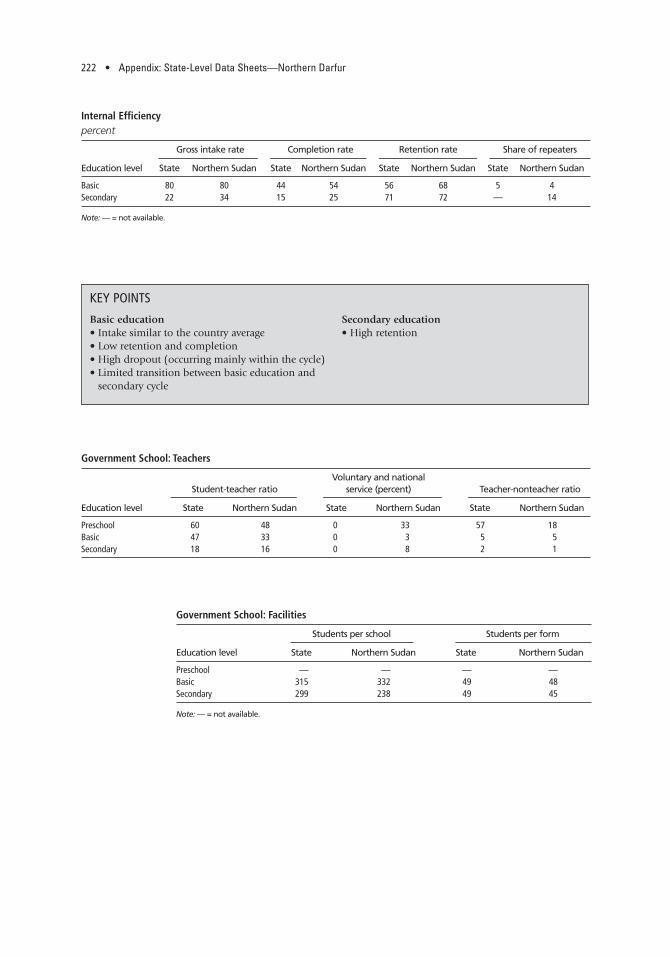
222 • Appendix: State-Level Data Sheets—Northern Darfur
Internal Efficiencypercent
Gross intake rate Completion rate Retention rate Share of repeaters
Education level State Northern Sudan State Northern Sudan State Northern Sudan State Northern Sudan
Basic 80 80 44 54 56 68 5 4Secondary 22 34 15 25 71 72 — 14
Note: — = not available.
Basic education • Intake similar to the country average • Low retention and completion • High dropout (occurring mainly within the cycle) • Limited transition between basic education and
secondary cycle
Secondary education• High retention
KEY POINTS
Government School: Teachers
Voluntary and national Student-teacher ratio service (percent) Teacher-nonteacher ratio
Education level State Northern Sudan State Northern Sudan State Northern Sudan
Preschool 60 48 0 33 57 18Basic 47 33 0 3 5 5Secondary 18 16 0 8 2 1
Government School: Facilities
Students per school Students per form
Education level State Northern Sudan State Northern Sudan
Preschool — — — —Basic 315 332 49 48Secondary 299 238 49 45
Note: — = not available.
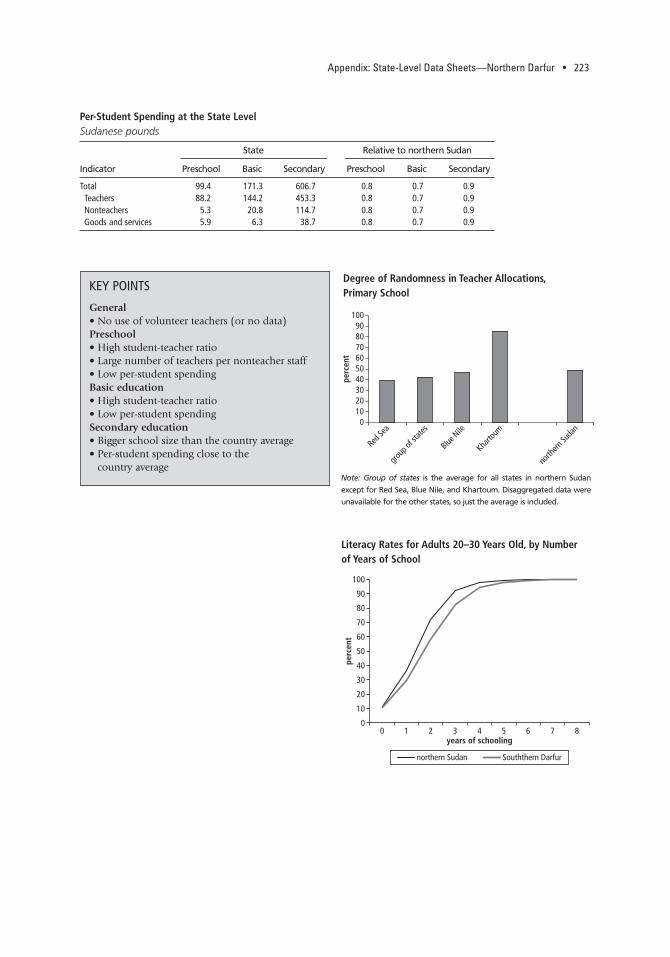
Appendix: State-Level Data Sheets—Northern Darfur • 223
Per-Student Spending at the State LevelSudanese pounds
State Relative to northern Sudan
Indicator Preschool Basic Secondary Preschool Basic Secondary
Total 99.4 171.3 606.7 0.8 0.7 0.9Teachers 88.2 144.2 453.3 0.8 0.7 0.9Nonteachers 5.3 20.8 114.7 0.8 0.7 0.9Goods and services 5.9 6.3 38.7 0.8 0.7 0.9
KEY POINTS
General • No use of volunteer teachers (or no data) Preschool • High student-teacher ratio • Large number of teachers per nonteacher staff• Low per-student spending Basic education• High student-teacher ratio • Low per-student spending Secondary education• Bigger school size than the country average • Per-student spending close to the
country average
0102030405060
perc
ent
708090
100
Red Se
a
group
of st
ates
Blue N
ile
Kharto
um
north
ern Su
dan
0
10
20
30
40
50
60
70
80
90
100
perc
ent
0 1 2 3 4 5 6 7 8years of schooling
northern Sudan Souththern Darfur
Degree of Randomness in Teacher Allocations, Primary School
Literacy Rates for Adults 20–30 Years Old, by Number of Years of School
Note: Group of states is the average for all states in northern Sudan
except for Red Sea, Blue Nile, and Khartoum. Disaggregated data were
unavailable for the other states, so just the average is included.

224 • Appendix: State-Level Data Sheets—Southern Darfur
Indicator State Northern Sudan State–northern Sudan ratio
Demographic pressure (population ages 5–16 as a percentage of total population) 33 32 1.04
School life expectancy, excluding higher education 3.5 6.3 0.56Effort: spending per school-age population (SDG) 64 165 0.39Efficiency of education spending: spending per child
(in population) per year of SLE produced (SDG) 18 26 0.70
State: Southern Darfur Year: 2008–09
0123456789
1011
0 10 20 30 40 50 60 70 80 90 100% of corresponding age group
year
s of
sch
oolin
g
basic
secondary
northern Sudan Southern Darfur
KEY POINTS
General • Very low school life expectancy • Very low level of spending per school-age
population • More efficient use of resources Preschool • Share of girls very low Basic education • Very lower GER • Small increase in GER, no clear sign of catch-up • Lower percentage of girls than the country
average Secondary education • Very lower GER • Lower percentage of girls than the country
average
Educational Pyramid for Southern Darfur (Basic and Secondary Only)
Student Flow and Socioeconomic Disparities
Share of girls in total Share of private schoolGross enrollment rate enrollments enrollments
(percent) (percent) (percent)
Education level Enrollments State Northern Sudan State Northern Sudan State Northern Sudan
Preschool 114,280 38 37 36 47 — —Basic 424,904 41 72 43 46 10 5Secondary 52,263 17 29 40 48 33 23Academic 51,030 17 28 41 49 34 24Technical 1,233 0 1 7 25 0 0
Literacy program 0 n.a. n.a. n.a. n.a. n.a. n.a.
Note: — = not available; n.a. = not applicable.
Student Annual Growth Rate 2005–09percent
Education level State Northern Sudan
Preschool 47 15Basic 7 5Secondary –1 7
Share of Enrollment in Basic Educationpercent
Schools State Northern Sudan
Nomadic 5 3IDP 18 4

Appendix: State-Level Data Sheets—Southern Darfur • 225
Internal Efficiencypercent
Gross intake rate Completion rate Retention rate Share of repeaters
Education level State Northern Sudan State Northern Sudan State Northern Sudan State Northern Sudan
Basic 57 80 22 54 38 68 1 4Secondary 15 34 11 25 74 72 — 14
Note: — = not available.
Basic education • Low intake • Very low retention and low completion • High dropout (occurring mainly within the cycle) • High transition between basic education and
secondary cycle
Secondary education• High retention
KEY POINTS
Government School: Teachers
Voluntary and national Student-teacher ratio service (percent) Teacher-nonteacher ratio
Education level State Northern Sudan State Northern Sudan State Northern Sudan
Preschool 64 48 0 33 8 18Basic 44 33 0 3 5 5Secondary 20 16 0 8 2 1
Government School: Facilities
Students per school Students per form
Education level State Northern Sudan State Northern Sudan
Preschool — — — —Basic 275 332 56 48Secondary 360 238 55 45
Note: — = not available.

226 • Appendix: State-Level Data Sheets—Southern Darfur
Per-Student Spending at the State LevelSudanese pounds
State Relative to northern Sudan
Indicator Preschool Basic Secondary Preschool Basic Secondary
Total 92.6 182.0 544.9 0.7 0.8 0.8Teachers 82.2 153.2 407.4 0.7 0.8 0.8Nonteachers 4.9 22.1 103.0 0.7 0.8 0.8Goods and services 5.5 6.7 34.5 0.7 0.8 0.8
KEY POINTS
General • No use of volunteer teachers (or no data) Preschool • High student-teacher ratio • Fewer teachers per nonteacher staff members
than the country average • Low per-student spending Basic education • High student-teacher ratio• Smaller school size than the country average • Low per-student spending Secondary education• Bigger school size than the country average • Per-student spending close to the country
average
0102030405060
perc
ent
708090
100
Red Se
a
group
of st
ates
Blue N
ile
Kharto
um
north
ern Su
dan
0
10
20
30
40
50
60
70
80
90
100
perc
ent
0 1 2 3 4 5 6 7 8years of schooling
northern Sudan Southern Darfur
Degree of Randomness in Teacher Allocations, Primary School
Note: Group of states is the average for all states in northern Sudan
except for Red Sea, Blue Nile, and Khartoum. Disaggregated data were
unavailable for the other states, so just the average is included.
Literacy Rates for Adults 20–30 Years Old, by Number of Years of School

Appendix: State-Level Data Sheets—Western Darfur • 227
Indicator State Northern Sudan State–northern Sudan ratio
Demographic pressure (population ages 5–16 as a percentage of total population) 34 32 1.07
School life expectancy, excluding higher education 7.2 6.3 1.13Effort: spending per school-age population (SDG) 96 165 0.58Efficiency of education spending: spending per child
(in population) per year of SLE produced (SDG) 13 26 0.51
State: Western Darfur Year: 2008–09
0123456789
1011
0 10 20 30 40 50 60 70 80 90 100% of corresponding age group
year
s of
sch
oolin
g
basic
secondary
northern Sudan Western Darfur
KEY POINTS
General • School life expectancy higher than northern
Sudan average (1 more year) • Low level of spending per school-age population • More efficient use of resources Preschool• Low GER • As many girls as boys enrolled Basic education • GER larger than the country average • Percentage of girls lower than the country
average Secondary education • GER smaller than the country average • Percentage of girls lower than the country
average
Educational Pyramid for Western Darfur (Basic and Secondary Only)
Student Flow and Socioeconomic Disparities
Share of girls in total Share of private schoolGross enrollment rate enrollments enrollments
(percent) (percent) (percent)
Education level Enrollments State Northern Sudan State Northern Sudan State Northern Sudan
Preschool 25,134 26 37 50 47 — —Basic 283,355 88 72 44 46 2 5Secondary 23,348 25 29 35 48 39 23Academic 22,728 24 28 36 49 40 24Technical 620 1 1 27 25 0 0
Literacy program 0 n.a. n.a. n.a. n.a. n.a. n.a.
Note: — = not available; n.a. = not applicable.
Student Annual Growth Rate 2005–09percent
Education level State Northern Sudan
Preschool 33 15Basic 6 5Secondary 21 7
Share of Enrollment in Basic Educationpercent
Schools State Northern Sudan
Nomadic 8 3IDP 24 4
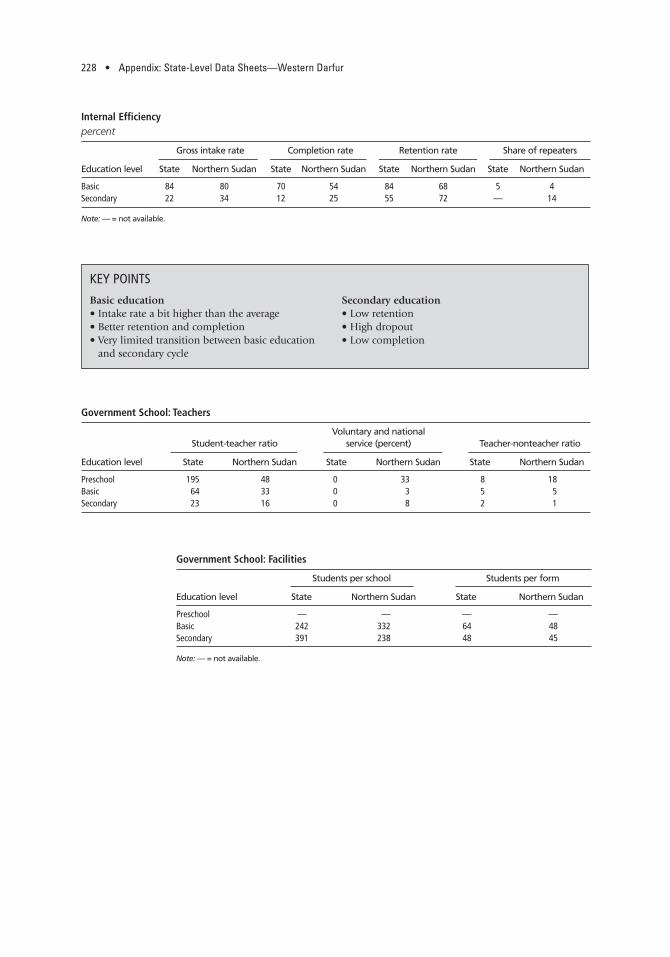
228 • Appendix: State-Level Data Sheets—Western Darfur
Internal Efficiencypercent
Gross intake rate Completion rate Retention rate Share of repeaters
Education level State Northern Sudan State Northern Sudan State Northern Sudan State Northern Sudan
Basic 84 80 70 54 84 68 5 4Secondary 22 34 12 25 55 72 — 14
Note: — = not available.
Basic education • Intake rate a bit higher than the average • Better retention and completion • Very limited transition between basic education
and secondary cycle
Secondary education• Low retention • High dropout • Low completion
KEY POINTS
Government School: Teachers
Voluntary and national Student-teacher ratio service (percent) Teacher-nonteacher ratio
Education level State Northern Sudan State Northern Sudan State Northern Sudan
Preschool 195 48 0 33 8 18Basic 64 33 0 3 5 5Secondary 23 16 0 8 2 1
Government School: Facilities
Students per school Students per form
Education level State Northern Sudan State Northern Sudan
Preschool — — — —Basic 242 332 64 48Secondary 391 238 48 45
Note: — = not available.

Appendix: State-Level Data Sheets—Western Darfur • 229
Per-Student Spending at the State LevelSudanese pounds
State Relative to northern Sudan
Indicator Preschool Basic Secondary Preschool Basic Secondary
Total 30.5 124.1 466.6 0.2 0.5 0.7Teachers 27.1 104.5 348.9 0.2 0.5 0.7Nonteachers 1.6 15.1 88.2 0.2 0.5 0.7Goods and services 1.8 4.5 29.6 0.2 0.5 0.7
KEY POINTS
General • No use of volunteer teachers (or no data) Preschool • Very high student-teacher ratio • Fewer teachers per nonteacher staff members
than the country average • Extremely low per-student spending Basic education • High student-teacher ratio • Smaller school size than the country average • Very low per-student spending (half the average) Secondary education• Bigger school size than the country average • Very low per-student spending (half the average)
0102030405060
perc
ent
708090
100
Red Se
a
group
of st
ates
Blue N
ile
Kharto
um
north
ern Su
dan
0
10
20
30
40
50
60
70
80
90
100
perc
ent
0 1 2 3 4 5 6 7 8years of schooling
northern Sudan Western Darfur
Degree of Randomness in Teacher Allocations, Primary School
Literacy Rates for Adults 20–30 Years Old, by Number of Years of School
Note: Group of states is the average for all states in northern Sudan
except for Red Sea, Blue Nile, and Khartoum. Disaggregated data were
unavailable for the other states, so just the average is included.
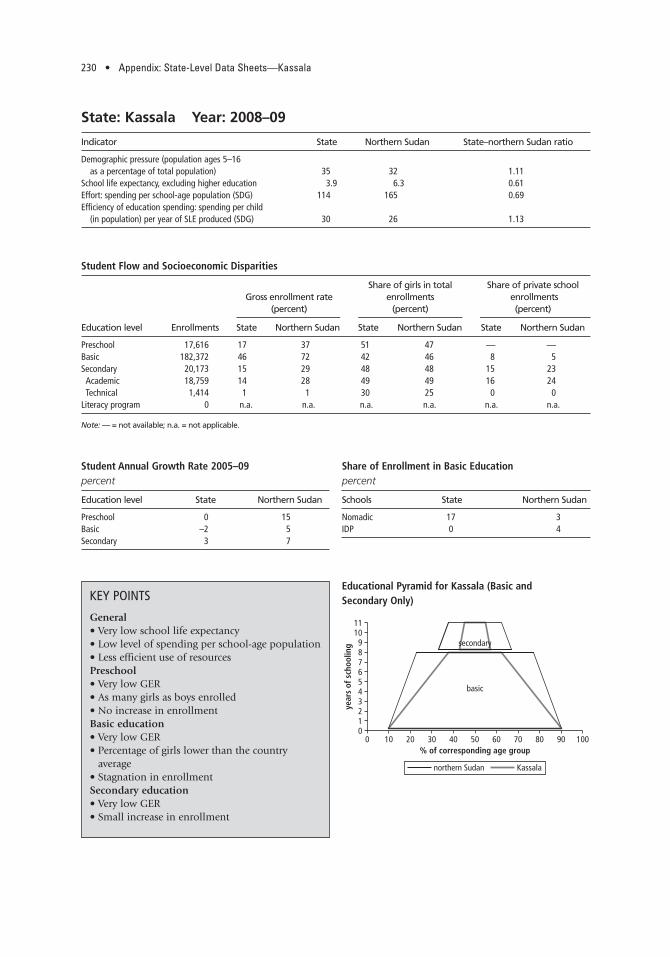
230 • Appendix: State-Level Data Sheets—Kassala
Indicator State Northern Sudan State–northern Sudan ratio
Demographic pressure (population ages 5–16 as a percentage of total population) 35 32 1.11
School life expectancy, excluding higher education 3.9 6.3 0.61Effort: spending per school-age population (SDG) 114 165 0.69Efficiency of education spending: spending per child
(in population) per year of SLE produced (SDG) 30 26 1.13
State: Kassala Year: 2008–09
0123456789
1011
0 10 20 30 40 50 60 70 80 90 100% of corresponding age group
year
s of
sch
oolin
g
basic
secondary
northern Sudan Kassala
KEY POINTS
General • Very low school life expectancy • Low level of spending per school-age population • Less efficient use of resources Preschool • Very low GER • As many girls as boys enrolled• No increase in enrollment Basic education • Very low GER • Percentage of girls lower than the country
average• Stagnation in enrollment Secondary education • Very low GER • Small increase in enrollment
Educational Pyramid for Kassala (Basic and Secondary Only)
Student Flow and Socioeconomic Disparities
Share of girls in total Share of private schoolGross enrollment rate enrollments enrollments
(percent) (percent) (percent)
Education level Enrollments State Northern Sudan State Northern Sudan State Northern Sudan
Preschool 17,616 17 37 51 47 — —Basic 182,372 46 72 42 46 8 5Secondary 20,173 15 29 48 48 15 23Academic 18,759 14 28 49 49 16 24Technical 1,414 1 1 30 25 0 0
Literacy program 0 n.a. n.a. n.a. n.a. n.a. n.a.
Note: — = not available; n.a. = not applicable.
Student Annual Growth Rate 2005–09percent
Education level State Northern Sudan
Preschool 0 15Basic –2 5Secondary 3 7
Share of Enrollment in Basic Educationpercent
Schools State Northern Sudan
Nomadic 17 3IDP 0 4

Appendix: State-Level Data Sheets—Kassala • 231
Internal Efficiencypercent
Gross intake rate Completion rate Retention rate Share of repeaters
Education level State Northern Sudan State Northern Sudan State Northern Sudan State Northern Sudan
Basic 80 80 25 54 31 68 4 4Secondary 15 34 10 25 67 72 — 14
Note: — = not available.
Basic education • Intake at the average level • Extremely low retention and low completion • High dropout (occurring mainly within the cycle) • Relatively limited transition between basic
education and secondary cycle
Secondary education• Low intake rate • High retention
KEY POINTS
Government School: Teachers
Voluntary and national Student-teacher ratio service (percent) Teacher-nonteacher ratio
Education level State Northern Sudan State Northern Sudan State Northern Sudan
Preschool 76 48 25 33 3 18Basic 31 33 9 3 5 5Secondary 14 16 0 8 1 1
Government School: Facilities
Students per school Students per form
Education level State Northern Sudan State Northern Sudan
Preschool — — — —Basic 267 332 49 48Secondary 293 238 44 45
Note: — = not available.
Education Expenditurespercent
Indicator State Northern Sudan
Education as a percentage of all expenditures 28 27Salaries as a percentage of education expenditures 71 85

232 • Appendix: State-Level Data Sheets—Kassala
Per-Student Spending at the State LevelSudanese pounds
State Relative to northern Sudan
Indicator Preschool Basic Secondary Preschool Basic Secondary
Total 135.6 297.5 749.0 1.1 1.2 1.1Teachers 59.6 226.0 515.9 0.5 1.1 1.0Nonteachers 22.6 33.6 167.6 3.4 1.2 1.3Goods and services 53.3 37.9 65.5 7.2 4.3 1.5
KEY POINTS
Preschool • High student-teacher ratio • Very small number of teachers per nonteacher
staff members• Per-student spending higher than the country
average Basic education • Student-teacher ratio lower than the country
average • Smaller school size than the country average • Per-student spending higher than the country
average Secondary education• Bigger school size than the country average • Per-student spending higher than the country
average
0102030405060
perc
ent
708090
100
Red Se
a
group
of st
ates
Blue N
ile
Kharto
um
north
ern Su
dan
Degree of Randomness in Teacher Allocations, Primary School
Note: Group of states is the average for all states in northern Sudan
except for Red Sea, Blue Nile, and Khartoum. Disaggregated data were
unavailable for the other states, so just the average is included.

Appendix: State-Level Data Sheets—Al Qadarif • 233
Indicator State Northern Sudan State–northern Sudan ratio
Demographic pressure (population ages 5–16 as a percentage of total population) 37 32 1.15
School life expectancy, excluding higher education 5.5 6.3 0.87Effort: spending per school-age population (SDG) 155 165 0.94Efficiency of education spending: spending per child
(in population) per year of SLE produced (SDG) 28 26 1.08
State: Al Qadarif Year: 2008–09
0123456789
1011
0 10 20 30 40 50 60 70 80 90 100% of corresponding age group
year
s of
sch
oolin
g
basic
secondary
northern Sudan Al Qadarif
KEY POINTS
General• High demographic pressure• Very low school life expectancy• Slightly low level of spending per school-age
population• Less efficient use of resourcesPreschool• GER at the country average• Sharp increase in enrollmentBasic education• GER at the country average • Steady increase in enrollment Secondary education • GER at the country average
Educational Pyramid for Al Qadarif (Basic and Secondary Only)
Student Flow and Socioeconomic Disparities
Share of girls in total Share of private schoolGross enrollment rate enrollments enrollments
(percent) (percent) (percent)
Education level Enrollments State Northern Sudan State Northern Sudan State Northern Sudan
Preschool 34,730 36 37 46 47 — —Basic 222,083 70 72 45 46 2 5Secondary 28,706 31 29 46 48 18 23Academic 26,297 28 28 47 49 20 24Technical 2,409 3 1 33 25 0 0
Literacy program 14,105 n.a. n.a. n.a. n.a. n.a. n.a.
Note: — = not available; n.a. = not applicable.
Student Annual Growth Rate 2005–09percent
Education level State Northern Sudan
Preschool 26 15Basic 7 5Secondary 8 7
Share of Enrollment in Basic Educationpercent
Schools State Northern Sudan
Nomadic 2 3IDP 3 4

234 • Appendix: State-Level Data Sheets—Al Qadarif
Internal Efficiencypercent
Gross intake rate Completion rate Retention rate Share of repeaters
Education level State Northern Sudan State Northern Sudan State Northern Sudan State Northern Sudan
Basic 78 80 40 54 51 68 13 4Secondary 30 34 19 25 66 72 — 14
Note: — = not available.
Basic education • Intake at the average level • Low retention • Relatively high transition between basic
education and secondary cycle
Secondary education• Low retention
KEY POINTS
Government School: Teachers
Voluntary and national Student-teacher ratio service (percent) Teacher-nonteacher ratio
Education level State Northern Sudan State Northern Sudan State Northern Sudan
Preschool 47 48 0 33 38 18Basic 38 33 4 3 6 5Secondary 16 16 9 8 2 1
Government School: Facilities
Students per school Students per form
Education level State Northern Sudan State Northern Sudan
Preschool — — — —Basic 329 332 48 48Secondary 245 238 48 45
Note: — = not available.
Education Expenditurespercent
Indicator State Northern Sudan
Education as a percentage of all expenditures 31 27Salaries as a percentage of education expenditures 76 85
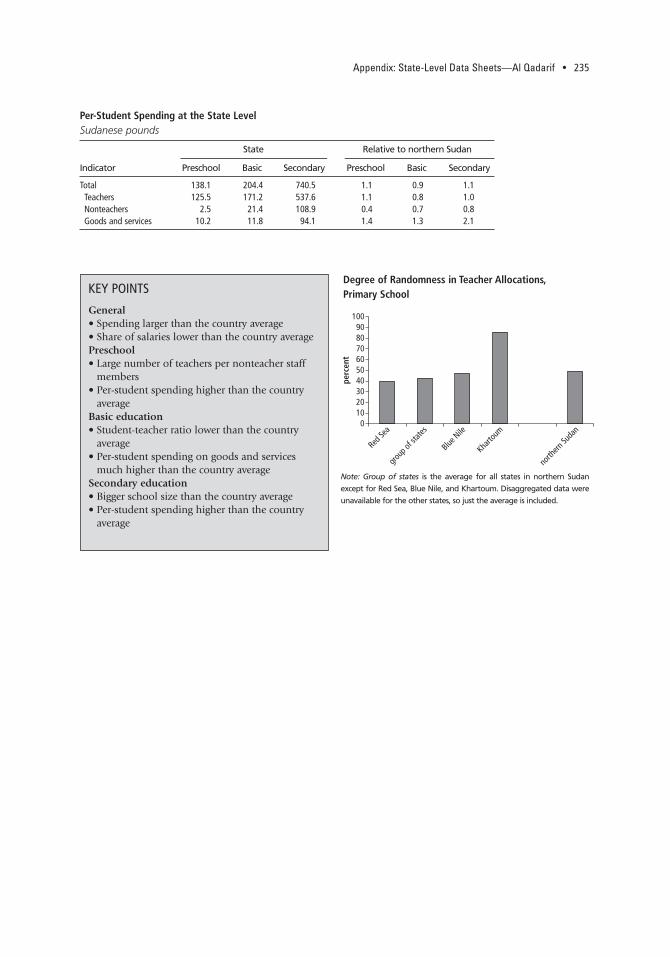
Appendix: State-Level Data Sheets—Al Qadarif • 235
Per-Student Spending at the State LevelSudanese pounds
State Relative to northern Sudan
Indicator Preschool Basic Secondary Preschool Basic Secondary
Total 138.1 204.4 740.5 1.1 0.9 1.1Teachers 125.5 171.2 537.6 1.1 0.8 1.0Nonteachers 2.5 21.4 108.9 0.4 0.7 0.8Goods and services 10.2 11.8 94.1 1.4 1.3 2.1
KEY POINTS
General • Spending larger than the country average • Share of salaries lower than the country average Preschool • Large number of teachers per nonteacher staff
members• Per-student spending higher than the country
average Basic education • Student-teacher ratio lower than the country
average • Per-student spending on goods and services
much higher than the country average Secondary education• Bigger school size than the country average • Per-student spending higher than the country
average
0102030405060
perc
ent
708090
100
Red Se
a
group
of st
ates
Blue N
ile
Kharto
um
north
ern Su
dan
Degree of Randomness in Teacher Allocations, Primary School
Note: Group of states is the average for all states in northern Sudan
except for Red Sea, Blue Nile, and Khartoum. Disaggregated data were
unavailable for the other states, so just the average is included.


237
Glossary
Child-friendly schools. A rights-based, child-friendly school has two basiccharacteristics:
• It is child seeking—actively identifying excluded children to get themenrolled in school and included in learning; treating children as sub-jects with rights that the states are duty-bound to fulfill; and demon-strating, promoting, and helping to monitor the rights and well-beingof all children in the community.
• It is child centered—acting in the best interests of the individualchild, leading to the realization of the child’s full potential, and con-cerned both about the “whole” child (including her health, nutri-tional status, and well-being) and about what happens to that child(in her family and community) before she enters school and aftershe leaves it.
Dependency ratio. This ratio is defined as the school-age population as ashare of the total population.
Development spending. This type of spending is for physical assets withbenefits extending into the future.
Gender parity index (GPI). The GPI is calculated here as the gross enroll-ment rate for girls divided by the gross enrollment rate for boys.
Gini coefficient. This is a measure of the inequality of distribution. It is cal-culated as the ratio of the area between the diagonal and the Lorenzcurve to the area of the triangle beneath the diagonal. A value of zeroexpresses total equality and a value of one, maximum inequality.
Gross enrollment rate (GER). The GER is calculated as total enrollment inthe level of education divided by the population of relevant age for thatlevel. The relevant age groups here are ages 4–5 for preschool, ages6–13 for basic school, and ages 14–16 for secondary school.

238 • Glossary
Gross intake rate (GIR). This rate is calculated as the number of nonre-peaters in grade 1 divided by the number of students age 6.
Internally displaced persons (IDPs). “Persons or groups of persons whohave been forced or obliged to flee or leave their homes or places ofhabitual residences, in particular as a result of or in order to avoid theeffects of armed conflict, situations of generalized violence, violationsof human rights or natural or human-made disasters, and who havenot crossed an internationally recognized State border” (Guiding Prin-ciples of Internal Displacement 1998).
Khalwas. These institutions are traditional Islamic schools that teach theQuran. They enroll children of all ages.
Mahalya. The mahalya, or locality, is under the political leadership of anelected council of between 24 and 48 people, including a committeefor education. Its administration is under the responsibility of an exec-utive director appointed by the wali (state governor). He or she isassisted by a number of directors (including a director of education) incharge of various sectors of activity. The director for education in themahalyas is often assisted by three officials, who are in charge of teach-ers, administration and finance, and students and statistics.
Net enrollment rate. This rate is calculated as the enrollment of 6–13-year-olds in basic school divided by the population of 6–13-year-olds.
Net intake rate. This rate is calculated as the nonrepeaters in grade 1 whoare age 6 divided by the age 6 population.
Primary completion rate. This rate is calculated as the number of nonre-peaters in grade 8 divided by the number of students age 13.
R2. This indicator measures the extent to which the number of teachers ina school is proportionate to the size of its enrollment. If the number ofteachers deployed to a school is perfectly proportionate to the size ofenrollment, then R2 will be equal to one. Conversely, an R2 of zerowould indicate that there is no relationship between the number ofteachers deployed to a school and the number of students enrolled inthat school.
Recurrent spending. This type of spending is for assets or services to beconsumed within one year.
Stunting. Moderate and severe: the percentage of children ages 0–59months who are below minus two standard deviations from medianheight for age of the WHO (World Health Organization) Child GrowthStandards. (WHO definition)
Underweight. Moderate and severe: the percentage of children ages 0–59months who are below minus two standard deviations from median

Glossary • 239
weight for age of the reference population from the National Center forHealth Statistics (NCHS) of the U.S. Centers for Disease Control andPrevention and from the WHO. (NCHS/WHO definition)
Wasting. Moderate and severe: the percentage of children ages 0–59 monthswho are below minus two standard deviations from median weight forheight of the WHO Child Growth Standards. (WHO definition)


ECO-AUDIT
Environmental Benefits Statement
The World Bank is committed to preservingendangered forests and natural resources.The Office of the Publisher has chosento print The Status of the Education Sectorin Sudan on recycled paper with 50 percentpost consumer fiber in accordance withthe recommended standards for paper usageset by the Green Press Initiative, a non-profit program supporting publishers inusing fiber that is not sourced from endan-gered forests. For more information, visitwww.greenpressinitiative.org.
Saved:• 6 trees• 3 million British thermal
units of total energy• 591 pounds of net
greenhouse gases• 2,665 gallons of waste
water• 169 pounds of solid
waste

T he Status of the Education Sector in Sudan provides an analysisof the education system in northern Sudan over the past
decade and a knowledge base to inform the Government of Sudanabout priority areas during its preparation of the Education SectorStrategic Plan for 2012–16. This report also contributes toward dialogue among relevant stakeholders about the challenges andemerging strategic priorities for the future of the education sector in Sudan.
ISBN 978-0-8213-8857-0
SKU 18857
Sudan Ministry of General Education