report no. 6475-su sudan the manufacturing sector: setting...
TRANSCRIPT

Report No. 6475-SU
SudanThe Manufacturing Sector: Setting the Stage forRestructuring(In Two Volumes) Volume II: AnnexesJune 30,1987
Industrial Restructuring Division Industrial Strategy and Policy Division Industrial Development and Finance DivisionIndustry Department Industry Department Eastern Africa Projects Department
FOR OFFICIAL USE ONLY
Document of the World Bank
This report has a restricted distribution and may be used by recipientsonly in the performance of their official duties. Its contents may not otherwisebe disclosed without World Bank authorization.
Pub
lic D
iscl
osur
e A
utho
rized
Pub
lic D
iscl
osur
e A
utho
rized
Pub
lic D
iscl
osur
e A
utho
rized
Pub
lic D
iscl
osur
e A
utho
rized
Pub
lic D
iscl
osur
e A
utho
rized
Pub
lic D
iscl
osur
e A
utho
rized
Pub
lic D
iscl
osur
e A
utho
rized
Pub
lic D
iscl
osur
e A
utho
rized

CURRENCY EQUIVALENTS
Currency Unit: Sudanese Pound (LS)
Exchange Rate as of December 31, 1986.
Official Rate US$1.00 = LS2.5Commercial Rate US$1.00 = LS3.25Parallel Market Rate US$1.00 = LS4.5
Fiscal Year
July 1 - June 30
(in 1984 and 1985 a Coranic year was introduced,but in 1986 the traditional definition of fiscalyear was reintroduced, in this report thetraditional definition is used for all years).

FOR OMCUIL US ONLY
SUDAN
THE MANUFACTURING SECTOR:
SETTING THE STAGE FOR RESTRUCTURING
VOLUME II: ANNEXES
TABLE OF CONTENTS
page
ANNEX I: Regulation of Industrial Activities .... .......... 1
ANNEX II: State-Owned Manufacturing Enterprises ............ 17
ANNEX III: Labor Markets in Sudan .... ....................... 37
ANNEX IV: The Financial Sector .... ....................... 55
ANNEX V: Statistical Appendix ...... ....................... 65
This document has a restricted ditribution and may be used by recipients only in the porformanceof their offlcial duties. Its contents may not otherwise be disclosed without World Bank authorizaton.

ANNEX I
REGULATION OF INDUSTRIAL ACTrVITIES
A. Introduction
1. This Annex focuses on the regulatory framework within whichindustrial enterprises, both private and public, operate. The discussionis centered on four main areas where regulations have been inhibitingefficiency and distorting the allocation of resources: investments,Imports, exports, and domestic prices. The institutional framework andcapability of the administration of these regulations are also discussed.
B. Investments
2. The regulatory framework for investments is contained in the"Encouragement of Investments Act, 1980" and the accompanying "GeneralRegulation of Encouragement of Investment, 1982". All projects not lessthan LSd 250,000--whether incentives are being requested or not--aresubject to investment licensing under the Investment Act except for a listof 27 categories where the approving authority was transferred to theregional governments. Investors in projects established without a licenseare fined; in addition, unlicensed projects requiring imported inputs wouldnot be able to operate since the importation approval requires thepresentation of an investment license.
3. The 27 categories of industries whose licensing is delegated tothe regional authorities include two categories which are discretionary andambiguous in terms of definition: (1) any other light industry the ownerof which asks for no concessions under the investments Act; and (2) anyother industries decided by the Minister of Finance and Economic Planning.
4. The Bureau of Investment is the regulatory agency charged withthe implementation of the Investment Act. Because the Investments Actcovers private sector projects in all areas, the Bureau of Investment wsplaced under administrative supervision of the Ministry of Finance andEconomic Planning to obviate biases by sectoral ministries in favor ofinvestment in their respective sectors. The Bureau of Investment,technically called the "Secretariat-General for Investment", is composed ofa Secretary General, a Technical Secretariat, and a ConsultativeCommittee. In addition to the Secretariat-General, a Ministerial Committeefor Investment was formed with the general function of supervising theencouragement of investment. The detailed functions and composition of thedifferent institutions involved in investment in licensing are explainedbelow.
S. The Secretary General is responsible for the preparation of thestudies and recommendations on the investment applications which are to besubmitted to the Ministerial Committee or Minister for decision. As such,the Secretary General has supervision over the Technical Secretariat andpresides over the deliberations of the Consultative Committee.

- 2 -
6. The Technical Secretariat makes the required analysis of theinvestment applications including the supporting documents such as thefeasibility studies. In addition it has the responsibility of following upthe execution of the projects and of controlling the utilization ofIncentives. It is also charged with disseminating investment informationand providing advice to investors. The Technical Secretariat is composedof at least six members: a representative from the Ministry of Industryappointed by the Minister of Industry, a representative from the Ministryof Agriculture appointed by the Minister of Agriculture, a representativefrom the Industrial Research and Consultancy Institute appointed by theMinister of Industry, a representative from the Ministry of Constructionand Public Works appointed by the Minister of Construction and PublicWorks, a representative from the Ministry of Finance and Economic Planningappointed by the Minister of Finance and Economic Planning, and arepresentative of the Secretariat-General appointed by the SecretaryGeneral for Investment. The committee is supported by a staff of 40, andmeets at least once a week.
7. The Consultative Committee is the deliberating body thatconsiders applicatlons for project licenses and incentives after theTechnical Secretariat has made its analysis. Its recommendations areforwarded to the Minister of Finance and Economic Planning through theSecretary-General. The Investments Act provides that the ConsultativeCommittee "shall consist of the Secretary General as Chairman and of suchmembers representing bodies directly concerned with investment as thePresident of the Republic may appoint provided that four membersrepresenting the private sector whose tenure of membership shall be threerenewable years, shall be included in the appointment." Presently, theConsultative Committee consists of eleven members: Undersecretary forEconomy, Undersecretary of Agriculture, Undersecretary of Energy,Undersecretary of Commerce, Deputy Undersecretary of Industry, Director ofCentral Land Unit, Director of National Corporation for Electricity,Director of the Bank of Sudan, Chairman of the Sudanese IndustriesAssociation, Representative of the Chamber of Commerce, and the LegalAdviser to the Ministry of Finance and Economic Planning. The Committeeconvenes once a month.
8. The Investments Act also established a Ministerial Committeewhose composition is to be decided by the President of the Republic. TheMinisterial Committee is empowered by the Investment Act to "frame thegeneral policy for encouragement of investment" and "determine thepriorities in the grant of licenses, privileges and facilities". However,the Ministerial Committee was never formed.
9. The Minister of Finance and Economic Planning is the approvingauthority for the approval of licenses, incentives, and facilities underthe Investments Act. All alterations in the size and character of theproject, including transfers of ownership, are subject to the writtenconsent of the Minister of Finance.

- 3 -
10. The following are the procedures in the licensing process:
(a) Application for licenses are submitted to the concerned Ministryon a three page form containing basic Information on theenterprise and the project and supported by a feasibility study,the taxation card and certificate from the taxation department,and a certificate of financial ability from a commercial bank.Copies of the applications are sent to the Secretariat-General.
(b) After analyzing the application, the concerned Ministry submitsthe application along with its recommendations to the TechnicalCommittee of the Secretariat-General. The Ministry may requestfor additional information from the prospective projectproponent.
(c) The Technical Committee studies the application and submits itsrecommendations to the Consultative Committee.
(d) The Consultative Committee deliberates over the application andmakes its recommendations.
(e) The Secretary General presents the recommendations of theConsultative Committee to the Minister of Finance and EconomicPlanning for his approval.
11. Over a four year period from 1980 to 1984, the total number ofprojects approved was 1,330 with an estimated ii.'estment value of LSd2.0billion; this is equivalent to about one project being approved per workingday with more being subject to analysis and deliberation assuming that someproject applications are rejected.
12. The licensing procedure, though few in number of steps, generallytakes several months. According to the Investments Act, the concernedMinistry has one month to analyze the application and submit itsrecommendations to the Secretariat; the Secretary General Is given twomonths to submit the recommendations for approval of the Minister ofFinance and Economic Planning. In practice, this timetable is notfollowed: it is difficult to process more than 300 projects per year givenlimited manpower and the degree of detail of the analysis of some projects,whose spare parts and equipment requirements are being checked. The lengthof time it takes to secure an investment license is a disincentive toinvestment, especially for medium scale industries.
13. The recommenided direction of reform is to eliminate investmentlicensing for those that are not applying for incentives under theInvestments Act and to make more mechanical and transparent the proceduresfor approving applications for incentives. More specifically, thefollowing are recommended.
(a) Investment licensing should be eliminated for all projects exceptfor a limited negative list of socially undesirable industrialactivities. The rationale is the facilitation of entry ofenterprises to promote competition and the elimination of

- 4 -
centrally directed allocation of resources. Investments inpreferred areas of economic activity could be encouraged--andinvestment in non-preferred areas could be discouraged-byrestructuring the system of incentives to employ a moremechanical and transparent process.
(b) Investment licensing for large scale projects, which could bedefined to be more than US$1.0 million, could be replaced byregistration with the Bureau of Investment. The purpose of theregistration is to monitor rather than to approve or disapproveof investment decisions by the private sector; furthermore. theBureau of Investment has the opportunity of disseminatinginformation to prospective investors in case the proposedinvestment is in a less preferred area, e.g., overcrowdedIndustries. The registration process permits the Bureau ofInvestment to analyze investment trends and lessen marketimperfections irimarily by providing Information.
(c) The Investment Act should be restructured to permit the grantingof incentives without need for prior approval or licensing of theincentives. Specifically, the following modifications could bemade: (a) all exports would be subject to the drawback system;and (b) all foreign investments with proof of inward remittance--and possibly registered with the Bank of Sudan--are automaticallygranted protection against nationalization and provided withrights of capital and divided repatriation without need for priorregistration of investment. The assumption is that all exportsand all foreign investments are to be encouraged; priorregistration or licensing is therefore superfluous.
14. The recommended reform assumes an incentive structure describedin previous chapters which utilizes a more transparent mechanism and whichencourages general classes of economic activity (such as exports andforeign investments) rather than specific investment areas (such as textileor oil milling).
C. Importation
15. Import licensing arrangements in Sudan are comprehensive andcomplex. While different procedures are followed for government agencies,private productive enterprises, public productive enterprises, and forcommercial imports by public and private agencies, all these procedures arecomplicated and time consuming. The major difficulties created by thesystem as summarized in a recent USAID report include: (1) considerablerisk faced by importers that the major effort and expense incurred infollowing procedures would not necessarily result in the authority toImport; (2) confusion among different entities sharing responsibility foradministering the system about their respective roles; (3) substantialuncertainty about the priorities associated with importation anddifficulties caused by abrupt changes in priorities; and (4) a further

encouragement of black market activities and smuggling as frustratedproducers and consumers seek alternative means of obtaining imports.
16. Aside from personal effects of returning migrants, there are fivemain categories of import approval procedures which are applied.
(1) Public Sector Commodities. The government maintains a monopolyof import supply of sensitive products such as wheat andpetroleum which presently account for over 30 percent of totalmerchandise imports. In addition, the government imports othercommodities utilizing its official foreign exchange holdings.The procedures for government imports are outlined below:
(a) the Ministry of Finance allocates foreign exchange budgetsto the government agencies;
(b) the importing agencies request for approvals from theCentral Planning Unit;
(c) the Central Purchasing Unit solicits tenders from suppliersand approves sources and prices of imported items;
(d) the importing agencies apply for import licenses from theImport Office, MCCS with the approval of the CPU attached tothe applications;
(e) the Import Office, MCCS, recommends approval to theCommittee for the Rationalization of Imports;
(f) the CRI refers approval decision to the Import Office, MCCS;
(g) the Import Office, MCCS, gives import license to theimporting agencies;
(h) the importing agency pays local currency equivalent offoreign exchange requirements to the Bank of Sudan;
(i) Bank of Sudan opens letter of credit;
(j) Customs Forces release goods against shipping documents.
(2) Commodity Aid Financed Imports. These imports, equivalent toabout 25 percent of total official imports in 1985, have inrecent years been an extremely important source of governmentrevenue. Both private and public sector entities are covered bythe following procedures for importation of commodity aidfinanced imports:
(a) The Commodity Aid Committee solicits and receives requestsfor imports under the program from various entities inSudan;

- 6 -
(b) the Commodity Aid Committee and the Donor Agency negotiateon the matching of the commodities with the eligibleimporters under the framework of the specific donoragreements;
(c) the Commodity Aid Committee sends letters of approval toselected importers;
(d) the importer applies for license with the Import Office ofthe Ministry of Commerce;
(e) the Import Office of the Ministry of Commerce approves theimportation;
(f) upon approval, the importer deposits the local currencyequivalent, converted at the commercial bank rate, with thegovernment owned Import/Export Bank;
(g) Import/Export Bank releases shipping documents;
(h) Customs Forces releases goods against shipping documents.
(3) Open General Licenses (OGL) for Private Producers. This is themajor route through which industrial producers, not able toobtain access to commodity aid funds, would process theirrequests for imports. It is also the most complex of the variousroutes as described below:
(a) major producers request for an annual OGL allocation fromthe Import Department of the Ministry of Industry whichchecks the request against installed capacity;
(b) the major producers request for partial shipment against theOGL allocation, which defines the upper limit of theimportation of eligible goods, from the Import Office of theMinistry of Commerce;
(c) the Ministry of Commerce refers the request back to theImport Office of the Ministry of Industry to determineappropriateness of import prices;
(d) the Import Office of the Ministry of Industry makes ajudgement on the import and gives back the application tothe Import Office, Ministry of Commerce;
(e) the Import Office, Ministry of Commerce, refers the importrequest to the Committee for the Rationalization of Imports;
(f) the Committee for the Rationalization of Imports passesjudgement on the request based on available foreign exchangeand available domestic supplies of the import request andgives its decision to the Import Office, Ministry ofCommerce;

(g) the Import Office of the Ministry of Commerce grantslicenses to those approved by the Committee for theRationalizat-on of Imports;
(h) following the issue of the import license by the Ministry ofCommerce, the importer deposits a part of the value of theImportation, typically five percent, converted at thecommercial bank rate;
(i) the importer submits the license to the Bank of Sudan forfranking;
(j) the Bank of Sudan checks the license against the record ofactions by the Committee for the Rationalization of Imports,recommends Eplitting of importa-lon depending on foreignexchange budget, and franks l.Lcenses with a time limit ofgenerally 15 days for letter of credit opening;
(k) the importer takes the license to his commercial bank toarrange the opening of the letter of credit;
(1) the commercial bank submits the request of letter of creditopening to the fore tgn exchange pool administered by acommittee of seven bankers;
(m) the committee of seven bankers approve the foreign exchangeallocation in favor of the letter of credit request;
(n) the bank opens the letter of credit upon receipt of paymentof the remainder of the equivalent of the foreign exchangeconverted at the official exchange rate;
(o) the bank releases the shipping documents to the importer;
(p) Customs Forces releases the goods upon presentation of theshipping documents.
(4) Open General License for Public Sector Producers. The procedureis the same as for private producers except for an additionalstep: upon granting of the annual OGL by the Import Departmentof the Ministry of Industry, the Central Purchasing Unit solicitstenders from suppliers.
(5) Commercial Imports. This category covers all imports byproductive enterprises who do not have an annual OGL allocation,as well as imports for trade purposes. In this case, the licensegoes first to the Import Office of the Ministry of Commerce andthen to the Inter-Ministerial Import Committee. Thereafter, theprlcedures follow the same route as for the OGL importers. Itgoes without saying that given the extensive list of banned itemsand the tightness of the procedures, it is extremely difficult toimport items other than those used directly in the productiveprocess or by the government.

17. There are several reasons Why the system as described above needsrationalization. First, the considerable costs to would-be importers interms of time spent filling in forms, seeking Information, and waiting forapprovals not only discourage production but also encourage black marketactivities. Second, the system has little chance of achieving itsobjective of allocating resources efficiently since there is no distinctionthat is made among efficient and inefficient Importers. Third, the systemis open to abuses. Fourth, the system involves a high cost ofadministration.
18. Import licensing has been made necessary by the foreign exchangepolicy: more reallqtic pricing of foreign exchange would make importlicensing unnecessary. The recommended direction of reform is theelimination of import licensing and its replascement by a market-determinedforeign exchange pricing policy and a tax and tariff structure thatencourages efficient economic activities. Attempts to influence the levelof demand for foreign exchange through import licensing would .esult in theadministrative allocation of scarce resources which is not likely to resultin efficient distribution. Additionally, excess demand would simply spillover to the parallel economy with negative effects on government revenues.
D. Exports
19. All merchandise exports are subject to licensing from theMinistry of Commerce. The prospective exporter is required to submit anexport contract specifying the type of commodity, means of payment, quan-tities to be exported, prices, and date of shipment. The contract isattached to an export application form which is sent to the Export Licens-ing Section of the Ministry of Commerce which checks the following:(1) the prices of the commodities to be exported; (2) quantities of commo-dities to be exported; (3) means of payment; (4) quality of goods to beexported, (5) whether the commodities are permitted for export or not and(6) whether the country to which the commodities is exported has a ban onthese commodities. The license is approved subject to certain conditionsand a copy of the export license is sent to the Customs st:ation.
20. The only export monopoly is the Cotton Public Corporation throughwhich all cotton exports are to be coursed. There used to be a monopoly ingroundnuts exports which was abolished a few years ago but which hasrecently been re-established. Manufactured exports are handled by theprivate sector, the main restrictions being in the price and quantity ofthe exports. The means of payment required are mainly hard currency,although to a limited scale barter trade is allowed.
21. The rationale behind the export bans, whether total or partial,is to ensure domestic supply. The Department of Supply under the Ministryof Commerce makes the determination of the supply gap for certain commodi-ties and recommends the ban on exports of such commodities in case a supplygap is ascertained.

- 9 -
22. Minimum prices are set to prevent salting of foreign exchange.A committee responsible for the determination of the minimum prices ofexportable commodities was established in the Ministry of Cooperation,Commerce, and Supply, headed by the director of the Export LicensingSection. Other members of the committee include representatives from theBank of Sudan, Exporters Union, and the Sudan Chamber of Commerce. Thecommittee reviews on a regular basis trends of export prices and setsminimum prices of exportable commodities. The main complaint of exportersis that the prices are not reflective of world prices and do not considermarketing strategies which may necessitate pricing lower than world marketto break into certain markets.
23. The export licensing requirement should be eliminated andreplaced by registration except for those commodities that are covered byspecific bilateral agreements that need some kind of control, e.g.,garments under quota restrictions. The recommended changes in the policyenvironment would make unnecessary the export licensing process. Thesupply gap argument assumes domestic price controls; there is no need toban exports if domestic prices are allowed to seek a level that reflectsthe scarcity value of the products. The problem of foreign exchangesalting has its roots in an overvalued exchange rate and limited access toforeign exchange; the establishment of a unified market determined exchangerate would make superfluous a price check on exports.
24. Instead, the Ministry of Commerce should encourage exports in avariety of ways. Information on markets, regulations, and trade practicesshould be available to prospective exporters. The setting up of a body todetermine quality specifications acceptable to the buyers would prevent toa certain extent claims due to product defects. Trade agreements couldalso be sought out which would give preferred status to exports from theSudan.
E. Price and Profit Controls I/
25. According to the prevailing laws, almost every commodity sold inSudan with the exception of handicrafts in informal markets, is subject tocontrolled prices at the import, ex-factory, wholesale and retail levels.This tradition of far-ranging control of prices dates back to thepre-independence period and has not been modified since it was codified in1955.
Legal Framework
26. The legal basis for the system of price controls Is contained inthe following laws: (1) the Provisional Pricing Control Order (1955); (2)the Maximum Profit Rates Act (1955); and (3) the Goods Control Act (1977).
1/ Source: IMF Report.
- 10 -
27. The Provisional Pricing Control Order, which has remainedunchanged since its adoption, regulates the pricing procedures for allcommodities sold in Sudan at all marketing stages. It enumerates in detailthe list of allowable costs to the importer and domestic manufacturer andestablishes the mechanism for determining maximum legal prices at theex-factory, import, wholesale, and retail levels. Profit margins are addedto allowable costs to determine maximum legal prices according to theprofit rates set forth in the Maximum Profit Rates Act. These rates differaccording to the type of commodity and marketing stage, and, with very fewexceptions have remained unchanged since 1955. In contrast to the detailedmechanism for pricing imported and domestically manufactured goods thePricing Control order leaves the Ministry of Commerce considerablediscretion to determine the prices of domestic agricultural products; theMinistry of Commerce can define allowable costs and reasonable profi. ratesfor these commodities without reference to established guidelines.
28. The Goods Control Act of 1977 greatly expanded the powers of theMinistry of Commerce on price determination by allowing it to: (1) fixand control the price of any good,'overriding, if necessary, establishedguidelines; (2) prohibit or regulate the production, import, export, trans-port, distribution or storage of any good; (3) prohibit the hoarding of anygood; (4) order the sale of any good to the Ministry of Commerce or to anyperson at the legal price; and (5) examine and seize all financial recordsof any business and conduct searches without warrant. Although the pricecontrol legislation puts the final authority for price determination andits enforcement under the Ministry of Commerce, in practice the Ministry ofCommerce has delegated some of its powers and, currently, price controlsare administered by several ministries, joint committees, local govern-ments, and several enforcement entities.
The Mechanism of Price Determinatior.
29. Different mechanisms of price determination are applicable toimported goods, domestic manufactures, and domestically produced agricul-tural commodities. In addition, prices of selected commodities consideredto be of strategic importance are determined without reference to esta-blished guidelines; most of these prices are set directly by the ministerconcerned.
Imports
30. In the case of imports, the pricing decisions are made by theCentral Pricing Office (CPO) of the Ministry of Commerce. To obtain aprice decision from the CPO, the importer must submit an application indi-cating the exact nature and description of the goods, customs certificates,and proof of all "allowable costs" incurred in the process of importation.Allowable costs are defined to include (1) value of the imported good(c.i.f.) converted into local currency at an exchange rate determined by

- 11 -
CPO;2/ (2) custom duties and government fees; (3) clearance costs;(4) bank fees and commissions; (5) actual interest charges paid on bankloans; (6) a maximum of 6 percent per annum interest on prior importdeposits accruing from the date of deposit to the date imports arrive atthe port of entry,3/ and (7) transport charges from the point of entry tothe place of sale or storage. On the basis of this information, the CPOprovides the importer with the official price documentation which includesthe official landed price as well as wholesale and retail prices which areobtained by adding the legal profit margins to the landed price. Profitrates, ranging from 15 to 65 percent, were set in 1955 according toseveral criteria, Including rate of turnover of the comrodity, degree ofrisk or loss from wastage, breakage or spoilage, or need for specialtreatment such as refrigeration. For the few imported commodities whichhave appeared in the market after 1955 and are therefore not included inthe Maximum Profit Act list, the Ministry of Commerce determines legalprices on the basis of "reasonable" profit rates; these profit rates areset normally at 10 percent for importers, 5 percent for wholesalers and 15percent for retailers.
31. Importers are permitted to make their own cost calculations byfollowing the same procedures as the CPO and sell their products withoutany documentation from the CPO, provided that their financial recordsremain available for inspection. Currently about 80 percent of imports arepriced directly by importers. All importers, wholesalers, and retailersare bound by law to make their goods available at the legal prices. In thecase of complaint, judicial action can be taken against violators and, ifconvicted, a fine and a prison sentence can be imposed.
Domestic Manufactures
32. The authority for setting ex-factory prices for domesticmanufactures rests with the Joint Price Committee (JPC) composed ofrepresentatives of the Ministry of Commerce and the Ministry of Industry.Calculations for ex-factory prices are prepared by the Specifications,Quality Control and Costing Office (CO) of the Ministry of Industry and aresubmittd to the JPC for approval. Wholesale and retail prices aredetermined by the JPC by adding profit margins to the ex-factory prices;wholesale and retail profit rates are the same for imports and domesticmanufactures.
33. With the exception of certain products for which the CO calce-lates and average industry price, ex-factory prices are firm-specific._/
2/ As of end-Novembet 1985, the CPO used a rate of LSd 3.00 per US$1,except for medicin.es, where the commercial bank rate of LSd 3.35 perUS$1 was applied. Commodity aid imports were converted at differentexchange rates.
3/ Prior import deposits range from 10 percent (intermediate inputs) to'00 percent (luxury goods).
4/ Following are the commodities for which industry prices are calculated:edible oils; soft drinks; macaroni; ice; plastic shoes; and commoncloth.

- 12 -
Ex-factory prices are calculated on the basis of a list of allowable costswhich include: (1) raw materials and packaging;5/ (2) wages and salaries;(3) electricity, fuel, and water charges; (4) costs for general mainte-nance; (5) capital depreclatlon;6/ (6) insurance costs; (7) bank interestcharges; (8) rents, and (9) taxes on wages and salaries paid by theemployer. Ex-factory prices are calculated by adding a profit margin forthe producer to allowable costs. The CO exercises considerable discretionin determining the profit rate in each case; currently, the rates rangefrom 7.5 percent to 15 percent, with the bulk being set between 10 and 15percent.
34. Producers pay excise taxes on the basis of the establishedex-factory prices and production levels. In order to prevent underreport-ing of production, an official of the Excise Office is appointed to eachfirm to inspect production records and monitor the shipment of goods.
35. Requests for price adjustments are submitted by firms followingcost changes. Although most cases are reviewed individually, the JPC mayonly consider cost changes which are shared by all firms in the industry(e.g., changes in electricity rates, prices of raw materials, labor costs,etc.). Currently, the JPC takes from four to six months and occasionallyeven longer to process an application. If the application for priceadjustment is rejected or the requested adjustment is not granted in full,the producer has the right to appeal to a committee composed of theMinisters of Commerce and Industry that will make the final decision.
Domestic Agricultural Products
36. The prices of locally produced crops are established by differentadministrative bodies. Minimum producer prices for groundnuts and sesameare fixed by the Oilseed Corporation, although the Ministry of Finance isnot under any legal obligation to make funds available to the Corporationto support these floor prices.7/ Gum arabic floor prices are fixed by theGum Arabic Corporation which has a monopsony in that market. Historically,there have been no minimum prices for dura (sorghum), but the Governmentintends to intervene in 1986 through the Agricultural Bank of Sudan tosupport a minimum price for dura in view of the rapid and sharp declinein its market price since July. Procurement prices for wheat are set eachyear by the Ministry of Agriculture. Finally, cotton prices are determinedby a joint committee composed of representatives of the Ministries ofAgriculture and Finance.
5/ Since November 7, 1985 imported raw materials are converted into localcurrency for costing purposes at the rate of LSd 3.35 per US$1.
6/ The CO uses the same depreciation rates as those used by the Ministryof Finance for assessing business profit taxes. Currently, thefollowing annual rates are applicable: 2.5 percent for buildings;7.5 percent for machinery and equipment; and 25 percent for motorvehicles.
7/ As of end-January 1986, the Oilseed Corporation has been granted amonopoly for the exports of groundnuts.

- 13 -
37. The Ministry of Commerce has delegated the power to set theprices of most other domestically produced crops to local governmentswithin their area of jurisdiction. The performance of local governmentswith regard to price setting and controls appear to cry across regions andis currently being reviewed at the Ministry of Finance so as to achieveharmonization. In the National Capital Administration, the High Committeefor Prices (HCP) sets the wholesale and retail prices of most locallyproduced foodstuffs sold within the Greater Khartoum area (Khartoum,Khartoum North, and Omdurman)- These items include fruits ard vegetables,meats, fish, and dairy products.8/ The recommendations for priceadjustments are put forward to tihe HCP by a technical committee thatobserves market developments. Since the supply of most zommodities whichare under the direct pricing control of the HCP is seasonal, a major taskof this Committee is to establish whether market variations are of atemporary nature or whether they reflect more permanent changes. The HCPtakes supply and demand conditions into consideration when adjustingofficial prices; however, in the case of temporary and reversible factors,such as transportation difficulties into the city, the HCP may refrain fromadjusting the official price.
38. The HCP, which convenes weekly to review prices, is composed ofrepresentatives from each of the three area councils, from the Tourist andHotels Corporation, from the Ministry of Agriculture, and from themunicipalities' departments of trade and supply (on secondment from theMinistry of Commerce), health affairs, and weights and measures. Theproducers and distributors may also be represented in the deliberations ofthe Committee if a pricing decision affecting them is discussed. Thedecisions of the HCP are transmitted to other regional governments whotypically take them into consideration in setting prices within theirjurisdictions. However, the extent to which the pricing decisions made inthe capital are followed by the regional governments varies widely amongregions where prices tend to reflect the relative scarcity of commoditiesin that region.
Strategic Commodities
39. Prices of goods considered to be of strategic importance are setdirectly by the following Ministers without reference to the establishedpricing rules; petroleum prices (Minister of Energy); sugar prices(Minister of Finance); wheat, wheat flour, and bread prices (Minister ofCommerce).
Enforcement of Price Controls
40. Responsibility for enforcement of all pricing laws was trans-ferred from the Ministry of Commerce to the local governments by the LocalGovernment Act of 1980. Local governments are empowered to exercise
8/ The HCP also sets prices for other commodities such as charcoal andwood, and for selected services such as meals in restaurants, hotels,cinema tickets, and urban transportation.

- 14 -
the authorities of the Minister of Commerce as detailed in the GoodsControl Act of 1977, including the search without warrant, seizure of goodsand financial records, and the initiation of judicial action againstoffenders. Local governments also set transport increments on the officialprices for goods transported into their regions and, therefore, determinethe final official price of all goods sold within their jurisdiction.
41. The enforcement apparatus consists of the local pricing office,the price courts, and the General Discipline Guards. The local pricingoffices are staffed b/ officials trained by the Ministry of Commerce in theapplication of the price laws and in the calculation of costs. Prices arecontrolled through random checking in stores and by investigating customercomplaints of overcharging. A customer who suspects of being overcharge.dalso has recourse to the price courts which are situated near the markets.These courts are composed of officials from the pricing office, policeofficers assigned to the court by the local governments, and a militaryofficer trained in the legal requirements of the pricing laws who acts asjudge. When a suspect is brought before a court by a customer, hisfinancial records are reviewed, witnesses are questioned, and a verdict andsentence are rendered. The defendant can appeal the decision throughnormal judicial channels. Price controls are also enforced through theGeneral Discipline Guards, a para-police force under the direct authorityof the regional governor; the Guards, in addition to keeping order in themarket ensure that actual prices are commensurate with legal prices.
42. Penalties for violation of pricing laws are prescribed in the1977 Goods Control Act. They range from a three-year maximum imprisonmentand fines for keeping improper financial records, to five years forhoarding and other infractions, to seven years for importers who do notcorrectly report their price, to ten years for smuggling.
43. The observance of pricing decisions for domestic manufacturerscan easily be controlled since there are few industrial enterprises andthese are monitored in addition by the Ministry of Finance for taxpurposes. However, enforcement at the wholesale and retail stages becomesprogressively more difficult and is almost wholly dependent on theinitiative of consumer to bring infractions to the attention of officials.The pricing control becomes particularly difficult at times of shortages.For example, in the case of imports which, at present are largelyrestricted, customers are anxious to purchase from the limited stocks andare not inclined to complain to the authorities, thereby breaking thestrongest link between the enforcement authorities and prices.
Conclusions
44. The case for price liberalization has been explained in Chapter 3of the main report. Essentially the distortions created by the pricecontrol regime have conspired to encourage trading and discourage produc-tion. In addition, the following buttress the case of elimination of pricecontrols.
I

- 15 -
45. One, price controls do not work in Sudan in terms of benefits tothe consumer. The survey of major manufactured goods sold to consumersshow actual prices paid by the consumer is way in excess of controlprices.
'46. Two, price controls are difficult if not impossible to enforce atthe retail level. The traders, in collusion with buyers, would find waysand means of transacting business underground with the unintended result ofdecreased government revenues from taxation.
47. Three, price control decisions lag behind realized costincreases, the net effect being the traders accumulating excessive rents.
48. Four, price controls entail profit or margin fixing through acost-plus medium which does not encourage operational efficiency.

_ It-, _
I ~ ~ ~ ~ ~ ~~ _
gTHIS PAG
IS BLANK

- 17 -
ANNEX II
STATE-OWNED MANUFACTURING ENTERPRISES
A. Introduction
1. This Annex examines the manufacturing enterprises owned orcontrolled by the government (SOEs)1/ and recommends a direction forreform. This is done by examining the evolution of direct governmentparticipation in manufacturing, the objectives of establishing SOEs, thecomparative performance of manufacturing SOEs with private sector firms,and the causes of divergence in performance.
B. Evolution of Manufacturing SOEs
2. The history of manufacturing SOEs is characterized by shiftingviews on the role of the state in economic activity. As a result, theevolution of the manufacturing SOEs followed a process of expansion andcontraction during its twenty-five year history. How the manufacturing850. evolved is analyzed in four periods:
Phase I (prior to 1960): Private Sector Dominance
Phase II (1960-1969) : Beginning of Public SectorParticipation
Phase III (1970-1979) : Expansion of Public SectorParticipation; Nationalization andConfiscation of Private SectorEnterprises
Phase IV (1980-present): Mixed Manufacturing Sector
3. Phase I: Prior tn 1960, private sector initiative was thedriving force behind manufacturing activities which were concentrated onvegetable oils, soap, confectionaries, soft drinks, cement, and textile.At independence in 1956, the first national government embarked on a policyof diversifying the economy and industrialization was envisaged as theappropriate strategy. Consequently, a system of incentives was designedand codified in the 'Approved Enterprises (Concessions) Act, 1956" whoseobjective was to encourage local and foreign private sector investments inindustry by providing incentives in the form of tax concessions, low renton land, and protective tariffs. Official development policy relied onprivate initiative as the locomotive of industrial growth.
D/ 9ue to lack of data, this study does not include firms operating underzhe Military Economic Board which was put into liquidation in 1985.

- 18 -
4. Phase II: The changes in industrial policy that occurred duringthe period 1960-1969 were precipitated by the military coup in late 1958and were incorporated in the "Ten Year Plan of Economic and Social Develop-ment of the Sudan 1961/62-1970/71." The plan introduced direct stateparticipation in industrial activity and consequently nine factories wereconstructed beginning in the early 1960s (see Table II.1). Despite theIncreasing activity by the state, the private sector remained dominantuntil 1969. The "Approved Enterprises (Concessions) Act, 1956" wasreplaced by the "Organization and Promotion of Industrial Investment Act,1967" whiclh became effective in March of 1968. One of the significantprovisions of the new Act was the recognition of government participationin industrial projects which the private sector was not willing to under-take because of huge investment requirements or unattractive returns. Inaddition, the new Act stated that the state might undertake "projects whichwere considered to be of a strategic nature and others which by necessityand for national considerations had to be injected into the traditionalsector of the economy." Furthermore, "strategic considerations" werementioned as a rationale for nationalization of private industry.
Table II.1: STATE-OWNED FACTORIES CONSTRUCTED, 1960-1969
Cost I Start ofFactory Lsd'0OO Creditor Production
1. Karima Dates 85 USSR 19602. Khartoum Tannery 1,003 Yugoslavia 19623. Guneid Sugar 5,460 West Germany 19624. Aroma Cardboard 720 Yugoslavia 19635. New Halfa Sugar 4,312 West Germany 19646. Kassala Onion 605 USSR 19667. Karima Fruits and
Vegetables 1,188 USSR 19668. Wau Fruits and
Vegetables 1,100 USSR 19679. Babanousa Dairy
Products 1,150 USSR 1966
Source: Bodour Osman Abu Affan, "Industrial Policies and Iriustrializationin the Sudan."
5. Phase III: The decade of the 1970s witnessed the expansion ofdirect state participation in manufacturing not only by the construction ofmore state-owned factories but also, and more significantly, through thenationalization and confiscation of private sector manufacturing enter-prises. The May Revolutionary Government of 1969 adopted a socialistorilentation resulting in the confiscation in 1971 of all the large private

- 19 -
manufacturing firms in accordance with the provisions of the "CompaniesNationalization Act, 1970." In 1971, almost 60 percent of total invest-ments in the industrial sector became state owned. However, the governmentreversed its policy of nationalization irn 1972 and promulgated the"Development and Encouragement of Industrial Investment Act, 1972" with theobjective of regaining the confidence of private investors. By 1979, mostof the confiscated firms were returned to their original owners whocomplained of the depreciated state of machinery and equipment. Perhapsthe two worst effects of the nationalization policy were the shaken confi-dence of investors and the acceleration of the migration of skilled workersand managers from Sudan.
6. From 1970-1979, about US$700 million of investments were made bythe public sector in industrial activities financed mainly by foreigndebt. Table II.2 lists the public investments in industry during theperiod 1970-79 with the estimated project costs.
7. Phase IV: During the period 1980-1985, no major new investmentswere made by the government in industry except for relatively minor prog-rams for rehabilitating some factories. The major developments have beenthe policy changes that resulted in: (i) the reduction in consumer subsi-dies for certain products such as sugar which improved SOE revenues; (ii)the curtailment of direct subsidies to SOEs; and (iii) efforts to returnselected confiscated firms to the private sector.
C. Objectives for Establishing SOEs
8. The initial direct participation of the government in manufac-turing activities during the early 1960s was intended primarily to comple-ment private sector initiative. The expansion of the role of governmentfrom support to direct participation was rationalized in the "Organizationand Promotion of Industrial Investment Act, 1967" which stated that thestate could undertake projects which (i) the private sector was unwillingor unable to invest in due to high risk, huge investment requirements, orlow profitability; or (ii) were deemed to be in the national interest dueto strategic importance. Among the investments made by the government inthe early 1960s, the two sugar factories pioneered the growth of thepresent subsector and the tannery was the first large scale attempt tomodernize the leather and tanning industry.
9. The social objectives behind the government investments inindustry manifested themselves in the rationale for and design of some ofthe earliest projects constructed at the beginning of the 1960s. Thesesocial objectives were later incorporated in the statutes of the IndustrialDevelopment Corporation which was organized in 1965 to supervise the stateowned factories. Among the objectives of IDC were: (i) to distributemanufacturing activities throughout the country; (ii) to reduce migrationfrom the rural areas to the 'Three Towns" (Khartoum, Khartoum North, andOmdurban where Industrial activities are concentrated); and (iii) to trainpeople from rural areas in modern agricultural techniques and skilled

- 20 -
factory work. Of the nine projects started in the 1960s, five were foodprocessing plants located in remote rural areas to accelerate economicdevelopment in those places.
10. The rationale for public participation in industry became ideolo-gical and political In 1970. In particular, the objective as embodied Inthe "Companies Nationalization Act, 1970" was to assure state domination ofthe industrial sector including the expulsion of major foreign investors.The confiscation of major private sector enterprises, the nationalizatlonof foreign firms, and the huge additional investments by the government Inindustry were the consequences of economic policy at that time.
Table II.2: STATE OWNED FACTORIES CONSTRUCTED DURING 1970-79
Cost Start of Start ofFactory LSd'00O Construction Production
1. Khartoum Central Foundry 300 1971 19752. Sennar Sugar 28,000 1972 19763. Assalaya Sugar 30,000 1974 19794. Melut Sugar 49,000 1976 *5. Mangala Sugar 26,000 1974 *6. Hassaheisa Textiles 4,000 1972 19767. Port Sudan Cotton Spinning 14,000 1972 *8. Al Haj Abdallah Spinning 20,000 1974 19819. Khartoum North Spinning 10,700 1975 *10. Gadaw Textile 34,000 1975 *11. Kosti Weaving Shed 5,000 1974 197812. shendi Weaving Shed 5,000 1974 197813. Douem Weaving Shed 5,000 1974 197914. Nyala Weaving Mill 5,000 1974 197915. Kadugli Weaving Mill 5,000 1974 197916. Mangala Weaving Mill 5,000 1974 197917. Abu Naama Kenaf 7,000 1972 197618. Tonj Kenaf 17,000 1974 *19. White Nile Tannery 1,300 1972 197520. Gezira Tannery 2,800 1972 197721. Malakal Tannery 828 1973 *22. Port Sudan Fertilizer 19,000 1975 *23. White Nile Brewery 900 1973 *
Total LSd 294,828(us$737,070)/
* Not yet operational
a/ Based on exchange rates during the period of construction.

- 21 -
11. The subsequent reversal of the nationalization policy and thereturn of most confiscated firms to the private sector appeared to be arepudiation of the "dominant public sector" theme of 1970. The need forboth local and foreign investments in the industrial sector was reinforcedby the appearance of two investment acts in 1972 and 1974 which devotedwhole chapters on investment guarantees against nationalization and confis-cation. To date, only five out of the confiscated/nationalized firms havenot been returned to the private sector: Nile Cement Company, MaspioCement Company, Blue Nile Packing Company, Krikab industry Corporation, andRia Sweet Company. However, the government continued to invest in manufac-turing projects, mainly in textile, tanneries, and sugar. The manufactur-ing SOEs do not dominate the manufacturing sector: the 1981 survey ofmanufacturing industries estimates the share of both investment and grossoutput by the public sector enterprises at less than 15 percent.
12. At present, there is no clear definition of the role of thegovernment in manufacturing. All manufacturing SOEs, with the exception ofthe two cement companies, are in economic activities where the privatesector has majority participation. In the case of cement, both plants werenationalized but never returned to the private sector, although one of theplants has minority private sector interest. In effect, the output of themanufacturing SOEs were either historically being produced by the privatesector or are currently competing with similar output from private firms.The original objective of public sector direct participation, which is toinvest in projects that do not attract private sector participation, nolonger applies. Furthermore, the strategic criterion as applied to anyexisting SOE manufacturing operation is questionable.
13. Although social objectives were taken into consideration in thedesign and location of projects, the manufacturing SOEs were establishedprimarily as profit-making entities as indicated by available feasibilitystudies of past projects. Although stabilization of prices or subsidiza-tion of certain goods were never explicitly mentioned as objectives forsetting up state-owned factories, in practice, the state sugar factorieswere selling their output at prices lower than the equivalent export priceand lower than the prices at which the private sector sugar company isallowed to sell. The prices of the non-sugar manufacturing SOEs aresubject to the same administrative controls as private sector enterprises.At this point, it is necessary for the government to make explicit and toquantify the cost of achieving the social objectives of the manufacturingSOEs and bear judgments on their desirability.
D. Relative Size and Productivity
14. The SOE sector, which is dominated by the agricultural enter-prises, plays a significant role in the Sudanese economy: the non-finan-cial SOEs are estimated to contribute about 50 percent 2/ of GDP andaccount for more than 50 percent of domestic credit. Cumulative government
2/ This does not include firms operating under the Military EconomicBoard.

- 22 -
equity in parastatals amounted -o LSd 944 million as of 1983 and annualinvestments in the SOEs have Increased from LSd 66 million in 1978/79 toLSd 214 in 1982/83, equivalent to more than 50 percent of total publicsector investments. While there are no statistics on the financial perfor-mance of the estimated 136 enterprises that comprise the parastatal sector,a World Bank survey in 1984 on sixteen SOEs recorded a net loss of LSd 22million in 1982/83 on an equity figure of LSd 367 million and net fixedassets of LSd 714 million. Indicators point towards substantial parastatallosses financed mainly by the Bank of Sudan which in 1984 placed approxi-mately LSd 500 million of uncollectible parastatal debts into a special"frozen" account.
15. The mission has identified 27 operating manufacturing SOEs whichhave an estimated LSd 160 million of government equity, accounting for 17percent of total government equity in the SOE sector. However, the govern-ment has invested an additional LSd 150 million (US$375 million) in sevenuncompleted wholly owned industrial projects and in addition has majorityownership in a non-operating fertilizer company with a US$75 million (LSd187.5 millon) 3/ obligation; these bring the total government investmentin manufacturing projects to about LSd 450 million. Despite the signi-ficant share of the manufacturing SOEs in total SOE investment, theircontribution to GDP is insignificant, amounting to only one percent of 1981GDP.
Table 11.3: COMPARATIVE SHARE OF PRIVATE AND PUBLIC SECTORIN MANUFACTURING, 1971 AND 1982
(percent)
Manufacturing 1971 1982Indicator Private Public Private Public
Gross Investment 41.0 59.0 86.9 13.1Value Added 46.9 53.1 89.7 10.3Gross Output 48.4 51.6 90.9 9.1Salaries and Wages 49.8 50.2 75.0 25.0Number of Employees 48.9 51.1 73.7 26.3
Source: Industrial Surveys.
3/ LSd 0.40 = $1.00 conversion at the time of investments.

- 23 -
Table II.4: GOVERNMENT INVESTMENTS IN MANUFACTURING
Estimated Percent ofNumber of Factories Investment Total In-
Activity Operating Non-Operating Total LSd'00O vestment
Fertilizer 0 1 1 187,000 41.6Textile 9 4 13 136,000 30.2Sugar 4 2 6 116,000 25.7Tanneries 3 1 4 5,000 1.1Food Processing 7 0 8 4,000 0.9Cement 2 0 2 2,000 2/ 0.4Miscellaneous 2 0 2 500 0.1Total 27 8 35 450,500 100.0
Source: Mission estimates.
a/ Confiscated companies; investment based on government equity amount asreflected in financial statements.
16. The manufacturing SOEs can be classified into seven majoreconomic activities as shown in Table II.4.
17. Based on the 1982 survey carried out by UNIDO, the manufacturingSOEs accounted for 13 percent of gross investments, 10 percent of grossvalue addid, nine percent of gross output, 25 percent of salaries andwages, and 26 percent of employment in the manufacturing sector. The shareof the industrial SOEs in total manufacturing activity as measured bydifferent criteria has substantially declined since 1971 due mainly to thereturn of confiscated firms to the private sector.
18. The largest single manufacturing SOE in terms of investment isthe fertilizer company which has a minority private sector participation.The plant, which needs about $5 million for commissioning, has not beenstarted up due to the non-viability of operations based on existing pricesof imported urea, cost of inputs, and operating expenses. The plant has apotential capacity of 90,000 tons per year to service an estimated 200,000tons per year of demand which is currently being met solely by imports.
19. Despite the enormous investments by the government in 13 textilefactories, the private sector is still predominant with 60 percent ofspinning and 70 percent of weaving capacities. In terms of actual product-ion, the share of the private sector is more than 70 percent. Among thestate factories, only Hassaheisa Integrated Textile Mills has been consist-ently in production, although capacity utilization has been below 30percent. One newly installed spinning mill (estimated project cost: $20million) operates at less than 20 percent of capacity due to a humidityproblem that halts all operations three months a year; however, the problem

- 24 -
could be corrected by a $0.5 million investment in equipment. Anotherrelatively new spinning mill (estimated project cost: $14 million)designed for export and located in Port Sudan is not operational because ofan air conditioning problem. Six weaving sheds (estimated cost: $30million) are considered by many textile industrialists as unviable due totheir uneconomic location; nonetheless they are operating at less than 15percent capacity and generating losses. Machinery and equipment for alarge integrated plant (estimated cost: $35 million) have never beeninstalled and made operational. The history of government investments intextile is replete with wasted resources and mismanagement.
20. There are four state owned sugar factories in operation which inthe past year experienced a 60 percent capacity utilization. A fifth plant(estimated cost: $50 million) has not been completed. There is a sixthuncompleted plant on which information is not available. The four operat-ing plants account for 50 percent of total sugar production in Sudan, therest being produced by a joint venture sugar mill with majority privatesector ownership, minority government equity participation, and privatesector management. Two of the state plants were established in the early1960s and are the subject of major rehabilitation efforts.
21. Of the seven food processing factories, five were constructed inthe early 1960s and two were confiscated from the private sector and neverreturned. The state factories were constructed in remote areas to accele-rate rural development; however, the factories were plagued by lack of rawmaterials, inadequate infrastructure, and poor technical design resultingin projects that have never produced economic returns and may not have beenviable to start with. The government is attempting to sell the two confis-cated companies but has so far not received any serious offers.
22. Of the four government tanneries, three are operational, althoughat less than 20 percent of capacity due to poor raw material purchasingcapability, shortage of fuel, lack of marketing skills, poor quality, andineffective management. The tanneries were built to process hides andskins which were and to a large extent still are being exported in rawform. While there are numerous small scale tanneries in the rural areas,these use only very elementary processing techniques on low grade rejecthides and defective skins. The state tanneries were constructed to producequality processed hides and skins but need about $15 million for rehabili-tation, spare parts, and working capital.
23. The two cement plants have a combined capacity of 300,000 tonsper year to meet an estimated demand of between 700,000 and 1,000,000 tonsper year. Capacity utilization has been less than 60 percent due mainly tolack of fuel and spare parts. One of the cement plants is expanding by anadditional 300,000 tons per year and the other is contemplating expansionby about 200,000 tons per year. The two cement companies were confiscatedfrom the private sector and are currently the only cement producers inSudan.
24. The two manufacturing SOEs in the miscellaneous classificationare a metal fabrication plant and a packaging factory, both relativelysmall operations compared to similar private sector firms.

- 25 -
Table II.5: SHARE OF MANUFACTURING SOEs WITHIN SUBSECTORS, 1982(percent)
Gross Value Gross Salaries NumberSubsector Added Output and Wages of Workers
Food Beverages Tobacco 5.0 4.9 19.6 17.7Textiles, WearingApparel and Leather 18.7 19.9 22.6 34.0
Others 17.9 12.9 22.0 24.9Total Manufacturing SOEs 10.3 9.1 25.0 26.3
25. Several measures based on 1982 data indicate that the industrialSOEs performed poorly in comparison with private sector enterprises. One,while the industrial SOEs had a 13.1 percent share of gross investment and26.3 percent share of employment in 1981, they had a disproportionate 10.3percent share of gross value added and 9.1 percent share of gross output inindustry. Two, value added per employee was Lsd 3,268 in the privatesector compared to Lsd 1,054 in the public sector; in addition, the ratioof value added to investment was higher for the private sector (0.55) thanfor the public sector (0.12). Three, net productivity ratio, defined asthe gross value added less salaries and wages divided by gross investment,was 0.10 for the private sector and zero for the public sector. Four, theabove measures when applied to the two subsectors with the heaviest concen-tration of SOEs (food, beverages, and tobacco; and textile, wearingapparel, and leather) yielded similar results.
26. An analysis of how the manufacturing SOEs performed over timeshows a deterioration of performance; although this might be explained bythe fact that in 1971, the year when comparable data were available, theparastatal sector included confiscated and nationalized firms. In 1971,the manufacturing SOEs actually had a higher value added per employee thanprivate sector firms and the net productivity ratio for both sectors wasalmost the same. For the public sector, the measures detail the deteriora-tion of performance from 1971 to 1982: value added per employee adjustedfor inflation fell by more than 75 percent, the ratio of value added toinvestment dropped by 50 percent, and the net productivity ratio declinedby 100 percent. Table II.6 summarizes the performance and productivitycomparisons of private and public sector enterprises in 1971 and 1982,including a comparison within the two subsectors with SOE concentration.

- 26 -
Table II.6: COMPARATIVE PERFORMANCE OF PUBLIC AND PRIVATE SECTOR FIRMSIN MANUFACTURING, 1971 AND 1982
Value Added Value Added Over Net ProductivityPer Employee Investment Ratio a/
Private Public Private Public Private Public
Food, Beveragesand Tobacco 3,700 900 0.41 0.20 0.32 0.01
Textile, Appareland Leather 1,160 580 0.15 0.10 (0.04) (0.05)
Total - 1982 3,268 1,054 0.55 0.12 0.10 0.00
Total - 1971 623 666 0.31 0.24 0.15 0.13
a/ Gross value added plus salaries and wages divided by gross investment.
E. Organization and Management
27. The nine factories built in the 1960s were placed under thecontrol of a government body formed in 1962 called "Government FactoriesCorporation" which was converted in 1965 into the Industrial DevelopmentCorporation (IDC) with the following objectives: (i) to coordinate govern-ment activities in the manufacturing sector; (ii) to distribute manufactur-ing activities throughout the country; (iii) to reduce migration from therural areas to the "Three Towns"; and (iv) to train people from rural areasin modern agricultural techniques and skilled factory work. IDC was set upas an autonomous corporate body with a high degree of flexibility andfreedom of action, and was given the mandate to complete the constructionof the unfinished factories, manage them, and recommend new ones. The IDCAct provided the IDC with operational autonomy and stressed that "the Boardshall at all times act on commercial principles and shall not be subject tothe direction of any other person, body, or authority". The Board ofDirectors was responsible for the general direction of the corporation; theManaging Director, appointed by the Council of Ministers, was the chiefexecutive. Public accountability was incorporated in the Act by requiringthe submission of annual reports on the financial position of the Corpora-tion to the Minister of Commerce, Industry, and Supply representing theCouncil of Ministers. Despite the seemingly sound principles on which theIDC was organized, it failed for several reasons. One, the Board ofDirectors was not able to fulfill its functions and delegated much of itspowers and functions to the Managing Director; most of the people appointedto the Board were too busy with other functions. Two, the ManagingDirector was ineffective, compounded by the incompetence of the factorymanagers as detailed in the "Report of the Central Committee for theEvaluation of Public Factories, 1970." Three, the government failed to

- 27 -
exercise its ownership role: performance shortfalls should have beenrectified. In effect, autonomy was not counterbalanced by accountabilityenforced through a system of rewards and punishment based on agreqd,standards of performance. Furthermore, the roles of the government, theBoard of Directors, and the Managing Director were not executed in themanner set out in the IDC Act.
28. The changes that occurred in 1970 enlarged the number of enter-prises under the control of the public sector from 9 to 47 and broughtabout a need for reorganization. To address the problems created by thenew size and character of the public sector, the Public Corporation Act of1971 was passed which established a body to make the major decisionsaffecting the operations of parastatals: the Supreme Authority for PublicSector Corporations composed of the Prime Minister, twelve other ministers,and the chairmen of the sector corporations. The Act also established twotiers of corporations, sectoral and branch. In manufacturing, the Indus-trial Production Corporation (IPC) was formed to replace the IDC with thefollowing main tasks: (i) execution of projects in accordance with thedevelopment plan; (ii) planning and supervision of the activities ofproduction units; and (iii) evaluation of new projects. Under the IPC,eight sub-corporations were organized to control the 47 industrial firmsunder the public sector. The Minister of Industry was made responsible tothe Supreme Authority for the policies of IPC which was charged with "thegeneral supervision, control, coordination and evaluation of the perform-ance of the Branch Corporation (i.e., Sub-corporation) attached to theSectoral Corporation (i.e., IPC), without interfering in the internalaffairs of such Branch Corporation." However, the IPC never succeeded inperforming its functions, and the autonomy and independence of the sub-corporations made IPC superfluous causing the last General Manager of IPCto recommend its dissolution.
29. The recognition that the new organizational structure was notworking resulted in new legislation in 1976 which: (i) removed allreference to sector and branch corporations consequently resulting in theliquidation of the IPC whose functions were transferred either to theMinister's office or to the branch corporations; (ii) replaced the SupremeAuthority with a Supreme Council chaired by the Minister of Finance andempowered to direct general policy, effect coordination among corporations,set limits to borrowing, and determine rate of profit to be paid to thegovernment. However, the Supreme Council has never been constitutedalthough the Minister of Finance, with the establishment of che Departmentof Public Corporations under the Ministry of Finance, is supposed to exer-cise control over the public corporations. In practice, the manufacturingSOEs act autonomously and have not been submitting reports to any govern-ment office regularly, unless there is a request for funds or governmentguarantee. Currently, there is a state of confusion as to the organi-zational structure of the SOEs and the roles of the different governmentagencies in SOE management.

- 28 -
30. There are three major issues relating to the organization of theSOE sector: (i) the legal structure of the SOE, (ii) the role of thedifferent ministries, and (iii) role of holding companies/corporations.
31. The legal structure of the SOEs take two basic forms: (i) corpo-rations registered either under the Public Sector Corporations Act, 1971(subsequently replaced by the Public Corporations Act, 1976) or under itsown legislation; (ii) companies registered under the Companies Act, 1925.Public corporations are endowed with greater autonomy and independence thantraditional government units due to their separate legal status. However,property owned by the public corporations is considered public and theemployees are considered public ;ervants and therefore covered by the civilservice regulations. Recent moves to convert the public corporations tocompanies are designed to provide more autonomy and flexibility to theSOEs. More concretely, SOEs which are companies can perform the following:(i) establish a pay scale and formulate personnel policies independent ofcivil service regulations; and (ii) absorb private sector equity. Giventhe commercial or profit-seeking nature of all the manufacturing SOEs, theconversion from corporations to companies is advantageous.
32. Typically, three ministries are involved in the operations ofSOEs: the Ministry of Finance, the Ministry of Civil Service, and theSector Ministry. The Ministry of Finance has a very active role, in theSOEs for two reasons: (i) it represents the government as owner of theSOEs and (ii) it approves budgets of corporations and invariably getsinvolved in the financing of operations of the SOEs by providing guaranteesor additional equity. The Civil Service Ministry is consulted in personnelmatters for corporations while the Sector Ministry generally providestechnical support and strategic direction to the SOE in his sector. Theconversion of the corporations into companies would make unnecessary theinvolvement of the Ministry of Civil Service. Ideally, the Ministry ofFinance should limit its involvement to that of owner while the SectorMinistry could provide the strategy and policy guidance through itsmembership and influence in the Board of Directors. However, thisdistinction of roles for the two ministries is workable only if the SOEsare financially autonomous.
33, The industrial SOEs have operated under different types ofholding corporatioa structures, having gone through different layers ofholding corporations which were subsequently abolished and later re-intro-duced. There are several reasons why holding corporations were introduced,among them the inability of a government unit to oversee numerous paras-tatals, the synergy effects of cooperation and coordination among paras-tatals in the same industry, and the augmenting of poor management inindividual parastatals. However, the establishment of holding corporationshas not resulted in greatex efficiency and may in fact be irrelevant atthis point. The solution lies in strengthening the management of theindividual parastatals; constituting a capable and responsible Board ofDirectors; clarifying the roles of the different ministries; separating theownership, strategic, and management functions; identifying clear objec-tives and measures of performance; providing autonomy to SOE management

- 29 -
tempered by clear accountability with agreed standards and system ofrewards and punishment; and establishing a timely and accurate informationsystem that would provide all parties involved with the SOEs with thesignals necessary to respond accordingly.
34. The shortage of skilled managers has exacerbated the organizationproblem. While management deficiency in parastatals has been a recognizedand long-standing constraint to efficiency, little has been done to correctthe problem. To attract competent managers, the SOEs should professiona-lize management instead of hiring political recommendees, improve salary,tructure, and provide a supportive environment the elements of which werediscussed in the previous paragraph.
F. Financial Performance
35. The financial results of operations of the manufacturing SOEsIndicate massive losses and negative cash flows. Data from the latestavailable financial statements of 25 out of 27 manufacturing SOEs that areoperational reveal an annual net loss of LSd 53 million on paid-up capitalof LSd 157 million. Only one out of the 25 SOEs had private sector equityparticipation amounting to less than LSd 0.5 million. In interpreting theconsolidated losses, three things must be considered. One, the losses,with the exception of two small SOEs in the food subsector, did not includeinterest on loans used to finance fixed assets since these obligations wereassumed by the government which put up the equivalent assets as paid-upcapital. The resulting enormous capitalization of the industrial SOEsunderstates the magnitude of the deficits, especially if foreign exchangelosses were taken into account. Two, some of the financial statementsreflected a 5 percent interest on capital as part of the costs. On acapital contribution of LSd 157 million, the 5 percent interest on govern-ment investment capital would be LSd 7.85 million. Three, some parastatalsenjoyed certain subsidies, examples of which are favorable exchange ratesand low prices of raw materials (cotton). While private sector enterprisespurchased foreign exchange in the free market at rates in 1985 reaching upto LSd 4.70 to $1.00, many SOEs were provided foreign exchange by statecommercial banks at the rate of LSd 3.30 to $1.00.
36. The manufacturing SOEs have been experiencing losses since theinception of operations. In 1968, net losses of the nine factoriestotalled LSd 1.3 million on an estimated government investment of LSd 15million. In 1974, net losses of 33 factories amounted to LSd 1.4 millionon an estimated LSd 40 million of gross fixed assets. The latest balancesheets of the 25 industrial SOEs show total accumulated losses of LSd 160million which have almost wiped out paid up capital.
37. The annual operating deficit on a zash flow basis of the 25 manu-facturing SOEs was estimated by deducting interest on capital from andadding depreciating charges to net profit. The resulting estimated annualcash flow amounted to negative LSd 38 million which is equivalent to aboutfour percent of average annual government revenues during the period1980-1984.

- 30 -
38. The bulk of the losses is contributed by the sugar SOEs whichsuffered an annual loss of LSd 36 million. Only three industrial SOEsexperienced positive, though minimal, profits: Krikab Sweets, GeziraTannery, and Blue Nile Packing. Table II.7 summarizes the financialperformance of the operating industrial parastatals.
Table II.7: SELECTED FINANCIAL DATA OF OPERATING MANUFACTURINGSOEs DURING LATEST YEAR FINANCIAL STATEMENTS ARE AVAILABLE
(LSd 000)
Net Depre- Paid-up NetSubsector Profit ciation Capital Worth
Sugar (40,837) 5,582 81,315 (46,615)Textile (7,643) 2,659 62,794 36,526Food Processing (1,954) 585 3,618 (6,332)Cement (1,155) 2,192 2,318 1,907Tanneries (892) 318 7,280 4,278Miscellaneous (311) 111 909 9Total (52,792) 11,451 158,234 (10,227)
Note: Figures in brackets represent negative values.
39. In addition to the poor performance of operating parastatals,there have been substantial investments in industrial SOEs that neverbecame operational. The estimated project costs of these idle assetsamount to LSd 338 million equivalent to about US$454 million based onexchange rate prevailing at the time of project construction (seeTable 11.8). The largest idle investments were made in a sugar plant(US$122 million), a textile factory (US$85 million), and a fertilizer plant(US$75 million).
Table II.8: INVESTMENTS IN NON-OPERATIONAL INDUSTRIAL SOEs
Amount of InvestmentEnterprises LSd'000 US$'000
Sudan-ren Fertilizer 187,000 75,000Khartoum North Spinning 10,700 26,750Port Sudan Spinning 14,000 35,000Gadaw Textile 34,000 85,000TonJ Textile 17,000 42,500Malakalk Tannery 828 2,070Melut Sugar 49,000 122,500Total 338,528 453,820
Note: LSd 0.40 to US$1.00 used for all except Sudan-renwhere LSd 2.50 to US$1.00 was used.

- 31 -
G. Domestic Credit Share of SOEs
40. As of end-1985, total domestic credit was about LSd 2.8 billionout of which LSd 1.4 billion, or about 50 percent, were extended to indus-trial and non-industrial SOEs. Excluded in the above figures were LSd 530million of SOE debt assumed by the government and placed in "frozen'accou.nts with the Bank of Sudan. More thani 90 percent of the SOB debt wasextended by the Bank of Sudan; in effect, commercial bank credit to SOEs isminimal, estimated to be only 5 percent df total portfolio. ManufacturingSOEs do not have outstanding obligations with the BOS.
41. The manufacturing SOEs had outstanding obligations to commercialbanks amounting to LSd 32 million, which is negligible. Debts to commer-cial banks account for about 45 percent of total liabilities of operatingindustrial SOEs excluding the sugar parastatals which have their ownfinancing arrangements with the BOS. However, manufacturing SOEs contri-bute indirectly to total parastatal credit by incurring obligations withother SOEs, primarily the Cotton Public Corporation and the NationalElectricity Company.
H. Reasons for Poor Performance
42. The reasons for the poor performance of the parastatals resultingin their decapitalization are varied and interrelated. The major factorsare the following:
(i) Non-viable Projects: Past investment decisions have not beenbased on comprehensive analysis of project proposals resulting infundamentally unviable projects. Factories were constructed thatwere not'technically feasible, lacked raw material sources, hadinadequate power supply, or were located in the uneconomicsites. Furthermore there was no evaluation of the competitive-ness of activities in terms of international prices.
(ii) Unclear Objectives: The inclusion of social objectives hasresulted in unprofitable and uneconomic projects. The effort todisperse industry and train people in the rural areas resulted inthe establishment of plants in remote areas which eventually madethe projects unviable. The weaving sheds are clear examples. Inaddition, the managers of SOEs rationalize poor financialperformance on the basis of social objectives such as employment.
(iii) Price Controls: Present price controls prevent the manufacturingSOEs from maximizing revenues. In the case of cement, pricesbeing paid by the consumer are double ex-factory prices. Thebeneficiaries of these rents will not be identified.
(iv) Management: This has been recognized as a major parastatalproblem.

- 32 -
(v) Unclear Institutional Relationship: The management problem ofthe manufacturing SOEs has been exacerbated by the unclear rela-tionships among different ministries and the parastatals, includ-ing the sector corporations that have been set up, dismantled,and re-introduced. The distinctions among the ownership, strate-gic, and operating functions have been blurred resulting indisorganization and lack of direction.
(vi) Poor Business Environment: Externalities have a significanteffect on manufacturing SOE performance. The regulatory environ-ment has reculted in enormous compliance costs on industrialenterprises, private and publi.c. Lack of access to foreignexchange, inadequate infrastructure support, inefficient utili-ties, and deficiency of supply of critical inputs have combinedto constrain operational efficiency.
I. Rationalization
43. The role of the public sector in manufacturing over the past twodecades has been following a meandering course characterized at certainpoints by sharp divergence from a chosen path. The short-lived experimentwith nationalization and confiscation of companies has been particularlydavaging, not only in terms of depreciated assets and opportunity costs butalso, and more important, due to the loss of investor confidence, local andforeign, and the migration of skilled labor and managers. With a newgovernment coming in, it is propitious to take stock of the situation ofthe manufacturing SOEs as a sector and define a direction consistent withclear objectives and available resources.
44. As a starting point, the historical performance of the manufac-turing SOEs should be analyzed against the objectives that formed therationale behind the active participation of the public sector inindustry. Three major objectives are discussed below.
45. First, state factories were built to establish industries ineconomic activities where the private sector was unwilling or unable toinvest. The construction of the sugar factories may have necessitatedpublic sector participation and initiative due to the size of the projectwhose capital requirements could not be absorbed by the private sector atthat time. However, most of the other factories were constructed insubsectors where the private sector was already dominant. In severalcases, the government went into projects which the private sector wasunwilling to go Into not because of lack of availability of capital, butbecause of non-viability, as in the cases of the food processing plants,the cardboard factory, the weaving sheds, and the fertilizer plant. If thecriteria for state participation were (i) lack of capability of the privatesector to invest and (ii) viable projects, only the sugar projects, andquite possibly the tanneries, would have been considered, although theirfeasibility would have to go through a rigid analysis to determinefinancial and economic viability.

- 33 -
46. Second, the manufacturing SOEs were intended to provide adequatefinancial returns on investment. The financial objectives of the manufac-turing SOEs were never quantified, except for the requirement of a 5 per-cent return on capital. By any financial measure, the manufacturing SOEsector has not achieved the financial objectives. Despite the enormouscapitalization of the SOEs (due to the government absorbing the loans usedto finance the purchase and installation of the assets and putting in theassets into the SOE as its equity contribution), their consolidated networth is almost zero. All subsectors have accumulated net losses, andbased on the latest year where data are available, the SOEs are incurringlosses to the extent of LSd 52 million per year and an estimated negativecash flow of LSd 38 million per year.
47. Third, the manufacturing SOEs had social objectives, among whichare the geographical dispersal of industry, the reduction of migration fromrural areas to the Three Towns, and the training of people in the ruralareas. These social objectives led to the establishment of factories inremote areas; however, in the pursuit of the social objectives, the viabil-lty of the SOEs was compromised. The food processing factories and theweaving sheds have never operated at anywhere close to break-even capacity,resulting in operating losses. The social objectives could not be attainedwithout a viable and profitable operation.
48. The twenty-five year experience with manufacturing SOEs has beena failure in most respects resulting in an enormous waste of resources.The experiments with different degrees of state involvement in industrialactivities Indicate that: (i) the public sector does not have the lnstitu-tional capability to evaluate, plan, implement, and manage industrialprojects; (ii) the private sector would have to play the key role in manu-facturing growth given the resource constraints, both financial and manage-rial, in the public sector; and (iii) social objectives cannot be served byInefficient and non-viable enterprises. The determination of the futurerole of government in industrial development will have to be made In thecontext of the historical experience with, and evolution of, the parastatalsector.
49. Rationalization of the industrial SOEs needs a clear definitionof the objectives behind government participation in industrial activi-ties. The original objective seems to be reasonable: to invest In strate-gic economic activities that have long term viability but no potentialprivate sector participation. The implication on industrial policy is anorientation towards private sector domination of industrial activities withlimited public sector participation. Specifically, policy Implicationsare: (i) the liquidation of non-viable industrial SORs and (ii) theprivatization of manufacturing SOEs with interested private sector buyers.
50. Only with clear objectives and policies can a coherent rationali-zation program be formulated and implemented. Assuming the objective andpolicy orientation mentioned in the preceding paragraph, the key elementsof a rationalization program are:
(1) the analysis of the long-term economic and financial viability ofeach manufacturing SOE;

- 34 -
(ii) the immediate liquidation of enterprises or operations withinenterprises that are determined to be non-viable;
(iii) the divestiture of manufacturing SOEs that have interestedprivate sector buyers;
(iv) the improvement in operations of manufacturing SOEs that theprivate sector has no interest in; and
(v) screening of government investment; for an industrial SOE, thecriteria for government financial contribution should be strictlycommercial, i.e., guided by the financial and economic rates ofreturn.
51. The rationalization program will have to be accompanied by thefollowing reform:
(i) The manufacturing SOEs should operate on the basis of commercialguidelines. There are several implications of this reform:(a) the SOE should be given more autonomy; (b) the legal organi-zation should be transformed to companies under the CompaniesAct, 1925 to allow flexibility especially in personnel matters;(c) the Board of Directors should be constituted and strengthenedto determine policies; and (d) the SOE should have control of itsfinancial affairs without need for government subsidies orsupport such as non-payment of arrears to other publicenterprises.
(ii) The manufacturing SOEs should be subject to the discipline of themarket and shall not receive special concessions in, inter alia,allocation and pricing of foreign exchange, credit, raw mate-rials, and government contracts. In addition, if SOEs arerequired to carry out social and political functions, the econo-mic costs must be recognized and compensated for. If, forinstance, an SOE is subject to a controlled price set below itsmarket level, the price differential must be covered by somegovernment agency. This costing procedure would allow SOEs todischarge its non-economic functions and follow the marketdiscipline. Furthermore, the government would have to weigh thecosts of social functions against their benefits.
(iii) The institutional capability of the government to evaluateinvestments and monitor the performance of parastatals should bestrengthened. A small unit in the Ministry of Finance could beestablished that will perform the above functions. The relation-ship between the monitoring unit and the SOE should be made clearin order that the different functions of owners (the Ministry ofFinance) and managers (the Board of Directors and the OperatingManagers) are not blurred. The sector minister can influence SOE

- 35 -
strategies and policies through the Board of Directors. Criticalto the process of monitoring and the success of the principle ofautonomy is the agreement on quantified performance targets forwhich the SOE managers would be accountable to the government.
(iv) The management of the manufacturing SOEs would have to be streng-thened. In order to do this the SOEs should be able to offercompetitive salaries and incentives preferably linked with theenterprises' performance. Other alternatives that should beconsidered are management contracts and leasing of assets.
(v) Studies should be made on whether and how to restructure specificenterprises. This will encompass all aspects of the enterpriseincluding financial, technical, human resources, informationsystem, etc.
52. In addition, the overall economic policies must be reformed tocreate a favorable business environment.

en~~~c I
- H'~t-
~.A
rz C )~~~~~~~~~~~~~~~~~~~~~~~~~~~~~~~~~11(N

- 37 -
ANNEX III
LABOR MARKETS IN SUDAN
A. Introduction
1. This Annex discusses the labor market in Sudan to put Intoperspective the labor problem being faced by the industrial sector.
B. The Labor Force and its Development
2. Sudan is a country which has experienced rather high populationgrowth in recent years. As Table III.1 shows, this was not always the caseas population only increased at a fairly modest 1.8 percent per yearbetween 1955 and 1973. The main reason for this jump in the populationgrowth rate to its present 3.8 percent is the sharp fall in the mortalityrate over the same period as reflected for example in a rise in averagelife expectancy from 39 years in 1960 to over 46 years in 1981. Anotherreason is that in recent years the famine in wide geographical areas ofnorthern and eastern Africa has led to substantial numbers of refugeesentering Sudan. In 1983 these numbered around 650,000 which is substan-tially greater than the figure reported for Sudanese working abroad of334,000 at about the same time. Refugee inflow has continued since 1983and the total number of refugees had risen to 1,134,000 by March 1986. Thecrude birth rate has if anything risen slightly over the same period ashealth facilities have improved with almost no adoption of contraceptivetechniques.
Table 111.1: URBAN/RURAL COMPOSITION OF POPULATION (millions)
Average annual Average annual% growth rate % growth rate
1955 1973 1983 1973/55 1983/73
Urbau 0.82 2.61 4.15 6.64 4.77
Rural- Settled 9.21 14.22 4.44
9.44 1.10- Nomadic 2.30 2.19 -0.5
Total 10.26 14.11 20.56 1.79 3.84
Sources: El Tahir and Abu-El Yamen (1984).Demographic Features of the Labour Force and Manpower Planning inthe Sadan. National Conference on Training and ManpowerPlannipng, Khartoum, 1983.

- 38 -
3. One can also see from Table III.1 that urban population growthwas much higher in the 1955/73 period. The much lower figure for thepopulation growth rate in rural areas would Indicate that rural-urbanmigration must have been very substantial although the much more similarurban and rural population growth rates for 1973/83 would suggest that thishas slowed down in recent years. Unfortunately the relevant informationhas not as yet been processed from the 1983 Census. The other very signi-ficant fact that one can draw from Table 111.1 is that over 10 percent ofthe total population of Sudan are nomads. Many of these are pastoralistswho move from one grazing area to another although some will at timessupply their labor to the irrigated agricultural schemes. It would'seemthat the proportion of nomads is in decline, although not too much shouldbe inferred from the 1983 census figure in this respect as 1983 was asevere drought year in which poorer pastoralists would have found itdifficult to live off their few cattle and have been induced to seek workelsewhere.
4. Turning now from population to labor force, we can see fromTable 111.2 that the overall participation rate has changed very littlebetween 1955 and 1983. The participation rate among males has declined butthis can be explained by the growth of secondary education over theperiod. Similarly, the disparity between male participation rates in ruraland urban areas is due to differential access to secondary schooling. Thiscannot provide a full explanation, however, for the very striking differ-ence between the urban and rural female participation rates: 0.11 in thetowns as opposed to 0.25 in the countryside. Although Sudan is an Islamiccountry, the female participation rate is not particularly low by lessdeveloped couutry standards--in Saudia Arabia, for example, the figure isaround 5 percent. One explanation that does then arise is that insofar asIslamic tradition presents obstacles to female participation, these aremuch more likely to apply to employment activities outside the household.One apparent exception to this is the use of migrant household (includingfemale) labor on commercial farms and the large irrigated schemes, althoughone could argue that this is not really participation outside the householdas wives, etc., are working alongside other family members. The hypothesisis therefore, that the female participation rate in each sector will behigher the more likely are households to engage in conventionally definedproduction activities within their own premises or family unit and willalso tend to rise over time insofar as social obstacles to non-hduseholdfemale employment are removed. Rural-urban migration would then have hadthe effect of lowering the overall female participation rate as intra-household production is less widespread in urban areas, but this effect mayhave been offset by (say) increased employment opportunities for women ingovernment employment.
5. It is not possible given the existing data base to provide anaccurate breakdown of labor force deployment in Sudan. In urban areas,wage employment is overwhelmingly dominated by the public sector. In1983-84 central and regional government respectively accounted for 108,000and 227,000 posts, the great majority of which would have been urban.Public corporations and companies provided around 200,000 jobs thus puttingtotal public sector employment at around 535,000. We further estimate that

- 39 -
Table III.2: LABOR FORCE (MILLIONS) AND PARTICIPATION RATES
Annual Average Participation Rates1955 1983 % Growth Rate 1955 11983
Labor Force (Total) 3.50 6.65 2.32 0.34 0.32
- Male 2.75 5.16 2.27 0.54 0.50- Female 0.75 1.50 2.51 0.15 0.15
Labor Force (Urban) 1.28 0.31
- Male 1.06 0.48- Female 0.22 0.11
Labor Force (Rural) 5.37 0.33
- Male 4.30 0.52- Female 1.07 0.25
Notes: Participation rate is labor force as a proportion of population.To obtain labor force as an approximate proportion of those aged16-64 years then divide by 0.53.
Sources: El Tahir and El Yamen (op. cit) and data supplied by Departmentof Statistics, Khartoum.
there are 100,000 employees in private sector establishments employing tenor more workers thus giving us an estimate of total modern sector employ-ment in Sudan of 635,000. Of these we estimate that no more than 530,000are in urban areas.
6. If urban labor force is 1.28 million and we assume that themodern sector is entirely located in towns, then this implies that theinformal sector and the unemployed account for some 750,000 urban workers.Contrary to earlier studies it now seems that open unemployment is quitesizeable in urban areas at least. As Table III.3 shows, the most recentsurvey gives an overall urban open unemployment rate of 10.6 percent for1979-80. Applying this proportion to our figure of 1.28 million wetherefore get 136,000 as our estimate for the number of openly unemployedin urban areas. The remaining major employer of urban workers is theInformal sector. Very little research has been done on this very importantpart of the Sudanese economy although the ILO employment mission 1/estimated that the informal sector accounted for about 25 percent of total
1/ ILO. Growth. Employment and EquitY. Geneva, 1976.

- 40 -
employment in Khartoum in 1974. If applied to urban Sudan as a whole thiswould give 320,000 informal sector workers in 1983. We are still left witha discrepancy of some 300,000 urban workers. In part this is made up ofmiscellaneous groups missing from any of the above categories such as houseservants, but the most likely explanation is that the size of the informalsector is underestimated both because the relative size of the informalsector is likely to be greater in urban areas other than in large citiessuch as Khartoum and Port Sudan and also because casual observation seemsto suggest that informal activities have grown quite rapidly since themid-1970's. The size of the discrepancy might also indicate that ourestimate of urban labor force is upward biased.
7. Wage employment in rural areas occurs in two main sectors: inthe large state owned and managed irrigation schemes towards the north ofthe country and in the large mechanized farms in the rain-fed easternregions. Labor is supplied to these sectors from several differentsources: local small scale farmers who supplement their incomes fromagriculture by seasonal wage employment, local landless laborers who maywork both in agricultural and non-agricultural activities, temporarymigrants who may be drawn from both of these categories, and nomads asdescribed above. The most striking feature of the rural labor market inSudan is the sheer scale of seasonal labor migration. In a given year asmany as one million workers may travel large distances from the westernregions of the country and return again at the end of the season. In a badagricultural year seasonal migration may also occur into urban areas. Thepredominant form of labor deployment is, however, self-employment inagriculture. The Rural Labour Study in Northern Sudan (RLS) (op. cit.)found that 75 percent of resident workers were employed either on thefamily farm or as family herdsmen while non-agricultural self employmentactivities accounted for the bulk of the remainder. A rough and readybreakdown of the 5.37 million rural labor force might then be given as4 million traditional sector self employed with the the rest being made upof a variable mixture of migrant workers, nomadic pastoralists andunemployed.
C. Some Stylised Facts and Hypotheses
8. The Sudanese labor market is one characterized by considerablemobility with little intervention in the workings of the private labormarket. There are in particular two main examples of this mobility, theextraordinary size of annual unskilled labor movements both within ruralareas and rural to urban, and the movement of skilled Sudanese workers tojobs abroad. Our four main stylised facts regarding Sudanese labor marketsare:
(a) A high degree of mobility among unskilled labor between ruraland urban areas. This leads to the hypothesis that unskilledwage rates in the urban private sector are determined by thesupply price of migrants.

- 41 -
(b) A high degree of mobility among skilled Sudanese workers to jobsabroad. One explanation of the apparent shortages of theseworkers is that domestic supply prices are determined withreference to wages overseas and that domestic wages have failedto rise accordingly.
(c) That public sector wages have fallen substantially behind thoseof comparable workers in the private sector.
(d) There is a growing surplus among university graduates withgeneral academic as opposed to vocationally based qualifica-tions. This reflects stagnating civil service employment, thecurrently depressed state of the economy and a lack of demandabroad for graduates of this type.
Our general view is one therefore, of a competitive private sector labormarket existing side by side with a distorted system of public sector wagesand a growing surplus of university graduates. This picture is notnecessarily at odds with the unemployment figures presented in Table III.3provided that one restricts the discussion to males only. Here one canplausibly argue that the male unemployment rate could be accounted for bythe surplus of graduates and clerically oriented secondary school leaversand by the existence of frictional unemployment among unskilled andmanually skilled workers. Unfortunately the only further breakdown ofthese figures is by age although this shows unemployment to be heavilyconcentrated among the late teens to early twenties age groups. This iscertainly consistent with the above arguments as younger workers are morelikely to experience unemployment than older workers. The open unemploy-ment rates among females are much higher and would suggest that the modernsector job market is very restricted for women and that unlike many otherless developed countries, there are serious obstacles to informal sectorparticipation. It should also be noted that the 31 percent unemploymentrate observed among urban female workers is derived from a rather smallsample and is therefore a rather reliable estimate.
Table III.3: UNEMPLOYMENT RATE 1979/80(Percent)
Urban Rural Total
Males 6.1 4.2 4.7
Females 31.6 11.0 15.4
Total 10.6 5.7 6.9
Sources: Sudan. Ministry of Finance andEconomic Planning. HouseholdIncome and Expedition Survey.1978-80.

- 42 -
D. International Migration
Sudanese Nationals Working Abroad
9. A major feature of the Sudanese economy is the large number ofits citizens who are working abroad at any moment in time. Estimates ofthe exact size of this overseas labor force vary: Choucri (1985) 2/estimated that there were 334,000 Sudanese nationals working abroad (SNWA)in 1983 while official governmental sources in Khartoum estimated thenumber to be 457,000. At first glance these figures may not seem to beespecially large - between 5 and 8 percent of the total labor force,however, the essential point is that SNWA are drawn very disproportionatelyfrom the mere skilled sections of the urban population. Choucri's resultsindicated that only 12 percent of SNWA were employed in agriculture priorto migration which contrasts sharply with our earlier observation that themajority of the domestic labor force are to be found in agriculture. Thisclearly illustrates the urban bias in the origins of SNWA. Even morestriking is the relatively high proportion of Sudanese skilled workers whowork abroad. It was estimated in the Six Year Plan that there would be47,800 skilled workers in Sudan in 1983 while Choucri also estimate thatthere was at least 68,000 skilled SNWA in the same year. This suggeststhen that 60 percent or above of the total national stock of skilledworkers are abroad. A weaker case can be made for other skill groups:40 percent of professionals, 30 percent of technicians and 31 percent ofclerks were also abroad at the same time.
10. The central effect then of Job opportunities abroad is that theyopen up the labor market to trade in skilled labor. The shortages ofskilled manual labor reported by private sector employees are undoubtedlydue mainly to this effect. There are in addition a substantial number ofunskilled SNWA but they are proportionately small relative to the totalstock of unskilled Sudanese.
11. By far the largest recipient of SNWA is Saudi Arabia whichaccounts for 80 percent of the total. The other three recipients are indeclining order of importance: United Arab Emirates, Kuwait and Yemen.Although the surveys reported by Choucri found little evidence of occupa-tional shifts associated with migration, it did seem that migrants weremore likely to enter private sector employment abroad as compared withSudan, while they were also more likely to be employed in the servicessector abroad. The proportion of SNWA accounted for by services is never-theless very similar to that in domestic formal sector employment as awhole, i.e., 34 percent and 31 percent respectively.
12. The critical issue is whether or not the Sudan economy gains fromthis substantial overseas migration. If one adopts a nationalisticapproach in which one considers the welfare of Sudanese nationals as awhole then the answer is almost certainly in the affirmative, as one wouldinclude the whole of the very substantial income increase enjoyed by
2/ Choudri. A Study of Sudanese Nationals Working Abroad, Volumes Iand II. MIT, 1985.

- 43 -
migrants themselves abroad as a benefit. If, on the other hand, one onlyincludes the costs and benefits to the domestic economy, thus excluding thebenefits to migrants during their period of absence, then a slightlydifferent picture emerges.
13. If one assumes that workers are paid according to their marginalsocial products in Sudan, then the costs of migration are the loss indomestic output accruing to the remaining domestic factors of production.For a marginal change such as the migration of a single worker, this isnegligible; but for non-marginal changes such as the displacement abroad ofover one half of the domestic stock of skilled workers this effect may bequite substantial. Against this must be set the benefit of remittances andany future improved productivity of returning migrants arising from theirstay abroad.
14. It appears that the Sudanese do remit a large part of theiroverseas earnings back to Sudan. Choucri found, for example, that skilledworkers abroad in 1983 earned an average of $19,300 per year of which$11,307 was on average remitted back to Sudan. This may be compared withthe ILO estimate in 1982 that skilled workers in Sudan earned an averageof LSd 1448 in the public sector and LSd 1848 in the private sector whichusing a shadow exchange rate of US$2.00 per LSd 1.00 gives $2896 and $3696respectively. Thus, even if on average the net production loss per migrantworker was equal to that worker's marginal product in the absence of anymigration abroad, then the benefit/cost ratio would be of the order of 3:1or even greater. It might be argued that our estimate of the domestic wageis an underestimate as migrants are amongst the more experienced workerswith an average of 12 years experience prior to migration. However, it isalso true that the ILO survey Included a few respondents who were alreadyworking abroad and thus biased upwards their estimate of the domestic wage.
15. The remaining benefit is more difficult to assess. It seems thatSudanese do not, in general, return to their original occupations upontheir return to Sudan. Choucri's study showed that only 35 percent ofthose employed abroad expected no shift in sector of employment. There wasa strong preference in favor of the agricultural sector and a generalimpression that migrants intended to invest their earnings in housing, landand private business purchase on their return to Sudan. This does notmean, however, that there is a loss in migrants' productivity as a resultof their overseas experience. On the contrary, this could equally meanthat valuable entrepreneurial skills had been acquired.
16. It is very likely therefore that a rigorous cost-benefit analysiswould not suggest that overseas migration be curbed. It is in any caseextremely doubtful whether the Sudanese authorities would be able toenforce such a policy as the majority of emigrants are unofficial and canalways enter Saudi Arabia under the pretence of being Moslem pilgrims.
17. One important feature of overseas remittances into Sudan is thatonly around 10 percent of the total ever find its way into the officialrecords. Choucri estimated that total remittances (including those inkind) were of the order of $3.06 billion in 1983 which would suggest a

- 44 -
corresponding estimate of around $4 billion for 1985-86. The implicationsof this are that Sudan could, for the time being at least, effectivelysolve its very serious financial problems if only migrants could be inducedto remit through official channels. Lack of confidence in the futurestability of the general economic and political situation is one veryimportant factor explaining the avoidance of official channels, but thesituation would certainly be helped by a successful counter-inflationarypolicy and a more flexible exchange rate.
Refugees
18. The number of refugees in Sudan has grown rapidly in recentyears. Current estimates (February 1986) vary between 1.16 million and 1.5million while an earlier estimate for 1983 put their number at 690,000.There have been successive waves of refugees into Sudan since 1965,originating from both political conflicts such as the conflicts in Eritreaand Uganda, and from the widespread drought over neighboring regions. Mostof them are Eritreans who, according to the UNHCR figures, constitute themajority of the 786,000 refugees from Ethiopia while the other three donorcountries: Chad, Uganda and Zaire account for 123,000, 250,000 and 5,000respectively. Nearly all of the refugees are currently in Eastern andCentral Sudan.
19. Government policy has been to try and accommodate this populationinflux in organized settlements. The latter are of two types: wage earn-ing settlements in which the inhabitants are located near to urban labormarkets or irrigated schemes, and land settlements in which refugees ofrural origin are given 5 to 10 feddans per family in the semi-arid rainfedareas. In spite of these efforts, the great majority of refugees havechosen to settle directly in the urban areas where some have taken upcasual employment mostly in services and the informal sector. The evidenceas presented in the joint volume as produced by the ILO and UNHCR 3/ indi-cates that the agricultural schemes have so far been unsuccessful in thatthe wage settlements are characterized by severe seasonal underemployment,while output is too low on the land settlements to permit self suffi-ciency. Urban immigrants have on average a higher income per capita thanthose in rural areas, but their integration into the domestic labor marketis understandably limited.
20. To what extent do refugees constitute a potentially useful addi-tional source of domestic labor supply? The age distribution as obtainedfrom the ILOI UNHCR survey showed that only 8% of all refugees were aged 45years or more, while 51 percent were in the prime working age group of 15to 44 years. As 54 percent of the total sample were males it follows thatone could expect an overall participation rate of 30 percent or higher. Ofthose who were economically active prior to migration, 7% possessed skillsof a manual or clerical nature and around 60 percent of these had foundemployment in a similar occupation at the time of the survey. As the ILO
3/ ILO/UNHCR Towards Self-Reliance: A Programme of Action for Refugees inEastern and Central Sudan, ILO, Geneva, 1984.

- 45 -
report points out, there are obvious language difficulties acting as abarrier to domestic participation while many manually skilled refugeescomplained of a lack of the necessary tools. The barriers to labor marketentry are highlighted by the fact that significant unemployment existedamong groups that are known to be in a situation of relative scarcity inthe domestic labor market. This reflected among other things restrictionson geographic mobility imposed upon refugees by the authorities.
E. Urban Labor Market
EmploMent
21. The most striking feature of formal sector employment in theSudan is that it is very heavily dominated by the public sector. As wehave noted earlier, employment in local and central government stood at335,000 in 1983-84. In 1985-86, total central and regional governmentemployment stood at 285,000 but it is unlikely that this represents adecline as this latter figure excludes the Southern region of the country.There is also an additional 14,400 uniformed grade employees, e.g., thepolice and fireman, who are not included in these figures. The employmentdata regarding the rest of the public sector are much more shaky, as thelast survey was conducted back in 1976-77 and failed to take account oftemporary or casual workers. A World Bank Study showed that total employ-ment of sixteen identifiable public corporations in 1983-84 was 117,561.This figure excludes a number of other corporations and companies. TheUNIDO survey of manufacturing industries in 1981-82 found 27,500 employeesall of whom were apparently not included in the World Bank estimate.Allowing further for the remaining omissions in the public sector such asfinancial institutions and other public companies suggests that totalnon-civil service public sector employment in Sudan probably now lies inthe 175,000 to 200,000 range. The survey of private sector establishmentsof 1979-80 found 75,000 private sector employees in establishments employ-ing ten or more workers of which 56,000 were employed in manufacturing.The UNIDO survey found 79,000 private sector manufacturing employees in1981-82 In establishments with twenty five or more workers and a further39,000 in manufacturing establishments with less than twenty five workers.Obviously this last statistic includes many informal sector employees butas it is known that there were a number of factory starts at the turn ofthe 1980s, it would seem safe to assume that our estimate of privatesector employment in establishments employing more than ten workers couldbe raised into the 100,000 to 110,000 range. This then gives an estimatefor total modern sector employment of 620,000 to 650,000 of which theprivate sector accounts for between 15.6 percent to 17.8 percent. The1976-77 survey found that 16 percent of all public sector staff worked inagriculture. Adjusting for this and further assuming that 40,000 out of57,000 school teachers are rural based gives an estimate of 530,000 urbanformal sector workers as an upper limit.
22. The obvious difference between the public and private sectors interms of the distribution of employment by production activity is that
- 46 -
public sector employment is heavily concentrated in services and transportwhile private sector employment is largely concentrated in manufacturing.The distributions from various Ministry of Labour surveys are shown inTable 4. Public sector employment is absolutely greater than that of theprivate sector in all major activities except manufacturing and possiblytrade.
23. Little is known about the quantitative dimensions of the urbaninformal sector in Sudan other than the fact that it appears to be quitelarge. The only serious attempt to measure the size of informal sectoremployment was made by the ILO mission in 1974. This study was restrictedto the Khartoum area and concluded that the informal sector accounted forabout 25 percent of urban employment at that time. The main impressionthat emerges from this study is that informal sector employment is actuallyvery heterogeneous in nature ranging from lucrative small scale businessesto highly casual street selling activities which are usually very temporaryin nature.
24. It is arguable that the critical distinction to be made in Sudanis between public and private sector employment rather than between theformal and informal sectors. The essential point about the public sectoris that wage scales are determined directly or indirectly by acts ofgovernment policy, although even here there is a grey area regarding publiccompanies set up under the 1925 Act. In the private sector the wage set-ting process is largely determined by market forces, although equilibriumwages may not be independent of, for example, public sector employmentlevels. Normally the rational for a formal/informal distinction in labormarket terms is that the formal sector may set a wage above market clearinglevels either because of institutional pressures such as those imposed bygovernment or trade unions, or because efficiency wage considerations domi-nate in the sense that firms have an incentive to maintain high wages so asto reduce turnover amongst experienced staff or to maintain a sufficientlyhigh quality level among job applicants. Under this view, one wouldobserve workers queuing for formal job openings with little movement fromthe formal to informal sectors. In Sudan this model does not seem to standup to casual observation. Private large scale employers complain abouthigh turnover rates, not only to jobs abroad but also to small scale activ-ities and even blame the government for encouraging the latter. In thepublic sector where wage rates are generally believed to be lower than inthe large scale private sector, turnover rates among unskilled workers arealso high and part-time work in informal sector activities is believed tobe common.
25. The dualistic labor market model does not then seem to becurrently applicable in Sudan. The ILO (1976)4/ study argued that theinformal sector broke into three categories: a high level virtuallyindistinguishable from the formal sector except in terms of establishmentsize, a middle level in which participants earned incomes comparable to the
4/ ILO (1976) op. cit.

- 47 -
formal sector and a low level consisting of hawkers and petty traders inwhich search for formal sector work seemed common. It is only this lastcategory that appears to fit the traditional formal sector image, but theILO team found it to account for only 15 percent of total informal sectoremployment. This group may also move into other patts of the informalsector. Excluding this last category, the informa' sector consists of awide range of activities in which individual incomes differ according totheir skills and capital assets. There is no evilence that labor incomesin the higher and middle strata of the informal sector are any lower thanthose of comparable workers in other sectors. The lowest part of the
Table III.4: MODERN SECTOR EMPLOYMENT(Percent)
Public Sector Private Sector1976/77 1975/76 1979/80
Agriculture 16.24
Mining 1.19
Manufacturing 4.12 74.72 74.50
Water, Gas & Electricity 7.80 - 0.37
Construction 7.30 1.92 4.45
Trade 1.95 9.90 9.92
Transport 22.69 11.16 8.16
Financial Services 3.68 0.96 1.54
Other Services 35.03 1.35 1.05
TOTAL 100 100 100
No. Employed 278,669 51,189 75,077
Sources: Democratic Republic of Sudan Labor Department
1. Survey of the labor force in private sector establishments,1975/76.
2. Labor force, wages and working hours for private sectorestablishments in 1979/80.
3. Survey of labor force in private sector establishmentsemploying 10 or more persons in 1975/76.

- 48 -
Table III.5: REAL UNSKILLED WAGES (1975-82) IN SUDANESE POUNDSPER MONTH AT 1980 PRICE
1975 1980 1982
Small (< 100 workers)
Cotton cord land wax 65 35 22Perfumery - 40 28Cloth factors - 28 18Cosmetics - 45 28Soap factory 39 35 22
Medium (100 - 300)
Packing house 39 32 25Paints works 39 40 25Shoe factory 39 35 22Oil mill - 45 38
Big (300 - 1000)
Biscuit Factory 39 28 25Shoe Factory 39 28 25
Large (> 1000)
Textiles 39 28 18Civil Service 39 28 18
Source: Ghosb (1984). The Urban Sector, Part III of ILO/UNHCR. Labormarkets in Sudan, Geneva, page 161. The data or nominal wages aredeflated by the CPI as calculated for low income groups.
informal sector was very small in 1974 and might at that time have beenessentially a reflection of a purely frictional process in the urbai,labormarket. Since then the influx of migrants £rom the rural areas and'"elsewhere have probably led to an expansion in casual street activities.
Wages
26. The data.collected by the ILO team from the Sudanese WorkersTrade Union Federation are reproduced in Table III.5 after deflating by theconsumer price index. In every firm the real wage of unskilled workers hasfallen by at least 30 percent between 1975 and 1982, although the timingand extent of the decline is uneven across the sample. The 200 percentdecline observed in cotton cord and wax may well be a mirage given theabnormally high wage reported for 1975.

- 49 -
27. It is interesting here to compare the behavior of private wagerates with those of the civil service. Although in 1975 and to a lesserextent in 1980 , the civil service unskilled wage rate was similar to thosein the private sector, it had fallen well behind most of the rest by 1982.As from July 1986, the wage rangz for an unskilled worker in the civilservice including allowance will be 60 to 75 Sudanese pounds per month.This would be LSd 10.5 to LSd 13 per month in 1980 prices. Two firmsvisited in the Khartoum area early in March 1986, one a shoe manufacturerand the other the same textiles manufacturer as quoted in Table 8.5, quotedLSd 100, and LSd 100 to LSd 160 a month, respectively, as the earnings ofan unskilled worker. Taking LSd 100 to LSd 120 as representative figureswould give us an unskilled earning differential of around 70 percentbetween the civil service and private sector at the present time.
28. The other major movement in wages over time is reflected in asecular compression of skill or seniority differentials within the publicsector. The World Bank study investigated this very thoroughly and theirfigures show that the ratio to the earnings of an unskilled worker, adeputy under secretary, a university graduate and a secondary schoolgraduate declined from 13.1:1, 3.87:1 and 2.15:1 respectively, in June1972, to 9.26:1, 2.60:1 and 1.61:1 respectively by November 1983. Thecompression has partly continued since then, as the same ratios as calcu-lated from the salary scales of July 1986 are 8:73:1, 2.53:1 and 1.67:1.The real value of highly skilled or senior civil servants has thus declinedsharply over the past ten years. For example, in July 1986, a deputyundersecretary's salary will be worth about 8 percent of its real value inJune 1975.
29. The salary scales in public corporation although subject togovernment control are not the same as in the civil service. Public corpo-rations which fall under the 1976 Public Corporations Act have a common setof salary scales that are determined by the government. Public corpora-tions not covered by the act such as Sudan Railways and the NationalElectricity Corporation determine their individual scales in consultationwith the government. In practice salary scales in these Corporations seemto closely follow those elsewhere in the public sector. Public companiesas covered by the 1925 Act have more freedom in setting salary scales andcan be presumably treated as private sectorlfor this purpose. Althoughconstrained by government scales the public corporations do seem to payabout 5 percent more for comparable grades. The main exception to this isthe pay of university graduates who earn 80% more on entry but only16 percent more by the time they have reached the top of the SeniorExecutive Officer scale or its equivalent. Fringe benefits are alsosubstantially greater in the public corporations although generally lessthan in the private sector.
30. As public sector pay has fallen substantially below that of theprivate sector, one would expect to observe two effects. The first is thatthe morale and work effort would decline, while the second is that volun-tary turnover among public sector employees would increase. Morale andwork effort are obviously difficult to observe although there are manycasual reports of increased moonlighting among public sector employees.

- 50 -
There are unfortunately no time series data on voluntary turnover to seewhether quits have increased over time. Among the classified grades, i.e.employees other than semiskilled and unskilled workers there were 5612vacant posts in Central government and 5580 in local government (excludingthe Southern Regions) as of September 1985. This implies a vacancy tototal classified parts ratlo of 8.6 percent which, assuming that it takesthree months on average to fill a vacancy and that there is no growthanywhere in the system would give an annual turnover rate of over 34 per-cent among classified government employees as a whole. This figure islikely to be on the high side as expansion did occur among school teachersand health workers while it is possible that some vacancies were unfilledas a matter of deliberate policy. Nevertheless this calculation wouldsuggest that turnover is substantial out of government employment. Theonly other available estimates indicates that between i976-77 and 1977-78,11.5 percent of the total central government professional and administra-tive staff and 8.1 percent % of total permanent staff left without notice.Slightly lower estimates were obtained for the period 1979-80 to 1980-81.These figures are clearly lower limits of actual voluntary turnover,
31. The policy implication here is clearly that recent trends in realpublic sector pay need to be reversed so as to re-establish parity with theprivate sector. As there is known to be widespread overstaffing in thecivil service the budgetary implications of this could be minimized bysimultaneously allowing employment levels to drop by a process of naturalwastage.
F. Institutional Aspects
Minimum Wages
32. Sudan is not a country in which the government exercises a1greatdeal of direct influence over private sector labor markets. A minimum wagelaw applying only to permanent workers In the organized sector was Intro-duced in 1974. This has never, however, been set at an effective level andis currently equal to the minimum pdblic sector wage i.e., LSd 60 permonth. A more significant development is the recent endorsement by theMinistry of Labour of a national collective agreement which not onlyreaffirms the level of the minimum wage, but also grants a wide range ofstipulated increases to private sector employees earning more than theminimum wage. For example, a worker earning LSd 90 per month in January1986 would enjoy an increase of 37 percent to LSd 123. Whether increasesof this kind constitute a serious attempt to prop up real wages abovemarket clearing levels must be doubtful: partly because of the very highinflation rates currently experienced in Sudan and partly because payincreases granted since January 1985 can be interpreted as being includedin the increases stipulated under this new agreement. It remains to beseen, however, whether a precedent has been set for regular and moreserious interventions of this kind.

- 51 -
Labor Legslation
33. The only controversial area regarding non-wage labor legislationin Sudan concerns the Individual Labor Relations Act of 1981. EssentiallyPara VI of the Act that deals with the termination of employees lays down arather time consuming procedure. To dismiss a non-probationary worker anemployer must establish that the worker has committed one or other of anumber of predetermined offenses, e.g., gross negligence, commercialespionage, assault, etc., and win approval from the Commissioner ofLabour. If his application is not approved then he must either reinstatethe worker or pay him a month's notice plus a further six monthscompensation. The central problem with the Act is that unsatisfactory jobperformance is not given as a valid cause for dismissal. This legislationwill have the effect of:
(i) increasing expected employment costs and employment and,possibly,
(ii) reducing worker incentives.
34. Another rather strange sub-section rules that even if a worker isdismissed with the approval of the Commissioner, the employer has toprovide him with a certificate giving period of service, wage, etc., butspecifically not mentioning the reasons for dismissal. This wouldpresumably reinforce (ii) above.
35. The counter-argument used to defend the Act is that unfalrdismissal was the most common cause of industrial dispute in the 19708.The problem is thus one of finding a formula which satisfies the uliins onthe one hand and reduces the undesirable effects of the Act on the other.At present the Act specifies a maximum probationary period of threemonths. If this period were extended, then it should be possible for firmsto rid themselves of the most undesirable employees before the terminationclauses begin to apply.
Trade Unions
36. Prior to the early 1970s the trade union movement in Sudanconsisted mainly of small weak unions with the one exception of the RailwayWorkers Union. Although there was substantial growth in membership duringthe 1970s, virtually all of the 600 registered unions in existenee by theend of the decade were too small to exercise any real influence. Theturning point was the introduction of a deliberate restructuring of theentire union movement into 41 blue collar and 48 white collar unions underthe 1971 Trade Union Act, later amended by the Employees Trade Union Act of1977. These two pieces of legislation along with a Ministerial directivein 1973 jcintly designate the sector and occupations within which unionsmay be formed, and the internal structure in terms of national and regionalfederation of the unions themselves. There are two national federations:the (blue collar) Sudan Workers Trade Unions Federation with around 600,000members and the (white collar) Employees and Professionals Trade Unions

- 52 -
Federation with about 150,000 members. The blue collar unions are organ-ized on a largely sectoral basis and include a significant proportion ofrural workers In, for example, the Gezira and Managil Project Workers'Trade Union (20,000) and the Sudanese Irrigation Workers' Trade Union(40,000). White collar unions are found in a mixture of sectors andoccupations of which the General Trade Union of Teachers is by far thelargest.
37. The unions themselves claim that membership is virtually100 percent in establishments where unions are present. Although there isno provision for the closed shop under Sudanese law, this claim may bejustified as some collective bargains have conferred certain benefits onlyupon union members, while the 1977 Act prohibits an employer to negotiatewith any group of employees wherever a lawful trade union already exists.Membership is therefore very large in the public sector and large scaleprivate sector, although little is known about smaller enterprises. TheSudanese Workers' Trade Union Federation claim recent success in unionizingsmall scale handicrafts and are currently trying to organize seasonalworkers in large agricultural schemes. At present it is nonetheless truethat union strength is highly concentrated in larger establishments.
38. Bargaining is very much on a sectoral as opposed to a shop floorbasis. The relative bargaining strength of the unions is a subject of somecontroversy in that although their membersh*p is considerable, they,',orefaced with government pay regulation in the public sector and a lowprofitability organized private sector that is restricted by foreignexchange regulations and import licenses. Certainly the unions have beenunable to prevent a widening disparity from developing between public andprivate sector pay levels. Legally their right to use the strike is ratherlimited. Civil servants are not allowed to strike while the LabourRelations Act of 1976 lays down a full procedure regarding disputes whichshould be followed before strikes can begin. In practice, however, strikesdo occur and are believed to have been growing recently, although therecorded number of industrial disputes remained roughly constant between1983-4 and 1982-3. The conclusion must be therefore that unions arebecoming more powerful but that so far they are unlikely to have been amajor force in creating intersectoral wage differentials. The possibilityremains, however, that since industrial unions bargain for a fixed percentpay rise for all workers, they may present a serious obstacle to changingskill differentials among manual workers.
Market Imbalances
39. There appear to be two major examples of labor market imbalancein the Sudan at present. The first is that there is a growing surplus ofacademically educated higher education graduates and one suspects a surplusof secondary school graduates as well. To a large extent this is simply anongoing problem that was disguised by past policies. In the past Sudanfollowed the same practice as in Egypt of guaranteeing public sectoremployment to all university graduates. This policy was dropped withreference to Arts graduates in 1974, Science graduates in 1978, Agriculturegraduates In 1980 and then discontinued altogether in 1981. Just as this

- 53 -
policy led in the past to growing overstaffing in the civil service, itsabolition has been reflected in a growth in open unemployment amonggraduates. The determinants of the volume of graduate unemployment arethe level and composition of output from the universities, the number ofpublic sector jobs available and the length of time It takes graduates toreduce their reservation wages until they are prepared to accept jobsnormally associated with lower educational qualifications. What hashappened is that the universities have continued to produce mostly non-vocational graduates for whom there are few job opportunities outside thepublic sector, while public sector employment has stagnated in recentyears. An increasing proportion of graduates thus go through the publicsector recruitment process without success, and it is estimated by thePublic Service Recruitment Board that 50 percent of university graduateseventually end up in higher secondary qualification public sector jobs.
40. The other type of manpower imbalance that is frequently referredto in Sudan is the apparent shortage of skilled manual workers and techni-cal personnel. The first point that should be made about this is that thisonly applies to experienced workers. Freshly trained workers are not ingeneral in a position to obtain jobs overseas and may even in fact experi-ence initial difficulty in finding jobs. The statement about shortagestherefore applies for the most part to skilled workers with a substantialamount of demonstrable experience.
41. The basic pattern is then that after completing the trainingperiod, workers accumulate experience within Sudan and then migrate to muchhigher paid jobs elsewhere. This is reflected in the turnover ratesexperienced in both the public and private sectors although in the lattercase the very high turnover rates reported by some employers may alsoreflect temporary interfirm differences in wage rates. The main implica-tion of this process is that as skilled wages abroad are roughly betweensix and fifteen times these in Sudan, the supply price of a typical skilledexperienced worker is going to be several times that of a correspondinginexperienced worker. The market equilibrium that is then observed, is onein which employers will, as far as possible, substitute inexperienced forexperienced workers so that the latter will constitute only a small ornegligible proportion of skilled employment. The term "shortage" is thusto some extent a misnomer in that one is to a large extent observing alabor market equilibrium in which a scarcity of experienced workers is therule, and in which relatively few additional experienced workers would beattracted by a significant improvement in wages as the latter would stillbe considerably below those abroad. Those experienced workers who areemployed domestically, may still command sizable differentials over thosewith less experience and this may explain why the ILO urban labor marketsurvey of 1982 found a small number of skilled workers earning severaltimes the mean. This explanation does not deny, however, that true short-ages in the sense of excess demand at existing wages do also occur. In thepublic sector, where earnings differentials have tended to be compressedover recent years, it is very difficult to attract suitably experiencedworkers, while parts of the piivate sector may have faced difficulty inincreasing differentials due to the existing trade union policy of bargain-ing for fixed proportionate increases for all relevant categories ofworker.

- 54 -
42. One problem that employers do seem to experience in Sudan is adifficulty in identifying the quality of prospective applicants even aftercarrying out tests within the factory. The vocational training centers dooffer a trade testing service but the accessibility and reliability of suchtests are not widely known. Given uncertainty about applicant quality itis rational for employers to offer no more than a wage appropriate to whatthey believe to be the average quality level. Employers thus speak of ashortage of skilled labor in the sense that they would be willing to pay ahigher wage for an applicant of guaranteed high quality.
43. There are two main sources of certified skilled manual labor inSudan: the Vocational Training Centers (VTC's) and the Technical EducationSystem (TE). The difference between these two systems Is that whereas theVTC's are clearly designed to confer manual skills upon their intake, TEhas much less clear aims and provides a mixture of technical traint;g andgeneral education. At present there are eight VTCs in Sudan and 15Technical Industrial Secondary schools. Currently the five northern VTCshave an intake of 1290 per year which, after allowing for dropout andfailure rates and taking into account the output of the southern VTCs,suggests a total annual output of 1450 per year. The Technical IndustrialSecondary Schools graduate about 1,000 a year thus yielding a total nation-al output or around 2,500. The social returns to training and education ofthis kind are presumably quite high given the relatively tight state of thedomestic labor market in skilled labor and the large foreign exchangeremittances that can be expected in later years from jobs overseas. Itwould seem that current policy aims of expanding and improving the qualityof training centers and schools are well justified.

- 55 -
ANNEX IV
THE FINANCIAL SECTOR
A. Introduction
1. This Annex describes the financial system structure and financialpolicies; it also recommends changes in policies to enable the finkntialsystem to play its proper role in the development of an efficientindustrial sector.
B. The Structure of tiic Financial System
2. Sudan has 21 commercial bar.;s and six specialized financialinstitutions in addition to the central bank. The commercial banks insudan are clearly categorized with respect to their relationship to theGovernment and include five Islamic banks, six nationalized banks whichwere expropriated by the Government in 1970, six wholly foreign-owned banksand four joint-venture (Sudanese and foreign) banks.
3. The Bank of Sudan (BOS) was established in 1960 as the localcentral bank. Its principal objectives are to regulate a sound monetary,credit and banking system so as to foster an orderly and balanced economicdevelopment of the country, to maintain the stability of the currency, toact as financial advisor to the Government and to be a lender of lastresort.
4. By the end of 1984 the Bank of Sudan had 9 offices and Sudan's 21commercial banks run 205 branches throughout the nine regions. Thirty-sixpercent of these branches were situated in Khartoum and another 34 percentwere in the Middle and Eastern regions. The rest were in the Northern(9%), Kordofan (10%), Darfour (5%), Upper Nile, Equatorial and BahrEl-Ghazel regions (2% each). Government-owned commercial banks accountedfor 103 of the 214 branches; foreign banks had a total of 9 branches,mostly in Khartoum; and the Islamic and joint-venture institutions control-led another 47. The specialized banks had 46 branches between them.
5. Sudan's commercial banks have engaged mainly in short-term exportand import financing and, until it was prohibited by the central bank, ininter-bank lending, leaving financing ff production to specialized institu-tions such as the Agricultural Bank of Sudan (ABS), the Industrial Bank ofSudan (IBS), and the Sudan Development Corporation.
6. In the past, commercial banks were a major source of workingcapital finance for industry, but since 1979 such lending has declined inreal terms, growing at a compound nominal rate of 19 percent per year from1979 to 1985 while inflation stayed above 30 percent per year over the

- 56 -
period. During the same period, lending for imports was maintained in realterms (29% per year compounded) while loans for local trade surged (36%per year), and for a while stayed ahead of inflation.
7. Apart from the commercial banks, there are six specialized finan-cial institutions in the Sudan: the Agricultural Bank of Sudan (ABS)6 theIndustrial Bank of Sudan (IBS), the Estates Bank, the Sudanese SavingsBank, the Sudan Development Corporation (SDC) and the Sudan Rural Develop-ment Finance Corporation (SRDFC).
8. The Agricultural Bank of Sudan was set up in 1959 as a fullyowned subsidiary of the Bank of Sudan with a paid up capital of LSd 30million (US$12 million at the current official exchange rate). Its objec-tives are to promote and improve agriculture and related activities byfinancing inputs and services for the sector. In 1984 it loaned out aboutLSd 28 m (LSd 26 million in 1983 and LSd 24.3 million in 1982). As inprevious years, most of its loans were short-term advances for the seasonalneeds of agricultural production. In 1985 an IDA Drought Recovery Creditto the sector (Cr. 1614-SU) for US$20 million was partly channelled throughthe ABS (US$9 million), with another US$8.5 million being processed throughABS for parastatals.
9. The Industrial Bank of Sudan (IBS) was established in 1961 toassist and promote the establishment, expansion and modernization ofprivate industrial enterprises in Sudan and to encourage participation offoreign and local private capital in such enterprises. So far, IBS hasfocused on financing capital expenditures for small and medium privateIndustrial enterprises. IBS provides medium (2 to 6 years) and long (6 to15 years) term loans of up to two-thirds the cost of investment projects.It also participates in the equity of industrial undertakings and is autho-rized to provide advice and technical assistance to projects it finances.In the 1970s IBS received loans from IDA (Credits 447-SU and 589-SU), theKuwait Fund for Economic Development (SK 1.5 million) and the KfW (DM 5million). In 1983 IBS made loans to'16 projects for LSd 1.8 million.Lending in 1984 amounted to LSd 5.1 million for 21 projects. In 1981, IDAhad cancelled its second credit to IBS and stopped processing of the third,because of continued deterioration in the institution's management andtechnial performance. Since then, IBS has been strapped for resources, andfor the first time in its existence made no loans in calendar year 1985.
10. The Estates Bank, which provides long-term loans for real estate,primarily for residential purposes, approved 646 loans totalling LSd 2.3million in 1983.
11. The Sudanese Savings Bank had been set up in 1974 as a pilotscheme by the Government of Sudan.. It has however flourished as a savingsinstitution and in 1983 disbursed LSd 25.6 million in short term loans toits customers. Approximately 10 percent of all its loans go for smallindustrial enterprises.
12. The Sudan Development Corporation (SDC), established in 1974 witha paid up capital of US$200 million, is Sudan's leading development financeinstitution. While it is wholly owned by the Government (the Chairman and

- 57 -
Managing Director and his deputy are appointed by the Government ancO., withthe representatives of the Bank of Sudan and the Ministry of Finani'c andEconomic Planning, form a two-thirds majority on the Board), it has so farbeen run as an autonomous financial institution. SDC's main objectives areto identify, appraise and implement technically feasible, economicallysound and commercially viable joint-venture projects between Sudanese andforeign technical and financial parties/partners in agriculture, industryand agro-industry. Its activities have focused on medium and large scaleprojects, and it has in the recent past tried to resist the increasingpressure from Government to finance projects that have not been thoroughlyappraised. In 1976, IFC participated in providing equity (8%) to each ofthe first two textile plants financed by SDC. By end 1985, SDC hadinvested a total of US$151.2 million (through equity, loans and guarantees)in 38 projects whose total costs amounted to US$1,294.4 million. None ofthese investments have been capable of generating repayments of their debtobligations. The investments covered the mining, construction, transport,food processing, packaging materials and textiles subsectors. SDC had asat February 1986 one wholly-owned subsidiary - the Sudan Rural DevelopmentCompany. !13. The Sudan Rural Development Company (SRDC) was established in1980 as a subsidiary of SDC to promote small and medium scale projects inindustry and agriculture outside Khartoum. In 1981, the Sudan RuralDevelopment Finance Company (SRDFC) was set up as the investment/financingassociate of SRDC. SRDFC is owned 40 percent by SRDC and 20 percent eachby the Caisse Centrale of France, the DEG of Germany and the CommonwealthDevelopment Corporation of Britain. The latter, with the EEC and the GTZ,gave initial technical assistance support to SRDFC. The staff of 48(jointly shared by SRDC and SRDFC) includes 5 technical assistance expa-triates and is headed by an expatriate General Manager, assisted by a Headof Implementation and Monitoring and a Financial Controller. Although arelatively young institution, SRDFC has excellent staff and has developedsound systems and procedures for project lending. SRDFC gave its firstloans totalling LSd 1.7 million (DM 1.6 million) to seven projects in 1985.
C. Financial Sector Policies
14. Interest Rates:l/ Interest rates on local currency deposits andloans have been negative Tn real terms for at least the last five years.Table IV.1 shows commercial bank rates in effect up to the Islamizationmeasures of 1984. Until then, fixed deposit rates ranged from 13 percentto 14.5 percent based on term, and notice (15 day) deposits were at sixpercent. Savings accounts earned a maximum rate of 13 percent p.a.Special "international" rates are set by the Bank of Sudan for dollar andsterling deposits (Table IV.2). Until 1984, the rate for loans to
1/ Although predetermined interest rates on loans were abolished in 1984,this section still uses the term "interest rates" for the cost of loancapital estimated ex-post.

- 58 -
Table IV.1: SUDAN: COMMERICAL BANKS' INTEREST RATES, 1979-83 a/(in percent)
February February-November January1978 1981 1983
Lending ratesDiscount of bills ofexchange 13.0 15.0 17.0 20.0
Advances against billsof exchange 13.5 15.5 17.5 20.0
Advances to industrialborrowers ) 12.0 14.0 17.0
Overdrafts and other ) 10.0-14.5advances (range) ) 12.0-16.5 14.0-18.5 17.0-20.0
Deposit ratesA. Non-governmental customers
Demand deposits -- -- -- --
Notice deposits(15 days) 1.0 1.0 3.0 6.0
Fixed deposits3 months 6.0 8.5 10.5 13.56 months 7.0 9.0 11.0 14.09 months 8.0 9.5 11.5 14.512 months 8.5 10.0 12.0 15.0Savings deposits 8.0 8.0 10.0 13.0Deposits of pensionand provident funds 4.0 8.0 10.0 13.0
Foreign currencydeposits (U.S. Linked to rates Inter-dollars and in international nationalpounds sterling) -- markets b/ rates
B. Governmental customersDemand depositsFixed deposlto(range) 3.0-4.0Savings deposits 4.0
Source: Bank of Sudan.
a/ The structure of interest rates was unchanged between February 1978 andFebruary 1981, between November 1981 and January 1983, and between January1983 and October 1984. The charging and payment of interest was prohibitedby law effective September 1984.
b/ Since June 1980.

- 59 -
Table IV.2: BANK OF SUDAN TIME DEPOSITS MAXIMUM RATES
As at 02/24/1986
US$ (000's) 1 2 3 6 9 12 Months
From 5 to 10 7.06 7.13 7.13 7.13 7.25 7.03
Over 10 to 25 7.03 7.38 7.38 7.38 7.05 7.56
Over 25 to 50 7.56 7.63 7.63 7.63 7.75 7.08
Over 50 to 100 7.69 7.75 7.75 7.75 7.88 7.09
Over 100 to 250 7.08 7.88 7.88 7.88 8.00 8.06
Over 250 to 500 8.03 8.38 8.38 8.00 8.05 8.56
Over 500 and Over 8.08 8.88 8.88 8.08 9.00 9.13
(000'8) 1 2 3 6 9 12 Months
From 2.5 to 5 11.09 11.81 11.75 11.38 11.25 11.19
Over 5 to 12.5 12.19 12.06 12.00 11.63 11.05 11.44
Over 2.5 to 25 12.44 12.31 12.25 11.88 11.75 11.69
Over 25 to 50 12.56 12.44 12.38 12.00 11.88 11.81
Over 50 to 125 12.69 12.56 12.05 12.13 12.00 11.94
Over 125 to 250 13.19 13.06 13.00 12.63 12.05 12.44
Over 250 and Over 13.69 13.56 13.05 13.13 13.00 12.94
- 60 -
industry, agriculture and exports was 17 percent. Banks were also allowedto charge up to 21.5 percent for other activities. The application ofthese Bank of Sudan rates for the various activities was strictly enforcedby the central bank.
15. Since September 1984, the chargirg and payment of interest,except on foreign currency time deposits, has been prohibited as part ofthe general "islamization" of Sudan's economy. Since then, seven types ofbank-client arranigements have been instituted under Sudan's Islamic laws togovern commercial bank lending. In place of interest on local deposits andon loans, banks 'nave instituted shared "profits" and "charges". Whilecommercial banks have continued to pay depositors "profits" relativelyequivalent to the interest rates in effect prior to 1984, the chargeslevied on loans to their clients have increased progressively, with theresult that, except government banks, commercial banks charge effectiverates of about 30 percent. This compares with an annual inflation rateestimated at about 35 percent per year, and is a significant improvementover previous years. Also, implementation of Islamic "murabaha", 'musha-raka' or "mudaraba" contracts involves additional risks to banks akin toequity participation in the businesses financed, and commercial banks areusing the new system to compensate for the increased risks. As a result,the margin of banks, which used to be 7 percent to 13.5 percent, now rangesaround 20 percent. Banks are therefore likely to be more profitable underthe new system, although little of the new profits might be passed on todepositors. Also, many of Sudan's commercial banks are more liquid thanthey would prefer, partly because the Bank of Sudan's rules prohibitinterbank deposits or loans.
Monetary Policies
16. The World Bank report, Sudan: Problems of Economic Adjustment(1987) concluded that the key for better performance in this field lies ina substantial reduction in the financial deficits of the Central Governmentand parastatal enterprises, thereby reducing the inflation, and creatingadequate room for sound credit expansion to the private sector. It wasalso stated that, as part of a comprehensive approach to Sudan's economicproblems, monetary policy should shift away from credit ceilings, sectoralcredit targets and individual credit approvals to better management ofmonetary base. However, In the interim, the monetary authorities will haveto largely rely on specific instruments of credit control, essentially tooffset the distortions created elsewhere in the economy. One example ofthese distortions is in the high profitability of local trade compared tocommodity production, or in the high profitability of import trade versusexports, phenomena related to the overvaluation of the Sudanese pound.Another example is the attractiveness of investment in real estate andcommodity stocks due to the high domestic inflation. Also the use of bankcredit for speculation against the domestic currency is a major concern tothe Government. The present credit allocation system tries to offset thesenegative tendencies created by overall distortions. However, controls canonly mitigate harmful effects of distortions in the short run. Problems ofthis nature should be attacked at the roots of the distortions, i.e.,appropriate budget, parastatal and exchange rate policies. Attempts at

- 61 -
remedying the symptoms of overexpenditure and bad incentive structures arebound to be ineffective in the medium and long term.
17. Credit controls will have to be applied as part and parcel ofoverall demand management policies. With the presence of credit ceilingsthe issue of credit allocation arises. There are at least four issues inthe current credit allocation system that lead to an insufficient supplyresponse of the economy: (i) criteria to determine a credit ceiling foreach commercial bank, (ii) imposition of floors of credit for priorityactivities, as well as Bank of Sudan approvals of credit above LSd 300,000,(iii) absence of an interbank money market, and (iv) preferential access tocredit for the public sector which, in general, is suffering from a lowlevel of economic performance.
18. Individual Ceilings. The private banks have, in general, adheredto the credit ceilings imposed on them to avoid the 5 percent penalty pay-ment on credits exceeding the ceiling. As mentioned earlier these ceilingsare set on rather subjective criteria that do not reward efficient finan-cial intermediation. The largest share should go to banks that show effi-ciency in placing their funds at positive real returns2/ in the economy.On the other hand, efficient banks should be able to attract sufficientdeposits to finance their credit operations. It is, therefore, recommendedto link the credit ceiling for individual banks to their ability to collectdeposits. Competition for deposits would increase the remuneration forsavers and decrease the differences, between rewards for deposits andcharges for loans, spreads that have become too high. Also, it would helpresource mobilization.
19. The ratio between deposits and loans could, however, not be theonly criterion for setting the ceilings. Some state-owned banks may haveas an objective to keep the cost of capital at negative levels in realterms. Moreover, some banks have a history of neglecting sound bankingprinciples in some of their transactions which undermined their solva-bility. Bad loans should be written off or have offsetting provisions toreveal the real equity of the commercial bank in question. Limits onallowable ratios between outstanding credit and the real net worth of thebanks concerned should restrict the credit expansion of the less solventcommercial banks, including those owned by the state. This is an area ofneglect that should be remedied by the Bank of Sudan.
20. Sectoral Targets. Table IV.3 shows the distribution of outstand-ing credit allocated to different activities in 1985 by government-ownedbanks, foreign banks, and Islamic and joint venture banks, and theiraverage annual growth rates from 1979. The high shares and high growthrates of credit to local trade and import activities in nongovernment-ownedbanks imply where the relatively profitable activities are in the economy.
2/ Annual charges or returns on loan capital adjusted for annualinflation,

- 62 -
Table IV.3: CREDIT ALLOCATION SHARES TO DIFFERENT ACTIVITIES (1985)AND ANNUAL COMPOUND GROWH RATES (1979-1985)
(in percentage)
Foreign Islamic & Joint- Government-Banks Venture Banks Owned Banks Total
Short-termTarget Share Exports 10 22 20 19(actual growth p.a.) (19) (46) (14) (20)
Target Share Imports 29 22 6 13(actual growth p.a.) (36) (51) (13) (29)
Target Share Industry 15 13 27 21(actual growth p.a.) (24) (80) (15) (19)
Target Share LocalTrade 20 15 3 9
(actual growth p.a.) (167) (155) (6) (36)
Others 4 13 6 8(10) (49) (8) (17)
Target Share Medium &Long-Term 22 15 38 30
(actual growth p.a.) (154) (79) (28) (33)
Total 100 100 100 100(38) (59) (17) (26)
Source: Bank of Sudan.
21. In Sudan, where credit has to be rationed, administrativelyregulated credit allocation to economic priorities has become a politicalissue. The new Government introduced targets for certain credit destina-tions such as working capital, exports and medium or long term financing.However, such credit allocation systems normally lead to massive relabelingexercises rather than shifts in credit flows and, therefore, should not berelied upon for policies of economic growth. Furthermore, if seriouslyapplied and set on unrealistic levels these sectoral targets can becomehighly damaging to the economy. Commercial banks would be pushed intocredit extension to marginal operations within the priority sector at thecost of economically profitable operations in a non-priority sector. Forexample, the perception that all production-oriented operations are econo-mically more attractive than all trade operations is of course wrong. Inthis field, one would expect the best results from an approach of moralpersuasion of the banking community by the Government and a strong input of

- 63 -
the bankers in the targets to be chosen, while using firm government actionto stop credit for clearly undesirable activities. The existing ban ofpersonal credit, for example, can be quite well defended in a country witha problem of overconsumption and the tendency to use domestic credit forforeign exchange and commodity speculation. Also, in some developingcountries the personal loan accounts with state banks have been an area ofhighly subjective criteria instead of sound banking principles. This banmight be removed after the present economic disequilibria have beenmitigated and the cost of capital has become positive in real terms. Theban on credit for building reflects a reaction on the attractiveness ofinvestment in real estate over commodity production. As a short-termmeasure in a highly distorted environment this may be justified, but oncethe price of loan capital is correct and the incentives for investment Incommodity production vis-a-vis real estate are freed from distortions themonetary authorities should allow banks again to extend credit to thebuilding sector. The 30 percent target as set for the portfolio exportactivities appears to be unrealistic compared to an actual average share of20 percent in the total portfolio. The other targets (25 percent forworking capital in productive sectors and 15 percent for medium- andlong-term capital) appear to be more in line with real feasibility,although it should be mentioned that most of the medium- and long-termloans in Table IV.3 are less than 3 years in maturity, while the CentralBank is seeking stricter criteria.
22. The approval for individual credits above LSd 300,000 may developinto a highly subjective tool of economic management, that adds to theother forms of unnecessary regulations. It should be replaced by a report-Ing system that would help the Bank of Sudan in tracing illegal transac-tions in the field of capital flight. The need for such monitoring systemswould disappear with the gradual removal of the distortions from theeconomy.
23. Interbank Market. At the moment, the cost of loan capital andthe rewards on deposits vary widely between the different banks showing thevast imperfections in this market. These imperfections may reflect in parta possible objective of state banks to keep the cost of loan capital atnegative levels in real terms. But, as far as the private banks areconcerned, these imperfections are partly due to the absence of a freeinterbank money market and a system of credit ceilings that is unrelated tothe commercial bank's liquid liabilities. The presence of an interbankmoney market could become operative once the present money injectionsoriginating in the public sector have been reduced and the excess liquidityeliminated from the economy.
24. Public Sector Bias. Finally, the credit allocation system as awhole is quite partial to the public sector. First of all, last year thecredit ceilings for the central government and the parastatals have notbeen enforced while the ceilings on the private sector were effective andstrengthened with sectoral targets. Second, in setting the ceilings forthe individual commercial banks, the central government favors thegovernment-owned banks. Higher ceilings for banks with more bad debtsallow government-owned banks to survive and to give out fresh loans to

- 64 -
largely bankrupt parastatals. As a result, the estimated credit that hasbeen channeled into the purely private sector is only LSd 418 million outof the total commercial bank credit of LSd 1.9 billion as of December 31,1985.3/ Third, the ceiling on shares of medium- and long-term loans is5 percent for government-owned banks, while the rest of commercial bankshave to extend at least 15 percent of credit into this type of loans. Inan economic environment characterized by distortion and uncertainties suchan obligation represents a heavy liability on the private banks whenstrictly enforced.
25. Supply oriented policies require a considerable reduction in thecredit extension to the public sector in order that the credit needs of theprivate sector can be met without undesirable controls and restrictions.As the government is making progress towards this goal the different creditregulations can be relaxed. However, already under the present circum-stances the following measures should be considered for immediate action:
(i) establish objective criteria of setting individual banks' c'editceilings that are transparent and depend on their performance inresource mobilization, while removing the special privileges anduneconomic objectives of the state banks;
(ii) eliminate special treatment of parastatals as privilegedborrowers;
(iii) make the targeting of credit into priority areas a cooperativeprogram between the government and the bankers' community;
(iv) replace the credit approval about LSd 300,000 by a system ofmonitoring; and
(v) revive the interbank market.
3/ Sudanese statistics include government-owned and jointly-ownedenterprises operating under the company law under the private sector.

- 65 -
ANNEX V
STATISTICAL APPENDIX

PAGE ITABLE 1SUDAN: GDP BY SECTOR (CURRENT PRICES). 1975/76-1985/86
(MILLIONS OF SUDANESE POUNDS)
ITEM 1975/76 1976/77 1977/78 t978/79 1979/80 1980/81 1981/82 1982/83 1983/84 1984/85 1985/86
PRIMARY PRODUCTION 117 628.0 818.4 i.044.1 1,093.0 1.235.8 1.450.6 2,399.0 2.986.8 3,715.6 4,643.2 7,277.8AGRICULTURE 118 622.6 816.9 1,042.5 1.089.5 1,232.1 1,445.8 2,396.0 2.980.0 3,707.0 4.627.5 7,257.2MINING 119 5.4 1.5 1.6 3.5 3.7 4.8 3.0 6.7 8.6 15.7 20.5
SECONDARY PRODUCTION 120 224.2 269.2 304.1 370.1 488.8 654.4 820.0 1.307.0 1.593.4 2.252.4 2.930.9MANUFACTURING 121 108.6 132.1 147.5 201.8 249.4 358.7 365.0 541.1 681.6 1.007.5 1,398.8CONSTRUCTION 122 87.0 102.8 118.0 123.3 188.6 207.2 378.0 638.0 736.6 937.0 1,097.8PUBLIC UTILITIES 123 28.6 34.3 38.6 45.0 50.8 * 88.5 77.0 127.9 175.1 308.0 434.3
SERVICES 124 770.1 996.4 1,229.1 1.433.0 1.905.3 2.414.9 3.018.0 4.203.6 5.267.8 7.010.5 9.948.8TRANSPORT & STORAGE 125 186.4 220.9 273.4 338.9 458.2 467.8 683.0 940.9 1.140.1 1.547.7 2.158.0COMMERCE 126 259.5 372.7 481.2 564.4 629.2 1.047.3 928.0 1.324.5 1,577.9 2.116.7 2,992.5BANKING, INSURANCE & FINANCE127 137.6 165.6 189.9 216.7 352.6 290.9 683.0 946.2 1,255.1 1.592.1 2.219.6HOUSING 128 - - - - - - - - - - -PUBLIC ADMIN. & DEFENSE 129 173.5 220.0 265.6 '282.4 391.7 493.3 545.0 734.9 958.1 1.325.9 1.980.2PERSONAL SERVICES 13-O 13.1 17.2 19.0 30.6 73.6 115.6 179.0 257.1 336.5 428.0 598.5 S
GROSS DOMESTIC PRODUCT 131 1.C22.3 2.084.0 2.577.3 2.896.1 3.629.9 4.519.9 6.237.0 8,497.3 10.576.7 13.906.1 20.157.5 co
INDIRECT TAXES, NET 136 225.7 255.6 305.4 357.6 342.1 460.0 484.0 847.0 895.0 1.014.0 1,199.6
GDP - MARKET PRICES 14 1.848.0 2.339.6 2.882.7 3.253.7 3,972.0 4.979.8 6.721.0 9.344.3 11.471.7 14.920.1 21,357.1
GDP DEFLATOR (1980/81=100.0) 42 31.0 34.1 42.6 53.7 65.0 79.7 1OO.O 134.6 171.7 261.0 342.0EXCHANGE RATE (AG) US$/LSIO0 43 287.2 287.2 287.2 287.2 170.2 158.7 112.4 81.3 63.0 49.8 36.7
SOURCE: MINISTRY OF FINANCE ANO ECONOMIC PLANNING & STAFF ESTIMATES.SERIES 1981/82-1983/84 ARE UPDATED USING NEW NATIONALACCOUNTS ESTIMATED BY.DEPT. OF STATISTICS. 1984/85 AND1985/86 ARE ESTIMATES MADE BY MINISTRY OF FINANCE ANDECONOMIC PLANNING BASED ON DEPT. OF STATISTICS FIGURES.

TABLE 2 PAGE ISUDAN:GOP BY SECTOR(1981/82 PRICES):I/, 1975/76-1985/86
(MILLIONS OF SUDANESE POUNDS)
------------------------------------------------------ ____--_____--________-____________- -_______-_----__-_____-__ -____-----_-____ITEM 1975/76 1976/77 1977/78 1978/79 1979/80 1980/81 )981/82 1982/83 t983/84 1984/85 1985/86
----------------------------------------------------- I.-----------------------
PRIMARY PRODUCTION 101 2,027.1 2,403.5 2,449.8 2,036.5 1t902.7 1,820.0 2,399.0 2,219.0 2,164.0 1,779.0 2,128.0
AGRICULTURE 102 2,009.7 2,399.1 2,446.0 2,030.0 1,897.0 1,814.0 2.396.0 2.214.0 2,159.0 1.773.0 2.122.0MINING 103 17.4 4.4 3.8 6.5 5.7 6.0 3.0 5.0 5.0 6.0 6.0
SECONDARY PRODUCTION 104 723.6 790.6 713.6 689.5 752.6 821.0 820.0 971.0 928.0 863.0 857.0
MANUWFACTURING 105 350.5 388.0 346.1 376.0 384.0 450.0 365.0 402.0 397.0 386.0 409.0CONSTRUCTION 106 280.8 301.9 276.9 229.7 290.4 260.0 378.0 474.0 429.0 359.0 321.0PUBLIC UTILITIES 107 92.3 100.7 90.6 83.8 78.2 1t1.0 77.0 95.0 102.0 118.0 127.0
SERVICES 108 2,485.8 2,926.3 2,883.9 2,670.1 2,933.5 3.030.0 3,018.0 3,123.0 3,068.0 2.686.0 2.909.0
TRANSPORT & STORAGE 109 601.7 648.8 641.5 631.5 705.5 587.0 683.0 699.0 664.0 593.0 631.0COMMERCE 110 837.6 1,094.6 1,129.0 1,051.6 968.7 1,314.0 928.0 984.0 919.0 811.0 875.0BANKING, INSURANCE 8 FIN. 111 444.2 486.3 445.6 403.8 542.9 365.0 683.0 703.0 731.0 610.0 649.0HOUSING 112 - - - - - - - - - - -PUBLIC ADMIN. & DEFENSE 113 560.0 646.1 623.2 526.2 603.1 619.0 545.0 546.0 558.0 508.0 579.0PERSONAL SERVICES 114 42.3 50.5 44.6 57.0 113.3 145.0 179.0 191.0 196.0 164.0 175.0
GDP - FACTOR COST 115 5,236.5 6,120.4 6,047.3 5,396.1 5,588.8 5,671.0 6,237.0 6.313.0 6.160.0 5.328.0 5,894.0======== =====a= ======== =====,== ======== ===== ========= ======
INDIRECT TAXES, NET 133 728.5 750.7 716.6 666.3 526.7 577.2 484.0 629.3 521.3 388.5 353.6
GOP - MARKET PRICES 34 5,965.0 6,871.1 6,763.9 6,062.4 6,115.5 6,248.2 6,721.0 6,942.3 6,681.3 5,716.5 6.247.6
GOP DEFLATOR (1980/81=100.0) 42 31.0 34.1 42.6 53.7 65.0 79.7 100.0 134.6 171.7 261.0 342.0EXCHANGE RATE (AG) US$/LSIOO 43 287.2 287.2 287.2 287.2 170.2 158.7 112.4 81.3 63.0 49.8 36.7
SOURCE: MINISTRY OF FINANCE AND ECONOMIC PLANNING & STAFF ESTIMATES.SERIES 1981/82-1983/84 ARE UPDATED USING NEW NATIONALACCOUNTS ESTIMATED BY DEPT. OF STATISTICS. 1984/85 AND1985/86 ARE ESTIMATES MADE BY MfINISTRY OF FINANCE ANDECONOMIC PLANNING BASED ON DEPT. OF STATISTICS FIGURES.

TABLE 3 PAGE 1SUDAN: GOP BY EXPENDITURE (CURRENT PRICES) 1/, 1975/76-1985/86
(LS MILLION)
----------------------------------------------------------------__----.------__-----------------------------------------------------
ITEM 1975/76 t976/77 1977/78 t978/79 1979/80 1980/81 1981/82 1982/83 1983/84 1984/85 1985/86
CONSUMPTION 1 1.603.9 2.088.3 2.699.8 3.039.2 3.836.5 4.878.0 6.270.4 8.764.4 10.787.7 14.038.9 20.574.1PRIVATE 2 t.373.9 1.8t0.3 2.368.8 2.632%2 3.200.5 4,003.2 5.184.9 7.500.2 9.t49.6 11,644.6 17.661.2GOVERNMENT 3 230.0 278.0 331.0 407.0 636.0 874.8 1.085.5 1,264.2 1.638.1 2.394.3 2,912.9
GROSS DOMESTIC INVESTMENT 4 428.0 399.0 414.0 431.0 598.0 764.0 1.649.0 i.789.0 1.792.0 2.074.0 2.516.0FIXED 5 362.0 312.0 324.0 339.0 458.0 556.0 1.276.0 1.756.0 2.026.0 2.009.0 2,256.0PRIVATE 2/ 6 24t.0 157.0 138.0 177.0 178.0 2t6.0 909.0 1.306.0 1.551.0 1.527.0 1.871.0PUBLIC 7 113.0 155.0 186.0 162.0 280.0 340.0 367.0 450.0 475.0 482.0 385.0CHANGE IN STOCKS 8 66.0 87.0 90.0 92.0 140.0 208.0 373.0 33.0 -234.0 65.0 260.0
GROSS DOMESTIC EXP. (C+I) 19 2.031.9 2,487.3 3,113.8 3.470.2 4,434.5 5.642.0 7,919.4 1O,553.4 12,579.7 t6,t12.9 23,090.1EXPORTS (GNFS) 9 222.8 247.1 242.4 243.5 475.9 471.3 593.4 1.009.8 1,495.2 1.606.4 1,912.8IMPORTS (GNFS) 1o 406.7 394.8 473.5 460.1 938.4 1,133.6 1,791.8 2,218.9 2,603.2 2.799.2 3.645.8
RESOURCE GALANCE (X-M) 50 -183.9 -147.7 -23t.1 -216.6 -462.5 -662.3 -1,198.4 -1.209.1 -1.107.9 -1,192.8 -1.733.0NET FACTOR SERV. INC. (FSY) 11 -17.8 -17.8 -17.8 -24.0 -41.1 -135.5 -260.7 -383.8 -742.9 -959.8 -1.515.0NET CURRENT TRANSFERS (NCT) 12 52.5 59.9 76.9 83.6 t22.8 192.2 311.4 510.5 627.0 863.5 953.7CUR A/C BAL - EXT SAV 13 -149.2 -105.6 -171.9 -157.0 -380.8 -605.5 -1,147.7 -1.082.4 -1,223.8 -1,289.2 -2.294.3
PRODUCT AT MARKET PRICES 0GROSS DOMESTIC (GDX+RB) 14 1,848.0 2,339.6 2.882.7 3.253.7 3,972.0 4,979.8 6.721.0 9,344.3 11,471.7 14,920.1 21,357.1
GROSS NATIONAL (GDP+FSY+NCT) 20 1,882.6 2,381.7 2,941.9 3,313.2 4,053.7 5,036.5 6,771.7 9,471.0 11,355.8 14,823.7 20,795.6SAVINGS
GROSS DOMESTIC (GDP-C) __62. 244.1 251.3 182.9 214.5 135.S t10.7 450.6 579.9 684.1 881.2 783.0GROSS NATIONAL (GDS+FSY+NCT) 66 278.8 293.4 242.1 274.0 217.2 158.5 501.3 706.6 568.2 784.8 221.7(0/V GOVERNMENT) 15 39.7 52.1 35.9 -141.9 -136.5 -316.0 -452.9 -29t.5 -511.7 -1.847.8 -2.282.SOTHER INDICATORS
INDIRECT TAXES, NET 136 225.7 255.6 305.4 357.6 342.-1 460.0 484.0 847.0 895.0 1.014.0 1.199.6GDP DEFLATOR (1980/81.100.0) 42 31.0 34.1 42.6 53.7 65.0 79.7 100.0 134.6 171.7 261.0 342.0IMPORT DEFLATOR (1981/82=100) 196 37.4 37.1 43.7 51.5 67.3 69.0 100.0 141.0 153.0 245.0 362.0EXPORT DEFLATOR (1981/82-100) 197 23.8 30.0 34.2 42.4 49.2 57.0 100.0 134.0 138.0 287.0 314.0EXCHANGE RATE (AG) USS/LSIOO 43 287.2 287.2 287.2 287.2 170.2 158.7 112.4 81.3 63.0 49.8 36.7POPULATION (MILLIONS) 44 16.6 17.0 17.5 18.1 18.6 19.2 19.7 20.2 20.8 21.3 21.9GNP (US$) 45 5.406.8 6.840.2 8.449.1 9.515.5 6.899.4 7.992.9 7.611.4 7,699.9 7.154.2 7.382.2 7,573.6GNP PER CAPITA (USS) 47 325.7 402.4 482.8 525.7 370.9 416.3 386.4 38t.2 344.0 346.6 345.8
SOURCE: MINISTRY OF FINANCE AND ECONOMIC PLANNING & STAFF ESTIMATES.I/ SERIES 1981/82-1983/84 ARE UPDATED USING NEW NATIONAL
ACCOUNTS ESTIMATED BY DEPT. OF STATISTICS. 1984/85 AND1985/86 ARE ESTIMATES MADE BY MINISTRY OF FINANCE ANDECONOMIC PLANNING BASED ON DEPT. Of STATISTICS FIGURES.
2/ AS FROM t981/82 THE INVESTMENT SERIES WERE REVISED TO INCLUDEAN IMPORTANT AMOUNT OF TRADITIONAL CONSTRUCTION AND HOUSINGREPAIRES.

PAGE 1TABLE 4
SUOAN: GDP BY EXPENDITURE (CONSTANT 1981/82 PRICES) t/, 1975/76-1985/86(LS MILLION)
…----------------------------,-------------------_----------_----____________________--------,--------------------------------------ITEM 1975/76 1976/77 1977/78 1978/79 1979/80 1980/81 1981/82 1982/83 1983/84 1984/85 1985/86…-.------------_---------------_-----------------------------__--------------__-----------------------------------------__----------
CONSUWPTION 21 4.734.2 S,939.8 6.167.6 5.578.1 5,623.2 6,105.6 6,270.4 6.433.3 6,255.5 5.591.7 5,567.2…_______ -------- -------- -------- -------- -------- -------- -------- -------- -------- --------
PRIVATE 22 3,991.8 5,123.4 5,391.0 4,819.8 4.644.0 8,007.9 5.184.9 5.494.0 5.301.4 4.674.3 4.7t5.4GENERAL GOVERNMENT 23 742.4 816.4 776.6 758.3 979.2 1,097.6 1,085.5 939.2 954.0 917.4 85t.7
GROSS DONESTIC INVESTMENT 24 1,381.5 1,171.8 971.4 803.0 920.7 958.6 1.649.0 1.329.1 1,043.7 794.6 735.7…_______ -------- -------- -------- -------- -___ - ---- ________ ________
FIXED 25 1,168.5 916.3 760.2 631.6 705.2 697.7 1,276.0 1,304.6 1.180.0 769.7 659.6PRIVATE 2/ 26 803.7 461.1 323.8 329.8 274.1 271.0 909.0 970.3 903.3 585.1 547.1PUBLIC 27 364.8 455.2 436.4 30t.8 431.1 426.6 367.0 334.3 276.6 184.7 112.6
CHANGE IN STOCKS 28 213.0 255.5 211.2 171.4 215.6 261.0 373.0 24.5 -136.3 24.9 76.0
GROSS DOMESTIC EXP. (GDX-C+I) 39 6,115.7 7,111.6 7,139.0 6,381.1 6,544.0 7,064.1 7,919.4 7,762.4 7.299.2 6.386.3 6.302.8
EXPORTS (GOODS b NFS) 29 937.5 823.6 709.4 574.8 .966.9 826.9 593.4 753.6 1,083.5 559.7 609.2TERNS OF TRADE ADJ (TADJ) 41 -341.3 -157.5 -154.3 -10t.8 -259.2 -143.8 - -37.4 -106.2 96.0 -80.8
EXPORTS (IMPORT CAPACITY) 55 596.2 666.0 555.2 473.0 707.7 683.1 593.4 716.2 977.3 655.7 528.4INPORTS (GOODS & NFS) 30 1,088.1 1,064.2 1,084.5 893.5 1.395.3 1,642.9 1,791.8 1.573.7 1.701.4 1.142.5 1.007.1
RESOURCE BALANCESEXPORTS - IMPORTS (RB) 53 -150.6 -240.6 -375.1 -318.7 -428.4 -816.0 -1,198.4 -820.1 -617.9 -582.8 -397.9IMP CAPACITY - IMPORTS 57 -491.9 -398.2 -529.3 -420.5 -687.6 -959.8 -1,198.4 -857.5 -724.1 -486.8 -478.7
NET FACTOR INCOME (FSY) 31 -47.7 -47.9 -40.8 -46.7 -61.2 -196.3 -260.7 -272.2 -485.5 -391.8 -418.5 oNET CURRENT TRANSFERS (NCT) 32 t40.4 161.4 176.3 162.3 182.6 278.5 311.4 362.0 409.8 352.4 263.4 0
CUR A/C BAL a EXT SAVINGS 33 *-57.9 -127.0 -239.6 -203.1 -307.0 -733.8 -1.147.7 -730.3 -693.6 -622.1 -553.0
PRODUCTGROSS DOMESTIC (GDX+RB) 34 5,965.0 6,871.1 6,763.9 6,062.4 6,115.5 6,248.2 6,721.0 6.942.3 6,681.3 5.803.5 5.904.9
GNP (GDP+FSY) 40 5,917.4 6,823.2 6,723.0 6,015.4 6,054.3 6,051.8 6,460.3 6,670.1 6,195.7 5,411.7 5,486.4GNP (GDP+FSY*NCT) 198 6,057.8 6,984.6 6.899.2 6,178.1 6.236.9 6,330.4 6,771.7 7.032.1 6.605.5 5.764.2 5.749.8
GROSS DONM SAVING(GOP-C) 63 889.6 773.6 442.0 382.5 233.0 -1.2 450.6 47t.6 319.5 307.8 257.0GROSS NAT. SAVING(GDY+FSY+NCT) 67 982.3 887.2 577.6 498.1 354.5 81.0 501.3 561.5 243.8 268.4 101.9
INCOMEGROSS DOMESTIC (GDP+TADJ) 59 5,623.8 6.713.5 6.609.5 5,960.6 5.856.2 6,104.4 6,721.0 6,904.9 6.575.0 5.899.5 5.824.1GROSS NATIONAL (GDY+FSY+NCT) 61 5,716.5 6.827.1 6.745.0 6,076.3 5.977.7 6,166.5 6.771.7 6.994.7 6,499.3 5,860.1 5,669.1
GOP DEFLATOR(198t/82"100) 42 31.0 34.1 42.6 53.7 65.0 79.7 100.0 134.6 171.7 261.0 342.0EXCHANGE RATE(USS/LSOO) 43 287.2 287.2 287.2 287.2 170.2 158.7 112.4 81.3 63.0 49.8 36.7
SOUS-CE: fAIN1STRY OF FINANCE AND ECONOMIC PLANNING & STAFF ESTIMATES.t/ SEtl1ES 1981/82-1983/84 ARE UPDATED USING NEW NATIONAL
ACCOUNTS ESTIMATED BY DEPT. OF STATtSTICS. 1i84/85 AND1985/86 ARE ESTIMATES MADE mY MINISTRY OF FINANCE ANDECONOMIC PLANNING BASED ON DEPT. OF STATISTICS FIGURES.
2/ AS FROM 1981/82 THE INVESTMENT SERIES WERE REVISED TO INCLUDEAN IMPORTANT AMOUNT OF TRADITIONAL CONSTRUCTION ANDC ID HOUSINGREPAIRS.

TABLE 5 PAGE iSUDAN: VALUE OF EXPORTS BY COMMODITY. i975/76-1985/86
(MILLION US DOLLARS)
ITEM 1975/76 1976/77 1977/78 i978/7R 1979/80 1980/81 1981/82 1982/83 1983/84 1984/85 1985/86
t * EXPORTS - VALUES * *COTTON 1 300.4 285.8 296.0 320.7 328.8 182.1 69.4 174.6 333.2 245.1 136.0
LONG STAPLE 2 261.5 222.1 230.3 207.4 202.0 126.9 48.4 112.8 191.2 154.2 88.1OTHER COTTON 3 38.9 63.7 65.7 113.3 126.8 55.1 21.0 61.8 142.1 90.9 47.9
GUM ARABIC 4 30.6 34.1 35.3 39.9 44.4 34.3 43.9 47.4 61.9 41.6 27.3SESAME 5 32.9 62.1 55.5 27.6 41.9 34.1 43.5 50.5 63.6 42.3 34.3GROUNDNUTS 6 115.6 103.4 80.2 25.6 12.9 66.2 49.0 15.9 15.4 1'.1 4.9
FOOD GRAIN 7 6.3 15.8 9.8 10.2 71.3 70.3 65.8 93.7 33.3 1.0 0.7SORGHUM a 5.1 12.9 8.6 8.8 70.3 69.8 65.0 91.0 31.1 - 0.5MILLET 9 0.2 0.8 0.2 0.2 0.6 0.2 0.6 2.7 0.4 0.5 0.1PuLSES 10 0.1 0.4 0.7 0.9 0.1 0.0 - - - - -WHEAT BRAN 1t 0.8 1.6 0.4 0.3 0.4 0.3 0.2 - 1.8 0.5 0.1
SENNA PODS & KARKADEH 12 3.0 5.8 2.6 2.7 3.8 3.2 3.4 3.9 5.6 4.7 4.4OTHER AGRICULTURE - _ 13 4.6 1.9 2.3 0.3 0.3 1.2 3.7 2.6 1.7 3.1 1.4
LIVESTOCK 1/ 14 11.4 23.8 --26.8 30.0 36.2 94.6 108.6 141.1 145.5 211.5 249.8SHEEP & LAMBS 15 0.5 7.0 11.4 17.5 20.9 81.6 96.7 119.1 108.9 134.9 103.5CATTLE 16 0.0 2.3 2.6 3.0 2.0 2.9 3.7 2.6 7.0 5.3 3.6CAMELS 17 0.8 0.6 1.0 0.6 0.2 0.2 0.8 8.8 17.3 57.1 130.4GOATS 18 - 0.3 0.4 0.1 0.0 0.1 - - - - -HIDES & SKINS 33 10.1 13.6 t1.5 8.8 13.1 9.8 7.4 10.6 12.3 14.2 12.3
SEEDS 19 5.0 5.7 3-1 4.4 6.5 6.3 14.2 16.4 11.2 12.9 21.9
OILS 20 2.9 5.5 8.6 26.6 8.6 11.8 10.9 9.1 16.7 5.2 -COTTON SEED 30 - - 0.0 - - - - - - _ _SESAME 31 0.4 0.0 2.4 1.1 2.1 0.0 0.3 2.9 2.5 1.6 -GROUNDNUT 32 2.4 5.4 6.2 25.5 6.5 11.8 10.6 6.2 14.2 3.6 -
CAKE/MEAL 21 16.2 26.3 8.8 21.1 18.6 23.0 16.4 16.3 16.7 1.5 3.2COTTON SEED 22 7.9 10.0 2.5 5.3 2.0 0.1 0.1 0.0 0.3 0.1 0.6SESAME 23 4.9 8.t 0.8 4.5 1.8 4.5 4.4 0.7 1.4 t.1 0.8

TABLE 5 PAGE 2SUDAN: VALUE OF EXPORTS CY COMMODITY. 1975/76-1985/86
(MILLICN US DOLLARS)
----------------------------------------------------------------- __----------__--------------------------______-_-__-----___-----__-
ITEM 1975/76 1976/77 1977/78 1978/79 1979/80 1980/81 1981/82 1982/83 1983/84 1984/85 1985/86
GROUNDNUT 24 3.4 8.2 5.5 11.3 14.9 18.4 11.9 15.6 15.0 0.3 1.8
OTHER EXPORTS 25 6.4 4.3 1.4 1.9 3.3 3.2 1.6 4.2 7.0 8.5 13.1
MISC EXPORTS (PRICE BASED) 34 15.5 20.6 21.0 15.8 17.4 7.i 1.6 5.4 10.5 6.9 0.2
TOTAL EXPORTS 29 550.8 595.0 551.4 526.8 593.9 537.5 432.0 581.1 722.3 595.4 497.2
EXPORT PRICE INDEX 80 87.9 100.6 t10.0 112.1 108.6 119.7 10)0.0 99.9 106.7 113.3 -
SOURCE: BANK OF SUDAN, tMF AND STAFF ESTIMATES.1/ FROM i980/81 ONWARDS INCLUDES UNRECORDED EXPORTS.
FROM 1981/82 ONWARDS GOATS ARE INCLUDED UNDER CAMELS.
TABLE SOD/3X/1

-PAGE iTABLE 6SUDAN: VOLUME OF EXPORTS BY COMMOOITY, 1975/76-1985/86
(METRIC TONS, UNLESS INDICATED)
ITEM 1975/76 1976/77 1977/78 1978/79 1979/80 1980/8t 1981/82 1982/83 1983/84 1984/85 1985/86__________________________________________________________________-_I.--------------------------------------------------------------
COTTON (THOU SALES) 41 1.147 792 749 884 969 466 260 691 1,198 846 586
LONG STAPLE 42 962 592 601 484 512 281 t57 406 623 414 240OTHER COTTON 43 185 200 148 399 456 185 1O3 285 575 432 346GUM ARABIC 44 23,834 29.595 31,559 35,400 34.861 25,518 31,343 34,6iO 46.913 35.115 19,800SESAME 45 60,413 i08.617 93,444 37.265 40.063 45,121 63,642 66.443 77.205 51.746 44.700GROUNONUTS 46 279.280 223,971 135.061 40.014 19.375 69,923 118,284 22.957 18.762 15,265 7,500FOOD GRAIN 47 54,845 134,755 193,585 65.288 351.388 327,261 263.261 389.056 196.764 3.435 3.000DURA 48 39.t17 108.583 58,246 55.521 340.829 320.360 259.785 381.216 180.725 - 3.000DUKHN 49 2,007 5,680 t,827 1,639 2,815 1,556 2,486 7.840 1,528 1,932 -PULSES 50 945 1,285 1.379 1.697 -287 0 - - - - -WHEAT BRAN 51 12,776 19.207 132,133 6,431 7.457 5.345 990 - 14.511 1,503 -SENNA PODS a KARKAOEH 52 2.485 7,491 3,428 3,113 3,687 3.604 3.611 4.221 6,526 2,836 -OTHER AGRICULTURE 53 11,083 4,218 4,913 657 820 3,404 6,522 3.982 2,143 3.368 -SHEEP & LAMBS (HEAD) 55 17,194 144,425 271,990 240,924 268.067 409.969 479,673 607,539 517,065 464,506 441.600 sCATTLE (HEAD) 56 50 10,493 10,162 10,967 6,491 9,757 10.368 7.661 11.811 10.814 -CAMELS (HEAD) 57 4,103 3.009 3,986 2,579 787 562 982 797 513 4.708 _GOATS (HEAD) 58 - 14.37t 18,515 4.152 1.330 2.219 8-2.O 7.718 6.976 4.225 -HIDES 6 SKINS 73 5.653 8.589 5,237 3.850 4.435 4.058 6.443 7.995 14.047 12,691 -
SEEDS 59 22.445 32,699 10.988 15,882 15.712 26.278 33.202 37.397 19.638 12.457 -
OILS 60 5.847 15,520 19,378 41,346 21.688 32.930 18.603 13,883 18,525 21.000 -COTTON SEED 70 - - - - - - - - - -SESAME 71 SO5 65 2.615 1.605 2.313 20 730 3.290 2.025 2.000 -GROUNDNUT 72 5.346 15,455 16,763 39,741 19.375 32.910 17.873 10.593 16.500 19,000 -
CAKE/MEAL 61 224.79 209.645 79,033 185,971 155,110 145,954 105,703 90,722 95.781 75.490 21.300COTTON 62 130.332 94,317 19.949 62.262 22,534 - 1.039 593 198 1.668 1.000 -SESAME 63 49.144 36,651 4,711 28.t18 12,423 17,169 24.346 4.157 7.099 6,499 5.000GROUNDNUTS 64 44.703 78.677 54,373 96.591 120,153 127,746 80,764 86.367 87.014 67.991 16.300
OTHER EXPORTS 65 48,799 40.092 9,569 17,294 14.427 23.562 9.394 21,019 19.261 23.786 -PETROLEUM PRODUCTS 67 220,500 302,757 240,268 204,036 95,000 192,000 94,900 77,800 40,000 - -
SOURCE: BANK OF SUDAN, FOREIGN TRADE STATISTICS

TABLE 7 PAGE iSUDAN: VALUE OF IMPORTS BY COMMODITY. 1975/76-1985/86
(MILLION US DOLLARS)
ITEM 1975/76 i976/77 1977/78 1978/79 1979/80 1980/81 1981/82 1982/83 1983/84 1984/85 1985/86
* * IMPORTS - VALUE * *
CONSUMER GOODS 125 250.7 200.4 221.4 194.5 326.4 413.6 520.8 389.0 315.5 251.2 280.0FOOD 8 BEVERAGES 141 168.3 143.6 139.6 111.8 273.1 337.6 394.7 277.4 219.2 192.1 195.1
FOOD 81 153.0 127.8 122.0 99.8 263.8 314.5 371.2 253.6 195.5 187.7 190.5RICE 82 0.3 0.3 1.1 1.5 3.5 5.4 7.1 11.8 2.3 t1.0 3.9WHEAT 83 26.4 29.3 17.5 t1.8 37.9 13.2 67.9 40.1 75.6 58.5 96.9WHEAT FLOUR 84 3.7 - 3.2 * 4.5 46.6 30.4 59.7 31.6 35.8 34.0 20.7SUGAR 85 91.0 58.6 43.6 28.0 121.5 183.6 i58.4 53.3 24.2 14.4 0.4TEA 86 11.8 t5.2 33.0 2.7.0 20.6 27.6 25.7 27.8 26.5 21.8 29.5COFFEE 87 5.2 7.8 5.7 2.5 4.0 11.3 4.6 5.0 4.8 10.3 5.9DAIRY PRODUCT 88 4.3 4.3 5.7 8.8 4.4 10.8 18.4 41.2 5.7 12.5 13.2EDIBLE OIL 133 0.3 0.9 1.1 2.0 1.5 4.6 5.8 9.7 7.2 6.3 3.9OTHER JOOD 89 6.0 7.5 6.0 9.3 18.5 21.4 16.3 26.6 7.3 9.8 7.4MISC F.DOD (PRICE-BASED) 134 4.0 4.0 4.9 4.5 5.4 6.2 7.3 6.5 6.1 9.1 8.7
BEVERAGES AND TOBACCO 90 - 15.2 15.8 17.5 12.0 9.6 23.1 23.5 23.8 23.7 4.4 4.6 -.
BEV.NON-ALC (PRICE-BSO) 135 0.3 0.3 0.6 0.8 1.2 1.0 2.1 2.2 2.0 1.5 -BEVERAGES 91 1.4 1.7 2.3 3.8 5.2 12.9 11.0 6.1 0.? - -TOBACCO 92 13.5 13.8 14.6 7.5 3.1 9.2 10.4 15.5 21.5 2.9 4.6OTHER CONSUMER GOODS 93 82.4 56.9 8t.9 82.8 53.0 76.0 126.1 1i1.6 96.3 59.1 e4.9
MED3PHARM (PRICE-BASED) 94 29.3 22.4 38.5 31.5 27.0 32.8 20.0 39.6 31.6 21.5 38.0PERFUMES & COSMETICS 95 2.3 3.2 2.9 3.0 t.2 4.8 5.6 6.2 5.2 1.2 2.7SPECIAL TEXTILE FABRICS 96 3.2 2.0 2.9 2.5 0.8 1.6 - - - - -MADE-UP TEXTILE FABRICS 97 6.0 5.7 6.6 6.5 6.0 8.0 15.4 15.1 11.1 9.8 10.3TV & RADIO (PRICE-BASED) 98 2.3 2.3 3.7 2.3 4.2 2.4 2.2 4.6 1.0 0.3 0.5DOMESTIC ELECT EQUIP 99 0.3 0.6 0.3 1.0 1.0 1.8 2.0 2.5 1.7 1.5 0.8ROAD PASSENGER CARS 100 31.3 12.9 14.1 27.0 6.2 13.4 67.9 32.7 37.3 15.8 20.4MOTORCYCLES 101 0.3 0.3 0.3 0.5 0.2 0.4 O.S 0.7 0.9 1.0 t.1BICYCLES 102 0.6 0.6 1.7 1.5 0.8 1.0 2.4 2.1 1.4 1.2 2.7FOOTWEAR 103 0.3 - 0.6 0.3 0.2 0.6 t.1 1.3 0.8 0.7 1.8PRINTED MATTER tO4 6.0 5.7 8.9 5.8 4.4 6.2 7.0 _4_6 3.9 5.0 5.4TOYS AND SPORTING GOODS 105 0.6 1.1 1.4 1.0 0.8 3.0 2.0 2.2 1.4 1.1 1.2PETROLEUM 106 87.0 1O7.7 121.5 158.5 257.7 311.2 339.0 332.8 351.0 285.8 265.5

PAUL 2TABLE 7
SUDAN: VALUE OF IMPORTS BY COMMODITY. 1975/76-1985/86(MILLION US DOLLARS)
…----------------------------------------------------------------__----------__-----------------------------------------------------ITEM 1975/76 1976/77 1977/78 1978/79 1979/80 1980/81 1981/82 1982/83 1983/84 1984/85 1985/86-------------------------------------------------------------..----...----------------------------------------------------------------
INTERMEDIATE GOODS 109 308.1 285.7 371.0 339.8 394.2 457.5 462.0 415.1 404.1 355.3 321.9
CRUDE MATERIALS itO 1.1 2.6 2.0 1.3 1.7 10.0 2S.8 i1.6 5.7 3.8 7.7FERTILIZERS *26 37.0 17.2 3.4 11.8 11.6 t1.9 20.0 30.8 29.0 33.4 48.2INSECTICIDES 127 19.5 15.2 24.7 20.5 23.5 29.2 33.7 51.6 53.3 97.0 74.3OTHER CHEMICALS 111 0.3 0.6 0.3 0.3 0.6 0.6 1.6 t.l 1.9 2.9 0.8IRON & STEEL 128 25.8 17.5 26.4 28.0 16.0 25.6 10.1 7.2 6.1 5.6 4.2METALS MANUFACTURES 129 35.3 58.9 76.4 74.3 113.8 114.4 138.6 i14.1 127.7 56.0 41.2JUTE a SACKS 130 12.3 8.3 10.3 12.8 26.2 37.4 14.7 29.0 9.6 11.7 32.7ASBESTOS CEMENT PIPES 131 24.1 14.4 19.8 26.8 20.0 28.4 15.2 13.2 16.2 14.4 9.3OTHER MANUFAC-URED GOODS 112 38.2 41.1 60.6 54.3 51.4 96.2 80.2 62.7 74.1 64.3 38.6OTHER TEXTILES 113 68.6 70.3 95.9 51.8 63.2 46.2 36.2 19.1 6.6 9.3 7.2MISC CRUDE MATERIAL 136 1.4 0.6 0.6 1.3 0.4 0.8 0.9 0.8 0.9 1.0 2.5MISC CHEMICALS (PRICE-BASED)137 29.0 27.9 36.8 42.3 58.7 45.4 64.3 49'6 50.9 37.1 38.2SCIENT INST. (PRICE-BASED) t38 tO.0 6.3 8.9 11.5 4.6 6.0 6.4 9.6 7.2 6.2 5.3MISC MFD GOODS (PRICE-BASED)139 5.2 4.9 4.9 3.3 2.5 5.4 10.3 14.7 14.9 12.6 i1.7
CAPITAL GOODS 114 416.4 391.9 474.1 423.0 360.7 357.9 432.3 397.5 299.6 222.0 187.8
MACHINERY 115 273.4 281.7 365.2 281.5 232.2 231.1 273.1 263.3 193 162.7 108.1 s
MACHINERY, ELECTRIC 116 6.3 21.0 6.6 17.5 42.2 33.6 26.3 52.8 54.0 36.8 20.9MACHINERY. NON-ELECTIRC 117 75.2 75.5 87.3 86.5 78.0 77.8 52.8 71.1 64.1 66.1 62.3MACHINERY SPARE PARTS 118 147.9 129.2 235.5 122.3 92.4 91.6 115.0 118.1 62.2 37.3 9.5TRACTORS 119 18.1 8.6 10.0 14.8 6.9 13.2 30.2 15.2 12.0 10.5 5.0TEXT MACH & PARTS 195 25.8 47.4 25.8 40.5 12.7 8.4 2.6 4.1 0.9 2.2 0.6MIS. MACHINERY 197 - - - - - 6.5 46.2 2.0 0.4 9.8 9.8
TRANSPORT EQUIPMENT t20 143.0 110.3 108.8 14t.5 128.6 126.8 159.2 134.2 106.0 59.3 79.7
TRUCKS 132 54.8 31.6 26.1 32.3 32:7 26.1 70.4 63.7 42.5 23.1 32.2AIR & RAIL EQUIP 121 21.5 8.3 10.9 , 5.8 6.0 4.2 11.4 20.0 24.0 7.8 7.1TIRES & TUBES 122 10.3 15.5 21.8 24.5 21.6 20.8 11.2 4.7 2.8 2.4 3.6SPARE PARTSAUTO (PRICE-BASED) 123 41.1 39.1 44.2 72.8 67.0 70.5 55.2 38.9 33.1 18.4 19.4LOCOMOTIVE (PRICE-BASED)140 8.6 10.0 2.9 4.8 0.8 2.8 9.0 3.6 2.7 6.0 14.5AIRCRAFT (PRICE-BASED) 194 6.6 5.7 2.9 1.5 0.4 2.4 2.0 3.1 Q02 0.8 2.5
OTHERS 298 - - - - - - - 0.2 0.7 0.8 0.4TOTAL IMPORTS 124 1.062.1 985.8 1,187.9 1,115.8 i.339.1 1,540.2 1.754.1 1.534.4 1;370.2 1.114.3 1.055.2

TABLE 7 PAGE 3SUDAN: VALUE OF IMPORTS BY COMMODITY. 1975/76-1985/86
(MILLION US DOLLARS)
ITEM 1975/76 1976/77 1977/78 i978/79 1979/80 1980/81 1981/82 1982/83 1983/84 1984/85 1985/86
* * PRICE INDICES - DERIVED *
CONSUMER GOODS 201 80.6 62.3 61.0 66.7 67.2 107.1 100.0 68.3 87.5 93.7 -FOOD & BEVERAGES 200 76.8 59.0 52.1 54.9 63.9 116.0 100.0 66.6 87.5 91.6 -
FOOD 202 74.3 55.3 48.3 52.0 64.1 115.6 100.0 65.0 80.8 89.2 -BEVERAGES & TOB 203 117.2 126.5 116.7 100.8 58.5 t22.0 100.0 89.1 298.0 290.2 -
OTHER CONSUMER GOODS 204 89.6 72.4 86.0 94.3 91.9 80.0 100.0 73.2 87.6 101.8PETROLEUM 205 28.7 33.9 29.7 40.3 61.3 62.9 100.0 94.2 95.5 192.9 -INTERMEOIATE GOODS 206 58.2 71.4 83.2. 82.4 97.6 100.2 100.0 108.8 84.9 t06.2 -CAPITAL GOODS 207- 68.7 74.5 66.2 103.2 88.8 106.2 100.0 94.4 67.1 72.8 -
MACHINERY,_ 208 69.7 85.3 84.5 121.9 97.0 110.5 1oo.0 106.6 107.6 67.3 -IRANSPORT EQUIPMENT 209 66.7 56.4 38.4 79.2 77.1 99.2 100.0 77 0 40.3 87.4 -
TOTAL IMPORTS 210 60.1 63.0 61.5 74.0 78.0 92.0 100.0 88.9 83.2 106.7
MEMO ITEMMUV INDEX 237 65.2 71.6 82.5 93.5 102.5 103.1 100.0 98.8 97.0 96.5 -
SOURCE: BANK OF SUDAN. IMF AND STAFF ESTIMATES.

TABLE 8 PAGE 1SUDAN: VOLUME OF IMPORTS BY COMMODITY. 1975/76-1985/86
(THOUSAND METRIC TONS, UNLESS INDICATED)
ITEM 1975/76 1976/77 1977/78 1978/79 1979/80 1980/81 1981/82 1982/83 1983/84 1984/85 1985/86
RICE 142 1.0 1.1 3.1 3.5 8.1 10.5 14.9 33.4 5.8 20.5 7.4WHEAT 143 134.3 164.7 123.6 83.7 171.1 59.9 286.6 21t.8 219.8 97.0 104.1WHEAT FLOUR 144 15.4 - 22.0 24.5 194.5 99.0 181.0 153.3 1t8.9 191.3 84.7SUGAR t45 136.1 153.7 171.3 113.2 294.5 187.7 201.6 137.0 78.3 44.0 1.9TEA 146 11.6 14.1 18.5 14.6 9.9 11.8 10.8 13.2 12.8 11.9 14.4COFFEE 147 4.7 4.3 4.4 4.5 1.7 2 7 1.9 2.8 2.9 7.1 3.8DAIRY PRODUCT 148 3.2 3.3 3.8 4.9 4.4 4.8 8.7 16.7 3.4 10.0 -EDIBLE OIL 193 0.6 1.2 1.1 1.6 4.2 i.2 2.4 19.2 14.3 25.1 16.1OTHER FOOD 149 11.5 15.2 12.1 11.6 25.6 25.5 19.8 32.5 10..4 13.0 9.0
BEVERAGES.ALC. (THS OF LTRS) 151 558.2 7975_---,423.7 1.850.1 5,277.8 9,559.4 9.317.8 6,270.5 69.8 -TOBACCO -152 1.6 1.5 1.7 1.2 1.2 0.9 1.4 2.3 0.8 0.3 -
PERFUMES & COSMETICS 155 0.5 0.9 0.7 0.6 0.5 1.2 3.7 1.9 t.5 0.3 1.0SPECIAL TEXTILE FABRICS 156 1.9 1.0 1.8 1.4 0.7 0.6 0.9 0.2 - - -MADE-UP TEXTILE FABRICS 157 1.6 1.8 2.1 2.2 2.7 2.7 4.2 5.8 4.2 3.1 1.9DOMESTIC ELECT EQUIP(NO.THS) 159 0.3 0.8 0.3 0.8 1.0 1.4 1.9 5.3 3.0 0.8 0.7 1ROAD PASSENGER CARS(NO.THS) 160 2.5 2.5 2.7 3.2 0.8 1.9 9.4 8.0 3.5 2.6 3.2MOTORCYCLES (NO.THS) 161 O.1 0.2 0.2 0.4 0.9 0.8 0.9 1.3 1.1 1.3 1.0BICYCLES (NO.THS) 162 8.9 8.2 14.3 22.2 8.1 10.5 12.4 14.0 9.1 9.2 10.6FOOTWEAR (THS OF PAIRS) 163 1.2 - 68.7 38.7 44.0 399.1 143.4 t28.0 123.9 162.1 262.9PRINTED MATTER 164 4.5 3.8 2.6 3.3 1.3 6.0 2.4 1.6 1.2 1.0 2.4TOYS & SPORTING GOODS 165 0.3 0.5 0.5 0.4 0.4 1.7 0.5 0.6 0.6 0.4 0.5
PETROLEUM 166 945.9 993.7 1,275.7 1.229.5 1.314t2 1.546.3 1,152.1 1.142.2 1.167.0 531.1 449.7
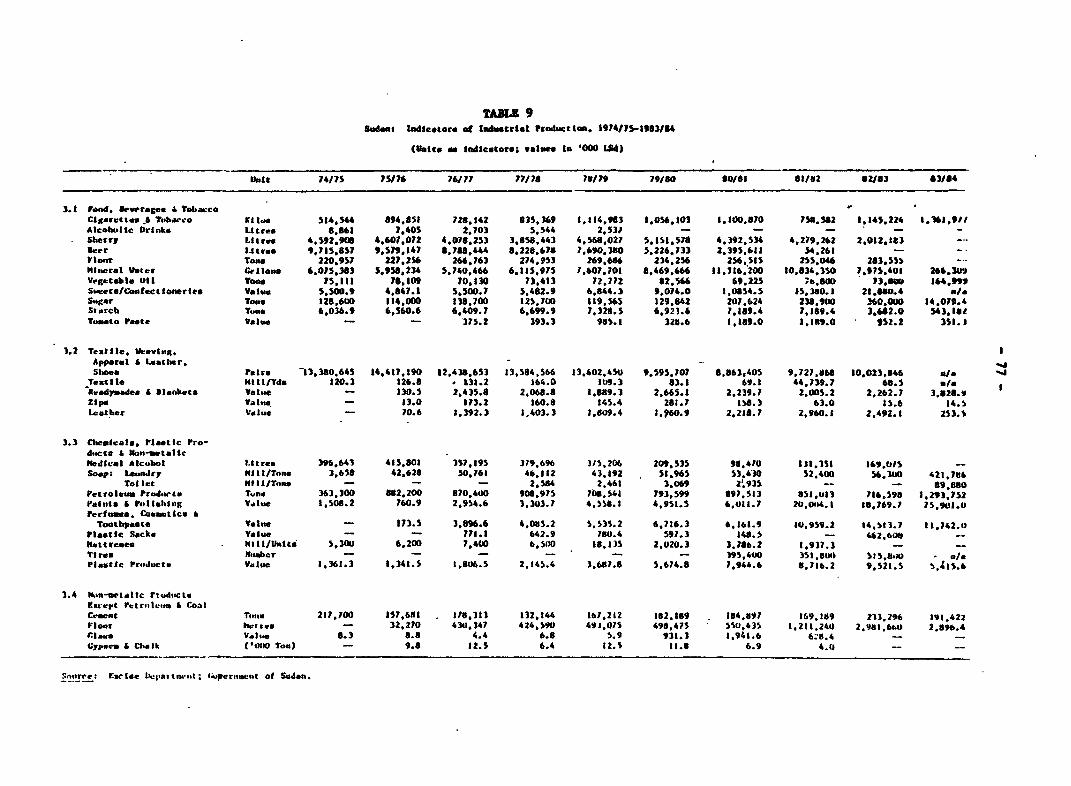
TABLE9Sotlai Zadleator. ot Imdetriel Productleo. 1974/7S-1983J5
(Voitce tndlcetore; values In o000 LSd)
Wimit ?4/7S 75/76 76/71 77/78 7/79 79/60 "O/BR SI/82 62/83 83/84
3.1 Po".o frverages 4 TobaccoClgarettes.4 Tabar.o Klten 514,544 894.858 t28,142 835,369 1,114.9813 1.056.103 8,800,670 758,582 1,145,224 161,91/Alctwotthc Orink Lttres 8.861 7.40S 2t703 5,544 2,531 -Sherry l.larec 4,S92,9W8 4.601.072 4.078,253 31858.443 4.568,027 5,ISI578 4.392,534 4.279.262 2,012,tt3seer Lttre. 9,715,857 9,5798147 8,788,444 8,228,678 7.490.380 5.226.733 2,395.611 54.261 -Flour tons 220.957 227.256 266,163 274,953 2696886 234.256 256.51S 255,044 283.555-"lloeral Water CrIlone 6.0t5,38t3 5,958,234 S.740,466 6.115,975 1,O07.,01 8,469.664 3,J316,200 10.8t34.350 7,9t5.401 266.319vegotsble 0o1 To" 75,111 76,I09 70,130 73,413 72.712 82.S66 69.225 e,800 73,11V 164.99Suet.e/Contectionerlea Vatue S500.9 4,841.1 5,500.7 5,482.9 6,84.3 9,014.0 1,0854.5 15,380.1 21,880.4 a/aSugar Toots 128600 1;4.000 138,700 32S.700 119,56S 129,842 207,624 238,900 310,"0o 14,079.4Starch Tons 6,036.4 6,560.6 6,409.7 6,699.9 7,326.S 6,923.6 7,389.4 7,189.4 3,"2.0 543,161Tomto paste Ve5 - - 3t.2 393.3 965.1 328.6 1,189.0 1,1t9.0 952.2 3SI.1
1.2 Teatile, timvng. IApparel 4 Leather, --
Shote Pairs -13,380,645 14,417,190 12,438.653 13,584,566 13.602.45S 9.595,707 8.,63,405 9,727,868 10.023,846 n/aTextile killtda 320.3 126.8 .131.2 164.0 809.3 83.1 69.1 44,t39.7 68.5 n/t Iweadyfmae. 4 blankets Value - 130.5 2,435.8 2,068.8 1,8f9.3 2,665.1 2,239.7 2,005.2 2,262.7 3,828.9ZIpS Valst 13.0 173.2 160.8 145.4 281.7 I88.3 63.0 15.6 14.5leather Value - 70.6 1,392.3 1,403.3 1,809.4 1.60.9 2,218.7 2,960.1 2,492.1 2S3.L
3.3 Chemical., 8laotic Pro-ducts 6 Son met*ltcMedical Alcohol litrea 396,641 415,801 357,195 379.696 315,206 209,535 98,410 1838,53 I6I9,0S --Soap: Laundry "I A /Tona 3,658 42.628 50,761 46,112 43,192 51,965 53.430 52,400 56.300 421.766Tolilet 831lltTon - - 2t,584 2,461 3,069 2.931 - - S9,68OPettoleum Prodoorta Tuna 363,300 882,200 870,400 908,975 703,541 793,599 897,513 851.013 716,598 1.293,752Palatte 6 Pollahiog Value 1,508.2 760.9 2,954.6 3,303.7 4,558.1 4,951.5 6,011.7 20,04.31 188,69.7 75,9a1.0Perfume, Cosmetice &
Toothp;ste Valu*e 173.5 3,896.6 4,085.2 5.5)5.2 6,716.3 6,161.9 10,95S.2 14,511.7 31,742.0Pl-atic Sacks Value _- 77_.1 642.9 780.4 591.3 148.5 - 462,600tlttreaes 38111/lJntt 5,300 6.200 7,400 6,5180 18,835 2,020.3 3,788.2 1,937.3 _ __Tire$ nMbcr - - - - - - 35,4twJ 3518180 515.8x) ataPlastic Praolucts Value 1,361.3 1,341.5 1,606.5 2,145.4 3,687.8 5,674.8 7,944.0 8.71b.2 9,5l2.S 5.435.6
3.4 Iuuutallc Pl'uductsltCrpt Petfr.le.m * Coal
Cement Tons 217,700 157,681 116,311 132,344 181,2i2 162,169 184.897 169,189 213,W6 191842ZFloor het.re. - 32,V20 430,347 424,590 49J,01S 498,475 550,435 1,21t,240 2,9tt,6br.0 2,698.4:lass YnvAl, 8.3 8.8 4.4 6.6 5.9 931.1 1,941.6 6.8.4 -- --Cypuem & Chllk ('IOK) Ton) - 9.8 12.S 6.4 12.S 31.8 6.9 4.0
50.rce: 8selae '..l.apnati t; Wperitse.t of Su4an.

TABLE 10 PAGE 1SUDAN: CENTRAL GOVERNMENT OPERATIONS (ACTUALS). 1975/76-1985/86
(LS MILLIONS)
…__ _ _ _ _ _ _ _ _ _ _ _ _ _ _ _ _ _ _ _ _ _ _ _ _ _ _ _ _ _ _ _ _ _ _ _ _ _ _ _ _ _ _ _ _ _ _ _ _ _ _ _ _ _ _ _ _ _ _ _ _ _ _ _ _ _ _ _ _ _ _ _ _ _ _ _ _ _ _ _ _ _ _ _ _ _ _ _ _ _ _ _ _ _ _ _ _ _ _ _ _ _ _ _ _ _ _ _ _ _ _ _ _ _ _ _ _ _ _ _ - - _ _ _ _- - _ITEM 1975/76 1976/77 1977/78 1978/19 1979/80 1980/81 1981/82 1982/83 1983/84 1984/85 1985/86
-- _---------------------------------------------------------..--------------..---.-----------------------.-------------___.__________
EVENUES 42 323.2 384.5 459.t 505.1 587.4 734.4 895.1 1.271.7 1.474.4 1.485.5 1,790.4TAX REVENUES 68 273.7 310.6 360.9 414.8 471.7 593.9 745.7 1.080.2 1.246.8 1.285.2 1.585.9NON-TAX REVENUES 69 49.5 73.9 98.2 90.3 115.7 140.5 149.4 191.5 227.6 200.3 204.5
URRENT EXPENDITURES 1/ 70 283.5 332.4 423.2 647.0 723.9 1.050.4 1.348.0 1,563.2 1.986.1 3.333.3 4.072.9
CURRENT BALANCE 79 39.7 52.1 35.9 -141.9 -136.5 -316.0 -452.9 -291.5 -511.7 -1.847.8 -2.282.5
EVELOPMENT EXPENDITURES 80 113.0 155.4 185.8 164.6 221.3 290.5 314.8 414.0 463.3 471.8 369.iAGRICULTURE 81 31.4 42.1 43.2 55.4 46.9 59.7 59.6 126.9 125.2 117.9 -INDUSTRY 82 35.7 32.1 39.0 33.5 37.9 32.0 88.9 71.7 122.1 104.7 -TRANSPORT & COMMUNICATION 83 27.9- 39.0 55.0 26.2 33.7 39.6 44.3 77.7 51.1 41.2 -SERVICES 84 9.7 1t.0 15.9 - - - - - 49.9 41.2 -OTHER 85 8.3 25.2 32.7 49.5 102.8 159.2 122.0 137.7 115.0 166.8 -
QUITY EXPENDITURE 1SO - - - - 30.0 49.3 31.9 31.4 80.0 45.0 69.5
OTAL EXPENDITURES 142 396.5 487.8 609.0 811.6 975.2 1.390.2 1.694.7 2.008.6 2.529.4 3.850.t 4.511.5
VERALL 8ALANCE 87 -73.3 -103.3 -149.9 -306.5 -387.8 -655.8 -799.6 -736.9 -1,055.0 -2.364.6 -2.721.1============5==s============= ======== ======== ===== ===== z=======
XTERNAL FINANCING 175 74.7 40.0 28.2 146.4 237.6 366.5 766.6 663.0 829.0 1.690.8 1.907.8…_ _ _ _ _ _ _ - - - - - - - - - - - - - - - - - - - - - - - - - - - - - - - - - - - - - - - - - - - - - - - - _ _ _ _ _ _ _ - - - - - - - - - - - - - - - -
LOANS (MLT) 89 64.8 34.7 21.8 146.4 237.6 -304.7 -209.1 -190.9 -500.6 -705.6 -1,279.8DISBURSEMENT 90 84.5 53.5 49.7 146.4 237.6 174.4 184.8 21O.0 204.0 221.0 371.3AMORTIZATION 1/ 118 19.7 18.8 27.9 - - 479.1 393.9 400.9 704.6 926.6 1.651.1
CASH & COMM. OPS. 34 9.9 5.3 6.4 - - - - - 450.0 648.7 841.9DEBT RELIEF 2/ 122 - - - - - 671.2 975.7 853.9 879.6 1.747.7 2.345.7
ENTRAL BANK FIN. (NET) 151 25.9 95.5 173.0 149.8 143.2 289.3 33.0 43.9 216.0 673.8 813.3-_ _ _ _ _ _ _ - - - - - - - - _ _ _ _ _ _ _ - - - - - - - - - - - - - - - - - - - - - - - - - - - - - - - -_ _ _ _ _ _ - - - - - - - -
ON-BANK FIN. (NET) 108 -27.3 -32.2 -51.3 10.3 7.0 0.0 - 30.0 10.0 --_ _ _ _ _ _ _ - - - - - - - - - - - - - - - - - - - - - - - - - - - - - - - - _ _ _ _ _ __ - - - - - - - - - - - - - - - -_ _ _ _ - - - - - - - -
ROSS DOMESTIC PRODtlCT 110 1,848.0 2,339.6 2.882.7 3.253.7 3.972.0 4.979.8 6,721.0 9.344.3 11.471.7 14.920.1 21,357.1________ - - - - - - - - - - - - - - - - - - - - - - - - - - - - - - - - - - - - - - - - - - - - - - - - - - - - - - - - - - - - - - - - - - - - - - - -______....... _

PAGE 2TABLE 10SUDAN: CENTRAL GOVERNMENT OPERATIONS (ACTUALS), 1975/76-1985/86
(LS MILLIONS)
ITEM f975/76 1976/77 i977/78 1978/79 1979/80 1980/81 1981/82 1982/83 1983/84 1984/85 1985/86
AEMO::'UBLIC SECTOR DEVELOPMENT EXP 172 145.9 176.9 200.6 187.2 251.2 358.9 404.6 475.4 533.8 558.13AID INTERST 123 - - - - - - - 152.0 100.0 197.0'AID AMORTIZATION 124 - - - _ _ _ - 21.0 17.9 268.4
1/FOR YEARS 1980/81-1985/86 FIGURES REPRESENT ACCRUED-PAYMENTS.FOR EARLIER YEARS,FtGURES ARE ON CASH BASIS.
2/ DEBT RELIEF PLUS ARREARS ACCUMULATION.SOURCE: AUDITOR GENERAL AND MINISTRY OF FINANCE. DIRECTOR OF ACCOUNTS.

T"LE> 11 PAGE 1SUDAN: CENTRAL GOVERNMENT REVENUES (ACTUALS). 1975/76-1985/86
(LS MILLIONS)
-------------------------------------------------------------- __-------------__-----------------------------------------------------
ITEN 1975/76 1976/77 1977/78 1978/71 1979/80 1980/8 1981/82 1982/83 1983/84 1984/85 1985/86.___________________________________________________________________________________________________________________________________
TAX REVENUES
IIRECT TAXATION t 32.2 41.7 48.2 56.0 82.9 113.7 143.8 203.1 258.9 300.5 351.6
BUSINESS PROFIT TAX 2 24.3 30.9 35.5 41.7 44.8 62.9 79.5 122.7 178.0 226.7 262.9'ERSONAL INCOME TAX 3 7.6 9.2 11.2 13.0 38.1 47.2 '51.5 56.3 48.4 26.3 25.7DEVELOPMENT TAX ON BUSINESS 4 - 1.1 0.7 0.2 - - - - - - -PROFITS & RENTAL INCOME TAX 5 0.2 0.4 0.6 0.7 - - - - -CAPITAL GAINS TAX 6 0.1 0.1 0.2 0.4 - - - - - - -OTHER I/ 43 - - - - - 3.6 12.8 24.1 32.5 47.5 63.0
[NDIRECT TAXATION - 8 241.5 268.9 312.7 358.8 388.8 480.2 601.9 877.1 987.9 984.7 1.234.3
rAXES ON FOREIS TRADE 136 t71.6 .170.8 219.8 267.1 264.4 - 345.5 445.4 679.7 722.1 796.0 917.0
IMPORT DUTIES 9 15S.6 150.0 197.0 241.5 241.5 303.8 414.2 657.7 698.3 776.9 883.4CUSTOMS DUTtES 44 92.4 92.3 127.5 132.8 185.4 236.9 274.4 359.8 353.3 742.4 883.4OTHER IMPORT CHARGES 45 63.2 57.7 69.5 108.7 56.1 66.9 139.8 297.9 345.0 34.5 -ADDITIONAL TAX 46 47.0 31.0 32.0 67.0 - - 47.7 151.3 179.0 - -DEV. TAX ON IMPORTS 47 7.2 13.7 20.8 21.8 7.8 - - - - - -DEFENSE TAX 48 - - - 2.4 28.8 43.2 65.3 121.4 148.6 32.8 _OTHER 49 9.0 13.0 16.7 17.5 19.5 23.7 26.8 25.2 17.4 i.7
EXPORT DUTIES 11 16.0 20.8 22.8 25.6 22.9 41.7 31.2 22.0 23.8 i9.1 33.6EXPORT DUTY 50 11.0 11.8 12.3 13.7 9.7 41.7 23.2 13.0 10.0 19.1 33.6EXPORT ROYALTY 51 1.1 0.8 1.0 1.2 - - - - - - -DEV. TAX ON EXPORTS 52 3.9 8.2 9.5 10.7 13.2 - 8.0 9.0 13.8 - -
'AXES ON DOMESTIC TRADE 137 67.7 96.0 90.4 88.4 122.6 130.4 148.9 184.3 251.3 160.8 281.1
CONSUMPTION DUTIES 10 - - - - - - - - - 108.0 281.1EXCISE DUTIES 13 37.0 43.6 48.2 58.4 59.7 62.8 60.9 88.9 112.1 22.2 -
DEVELOPMENT TAX - DON. MFG. 14 3.4 6.9 1O.1 14.0 15.6 36.9 27.5 35.9 47.4 12.3STABILIZATIOW FUND EXCISES 64 2,6 4.5 5.8 13.0 21.1 30.7 60.5 59.5 91.8 18.3SUGAR MONOPOLY PROFITS 26 24.7 41.0 26.3 3.0 26.2 - - - - - -
'TAMP AND OY..ER TAXES 2/ 36 2.2 2.1 2.5 3.3 1.8 4.3 7.6 13.1 14.5 27.9 36.2
OTAL TAXES s8 273.7 310.6 36Q.9 414.8 471.7 593.9 745.7 1.080.2 1.246.8 1.285.2 1.585.9
NON-TAX REVENUES
,ENSION CONTRIBUTION 40 2.0 3.3 3.8 9.2 13.9 21.0 24.4 31.0 43.0 39.2 27.9

TABULE i PAGE 2
SUDAN: CENTRAL GOVERNMENT REVENUES (ACTUALS). 1975/76-t985/86(LS NILLIONS)
ITEM 1975/76 1976/77 1977/78 1978/72 1979/80 1980/8t t981/82 1982/83 1983/84 1984/85 t985/86
FEES a CHARGES 18 17.4 22.6 32.7 18.7 36.8 53.3 75.9 102.2 107.0 94.9 123.6RENTS FROM GOVT LANDS & BLDGS 24 0.2 0.3 1.4 0.4 - - - - - - -PROFITS FROM GOVT. ENTERPRISE 25 8.7 15.7 31.3 32.6 27.5 30.7 26.9 35.8 45.2 13.5 14.9OTHER -
INTEREST EARNED. 37 2.1 2.3 2.5 6.7 9.3 20.1 6.0 11.5 22.8 19.9 5.1-REIMBURSEMENT & tNTER-DEPTSERVICES 38 tt.0 12.2 11.5 5.9 5.5 - - - - - -UNCLASSIFIED REVENUE 39 8.1 17.3 14.8. 16.2 18.1 3.7 15.5 0.7 6.3 28.2 23.2SALES OF GOVT PROPERTY 41 - 0.2 0.2 0.6 4.6 t1.7 0.7 10.3 3.3 4.6 9.8
LOCAL COUNTERPART FOR COM-MODITY S PRICE DIFF. 34 9.9 5.3 6.4 - - - - - 450.0 648.7 841.9
TOTAL NON-TAX REVENUE 69 49.5 73.9 98.2 90.3 115.7 140.5 149.4 191.5 227.6 200.3 204.5 1(UNADJUSTED) /A 97 59.4 79.2 104.6 90.3 115.7 140.5 149.4 191.5 227.6 200.3 204.5 o
TOTAL REVENUE 42 323.2 384.5 459.1 505.1 587.4 734.4 895.1 1.271.7 1.474.4 1,485.5 1.790.4snns.u msnnn nnnmn .. nS '00sn-u f....=..a onss a. . .. =-..... *....at GSS. *- *=-*- ..(UNADJUSTED) /A i34 333.1 389.8 465.5 505.t 587.4 734.4 895.1 1,271.7 1,474.4 1,485.5 i.790.4
SOURCE: AUDITOR GENERAL AND MINISTRY OF FINANCE.DIRECTOR OF ACCOUNTS.
1/ INCLUDES TAXES ON SUDANESE WORKING ABROAD.2/ FOR 1985/86 INCLUDES MEASURES ANNOUNCED BY THE GOVERNMENT AT
THE END OF JANUARY 1986 AND ALSO INCREASED REVENUES FROM THECHANGES IN PRICING OF PETROLEUM AND SUGAR.
/A UNADJUSTED FIGURES REFLECT NORMAL GOVERNMENT PRESENTATION.: ADJUSTMENTS INVOLVE EXCL"SION OF CASH AND COMMODITY LOAN COUNTERPARTFUNDS FROM REVENUES AND LOAN AMORTIZATION FROM CURRENT EXPENDITURES.

TABLE 12 PAGE ISUDAN: CENTRAL GOVERNMENT EXPENSES, 1975/76-1985/86
(MILLIONS OF SUDANESE POUNDS)
ITEM 1975/76 1976/77 1977/78 1978/79 1979/80 1980/81 1981/82 1982/83 1983/84 1984/85 1985/86
CURRENT EXPENDITURES 70 283.5 332.4 423.2 647.0 723.9 1,050.4 1,348.0 1,563.2 1,986.1 3,333.3 4,072.9
ECONOMIC & SOCIAL SERVICES 71 69.0 83.8 92.4 81.5 101.6 173.7 183.9 213.5 22t.9 187.7 228 5AGRICULTURE/NAT. RES. 72 tO.3 9.0 5.9 6.9 8.2 9.7 10.6 14-6 15.6 15.0 16.5LIVESTOCK 73 2.6 2.5 2.8 2.9 3.3 4.4 5.3 8.4 8.2 8.8 9.4IRRIGATION/HYDRO-POWER .74 7.5 7.8 9.2 12.0 15.2 18.8 21.9 27.9 39.1 35.0 41.2COMMERCE 75 1.9 2.6 2.7 0.6 0.6 0.8 1.0 1.4 1.6 1.4 1.8INDUSTRY & MINING 76 1.3 5.7 5.5 0.9 0.9 0.9 1.5 1.9 2.2 2.1 2.5TRANSPORT & TELECOM 77 10.2 10.8 t1.6 3.8 4.8 4.0 6.3 7.4 8.3 8.0 9.3CONSTRUCTION 78 1.0 1.6 1.9 3.0 2.6 3.3 4.2 6.3 5.4 5.3 6.4EDUCATION 112 10.0 9.7 6.8 7.1 9.0 1t.9 13.8 20.6 21.5 22.5 23.6HEALTH 113 6.4 7.4 9.4 9.4 9.1 9.8 14.9 29.6 36.0 37.5 40.0OTHER 114 17.8 26.7 36.6 34.9 47.9 1tO.1 1O4.4 95.4 84.0 52.1 77.8
INTEREST EXPENDITURE 115 17.8 18.2 53.4 31.6 48.0 193.2 281.4 324.0 374.4 939.0 1.173.8INTEREST - FOREIGN t/ 116 12.5 8.2 38.4 17.4 21.3 175.6 262.5 299.0 348.0 939.0 t.,60.0INTEREST - LOCAL 117 5.3 1O.0 15.0 14.2 26.7 17.6 18.9 25.0 26.4 - 13.8
-)
ARMED & POLICE FORCES 2/ 119 45.5 67.2 80.9 75.6 107.4 125.1 113.9 164.0 300.0 462.0 473.1 1
OTHER 120 151.2 163.2 196.5 383.6 405.2 332.2 386.1 406.4 446.1 503.4 717.7PAYMENTS TO INSTITUTIONS 105 77.7 75.7 91.2 252.4 196.1 68.5 89.4 105.6 124.1 142.9 160.0TRANSFERS TO REGIONS 121 73.5 87.5 105.3 131.2 209.1 263.7 296.7 300.8 322.0 360.5 557.7
OTHER EXPENDITURE 3/ 88 - - - 74.7 61.7 114.5 127.7 189.6 207.9 281.1 884.1
UNIDENTIFIED EXPENDITURE 4/ 173 - - - - - 111.7 255.0 265.7 435.8 762.1 429.2
EMERGENCY FOOD DISTRIBUTION 180 - - - 92.0 90.9
DEVALUATION COMPENSATION 181 - - - - - - 106.0 75.6
EOUITY EXPENDITURE 150 - - - - 30.0 49.3 31.9 31.4 80.0 45.0 69.5

TABLE 12 PAGE 2SUDAN: CENTRAL GOVERNMENT EXPENSES. 1975/76-1985/86
(MILLIONS OF SUDANESE POUNDS)
IIEL 1975/76 1976/77 1071/78 1978/g9 1979/80 1980/81 198J1/82 1J82/83 1963/84 1984/8b 1985/86
DEVELOPMENT EXPENDItURE 5/ 80 113.0 155.4 185.8 164.6 22i.3 290.5 314.8 414.0 463.3 471.8 369.1
FOREIGN. 168 1t3.0 155.4 t85.8 164.6 22i.3 174.4 184.8 210.0 204.0 22t.0 t66.0LOCAL 169 - - - - - 116.1 130.0 204.0 259.3 250.8 203.1
AGRICULTURE 81 31.4 42.1 43.2 55.4 46.9 59.7 59.6 126.9 125.2 117.9 -INDUSTRY 82 35.7 32.1 39.0 33.5 37.9 32.0 88.9 71.7 t22.1 -104.7 -TRANSPORT & COMMUNICATION 83 27.9 39.0 55.0 26.2 33.7 39.6 44.3 77.7 5:.1 41.2 -SERVICES 84 9.7 17.0 15.9 - - - - - 49.9 41.2 -OTHER 85 8.3 25.2 32.7 49.5 102.8 159.2 122.0 137.7 115.0 166.8 -
TOTAL EXPENDITURE 6/ 142 396.5 487.8 609.0 811.6 975.2 1.390.2 1,694.7 2.008.6 2.529.4 3.850.1 4.511.5_=-=:1 = =t= = 2 == == S= = n=zt== =_= = == == = = … == == == 5 = =c= = = = =======================
SOURCE: AUDITOR GENERAL AND PIRECTOR OF ACCOUNTS. MINISTRY OF FINANCE 0t/ DATA FOR ALL YEARS ARE G.1 A CASH BASIS. I.E. FOREIGN INTEREST
ACTUALLY PAID EXCEPT FOR 'EARS 1980/81 THROUGH 1985/86THAT ARE BASED ON OBLIGA;IONS FALLING CUE.
2/ EXCLUDING FOREIGN FINANCED DEFENCE EXPENDITURE.3/ INCLUDES LSD 136 MILLION FOR PAY AWARD AND LSO 280 MILLION
RESERVES IN 1985/86.A/ REFLECTS DEFENCE EXPENDITURE. REGIONAL EXPENDITURE. CUSTOM DUTIES
UNCOLLECTED FROM PUBLIC ENTERPRISES. PALACE EXPENDITURES. ETC.5/ INCLUDES CENTRAL GOVERNMENT CONTRIBUTIONS TO CAPITAL BUDGETS OI
SELF-FINANCED UNITS.6/ t985/86 DATA ARE REVISED BUDGET ESTIMATES.

84~~~~~~~~~~~~~
- 84 -
TABLE 13
SUDAN: NONETARY SURVEY 1983 - 1986
fIN LS MILLION)
June June I/June Dec. June Dec. gOld) (Ntv) Sept. Dec. June It eot.-
1983 194*198) 1986
Foreign es eta (net) -2,497.9 -2,386.4 -2,416.8 -2,365.9 -3,.66.0 *3.569.9 -3,549.0 -3.572.0 -3,918.1 .4,192.2bank of Sudan (-2,17e.5) (-2,766.4) (-2,801.4) (-2,854.6) (-4,556.3) (-4,56.3) (-6,665.2) (-4.578.3) %-4,520.0i (-4.957.6)Coumerci4l banks (280.6) (380.0) (390.6) (488.7) (900.4) (966.4) (1,096.2) (1,006,3) (861.9) (165.')
RescheduliAg adjustm6nt 566.3 S75.8 575.8 575.8 743.0 743.0 743.0 743.0 743.0 743.0-Valuation adjustment ) 1.532.3 1,532.3 1,532.3 1,532.3 2,744.2 2,744.2 2,852.8 2909.2 3,039.9 3,089.d
ForeLgn assets (net)tlci. adjustments -399.3 -278.3 -308.7 -257.8 -166.7 -82.7 46.7 80.2 -155.2 -359.4
Net domestic aosett 3,096.8 3,388.7 3,570.4 3,976.8 4.9S0.0 5,263.3 5,661.3 6.027,9 6.996.7 7,763.6
Clatos on Governaent(net) (1,552.4) (1.679.0) (1,748.7) (2,024.5) .Z,441.4) (2.447.4) (2,413.2) (2,729.3) (3,366.3) (3,640-8)
Sank of Sudan (',485.71 11,631.41 11,695.61 11,985.01 12,521.11 12,521.11 12,$36.61 12,893.91 (3.806.51 (4.099.01Comerc&al backs (66.71 147.61 153.11 139.51 (-73.71 (-13.11i 163.41 1-164.61 t-442.21 1-4a8.21
Claims on publicentitLes (397.8) (472.9) (495.0) (582.2) (640.3) (640.3) (972.4) (1,146.7) (1,188.8) (1,572.5)
Claim en privet*sector (1,271.2) (1,376.9) (1,309*.) (1,409.2) C1,105.9)_.(1.82Y.9) (1,773.1) (1,S82.2) (2,317.5) (2.259.5)
Claims on spectalisedbanks (30.6) (45.0) t51.60 (56.5) (66.6) (66.6) (71.6) (71.6) (79.3) (79.3)
Other items (net) (-155.2) (-585.1) (-234.0) (-295.6) (9.4) (281.1) (371.0) (198.1) (44.9) (211.4)
Total assets -total ltibtiitles 2,697.5 3,110.4 3,261,2 3,719.0 4,181.3 5,180.6 S.708.0 6,108.1 6,841.5 7.404.2
Money and quast-money 2,697.5 3,110.4 3,26.'1. 3,719.0 4,181.3 c S, 180. 5,708.0 6;108.1 ,l : 7,404.2Currency outside banks (926.3) (1.022.2) (1,170.2) (3.247.2) (1,451.5) (tt 5) (t,620.3) (1.930.4) t2.300.1) (2,422.2)Otuand deposits (1,114.4) (1,313.9) (1,281.3) (1,511.0) (2,233.4) (1,854.3) (2,056.6) (2.214.2) (Z,672.5) (2,993.1)Tim., savings and
forelgacurrency deposits (656.8) (774.3) (810.2) (954,) (1,096.4) (1,874-9) (2.031-1) (1,963.5) 't1.868.9) (1.988.9)
SOURCE: Bank of Sudan and IMF.1/ areak in sertes due to revision of comm4 ctal bank data.TI Het claims on Coverneent by coerleal banks have been teduced by LSd 105 million to teflect a large Item In tranelt. Other
it7em (net) have been correspondingol increased.
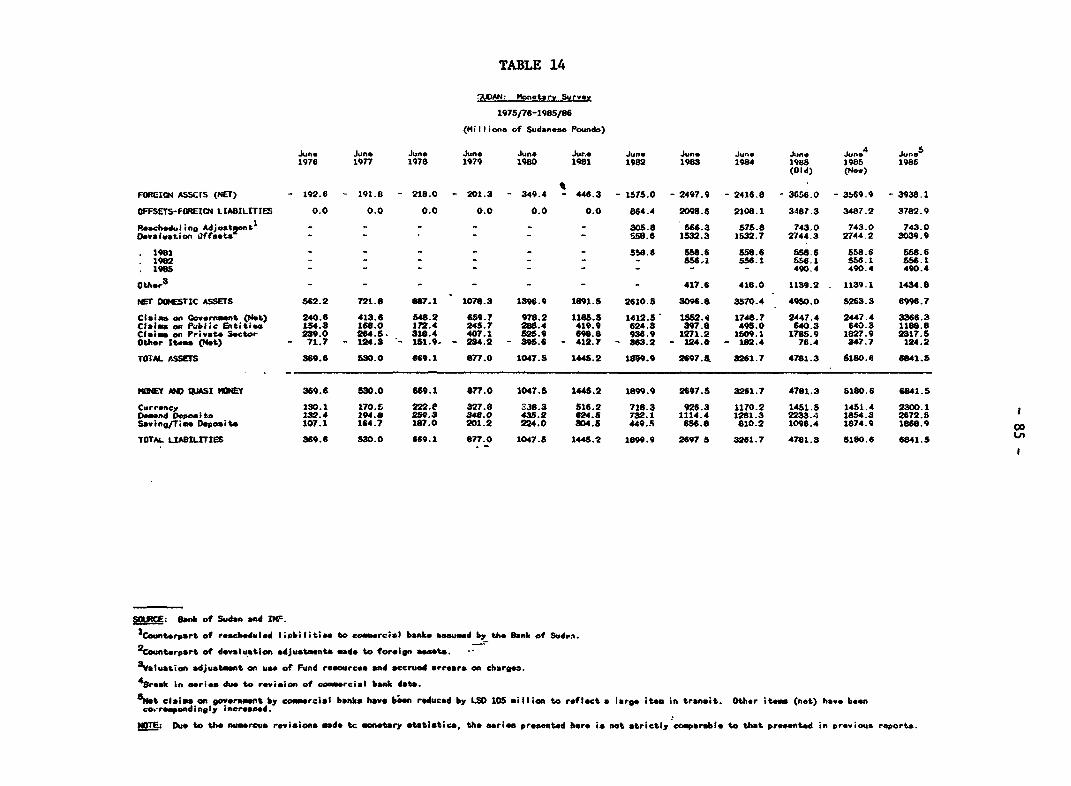
TABLE 14
-DAN: Moqetarv Survey
1975/76-1985/86
(Mi tI ions of Sudan... Poundo)
Jun. Jun. Jun. Jun. June Juw. June Jun June Jun. June4
Jun.5
1976 1977 1978 1979 1980 1981 1982 1983 1984 19B5 1985 1986(Old) (No.)
FOREIaN ASSCtS (NEr) - 192.6 - 191.8 - 218.0 - 201.3 - 349.4 - 446.3 - 1575.0 - 2497.9 - 2416.8 - 3656.0 - 3569.9 - 3938.1OFFSETS-FOREICN LIAILITTiES 0.0 0.0 0.0 0.0 0.0 0.0 864.4 2098.6 2108.1 3481.3 3487.2 3782.9Rench*duling Adjstrent - - - - - - 305.8 566.3 575.8 743.0 743.0 743.0Devalustion Offsets - - - - - 558.6 1532.3 1532.7 2744.3 2744.2 3039.9. 1982 - - - - - - 558.6 558.6 558.6 S56.6 558.6 558.61982 - - - - - - - 556.1 556.1 55.1 556.1 S56. 11985 - - - 490.4 490.4 490.4
Oth-r3
- - - - - - 417.6 416.0 1139.2 . 1139.1 1434.8NET DOMSTIC ASSETS 562.2 721.8 887A1 1076.8 1396.9 1891.5 2610.5 3096.8 3570.4 4950.0 5263.3 6996.7Claim on Cotornent (Not) 240.6 413.6 546.2 659.7 978.2 1185.5 1412.5 1552.4 1748.7 244?.4 2447.4 3366.3Claims on Public Entities 14.3 168.0 172.4 245.7 288.4 419.9 624.3 397.8 495.0 640.3 640.3 1188.8Claims on Private Sector 239.0 264.5. 181.4 407.1 525.9 698.8 936.9 1271.2 1509.1 1785.9 1827.9 2317.5Other Items (Net) 71.7 - 124.8 151 .9- - 234.2 - S95.6 - 412.7 - 863.2 - 124.0 - 182.4 76.4 347.7 124.2TOTAL ASSETS 369.6 530.0 S669.1 877.0 1047.5 1445.2 189.9 2697.1 3261.7 4781.3 S180.6 6841.5
V1O@E AD ASS If ONEY 369.6 580.0 669.1 677.0 1047.5 1445.2 1899.9 2697.5 8261.7 4781.3 5180.6 6841.5Curr ncy 30.1 170.5 222.e 827.8 338.3 S16.2 718.3 926.3 1170.2 1451.5 1451.4 2300.1Demand beocits 132.4 194.8 259.3 348.0 435.2 624.5 732.1 1114.4 1281.3 2233.4 1854.3 2672.5SavingJTme, Deposits 107.1 164.7 187.0 201.2 224.0 304.5 449.0 656.8 810.2 1096.4 1874.9 1868.9 ODTOTAL LIABILITIS 369.6 530.0 669.1 877.0 1047.5 1445.2 1899.9 2697 S 3261.7 4781.3 5180.6 6841.5
WUtCE: 8anlk of Sudan and 1W .1Counterpart of rescheduled I ibilities to coomrcial bhank. ssumed by the Bank of Sudva.
2C4unterport of devsluation adjustments md- to foreign esets.
3aluntion adjustmnt on ue of Fund reeourco and accrued arrears on charges.4Sreak in ser;oa due to revision of commrcial bank data.
SI*t clti_, on government by commercial banks have been reduced by LSD 105 million to roflect a lure item in traneit. Other ite" (net) hav, beanco.-respandingly increased.
NTh: Due to the numerous revisions oade te monetary statistics. the s*rie- preented Iter is not strictly cowparable to that presented in previous reports.

PAGE 1TABLE 15
SUDAN: COMMERCIAL BANK CREOIT OUTSTANDING TO PRIVATE SECTOR BY lUSE. 1975/76-1985/86(CREDIT OUTSTANDING-LS MILLIONS)
ITEM 1975/76 1976/77 1977/78 1978/79 1979/80 1980/81 1981/82 1982/83 1983/84 1984/85 1985/86
COMMERCIAL CREDITS 41 199.4 218.5 250.9 312.0 395.0 541.8 712.8 944.1 1.106.9 1.305.5 1.708.9
CROP CULTIVATION 42 0.5 0.3 0.7 1.5 - 0.7 4.1 3.0 - 2.6 -COTTON 43 - - - - - -0.4 2.9 1.5 - 2.0 -OTHER 44 0.5 0.3 0.7 1.5 1.1 1.2 1.5 - 0.6 -
EXPORTS 45 86.o 83.8 79.0 91.6 1O9.4 145.2 224.1 284.4 385.1 411.2 470.7COTTON 46 8.6 7.1 4.4 5.7 3.6 6.0 9.5 18.6 30.6 40.3 3.1COTTON SEED 47 *0.2 i.4 1.2 - - 3.7 3.0 1.5 - 4.7 -GUM ARABIC 48 17.0 16.1 . 15.6 13.0 7.1 4.8 4.8 2.5 2.5 3.8 3.9SESAME 49 16.6 12.4 7.0 9.8 27.8 35.7 33.2 37.8 71.0 64.7 116.6GROUNONUTS 50 19.8 t5.4 12.6 11.2 7.3 20.0 52.5 66.4 76.5 107.1 126.6OTHER 51 23.8 31.4 28.2 51.9 63.6 75.0 121.1 157.6 204.5 195.3 220.5
IMPORTS 52 16.5 18.0 33.8 39.8 57.1 79.0 132.8 224.1 233.3 212.0 213.0PURCHASES 53 12.7 15.6 31.6 36.4 57.1 70.4 108.9 184.1 186.9 166.6 -CREDIT SALES 54 3.8 2.4 2.2 3.4 - 8.6 23.9 40.0 46.4 45.4 -
MISCELLANEOUS 55 96.4 116.4 137.4 179.1 228.5 316.9 351.8 432.6 488.5 638.8 -INDUSTRIAL ENTERPR'SES 56 62.3 80.6 96.0 122.6 150.8 221.7 244.4 275.4 297.3 388.7 427.6 coPRIVATE AND PROFESSIONAL 57 1.5 2.2 4.8 8.9 - 3.8 3.5 6.6 - 8.9 -OTHER 58 32.6 33.6 36.6 47.6 77.7 91.4 103.9 150.6 191.2 293.6 597.6
MEDIUM AND LONG-TERM ADVANCES 59 17.t 23.5 44.5 72.1 -108.0 134.0 195.8 327.1 402.2 522.4 608.6
CAPITAL INVESTMENT 60 5.0 8.7 33.0 59.6 95.8 119.3 151.0 197.0 236.8 142.5 -OTHER 61 12.1 14.8 11.5 12.5 12.2 14.7 44.8 13O.1 165.4 379.9 -
TOTAL 1/ 4 216.5 242.0 295.4 384.1 503.0 675.8 908.6 1.271.2 1.509.1 1.827.9 2.317.5======== ======== ====== = ======== ======d= ======== ======== ======= = === ==== ========
SOURCE: BANK OF SUDAN. IMF AND BANK STAFF ESTIMATESi/ UNDER THE OLD REPORTING SYSTEM. TOTAL CREDIT AMOUNTED TO LSD1785.9
MILLION FOR 1985/86. THE NEW REPORTING SYSTEM WAS APPLID AS OFJUNE 1985.

TABLE 16 PAGE 1
SUDAN: CREOIT OUTSTANDING TO PUBLIC ENTITIES, 1975/76-1985/86(MILLIONS OF SUDANESE POUNDS AS OF JUNE 30)
…-- - - - - - - - -..- - - -- - - - - - - - -- -- -- - - -- -- -_ - - --- -- -- -- - - -- - -- - -- --- - - - -- - - -- - - -- -- -- ---- -- -- --- - --- -- - - - -- -- -- - - -- - _ _ _ _ _ _____ - -____ __ _ _ __ITEM 1975/76 1976/77 1977/78 1978/71 1979/80 1980/81 1981/82 t982/83 1983/84 1984/85 1985/86
-------..----------------------------------------------------..--------------..------------------------------------------------------
AGRICULTURAL ENTITIES 65 119.8 140.4 136.6 184.5 215.2 315.3 495.5 770.5 779.5 559.9 1,113.4
SUDAN GEZIRA BOARD 9 54.5 50.9 41.2 57.1 63.1 105.9 124.6 166.8 203.5 193.5 287.9AGRICULTURAL REFORM CORP. 66 33.5 18.5 7.2 7.1 7.1 7.1 7.2 7.2 7.2 - -EL SUKI SCHEME 67 9.1 5.5 5.5 5.5 5.3 10.7 18.2 25.3 23.3 15.1 21.6MECHANIZED FARMING CORP. 1O 0.7 1.0 1.0 1.3 2.6 3.6 4.5 6.3 6.3 - -ANIMAL PRODUCTION CORP. ii 0.7 0.8 - - - - - - -PUBLIC CORP. FOR IRRIG.
8 EARTH MOVING 14 2.2 2.9 2.5 2.5 2.4 3.0 3.0 3.0 3.0 - -OTHER AGRICULTURE 63 - - - - - 55.3 131.0 199.8 252.5 205.7 300.2COTTON PUBLIC CORP. 124 - - - - - 75.0 227.3 146.4 145.6 503.7
INDUSTRIAL ENTITIES 68 7.3 7.0 13.5 21.9 28.6 46.6 '2-9 97.9 159.4 29.6 32.3…__ _ _ _ _ _ - - - - - - - - - - - - - - -- - - -- - - -- - - - - - - - - - - - - - - - - ___ ____ _______ -- - - - - - - - - - - - - - -
SUGAR AND DISTILLING CORP. 13 7.3 7.0 13.2 21.6 28.2 46.1 72.4 - 97.3 159.1 29.6 32.3FSOO INDUSTRIES CORPORATION 15 - - 0.3 0.3 0.4 0.4 0.4 0.4 0.3 - -OTHER 12 - - - - - 0.1 0.1 0.2 - - -
PU'P.LIC UTILITIES 69 27.2 20.6 22.3 39.0 44.4 48.9 . 48.9 55.4 66.0 50.5 42.7 X-__ _ _ _ _ _ - - - - - - - - - - - - - - - - - - - - - - -- - - - -- - - - - - - - - - - - __ _____ _ __ - - - - - - - -
SUDAN RAILWAYS 6 19.Q 20.6 22.3 37.1 42.0 44.9 44.S 44.8 56.9 19.3 19.2PEWC 7 8.2 - - 0.5 1.0 2.6 2.6 9.2 9.1 31.2 23.5SUDAN AIRWAYS 17 - _ _ 1.4 1.4 1.4 1.4 1.4 - - -
OTHER 70 - - - 0.3 0.2 9.t -7.0 4.0 20.0 - -…__ _ _ _ _ _ - - - - - - - - ___ ____ - - - - - - - - - - - - - - - -___ ____ - - - - - - - -_ - - - - - - - -
EXHIB. AND FAIRS CORP. 16 - - - 0.1 . 0.1 - - - - -SUGAR TRADING CORP. Si - - - 0.z 0.1 9.1 7.0 4.0 20.0 - -
TOTAL 1/ 71 154.3 168.0 172.4 245.7 288.4 419.9 624.3 927.8 1,025.0 640.0 1,188.5
SOURCE: BANK OF SUDAN AND IMF.1/ FOR 1984/85, LS 527.8 MILLION OF DEBT OUTSTANDING FROM PUBLIC
ENTITIES HAS BEEN ASSUMED BY THE CENTRAL GOVERNMENT AS LONGTERM LOANS.

TABLE 17
Sudan: Consolidated Balance Sheet of the Bank of Sudan, 1983-86
(In millions of Sudanese pounds)
June Dec. . June Dec. June Sept. Dec. June Sept.1983 1984 1985 1986
Assets 1,993.1 2,194.0 2,408.6 2,792.2 3,398.2 3,761.4 4,296.2 5,280.2 5,927.4Foreign assets 57.8 21.5 22.4 22.2 28.1 38.7 33.9 64.3 47.3Net claims on Government 1,485.7 1,631.4 1,695.6 1,985.0 2,521.1 2,536.6 2,893.9 3,808.5 4,089.0Claims on public entities 397.8 472.9 495.0 582.2 640.3 972.4 1,146.7 - 1,188.8 1,572.5Claims on commercial banks 21.2 23.2 144.0 146.3 142.0 142.0 150.0 139.4 139.3Claims on specialized banks 30.6 45.0 5l.6 56.5 66.6 71.6 71.6 79.3 79.3
Liabtlitties 1,993.1 2,194.0 2,408.6 2,792.2 3.398.2 3,761.4 4,296.2 5,280.2 5,927.4Reserve money 1,540.3 1,740.2 2,050.7 2,444.1 2,963.9 3,460.7 3,949.5 4,808.6 5,326.4 coCurrency outside banks (926.3) (1,022.2) (1,170.2) (1,247.2) (1,451.5) (1,620.3) (1,930.4) (2,300.1) (2,422.2)Cash in banks (47.7) (40.8) (54.3) (60.1) (85.4) (99.1) (95.2) (109.4) (131.4)Deposits of commercialbanks (465.6) (528.2) (725.2) (946.1) (1,185.7) (1,482.1) (1,634.9) (2,001.2) (2,243.5)
Other current deposits (100.7) (149.0) (101.0) (190.7) (241.4) (259.2) (289.1) (397.9) (529.3)
Quasi-monetary deposits 7.4 13.3 24.4 102.7 67.4 99.2 101.6 59.2 75.6
Foreign liabilities 2,836.3 2,787.9 2,829.8 2,876.8 4,584.4 4,684.0 4,612.2 4,884.3 5,004.9
Valuation adjustment -1,532.3 -1,532.3 -1,532.3 ,.-1,532.3 -3,044.2 -3,152.8 -3,209.2 -3,339.9 -3,389.8Rescheduling adjustment -566.3 -575.8 -575.8 -575.8 -743.0 -743.0 -743.0 -743.0 -743.0
Capital accounts 63.9 44.7 42.4 42.3 2.4 1.8 41.6 36.5 64.6
Other items (net) -356.2 -284.0 -430.6 -565.6 -432.7 -588.5 -456;.6 -425.5 -411.3
SOURCE: Bank of Sudan and IMF.

TAB 18
Sudan: Consolidated Balance Sheet of the Conmerciel Banks. 1983-86 1/
(In millions of Sudanese pounds)
JuneJune December June Deceiber June Revised 2/ Stpteaber December June 3/ Supteaber
1983 1984 1985 1986
Assets 2,499.5 2.828.7 2,907.0 3,308.8 4,504.9 4.8(.8.7 5,180.0 5,537.2 6.108.9 6,666.2
Reserves 660.4 826.2 800.3 936.7 1,401.0 1,497.3 1.704.3 2,009.4 2,229.0 2,704.8Currency_- (47.7) (40.8) (54.3) (60.1) (79.1' (85.4) (99.1) (9S-'2) (109.4) (131-4)Deposits with bank of Sudan (612.7) (785.4) (746.0) (876.7) (1,321.9) (1,411.9) (1.605.3) (1.914.2) (2,119.6) (2,573.4)
Foreign assets 473.9 532.3 501.4 666.5 1,217.1 1,442.6 1,602.3 1,545.1 1,463.9 1,393.3Claims on Government 93.9 93.3 96.2 96.3 100.9 100.9 100.4 100.4 98.4 108.6Claims on private sector 4/ 1,271.2 1,376.9 1,509.1 1,609.2 1,785.9 1,827.9 1,773.1 1,882.2 2,317.5 2,259.6
LSabilttles 2,499.5 2.828.7 2.907.0 3.308.8 4.504.9 4.868.7 5,180.0 5,537.2 6.108.9 6.466.2
Demand deposits 1,013.7 1,164.9 1,180.3 1,326.3 1,992.1 1,612.9 1,797.4 1,925.1 2.274.6 2,463.8Quastmonetary deposits 649.4 761.0 785.8 852.1 1,029.0 1,807.5 1,931.9 1,861.9 1,809.7 1,913.3
margin deposlts on Bank ofSuda% letters of credit (66.1) (104.2) (84.9) (135.6) (161.6) (382.5) (467.0) (403.1) (333.9) (397.9)
Time, savings and foreigndeposits (583.3) (656.8) (700.9) (716.5) (867.4) (1.425.0) (3,464.9) (1.458.8) (1,475.8)_ (1,515.4) t
Government d.tpostts 27.Z 45.7 43.1 56.8 174.6 174.6 163.8 265.0 540.6 5S6.8Foreign liabilities 193.3 152.3 110.8 177.8 316.8 456.2 506.1 538.6 582.0 627.9Credlt from bank of Sudan 110.1 147.6 149.3 126.5 21.2 21.2 22.8 30.5 4.9 10.9Capital accotnts 132.1 246.7 303.9 326.0 315.7 647.9 637.0 651.8 712.7 728.9Valuatton adjustment -- -- -- -- 300.0 300.0 300.0 300.0 300.0 300.0Unclassified Items (net) 373.7 310.6 333.8 443.3 355.6 -151.6 -179.0 -35.9 -115.6 -135.4
SOURCE: Bank of Sudarl and IMF.It A consolidation of coomercial banks and the Post Office Savings lank.2t From June 1985, the data for commercial banks has been revised as a result of the introduction of a new reporting system.i/ flanks' derosits at the Bank of Sudan end government deposlts bave been Increased by LSD 105 million to reflect o large Item in transit.A/ lacludes some publlc sector securittes held by commercial banks.

- 90 -
TABLE 19
SUDAN: CON'MERCIAL BANKS' INTEREST RATES, 1978-.33 I/
(In percenc)
Fehruarv Fehruirv Nove-her Januarv1978 19d1 19bI3
Lending ratesDiscount of hills ofexchange 13.0 15.( 17.0 20.0
Advances against hillsof exchange 13.5 15.5 17.5 20.0)
Advances to industrialhorrowers )
Overdrafts and other ) 10.0-14.5advances (range) ) 12.0-16.5 14.0-18.5 17.U-20.0
Deposit ratesA. Non-zovernmental
customersDertand deposits -- -- -- --
Notite deposits(15 dAys) 1.0 1.0 3.0 6.U
Fixed deposits3 months 6.0 8.5 10.5 13.56 months 7.0 9.0 11.0 14.09 months 8.0 -. 5 11.5 14.512 nonths 8.5 10.0 12.0 15.(
Savinzs deposits 8.0 3.0 10.0 13.0Deposits of pension I Iand provident-funds 4.0 8.0 10.0 13.0
roreign currency Linked to rates Interna-deposits (US dollars in international tionaland pounds sterling) markets 2/ rates
B. Governnental customersDemand denosits -- -- -- --
Fixed deposits(ranee) 3.4-4.0 --
Savines deposits 4.0 -- -- --
1/ The structure of interest rates was unchanecd hetween Fehruarv 1978 and Februarv1981, between November 1981 and Janitary 1983, and between Januarv 1983 andSeptenher 1984. The charzinj and pavment of Interest was nrohibited hv laweffective September 1q84.
2/ Since June 1980.
SOURCE: Bank of Sudan and IMF.

PAGE 1TABLE 20SUDAN: PRICE INDICES. 1976-1986
(INDEX NUMBERS)
-----------------------------------------------..------------__--------------__------------------------------------------------------
ITEM 1976 1977 1978 1979 1980 1981 1982 1983 1984 1985 1986
COST OF LIVING INDEX(JANUARY 1970 = 100) /A
LOWER SALARIES INDEX /BJANUARY 1 210.4 241.8 269.4 343.3 486.4 563.9 677.9 923.6 1,194.7 i.764.0 2.252.8FEBRUARY 2 204.1 240.7 260.7 340.9 487.8 572.7 683.5 928.1 1,191.9 1,807.0 2,379.3MARCH 3 204.1 241.1 266.5 339.6 486.2 575.4 692.9 943.3 1,191.9 1.896.0 2.443.5APRIL 4 208.2 252.9 283.5 351.0 *488.3 604.3 760.6 952.4 1,251.1 1.940.0 2.529.0MAY- 5 220.9 263.0 300.6 377.7 489.8 619.8 799.2 997.5 1.279.0 2.073.0 2,664.7JUNE 6 233.1 27t.5 323.7 400.8 508.0 672.5 829.0 1,047.1 1.318.0 2,323.0 2.685.9JULY 7 238.8 285.6 352.7 437.5 521.1 741.3 858.9 1,134.6 1.482.0 2.271.0 2:801.7AUWGUST 8 248.8 277.6 346.9 449.4 537.2 786.7 888.7 1,167.8 1,596.0 2.232.0 3.044.7SEPTtI#ER 9 236.2 275.6 347.5 467.1 546.8 684.1 892.9 1.156.6 1.600.0 2.167.0 3.C69.8OCTOBER 10 226.3 270.1 340.8 475.3 548.0 644.0 897.2 1.139.9 1.590.0 2.106.0 2.896.4NOVEMBER 11 229.0 274.8 339.8 475.6 549.0 631.2 901.4 l.22.9 t.634.0 2.044.0 2,668.9DECEMBER 12 241.6 268.0 338.8 486.9 550.2 626.3 912.5 1.157.3 i.679.0 2,100.0 2.615.6AVERAGE FOR YEAR /C 13 225.1 262.9 314.9 412.1 516.6 643.5 816.2 1,055.9 1,417.0 2.060.6 2.671.0
HIGHER SALARIES INDEXJANUARY 16 190.5 222.5 250.3 324.2 456.1 529.5 648.8 893.5 1,142.0 1.654.0 2.42.0 FFEBRUARY 17 186.8 221.2 249.4 322.9 458.9 540.1 65i.6 895.5 1,140.6 1,688.0 2,236.3MARCH 18 185.5 221.8 247.5 322.3 456.9 544.9 663.7 913.9 1,140.1 1.787.0 2,274.4APRIL 19 189.0 231.4 261.4 331.0 459.6 564.8 706.0 920.3 1,184.1 1.837.0 2,345.0MAY 20 189.0 238.2 274.4 353.6 462.1 580.2 733.2 960.9 1,206.0 1,941.0 2,473.6JUNE 21 211.2 237.2 292.4 374.8 478.3 625.1 765.0 993.9 1,233.8 2,148.2 2,491.2JULY 22 216.8 255.9 319.0 408.7 492.1 685.3 796.9 1,070.1 1.367.0 2.110.0 2,625.3AUGUST 23 224.5 252.8 3.6.7 419.3 51O.6 727.3 828.7 1.104.4 1.457.0 2.086.0 2,783.5SEPTEMBER 24 215.4 253.2 316.3 435.3 517.6 639.2 833.8 1,089.7 1,458.6 2.046.5 2,808.8OCTOBER 25 209.1 248.4 311.1 441.5 518.3 608.0 839.0 1.083.4 1.454.0 2.006.0 2.673.2NOVEMBER 26 212.3 251.2 312.9 443.7 519:7 605.0 844.1 1.063.6 1.495.0 1,959.0 2,555.3DECEMBER 27 218.5 247.5 314.9 453.8 522.7 603.4 868.8 1,105.5 1.530.8 1.938.7 2,420.3
AVERAGE FOR YEAR /C 28 204.1 240.7 288.9 385.9 487.5 604.0 765.0 1.007.6 1.317.0 1,939.0 2.485.7

TABLE 20 PAGE 2SUDAN: PRICE INDICES. 1976-1986
(INDEX NUMBERS)
ITEM 1976 t977 1978 1979 1980 1981 1982 1983 1984 t985 1986
COMPONENTS OF HIGHER SALARYINDEX - DECEMBER
FOOD. BEV 8 TOBACCO (60.r%) 40 23i.7 266.2 357.8 519.4 604.4 652.4 954.4 1,264.7 1.268.2 2.259.7HOUSING (O1.3%) 41 236.8 248.t 258.1 379.6 431.4 525.2 670.2 759.8 971.7 1.565.BCLOTHING (6.8%) 42 167.4 200.5 245.0 268.6 301.2 392.3 531.2 626.6 698.1 1.038.6TRANSPORT (8.4%) 0/ 43 224.9 211.8 214.4 420.5 383.1 - - - - -OTHER (13.0%) 44 163.7 237.7 281.5 411.7 465.5 637.4 777.6 990.7 1.007.2 1.515.0TOTAL (100.0%) 27 210.9 247.5 314.9 453.8 522.7 603.4 868.8 1.105.S 1,530.8 1,938.7 2.420.3
SOURCE: DEPARTMENT OF STATISTICSA/ WEIGHTS ARE FROM 1967/68 HOUSEHOLD SURVEY. WEIGHTS ARE AS
FOLLOWS:-FOOO. BEVERAGES AND TOtACCO 166.5%). HOUSING (12.4%).CLOTHING (5.9%). MISCELLANEOUS (15.2%).
8/ THOSE EARNING LESS THAN LSD 500 PER YEAR.C/ ANNUAL AVERAGES ARE BASED ON ARITH"ETIC MEAN OF MONTHLY OATA.D/ TRANSPORT INCLUDED IN 'OTHER AFTER 1981.

TABLE 21 PAGE 1SUDAN: PRICE INDICES. 1976-1986
(Rates of Inflation)
ITEM 1976 1977 1978 1919 1980 1981 1982 1983 1984 1985 1986------------------------------------------------------------------- __--------__-----------------------------------------------------
COST OF LIVING INDEX -(JANUARY 1970 - 100) /A
LOWER SALARIES INDEX /BJANUARY I 1.8 14.9 11.4 27.4 41.7 15.9 20.2 36.2 29.4 47.7 27.7FEBRUARY 2 0.5 17.9 8.3 30.8 43.1 17.4 19.3 35.8 28.4 51.6 31.7MARCH 3 -0.7 18.1 10.5 27.4 43.2 18.3 20.4 36.1 26.4 59.1 28.9APRIL 4 -3.5 21.5 12.1 23.8 39.1 23.8 25.9 25.2 31.4 55.1 30.4MAY 5 3.0 19.1 14.3 25.6 29.7 26.5 28.9 24.8 28.2 62.1 28.5JUNE 6 3.0 -16.5 19.2 23.8 26.r 32.4 23.3 26.3 25.9 76.3 15.6JULY 7 -0.0 19.6 23.5 24.0 19.1 42.3 15.9 32.1 30.6 53.2 23.4AUGUST 8 -0.7 11.6 25.0 29.5 19;.5 46.4 13.0 31.4 36.7 39.8 36.4SEPTEMBER 9 -1.5 16.7 26.1 34.4 17.1 25.1 30.5 29.5 38.3 35.4 41.7OCTOBER 10 2.4 19.4 26.2 39.5 15.3 17.5 39.3 27.1 39.S 32.5 37.5NOVEMBER 11 5.4 20.0 23.7 40.0 i5.4 15.0 42.8 24.6 45.5 25.1 30.6DECEMBER 12 11.0 10.9 26.4 43.7 13.0 13.8 45.7 26.8 45.1 25.t 24.6
AVERAGE FOR YEAR /C 13 1.7 16.8 19.8 30.9 25.4 24.6 26.8 29.4 34.2 45.4 29.6
HIGHER SALARIES INDEXJANUARY 16 -0.5 16.8 12.5 29.5 40.7 16.1 22.5 37.7 27.8 44.8 29.5FEBRUARY 17 -0.4 18.4 12.7 29.5 42.1 17.7 20.6 37.4 27.4 48.0 32.5MARCH 18 -2.1 19.6 t1.6 30.2 41.8 19.3 21.8 37.7 24.8 56.7 27.3APRIL 19 -3.2 22.4 13.0 26.6 38.9 22.9 25.0 30.4 28.7 55.1 27.7NAY 20 -3.0 26.0 15.2 28.9 30.7 25.6 26.4 31.1 25.5 60.9 27.4JUNE 21 3.1 12.3 23.3 28.2 27.6 30.7 22.4 29.9 24.1 74.1 16.0JULY 22 1.2 18.0 24.7 28.1 20.4 39.3 16.3 34.3 27.7 54.4 24.4AUGUST 23 0.7 12.6 25.3 32.4 21.8 42.4 13.9 33.3 31.9 43.2 33.4SEPTEMBER 24 0.3 17.5 24.9 37.6 18.9 23.5 30.4 30.7 33.9 40.3 37.2OCTOBER 25 4.9 18.8 25.2 41.9 17,4 17.3 38.0 29..1 34.2 38.0 33.3NOVEMBER 26 7.3 18.3 24.6 41.8 17.1 16.4 39.5 26.0 40.6 31.0 30.4DECEMBER 27 10.0 13.3 27.2 44.1 15.2 15.4 44.0 27.2 38.5 26.6 24.8
AVERAGE FOR YEAR /C 28 1.6 17.9 20.0 33.6 26.3 23.9 26.7 31.7 30.7 47.2 28.2

TABLE 21 PAGE 2
SUDAN: PRICE INDICES. 1976-1986
(Rates of Inflation)…-- - - - - - - - - - - - - - - - - - - - - - - - - - - - - - - - - - - - - - --__- -__- -__ _____-_-_-_______-___-_-_-__-__-_ -_
ITEM t976 1977 1978 1979 1980 t981 t982 1983 1984 1985 1986-_ _------------------------------------------
COMPONENTS OF HIGHER SALARYINDEX - DECEMBER
'OOD. BEV & TOBACCO (60.5%) 40 9.5 14.9 34.4 45.2 16.4 7.9 46.3 32.5 0.3 78.24OUSING (1t.3%) 41 11.7 4.8 4.0 47.1 13.6 21.7 27.6 13.4 27.9 61.1.LOTHING (6.8%) 42 11.6 19.8 22.2 9.6 12.1 30.2 35.4 18.0 i.4 48.8=RANSPORT (8.4%) D/ 43 - -5.8 1.2 96.1 -8.9 - - - - -ITHER (13.0%) 44 - 45.2 18.4 46.3 13.1 36.9 22.0 27.4 1.7 50.4 -
-OTAL (iOO.0%) 27 10.0 13.3 27.2 44.1 15.2 15.4 44.0 27.2 38.5 26.6 24.8
SOURCE: DEPARTMENT OF STATISTICS'/ WEIGHTS ARE FROM 1967/68 HOUSEHOLD SURVEY. WEIGHTS ARE AS
FOLLOWS: FOOD. BEVERAGES AND TOBACCO (66.5%). HOUSING (12.4%).CLOTHING (5.9%). MISCELLANEOUS (15.2%).
;/ THOSE EARNING LESS THAN LSD 500 PER YEAR./ ANNUAL AVERAGES ARE eASED ON ARITHMETIC MEAN OF MONTHLY DATA.
-J TRANSPORT INCLUDED IN *OTHER" AFTER 1981.

- 95 -
TABLE 22
SUDAN: Cost of Living Index for the Creater Khartoum Area, 1980-861
(January 1970 = 100)
Food, TransportBeverages, and Overalland Tobacco Housing Clothing Communications Other Index
(8046) (1131) (677) (395) (i7T31) (10000)
1980
June 540.8 420.8 290.8 188.0 539.8 478.3December 604.4 431.4 301.2 168.9 569.9 522.7
1981
June 733.9 478.2 308.0 245.6 880.8 82S.1December 862.4 525.2 392.3 288.2 759.4 803.4
1982
March 718.2 813.9 407.8 305.9 820.7 863.7June 887.7 813.9 407.8 305.9 820.7 788.3September 954.9 670.2 531.2 306.9 941.8 837.3December 964.4 870.2 531.2 306.9 941.8 837.0
1983
March 1018.9 739.7 687.1 394.8 1086.4 913.9June 1162.8 739.7 587.1 394.8 1086.4 993.9September 1302.8 739.7 628.8 394.8 1097.0 1089.7Aecember 1284.7 769.8 828.8 586.8 1288.0 1105.5
1984
March 1268.2 971.7 898.1 585.8 1296.3 1140.1June 1423.2 971.7 898.1 685.6 1295.3 1233.8September 1728.6 1117.7 817.0 586.8 1418.7 1458.8December 1831.4 1117.7 817.0 5668. 1493.2 1530.8
1986
March 1919.0 1317.8 950.0 838.8 1746.0 1854.1June 2s88.3 1687.0 950.G 908.7 2030.7 2148.2September 2391.0 1687.1 1127.2 - - 2048.5December 2307.3 1717.4 1127.2 - - 2009.1
1988
March 2880.8 1829.9 1309.7 - - 2274.4June 3039.3 1829.9 1309.7 - - 2491.2September 3522.9 1897.5 1383.8 - - 2808.8
lIndex prepared on the basis of budgetary survey for employees working in theGreater Khartoum area earning more than LSd 600 per annum in 1987/68.
SOURCE: Ministry of Finance and Economic Planning

- 96 -
TABLE 23
SUDAN: Retail Price of Dura (Sorghum) in Khartoum, 1990-8s5
(In Sudanese Piastres per Ruba)2
1980
First Quarter 8S.0Second Quarter 89.4Third Quarter 128.8
* Fourth Quarter 164.4
1981
First Quarter 180.0Second Quarter 186.8Third Quarter 217.8Fourth Quatter 217.6
1982
-First Quarter 228.6Second Quarter 226.6Third Quarter 240.0Fourth Quarter 240.0
1983
First Quarter 236.7Second Quarter 244.4*rhird Quarter 258.3Fourth Quarter 300.0
1984
First Quarter 288.9Second Quarter 400.0Third Quarter 93303
.Fourth Quarter 1000.0
1985
First Quarter 1033.3Second Quarter 1133.3Third Quarter 983.3Fourth Quarter 750.03
1988
First Quarter 500.0o3Second Quarter 500.03Third Quarter 500.
lPeriod averages.
2One ruba euqals 8.5 kilograms.
3Offical prices which may differ from those actually paid >y some consumers.
SOURCE: Uinistry of Finance and Economic Planning