the role of time-varying price elasticities in … bank of canada working paper 2011-28 november...
TRANSCRIPT

Working Paper/Document de travail 2011-28
The Role of Time-Varying Price Elasticities in Accounting for Volatility Changes in the Crude Oil Market
by Christiane Baumeister and Gert Peersman

2
Bank of Canada Working Paper 2011-28
November 2011
The Role of Time-Varying Price Elasticities in Accounting for Volatility Changes in the
Crude Oil Market
by
Christiane Baumeister1 and Gert Peersman2
1International Economic Analysis Department Bank of Canada
Ottawa, Ontario, Canada K1A 0G9 [email protected]
2Ghent University
Bank of Canada working papers are theoretical or empirical works-in-progress on subjects in economics and finance. The views expressed in this paper are those of the authors.
No responsibility for them should be attributed to the Bank of Canada.
ISSN 1701-9397 © 2011 Bank of Canada

ii
Acknowledgements
We thank Luca Benati, Matteo Ciccarelli, Lutz Kilian, Vivien Lewis, Davide Raggi, James Smith, Paolo Surico and our discussants Andreas Fritz and David Jacks, as well as participants at the 2010 Society for Nonlinear Dynamics and Econometrics Conference, the 2011 Canadian Economics Association Annual Conference and the 2011 Empirical Methods in Energy Economics workshop for valuable comments and helpful discussions. William Wu provided outstanding research assistance. We acknowledge financial support from IUAP and FWO. All remaining errors are ours.

iii
Abstract
There has been a systematic increase in the volatility of the real price of crude oil since 1986, followed by a decline in the volatility of oil production since the early 1990s. We explore reasons for this evolution. We show that a likely explanation of this empirical fact is that both the short-run price elasticities of oil demand and of oil supply have declined considerably since the second half of the 1980s. This implies that small disturbances on either side of the oil market can generate large price responses without large quantity movements, which helps explain the latest run-up and subsequent collapse in the price of oil. Our analysis suggests that the variability of oil demand and supply shocks actually has decreased in the more recent past preventing even larger oil price fluctuations than observed in the data.
JEL classification: E31, E32, Q43 Bank classification: Econometric and statistical methods; International topics
Résumé
Depuis 1986, la volatilité du prix réel du pétrole brut a systématiquement augmenté, alors que celle de la production pétrolière s’est atténuée depuis le début des années 1990. Les auteurs se penchent sur les raisons de cette évolution. Ils montrent que celle-ci s’explique vraisemblablement par le fait que les élasticités-prix à court terme de la demande et de l’offre d’or noir ont toutes deux considérablement diminué depuis la deuxième moitié des années 1980. Dans ces conditions, de petites perturbations dans la demande ou l’offre de pétrole peuvent engendrer de fortes fluctuations des prix sans faire varier les quantités de façon significative, ce qui aide à comprendre la récente envolée des cours de l’or noir et leur effondrement subséquent. D’après l’analyse des auteurs, la variance des chocs de demande et d’offre de pétrole a en fait baissé dernièrement. Sans ce recul, le prix du pétrole aurait fluctué encore plus.
Classification JEL : E31, E32, Q43 Classification de la Banque : Méthodes économétriques et statistiques; Questions internationales

1 Introduction
The rollercoaster ride of crude oil prices from values of around 50$ per barrel at the beginning of
2007 to record highs of almost 150$ in mid-2008, back to values as low as 40$ at the end of the
same year is a compelling illustration of the dramatic rise in oil price volatility that has been a
salient feature of oil price behavior for the last two decades. A related aspect that has almost gone
unnoticed in the literature is that, while oil price volatility has increased, the volatility of world oil
production has decreased substantially over time. Figure 1, panel A displays the quarter-on-quarter
rate of change for the real price of crude oil and for world oil production over the period 1974Q1
to 2010Q4. Panel B shows the evolution of the unconditional standard deviation of these two
oil market variables over time based on 5-year rolling windows and based on the empirical model
introduced in section 3.1 As is evident from both graphs, the amplitude of quarterly oil price
�uctuations increased signi�cantly in more recent periods. World oil production on the other hand
exhibited larger �uctuations in the early part of the sample, especially during the 1970s, which
gradually diminished over time. This diverging pattern is suggestive of a transformation in the
structure of the global market for crude oil. In light of the mounting concern among policymakers
and the public about rising oil price volatility, understanding the nature of the underlying causes of
greater oil price volatility is important. It not only helps devise suitable policy measures for dealing
with it, but can also provide insights into the volatility of other commodity and asset prices. The
goal of this paper is to analyze changes in oil market dynamics over time and to study the factors
that are responsible for the observed rise in oil price volatility and the concomitant drop in oil
production volatility.
Several hypotheses can conceivably account for these volatility changes. One natural explanation
could be changes in the variances of shocks or in the relative importance of di¤erent types of shocks
a¤ecting the oil market. Increases or decreases in the size of the underlying shocks alone, however,
cannot explain the inverse evolution of oil price and oil production volatilities. For instance, while
greater demand shocks due to changes in inventory practices or speculative activities have the
potential to account for the observed increase in oil price variability, such a hypothesis cannot
explain the accompanying fall in oil production variability. Similarly, smaller oil supply disruptions
in more recent periods relative to the 1970s and early 1980s can be a source of a decline in oil
production volatility, but are incompatible with greater oil price �uctuations. Hence, a combination
of changes in the magnitude of the underlying shocks would be needed to explain the evolution of
volatility.
1Figure 2A in the not-for-publication appendix (available at: http://www.bankofcanada.ca/author/christiane-
baumeister) reports the joint posterior distributions of the estimated volatilities for selected pairs of oil market
episodes following the approach of Cogley, Primiceri, and Sargent (2010), which reveal that changes in the volatility
pattern are indeed an important feature of the data.
2

Another potential explanation for structural changes in the oil market over time is a change in
the price elasticities of oil demand or oil supply, corresponding to a steepening or �attening of the
oil demand or oil supply curves. In particular, a fall in the short-run price elasticity of oil demand
or oil supply can rationalize an opposite movement of oil price and production volatility over time.
For example, a less elastic oil demand curve implies that similar shifts of an upward-sloping oil
supply curve are characterized by smaller adjustments in oil production and larger �uctuations of
oil prices. Likewise, a steeper oil supply curve could be the reason for increased oil price volatility
and decreased oil production volatility in the data for similar shocks at the demand side of the oil
market.
Finally, a change in the degree of �exibility of oil prices might be relevant for the volatility
pattern in the crude oil market. Before the collapse of OPEC in 1985, oil market transactions were
to a large extent based on long-term contracts with predetermined oil prices. As a consequence,
large production adjustments were needed to accommodate changes in the demand for crude oil, at
least for the remaining period of the contract. The gradual transition to the current market-based
system of spot contracts should be conducive to a more rapid transmission of oil supply and demand
shocks into price changes. As a result, smaller shifts in global oil production would be required to
clear the market.
The contribution of this paper is to evaluate these hypotheses in a unifying framework and to
provide empirical evidence that the increase in oil price volatility can be reconciled with a decrease
in oil production volatility, once we allow the price responsiveness of oil supply and oil demand as
well as the variances of the underlying shocks to vary over time. To this end, we propose a Bayesian
time-varying parameter vector autoregression (TVP-VAR) model with stochastic volatility in the
innovation process that we estimate over the sample period 1974Q1-2010Q4 in the spirit of Cogley
and Sargent (2005) and Primiceri (2005). Within this TVP-VAR framework, we identify three types
of structural disturbances that drive the movements in world oil production and oil prices, namely
oil supply shocks, oil demand shocks caused by unexpected shifts in global economic activity and
other oil demand shocks in the global market for crude oil. These shocks are identi�ed by means
of sign restrictions to allow for an immediate e¤ect of all three shocks on both oil prices and oil
production which can change over time.2
Our key �nding is that the volatility changes in the crude oil market are driven by a considerable
decrease in the price responsiveness of oil supply and oil demand in the short run in the second half
of the 1980s. A direct implication of these low price elasticities is that even small excess demand
2Kilian (2009) disentangles a similar set of shocks by imposing short-run zero restrictions. However, a recursive
identi�cation scheme is not appropriate for our purpose given that by construction the short-run elasticity of oil
supply is zero in such a framework. Moreover, such a restriction would be less plausible in our quarterly model than
in Kilian�s monthly model.
3

or excess supply of crude oil requires large jumps in prices to clear the global oil market. Put
di¤erently, a steepening of the short-run oil supply and oil demand curves over time is the likely
explanation of higher oil price volatility accompanied by lower oil production volatility. Hubbard
(1986) makes the case that the transition from long-term oil contracts to spot market deals and oil
futures contracts in the mid-eighties has played a critical role in the rise of oil price variability. We
complement this view by suggesting that this change in the pricing system has contributed to the
decrease in the short-run elasticities of oil demand and oil supply which in turn could have propelled
the shift from contractual arrangements to market transactions to cope with the substantial swings
in oil prices. We argue that the structural transformation in the oil market can be interpreted as the
result of an interplay between several features that tend to reinforce each other. On the one hand,
uncertainties deriving from greater oil price volatility might have encouraged the development of
derivative markets, stimulated the reliance on oil futures as risk-reduction tools and led to the
introduction of crude oil options as hedging devices. On the other hand, while these �nancial
instruments were designed to deal with the rise in oil price volatility, it is likely that the expansion
of hedging possibilities also played a role in lowering the sensitivity of oil consumers and producers
to price �uctuations thereby contributing to the steepening of the oil supply and demand curves
which results in higher oil price volatility. If such an interplay exists, our results could extend to
the volatility of other types of commodities and assets. Our analysis is facilitated by the fact that
for the oil market a long time span of both price and quantity data is available, which are necessary
to measure (time-varying) price elasticities.
The change in the volatility of key oil market variables over time is, however, not exclusively
determined by lower short-run price elasticities of oil supply and oil demand but also by the mag-
nitude of structural disturbances a¤ecting the oil market. By means of simple back-of-the-envelope
computations, we �nd that the variances of all three types of shocks have gradually decreased
rather than increased, ruling out this competing explanation of increased oil price volatility. We
show that the average variability of exogenous oil supply shocks was relatively high until the in-
vasion of Kuwait in 1990, after which it declined steadily. The average variability of oil demand
shocks re�ecting changes in economic activity declined in the mid-eighties, but has risen again
since the 2000s. Interestingly, the variability of an average oil demand shock driven by shifts in
expectations is smaller in more recent times compared to the 1970s and 1980s. This �nding is in
line with Kilian (2009) and Kilian and Murphy (2011) who conclude that oil demand shocks were
important driving forces behind oil price �uctuations throughout the 1974 to 2009 period. Finally,
our evidence reveals that the transition from administered prices to a market-based pricing system
had hardly any impact on the speed of adjustment of crude oil prices and consequently oil price
volatility when quarterly data are used. In other words, we observe little change in the degree of
persistence of the real price of oil over the entire sample period.
4

The rest of the paper is organized as follows. In section 2, we present a stylized time-varying
parameter structural model of the crude oil market which allows us to illustrate the di¤erent
hypotheses about the changing volatility of oil production and oil prices since 1974. Section 3
introduces the econometric framework, while the empirical results are reported in section 4. We
brie�y discuss a number of factors that might have contributed to the steepening of the short-run
oil supply and oil demand curves over time in section 5. In section 6, we assess the sensitivity of our
�ndings to changes in the model speci�cation and the identi�cation assumptions. The concluding
remarks are in section 7.
2 A stylized model of the crude oil market
In its simplest form, the crude oil market can be represented by the following demand and supply
equations, measured as deviations from steady state:
QDt = �dt � P �t + "dt (1)
QSt = st � P �t + "st (2)
where oil demand QDt and oil supply QSt at each point in time are respectively a negative and
positive function of the equilibrium price of oil P �t . The parameters dt and st are positive and
measure the responsiveness of respectively the quantity of oil demanded and supplied to a change
in the price of crude oil, i.e. the slopes of oil demand and supply curves at time t. Furthermore,
the supply and demand for crude oil are driven by two mutually uncorrelated exogenous shocks: "dtand "st , with E
�"dt�= E ["st ] = 0, E
�"dt�2= �2d;t, E ["
st ]2 = �2s;t and E
�"dt ; "
st
�= 0. In equilibrium,
we can express the price and quantity variables as a linear combination of the structural shocks
hitting the oil market:
P �t ="dt
st + dt� "stst + dt
(3)
Q�t =st"
dt
st + dt+
dt"st
st + dt(4)
We allow the actual oil price to evolve gradually towards its equilibrium level:
Pt = �t � P �t + (1� �t) � Pt�1 (5)
with 0 < �t < 1 being the time-varying speed of adjustment to the new equilibrium price. If
�t = 1, the price of oil immediately re�ects its fundamental value, which is expected to be the case
in the more recent decades. The actual (short-run) price and quantity equations of oil that clear
5

the market at each point in time are as follows:3
Pt =�t"
dt
st + dt� �t"
st
st + dt(6)
Qt =[st + (1� �t) dt] "dt
st + dt+�tdt"
st
st + dt(7)
When oil contracts are fully �exible, i.e. �t = 1, equations (6) and (7) are equal to their equilibrium
counterparts (3) and (4).
According to this stylized model, and taking into account that oil supply and oil demand
disturbances are uncorrelated, the variability of crude oil prices and oil production are respectively:
E [Pt]2 =
�2t
��2d;t + �
2s;t
�(st + dt)
2 (8)
E [Qt]2 =
[st + (1� �t) dt]2 �2d;t + �2td2t�2s;t
(st + dt)2 (9)
Relying on equations (8) and (9), we can formulate all possible hypotheses about the sources
of the observed change in volatility of both oil market variables. We now discuss them one by one.
A change in the variance of oil market shocks. A �rst possible source of time variation in
the oil market volatilities are changes in the variances of the underlying shocks. Keeping all other
parameters of the model �xed, a change in the variance of oil market disturbances should have the
following impact on the variability of oil prices and oil production:
@E [Pt]2
@�2s;t> 0 and
@E [Qt]2
@�2s;t> 0 (10)
@E [Pt]2
@�2d;t> 0 and
@E [Qt]2
@�2d;t> 0 (11)
According to equation (10), a reduction in the standard deviation of oil supply shocks can be a
source of reduced volatility of oil production over time, but cannot explain the opposite evolution of
oil price volatility. In contrast, smaller oil supply disturbances should also result in lower variability
of crude oil prices in more recent periods. Hence, this hypothesis alone does not su¢ ce to explain
the observed volatility pattern.
The variance of average oil demand shocks might also have changed over time. On the one hand,
the gradual transition from a system of posted OPEC prices to freely �uctuating spot market prices
in the early 1980s prompted the development of oil futures markets as a means of hedging price risks
3Note that in equation (6) we assume that the oil market was in steady state before shocks occur which implies
that Pt�1 is set to 0. This is in line with the use of conditional impulse responses in the empirical analysis.
6

(Mabro 2005). This evolution is often seen as the source of the dramatic rise in oil price volatility
(Hubbard 1986). Equation (11) suggests that if the standard deviation of oil demand shocks
resulting from e.g. increased speculative activities, precautionary buying or preference shifts, were
indeed greater nowadays, they would have the potential to account for the observed increase in
oil price variability. They do not, however, explain the concomitant drop in the variability of oil
production.
On the other hand, at around the same time of the change in oil market volatility, a widespread
reduction in macroeconomic volatility took place around the globe, commonly referred to as the
"Great Moderation". Several studies indicate that this remarkable decline in volatility was not
limited to output growth and in�ation but also extended to other macroeconomic variables (e.g.
Herrera and Pesavento 2009). As such, smaller �uctuations in oil production as a result of a
decrease in the standard deviation of business-cycle driven oil demand shocks would accord well
with this general phenomenon, but not with the observed increase in oil price volatility. Since
both hypotheses relating to the demand side of the crude oil market predict that the variances of
di¤erent oil demand shocks should evolve in opposite directions over time, in our empirical analysis,
we will make an explicit distinction between oil demand shocks driven by global economic activity
and other oil demand shocks.
Time-varying price elasticities of oil demand and oil supply. A change in the short-run
price elasticities of oil demand and oil supply can also play a role as can be inferred from the
following derivations:@E [Pt]
2
@dt< 0 and
@E [Qt]2
@dt> 0 (12)
@E [Pt]2
@st< 0 and
@E [Qt]2
@st> 0 (13)
For example, a fall over time in the short-run price elasticity of oil demand in equation (12) could
rationalize the observed pattern of higher oil price volatility and lower oil production volatility.
Such a decline in the demand elasticity seems plausible a priori given the great strides oil-importing
economies have made in recent decades in preserving their use of energy.
Time variation in the short-run price elasticity of oil supply, with a lower elasticity in the more
recent past, is another plausible hypothesis to explain the volatility data in Figure 1, panel A (see
equation (13)). In this regard, Kilian (2008) observes that world oil production has been close
to its full capacity level since 1990, which has made it more di¢ cult to raise production in the
short run in response to oil demand shocks compared to the 1980s. Smith (2009) goes further
and suggests that oil production responses have been sluggish in recent years owing to OPEC
supplier�s deliberate decision not to expand productive capacity despite ample oil reserves available
for development in order to support cartel discipline. Further evidence on the recent stagnation in
7

world oil production is provided by Hamilton (2009b) and Kilian (2010). According to equation
(13), the limited ability of oil producers to adjust oil supplies results in higher oil price �uctuations
and smaller oil production variability.
More �exible crude oil prices over time. Finally, changes in the speed of oil price adjustment
to oil demand and oil supply shocks are expected to a¤ect oil market volatility. The shift in the
pricing system from long-term oil contracts towards a more transparent system of spot and futures
market trading and the collapse of OPEC in late 1985 are likely to have increased the �exibility of
the real price of oil. If a greater fraction of oil transactions is carried out on the spot market, oil
supply and demand variations are expected to translate quicker into price changes. According to
our oil market model, an increase in the speed of adjustment of the actual oil price to its equilibrium
value in�uences the variability of oil prices and oil production in the following way:
@E [Pt]2
@�t> 0 and
@E [Qt]2
@�t=
2dt(st + dt)2
�� [st + (1� �t) dt]�2d;t + �tdt�2s;t
7 0 (14)
On the one hand, more �exible contracts do result in greater oil price volatility in the short run. On
the other hand, the impact of a faster convergence to the equilibrium price level on oil production
volatility is uncertain and crucially depends on the relative variance of supply and demand shocks
in combination with the short-run price elasticities of oil supply and demand. Intuitively, since
institutional arrangements in the oil market that prevailed until the mid-eighties relied on a �xed
reference price for crude oil, adjustments to new demand conditions had to be carried out by
adapting production volumes leading to wide �uctuations in oil production. On the other hand,
stipulating a �xed price should smooth oil production, which reduces the variability. The net e¤ect
on oil production volatility therefore depends on the relative importance of both shocks. If oil
demand shocks were relatively more variable in earlier periods, for example, an increased speed
of adjustment of the real price of crude oil toward its equilibrium value alone could explain the
pattern of oil market volatility.
It is very likely that many of these potential explanations come into play simultaneously. While
the theoretical demand and supply relationships are easily established, identifying them is more
di¢ cult. In the next section, we present an empirical framework that allows us to examine the
three main hypotheses jointly.
3 Empirical methodology
Previous empirical studies about oil price volatility (e.g. Barsky and Kilian 2002; Regnier 2007;
Yang, Hwang, and Huang 2002) have shown that surges in volatility typically are not a one-time
event but re�ect sustained developments in the market. This feature is readily apparent from the
8

standard deviations of the real oil price and oil production computed over 5-year rolling windows
presented in Figure 1, panel B. Alquist, Kilian, and Vigfusson (2011) illustrate that evidence of
changes in oil price volatility is highly sensitive to the choice of the break date. This reinforces
the case that associating changes in volatility with regime shifts might not be the appropriate
modeling strategy. Even conceptually, abrupt shifts are less likely to occur in light of the transitional
nature of processes characterizing adjustments in the global market for crude oil as laid out in the
introduction. As emphasized by Primiceri (2005), models with discrete breaks are hard to reconcile
with the idea of adaptive behavior of market participants, in particular given that aggregation
among agents�assessments tends to result in smooth changes since agents would not be expected
to update their beliefs all at the same time. In fact, interpreting this gradual adjustment as the
outcome of a constant learning process on the part of oil producers and oil consumers is in sharp
contrast with the regularity a switching process implies. This would suggest that the best modeling
approach is one that allows for a slow-moving but continuous change as well as for possible jumps.
In order to accommodate these potential features of the underlying data-generating process, we
propose to use a VAR framework that features time-varying coe¢ cients and stochastic volatilities in
the innovation process as an encompassing model speci�cation.4 Given its �exibility, this approach
enables us to evaluate time variation in the variances of shocks, the short-run price elasticities of oil
supply and oil demand, and the speed of oil price adjustment. We disentangle the structural shocks
by means of sign restrictions. In particular, we identify exogenous oil supply shocks, oil demand
shocks associated with unexpected changes in global economic activity, and other oil demand shocks
that capture shifts in expectations about future oil market conditions.
3.1 A Bayesian VAR with time-varying parameters and stochastic volatility
We consider the following VAR(p) model with time-varying parameters and stochastic volatility in
the spirit of Cogley and Sargent (2005), Primiceri (2005), Benati and Mumtaz (2007), and Canova
and Gambetti (2009):
yt = Ct +B1;tyt�1 + :::+Bp;tyt�p + ut (15)
where yt is an 3� 1 vector of observed endogenous variables that contains quarterly data on globaloil production, the real U.S. re�ners�acquisition cost of imported crude oil and world industrial
production,5 Ct is a vector of time-varying intercepts, Bp;t are 3 � 3 matrices of time-varying4As pointed out by Benati and Mumtaz (2007), drifting coe¢ cient models are well known for being able to
successfully track processes subject to structural breaks or regime shifts. Consequently, while a discrete-break model
might perform well if the data-generating process is indeed of such nature, our speci�cation can be expected to work
reasonably well for both periods of smooth evolutions and periods of abrupt shifts.5All variables are transformed to non-annualized quarter-on-quarter rates of growth by taking the �rst di¤erence
of the natural logarithm. The chosen oil price variable may be viewed as the best proxy for the free market global
9

coe¢ cients on the lags of the endogenous variables, where the number of lags is set to p = 4 to
allow for su¢ cient dynamics in the system, and ut are heteroscedastic reduced-form innovations
that are normally distributed with a zero mean and a time-varying covariance matrix t. The
overall sample spans the period 1947Q1-2010Q4. The �rst 25 years of data are used as a training
sample to calibrate the priors for estimation over the actual sample period which starts in 1974Q1.6
The drifting coe¢ cients are meant to capture possible time variation in the lag structure of the
model re�ecting adaptive behavior on part of the economic agents. The multivariate time-varying
covariance matrix allows for heteroscedasticity of the shocks and time variation in the simultaneous
relationships between the variables in the system. Including the stochastic volatility component
appears appropriate given the marked changes in volatility of our two key variables documented
above, since ignoring heteroscedasticity of the disturbance terms could lead to �ctitious dynamics
in the VAR coe¢ cients as emphasized by Cogley and Sargent (2005). In other words, movements
originating from the heteroscedastic covariance structure would be picked up by the VAR coe¢ cients
leading to an upward bias. Thus, allowing for time variation in both the coe¢ cients and the
variance-covariance matrix implies that time variation can derive from changes in the magnitude of
shocks and their contemporaneous impact as well as from changes in the propagation mechanism.
We estimate this model using Bayesian techniques described in Kim and Nelson (1999).7
3.2 Identi�cation of oil supply and oil demand shocks
Baumeister and Peersman (2008) propose to identify oil supply shocks by means of sign restrictions
to analyze the dynamic consequences for the U.S. economy. We extend their approach to the
demand side of the crude oil market. An advantage of sign restrictions is the absence of a restriction
on the magnitude of the contemporaneous impact of the shocks. Moreover, in our model this
impact e¤ect as well as the short-run price elasticities can vary over time.8 Speci�cally, we place
price of crude oil. The nominal re�ners�acquisition cost has been de�ated by the U.S. consumer price index. Our
approach deviates from Peersman and Van Robays (2009) who use the nominal price of crude oil. For a discussion of
the choice between the nominal and the real price of oil, see Alquist, Kilian, and Vigfusson (2011). World industrial
production is the broadest available index at quarterly frequency to capture the state of the global economy. A
detailed description of all the data used in this paper can be found in the not-for-publication appendix.6This is the earliest possible starting date. As discussed in Barsky and Kilian (2002) and demonstrated more
formally in Alquist, Kilian, and Vigfusson (2011), the regulation of the oil price prior to 1974 undermines the validity
of standard time-series models of the oil market even when allowing for time variation. Moreover, the fact that the
price of crude oil was not determined by market forces invalidates the sign restrictions based on the competitive
market model proposed in section 2 and discussed more fully in section 3.2.7Technical details regarding the model setup, the prior speci�cations and the estimation strategy (Markov Chain
Monte Carlo algorithm) are provided in the not-for-publication appendix.8See Uhlig (2005) and Peersman (2005) for alternative applications of this identi�cation strategy and Fry and
Pagan (2010) for a critical assessment of the sign-restriction methodology in general.
10

theoretically plausible sign restrictions on the time-varying impulse responses to recover the three
underlying structural shocks we postulated to drive world oil production and the real price of
crude oil in the model presented in section 2. The sign restrictions on the impact responses of oil
production, the real price of oil and world industrial production are summarized in Table 1.9
Table 1: Identi�cation restrictions
Qoil Poil Yworld
Negative oil supply shock � 0 � 0 � 0Positive aggregate demand shock � 0 � 0 > 0
Other positive oil demand shock � 0 � 0 � 0
Oil supply shocks are disturbances that shift the oil supply curve and could be the result of oil
production disruptions due to wars, for example. According to equations (6) and (7) of our model
such an oil supply shock moves oil quantity and the real price of oil in the opposite direction. After
a negative oil supply disturbance, the reaction of world industrial production is restricted to be
non-positive.
Oil demand shocks are disturbances that displace the oil demand curve and hence, move oil
production and oil prices in the same direction. As already mentioned, there are two oil demand
shocks in the model. We make an explicit distinction between oil demand shocks associated with
unexpected �uctuations global economic activity ("aggregate demand shocks") and oil demand
shocks driven by forward-looking behavior ("other oil demand shocks"), building on Kilian (2009).
The latter type of shock can be thought of as arising from revisions to expectations which are
not limited to future demand and supply conditions in the crude oil market alone, but extend to
the global business cycle, e.g. a deterioration in the economic outlook or the anticipation of faster
growth in emerging Asia. In order to disentangle these two kinds of demand disturbances, we impose
the restrictions that positive aggregate demand shocks unambiguously increase world industrial
production, whereas other positive oil demand shocks that are related to shifts in perceptions
or news about the future induce a reduction in current real activity as a result of the oil price
increase.10
In a recent contribution Kilian and Murphy (2010) make the case that sign restrictions alone
might be too weak to derive economically meaningful implications in the context of oil market
models and that the identi�cation strategy needs to be supplemented by additional information
to sharpen the results. Kilian and Murphy (2011) propose to use boundary restrictions on the
9Note that the sign conditions are imposed as weak inequality restrictions, � or � (except for the response of
world industrial production after an aggregate demand shock), which implies that a zero response is always possible.10We explore the robustness of our results to the assumption of a zero impact on world industrial production after
the other oil demand shock in section 6.
11

magnitudes of the implied short-run price elasticities of oil demand and oil supply as auxiliary
identi�cation criteria to eliminate those structural models that are associated with implausibly high
elasticities. We follow Kilian and Murphy (2011) in imposing that the short-run price elasticity for
oil demand cannot exceed its long-run counterpart which may be inferred to be about -0.8 using
cross-sectional evidence from U.S. household surveys (see e.g. Hausman and Newey 1995). This
long-run estimate imposes only weak prior beliefs on the short-run oil demand elasticity which is
crucial given that we are interested in its evolution over time.
Although it is a widely accepted view among oil economists that the price elasticity of oil supply
is low in the short run (e.g. Hamilton 2009a, Kilian 2009), deriving a suitable upper bound for
the quarterly supply elasticity is not straightforward. For one thing, we cannot rely on the bound
introduced by Kilian and Murphy (2010) based on monthly data and there is no direct mapping to
the quarterly frequency. More importantly, it is conceivable that di¤erent bounds are economically
relevant during di¤erent historical episodes. In particular, given that we want to assess to what
extent the slope of the oil supply curve has varied over time, we need to remain relatively agnostic
on this bound. Subject to the constraint that at least one model at each point in time has to
satisfy the upper bound, we restrict the short-run price elasticity of oil supply to be at most 0.6 in
the baseline model. We also provide sensitivity analysis for other bounds.11 The computation of
impulse responses and the implementation of the sign and boundary restrictions are discussed in
detail in the not-for-publication appendix.
4 Empirical results
4.1 Changes in oil market dynamics over time
Figure 2 displays the evolution of the median impact responses of global oil production and the
real price of imported crude oil to one-standard deviation structural shocks spanning the period
1974Q1 to 2010Q4, along with 68% and 95% posterior credible sets and the full set of admissible
models. All responses have been normalized such that the structural innovations raise the real
price of oil. There is evidence of considerable time variation in the dynamic responses of the oil
market variables for all three types of disturbances. The decline in world oil production after an
unexpected oil supply disruption weakens steadily over time, whereas the reaction of the real price
of oil gets more pronounced. The time pro�le observed after the two demand-induced shocks are
similar with a gradual reduction of the e¤ect on world oil production and a consistently stronger
price response from the mid-eighties onwards, in particular after an aggregate demand shock. The
most striking regularity is the declining trend of the responses of world oil production after all11 In section 4.2.2, we illustrate that our �ndings are robust for any empirically reasonable bound on the oil supply
elasticity.
12

three structural shocks, which is suggestive of the fact that the global market for crude oil has
experienced a structural transformation.
4.2 Evaluation of hypotheses
4.2.1 Speed of adjustment
To assess whether faster convergence to the equilibrium price level is at the origin of the observed
volatility pattern, it is instructive to look at the persistence of real oil price in�ation, measured as
the normalized spectrum at frequency zero. Following Benati and Mumtaz (2007) and Canova and
Gambetti (2009), we compute the spectral density in the following way:
f�;tjT (!) = s�(I3 � �tjT e�i!)�1tjT2�
h�I3 � �tjT e�i!
��1i0s0� (16)
which is normalized by dividing by the variance (the integral of (16)) for ! = 0, with s� being a
row vector selecting oil price in�ation. Figure 3 displays the time-varying median of the normalized
spectrum of real oil price in�ation for the period 1974Q1 to 2010Q4. If sluggishness in the oil price
adjustment were an important feature only in the early part of the sample, we would expect to
see a fall in persistence coinciding with changes in the institutional structure of the oil market.
Instead, the degree of persistence appears to have been stable over time. Thus, we can discard the
hypothesis of changes in the speed of adjustment as one explanation for larger oil price �uctuations.
4.2.2 Evolution of short-run price elasticities
As �rst stressed by Barsky and Kilian (2002) and recently highlighted by Kilian (2008) and Hamilton
(2009a), among others, it is di¢ cult to trace the slope of the oil demand and oil supply curves from
the observed movements in oil quantity and oil price because these two variables are subject to
a myriad of in�uences that are hard to disentangle.12 But since we have identi�ed the structural
shocks in our empirical model that induce reactions in the oil market variables by shifting either
the oil demand or oil supply schedule, we can derive direct estimates for the implied short-run price
elasticities of oil demand and oil supply at each point in time from the impulse responses as the
percentage change in world oil production divided by the percentage change in oil prices.
12Nevertheless, Hamilton (2009a) tries to infer the slope of the oil demand curve by selecting historical episodes
in which a shift of the supply curve was the primary factor for �uctuations in oil price and production (i.e. political
events or war activities) and computes elasticities from the subsequent changes in quantities and prices. However,
no single episode in the oil market is an exclusive supply-side story. Hence, this way of recovering a measure for the
demand elasticity constitutes a rough approximation. However, interestingly, Hamilton�s measure conveys the same
message i.e. that the price elasticity of oil demand is even smaller now than it was in 1980.
13

Figure 4 reports the evolution of the median impact elasticities of oil supply and oil demand
together with the 68% and 95% posterior credible sets and the range of elasticity estimates for all
admissible models over the entire sample. Note that since we identify two di¤erent types of demand
shocks, we trace the curvature of the oil supply schedule once with the shock to global economic
activity and once with the other oil demand shock. While the oil supply curve is relatively more
elastic in the �rst part of the sample period with median elasticities in the range of 0.3 to 0.5, the
responsiveness of oil quantities supplied to changes in crude oil prices subsides from 1983 onwards
and reaches very low levels in the most recent past. This earlier period experiences a temporary
drop in the price elasticity of oil supply in 1979 during which the adjustment in the aftermath
of demand-side shocks has taken place more via prices than quantities. Notably, since the late
eighties, the median value for the oil supply elasticities falls between 0.02 and 0.25, indicating that
the supply of crude oil has become highly insensitive to changes in its price. While qualitatively
similar, the estimated magnitudes of the short-run price elasticities for the supply of crude oil
derived with the two demand-side shocks are somewhat, a �nding which might point to a di¤erent
reaction of oil production depending on the source of demand.
Similarly, the impact price elasticity of oil demand is relatively high and stable during the 1970s
with a median estimate of around -0.55, but gradually declines from a high of -0.65 in 1983 to a low
of -0.07 in 1990. The sensitivity of oil demand to price changes remains low thereafter with median
elasticities ranging from -0.06 to -0.16. The sample average of our median estimates of oil demand
elasticity of -0.26 accords well with recent estimates derived from alternative structural models
reporting elasticity estimates between -0.26 and -0.41 (Bodenstein and Guerrieri 2011, Kilian and
Murphy 2011, Serletis, Timilsina, and Vasetsky 2010). These elasticity estimates clearly provide
evidence in favor of the hypothesis that attributes the oil market volatility pattern to a decrease in
the responsiveness of respectively oil demand and supply to price changes.13
Based on Figure 4, we can also assess the evolution of the range of time-varying elasticity
estimates which we will link to historical developments in section 5. We observe that our model
implies that the short-run price elasticity of oil supply derived with aggregate demand must have
been at least 0.1 for most of the period 1980-1985, although the data also support estimates as high
as 0.6. For the later period, this range narrows substantially going from slightly above 0 to about
a maximum of 0.2 for most of 1990-2010. While oil supply elasticities obtained with the other oil
demand shock can fall between 0.02 and 0.6 in the latter part of the sample, before 1986 the lowest
attainable value was 0.25 with the exception of the 1979 episode. The smallest demand elasticity
(in absolute value) for 1974-1985 was 0.2, but it could also reach magnitudes as high as 0.8 over
the same period. From 1990 onwards, the range shifts considerably upward covering values from
13Further evidence in support of a systematic change in the estimated impact elasticities over time is presented in
section 4.1 of the not-for-publication appendix.
14

0.01 to 0.4 at best in most instances.
Figure 5 shows that the evolution of the median elasticity estimates for oil supply and oil
demand over time are robust to variations in the upper bound on the oil supply elasticity. Relaxing
the upper bounds to 0.8 and 1 does not a¤ect the estimates of the oil demand elasticity and the oil
supply elasticity derived with aggregate demand shocks, but slightly raises the median elasticity of
oil supply obtained with other oil demand shocks in the periods 1976-1978 and 1981-1985. However,
the qualitative features of the changes in the elasticity estimates over the sample period remain
intact. We do not consider values above one based on the observation that supply elasticities greater
than 1 are not plausible for a good like crude oil with limited adjustment possibilities of current
production and long lead times for capacity expansion. This additional evidence con�rms that the
time pro�le of the elasticities is not driven by the speci�c elasticity bound used in the baseline
model.
A striking feature of our results is the similarity in the evolution of the slopes of both the oil
supply and oil demand schedules, with a marked decline of both short-run price elasticities over
the period 1983-1990. In section 5, we provide some potential explanations for the concurrence of
these developments.
4.2.3 Evolution of shocks
Within a SVAR framework, it is not possible to separately measure the underlying volatility of
shocks; only the contemporaneous impact of a one-standard deviation shock on the variables, which
is a combination of the magnitude of the shock itself and the immediate reaction of the variable to
that shock, can be measured. To get an approximation of the magnitudes of one-standard devia-
tion structural shocks over time, we perform some simple back-of-the-envelope calculations. More
speci�cally, given the short-run price elasticities recovered from the estimated impulse responses,
we can compute the time-varying magnitudes of average underlying shocks by means of equations
(1) and (2) from our stylized model of the oil market. Given the simpli�ed nature of the model,
the results should however be interpreted with caution.
Figure 6 depicts the changes in the variability of average structural shocks for all admissible
models. As emerges from the graphs, all structural oil market shocks have become smaller in size
during the latter part of the sample. While the variance of oil demand shocks driven by global real
activity has been relatively high in the early part of the sample, it has been steadily diminishing since
the mid-1980s which is in line with the onset of the "Great Moderation". Around the same time,
substitution e¤ects took hold thereby lowering the oil intensity of industrial production which might
induce smaller shifts of the oil demand curve deriving from greater economic activity. However,
aggregate demand shocks seem to have gained somewhat in size again since the early 2000s.
15
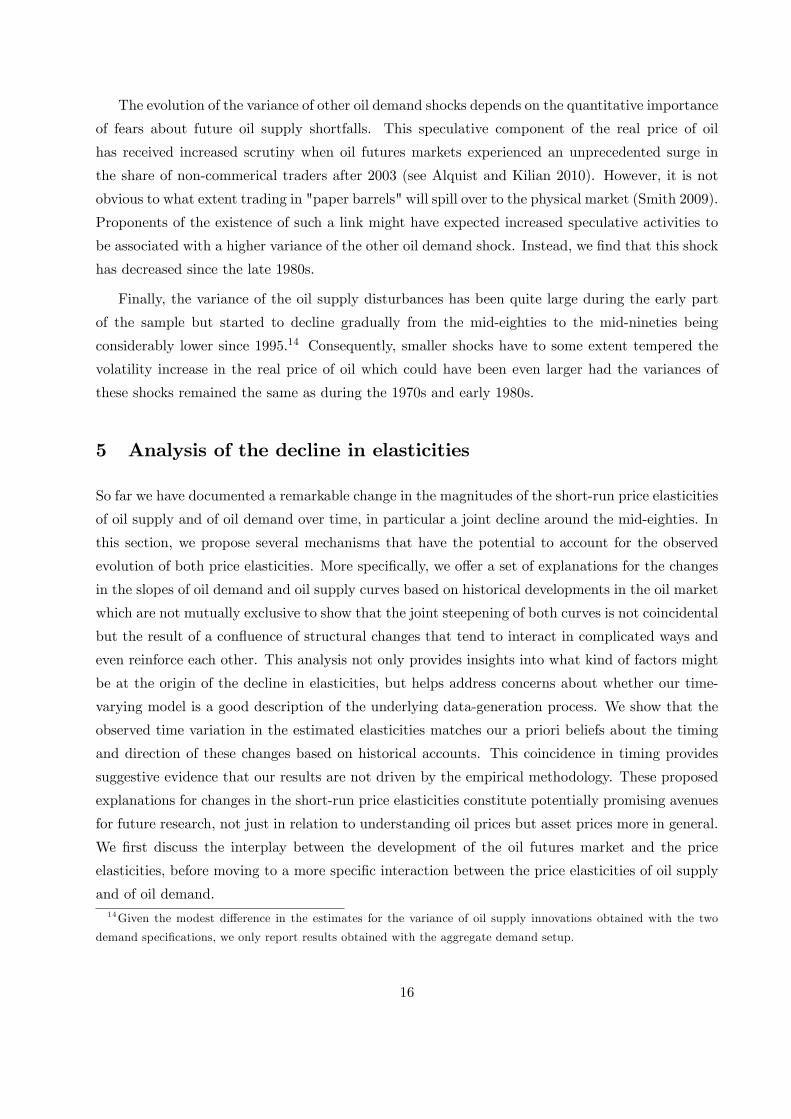
The evolution of the variance of other oil demand shocks depends on the quantitative importance
of fears about future oil supply shortfalls. This speculative component of the real price of oil
has received increased scrutiny when oil futures markets experienced an unprecedented surge in
the share of non-commerical traders after 2003 (see Alquist and Kilian 2010). However, it is not
obvious to what extent trading in "paper barrels" will spill over to the physical market (Smith 2009).
Proponents of the existence of such a link might have expected increased speculative activities to
be associated with a higher variance of the other oil demand shock. Instead, we �nd that this shock
has decreased since the late 1980s.
Finally, the variance of the oil supply disturbances has been quite large during the early part
of the sample but started to decline gradually from the mid-eighties to the mid-nineties being
considerably lower since 1995.14 Consequently, smaller shocks have to some extent tempered the
volatility increase in the real price of oil which could have been even larger had the variances of
these shocks remained the same as during the 1970s and early 1980s.
5 Analysis of the decline in elasticities
So far we have documented a remarkable change in the magnitudes of the short-run price elasticities
of oil supply and of oil demand over time, in particular a joint decline around the mid-eighties. In
this section, we propose several mechanisms that have the potential to account for the observed
evolution of both price elasticities. More speci�cally, we o¤er a set of explanations for the changes
in the slopes of oil demand and oil supply curves based on historical developments in the oil market
which are not mutually exclusive to show that the joint steepening of both curves is not coincidental
but the result of a con�uence of structural changes that tend to interact in complicated ways and
even reinforce each other. This analysis not only provides insights into what kind of factors might
be at the origin of the decline in elasticities, but helps address concerns about whether our time-
varying model is a good description of the underlying data-generation process. We show that the
observed time variation in the estimated elasticities matches our a priori beliefs about the timing
and direction of these changes based on historical accounts. This coincidence in timing provides
suggestive evidence that our results are not driven by the empirical methodology. These proposed
explanations for changes in the short-run price elasticities constitute potentially promising avenues
for future research, not just in relation to understanding oil prices but asset prices more in general.
We �rst discuss the interplay between the development of the oil futures market and the price
elasticities, before moving to a more speci�c interaction between the price elasticities of oil supply
and of oil demand.14Given the modest di¤erence in the estimates for the variance of oil supply innovations obtained with the two
demand speci�cations, we only report results obtained with the aggregate demand setup.
16
5.1 Oil futures markets and the short-run price elasticities of oil demand and
supply
At the time of the onset of the decline in both impact price elasticities in the early eighties, an
important structural transformation occurred in the oil market when the market moved from a
system of administered oil prices to a market-based system of spot trading and the subsequent
development of derivatives markets. Hubbard (1986) considers this shift as the source of greater oil
price volatility, which attracted speculators and fostered the creation and expansion of oil futures
markets. On the other hand, Smith (2009) argues that oil futures trading by speculators and hedgers
should hardly exert any e¤ect on the physical oil market, unless the buoyant futures market fuels a
revision of expectations about spot prices, which induces a reaction from market participants such
as an accumulation of oil inventories or a fall in production that should in�uence current oil prices.
While the development of oil futures markets might not have a direct impact on the physi-
cal market, the availability of oil futures contracts as a risk management tool has the potential
of indirectly altering the behavior of commercial traders on both sides of the oil market. More
speci�cally, re�neries and other oil consumers engage in oil futures trading to protect their business
operations against unfavorable price movements by entering into a hedging contract. For instance,
an airline company that wants to eliminate price risks associated with its future fuel purchases has
to buy oil futures today to lock in the desired price for future delivery. Likewise, oil producers can
lock in future sales revenues and pro�t margins and hedge themselves against declines in prices by
selling oil futures contracts given their long position in physical oil. As a result, both consumers
and producers will become less responsive to price changes because physical purchases and sales of
crude oil are hedged by o¤setting �nancial positions in the oil futures market.
Figure 7 shows the total quarterly trading volume of oil futures contracts with less than one
year to maturity traded on the New York Mercantile Exchange (NYMEX) for the period 1983Q2
to 2010Q4.15 The steady decrease in the short-run price elasticities of oil demand and oil supply
uncovered in our empirical analysis coincides with the creation and expansion of oil futures trading
during 1983-1990 which provided increasing opportunities for market participants to shield them-
selves from adverse future price developments. The observed rise in hedging activities is consistent
with the perception of a diminished sensitivity of commercial dealers to oil price �uctuations in
the spot market, contributing to less elastic oil demand and supply curves. The reduced price
elasticities of demand and supply result in increased oil price volatility which further encourages
the development of derivatives markets.
15Crude oil futures contracts based on West Texas Intermediate (WTI) grade were launched on the NYMEX in
March 1983. Up to 1989, the longest maturity for those contracts was 12 months, but even after the introduction
of longer-dated contracts, trading was concentrated in maturities up to one year which makes our volume measure a
good indicator of overall activity in the oil futures market (see also Neuberger 1999 and Alquist and Kilian 2010).
17

5.2 In�uence of investment and capacity constraints on supply and demand in
the oil market
The joint decline of both short-run price elasticities over the period 1983 to 1990 is also consistent
with an interplay between developments on the demand side of the crude oil market that trigger
reactions on the supply side which in turn a¤ect demand.16 Following the oil price shocks of the
1970s, the delayed consequences of increased energy conservation and substitution processes away
from oil to alternative sources of energy are likely to have contributed to a reduction in the short-run
price elasticity of oil demand from the early eighties onwards.17 According to Gately (2004), if the
price elasticity of crude oil demand is relatively low, oil producers may purposefully refrain from
expanding production capacity at a rapid pace to preserve the revenues from higher oil prices. Thus,
the price elasticity of oil demand feeds back into the supply behavior of oil producers by reducing
the incentives to bring new capacity on stream, which leads to less investments in infrastructure
and a gradual erosion of idle capacity. Moreover, the geographic concentration of proven oil reserves
in a limited number of OPEC countries, where investment decisions are not purely determined by
economic considerations but also political factors, might have impaired the necessary investments in
the oil sector.18 In fact, Smith (2009) advances the view that OPEC members pursue the deliberate
strategy of limiting the growth of productive capacity in the interest of the common good of the
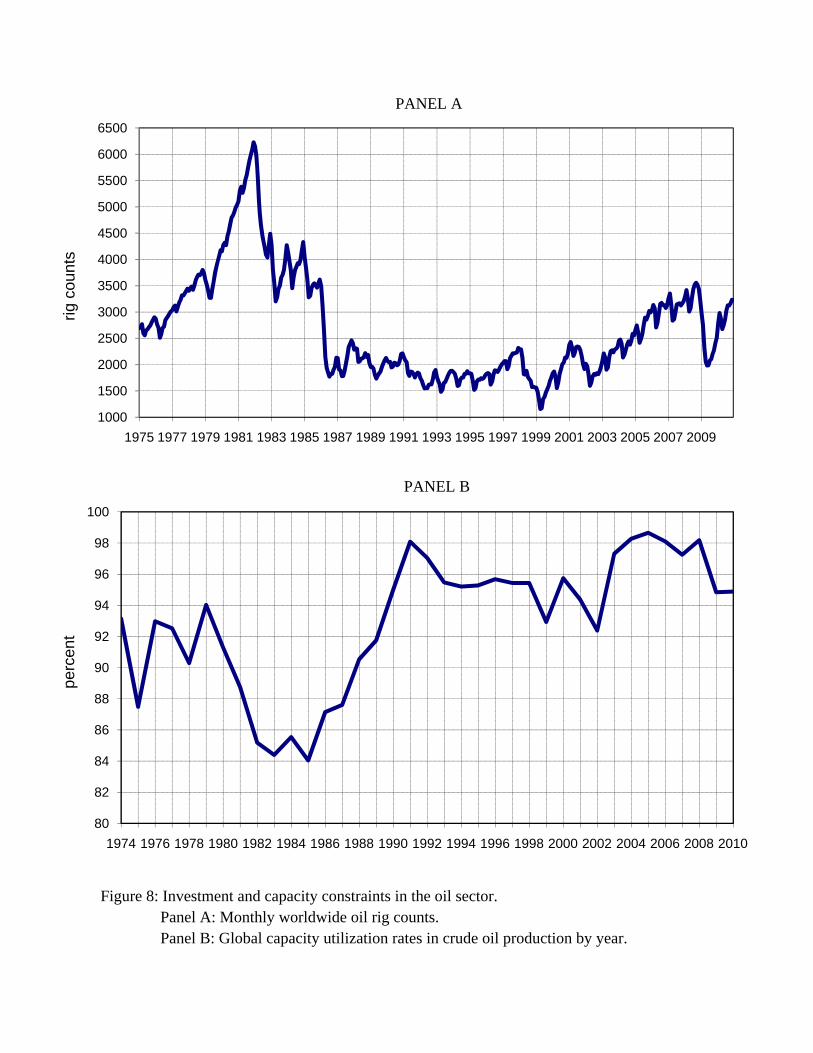
cartel. This evolution is illustrated in Figure 8. Panel A shows worldwide active rig counts for the
period 1975M1 to 2010M12 which can be considered as one of the primary measures of exploratory
activity in the oil industry and hence, a good indicator for investment in productive capacity. Panel
B displays the annual global capacity utilization rates of crude oil production from 1974 to 2010.
The substantial drop in investment activities during the early 1980s goes hand in hand with the
notable decrease in the price elasticity of oil supply in anticipation of a reduction in �exibility of oil
producers to o¤set unexpected oil market disturbances by raising oil production which is re�ected
in the subsequenct increase in the utilization of existing capacity.19 In addition, the increased oil
price volatility may increase uncertainty causing investment in exploration and development to be
16Hamilton (2009b, p.228) exempli�es this interaction by stating that "it is a matter of conjecture whether the
decline in Saudi production in 2007 should be attributed to depletion, [::: or] to a deliberate policy decision in response
to a perceived decline in the price elasticity of demand."17We refer to Baumeister and Peersman (2008) and references therein for a more detailed description of develop-
ments in oil-importing countries which are in line with a decrease in the short-run price elasticity of oil demand.18Political impediments for the expansion of capacity can be sought in the fear of expropriation, a resurgence of
"resource nationalism" i.e. refusal of foreign direct investments and concerns about rapid depletion of oil resources
i.e. preservation of oil reserves for future generations.19Geroski et al. (1987) and Smith (2005) make the case that also the market structure plays an important role
in determining the extent to which individual oil producers are willing to o¤set supply losses that occur elsewhere
in the system and that their conduct (cooperative vs competitive) varies in function of excess capacity among other
factors.
18

postponed.
The lack of investment and the presence of capacity constraints do not only a¤ect the supply
side of the global oil market but also have the potential to induce a di¤erent behavior on the
demand side. In fact, high rates of capacity utilization can put considerable strain on oil consumers
in that they signal market tightness and hence raise fears about future oil scarcity, which makes
market participants willing to pay a higher insurance premium for the same quantity of oil to shield
themselves from potential shortfalls in oil delivery (Alquist and Kilian 2010).20 This means that
the share of precautionary demand in total oil demand increases when the oil sector is operating
close to full capacity because agents anticipate that in case of a major oil shock, a shortfall in
production volumes cannot be replaced by other producers since no idle capacity is left that could
act as a bu¤er against abrupt disruptions. As a result, overall oil demand becomes less elastic.
This is re�ected in the sustained decline in the short-run price elasticity of oil demand observed
over the period 1985 to 1991 which closely follows the increase in global capacity utilization rates.
Oil demand remains less price sensitive thereafter because of consistently low spare capacity.
6 Sensitivity analysis
Model speci�cation. One contribution of our paper is to introduce a new world industrial
production index for measuring global real activity. An alternative speci�cation that has been
widely used in structural oil market models (e.g. Kilian 2009; Kilian and Murphy 2010, 2011) relies
on a di¤erent indicator of the global business cycle based on shipping rates to capture shifts in
the demand for all industrial commodities in combination with the real price of crude oil being
speci�ed in log-levels to preserve the low-frequency covariation in the data. It might be of concern
that �ltering out this low-frequency co-movement by �rst-di¤erencing the data as we do in our
benchmark VAR model could drive the results. It is therefore of interest to assess the robustness of
our �ndings to this alternative model speci�cation that includes the real re�ners�acquisition cost
of oil imports expressed in log deviations from its mean and replaces world industrial production
growth with the quarterly averages of the business cycle index of global real economic activity
proposed in Kilian (2009) which is expressed in percent deviations from a linear trend, representing
increasing returns to scale in shipping. Our conclusions remain largely unchanged for this competing
speci�cation. The general pattern of the impulse responses over time and the considerable decline
in both impact price elasticities are robust.21
20This induced change in demand behavior (which concerns the slope of the curve) has to be clearly distinguished
from other oil demand shocks; in the former case, oil consumers assign a greater value to the same amount of oil i.e.
they pay a premium to ensure that they get this amount, whereas in the latter case, they e¤ectively want to increase
the quantity demanded (i.e. a shift of the oil demand curve) for stockbuilding.21Further evidence is presented in Figures 4A and 5A in the not-for-publication appendix.
19

Identi�cation assumptions. The other oil demand shock captures shifts in the market�s assess-
ment related to uncertainty about future developments. While this expectation-driven component
of oil demand is readily re�ected in instantaneous movements in the price and quantity of oil,
its e¤ect on world industrial production is ambiguous. In fact, it may take some time until the
repercussions of such a shock are felt on the global business cycle. To explore the sensitivity of
our results to a delayed response in world industrial production after the other oil demand shock,
we impose a contemporaneous zero restriction instead of postulating that economic activity should
decline on impact.22 Our �ndings are remarkably robust to this modi�cation in the identi�ca-
tion assumptions.23 We still obtain the same time pro�le for both the impulse responses and the
short-run price elasticities of oil demand and supply as in the benchmark case.
7 Conclusions
In this paper, we documented the previously unnoticed fact that the increase in oil price volatility
since the mid-eighites has been accompanied by a signi�cant decline in oil production volatility.
We derived a set of potential hypotheses from a stylized demand and supply model for the crude
oil market to explain this observation and assessed their validity in a uni�ed empirical framework.
Since the evolution of the oil market volatilities can be accounted for by changes in the variances of
structural shocks, changes in the speed of adjustment as a result of modi�cations in the institutional
structure of the oil market and/or changes in the demand and supply behavior for crude oil,
we estimated a time-varying vector autoregression model for the period 1974Q1 to 2010Q4 that
captures potential time variation in the dynamic relationships and the volatility of the structural
shocks. For the identi�cation of oil supply shocks, oil demand shocks caused by shifts in global
economic activity and other oil demand shocks driven by forward-looking behavior, we proposed a
set of sign restrictions. The model was used �rst, to derive short-run price elasticities of oil supply
and demand that are not a priori restricted to be zero on impact and second, to trace the evolution
of the slopes of oil supply and demand curves, the volatility of structural shocks and the degree of
price �exibility over time.
We found that the variances of the structural shocks decreased over time and hence, changes in
the shock variances cannot explain the increased oil price volatility. Instead, the main reason for the
higher oil price volatility and smaller oil production volatility in more recent times is the substantial
decrease in the short-run price elasticities of oil supply and of oil demand. Put di¤erently, both
curves have become so inelastic that even small disturbances on either side of the market generate
large price jumps but only moderate quantity adjustments.22For details regarding the implementation of a single zero restriction, we refer to the not-for-publication appendix.23Figures 6A and 7A in the not-for-publication appendix report the impulse responses and the elasticity estimates
obtained with this new identi�cation scheme.
20

We provided a non-exhaustive list of historical developments in the oil market that are consistent
with the joint evolution of the price elasticities and help rationalize our results. We conjectured
that the steepening of the oil supply and demand curves since the mid-eighties is the result of an
interplay between several factors. In particular, the absence of excess oil production capacity and
the lack of investment in the oil sector may have contributed to a decline in the price elasticities
of oil supply and of oil demand. The corresponding surge in oil price volatility may have fostered
the deepening of oil futures markets to cope with the increased uncertainty, which in turn further
reduced the sensitivity of oil supply and demand to changes in crude oil prices.
In our analysis we have maintained that oil consumption equals oil production abstracting from
the possibility that part of the oil output available today might be put into storage for consumption
in the future. In recent research, Kilian and Murphy (2011) proposed an alternative de�nition of the
oil demand elasticity that takes changes in oil inventories into account, but their model postulates
a stable relationship over the entire post-1973 period. It would be interesting to explore how much
the inclusion of oil inventories matters for this elasticity estimate and how much this has varied over
time. We consider this an interesting avenue for future research. Another question that emerges is
whether time variation in volatilities or price elasticities is an important feature of other types of
assets such as exchange rates, stock, house or commodity prices.
21

References
[1] Alquist R, Kilian L. 2010. What do we learn from the price of crude oil futures? Journal of
Applied Econometrics 25(4): 539-573.
[2] Alquist R, Kilian L and Vigfusson R. 2011. Forecasting the price of oil. Prepared for: Handbook
of Economic Forecasting, 2, Elliott G, Timmermann A (eds.). Amsterdam, North-Holland.
[3] Barsky RB, Kilian L. 2002. Do we really know that oil caused the Great Stag�ation? A
monetary alternative. In NBER Macroeconomics Annual 2001, Bernanke BS, Rogo¤KS (eds.).
MIT Press: Cambridge, MA; 137-183.
[4] Baumeister C, Peersman G. 2008. Time-varying e¤ects of oil supply shocks on the U.S. econ-
omy. Ghent University Working Paper 515.
[5] Benati L, Mumtaz H. 2007. U.S. evolving macroeconomic dynamics: a structural investigation.
ECB Working Paper 746.
[6] Bodenstein M, Guerrieri L. 2011. Oil e¢ ciency, demand, and prices: a tale of ups and downs.
Mimeo, Federal Reserve Board.
[7] Canova F, Gambetti L. 2009. Structural changes in the U.S. economy: is there a role for
monetary policy? Journal of Economic Dynamics and Control 33(2): 477-490.
[8] Cogley T, Primiceri GE, Sargent TJ. 2010. In�ation-gap persistence in the US. American
Economic Journal: Macroeconomics 2(1): 43-69.
[9] Cogley T, Sargent TJ. 2005. Drifts and volatilities: monetary policies and outcomes in the
post WWII US. Review of Economic Dynamics 8(2): 262-302.
[10] Fry R, Pagan A. 2010. Sign restrictions in structural vector autoregressions: a critical review.
Journal of Economic Literature, forthcoming.
[11] Gately D. 2004. OPEC�s incentives for faster output growth. Energy Journal 25(2): 75-96.
[12] Geroski PA, Ulph AM, Ulph DT. 1987. A model of the crude oil market in which market
conduct varies. Economic Journal 97: 77-86.
[13] Hamilton JD. 2009a. Understanding crude oil prices. Energy Journal 30(2): 179-206.
[14] Hamilton JD. 2009b. Causes and consequences of the oil shock of 2007-08. Brookings Papers
on Economic Activity 40(1): 215-261.
[15] Hausman, JA, Newey WK. 1995. Nonparametric estimation of exact consumers�surplus and
deadweight loss. Econometrica 63: 1445-1476.
22

[16] Herrera AM, Pesavento E. 2009. Oil price shocks, systematic monetary policy, and the �Great
Moderation�. Macroeconomic Dynamics 13(1): 107-137.
[17] Hubbard RG. 1986. Supply shocks and price adjustment in the world oil market. Quarterly
Journal of Economics 101(1): 85-102.
[18] Kilian L. 2008. Exogenous oil supply shocks: how big are they and how much do they matter
for the U.S. economy? Review of Economics and Statistics 90(2): 216-240.
[19] Kilian L. 2009. Not all oil price shocks are alike: disentangling demand and supply shocks in
the crude oil market. American Economic Review 99(3): 1053-1069.
[20] Kilian L. 2010. Oil Price Shocks, Monetary Policy and Stag�ation. In In�ation in an Era of
Relative Price Shocks, Fry R, Jones C, Kent C (eds.). Sydney; 60-84.
[21] Kilian L, Murphy DP. 2010. Why agnostic sign restrictions are not enough: understanding
the dynamics of oil market VAR models. Journal of the European Economic Association,
forthcoming.
[22] Kilian L, Murphy DP. 2011. The role of inventories and speculative trading in the global market
for crude oil. Mimeo, http://www-personal.umich.edu/~lkilian/MS2010126R1.pdf [15 Septem-
ber 2011].
[23] Kim C-J, Nelson CR. 1999. State-Space Models with Regime Switching: Classical and Gibbs
Sampling Approaches with Applications. MIT Press: Cambridge, Mass.
[24] Mabro R. 2005. The international oil price regime: origins, rationale and assessment. Journal
of Energy Literature 11(1): 3-20.
[25] Neuberger A. 1999. Hedging long-term exposures with multiple short-term futures contracts.
Review of Financial Studies 12: 429-459.
[26] Peersman G. 2005. What caused the early millennium slowdown? Evidence based on vector
autoregressions. Journal of Applied Econometrics 20(2): 185-207.
[27] Peersman G, Van Robays I. 2009. Oil and the Euro area economy. Economic Policy 24(60):
603-651.
[28] Primiceri GE. 2005 Time varying structural vector autoregressions and monetary policy. Re-
view of Economic Studies 72(3): 821-852.
[29] Regnier E. 2007. Oil and energy price volatility. Energy Economics 29(3): 405-427.
23

[30] Serletis A, Timilsina G, Vasetsky O. 2010. International evidence on interfuel substitution.
Energy Journal 31(1): 1-29.
[31] Smith JL. 2005. Inscrutable OPEC? Behavioral tests of the cartel hypothesis. Energy Journal
26(1): 51-82.
[32] Smith JL. 2009. World oil: market or mayhem? Journal of Economic Perspectives 23(3):
145-164.
[33] Uhlig H. 2005. What are the e¤ects of monetary policy on output? Results from an agnostic
identi�cation procedure. Journal of Monetary Economics 52(2): 381-419.
[34] Yang CW, Hwang MJ, Huang BN. 2002. An analysis of factors a¤ecting price volatility of the
US oil market. Energy Economics 24(2): 107-119.
24

PANEL A
PANEL B
Figure 1: Volatility measures. Panel A: Volatility of the real refiners’ acquisition cost of imported crude oil and of world oil production for 1974Q1-2010Q4. Panel B: Median time-varying unconditional standard deviation (solid line) of the real refiners’ acquistion cost of imported crude oil and of world oil production based on the benchmark model estimated in Section 3 (solid line) and based on 5-year rolling windows (dotted line). Shaded areas indicate 95% coverage of the posterior distribution.
1975 1980 1985 1990 1995 2000 2005 2010-8
-6
-4
-2
0
2
4
6
8World oil production growth
1975 1980 1985 1990 1995 2000 2005 2010-80
-60
-40
-20
0
20
40Changes in the real oil price
1975 1980 1985 1990 1995 2000 2005 20100
1
2
3
4
5
6Standard deviation of world oil production
1975 1980 1985 1990 1995 2000 2005 20100
10
20
30
40
50
60
70Standard deviation of the real oil price
95% of distributionmedian5-year rolling window

Figure 2: Time-varying median impact impulse responses (thick solid lines) of world oil production and the real price of crude oil after oil supply shocks (1st row), other oil demand shocks (2nd row) and aggregate demand shocks (3rd row) where the dark and light shaded areas indicate respectively 68% and 95% posterior credible sets and the thin black lines indicate the range of admissible models.
1975 1980 1985 1990 1995 2000 2005 2010
-4
-3
-2
-1
0World oil production
Oil
supp
ly s
hock
1975 1980 1985 1990 1995 2000 2005 20100
10
20
30
Real oil price
1975 1980 1985 1990 1995 2000 2005 20100
1
2
3
4
Oth
er o
il de
man
d sh
ock
1975 1980 1985 1990 1995 2000 2005 20100
10
20
30
1975 1980 1985 1990 1995 2000 2005 20100
1
2
3
4
Agg
rega
te d
eman
d sh
ock
1975 1980 1985 1990 1995 2000 2005 20100
10
20
30

Figure 3: Time-varying normalized spectrum of real oil price inflation as a measure of persistence where the shaded area covers 95% of the posterior distribution and the solid line is the median.
1975 1980 1985 1990 1995 2000 2005 20100
0.02
0.04
0.06
0.08
0.1Persistence of real oil price inflation
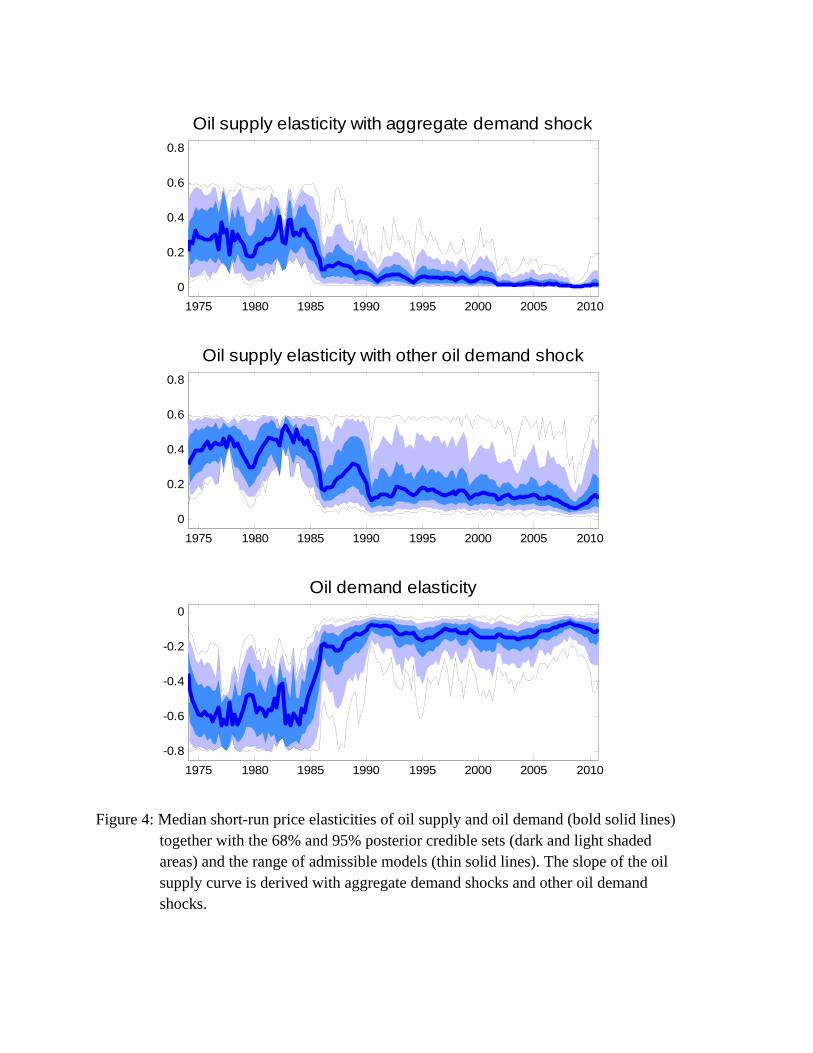
Figure 4: Median short-run price elasticities of oil supply and oil demand (bold solid lines) together with the 68% and 95% posterior credible sets (dark and light shaded areas) and the range of admissible models (thin solid lines). The slope of the oil supply curve is derived with aggregate demand shocks and other oil demand shocks.
1975 1980 1985 1990 1995 2000 2005 20100
0.2
0.4
0.6
0.8
Oil supply elasticity with aggregate demand shock
1975 1980 1985 1990 1995 2000 2005 20100
0.2
0.4
0.6
0.8
Oil supply elasticity with other oil demand shock
1975 1980 1985 1990 1995 2000 2005 2010-0.8
-0.6
-0.4
-0.2
0
Oil demand elasticity

Figure 5: Median short-run price elasticities of oil supply and oil demand with an upper bound on the oil supply elasticity of 0.6 (solid blue line), 0.8 (red crosses) and 1 (black dots).
1975 1980 1985 1990 1995 2000 2005 20100
0.2
0.4
0.6
0.8
1Oil supply elasticity with aggregate demand shock
1975 1980 1985 1990 1995 2000 2005 20100
0.2
0.4
0.6
0.8
1Oil supply elasticity with other oil demand shock
1975 1980 1985 1990 1995 2000 2005 2010-1
-0.8
-0.6
-0.4
-0.2
0
Oil demand elasticity

Figure 6: Set of structural residuals derived with back-of-the-envelope calculation for all admissible models (thin solid lines), the 68% and 95% posterior credible sets (dark and light shaded areas) with the median shown as bold solid line.
1975 1980 1985 1990 1995 2000 2005 20100
4
8
12
Other oil demand shock
1975 1980 1985 1990 1995 2000 2005 20100
4
8
12
Aggregate demand shock
1975 1980 1985 1990 1995 2000 2005 20100
4
8
12
Oil supply shock

Figure 7: Total quarterly trading volume of WTI futures contracts with less than one year to maturity. The vertical line indicates the point in time when the lowest oil demand elasticity was reached.
1985 1990 1995 2000 2005 201010
11
12
13
14
15
16
17
18Trading volume of oil futures contracts on the NYMEX
log
of to
tal n
umbe
r of c
ontra
cts
PANEL A
PANEL B
Figure 8: Investment and capacity constraints in the oil sector. Panel A: Monthly worldwide oil rig counts. Panel B: Global capacity utilization rates in crude oil production by year.
1000
1500
2000
2500
3000
3500
4000
4500
5000
5500
6000
6500
1975 1977 1979 1981 1983 1985 1987 1989 1991 1993 1995 1997 1999 2001 2003 2005 2007 2009
rig c
ount
s
80
82
84
86
88
90
92
94
96
98
100
1974 1976 1978 1980 1982 1984 1986 1988 1990 1992 1994 1996 1998 2000 2002 2004 2006 2008 2010
perc
ent