cross-price elasticities of demand across 114 countries
TRANSCRIPT
EconomicResearchService
TechnicalBulletinNumber 1925
March 2010
Anita RegmiJames L. Seale, Jr.
Cross-Price Elasticities of Demand Across 114 Countries
United States Department of Agriculture
ww
ww
w.er
s.usda.govoo
Find additional information about global food markets and related topics at:
http://www.ers.usda.gov/Briefing/globalfoodmarkets/
Visit Our Website To Learn More!
National Agricultural LibraryCataloging Record:
The U.S. Department of Agriculture (USDA) prohibits discrimination in all its programs and activities on the basis of race, color, national origin, age, disability, and, where applicable, sex, marital status, familial status, parental status, religion, sexual orientation, genetic information, political beliefs, reprisal, or because all or a part of an individual’s income is derived from any public assistance program. (Not all prohibited bases apply to all programs.) Persons with disabilities who require alternative means for communication of program information (Braille, large print, audiotape, etc.) should contact USDA’s TARGET Center at (202) 720-2600 (voice and TDD).
To file a complaint of discrimination write to USDA, Director, Office of Civil Rights, 1400 Independence Avenue, S.W., Washington, D.C. 20250-9410 or call (800) 795-3272 (voice) or (202) 720-6382 (TDD). USDA is an equal opportunity provider and employer.
Regmi, Anita. Cross-price elasticities of demand across 114 countries. (Technical bulletin (United States. Dept. of Agriculture); no. 1925)
1. Cost and standard of living. 2. Prices. 3. Elasticity (Economics) I. Seale, James L. II. United States. Dept. of Agriculture. Economic Research Service. III. Title.
HD6978
Photo credit: Thinkstock.
United StatesDepartmentof Agriculture
www.ers.usda.gov
A Report from the Economic Research Service
Abstract
This report presents a simple methodology for calculating cross-price elasticities across countries, using the Frisch own-price elasticity. Cross-price elasticities are calculated for 9 major consumption categories from the 1996 International Comparison Program data across 114 countries. The consumption categories are: food, beverage, and tobacco; clothing and footwear; education; gross rent, fuel, and power; house furnishings and operations; medical care; recreation; transport and communications; and “other” items. Additionally, cross-price elasticities are calculated and reported for a two-good demand system of food and nonfood. The elasticity estimates from this report are the only avail-able consistent cross-country cross-price elasticity estimates across such a large number of countries and consumption categories.
Keywords: Cross-country demand analysis, cross-price elasticities, 1996 ICP data, Florida Model, Frisch elasticity, complete demand analysis, food demand
About the Authors
Anita Regmi is an agricultural economist with the Economic Research Service, USDA, in the Market and Trade Economics Division. James L. Seale, Jr., is a professor in the Food and Resource Economics Department, University of Florida, Gainesville.
Acknowledgments
The authors thank Mathew Shane, Suchada Langley, Barry Krissoff, Margaret Andrews, and Carlos Arnade of the Economic Research Service, USDA; Terry Roe of the University of Minnesota; and Jeffrey Reimer of Oregon State University for their review comments. Special thanks are extended to the researchers whose incessant queries provided an inspiration to the authors to complete this report, and to the International Comparison Program Division of the World Bank for providing the data. Partial support for this project was provided by the U.S. Department of Agriculture under Agreement No. 58-3000-7-0104 and the International Agriculture Trade Center, IFAS, University of Florida. The authors thank Courtney Knauth for editorial advice and Wynnice Pointer-Napper for fi nal document layout and charts.
Anita Regmi, [email protected] L. Seale, Jr.
Cross-Price Elasticities of Demand Across 114 Countries
TechnicalBulletin Number 1925
March 2010
iiCross-Price Elasticities of Demand Across 114 Countries / TB-1925
Economic Research Service / USDA
Contents
Summary. . . . . . . . . . . . . . . . . . . . . . . . . . . . . . . . . . . . . . . . . . . . . . . . . . . iii
Introduction . . . . . . . . . . . . . . . . . . . . . . . . . . . . . . . . . . . . . . . . . . . . . . . . . 1
Background. . . . . . . . . . . . . . . . . . . . . . . . . . . . . . . . . . . . . . . . . . . . . . . . . . 2
Data . . . . . . . . . . . . . . . . . . . . . . . . . . . . . . . . . . . . . . . . . . . . . . . . . . . . . . . . 4
Methodology . . . . . . . . . . . . . . . . . . . . . . . . . . . . . . . . . . . . . . . . . . . . . . . . . 6
Three Types of Price Elasticities. . . . . . . . . . . . . . . . . . . . . . . . . . . . . . . . . 9
Empirical Results . . . . . . . . . . . . . . . . . . . . . . . . . . . . . . . . . . . . . . . . . . . . 11 Marginal Shares . . . . . . . . . . . . . . . . . . . . . . . . . . . . . . . . . . . . . . . . . . . 11 Cross-Price Elasticities in a Two-Good Demand System . . . . . . . . . . . . 12 Cross-Price Elasticities in a Nine-Good Demand System . . . . . . . . . . . 16
Conclusions . . . . . . . . . . . . . . . . . . . . . . . . . . . . . . . . . . . . . . . . . . . . . . . . . 19
References . . . . . . . . . . . . . . . . . . . . . . . . . . . . . . . . . . . . . . . . . . . . . . . . . . 21
Appendix tables . . . . . . . . . . . . . . . . . . . . . . . . . . . . . . . . . . . . . . . . . . . . . 25
Recommended citation format for this publication:
Regmi, Anita, and James L. Seale, Jr. Cross-Price Elasticities of Demand Across 114 Countries. TB-1925. U.S. Department of Agriculture, Economic Research Service, March 2010.

iiiCross-Price Elasticities of Demand Across 114 Countries / TB-1925
Economic Research Service / USDA
Summary
The extent to which price fl uctuations in one good may affect the demand for other goods (that is, the cross-price elasticities) varies across goods and countries. This report estimates cross-price elasticities across 114 countries for 9 major consumption categories: food, beverage, and tobacco; clothing and footwear; education; gross rent, fuel, and power; house furnishings and operations; medical care; recreation; transport and communications; and “other” items. In addition, the analysis provides cross-price elasticities for a two-good demand system involving food and nonfood items. The estimates are based on 1996 price data from the International Comparison Program, a multinational statistical project that collects price data that can be compared internationally for a basket of goods and services. The elasticities presented here are the only consistent, cross-country, cross-price estimates available for such a large number of countries and consumption categories.
What Is the Issue?
Price increases in goods and services may induce consumers to substitute cheaper products for more expensive—but perhaps higher quality—products that they feel they can no longer afford. Price increases also reduce the real income of consumers, leaving less disposable income for other goods and services. At the global level, price increases may reverse gains made by poor nations toward improved nutrition and welfare for their populations. This study’s estimates of consumer response to rising and falling prices across 114 countries can help policymakers assess future needs for goods and services, as well as for related transport and infrastructure. Awareness of demand and consumption trends across countries, essential for predicting shifts in demand for different products, can be a valuable tool for those in the agricultural, manufacturing, education, health, and energy sectors.
What Did the Study Find?
For each category of goods, the study estimated 2 sets of cross-price elas-ticities for 114 countries: (1) the compensated Slutsky elasticity, calculated assuming that the real level of income stays constant, compensated by an amount equivalent to the price rise of the good; and (2) the uncompensated Cournot elasticity, calculated assuming that the existing level of income stays constant, with no money added to cover the good’s increased price.
Two-Good (Food-Nonfood) Elasticity Comparisons
In the two-good (food-nonfood) model, an increase in the price of the non-food good, when accompanied with a compensating increase in income (the Slutsky elasticity), prompts increased food demand in all countries, but the middle-income countries experience the greatest increase in food demand.
By comparison, an increase in the price of a nonfood good, when not accom-panied by a compensating increase in income (the Cournot elasticity), leads to increased food demand in the poorest countries and declining food demand in wealthier countries.
ivCross-Price Elasticities of Demand Across 114 Countries / TB-1925
Economic Research Service / USDA
Nine-Good Elasticity Comparisons
In the nine-good model, when price increases are offset by equivalent income increases (Slutsky elasticities), the model fi nds:
• A price increase for one good triggers increased demand for the other eight goods; that is, the Slutsky cross-price elasticities are positive. But the demand increases for the other goods are not equal. Demand for the more luxurious of the remaining eight goods, such as recreation, increases more than demand for a necessity, such as food or clothing.
• When the price of a necessity (food or clothing) rises, the increases in demand for the other eight goods are greatest in the low-income countries and smallest in the high-income countries. That is, the Slutsky elasticities decrease as the income level trends upward across the 114 countries.
• When the price of a non-necessity rises, increases in demand for the other eight goods (except for food) are smaller in the low-income coun-tries than in the high-income countries; that is, the Slutsky cross-price elasticities are lower in the low-income countries and higher in the high-income countries.
In the nine-good model, when there is no increase in income to offset the price increases (the Cournot elasticities), the model fi nds:
• When a price increases for a necessity, the demand for all the other goods declines; that is, the Cournot cross-price elasticities for food and clothing are negative. That is true for all countries: low-income, middle-income, and high-income.
• When a price increases for a non-necessity, the demand response varies, based on the country’s income level and the good in question. For example:
In all countries, when the price of recreation increases, the demand for other goods rises; that is, the Cournot cross-price elasticities are positive for recreation.
On the other hand, when the price of transport and communica-tions rises, the demand for other goods goes up in low-income countries, but declines in middle- and high-income countries. That is, the Cournot cross-price elasticity for transport and com-munications is positive in low-income countries and negative in high-income countries.
How Was the Study Conducted?
This study builds on the models and fi ndings from an earlier ERS report, International Evidence on Food Consumption Patterns (TB-1904, 2003), to derive a methodology that can be used to estimate cross-price relation-ships. That study estimated income and own-price elasticities for a 9-good system (that is, for 9 broad consumer consumption categories) across 114 countries. Using the parameters and estimated income and own-price elas-ticities from the earlier ERS report, the present study describes a frame-work for estimating cross-price elasticities. The authors then calculate the
vCross-Price Elasticities of Demand Across 114 Countries / TB-1925
Economic Research Service / USDA
compensated and uncompensated cross-price elasticities for the same 9 con-sumer consumption categories as the earlier report, as well as for a 2-good, food-nonfood pairing, across the same 114 countries. Estimates from the earlier study have been widely used as input to economic models such as USDA’s Baseline model. The cross-country elasticity estimates from the present study should also provide valuable input for other economic models designed to forecast consumer demand when prices change. The methodol-ogy for obtaining the elasticities will aid future ERS efforts at estimating cross-price elasticities.


1Cross-Price Elasticities of Demand Across 114 Countries / TB-1925
Economic Research Service / USDA
Introduction
In an earlier ERS report, International Evidence on Food Consumption Patterns, Seale, Regmi, and Bernstein (2003) fi t a 2-stage demand system to 1996 International Comparison Program (ICP) data of 114 countries for 9 aggregate consumer goods and 8 disaggregated food categories. In that report, the model’s parameters were estimated with maximum likelihood (ML), cor-recting for group heteroskedasticity. From the model’s parameters, Seale and his colleagues calculated income and three types of own-price elasticities of demand for all nine goods in the fi rst stage (Seale et al., tables 7-10). They reported income and Frisch own-price elasticities of demand for the eight food categories in the second stage (Seale et al., tables 11-12). However, the earlier study did not report or calculate cross-price elasticities of demand.
Other cross-country demand studies have calculated and reported income or own-price elasticities of demand, often on a country-by-country basis, but few have calculated and reported cross-price, cross-country elasticities of demand.1
Among studies based on 1996 International Comparison Program data, Theil, Chung, and Seale (1989) and Seale and Theil (1991) calculate and report cross-price elasticities of demand using the ICP data for a two-good demand system, food and nonfood, on a country-by-country basis.2 To date, however, no one has reported and calculated cross-price elasticities of demand for more than these same two goods across countries using the ICP data.
In this study, a simple method for calculating cross-country, cross-price elas-ticities of demand, based on the parameter estimates of the Florida model and real per capita income across a large and diverse set of countries, is used to calculate cross-price elasticities for a 2-good demand system (food and non-food) in the 114 countries of the 1996 ICP. For the 41 countries that partici-pated in both an earlier ICP survey (ICP data Phase IV, 1980) and the 1996 ICP, the cross-price elasticity estimates calculated in this study are compared with those calculated by Theil, Chung, and Seale (1989, pp. 116-17). Next, cross-price elasticities are calculated and reported for 9 broad consumption categories: food, beverage, and tobacco; clothing and footwear; education; gross rent, fuel, and power; house furnishings and operations; medical care; recreation; transport and communications; and a category of other items across the same 114 countries.
The cross-price elasticities of demand presented in this report comple-ment the income and own-price elasticities calculated by Seale, Regmi, and Bernstein in 2003 and represent the only consistent set of cross-country, cross-price elasticities available for this large a number of countries and consumption categories. The estimates by Seale et al. of income and own-price elasticities have been widely used as input in economic models, such as USDA’s Baseline model, the Global Trade Analysis Project (GTAP) model, the International Food Policy Research Institute’s IMPACT model, and others (see, for example, studies by Winters (2005); von Braun (2007); Hertel and Winters (2006); and Valenzuela, Anderson, and Hertel (2007)). The newly estimated cross-price elasticities presented in this report should prove equally valuable for future research.
1Goldberger and Gamaletsos (1970) report and compare cross-price elastici-ties of demand for 5 goods in 11 OECD countries, but they estimate these for each country separately and not as a cross-country demand system.
2Theil and Finke, 1985, (also in Theil, 1987, table 2-10, p. 67) calculate cross-price elasticities of demand for food and nonfood for 13 real (1975) per capita income levels, expressed as a percent-age of per capita income of the United States, basing their calculations on parameter estimates of Finke, Rosalsky, and Theil (1983), while Seale and Theil (1991) base theirs on parameter esti-mates of Fiebig, Seale, and Theil (1988).

2Cross-Price Elasticities of Demand Across 114 Countries / TB-1925
Economic Research Service / USDA
Background
Cross-country demand analysis for goods and services has come a long way since the pioneering work of Hendrik Houthakker in 1957. Much of the advancement in this important area of study has been made possible by the International Comparison Program (ICP) and the data that it has provided since the early 1970s.3 The fi rst authors to apply a cross-country demand system to ICP data were Clements and Theil (1979) and Suhm (1979), who fi t Working’s (1943) model to 1975 Phase II data of 15 countries for 4 and 8 groups of consumer goods (hereafter “goods”), respectively.4
Working (1943) originally fi t his model to U.S. household data by assum-ing that all households face the same prices. Accordingly, Working’s model has an income term but no price term. The same is true for a cross-country Working’s model if one assumes that all consumers in all countries face the same set of prices. Clearly, this is a disadvantage, because consumers in dif-ferent countries generally do face different sets of prices, and the question of how sensitive the quantities demanded of goods are to a price change of another good is an important one.
Partly to answer this question, Theil, Suhm, and Meisner (1980) applied the dif-ferential approach to consumption theory to the cross-country Working’s model and incorporated a price (substitution) term into it. Theil and colleagues then fi t the resulting model, with the added constraint of preference independence (additive utility) among goods, to the data of Suhm’s cross-country demand system and estimated its parameters with maximum likelihood.
Others have successfully applied the Theil, Suhm, and Meisner (hence-forth Theil et al.) model to ICP data. Finke, Rosalsky, and Theil (1983) fi t the Theil et al. model to Phase III (1975) ICP data of 30 countries for 10 goods.5 Fiebig, Seale, and Theil (1987) disaggregated these data fur-ther into an 11-good system that additionally included energy. These same authors later (1988) applied the Theil et al. model individually to the data of 15 countries in Phase II (1970), 30 countries in Phase III (1975), and 24 (of 30) countries that participate in both Phases III and IV (1980). Fiebig and his colleagues also pooled the data of these 30 countries by linking country data from 1975 and 1970 and 1980 and 1975. Then, recognizing that these data are stochastically dependent across phases, Fiebig fi t the pooled data with an extension of the Theil et al. model, correcting for serial correlation across phases with an autoregressive process (AR(1)).6
Seale and Theil (1987) extended the analysis of Fiebig et al. in three ways: (1) they increased Fiebig et al.’s sample size from 30 countries to 58 by adding the Phase IV (1980) data of 28 additional countries that did not participate in the ICP prior to Phase IV; (2) they noted that the size of the error covari-ance matrices, when the Theil et al. model was applied to the data of the newly included 28 countries, was about twice the size of the error covariance matrices of the Fiebig et al. groupings; and (3), in estimating the pooled-data parameters, they multiplied by two the error covariance matrix of the newly included 28 countries in the computations of the ML estimator as a means to correct for group heteroskedasticity.
3ICP Phases I, II and III were con-ducted by Kravis et al. (1975, 1978a,b, 1982), Phases IV and V by the United Nations Statistical Offi ce, and the 1996 ICP data by a consortium coordinated by the World Bank. See Seale and Regmi (2006) for a more thorough dis-cussion of the data and issues involved in using information from the various phases to estimate and model cross-country demand systems.
4Working’s model is an Engel curve model that describes the budget shares of goods as (declining or increasing) linear functions of the log of total con-sumption expenditure (income).
6If the error term of, say, the food budget share is positive and large for country c in 1970 (Phase II), it is likely that this country will also have a positive error term for food in 1975 (Phase III). The AR(1) process is a simple method to account for stable but different prefer-ence structures across countries.
5Kravis, Heston, and Summers (1982) fi t the linear expenditure system (LES) to four broad categories of goods, but a careful reading of their footnote 47, p. 386, makes it clear that their LES analysis is independent of the ICP multilateral data. They do, howev-er, fi t a double-log model to ICP Phase III data for 25 summary categories of goods and for 103 detailed categories of goods in 30 countries.

3Cross-Price Elasticities of Demand Across 114 Countries / TB-1925
Economic Research Service / USDA
Theil, Chung, and Seale (1989) modifi ed the Theil et al. model by using a dif-ferent parameterization of the model. The resulting model, the Florida model, describes the budget share of a good as a function of a pure price term, in addi-tion to its being a function of an income term and a substitution term.7 Theil, Chung, and Seale, using a 10-good classifi cation, fi t the Florida model to the ICP data of Phases II, III, and IV individually, and, after a series of tests, to the data pooled across time. They estimated all parameters of the model with ML, including autoregressive and heteroskedasticity parameters, by an iterative grid search. In a subsequent paper, Seale, Walker, and Kim (1991) fi t the Florida model to Theil, Chung, and Seale’s data disaggregated into an 11-good system, including energy, and estimated all parameters (including the autoregressive and heteroskedastic coeffi cients) with the ML scoring method (Kmenta, 1990, p. 320). More recently, Seale, Regmi, and Bernstein (2003) and Seale and Regmi (2006 and 2009) fi t the Florida model to the 1996 ICP data of 114 coun-tries for 9 goods in the fi rst stage of a 2-stage demand system and estimated the parameters with a heteroskedastic-corrected ML estimator.8
The next section briefl y discusses the ICP and the 1996 ICP data. The Florida model is then described, followed by a section presenting three types of price elasticity measures and their formulation based on parameter estimates of the Florida model. Subsequent sections present cross-price elasticities of demand for a two-good system, food and nonfood, and of a nine-good system, focus-ing on income groupings. The appendix tables show the cross-price elastici-ties of demand for the 9-good system for each of the 114 countries for which these results were estimated.
7Theil, Chung, and Seale originally referred to the model as the Working-PI (Preference Independence) model (1989, p. 41). Seale, Walker and Kim (1991) were fi rst to refer to it as the Florida model, in the tradition of nam-ing a demand-system model for its place of origin (e.g., Rotterdam model (Theil, 1966), the CBS model (Keller and van Driel, 1985), and the NBR model (Neves, 1987). In later writings, Theil also refers to it as the Florida model (Theil, 1996, pp. 3, 60; 1997)).
8To differentiate the preference structure in the two stages, these authors refer to the fi rst-stage (second-stage) model as the Florida-PI (Slutsky) model. In this paper, we forego this differentiation and simply refer to the preference-independent form as the Florida model.
4Cross-Price Elasticities of Demand Across 114 Countries / TB-1925
Economic Research Service / USDA
Data
The 1996 ICP data, fully described in Seale, Regmi, and Bernstein (2003) and Seale and Regmi (2006), are used in this study. The analysis is confi ned to the consumption component of the gross domestic product and, in particular, to nine consumption categories: food; clothing and footwear; gross rent, fuel, and power; house furnishings and operations; medical care; transport and commu-nications; recreation; education; and other items. The food expenditure group includes food prepared and consumed at home plus beverages and tobacco. It does not include food consumed away from home. The nine consumption cat-egories used in this analysis are the same categories analyzed in Seale, Regmi, and Bernstein’s fi rst stage of the two-stage complete demand model.
The 114 countries in the 1996 ICP data are divided into low-, middle-, and high-income categories based on their real per capita income relative to that of the United States.9 Low-income countries represent those with real per capita income less than 15 percent of the U.S. level, middle-income countries represent those with real per capita income equal to or greater than 15 percent but less than 45 percent of the U.S. level, and high-income countries represent those with real per capita income equal to or greater than 45 percent of the U.S. level (table 1). This criterion for grouping indicates that the majority of Sub-Saharan African countries, poor transition economies such as Mongolia and Turkmenistan, and some low-income Middle Eastern and Asian countries such as Yemen and Nepal, fall within the low-income group. High-income countries include most Western European countries, Australia, New Zealand, Canada, and the United States. Middle-income countries include many Latin American countries, North African countries, and better-off transition econo-mies such as Estonia, Hungary, and Slovenia.
9Note that this classifi cation is done merely to facilitate analysis and is not based on any generally accepted criteria for classifi cation. Since the classifi ca-tion is based on the ICP data used in this analysis, some countries may be in a group with which they normally would not be associated.

5Cross-Price Elasticities of Demand Across 114 Countries / TB-1925
Economic Research Service / USDA
Table 1
Normalized per capita real income and food budget shares (from 1996 ICP) Per capita Food share Per capita Food share Per capita Food share real income of total real income of total real income of totalCountry US=100 expenditure Country US=100 expenditure Country US=100 expenditure
Percent Percent Percent
Low-income countries Middle-income countries High-income countries
Tanzania 2.04 73.24 Ukraine 15.28 45.03 Czech Republic 45.08 25.00Nigeria 2.88 72.97 Philippines 16.32 48.35 Greece 48.48 21.17Tajikistan 3.37 68.94 Peru 16.76 30.31 Korea 49.45 31.64Zambia 3.46 60.81 Botswana 16.81 32.80 Portugal 50.54 23.23Yemen 3.47 61.13 Thailand 17.03 28.56 Spain 50.84 17.52Malawi 3.81 53.35 Morocco 17.56 45.61 Ireland 52.19 16.59Madagascar 3.81 65.88 Venezuela 17.71 29.47 Singapore 53.64 13.04Mali 3.91 53.27 Macedonia 18.51 34.73 Mauritius 55.77 28.12Mongolia 3.94 58.74 Belize 18.55 31.17 Israel 57.73 17.70Benin 4.88 55.40 Egypt 18.58 48.08 New Zealand 58.54 15.19Kenya 5.35 45.82 St. Vincent & Grenadines 18.70 35.87 Finland 58.72 14.67Sierra Leone 5.80 62.09 Swaziland 19.67 27.48 Bahamas 59.35 35.73Nepal 5.81 57.88 Lebanon 20.07 39.33 Sweden 63.82 13.26Turkmenistan 6.04 50.82 Belarus 20.25 50.45 Netherlands 64.58 13.29Congo 6.51 46.92 Kazakhstan 20.33 51.82 France 68.20 15.34Senegal 6.94 53.35 Dominica 20.33 38.27 United Kingdom 68.55 16.37Vietnam 7.10 64.75 Latvia 21.43 41.76 Belgium 69.32 14.36Bangladesh 7.16 56.05 St. Lucia 21.55 46.62 Norway 69.51 15.98Pakistan 8.23 46.99 Brazil 21.68 22.71 Italy 70.07 16.59Azerbaijan 8.76 73.51 Bulgaria 21.80 30.70 Austria 71.51 13.53Côte d'Ivoire 8.99 44.32 Russia 22.47 34.35 Germany 71.79 13.09Paraguay 9.14 27.27 Fiji 23.25 36.28 Australia 73.17 15.07Uzbekistan 9.54 48.33 Grenada 23.26 40.99 Japan 74.12 14.88Kyrgyzstan 9.57 47.15 Turkey 23.65 32.60 Canada 75.41 11.68Cameroon 9.64 43.80 Lithuania 24.31 40.42 Bermuda 78.21 14.23Moldova 9.65 43.45 Romania 24.80 45.26 Switzerland 79.36 14.57Bolivia 10.10 42.52 Iran 25.80 32.55 Barbados 79.55 11.10Ecuador 10.27 29.09 Mexico 26.31 26.63 Hong Kong 79.86 10.28Armenia 10.74 69.66 Bahrain 26.91 28.55 Iceland 80.11 18.90Sri Lanka 10.79 63.55 Chile 27.25 22.96 Denmark 80.85 14.02Jordan 11.37 37.67 Antigua & Barbuda 27.34 36.12 Luxembourg 97.17 17.08Albania 12.25 69.26 Poland 28.27 30.65 United States 100.00 9.73Indonesia 12.56 50.62 Trinidad & Tobago 29.06 22.06 Jamaica 12.63 34.78 Estonia 29.87 33.45 Zimbabwe 12.71 25.58 Gabon 30.07 47.94 Guinea 13.03 43.69 Tunisia 30.72 35.95 Syria 13.79 47.92 St. Kitts & Nevis 31.11 36.33 Georgia 13.92 47.39 Uruguay 31.38 25.25 Slovakia 31.87 32.06 Hungary 34.57 22.54 Argentina 38.49 32.79 Oman 40.26 24.14 Qatar 42.57 26.22 Slovenia 43.67 21.34
Low-income average 0.080 52.58 Middle-income average 0.249 34.69 High-income average 0.674 16.97
Source: Seale and Regmi, 2009, table 12.2, pp. 158-59.
6Cross-Price Elasticities of Demand Across 114 Countries / TB-1925
Economic Research Service / USDA
Methodology
The Florida model, developed by Theil, Chung, and Seale (1989), was derived from Working’s (1943) model by incorporating prices. Theil et al.’s starting point was to rewrite Working’s model as a cross-country demand system,
(1)
where wic=Eic/Ec is the budget share of good i (= 1, …, n) in country c (=1, …, N), Eic is expenditure on good i in c, 1
nc i icE E== ∑ is total nominal con-
sumption expenditure, Qc is real per capita income (volume) in country c, ic is a random error term, and i and i are parameters to be estimated. The budget shares, summed across all n goods, equal 1, and the s and s are thus subject to the adding-up conditions,
(2)
for a given country c, since wi = Ei/E, Ei= wiE. Substituting equation 1 for wi, we obtain Ei = iE + iE log E, which, when differentiated with respect to E and using equation 1, gives the marginal budget share, i,
(3)
Both the budget and marginal shares are functions of income such that, when income changes, wi and i change.10
Let pic and pid be the domestic currency price of good i in country c and in country d, respectively, where c≠d. As domestic currency prices have dif-ferent dimensions in different countries, the absolute prices pic and pid from countries c and d will have different dimensions. However, for cross-country analyses, one needs to have prices for all countries in the same dimension. The solution is to use relative instead of absolute prices. Also note that the price ratio pic/pjc depends on country c and implies that different countries have different sets of prices. To extend equation 1 to include prices and still have fi xed parameters (i.e., i and i), one must select a particular set of rela-tive prices. Theil, Chung, and Seale chose to defl ate the absolute price of i in c by the geometric mean price11 of i across all N countries, that is,
(4)
The model that emerges has the budget share on the left and is polynomial in the parameters:
wic = LINEAR + QUADRATIC + CUBIC + ic, where (5)
LINEAR = Real-income term, = i + iqc , (5a)
QUADRATIC = Pure-price term,
(5b)
10The exception to this is when a good has unitary elasticity; as incomes increase, expenditure on the good in-creases in the same proportion, so that wic is unchanged.
11Theil and Seale (1987) justify the above choice of converting the absolute prices into relative prices through dividing each absolute price by the geometric mean price by proving that the geometric mean price point across countries has a minimum mean-squared distance property.
ic i i c icw lnQα β ε= + +
1 11 and 0
n n
i ii i
α β= =
= =∑ ∑
( )1 ii i i i i
dElog E w .
dEθ α β β= = + + = +
1
1
N
i icc
log p log p .N =
= ∑
( ) ( )1
jcnici i c j j cj
i j
ppq log q log ,
p p=
⎡ ⎤= α + β − α + β⎢ ⎥
⎣ ⎦∑
7Cross-Price Elasticities of Demand Across 114 Countries / TB-1925
Economic Research Service / USDA
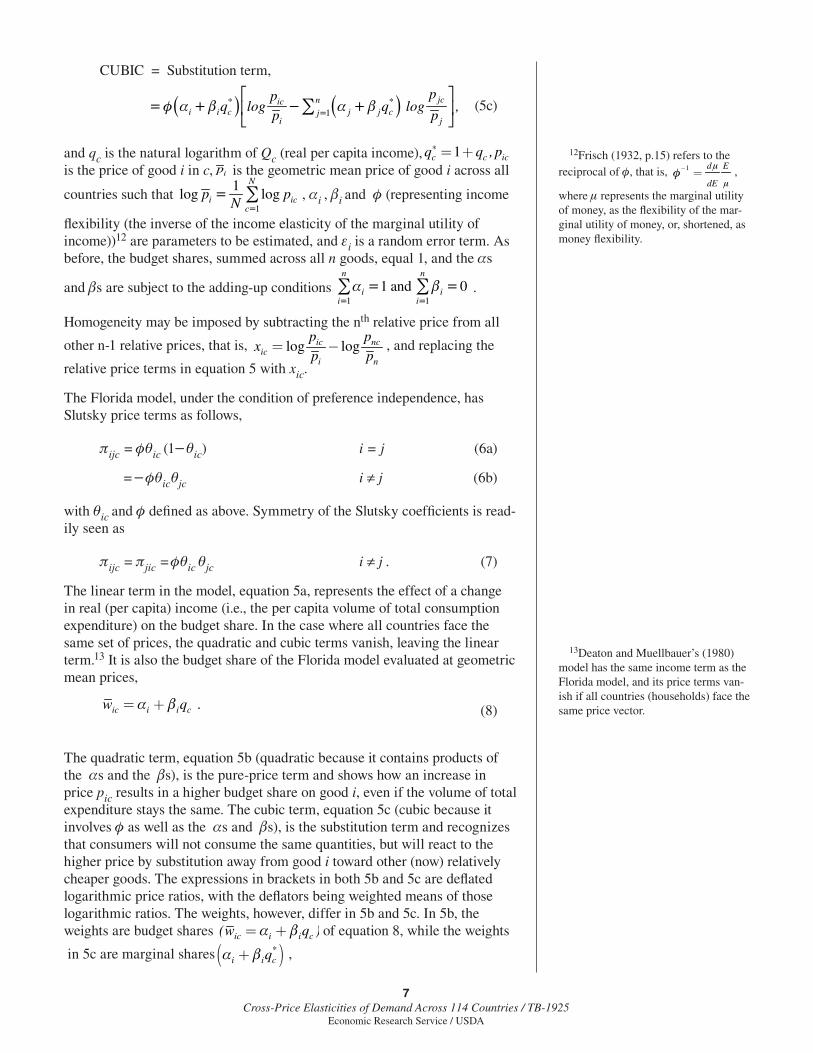
CUBIC = Substitution term,
(5c)
and qc is the natural logarithm of Qc (real per capita income), 1c c icq q ,p* = +is the price of good i in c, ip is the geometric mean price of good i across all
countries such that 1
1log log
N
i icc
p pN =
= ∑ , i , i and (representing income
fl exibility (the inverse of the income elasticity of the marginal utility of income))12 are parameters to be estimated, and i is a random error term. As before, the budget shares, summed across all n goods, equal 1, and the s
and s are subject to the adding-up conditions 1 1
1 and 0 n n
i ii i= =
α = β =∑ ∑ .
Homogeneity may be imposed by subtracting the nth relative price from all
other n-1 relative prices, that is, log logic ncic
i n
p px
p p= - , and replacing the
relative price terms in equation 5 with xic.
The Florida model, under the condition of preference independence, has Slutsky price terms as follows,
ijc = ic (1ic) i = j (6a)
=icjc i ≠ j (6b)
with ic and defi ned as above. Symmetry of the Slutsky coeffi cients is read-ily seen as
ijc = jic =ic jc i ≠j . (7)
The linear term in the model, equation 5a, represents the effect of a change in real (per capita) income (i.e., the per capita volume of total consumption expenditure) on the budget share. In the case where all countries face the same set of prices, the quadratic and cubic terms vanish, leaving the linear term.13 It is also the budget share of the Florida model evaluated at geometric mean prices,
(8)
The quadratic term, equation 5b (quadratic because it contains products of the s and the s), is the pure-price term and shows how an increase in price pic results in a higher budget share on good i, even if the volume of total expenditure stays the same. The cubic term, equation 5c (cubic because it involves as well as the s and s), is the substitution term and recognizes that consumers will not consume the same quantities, but will react to the higher price by substitution away from good i toward other (now) relatively cheaper goods. The expressions in brackets in both 5b and 5c are defl ated logarithmic price ratios, with the defl ators being weighted means of those logarithmic ratios. The weights, however, differ in 5b and 5c. In 5b, the weights are budget shares ic i i c(w q )α β= + of equation 8, while the weights
in 5c are marginal shares( )*i i cqα β+ ,
12Frisch (1932, p.15) refers to the reciprocal of , that is, 1 d E
dE
μ
μφ- = ,
where represents the marginal utility of money, as the fl exibility of the mar-ginal utility of money, or, shortened, as money fl exibility.
13Deaton and Muellbauer’s (1980) model has the same income term as the Florida model, and its price terms van-ish if all countries (households) face the same price vector.
( ) ( )1
jcn* *ici i c j j cj
i j
ppq log q log ,
p p=
⎡ ⎤= φ α + β − α + β⎢ ⎥
⎣ ⎦∑
.ic i i cw qα β= +
8Cross-Price Elasticities of Demand Across 114 Countries / TB-1925
Economic Research Service / USDA
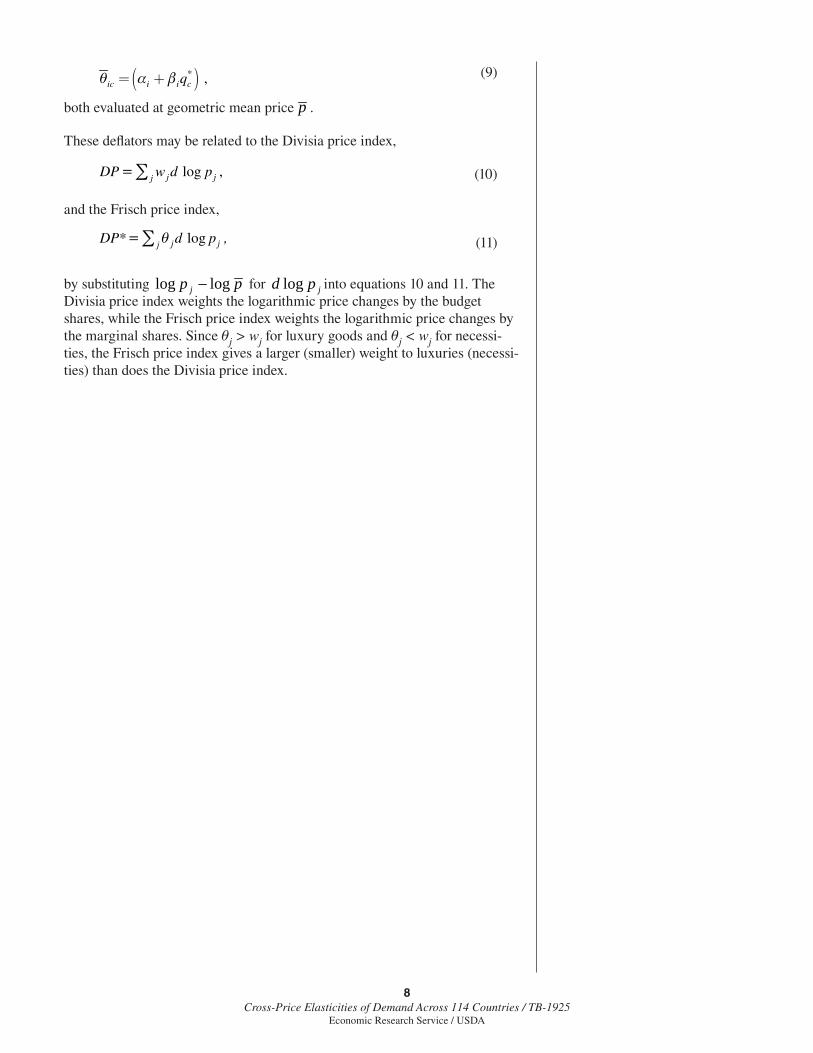
(9)
both evaluated at geometric mean price p .
These defl ators may be related to the Divisia price index,
(10)
and the Frisch price index,
(11)
by substituting pp j loglog − for jpd log into equations 10 and 11. The Divisia price index weights the logarithmic price changes by the budget shares, while the Frisch price index weights the logarithmic price changes by the marginal shares. Since j > wj for luxury goods and j < wj for necessi-ties, the Frisch price index gives a larger (smaller) weight to luxuries (necessi-ties) than does the Divisia price index.
( ) ,*ic i i cqθ α β= +
log ,j jjDP w d p=∑
logj jjDP* d p ,= θ∑
9Cross-Price Elasticities of Demand Across 114 Countries / TB-1925
Economic Research Service / USDA
Three Types of Price Elasticities
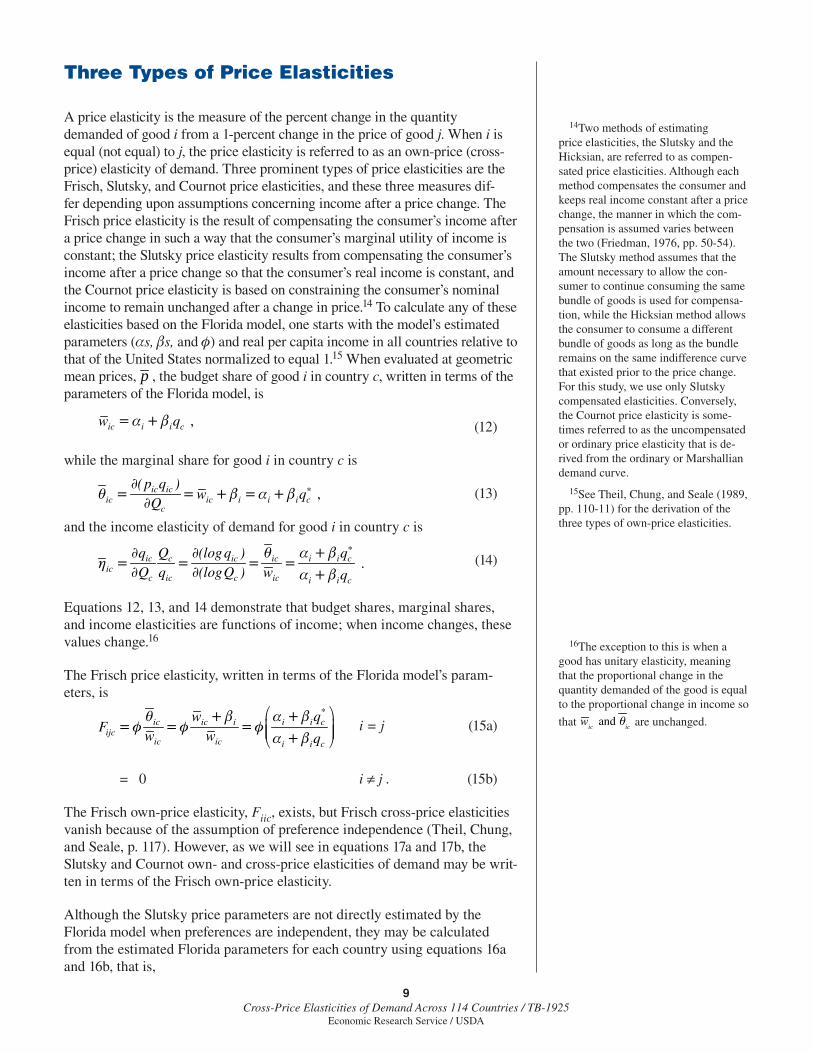
A price elasticity is the measure of the percent change in the quantity demanded of good i from a 1-percent change in the price of good j. When i is equal (not equal) to j, the price elasticity is referred to as an own-price (cross-price) elasticity of demand. Three prominent types of price elasticities are the Frisch, Slutsky, and Cournot price elasticities, and these three measures dif-fer depending upon assumptions concerning income after a price change. The Frisch price elasticity is the result of compensating the consumer’s income after a price change in such a way that the consumer’s marginal utility of income is constant; the Slutsky price elasticity results from compensating the consumer’s income after a price change so that the consumer’s real income is constant, and the Cournot price elasticity is based on constraining the consumer’s nominal income to remain unchanged after a change in price.14 To calculate any of these elasticities based on the Florida model, one starts with the model’s estimated parameters (s, s, and ) and real per capita income in all countries relative to that of the United States normalized to equal 1.15 When evaluated at geometric mean prices, p , the budget share of good i in country c, written in terms of the parameters of the Florida model, is
(12)
while the marginal share for good i in country c is
(13)
and the income elasticity of demand for good i in country c is
(14)
Equations 12, 13, and 14 demonstrate that budget shares, marginal shares, and income elasticities are functions of income; when income changes, these values change.16
The Frisch price elasticity, written in terms of the Florida model’s param-eters, is
i = j (15a)
= 0 i ≠j . (15b)
The Frisch own-price elasticity, Fiic, exists, but Frisch cross-price elasticities vanish because of the assumption of preference independence (Theil, Chung, and Seale, p. 117). However, as we will see in equations 17a and 17b, the Slutsky and Cournot own- and cross-price elasticities of demand may be writ-ten in terms of the Frisch own-price elasticity.
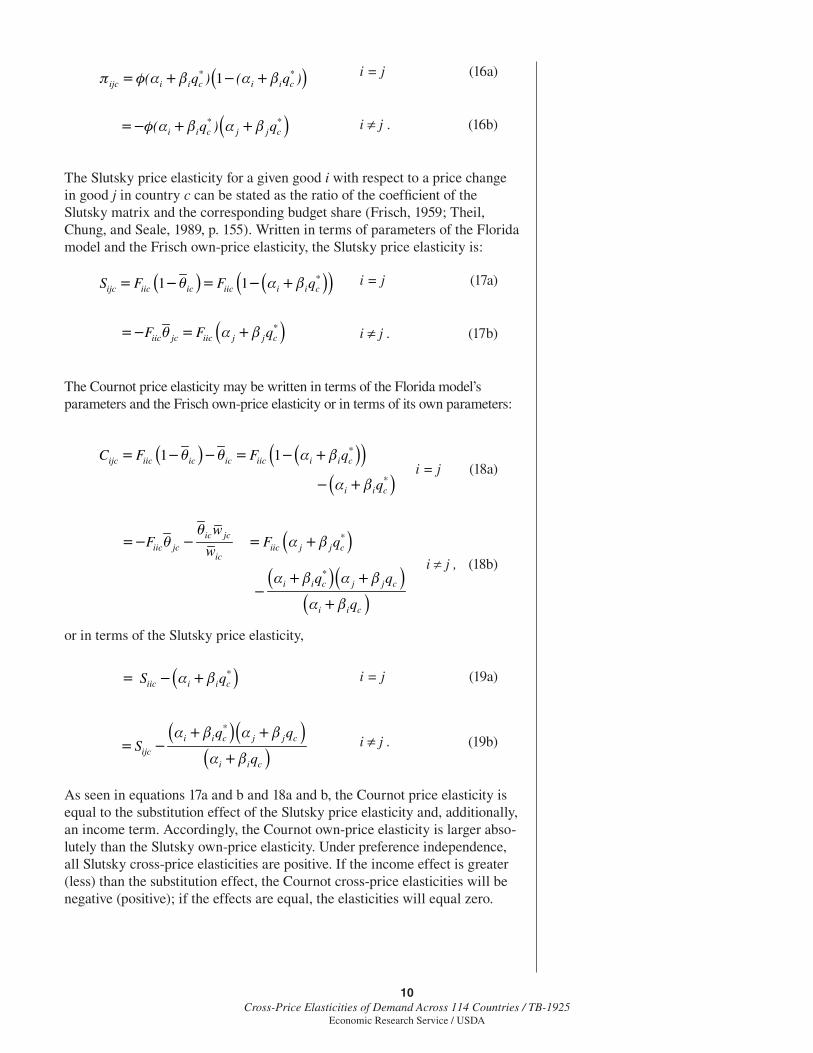
Although the Slutsky price parameters are not directly estimated by the Florida model when preferences are independent, they may be calculated from the estimated Florida parameters for each country using equations 16a and 16b, that is,
14Two methods of estimating price elasticities, the Slutsky and the Hicksian, are referred to as compen-sated price elasticities. Although each method compensates the consumer and keeps real income constant after a price change, the manner in which the com-pensation is assumed varies between the two (Friedman, 1976, pp. 50-54). The Slutsky method assumes that the amount necessary to allow the con-sumer to continue consuming the same bundle of goods is used for compensa-tion, while the Hicksian method allows the consumer to consume a different bundle of goods as long as the bundle remains on the same indifference curve that existed prior to the price change. For this study, we use only Slutsky compensated elasticities. Conversely, the Cournot price elasticity is some-times referred to as the uncompensated or ordinary price elasticity that is de-rived from the ordinary or Marshallian demand curve.
15See Theil, Chung, and Seale (1989, pp. 110-11) for the derivation of the three types of own-price elasticities.
16The exception to this is when a good has unitary elasticity, meaning that the proportional change in the quantity demanded of the good is equal to the proportional change in income so
that and ic ic
w θ are unchanged.
,ic i i cw q= α + β
,ic icic ic i i i c
c
( p q )w q
Q∗∂
θ = = + β = α + β∂
.ic c ic ic i i cic
c ic c ic i i c
q Q (logq ) qQ q (logQ ) w q
∗∂ ∂ θ α + βη = = = =
∂ ∂ α + β
*ic ic i i i c
ijcic ic i i c
w qF
w w q
⎛ ⎞θ + β α + β⎜ ⎟= φ = φ = φ⎜ ⎟α + β⎝ ⎠
10Cross-Price Elasticities of Demand Across 114 Countries / TB-1925
Economic Research Service / USDA
i = j (16a)
i ≠j . (16b)
The Slutsky price elasticity for a given good i with respect to a price change in good j in country c can be stated as the ratio of the coeffi cient of the Slutsky matrix and the corresponding budget share (Frisch, 1959; Theil, Chung, and Seale, 1989, p. 155). Written in terms of parameters of the Florida model and the Frisch own-price elasticity, the Slutsky price elasticity is:
i = j (17a)
i ≠j . (17b)
The Cournot price elasticity may be written in terms of the Florida model’s parameters and the Frisch own-price elasticity or in terms of its own parameters:
i = j (18a)
i j , (18b)
or in terms of the Slutsky price elasticity,
i = j (19a)
i ≠j . (19b)
As seen in equations 17a and b and 18a and b, the Cournot price elasticity is equal to the substitution effect of the Slutsky price elasticity and, additionally, an income term. Accordingly, the Cournot own-price elasticity is larger abso-lutely than the Slutsky own-price elasticity. Under preference independence, all Slutsky cross-price elasticities are positive. If the income effect is greater (less) than the substitution effect, the Cournot cross-price elasticities will be negative (positive); if the effects are equal, the elasticities will equal zero.
( )1 * *ijc i i c i i c( q ) ( q )π = φ α + β − α + β
( )* *i i c j j c( q ) q=−φ α + β α + β
( ) ( )( )1 1 *ijc iic ic iic i i cS F F q= −θ = − α + β
( )*iic jc iic j j cF F q=− θ = α + β
( ) ( )( )( )
1 1
*ijc iic ic ic iic i i c
*i i c
C F F q
q
= −θ −θ = − α + β
− α + β
( )
( )( )( )
ic jc *iic jc iic j j c
ic
*i i c j j c
i i c
wF F q
w
q q
q
θ=− θ − = α + β
α + β α + β−
α + β
( ) *iic i i cS q= − α + β
( )( )( )
*i i c j j c
ijci i c
q qS
q
α + β α + β= −
α + β
11Cross-Price Elasticities of Demand Across 114 Countries / TB-1925
Economic Research Service / USDA
Empirical Results
Seale et al. (2003) calculated income and three types of own-price elasticities of demand for 9 goods in 114 countries participating in the 1996 International Comparison Program. They did not report marginal shares for the 114 coun-tries or their cross-price elasticities of demand. In this section, we extend their analyses by calculating and reporting marginal shares in the 114 countries for the 9 goods. Next, we examine a two-good demand system, food and nonfood, calculate the cross-price elasticities for the system using the Seale parameter estimates, and compare our results with those of Theil et al. (1989). Finally, we calculate and report Slutsky and Cournot cross-price elasticities of demand for the 9-good system across 114 countries using equations 18a through19b. The minimal requirements for these calculations are parameter estimates from the Florida model and the natural log of real per capita incomes of the 114 coun-tries relative to that of the United States (normalized to equal 1). The param-eters are those estimated by Seale et al. (2003, table 5, p. 24). All marginal shares and elasticities are calculated at geometric mean prices.
Marginal Shares
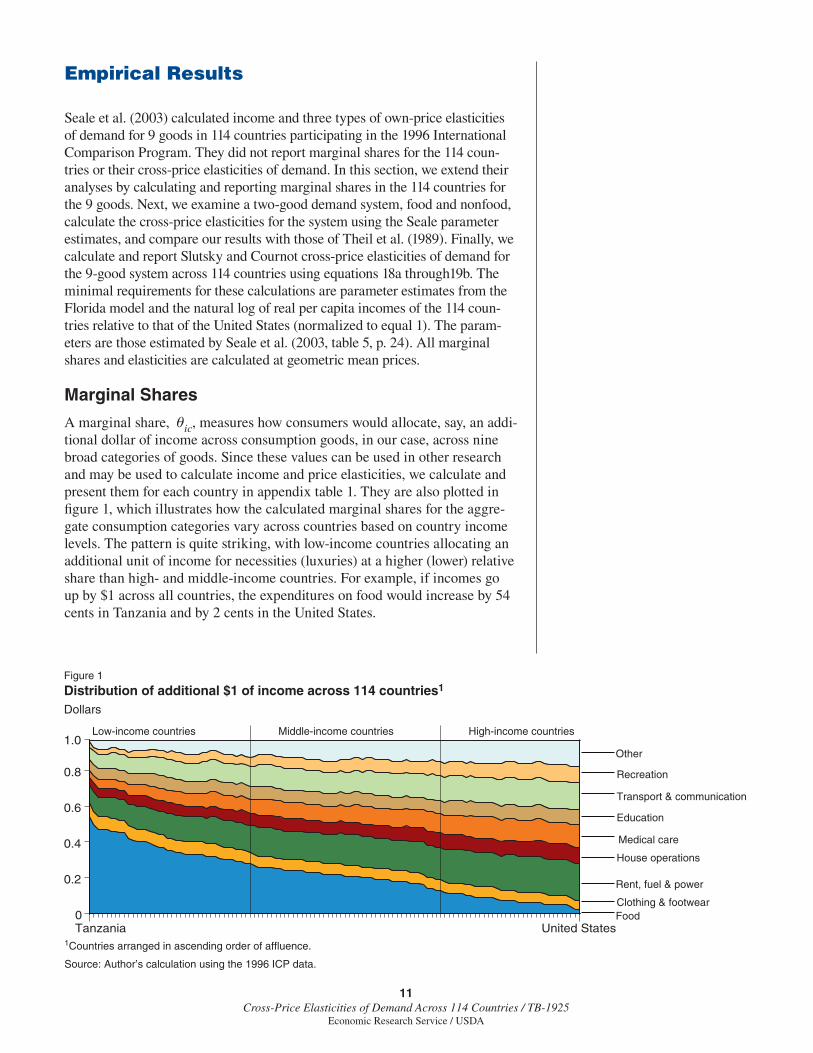
A marginal share, ic, measures how consumers would allocate, say, an addi-tional dollar of income across consumption goods, in our case, across nine broad categories of goods. Since these values can be used in other research and may be used to calculate income and price elasticities, we calculate and present them for each country in appendix table 1. They are also plotted in fi gure 1, which illustrates how the calculated marginal shares for the aggre-gate consumption categories vary across countries based on country income levels. The pattern is quite striking, with low-income countries allocating an additional unit of income for necessities (luxuries) at a higher (lower) relative share than high- and middle-income countries. For example, if incomes go up by $1 across all countries, the expenditures on food would increase by 54 cents in Tanzania and by 2 cents in the United States.
Figure 1
Distribution of additional $1 of income across 114 countries1
Dollars
1Countries arranged in ascending order of affluence.
Source: Author’s calculation using the 1996 ICP data.
Tanzania United States0
0.2
0.4
0.6
1.0
0.8
FoodClothing & footwear
Rent, fuel & power
House operations
Medical care
Education
Transport & communication
Recreation
Other
High-income countriesMiddle-income countriesLow-income countries
12Cross-Price Elasticities of Demand Across 114 Countries / TB-1925
Economic Research Service / USDA
In further contrast, an additional $1 of income in Tanzania would increase expenditures on other, recreation, and medical care by 5 cents, 3 cents, and 4 cents, respectively, while the same additional dollar in the United States would increase expenditure on these three goods by 18 cents, 9 cents, and 13 cents, respectively (a difference in magnitude of 3 to 4 times). The difference in the magnitude of marginal spending by consumers in the two countries is about double for clothing and footwear, gross rent, fuel and power, housing operations, and transportation, while it is only about 1.3 times for education.
Cross-Price Elasticities in a Two-Good Demand System
In a two-good demand system, the cross-price terms of the two goods are equal to the negative of the corresponding own-price terms. The Slutsky own-price elasticities are also equal to the negative of the corresponding Slutsky cross-price elasticities, but will differ for Cournot price elasticities. Calculations are based on and of food and from Seale et al. (2003, table 5, p. 24). The alpha and beta for nonfood are just 1 minus the alpha of food and the negative of the beta of food. This result is directly obtained from the adding-up conditions of equation 2.
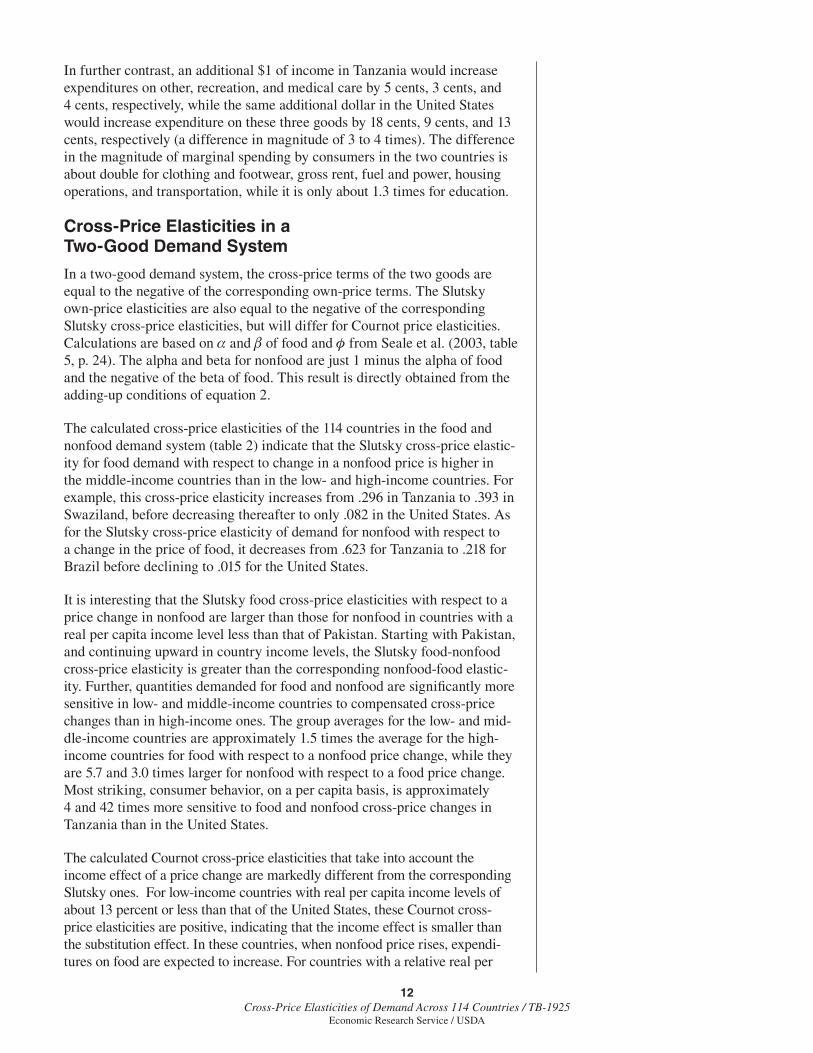
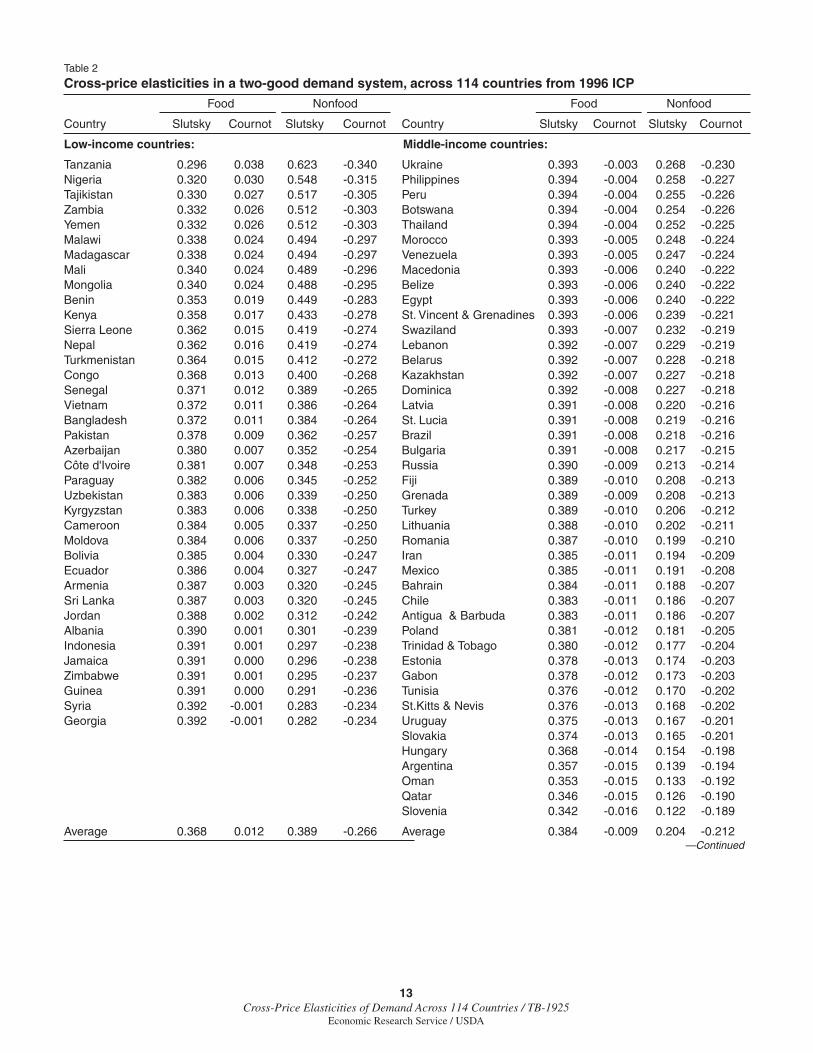
The calculated cross-price elasticities of the 114 countries in the food and nonfood demand system (table 2) indicate that the Slutsky cross-price elastic-ity for food demand with respect to change in a nonfood price is higher in the middle-income countries than in the low- and high-income countries. For example, this cross-price elasticity increases from .296 in Tanzania to .393 in Swaziland, before decreasing thereafter to only .082 in the United States. As for the Slutsky cross-price elasticity of demand for nonfood with respect to a change in the price of food, it decreases from .623 for Tanzania to .218 for Brazil before declining to .015 for the United States.
It is interesting that the Slutsky food cross-price elasticities with respect to a price change in nonfood are larger than those for nonfood in countries with a real per capita income level less than that of Pakistan. Starting with Pakistan, and continuing upward in country income levels, the Slutsky food-nonfood cross-price elasticity is greater than the corresponding nonfood-food elastic-ity. Further, quantities demanded for food and nonfood are signifi cantly more sensitive in low- and middle-income countries to compensated cross-price changes than in high-income ones. The group averages for the low- and mid-dle-income countries are approximately 1.5 times the average for the high-income countries for food with respect to a nonfood price change, while they are 5.7 and 3.0 times larger for nonfood with respect to a food price change. Most striking, consumer behavior, on a per capita basis, is approximately 4 and 42 times more sensitive to food and nonfood cross-price changes in Tanzania than in the United States.
The calculated Cournot cross-price elasticities that take into account the income effect of a price change are markedly different from the corresponding Slutsky ones. For low-income countries with real per capita income levels of about 13 percent or less than that of the United States, these Cournot cross-price elasticities are positive, indicating that the income effect is smaller than the substitution effect. In these countries, when nonfood price rises, expendi-tures on food are expected to increase. For countries with a relative real per
13Cross-Price Elasticities of Demand Across 114 Countries / TB-1925
Economic Research Service / USDA
Table 2
Cross-price elasticities in a two-good demand system, across 114 countries from 1996 ICP
Food Nonfood Food Nonfood
Country Slutsky Cournot Slutsky Cournot Country Slutsky Cournot Slutsky Cournot
Low-income countries: Middle-income countries:
Tanzania 0.296 0.038 0.623 -0.340 Ukraine 0.393 -0.003 0.268 -0.230Nigeria 0.320 0.030 0.548 -0.315 Philippines 0.394 -0.004 0.258 -0.227Tajikistan 0.330 0.027 0.517 -0.305 Peru 0.394 -0.004 0.255 -0.226Zambia 0.332 0.026 0.512 -0.303 Botswana 0.394 -0.004 0.254 -0.226Yemen 0.332 0.026 0.512 -0.303 Thailand 0.394 -0.004 0.252 -0.225Malawi 0.338 0.024 0.494 -0.297 Morocco 0.393 -0.005 0.248 -0.224Madagascar 0.338 0.024 0.494 -0.297 Venezuela 0.393 -0.005 0.247 -0.224Mali 0.340 0.024 0.489 -0.296 Macedonia 0.393 -0.006 0.240 -0.222Mongolia 0.340 0.024 0.488 -0.295 Belize 0.393 -0.006 0.240 -0.222Benin 0.353 0.019 0.449 -0.283 Egypt 0.393 -0.006 0.240 -0.222Kenya 0.358 0.017 0.433 -0.278 St. Vincent & Grenadines 0.393 -0.006 0.239 -0.221Sierra Leone 0.362 0.015 0.419 -0.274 Swaziland 0.393 -0.007 0.232 -0.219Nepal 0.362 0.016 0.419 -0.274 Lebanon 0.392 -0.007 0.229 -0.219Turkmenistan 0.364 0.015 0.412 -0.272 Belarus 0.392 -0.007 0.228 -0.218Congo 0.368 0.013 0.400 -0.268 Kazakhstan 0.392 -0.007 0.227 -0.218Senegal 0.371 0.012 0.389 -0.265 Dominica 0.392 -0.008 0.227 -0.218Vietnam 0.372 0.011 0.386 -0.264 Latvia 0.391 -0.008 0.220 -0.216Bangladesh 0.372 0.011 0.384 -0.264 St. Lucia 0.391 -0.008 0.219 -0.216Pakistan 0.378 0.009 0.362 -0.257 Brazil 0.391 -0.008 0.218 -0.216Azerbaijan 0.380 0.007 0.352 -0.254 Bulgaria 0.391 -0.008 0.217 -0.215Côte d'Ivoire 0.381 0.007 0.348 -0.253 Russia 0.390 -0.009 0.213 -0.214Paraguay 0.382 0.006 0.345 -0.252 Fiji 0.389 -0.010 0.208 -0.213Uzbekistan 0.383 0.006 0.339 -0.250 Grenada 0.389 -0.009 0.208 -0.213Kyrgyzstan 0.383 0.006 0.338 -0.250 Turkey 0.389 -0.010 0.206 -0.212Cameroon 0.384 0.005 0.337 -0.250 Lithuania 0.388 -0.010 0.202 -0.211Moldova 0.384 0.006 0.337 -0.250 Romania 0.387 -0.010 0.199 -0.210Bolivia 0.385 0.004 0.330 -0.247 Iran 0.385 -0.011 0.194 -0.209Ecuador 0.386 0.004 0.327 -0.247 Mexico 0.385 -0.011 0.191 -0.208Armenia 0.387 0.003 0.320 -0.245 Bahrain 0.384 -0.011 0.188 -0.207Sri Lanka 0.387 0.003 0.320 -0.245 Chile 0.383 -0.011 0.186 -0.207Jordan 0.388 0.002 0.312 -0.242 Antigua & Barbuda 0.383 -0.011 0.186 -0.207Albania 0.390 0.001 0.301 -0.239 Poland 0.381 -0.012 0.181 -0.205Indonesia 0.391 0.001 0.297 -0.238 Trinidad & Tobago 0.380 -0.012 0.177 -0.204Jamaica 0.391 0.000 0.296 -0.238 Estonia 0.378 -0.013 0.174 -0.203Zimbabwe 0.391 0.001 0.295 -0.237 Gabon 0.378 -0.012 0.173 -0.203Guinea 0.391 0.000 0.291 -0.236 Tunisia 0.376 -0.012 0.170 -0.202Syria 0.392 -0.001 0.283 -0.234 St.Kitts & Nevis 0.376 -0.013 0.168 -0.202Georgia 0.392 -0.001 0.282 -0.234 Uruguay 0.375 -0.013 0.167 -0.201 Slovakia 0.374 -0.013 0.165 -0.201 Hungary 0.368 -0.014 0.154 -0.198 Argentina 0.357 -0.015 0.139 -0.194 Oman 0.353 -0.015 0.133 -0.192 Qatar 0.346 -0.015 0.126 -0.190 Slovenia 0.342 -0.016 0.122 -0.189
Average 0.368 0.012 0.389 -0.266 Average 0.384 -0.009 0.204 -0.212—Continued
14Cross-Price Elasticities of Demand Across 114 Countries / TB-1925
Economic Research Service / USDA
capita income greater than 13 percent, income effects are larger than the substi-tution effects, and the elasticities are negative. However, the estimated Cournot elasticities are very small in magnitude, ranging on average from 0.012 for low-income countries to -0.009 for middle-income countries and -0.014 for high-income countries. Considering that food is a necessity, the relatively inelastic cross-price elasticity estimates are consistent with our expectations.
The pattern is different for the nonfood consumption category—in the aggre-gate, luxury goods—in terms of the price effects of a change in food price. Unlike the Slutsky cross-price elasticities, the Cournot elasticities are nega-tive. Starting with the poorest country, Tanzania, and traveling toward the richer ones, the Cournot cross-price elasticities gradually decline, down to the United States, which has the smallest absolute value. These elasticity esti-mates range from -0.34 for Tanzania to -0.216 for Brazil, and to -0.16 for the United States.
Table 2
Cross-price elasticities in a two-good demand system, across 114 countries from 1996 ICP—Continued
Food Nonfood
Country Slutsky Cournot Slutsky Cournot
High-income countries:
Czech Republic 0.338 -0.015 0.118 -0.188Greece 0.327 -0.015 0.108 -0.185Korea 0.324 -0.015 0.106 -0.185Portugal 0.320 -0.016 0.103 -0.184Spain 0.319 -0.016 0.102 -0.184Ireland 0.314 -0.016 0.099 -0.183Singapore 0.309 -0.016 0.095 -0.182Mauritius 0.301 -0.015 0.090 -0.181Israel 0.294 -0.015 0.085 -0.179New Zealand 0.291 -0.015 0.084 -0.179Finland 0.290 -0.015 0.083 -0.179Bahamas 0.288 -0.015 0.082 -0.178Sweden 0.269 -0.015 0.072 -0.176Netherlands 0.266 -0.015 0.071 -0.175France 0.251 -0.014 0.064 -0.173United Kingdom 0.249 -0.014 0.063 -0.173Belgium 0.246 -0.014 0.062 -0.173Norway 0.245 -0.014 0.061 -0.173Italy 0.242 -0.014 0.060 -0.173Austria 0.236 -0.014 0.058 -0.172Germany 0.235 -0.014 0.057 -0.172Australia 0.228 -0.014 0.055 -0.171Japan 0.224 -0.013 0.053 -0.171Canada 0.218 -0.013 0.051 -0.170Bermuda 0.204 -0.012 0.046 -0.169Switzerland 0.198 -0.012 0.044 -0.168Barbados 0.197 -0.012 0.044 -0.168Hong Kong 0.196 -0.012 0.043 -0.168Iceland 0.194 -0.012 0.043 -0.168Denmark 0.191 -0.012 0.042 -0.168Luxembourg 0.100 -0.007 0.018 -0.161United States 0.082 -0.005 0.015 -0.160
Average 0.250 -0.014 0.068 -0.175
Source: Authors' calculation using the 1996 ICP data.

15Cross-Price Elasticities of Demand Across 114 Countries / TB-1925
Economic Research Service / USDA
Our results are compared pair-wise with those of Theil et al. (1989) for the 41 countries present in both the 1980 and 1996 ICP. The comparison of the two ICP datasets (table 1 in this report compared with tables 5-8, pp. 116-17, of Theil) indicate that, during this period, real per capita income relative to that of the United States in the same year declined among the poorest countries in the sample. For example, the 1980 real per capita income relative to that of the United States was 3 percent for Tanzania, 6.7 percent for Nigeria and 6.5 percent for Madagascar. The 1996 real per capita income relative to that of the United States was 2 percent for Tanzania, 2.9 percent for Nigeria, and 3.8 percent for Madagascar.
Comparisons between the studies of the Slutsky and Cournot food-nonfood cross-price elasticities indicate similar patterns in the two sets of estimated elasticities (fi g. 2), with the lower-income countries in both sets having greater cross-price elasticities (absolutely) than the high-income countries. With the exception of Slutsky elasticity for a few very low-income countries that expe-rienced a decline in 1996 real per capita income relative to the 1980 real level, Slutsky cross-price elasticities for most countries are smaller absolutely in magnitude in 1996 than in 1980. This is a reasonable fi nding, since income lev-els for most countries increased between 1980 and 1996, and as income levels increase, we expect price elasticities to become less elastic (Timmer, 1981).
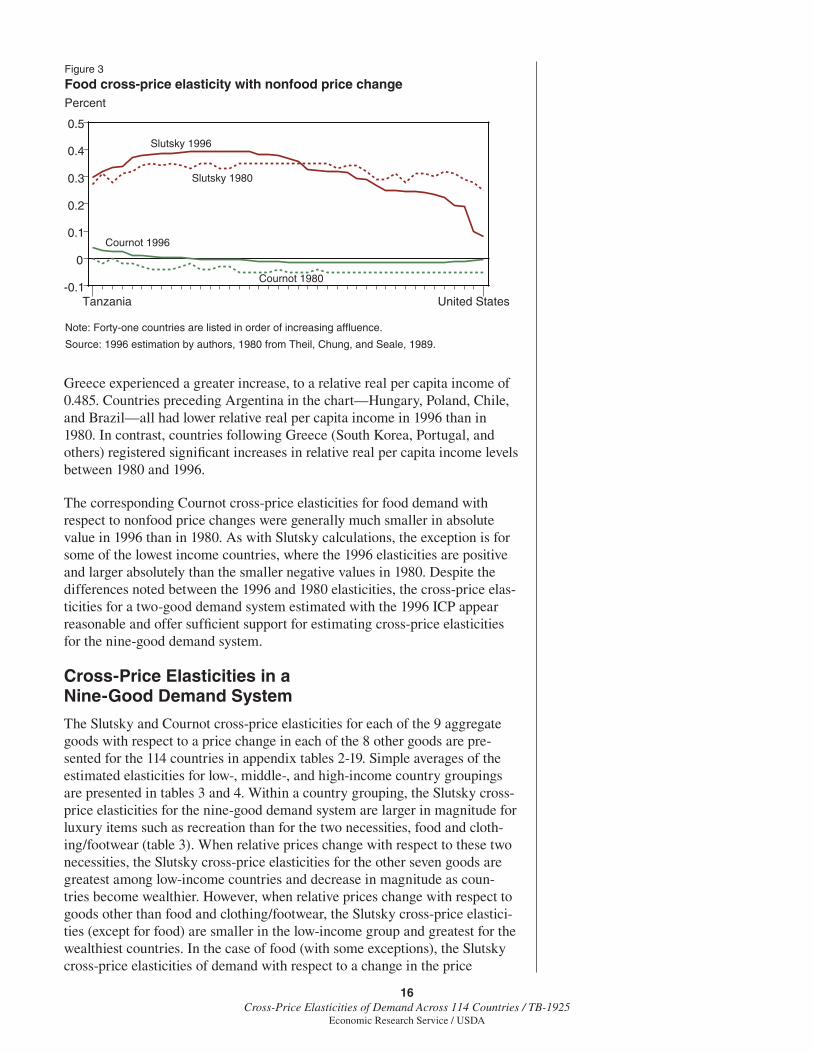
Although the patterns in the estimated Slutsky and Cournot cross-price elasticities for the quantity demanded for food in reaction to nonfood price changes were generally similar in 1980 and 1996, certain differences existed (fi g. 3). The values of the 1996 Slutsky cross-price elasticity were larger than the 1980 estimates for most countries in the lower income half of the sample. This again is related to the real per capita income level in these countries relative to that of the United States in the same year. Countries in the lower income grouping experienced little or no increase in income levels during this period. For example, the point at which the 1996 Slutsky elasticity line in fi gure 3 dips below the 1980 Slutsky elasticity line occurs between Argentina and Greece. In 1980, relative per capita income was 0.361 in Argentina and 0.413 in Greece (Theil et al., 1989); in 1996 it was 0.380 in Argentina, while
Figure 2
Nonfood cross-price elasticity with food price changePercent
Note: Forty-one countries are listed in order of increasing affluence.
Source: 1996 estimation by authors, 1980 from Theil, Chung, and Seale,1989.
Tanzania United States-0.5
-0.3
-0.1
0.1
0.3
0.5
0.7
Slutsky 1980
Slutsky 1996
Cournot 1980
Cournot 1996
16Cross-Price Elasticities of Demand Across 114 Countries / TB-1925
Economic Research Service / USDA
Greece experienced a greater increase, to a relative real per capita income of 0.485. Countries preceding Argentina in the chart—Hungary, Poland, Chile, and Brazil—all had lower relative real per capita income in 1996 than in 1980. In contrast, countries following Greece (South Korea, Portugal, and others) registered signifi cant increases in relative real per capita income levels between 1980 and 1996.
The corresponding Cournot cross-price elasticities for food demand with respect to nonfood price changes were generally much smaller in absolute value in 1996 than in 1980. As with Slutsky calculations, the exception is for some of the lowest income countries, where the 1996 elasticities are positive and larger absolutely than the smaller negative values in 1980. Despite the differences noted between the 1996 and 1980 elasticities, the cross-price elas-ticities for a two-good demand system estimated with the 1996 ICP appear reasonable and offer suffi cient support for estimating cross-price elasticities for the nine-good demand system.
Cross-Price Elasticities in a Nine-Good Demand System
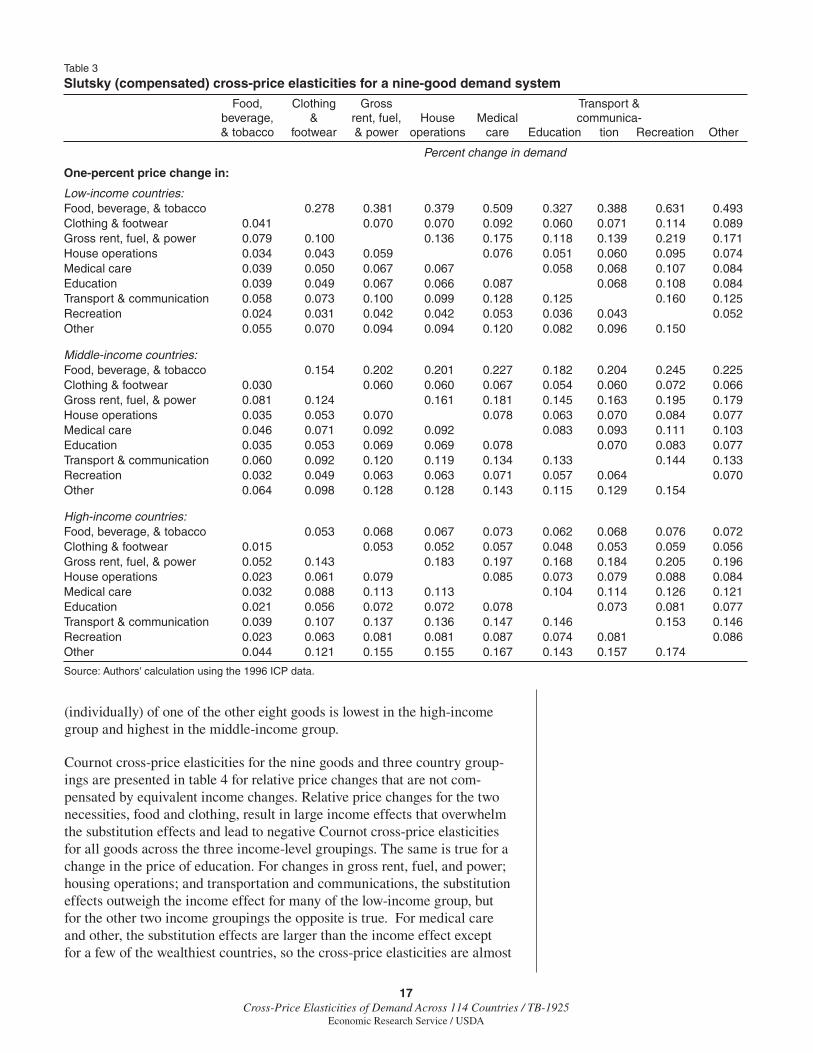
The Slutsky and Cournot cross-price elasticities for each of the 9 aggregate goods with respect to a price change in each of the 8 other goods are pre-sented for the 114 countries in appendix tables 2-19. Simple averages of the estimated elasticities for low-, middle-, and high-income country groupings are presented in tables 3 and 4. Within a country grouping, the Slutsky cross-price elasticities for the nine-good demand system are larger in magnitude for luxury items such as recreation than for the two necessities, food and cloth-ing/footwear (table 3). When relative prices change with respect to these two necessities, the Slutsky cross-price elasticities for the other seven goods are greatest among low-income countries and decrease in magnitude as coun-tries become wealthier. However, when relative prices change with respect to goods other than food and clothing/footwear, the Slutsky cross-price elastici-ties (except for food) are smaller in the low-income group and greatest for the wealthiest countries. In the case of food (with some exceptions), the Slutsky cross-price elasticities of demand with respect to a change in the price
Figure 3
Food cross-price elasticity with nonfood price changePercent
Note: Forty-one countries are listed in order of increasing affluence.
Source: 1996 estimation by authors, 1980 from Theil, Chung, and Seale, 1989.
Slutsky 1980
Slutsky 1996
Cournot 1980
Cournot 1996
Tanzania United States-0.1
0
0.1
0.2
0.3
0.4
0.5
17Cross-Price Elasticities of Demand Across 114 Countries / TB-1925
Economic Research Service / USDA
(individually) of one of the other eight goods is lowest in the high-income group and highest in the middle-income group.
Cournot cross-price elasticities for the nine goods and three country group-ings are presented in table 4 for relative price changes that are not com-pensated by equivalent income changes. Relative price changes for the two necessities, food and clothing, result in large income effects that overwhelm the substitution effects and lead to negative Cournot cross-price elasticities for all goods across the three income-level groupings. The same is true for a change in the price of education. For changes in gross rent, fuel, and power; housing operations; and transportation and communications, the substitution effects outweigh the income effect for many of the low-income group, but for the other two income groupings the opposite is true. For medical care and other, the substitution effects are larger than the income effect except for a few of the wealthiest countries, so the cross-price elasticities are almost
Table 3
Slutsky (compensated) cross-price elasticities for a nine-good demand system
Food, Clothing Gross Transport & beverage, & rent, fuel, House Medical communica- & tobacco footwear & power operations care Education tion Recreation Other
Percent change in demand
One-percent price change in:
Low-income countries:Food, beverage, & tobacco 0.278 0.381 0.379 0.509 0.327 0.388 0.631 0.493Clothing & footwear 0.041 0.070 0.070 0.092 0.060 0.071 0.114 0.089Gross rent, fuel, & power 0.079 0.100 0.136 0.175 0.118 0.139 0.219 0.171House operations 0.034 0.043 0.059 0.076 0.051 0.060 0.095 0.074Medical care 0.039 0.050 0.067 0.067 0.058 0.068 0.107 0.084Education 0.039 0.049 0.067 0.066 0.087 0.068 0.108 0.084Transport & communication 0.058 0.073 0.100 0.099 0.128 0.125 0.160 0.125Recreation 0.024 0.031 0.042 0.042 0.053 0.036 0.043 0.052Other 0.055 0.070 0.094 0.094 0.120 0.082 0.096 0.150
Middle-income countries:Food, beverage, & tobacco 0.154 0.202 0.201 0.227 0.182 0.204 0.245 0.225Clothing & footwear 0.030 0.060 0.060 0.067 0.054 0.060 0.072 0.066Gross rent, fuel, & power 0.081 0.124 0.161 0.181 0.145 0.163 0.195 0.179House operations 0.035 0.053 0.070 0.078 0.063 0.070 0.084 0.077Medical care 0.046 0.071 0.092 0.092 0.083 0.093 0.111 0.103Education 0.035 0.053 0.069 0.069 0.078 0.070 0.083 0.077Transport & communication 0.060 0.092 0.120 0.119 0.134 0.133 0.144 0.133Recreation 0.032 0.049 0.063 0.063 0.071 0.057 0.064 0.070Other 0.064 0.098 0.128 0.128 0.143 0.115 0.129 0.154
High-income countries:Food, beverage, & tobacco 0.053 0.068 0.067 0.073 0.062 0.068 0.076 0.072Clothing & footwear 0.015 0.053 0.052 0.057 0.048 0.053 0.059 0.056Gross rent, fuel, & power 0.052 0.143 0.183 0.197 0.168 0.184 0.205 0.196House operations 0.023 0.061 0.079 0.085 0.073 0.079 0.088 0.084Medical care 0.032 0.088 0.113 0.113 0.104 0.114 0.126 0.121Education 0.021 0.056 0.072 0.072 0.078 0.073 0.081 0.077Transport & communication 0.039 0.107 0.137 0.136 0.147 0.146 0.153 0.146Recreation 0.023 0.063 0.081 0.081 0.087 0.074 0.081 0.086Other 0.044 0.121 0.155 0.155 0.167 0.143 0.157 0.174
Source: Authors' calculation using the 1996 ICP data.

18Cross-Price Elasticities of Demand Across 114 Countries / TB-1925
Economic Research Service / USDA
all positive. For recreation, all cross-price elasticities are positive across all groups. The values of these elasticities for all goods generally tend to be largest for the poorest countries and to decrease in magnitude as countries become wealthier.
Relative price changes with respect to goods other than necessities lead to cross-price elasticities that vary across goods and country groupings. When a relative price change occurs with respect to gross rent/fuel/power, the effects on other consumption categories are more positive for low-income countries than for the other two groups. In contrast, the effect of a relative price change with respect to house furnishings and operations on the demand for all other eight goods is negative across the middle- and high-income country group-ings. A relative price change with respect to three luxury items—medical care, recreation, and other—leads to increased demand for all other goods, as indicated by the positive Cournot elasticity.
Table 4
Cournot (uncompensated) cross-price elasticities for a nine-good demand system
Food, Clothing Gross Transport & beverage, & rent, fuel, House Medical communica- & tobacco footwear & power operations care Education tion Recreation Other
Percent change in demand
One-percent price change in:
Low-income countries:Food, beverage, & tobacco -0.191 -0.260 -0.259 -0.343 -0.224 -0.265 -0.426 -0.332Clothing & footwear -0.014 -0.024 -0.024 -0.031 -0.021 -0.024 -0.039 -0.030Gross rent, fuel, & power 0.001 0.001 0.002 0.003 0.002 0.002 0.004 0.003House operations 0.000 0.000 0.001 0.001 0.000 0.001 0.001 0.001Medical care 0.008 0.010 0.014 0.014 0.012 0.015 0.024 0.019Education -0.006 -0.007 -0.010 -0.009 -0.012 -0.010 -0.015 -0.012Transport & communication 0.002 0.002 0.003 0.003 0.004 0.004 0.005 0.004Recreation 0.009 0.011 0.015 0.015 0.020 0.013 0.015 0.019Other 0.011 0.014 0.019 0.018 0.025 0.019 0.031 0.016
Middle-income countries:Food, beverage, & tobacco -0.160 -0.209 -0.209 -0.235 -0.188 -0.212 -0.253 -0.233Clothing & footwear -0.011 -0.021 -0.021 -0.024 -0.019 -0.021 -0.025 -0.023Gross rent, fuel, & power -0.003 -0.004 -0.006 -0.007 -0.005 -0.006 -0.007 -0.006House operations -0.001 -0.002 -0.003 -0.003 -0.002 -0.003 -0.003 -0.003Medical care 0.004 0.005 0.007 0.007 0.006 0.007 0.008 0.008Education -0.005 -0.008 -0.010 -0.010 -0.012 -0.011 -0.013 -0.012Transport & communication -0.002 -0.002 -0.003 -0.003 -0.003 -0.003 -0.004 -0.003Recreation 0.004 0.007 0.009 0.009 0.010 0.008 0.009 0.010Other 0.004 0.006 0.009 0.008 0.010 0.009 0.010 0.008
High-income countries:Food, beverage, & tobacco -0.135 -0.173 -0.173 -0.187 -0.159 -0.175 -0.194 -0.186Clothing & footwear -0.006 -0.019 -0.019 -0.021 -0.018 -0.019 -0.021 -0.021Gross rent, fuel, & power -0.003 -0.009 -0.012 -0.013 -0.011 -0.012 -0.013 -0.013House operations -0.001 -0.004 -0.005 -0.006 -0.005 -0.005 -0.006 -0.006Medical care 0.000 0.001 0.001 0.001 0.001 0.001 0.001 0.001Education -0.003 -0.009 -0.011 -0.011 -0.012 -0.011 -0.013 -0.012Transport & communication -0.002 -0.006 -0.008 -0.008 -0.008 -0.008 -0.009 -0.008Recreation 0.001 0.003 0.004 0.004 0.004 0.004 0.004 0.004Other 0.000 0.001 0.001 0.001 0.001 0.001 0.001 0.001
Source: Authors' calculation using the 1996 ICP data.
19Cross-Price Elasticities of Demand Across 114 Countries / TB-1925
Economic Research Service / USDA
Conclusions
This report articulates a simple method for calculating cross-country, cross-price elasticities of demand. Using this method, the authors calculate two sets of cross-price elasticities, Slutsky and Cournot, for 2-good and 9-good demand systems from the 1996 International Comparison Program data across 114 countries. The compensated Slutsky elasticity is calculated assuming that the real income level remains unchanged, while the uncompensated Cournot elas-ticity is calculated assuming that the nominal income remains unchanged.
Comparisons of the elasticities from the two-good demand system with elas-ticities estimated with the 1980 ICP data by Theil, Chung, and Seale (1989) provide affi rmation that the 1996 elasticity estimates in the present report are reasonable. In general, consumer demand in the higher income countries, where income levels had grown over this period, had become less elastic in 1996 with respect to relative price changes. However, in the poorest countries in the sample, where there was little or no real income growth during the period, relative price changes sometimes led to cross-price elasticities in 1996 greater than those calculated in 1980.
The elasticity estimates from this report represent the only available consis-tent cross-country cross-price elasticity estimates across this number of coun-tries and consumption categories. Past estimates of income and own-price elasticities, calculated using the 1996 ICP data (Seale, Regmi, and Bernstein, 2003), have been widely used as input in economic models such as USDA’s Baseline, the Global Trade Analysis Project (GTAP) model, the International Food Research Policy Institute (IFPRI) IMPACT model, and others. The newly estimated cross-price elasticities presented in this report should prove to be equally valuable. Users need to bear in mind that these elasticities are calculated based on ICP data, which can be considered broadly representa-tive for a country, but which may not be a good measure for different socio-economic groups within that country. Finally, having been based on broad aggregates, the elasticity estimates may be biased somewhat downwards.
The methodology presented in this report may be generalized to other demand systems. For example, several authors (e.g., Reimer and Hertel, 2003, 2004; Cranfield et al., 1998, 2003; Cranfield et al. 2000, 2004) have successfully fi t the 1985 and 1996 ICP data with the AIDADS model developed by Rimmer and Powell (1996, 2001). Based upon these authors’ estimated parameters, it is possible to calculate marginal shares and cross-price elasticities across the countries in the study, as has been done in this report. One could also fi t an Almost-Ideal Demand System (AIDS) model (Deaton and Muellbauer, 1980) to ICP data, estimate the parameters, and use these to calculate marginal shares and cross-price elasticities individually for all countries in the sample. However, as discussed by Seale and Regmi (2006), not all demand systems are suitable for cross-country demand analyses. For example, models with constant mar-ginal shares such as the linear expenditure system are not suitable for estimat-ing cross-price elasticities across individual countries.
The methodology may also be generalized to out-of-sample data sets. For example, Cox and Alm (2007) calculated income and own-price elasticities of demand for a set of countries by using the parameter estimates of Seale

20Cross-Price Elasticities of Demand Across 114 Countries / TB-1925
Economic Research Service / USDA
and Regmi (2006) and applying them to a real per capita income series that linked real income in 1996 to that of 2006. The method presented in this report could be applied to calculate those cross-price elasticities. Further, this study’s methodology should prove useful in estimating a new set of cross-price elasticities with the 2005 ICP data, which covers 147 countries.

21Cross-Price Elasticities of Demand Across 114 Countries / TB-1925
Economic Research Service / USDA
References
Clements, K.W., and H. Theil, 1979. A Cross-Country Analysis of Consumption Patterns, Report no. 7924. Center for Mathematical Studies in Business and Economics, University of Chicago, Chicago, IL.
Cox, W.M., and R. Alm, 2007. “Opportunity Knocks: Selling Our Services to the World,” in Federal Reserve Bank of Dallas 2007 Annual Report. Dallas, TX.
Cranfield, J.A.L., J.S. Eales, T.W. Hertel, and P.V. Preckel, 1998. “Changes in the Structure of Global Food Demand,” American Journal of Agricultural Economics, Vol. 80, pp. 1042–50.
Cranfield, J.A.L., J.S. Eales, T.W. Hertel, and P.V. Preckel, 2003. “Model Selection when Estimating and Predicting Consumer Demands Using International Cross Section Data,” Empirical Economics, Vol. 28, pp. 353–64.
Cranfi eld, J.A.L., P.V. Preckel, J.S. Eales, and T.W. Hertel, 2000. “On the Estimation of an Implicitly Additive Demand System,” Applied Economics, Vol. 32, pp. 1907-15.
Cranfield, J.A.L., P.V. Preckel, J.S. Eales, and T.W. Hertel, 2004. “Simultaneous Estimation of an Implicit Directly Additive Demand System and the Distribution of Expenditure: An Application of Maximum Entropy,” Economic Modelling, Vol. 21, 361–85.
Deaton, A.S., and J. Muellbauer, 1980. “An Almost Ideal Demand System,” American Economic Review, Vol. 70, pp. 313-26.
Fiebig, Denzil G., James Seale, Jr., and Henri Theil, 1987. “The Demand for Energy: Evidence from a Cross-Country Demand System,” Energy Economics Vol. 9, pp. 149-53.
Fiebig, Denzil G., James L. Seale, Jr., and Henri Theil, 1988. “Cross–Country Demand Analysis Based on Three Phases of the International Comparison Project.” In J. Salazar–Carrillo and D.S. Prosada–Rao (eds.), World Comparison of Incomes, Prices, and Product. Amsterdam: Elsevier Science Publishers B.V. (North-Holland), pp. 225–35.
Finke, R., M.C. Rosalsky, and H. Theil, 1983. “A New Cross-Country Tabulation of Income Elasticities of Demand,” Economics Letters, Vol. 12, pp. 391-96.
Frisch, Ragnar, 1932. New Methods of Measuring Marginal Utility. Tübingen, Germany: Mohr.
Frisch, Ragnar, 1959. “A Complete Scheme for Computing All Direct and Cross Demand Elasticities in a Model with Many Sectors,” Econometrica, Vol. 27(2), pp. 177-96.
Friedman, Milton, 1976. Price Theory, Chicago: Aldine Publishing Co.
22Cross-Price Elasticities of Demand Across 114 Countries / TB-1925
Economic Research Service / USDA
Goldberger, A.S., and T. Gamaletsos, 1970. “A Cross-Country Comparison of Consumer Expenditure Patterns,” European Economic Review, Vol. 1, pp. 357-400.
Houthakker, H.S., 1957. “An International Comparison of Household Expenditure Patterns, Commemorating the Centenary of Engel’s Law,” Econometrica, Vol. 25, pp. 532-51.
Hertel, T.W., and L.A. Winters, 2006. Poverty and the WTO: Impacts of the Doha Development Agenda. Washington, DC: World Bank Publications.
Keller, W.J., and J. van Driel, 1985. “Differential Consumer Demand Systems,” European Economic Review, Vol. 27, pp. 375-90.
Kmenta, Jan, 1990. Elements of Econometrics, Second Edition. New York: MacMillan Publishing Co.
Kravis, I.B., A.W. Heston, and R. Summers, 1978a. International Comparisons of Real Product and Purchasing Power, Baltimore: Johns Hopkins University Press (for the World Bank).
Kravis, I.B., A.W. Heston, and R., Summers, 1978b. “Real GDP Per Capita for More Than One Hundred Countries,” Economic Journal, Vol. 88, pp. 215-42.
Kravis, I.B., A.W. Heston, and R. Summers, 1982. World Product and Income: International Comparisons of Real Gross Product, Baltimore: Johns Hopkins Univ. Press (for the World Bank).
Kravis, I.B., Z. Kenessey, A.W. Heston, and R. Summers, 1975. A System of International Comparisons of Gross Product and Purchasing Power. Baltimore: Johns Hopkins University Press (for the World Bank).
Neves, P., 1987. “Analysis of Consumer Demand in Portugal, 1958-1981,” Memoire de Maitrise en Sciences Economiques, Universite Catholique de Louvain, Louvain-la-Nueve.
Reimer, J.J., and T.W. Hertel, 2003. “International Cross Section Estimates of Demand for Use in the GTAP Model,” GTAP Working Paper No. 22, Center for Global Trade Analysis, Department of Agricultural Economics, Purdue University. West Lafayette, IN.
Reimer, J.J., and T.W. Hertel, 2004. “Estimation of International Demand Behavior for Use with Input-Output Based Data,” Economic Systems Research, Vol. 16(4), pp. 347-66.
Rimmer, M.T., and A.A. Powell, 1996. “An Implicitly Directly Additive Demand System,” Applied Economics, Vol. 28, pp. 1613–22.
Rimmer, M.T., and A.A. Powell, 2001. “Demand Patterns across the Development Spectrum: Estimates for the AIDADS System,” Preliminary Working Paper No. OP-75, Centre of Policy Studies, Monash University, Victoria, Australia.

23Cross-Price Elasticities of Demand Across 114 Countries / TB-1925
Economic Research Service / USDA
Seale, James L., and Anita Regmi, 2006. “Modeling International Consumption Patterns,” Review of Income and Wealth, Vol. 52(4), pp. 603-24.
Seale, J., and A. Regmi, 2009. “International Consumption Patterns: Evidence from the 1996 International Comparison Project,” in Subrata Ghatak (ed.), Macroeconomics of Development. London/New York: Routledge.
Seale, J.L., A. Regmi, and J. Bernstein, 2003. International Evidence on Food Consumption Patterns, Technical Bulletin No. 1904, Economic Research Service, U.S. Department of Agriculture.
Seale, James, Jr., and Henri Theil, 1987. “Extending the Sample Size in Cross-Country Demand Analysis,” Economics Letters, Vol. 23, pp. 209-12.
Seale, J.L., Jr., and H. Theil, 1991. “Income and Price Sensitivity in Demand Systems, Part II: Price Sensitivity,” in T.J. Kaul and J.K. Sengupta (eds.), Economic Models, Estimation, and Socioeconomic System: Essays in Honor of Karl A. Fox. Amsterdam: Elsevier (North-Holland) Science Publishers, B.U.
Seale, James L., Jr., Wayne E. Walker, and In-Moo Kim, 1991. “The Demand for Energy: Cross-Country Evidence Using the Florida Model,” Energy Economics, Vol. 13, pp. 33-40.
Suhm, F.E., 1979. “A Cross-Country Analysis of Divisia Covariances of Prices and Quantities Consumed,” Manuscript, University of Chicago, Chicago, IL.
Theil, H., 1965. “The Information Approach to Demand Analysis,” Econometrica, Vol. 33, pp. 67-87.
Theil, H., 1987. “Evidence on International Consumption Patterns,” in Henri Theil and Kenneth W. Clements (eds.), Applied Demand Analysis. Cambridge, MA: Ballinger Publishing Co., pp. 37-100.
Theil, H., 1996. Studies in Global Econometrics. Dordrecht, Holland: Kluwer Academic Publishers.
Theil, H., 1997. “The Florida Model for Demand Analysis with Cross-Country Data,” in Antonio Jorge and Jorge Salazar–Carrillo (eds.), Price Policies and Economic Growth. Westport, CT: Praeger Publishers, pp. 227-36.
Theil H., C.F. Chung, and J.L. Seale, Jr. 1989. International Evidence on Consumption Patterns. Greenwich, CT: JAI Press, Inc.
Theil, H., and R. Finke, 1985. “Income and Price Elasticities of Demand at Low Levels of Real Income,” Economics Letters, Vol. 18, pp. 1-5.
Theil, Henri, and James L. Seale, Jr., 1987. “Measuring the Distance between Relative Price Vectors of Different Countries,” Economics Letters, Vol. 24, pp. 371-74.

24Cross-Price Elasticities of Demand Across 114 Countries / TB-1925
Economic Research Service / USDA
Theil, H., F.E. Suhm, and J.F. Meisner, 1980. “Statistical Inference in Cross-Country Demand Systems,” Economics Letters, Vol. 5, pp. 383-87.
Timmer, C.P., 1981. “Is There Curvature in the Slutsky Matrix?” Review of Economics and Statistics, Vol. 63, pp. 395-402.
Valenzuela, Ernesto, Kym Anderson, and Thomas Hertel, 2007. “Impacts of Trade Reform: Sensitivity of Model Results to Key Assumptions,” International Economics and Economic Policy, Vol. 4, pp. 395-420.
von Braun, J., 2007. The World Food Situation: New Driving Forces and Required Actions, Food Policy Report No. 18, IFPRI, Washington, DC.
Winters, L. Alan, 2005. “The European Agricultural Trade Policies and Poverty,” European Review of Agricultural Economics, Vol. 32(3), pp. 319–46.
Working, H., 1943. “Statistical Laws of Family Expenditure,” Journal of the American Statistical Association, Vol. 38, pp. 43-56.
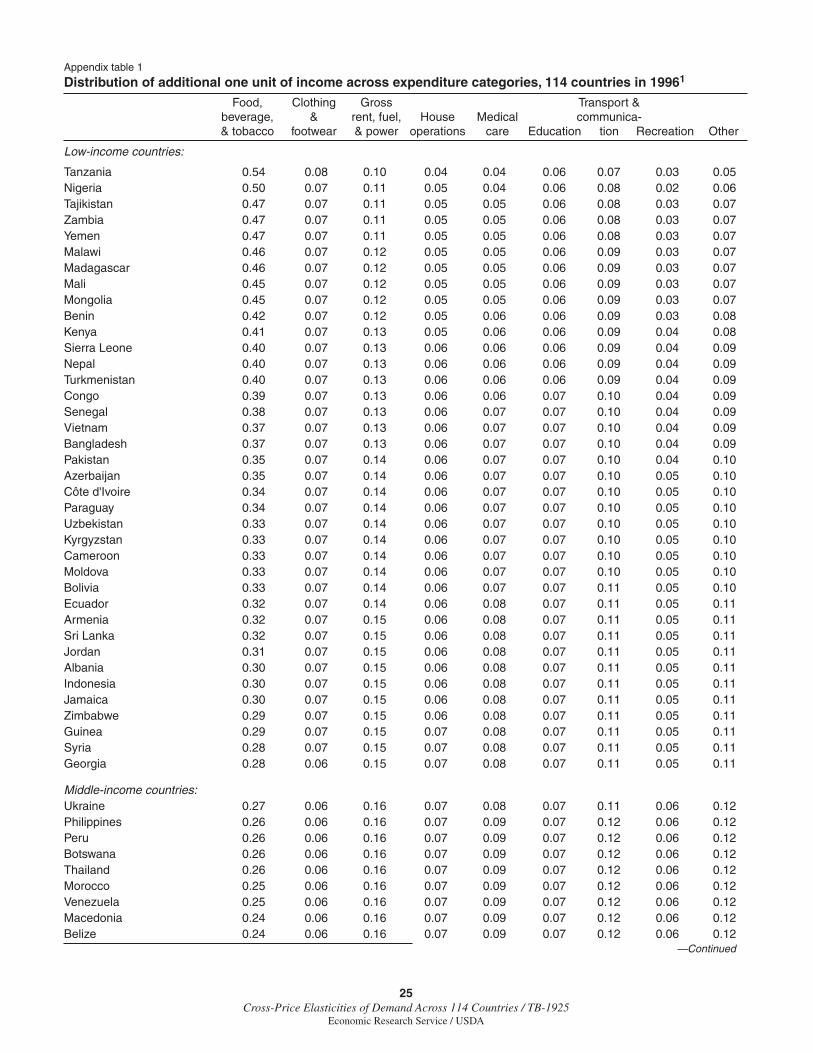
25Cross-Price Elasticities of Demand Across 114 Countries / TB-1925
Economic Research Service / USDA
Appendix table 1
Distribution of additional one unit of income across expenditure categories, 114 countries in 19961
Food, Clothing Gross Transport & beverage, & rent, fuel, House Medical communica- & tobacco footwear & power operations care Education tion Recreation Other
Low-income countries:
Tanzania 0.54 0.08 0.10 0.04 0.04 0.06 0.07 0.03 0.05Nigeria 0.50 0.07 0.11 0.05 0.04 0.06 0.08 0.02 0.06Tajikistan 0.47 0.07 0.11 0.05 0.05 0.06 0.08 0.03 0.07Zambia 0.47 0.07 0.11 0.05 0.05 0.06 0.08 0.03 0.07Yemen 0.47 0.07 0.11 0.05 0.05 0.06 0.08 0.03 0.07Malawi 0.46 0.07 0.12 0.05 0.05 0.06 0.09 0.03 0.07Madagascar 0.46 0.07 0.12 0.05 0.05 0.06 0.09 0.03 0.07Mali 0.45 0.07 0.12 0.05 0.05 0.06 0.09 0.03 0.07Mongolia 0.45 0.07 0.12 0.05 0.05 0.06 0.09 0.03 0.07Benin 0.42 0.07 0.12 0.05 0.06 0.06 0.09 0.03 0.08Kenya 0.41 0.07 0.13 0.05 0.06 0.06 0.09 0.04 0.08Sierra Leone 0.40 0.07 0.13 0.06 0.06 0.06 0.09 0.04 0.09Nepal 0.40 0.07 0.13 0.06 0.06 0.06 0.09 0.04 0.09Turkmenistan 0.40 0.07 0.13 0.06 0.06 0.06 0.09 0.04 0.09Congo 0.39 0.07 0.13 0.06 0.06 0.07 0.10 0.04 0.09Senegal 0.38 0.07 0.13 0.06 0.07 0.07 0.10 0.04 0.09Vietnam 0.37 0.07 0.13 0.06 0.07 0.07 0.10 0.04 0.09Bangladesh 0.37 0.07 0.13 0.06 0.07 0.07 0.10 0.04 0.09Pakistan 0.35 0.07 0.14 0.06 0.07 0.07 0.10 0.04 0.10Azerbaijan 0.35 0.07 0.14 0.06 0.07 0.07 0.10 0.05 0.10Côte d'Ivoire 0.34 0.07 0.14 0.06 0.07 0.07 0.10 0.05 0.10Paraguay 0.34 0.07 0.14 0.06 0.07 0.07 0.10 0.05 0.10Uzbekistan 0.33 0.07 0.14 0.06 0.07 0.07 0.10 0.05 0.10Kyrgyzstan 0.33 0.07 0.14 0.06 0.07 0.07 0.10 0.05 0.10Cameroon 0.33 0.07 0.14 0.06 0.07 0.07 0.10 0.05 0.10Moldova 0.33 0.07 0.14 0.06 0.07 0.07 0.10 0.05 0.10Bolivia 0.33 0.07 0.14 0.06 0.07 0.07 0.11 0.05 0.10Ecuador 0.32 0.07 0.14 0.06 0.08 0.07 0.11 0.05 0.11Armenia 0.32 0.07 0.15 0.06 0.08 0.07 0.11 0.05 0.11Sri Lanka 0.32 0.07 0.15 0.06 0.08 0.07 0.11 0.05 0.11Jordan 0.31 0.07 0.15 0.06 0.08 0.07 0.11 0.05 0.11Albania 0.30 0.07 0.15 0.06 0.08 0.07 0.11 0.05 0.11Indonesia 0.30 0.07 0.15 0.06 0.08 0.07 0.11 0.05 0.11Jamaica 0.30 0.07 0.15 0.06 0.08 0.07 0.11 0.05 0.11Zimbabwe 0.29 0.07 0.15 0.06 0.08 0.07 0.11 0.05 0.11Guinea 0.29 0.07 0.15 0.07 0.08 0.07 0.11 0.05 0.11Syria 0.28 0.07 0.15 0.07 0.08 0.07 0.11 0.05 0.11Georgia 0.28 0.06 0.15 0.07 0.08 0.07 0.11 0.05 0.11
Middle-income countries:Ukraine 0.27 0.06 0.16 0.07 0.08 0.07 0.11 0.06 0.12Philippines 0.26 0.06 0.16 0.07 0.09 0.07 0.12 0.06 0.12Peru 0.26 0.06 0.16 0.07 0.09 0.07 0.12 0.06 0.12Botswana 0.26 0.06 0.16 0.07 0.09 0.07 0.12 0.06 0.12Thailand 0.26 0.06 0.16 0.07 0.09 0.07 0.12 0.06 0.12Morocco 0.25 0.06 0.16 0.07 0.09 0.07 0.12 0.06 0.12Venezuela 0.25 0.06 0.16 0.07 0.09 0.07 0.12 0.06 0.12Macedonia 0.24 0.06 0.16 0.07 0.09 0.07 0.12 0.06 0.12Belize 0.24 0.06 0.16 0.07 0.09 0.07 0.12 0.06 0.12
—Continued
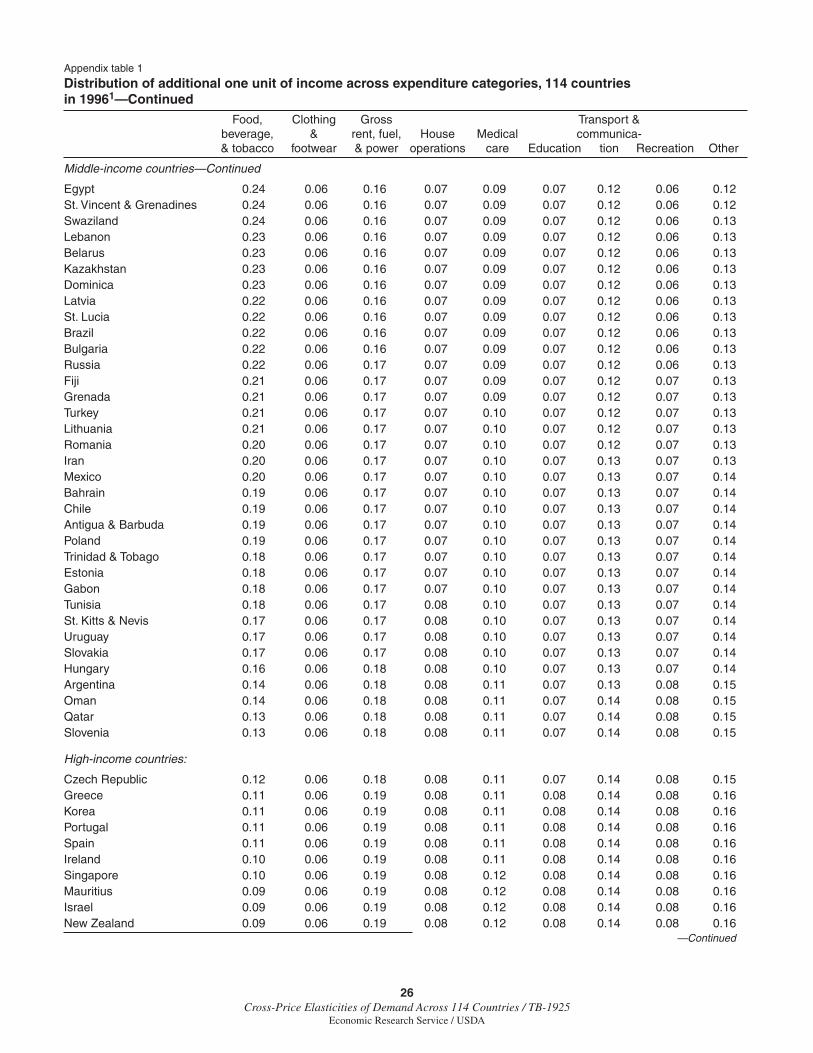
26Cross-Price Elasticities of Demand Across 114 Countries / TB-1925
Economic Research Service / USDA
Appendix table 1
Distribution of additional one unit of income across expenditure categories, 114 countries in 19961—Continued
Food, Clothing Gross Transport & beverage, & rent, fuel, House Medical communica- & tobacco footwear & power operations care Education tion Recreation Other
Middle-income countries—Continued
Egypt 0.24 0.06 0.16 0.07 0.09 0.07 0.12 0.06 0.12St. Vincent & Grenadines 0.24 0.06 0.16 0.07 0.09 0.07 0.12 0.06 0.12Swaziland 0.24 0.06 0.16 0.07 0.09 0.07 0.12 0.06 0.13Lebanon 0.23 0.06 0.16 0.07 0.09 0.07 0.12 0.06 0.13Belarus 0.23 0.06 0.16 0.07 0.09 0.07 0.12 0.06 0.13Kazakhstan 0.23 0.06 0.16 0.07 0.09 0.07 0.12 0.06 0.13Dominica 0.23 0.06 0.16 0.07 0.09 0.07 0.12 0.06 0.13Latvia 0.22 0.06 0.16 0.07 0.09 0.07 0.12 0.06 0.13St. Lucia 0.22 0.06 0.16 0.07 0.09 0.07 0.12 0.06 0.13Brazil 0.22 0.06 0.16 0.07 0.09 0.07 0.12 0.06 0.13Bulgaria 0.22 0.06 0.16 0.07 0.09 0.07 0.12 0.06 0.13Russia 0.22 0.06 0.17 0.07 0.09 0.07 0.12 0.06 0.13Fiji 0.21 0.06 0.17 0.07 0.09 0.07 0.12 0.07 0.13Grenada 0.21 0.06 0.17 0.07 0.09 0.07 0.12 0.07 0.13Turkey 0.21 0.06 0.17 0.07 0.10 0.07 0.12 0.07 0.13Lithuania 0.21 0.06 0.17 0.07 0.10 0.07 0.12 0.07 0.13Romania 0.20 0.06 0.17 0.07 0.10 0.07 0.12 0.07 0.13Iran 0.20 0.06 0.17 0.07 0.10 0.07 0.13 0.07 0.13Mexico 0.20 0.06 0.17 0.07 0.10 0.07 0.13 0.07 0.14Bahrain 0.19 0.06 0.17 0.07 0.10 0.07 0.13 0.07 0.14Chile 0.19 0.06 0.17 0.07 0.10 0.07 0.13 0.07 0.14Antigua & Barbuda 0.19 0.06 0.17 0.07 0.10 0.07 0.13 0.07 0.14Poland 0.19 0.06 0.17 0.07 0.10 0.07 0.13 0.07 0.14Trinidad & Tobago 0.18 0.06 0.17 0.07 0.10 0.07 0.13 0.07 0.14Estonia 0.18 0.06 0.17 0.07 0.10 0.07 0.13 0.07 0.14Gabon 0.18 0.06 0.17 0.07 0.10 0.07 0.13 0.07 0.14Tunisia 0.18 0.06 0.17 0.08 0.10 0.07 0.13 0.07 0.14St. Kitts & Nevis 0.17 0.06 0.17 0.08 0.10 0.07 0.13 0.07 0.14Uruguay 0.17 0.06 0.17 0.08 0.10 0.07 0.13 0.07 0.14Slovakia 0.17 0.06 0.17 0.08 0.10 0.07 0.13 0.07 0.14Hungary 0.16 0.06 0.18 0.08 0.10 0.07 0.13 0.07 0.14Argentina 0.14 0.06 0.18 0.08 0.11 0.07 0.13 0.08 0.15Oman 0.14 0.06 0.18 0.08 0.11 0.07 0.14 0.08 0.15Qatar 0.13 0.06 0.18 0.08 0.11 0.07 0.14 0.08 0.15Slovenia 0.13 0.06 0.18 0.08 0.11 0.07 0.14 0.08 0.15
High-income countries:
Czech Republic 0.12 0.06 0.18 0.08 0.11 0.07 0.14 0.08 0.15Greece 0.11 0.06 0.19 0.08 0.11 0.08 0.14 0.08 0.16Korea 0.11 0.06 0.19 0.08 0.11 0.08 0.14 0.08 0.16Portugal 0.11 0.06 0.19 0.08 0.11 0.08 0.14 0.08 0.16Spain 0.11 0.06 0.19 0.08 0.11 0.08 0.14 0.08 0.16Ireland 0.10 0.06 0.19 0.08 0.11 0.08 0.14 0.08 0.16Singapore 0.10 0.06 0.19 0.08 0.12 0.08 0.14 0.08 0.16Mauritius 0.09 0.06 0.19 0.08 0.12 0.08 0.14 0.08 0.16Israel 0.09 0.06 0.19 0.08 0.12 0.08 0.14 0.08 0.16New Zealand 0.09 0.06 0.19 0.08 0.12 0.08 0.14 0.08 0.16
—Continued
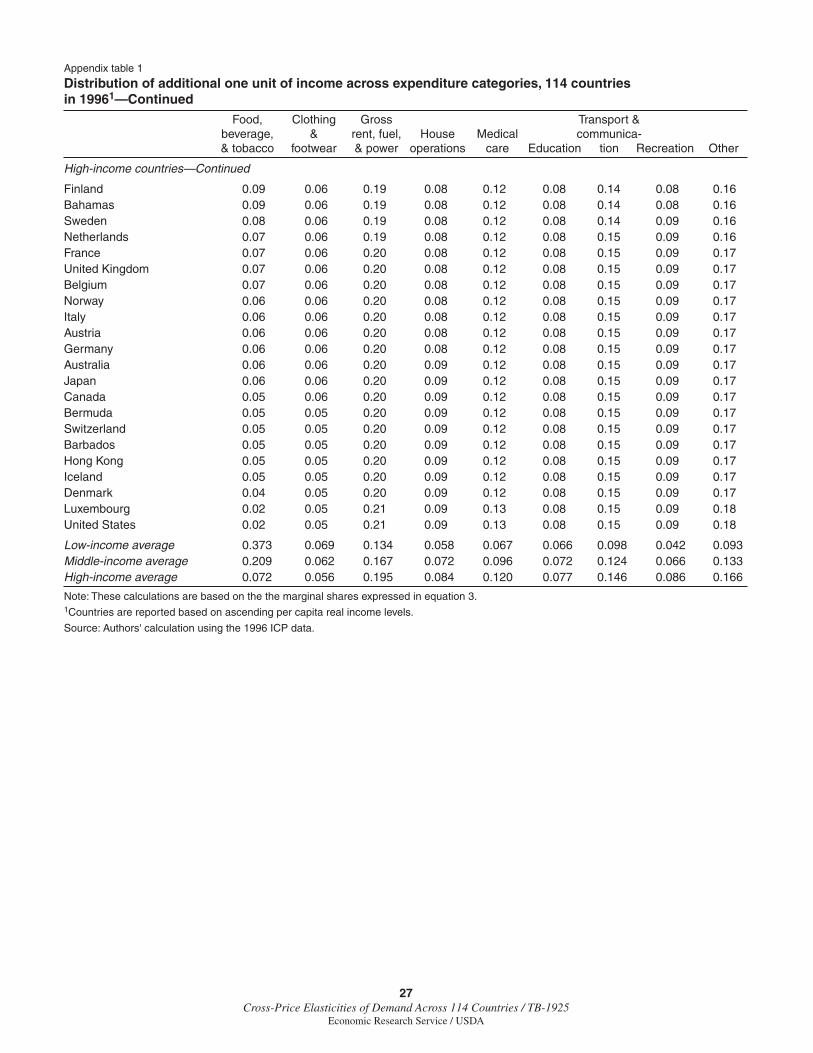
27Cross-Price Elasticities of Demand Across 114 Countries / TB-1925
Economic Research Service / USDA
Appendix table 1
Distribution of additional one unit of income across expenditure categories, 114 countries in 19961—Continued
Food, Clothing Gross Transport & beverage, & rent, fuel, House Medical communica- & tobacco footwear & power operations care Education tion Recreation Other
High-income countries—Continued
Finland 0.09 0.06 0.19 0.08 0.12 0.08 0.14 0.08 0.16Bahamas 0.09 0.06 0.19 0.08 0.12 0.08 0.14 0.08 0.16Sweden 0.08 0.06 0.19 0.08 0.12 0.08 0.14 0.09 0.16Netherlands 0.07 0.06 0.19 0.08 0.12 0.08 0.15 0.09 0.16France 0.07 0.06 0.20 0.08 0.12 0.08 0.15 0.09 0.17United Kingdom 0.07 0.06 0.20 0.08 0.12 0.08 0.15 0.09 0.17Belgium 0.07 0.06 0.20 0.08 0.12 0.08 0.15 0.09 0.17Norway 0.06 0.06 0.20 0.08 0.12 0.08 0.15 0.09 0.17Italy 0.06 0.06 0.20 0.08 0.12 0.08 0.15 0.09 0.17Austria 0.06 0.06 0.20 0.08 0.12 0.08 0.15 0.09 0.17Germany 0.06 0.06 0.20 0.08 0.12 0.08 0.15 0.09 0.17Australia 0.06 0.06 0.20 0.09 0.12 0.08 0.15 0.09 0.17Japan 0.06 0.06 0.20 0.09 0.12 0.08 0.15 0.09 0.17Canada 0.05 0.06 0.20 0.09 0.12 0.08 0.15 0.09 0.17Bermuda 0.05 0.05 0.20 0.09 0.12 0.08 0.15 0.09 0.17Switzerland 0.05 0.05 0.20 0.09 0.12 0.08 0.15 0.09 0.17Barbados 0.05 0.05 0.20 0.09 0.12 0.08 0.15 0.09 0.17Hong Kong 0.05 0.05 0.20 0.09 0.12 0.08 0.15 0.09 0.17Iceland 0.05 0.05 0.20 0.09 0.12 0.08 0.15 0.09 0.17Denmark 0.04 0.05 0.20 0.09 0.12 0.08 0.15 0.09 0.17Luxembourg 0.02 0.05 0.21 0.09 0.13 0.08 0.15 0.09 0.18United States 0.02 0.05 0.21 0.09 0.13 0.08 0.15 0.09 0.18
Low-income average 0.373 0.069 0.134 0.058 0.067 0.066 0.098 0.042 0.093Middle-income average 0.209 0.062 0.167 0.072 0.096 0.072 0.124 0.066 0.133High-income average 0.072 0.056 0.195 0.084 0.120 0.077 0.146 0.086 0.166
Note: These calculations are based on the the marginal shares expressed in equation 3.1Countries are reported based on ascending per capita real income levels.
Source: Authors' calculation using the 1996 ICP data.
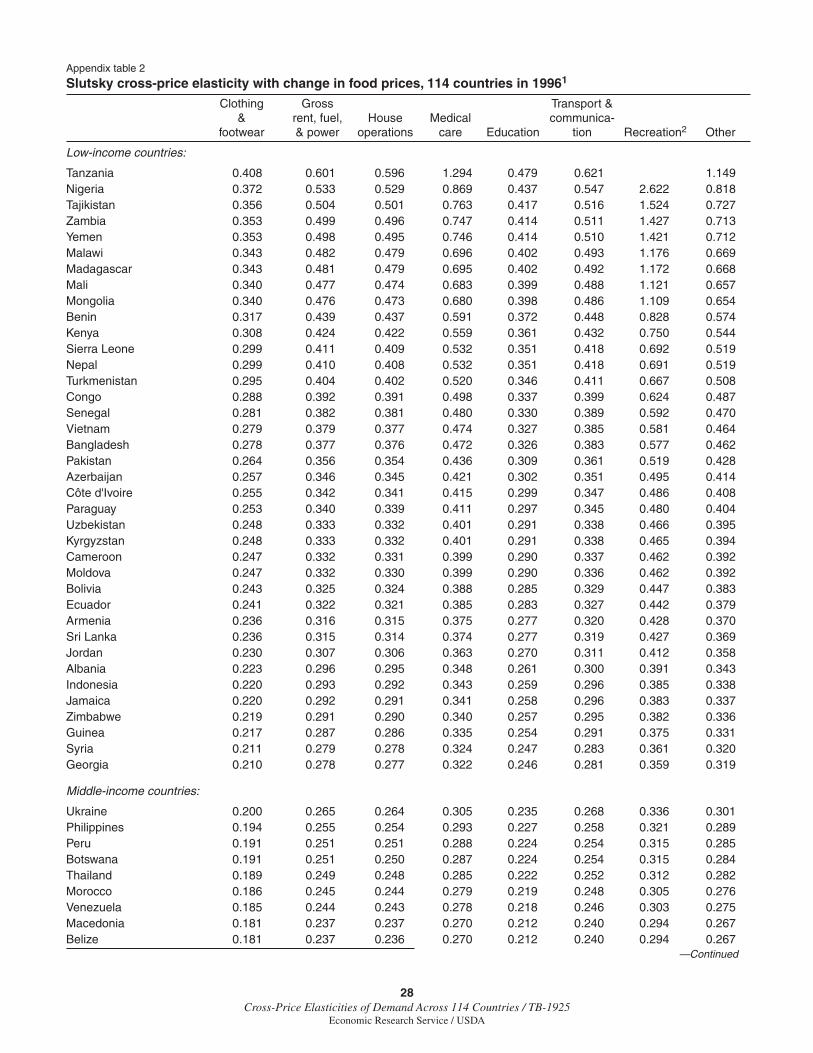
28Cross-Price Elasticities of Demand Across 114 Countries / TB-1925
Economic Research Service / USDA
Appendix table 2
Slutsky cross-price elasticity with change in food prices, 114 countries in 19961
Clothing Gross Transport & & rent, fuel, House Medical communica- footwear & power operations care Education tion Recreation2 Other
Low-income countries:
Tanzania 0.408 0.601 0.596 1.294 0.479 0.621 1.149Nigeria 0.372 0.533 0.529 0.869 0.437 0.547 2.622 0.818Tajikistan 0.356 0.504 0.501 0.763 0.417 0.516 1.524 0.727Zambia 0.353 0.499 0.496 0.747 0.414 0.511 1.427 0.713Yemen 0.353 0.498 0.495 0.746 0.414 0.510 1.421 0.712Malawi 0.343 0.482 0.479 0.696 0.402 0.493 1.176 0.669Madagascar 0.343 0.481 0.479 0.695 0.402 0.492 1.172 0.668Mali 0.340 0.477 0.474 0.683 0.399 0.488 1.121 0.657Mongolia 0.340 0.476 0.473 0.680 0.398 0.486 1.109 0.654Benin 0.317 0.439 0.437 0.591 0.372 0.448 0.828 0.574Kenya 0.308 0.424 0.422 0.559 0.361 0.432 0.750 0.544Sierra Leone 0.299 0.411 0.409 0.532 0.351 0.418 0.692 0.519Nepal 0.299 0.410 0.408 0.532 0.351 0.418 0.691 0.519Turkmenistan 0.295 0.404 0.402 0.520 0.346 0.411 0.667 0.508Congo 0.288 0.392 0.391 0.498 0.337 0.399 0.624 0.487Senegal 0.281 0.382 0.381 0.480 0.330 0.389 0.592 0.470Vietnam 0.279 0.379 0.377 0.474 0.327 0.385 0.581 0.464Bangladesh 0.278 0.377 0.376 0.472 0.326 0.383 0.577 0.462Pakistan 0.264 0.356 0.354 0.436 0.309 0.361 0.519 0.428Azerbaijan 0.257 0.346 0.345 0.421 0.302 0.351 0.495 0.414Côte d'Ivoire 0.255 0.342 0.341 0.415 0.299 0.347 0.486 0.408Paraguay 0.253 0.340 0.339 0.411 0.297 0.345 0.480 0.404Uzbekistan 0.248 0.333 0.332 0.401 0.291 0.338 0.466 0.395Kyrgyzstan 0.248 0.333 0.332 0.401 0.291 0.338 0.465 0.394Cameroon 0.247 0.332 0.331 0.399 0.290 0.337 0.462 0.392Moldova 0.247 0.332 0.330 0.399 0.290 0.336 0.462 0.392Bolivia 0.243 0.325 0.324 0.388 0.285 0.329 0.447 0.383Ecuador 0.241 0.322 0.321 0.385 0.283 0.327 0.442 0.379Armenia 0.236 0.316 0.315 0.375 0.277 0.320 0.428 0.370Sri Lanka 0.236 0.315 0.314 0.374 0.277 0.319 0.427 0.369Jordan 0.230 0.307 0.306 0.363 0.270 0.311 0.412 0.358Albania 0.223 0.296 0.295 0.348 0.261 0.300 0.391 0.343Indonesia 0.220 0.293 0.292 0.343 0.259 0.296 0.385 0.338Jamaica 0.220 0.292 0.291 0.341 0.258 0.296 0.383 0.337Zimbabwe 0.219 0.291 0.290 0.340 0.257 0.295 0.382 0.336Guinea 0.217 0.287 0.286 0.335 0.254 0.291 0.375 0.331Syria 0.211 0.279 0.278 0.324 0.247 0.283 0.361 0.320Georgia 0.210 0.278 0.277 0.322 0.246 0.281 0.359 0.319
Middle-income countries:
Ukraine 0.200 0.265 0.264 0.305 0.235 0.268 0.336 0.301Philippines 0.194 0.255 0.254 0.293 0.227 0.258 0.321 0.289Peru 0.191 0.251 0.251 0.288 0.224 0.254 0.315 0.285Botswana 0.191 0.251 0.250 0.287 0.224 0.254 0.315 0.284Thailand 0.189 0.249 0.248 0.285 0.222 0.252 0.312 0.282Morocco 0.186 0.245 0.244 0.279 0.219 0.248 0.305 0.276Venezuela 0.185 0.244 0.243 0.278 0.218 0.246 0.303 0.275Macedonia 0.181 0.237 0.237 0.270 0.212 0.240 0.294 0.267Belize 0.181 0.237 0.236 0.270 0.212 0.240 0.294 0.267
—Continued
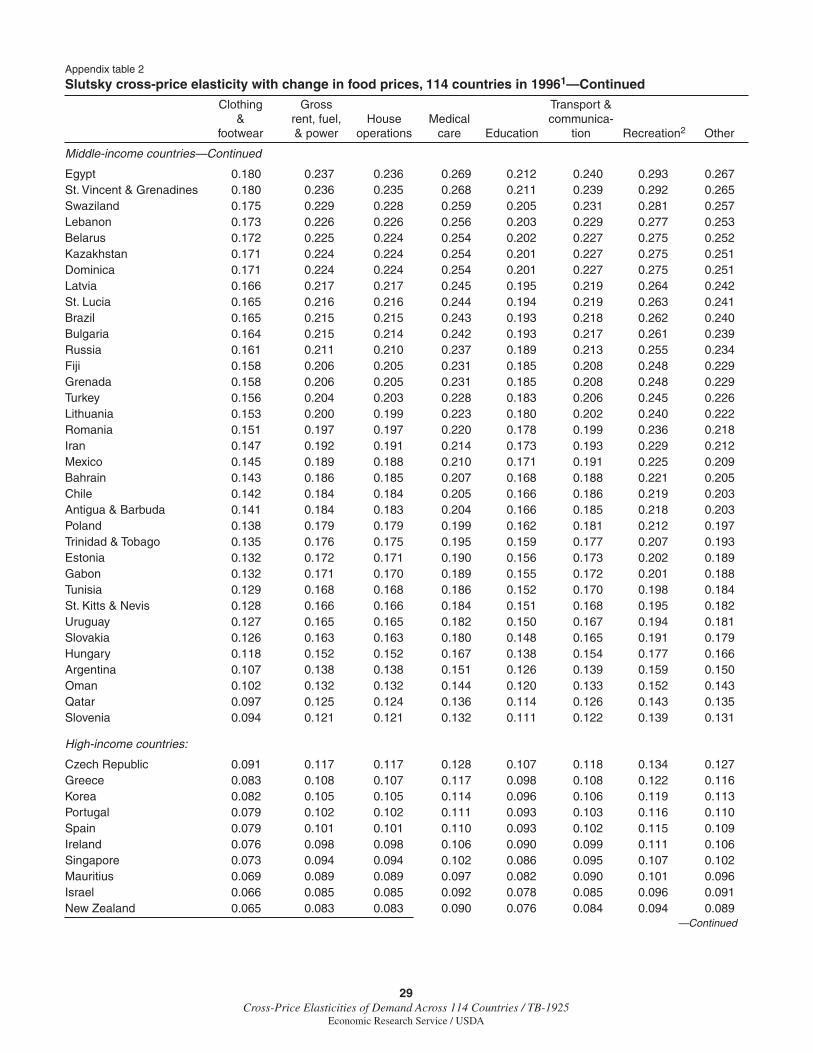
29Cross-Price Elasticities of Demand Across 114 Countries / TB-1925
Economic Research Service / USDA
Appendix table 2
Slutsky cross-price elasticity with change in food prices, 114 countries in 19961—Continued
Clothing Gross Transport & & rent, fuel, House Medical communica- footwear & power operations care Education tion Recreation2 Other
Middle-income countries—Continued
Egypt 0.180 0.237 0.236 0.269 0.212 0.240 0.293 0.267St. Vincent & Grenadines 0.180 0.236 0.235 0.268 0.211 0.239 0.292 0.265Swaziland 0.175 0.229 0.228 0.259 0.205 0.231 0.281 0.257Lebanon 0.173 0.226 0.226 0.256 0.203 0.229 0.277 0.253Belarus 0.172 0.225 0.224 0.254 0.202 0.227 0.275 0.252Kazakhstan 0.171 0.224 0.224 0.254 0.201 0.227 0.275 0.251Dominica 0.171 0.224 0.224 0.254 0.201 0.227 0.275 0.251Latvia 0.166 0.217 0.217 0.245 0.195 0.219 0.264 0.242St. Lucia 0.165 0.216 0.216 0.244 0.194 0.219 0.263 0.241Brazil 0.165 0.215 0.215 0.243 0.193 0.218 0.262 0.240Bulgaria 0.164 0.215 0.214 0.242 0.193 0.217 0.261 0.239Russia 0.161 0.211 0.210 0.237 0.189 0.213 0.255 0.234Fiji 0.158 0.206 0.205 0.231 0.185 0.208 0.248 0.229Grenada 0.158 0.206 0.205 0.231 0.185 0.208 0.248 0.229Turkey 0.156 0.204 0.203 0.228 0.183 0.206 0.245 0.226Lithuania 0.153 0.200 0.199 0.223 0.180 0.202 0.240 0.222Romania 0.151 0.197 0.197 0.220 0.178 0.199 0.236 0.218Iran 0.147 0.192 0.191 0.214 0.173 0.193 0.229 0.212Mexico 0.145 0.189 0.188 0.210 0.171 0.191 0.225 0.209Bahrain 0.143 0.186 0.185 0.207 0.168 0.188 0.221 0.205Chile 0.142 0.184 0.184 0.205 0.166 0.186 0.219 0.203Antigua & Barbuda 0.141 0.184 0.183 0.204 0.166 0.185 0.218 0.203Poland 0.138 0.179 0.179 0.199 0.162 0.181 0.212 0.197Trinidad & Tobago 0.135 0.176 0.175 0.195 0.159 0.177 0.207 0.193Estonia 0.132 0.172 0.171 0.190 0.156 0.173 0.202 0.189Gabon 0.132 0.171 0.170 0.189 0.155 0.172 0.201 0.188Tunisia 0.129 0.168 0.168 0.186 0.152 0.170 0.198 0.184St. Kitts & Nevis 0.128 0.166 0.166 0.184 0.151 0.168 0.195 0.182Uruguay 0.127 0.165 0.165 0.182 0.150 0.167 0.194 0.181Slovakia 0.126 0.163 0.163 0.180 0.148 0.165 0.191 0.179Hungary 0.118 0.152 0.152 0.167 0.138 0.154 0.177 0.166Argentina 0.107 0.138 0.138 0.151 0.126 0.139 0.159 0.150Oman 0.102 0.132 0.132 0.144 0.120 0.133 0.152 0.143Qatar 0.097 0.125 0.124 0.136 0.114 0.126 0.143 0.135Slovenia 0.094 0.121 0.121 0.132 0.111 0.122 0.139 0.131
High-income countries:
Czech Republic 0.091 0.117 0.117 0.128 0.107 0.118 0.134 0.127Greece 0.083 0.108 0.107 0.117 0.098 0.108 0.122 0.116Korea 0.082 0.105 0.105 0.114 0.096 0.106 0.119 0.113Portugal 0.079 0.102 0.102 0.111 0.093 0.103 0.116 0.110Spain 0.079 0.101 0.101 0.110 0.093 0.102 0.115 0.109Ireland 0.076 0.098 0.098 0.106 0.090 0.099 0.111 0.106Singapore 0.073 0.094 0.094 0.102 0.086 0.095 0.107 0.102Mauritius 0.069 0.089 0.089 0.097 0.082 0.090 0.101 0.096Israel 0.066 0.085 0.085 0.092 0.078 0.085 0.096 0.091New Zealand 0.065 0.083 0.083 0.090 0.076 0.084 0.094 0.089
—Continued

30Cross-Price Elasticities of Demand Across 114 Countries / TB-1925
Economic Research Service / USDA
Appendix table 2
Slutsky cross-price elasticity with change in food prices, 114 countries in 19961—Continued
Clothing Gross Transport & & rent, fuel, House Medical communica- footwear & power operations care Education tion Recreation2 Other
High-income countries—Continued
Finland 0.064 0.083 0.082 0.089 0.076 0.083 0.093 0.089Bahamas 0.063 0.081 0.081 0.088 0.075 0.082 0.091 0.087Sweden 0.056 0.072 0.072 0.077 0.066 0.072 0.081 0.077Netherlands 0.055 0.070 0.070 0.076 0.065 0.071 0.079 0.075France 0.049 0.063 0.063 0.068 0.058 0.064 0.071 0.068United Kingdom 0.049 0.063 0.063 0.067 0.058 0.063 0.070 0.067Belgium 0.048 0.061 0.061 0.066 0.056 0.062 0.068 0.065Norway 0.047 0.061 0.061 0.065 0.056 0.061 0.068 0.065Italy 0.047 0.060 0.060 0.064 0.055 0.060 0.067 0.064Austria 0.045 0.057 0.057 0.061 0.053 0.058 0.064 0.061Germany 0.044 0.057 0.057 0.061 0.052 0.057 0.063 0.061Australia 0.042 0.054 0.054 0.058 0.050 0.055 0.061 0.058Japan 0.041 0.053 0.053 0.056 0.049 0.053 0.059 0.056Canada 0.039 0.050 0.050 0.054 0.046 0.051 0.056 0.054Bermuda 0.036 0.046 0.046 0.049 0.042 0.046 0.051 0.049Switzerland 0.034 0.044 0.044 0.047 0.041 0.044 0.049 0.047Barbados 0.034 0.044 0.043 0.047 0.040 0.044 0.048 0.046Hong Kong 0.034 0.043 0.043 0.046 0.040 0.043 0.048 0.046Iceland 0.033 0.043 0.043 0.046 0.039 0.043 0.047 0.045Denmark 0.032 0.042 0.041 0.044 0.038 0.042 0.046 0.044Luxembourg 0.014 0.018 0.018 0.019 0.017 0.018 0.020 0.019United States 0.011 0.015 0.014 0.015 0.013 0.015 0.016 0.015
Low-income average 0.278 0.381 0.379 0.509 0.327 0.388 0.708 0.493Middle-income average 0.154 0.202 0.201 0.227 0.182 0.204 0.245 0.225High-income average 0.053 0.068 0.067 0.073 0.062 0.068 0.076 0.0721Countries are reported based on ascending per capita real income levels.2As the estimated budget share was negative for Tanzania we do not report the elasticity for this country.
Source: Authors' calculation using the 1996 ICP data.

31Cross-Price Elasticities of Demand Across 114 Countries / TB-1925
Economic Research Service / USDA
Appendix table 3
Cournot cross-price elasticity with change in food prices, 114 countries in 19961
Clothing Gross Transport & & rent, fuel, House Medical communica- footwear & power operations care Education tion Recreation2 Other
Low-income countries:
Tanzania -0.222 -0.328 -0.325 -0.706 -0.261 -0.339 -0.626Nigeria -0.214 -0.306 -0.304 -0.499 -0.251 -0.314 -1.506 -0.469Tajikistan -0.210 -0.297 -0.295 -0.449 -0.246 -0.304 -0.898 -0.428Zambia -0.209 -0.295 -0.293 -0.442 -0.245 -0.302 -0.845 -0.422Yemen -0.209 -0.295 -0.293 -0.442 -0.245 -0.302 -0.841 -0.422Malawi -0.207 -0.290 -0.288 -0.419 -0.242 -0.297 -0.708 -0.403Madagascar -0.206 -0.290 -0.288 -0.419 -0.242 -0.296 -0.706 -0.402Mali -0.206 -0.289 -0.287 -0.413 -0.241 -0.295 -0.678 -0.397Mongolia -0.206 -0.288 -0.287 -0.412 -0.241 -0.295 -0.672 -0.396Benin -0.200 -0.277 -0.276 -0.373 -0.235 -0.283 -0.522 -0.362Kenya -0.198 -0.273 -0.271 -0.359 -0.232 -0.278 -0.482 -0.350Sierra Leone -0.196 -0.269 -0.267 -0.348 -0.230 -0.274 -0.453 -0.340Nepal -0.196 -0.269 -0.267 -0.348 -0.230 -0.273 -0.452 -0.339Turkmenistan -0.195 -0.267 -0.265 -0.343 -0.229 -0.271 -0.440 -0.335Congo -0.193 -0.263 -0.262 -0.334 -0.226 -0.268 -0.419 -0.327Senegal -0.191 -0.260 -0.259 -0.327 -0.224 -0.265 -0.403 -0.320Vietnam -0.191 -0.259 -0.258 -0.324 -0.224 -0.263 -0.398 -0.318Bangladesh -0.191 -0.259 -0.258 -0.323 -0.224 -0.263 -0.396 -0.317Pakistan -0.187 -0.253 -0.252 -0.309 -0.219 -0.256 -0.368 -0.304Azerbaijan -0.186 -0.250 -0.249 -0.304 -0.218 -0.254 -0.357 -0.298Côte d'Ivoire -0.185 -0.249 -0.248 -0.301 -0.217 -0.252 -0.353 -0.296Paraguay -0.184 -0.248 -0.247 -0.300 -0.216 -0.252 -0.350 -0.295Uzbekistan -0.183 -0.246 -0.245 -0.296 -0.215 -0.250 -0.344 -0.291Kyrgyzstan -0.183 -0.246 -0.245 -0.296 -0.215 -0.250 -0.343 -0.291Cameroon -0.183 -0.246 -0.245 -0.295 -0.215 -0.249 -0.342 -0.291Moldova -0.183 -0.246 -0.245 -0.295 -0.215 -0.249 -0.342 -0.291Bolivia -0.182 -0.244 -0.243 -0.291 -0.214 -0.247 -0.336 -0.287Ecuador -0.182 -0.243 -0.242 -0.290 -0.213 -0.246 -0.333 -0.286Armenia -0.180 -0.241 -0.240 -0.286 -0.212 -0.244 -0.327 -0.282Sri Lanka -0.180 -0.241 -0.240 -0.286 -0.212 -0.244 -0.327 -0.282Jordan -0.179 -0.239 -0.238 -0.282 -0.210 -0.242 -0.320 -0.278Albania -0.177 -0.236 -0.235 -0.276 -0.208 -0.239 -0.311 -0.273Indonesia -0.176 -0.235 -0.234 -0.275 -0.207 -0.238 -0.308 -0.271Jamaica -0.176 -0.234 -0.234 -0.274 -0.207 -0.237 -0.308 -0.271Zimbabwe -0.176 -0.234 -0.233 -0.274 -0.207 -0.237 -0.307 -0.270Guinea -0.176 -0.233 -0.232 -0.272 -0.206 -0.236 -0.304 -0.268Syria -0.174 -0.231 -0.230 -0.268 -0.204 -0.234 -0.298 -0.265Georgia -0.174 -0.230 -0.230 -0.267 -0.204 -0.233 -0.297 -0.264
Middle-income countries:Ukraine -0.172 -0.227 -0.226 -0.261 -0.201 -0.229 -0.288 -0.258Philippines -0.170 -0.224 -0.223 -0.257 -0.200 -0.227 -0.282 -0.254Peru -0.169 -0.223 -0.222 -0.255 -0.199 -0.226 -0.280 -0.252Botswana -0.169 -0.223 -0.222 -0.255 -0.199 -0.225 -0.279 -0.252Thailand -0.169 -0.222 -0.222 -0.254 -0.198 -0.225 -0.278 -0.251Morocco -0.168 -0.221 -0.221 -0.252 -0.197 -0.224 -0.276 -0.250Venezuela -0.168 -0.221 -0.220 -0.252 -0.197 -0.223 -0.275 -0.249Macedonia -0.167 -0.219 -0.218 -0.249 -0.196 -0.222 -0.271 -0.247Belize -0.167 -0.219 -0.218 -0.249 -0.196 -0.221 -0.271 -0.246
—Continued
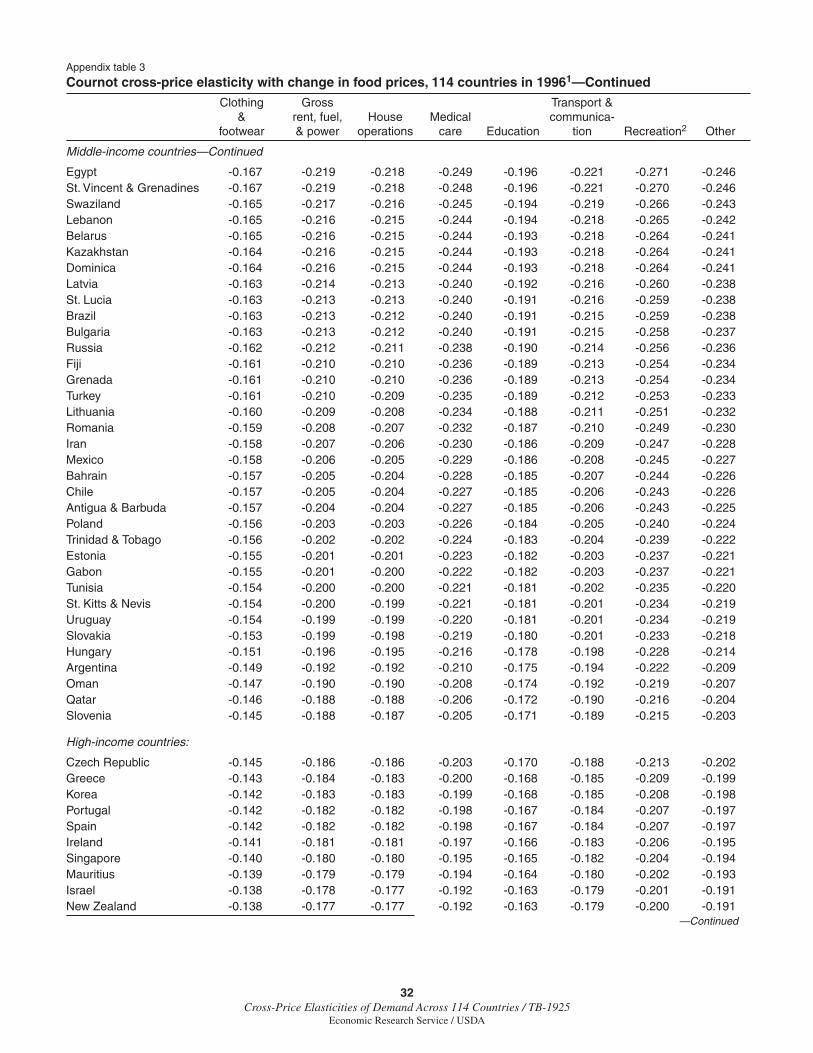
32Cross-Price Elasticities of Demand Across 114 Countries / TB-1925
Economic Research Service / USDA
Appendix table 3
Cournot cross-price elasticity with change in food prices, 114 countries in 19961—Continued
Clothing Gross Transport & & rent, fuel, House Medical communica- footwear & power operations care Education tion Recreation2 Other
Middle-income countries—Continued
Egypt -0.167 -0.219 -0.218 -0.249 -0.196 -0.221 -0.271 -0.246St. Vincent & Grenadines -0.167 -0.219 -0.218 -0.248 -0.196 -0.221 -0.270 -0.246Swaziland -0.165 -0.217 -0.216 -0.245 -0.194 -0.219 -0.266 -0.243Lebanon -0.165 -0.216 -0.215 -0.244 -0.194 -0.218 -0.265 -0.242Belarus -0.165 -0.216 -0.215 -0.244 -0.193 -0.218 -0.264 -0.241Kazakhstan -0.164 -0.216 -0.215 -0.244 -0.193 -0.218 -0.264 -0.241Dominica -0.164 -0.216 -0.215 -0.244 -0.193 -0.218 -0.264 -0.241Latvia -0.163 -0.214 -0.213 -0.240 -0.192 -0.216 -0.260 -0.238St. Lucia -0.163 -0.213 -0.213 -0.240 -0.191 -0.216 -0.259 -0.238Brazil -0.163 -0.213 -0.212 -0.240 -0.191 -0.215 -0.259 -0.238Bulgaria -0.163 -0.213 -0.212 -0.240 -0.191 -0.215 -0.258 -0.237Russia -0.162 -0.212 -0.211 -0.238 -0.190 -0.214 -0.256 -0.236Fiji -0.161 -0.210 -0.210 -0.236 -0.189 -0.213 -0.254 -0.234Grenada -0.161 -0.210 -0.210 -0.236 -0.189 -0.213 -0.254 -0.234Turkey -0.161 -0.210 -0.209 -0.235 -0.189 -0.212 -0.253 -0.233Lithuania -0.160 -0.209 -0.208 -0.234 -0.188 -0.211 -0.251 -0.232Romania -0.159 -0.208 -0.207 -0.232 -0.187 -0.210 -0.249 -0.230Iran -0.158 -0.207 -0.206 -0.230 -0.186 -0.209 -0.247 -0.228Mexico -0.158 -0.206 -0.205 -0.229 -0.186 -0.208 -0.245 -0.227Bahrain -0.157 -0.205 -0.204 -0.228 -0.185 -0.207 -0.244 -0.226Chile -0.157 -0.205 -0.204 -0.227 -0.185 -0.206 -0.243 -0.226Antigua & Barbuda -0.157 -0.204 -0.204 -0.227 -0.185 -0.206 -0.243 -0.225Poland -0.156 -0.203 -0.203 -0.226 -0.184 -0.205 -0.240 -0.224Trinidad & Tobago -0.156 -0.202 -0.202 -0.224 -0.183 -0.204 -0.239 -0.222Estonia -0.155 -0.201 -0.201 -0.223 -0.182 -0.203 -0.237 -0.221Gabon -0.155 -0.201 -0.200 -0.222 -0.182 -0.203 -0.237 -0.221Tunisia -0.154 -0.200 -0.200 -0.221 -0.181 -0.202 -0.235 -0.220St. Kitts & Nevis -0.154 -0.200 -0.199 -0.221 -0.181 -0.201 -0.234 -0.219Uruguay -0.154 -0.199 -0.199 -0.220 -0.181 -0.201 -0.234 -0.219Slovakia -0.153 -0.199 -0.198 -0.219 -0.180 -0.201 -0.233 -0.218Hungary -0.151 -0.196 -0.195 -0.216 -0.178 -0.198 -0.228 -0.214Argentina -0.149 -0.192 -0.192 -0.210 -0.175 -0.194 -0.222 -0.209Oman -0.147 -0.190 -0.190 -0.208 -0.174 -0.192 -0.219 -0.207Qatar -0.146 -0.188 -0.188 -0.206 -0.172 -0.190 -0.216 -0.204Slovenia -0.145 -0.188 -0.187 -0.205 -0.171 -0.189 -0.215 -0.203
High-income countries:
Czech Republic -0.145 -0.186 -0.186 -0.203 -0.170 -0.188 -0.213 -0.202Greece -0.143 -0.184 -0.183 -0.200 -0.168 -0.185 -0.209 -0.199Korea -0.142 -0.183 -0.183 -0.199 -0.168 -0.185 -0.208 -0.198Portugal -0.142 -0.182 -0.182 -0.198 -0.167 -0.184 -0.207 -0.197Spain -0.142 -0.182 -0.182 -0.198 -0.167 -0.184 -0.207 -0.197Ireland -0.141 -0.181 -0.181 -0.197 -0.166 -0.183 -0.206 -0.195Singapore -0.140 -0.180 -0.180 -0.195 -0.165 -0.182 -0.204 -0.194Mauritius -0.139 -0.179 -0.179 -0.194 -0.164 -0.180 -0.202 -0.193Israel -0.138 -0.178 -0.177 -0.192 -0.163 -0.179 -0.201 -0.191New Zealand -0.138 -0.177 -0.177 -0.192 -0.163 -0.179 -0.200 -0.191
—Continued
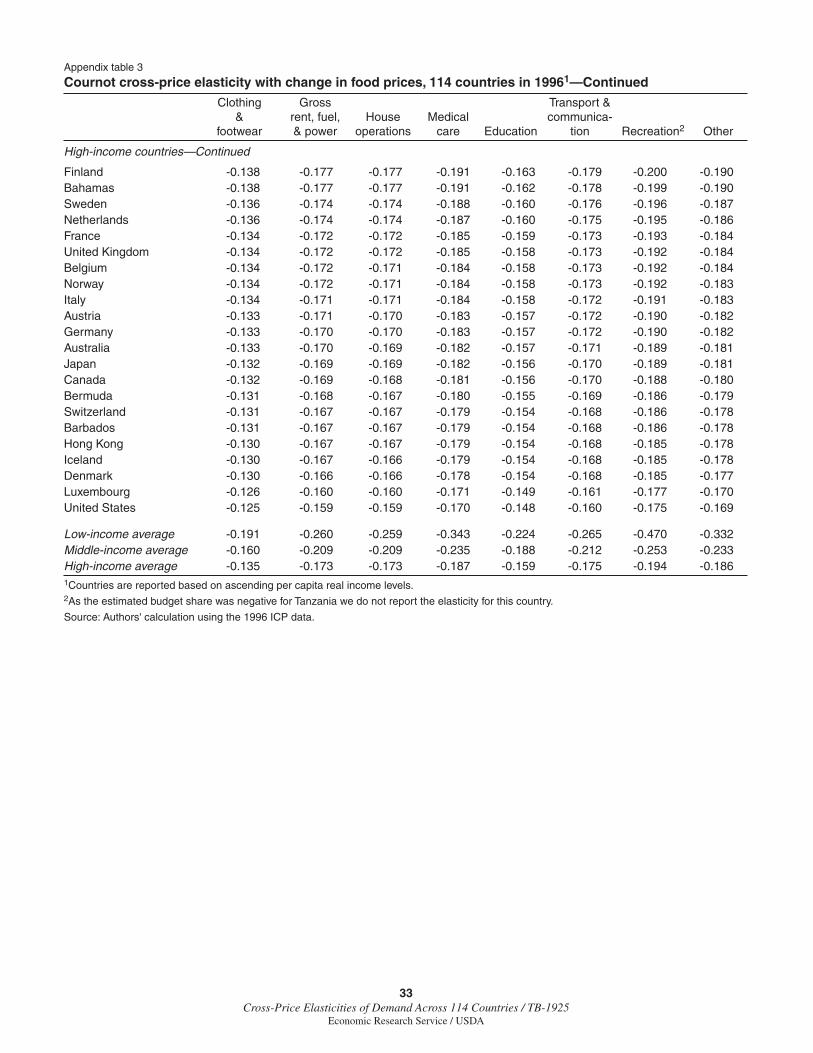
33Cross-Price Elasticities of Demand Across 114 Countries / TB-1925
Economic Research Service / USDA
Appendix table 3
Cournot cross-price elasticity with change in food prices, 114 countries in 19961—Continued
Clothing Gross Transport & & rent, fuel, House Medical communica- footwear & power operations care Education tion Recreation2 Other
High-income countries—Continued
Finland -0.138 -0.177 -0.177 -0.191 -0.163 -0.179 -0.200 -0.190Bahamas -0.138 -0.177 -0.177 -0.191 -0.162 -0.178 -0.199 -0.190Sweden -0.136 -0.174 -0.174 -0.188 -0.160 -0.176 -0.196 -0.187Netherlands -0.136 -0.174 -0.174 -0.187 -0.160 -0.175 -0.195 -0.186France -0.134 -0.172 -0.172 -0.185 -0.159 -0.173 -0.193 -0.184United Kingdom -0.134 -0.172 -0.172 -0.185 -0.158 -0.173 -0.192 -0.184Belgium -0.134 -0.172 -0.171 -0.184 -0.158 -0.173 -0.192 -0.184Norway -0.134 -0.172 -0.171 -0.184 -0.158 -0.173 -0.192 -0.183Italy -0.134 -0.171 -0.171 -0.184 -0.158 -0.172 -0.191 -0.183Austria -0.133 -0.171 -0.170 -0.183 -0.157 -0.172 -0.190 -0.182Germany -0.133 -0.170 -0.170 -0.183 -0.157 -0.172 -0.190 -0.182Australia -0.133 -0.170 -0.169 -0.182 -0.157 -0.171 -0.189 -0.181Japan -0.132 -0.169 -0.169 -0.182 -0.156 -0.170 -0.189 -0.181Canada -0.132 -0.169 -0.168 -0.181 -0.156 -0.170 -0.188 -0.180Bermuda -0.131 -0.168 -0.167 -0.180 -0.155 -0.169 -0.186 -0.179Switzerland -0.131 -0.167 -0.167 -0.179 -0.154 -0.168 -0.186 -0.178Barbados -0.131 -0.167 -0.167 -0.179 -0.154 -0.168 -0.186 -0.178Hong Kong -0.130 -0.167 -0.167 -0.179 -0.154 -0.168 -0.185 -0.178Iceland -0.130 -0.167 -0.166 -0.179 -0.154 -0.168 -0.185 -0.178Denmark -0.130 -0.166 -0.166 -0.178 -0.154 -0.168 -0.185 -0.177Luxembourg -0.126 -0.160 -0.160 -0.171 -0.149 -0.161 -0.177 -0.170United States -0.125 -0.159 -0.159 -0.170 -0.148 -0.160 -0.175 -0.169
Low-income average -0.191 -0.260 -0.259 -0.343 -0.224 -0.265 -0.470 -0.332Middle-income average -0.160 -0.209 -0.209 -0.235 -0.188 -0.212 -0.253 -0.233High-income average -0.135 -0.173 -0.173 -0.187 -0.159 -0.175 -0.194 -0.1861Countries are reported based on ascending per capita real income levels.2As the estimated budget share was negative for Tanzania we do not report the elasticity for this country.
Source: Authors' calculation using the 1996 ICP data.
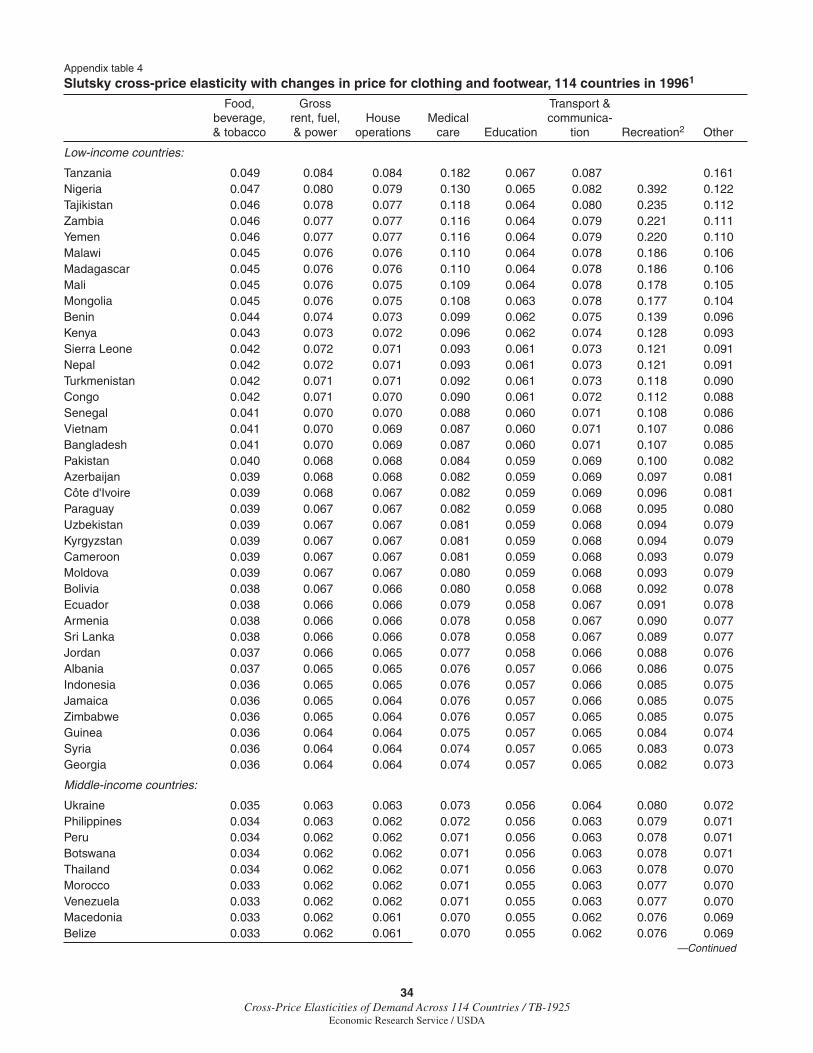
34Cross-Price Elasticities of Demand Across 114 Countries / TB-1925
Economic Research Service / USDA
Appendix table 4
Slutsky cross-price elasticity with changes in price for clothing and footwear, 114 countries in 19961
Food, Gross Transport & beverage, rent, fuel, House Medical communica- & tobacco & power operations care Education tion Recreation2 Other
Low-income countries:
Tanzania 0.049 0.084 0.084 0.182 0.067 0.087 0.161Nigeria 0.047 0.080 0.079 0.130 0.065 0.082 0.392 0.122Tajikistan 0.046 0.078 0.077 0.118 0.064 0.080 0.235 0.112Zambia 0.046 0.077 0.077 0.116 0.064 0.079 0.221 0.111Yemen 0.046 0.077 0.077 0.116 0.064 0.079 0.220 0.110Malawi 0.045 0.076 0.076 0.110 0.064 0.078 0.186 0.106Madagascar 0.045 0.076 0.076 0.110 0.064 0.078 0.186 0.106Mali 0.045 0.076 0.075 0.109 0.064 0.078 0.178 0.105Mongolia 0.045 0.076 0.075 0.108 0.063 0.078 0.177 0.104Benin 0.044 0.074 0.073 0.099 0.062 0.075 0.139 0.096Kenya 0.043 0.073 0.072 0.096 0.062 0.074 0.128 0.093Sierra Leone 0.042 0.072 0.071 0.093 0.061 0.073 0.121 0.091Nepal 0.042 0.072 0.071 0.093 0.061 0.073 0.121 0.091Turkmenistan 0.042 0.071 0.071 0.092 0.061 0.073 0.118 0.090Congo 0.042 0.071 0.070 0.090 0.061 0.072 0.112 0.088Senegal 0.041 0.070 0.070 0.088 0.060 0.071 0.108 0.086Vietnam 0.041 0.070 0.069 0.087 0.060 0.071 0.107 0.086Bangladesh 0.041 0.070 0.069 0.087 0.060 0.071 0.107 0.085Pakistan 0.040 0.068 0.068 0.084 0.059 0.069 0.100 0.082Azerbaijan 0.039 0.068 0.068 0.082 0.059 0.069 0.097 0.081Côte d'Ivoire 0.039 0.068 0.067 0.082 0.059 0.069 0.096 0.081Paraguay 0.039 0.067 0.067 0.082 0.059 0.068 0.095 0.080Uzbekistan 0.039 0.067 0.067 0.081 0.059 0.068 0.094 0.079Kyrgyzstan 0.039 0.067 0.067 0.081 0.059 0.068 0.094 0.079Cameroon 0.039 0.067 0.067 0.081 0.059 0.068 0.093 0.079Moldova 0.039 0.067 0.067 0.080 0.059 0.068 0.093 0.079Bolivia 0.038 0.067 0.066 0.080 0.058 0.068 0.092 0.078Ecuador 0.038 0.066 0.066 0.079 0.058 0.067 0.091 0.078Armenia 0.038 0.066 0.066 0.078 0.058 0.067 0.090 0.077Sri Lanka 0.038 0.066 0.066 0.078 0.058 0.067 0.089 0.077Jordan 0.037 0.066 0.065 0.077 0.058 0.066 0.088 0.076Albania 0.037 0.065 0.065 0.076 0.057 0.066 0.086 0.075Indonesia 0.036 0.065 0.065 0.076 0.057 0.066 0.085 0.075Jamaica 0.036 0.065 0.064 0.076 0.057 0.066 0.085 0.075Zimbabwe 0.036 0.065 0.064 0.076 0.057 0.065 0.085 0.075Guinea 0.036 0.064 0.064 0.075 0.057 0.065 0.084 0.074Syria 0.036 0.064 0.064 0.074 0.057 0.065 0.083 0.073Georgia 0.036 0.064 0.064 0.074 0.057 0.065 0.082 0.073
Middle-income countries:
Ukraine 0.035 0.063 0.063 0.073 0.056 0.064 0.080 0.072Philippines 0.034 0.063 0.062 0.072 0.056 0.063 0.079 0.071Peru 0.034 0.062 0.062 0.071 0.056 0.063 0.078 0.071Botswana 0.034 0.062 0.062 0.071 0.056 0.063 0.078 0.071Thailand 0.034 0.062 0.062 0.071 0.056 0.063 0.078 0.070Morocco 0.033 0.062 0.062 0.071 0.055 0.063 0.077 0.070Venezuela 0.033 0.062 0.062 0.071 0.055 0.063 0.077 0.070Macedonia 0.033 0.062 0.061 0.070 0.055 0.062 0.076 0.069Belize 0.033 0.062 0.061 0.070 0.055 0.062 0.076 0.069
—Continued
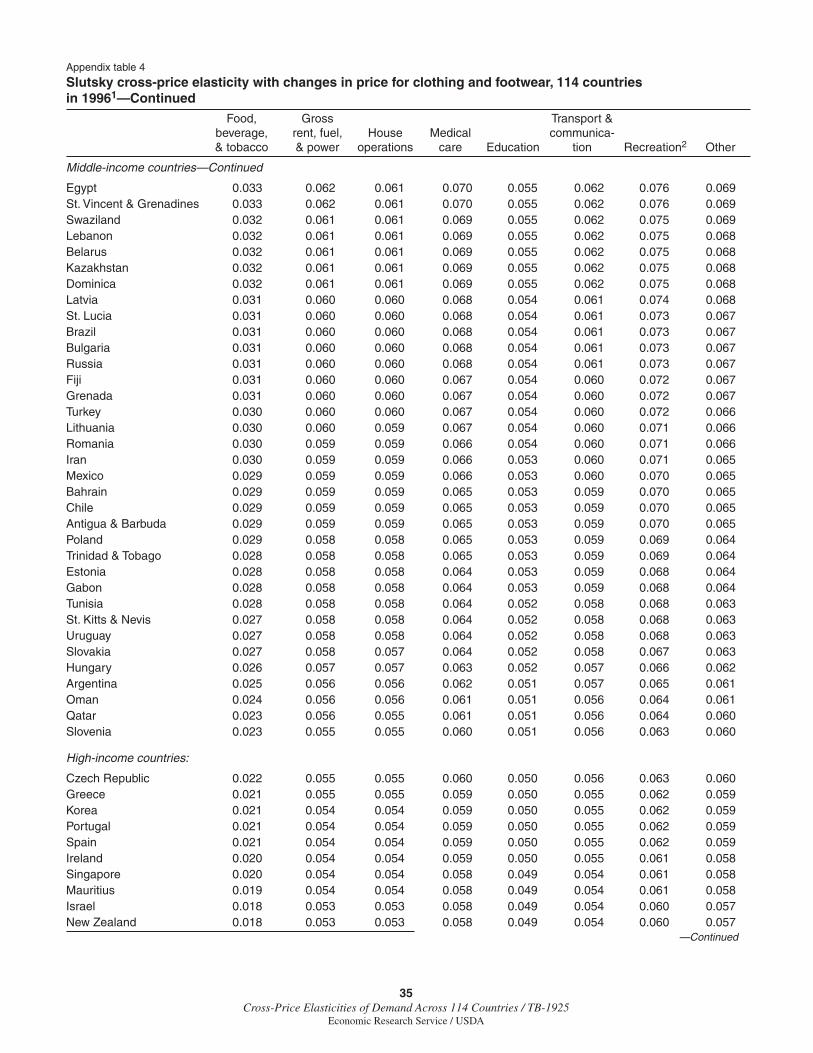
35Cross-Price Elasticities of Demand Across 114 Countries / TB-1925
Economic Research Service / USDA
Appendix table 4
Slutsky cross-price elasticity with changes in price for clothing and footwear, 114 countries in 19961—Continued
Food, Gross Transport & beverage, rent, fuel, House Medical communica- & tobacco & power operations care Education tion Recreation2 Other
Middle-income countries—Continued
Egypt 0.033 0.062 0.061 0.070 0.055 0.062 0.076 0.069St. Vincent & Grenadines 0.033 0.062 0.061 0.070 0.055 0.062 0.076 0.069Swaziland 0.032 0.061 0.061 0.069 0.055 0.062 0.075 0.069Lebanon 0.032 0.061 0.061 0.069 0.055 0.062 0.075 0.068Belarus 0.032 0.061 0.061 0.069 0.055 0.062 0.075 0.068Kazakhstan 0.032 0.061 0.061 0.069 0.055 0.062 0.075 0.068Dominica 0.032 0.061 0.061 0.069 0.055 0.062 0.075 0.068Latvia 0.031 0.060 0.060 0.068 0.054 0.061 0.074 0.068St. Lucia 0.031 0.060 0.060 0.068 0.054 0.061 0.073 0.067Brazil 0.031 0.060 0.060 0.068 0.054 0.061 0.073 0.067Bulgaria 0.031 0.060 0.060 0.068 0.054 0.061 0.073 0.067Russia 0.031 0.060 0.060 0.068 0.054 0.061 0.073 0.067Fiji 0.031 0.060 0.060 0.067 0.054 0.060 0.072 0.067Grenada 0.031 0.060 0.060 0.067 0.054 0.060 0.072 0.067Turkey 0.030 0.060 0.060 0.067 0.054 0.060 0.072 0.066Lithuania 0.030 0.060 0.059 0.067 0.054 0.060 0.071 0.066Romania 0.030 0.059 0.059 0.066 0.054 0.060 0.071 0.066Iran 0.030 0.059 0.059 0.066 0.053 0.060 0.071 0.065Mexico 0.029 0.059 0.059 0.066 0.053 0.060 0.070 0.065Bahrain 0.029 0.059 0.059 0.065 0.053 0.059 0.070 0.065Chile 0.029 0.059 0.059 0.065 0.053 0.059 0.070 0.065Antigua & Barbuda 0.029 0.059 0.059 0.065 0.053 0.059 0.070 0.065Poland 0.029 0.058 0.058 0.065 0.053 0.059 0.069 0.064Trinidad & Tobago 0.028 0.058 0.058 0.065 0.053 0.059 0.069 0.064Estonia 0.028 0.058 0.058 0.064 0.053 0.059 0.068 0.064Gabon 0.028 0.058 0.058 0.064 0.053 0.059 0.068 0.064Tunisia 0.028 0.058 0.058 0.064 0.052 0.058 0.068 0.063St. Kitts & Nevis 0.027 0.058 0.058 0.064 0.052 0.058 0.068 0.063Uruguay 0.027 0.058 0.058 0.064 0.052 0.058 0.068 0.063Slovakia 0.027 0.058 0.057 0.064 0.052 0.058 0.067 0.063Hungary 0.026 0.057 0.057 0.063 0.052 0.057 0.066 0.062Argentina 0.025 0.056 0.056 0.062 0.051 0.057 0.065 0.061Oman 0.024 0.056 0.056 0.061 0.051 0.056 0.064 0.061Qatar 0.023 0.056 0.055 0.061 0.051 0.056 0.064 0.060Slovenia 0.023 0.055 0.055 0.060 0.051 0.056 0.063 0.060
High-income countries:
Czech Republic 0.022 0.055 0.055 0.060 0.050 0.056 0.063 0.060Greece 0.021 0.055 0.055 0.059 0.050 0.055 0.062 0.059Korea 0.021 0.054 0.054 0.059 0.050 0.055 0.062 0.059Portugal 0.021 0.054 0.054 0.059 0.050 0.055 0.062 0.059Spain 0.021 0.054 0.054 0.059 0.050 0.055 0.062 0.059Ireland 0.020 0.054 0.054 0.059 0.050 0.055 0.061 0.058Singapore 0.020 0.054 0.054 0.058 0.049 0.054 0.061 0.058Mauritius 0.019 0.054 0.054 0.058 0.049 0.054 0.061 0.058Israel 0.018 0.053 0.053 0.058 0.049 0.054 0.060 0.057New Zealand 0.018 0.053 0.053 0.058 0.049 0.054 0.060 0.057
—Continued

36Cross-Price Elasticities of Demand Across 114 Countries / TB-1925
Economic Research Service / USDA
Appendix table 4
Slutsky cross-price elasticity with changes in price for clothing and footwear, 114 countries in 19961—Continued
Food, Gross Transport & beverage, rent, fuel, House Medical communica- & tobacco & power operations care Education tion Recreation2 Other
High-income countries—Continued
Finland 0.018 0.053 0.053 0.058 0.049 0.054 0.060 0.057Bahamas 0.018 0.053 0.053 0.058 0.049 0.054 0.060 0.057Sweden 0.016 0.053 0.053 0.057 0.049 0.053 0.059 0.057Netherlands 0.016 0.053 0.053 0.057 0.048 0.053 0.059 0.056France 0.015 0.052 0.052 0.056 0.048 0.053 0.059 0.056United Kingdom 0.015 0.052 0.052 0.056 0.048 0.053 0.059 0.056Belgium 0.015 0.052 0.052 0.056 0.048 0.053 0.058 0.056Norway 0.015 0.052 0.052 0.056 0.048 0.053 0.058 0.056Italy 0.014 0.052 0.052 0.056 0.048 0.053 0.058 0.056Austria 0.014 0.052 0.052 0.056 0.048 0.052 0.058 0.056Germany 0.014 0.052 0.052 0.056 0.048 0.052 0.058 0.056Australia 0.013 0.052 0.052 0.056 0.048 0.052 0.058 0.055Japan 0.013 0.052 0.052 0.056 0.048 0.052 0.058 0.055Canada 0.013 0.052 0.052 0.055 0.048 0.052 0.058 0.055Bermuda 0.012 0.051 0.051 0.055 0.047 0.052 0.057 0.055Switzerland 0.011 0.051 0.051 0.055 0.047 0.052 0.057 0.055Barbados 0.011 0.051 0.051 0.055 0.047 0.052 0.057 0.055Hong Kong 0.011 0.051 0.051 0.055 0.047 0.052 0.057 0.055Iceland 0.011 0.051 0.051 0.055 0.047 0.052 0.057 0.055Denmark 0.011 0.051 0.051 0.055 0.047 0.052 0.057 0.055Luxembourg 0.005 0.050 0.050 0.053 0.046 0.050 0.055 0.053United States 0.004 0.050 0.050 0.053 0.046 0.050 0.055 0.053
Low-income average 0.041 0.070 0.070 0.092 0.060 0.071 0.126 0.089Middle-income average 0.030 0.060 0.060 0.067 0.054 0.060 0.072 0.066High-income average 0.015 0.053 0.052 0.057 0.048 0.053 0.059 0.0561Countries are reported based on ascending per capita real income levels.2As the estimated budget share was negative for Tanzania we do not report the elasticity for this country.
Source: Authors' calculation using the 1996 ICP data.
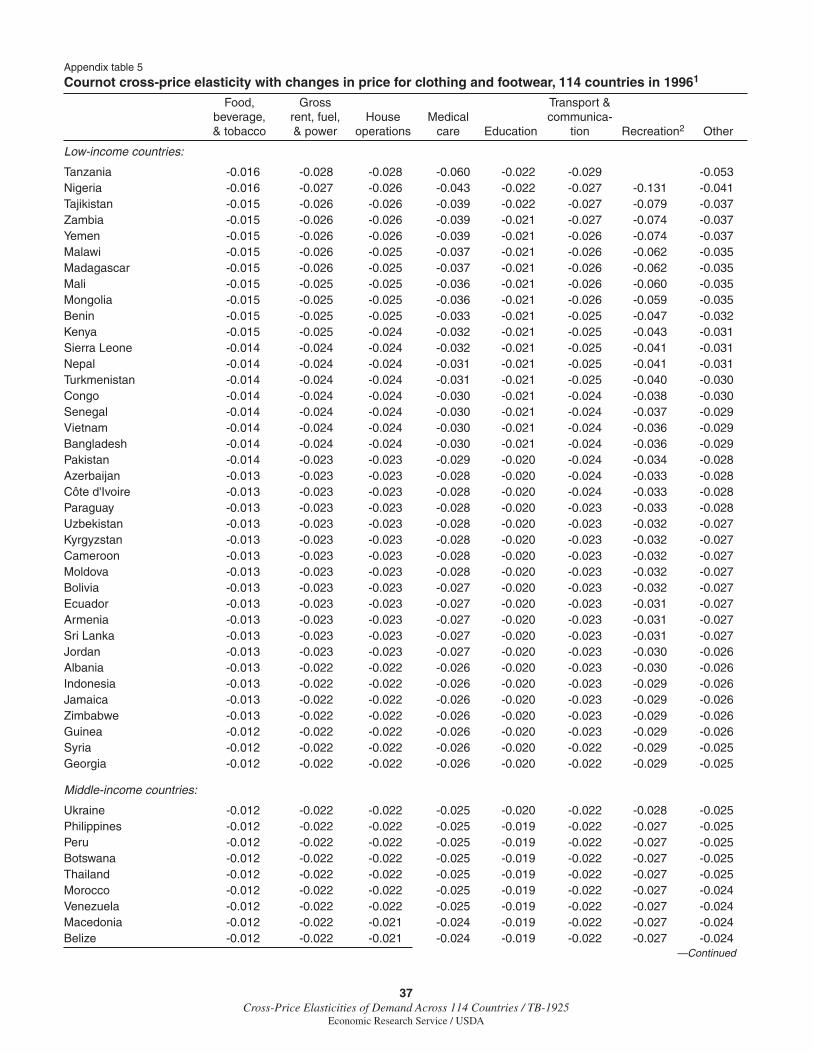
37Cross-Price Elasticities of Demand Across 114 Countries / TB-1925
Economic Research Service / USDA
Appendix table 5
Cournot cross-price elasticity with changes in price for clothing and footwear, 114 countries in 19961
Food, Gross Transport & beverage, rent, fuel, House Medical communica- & tobacco & power operations care Education tion Recreation2 Other
Low-income countries:
Tanzania -0.016 -0.028 -0.028 -0.060 -0.022 -0.029 -0.053Nigeria -0.016 -0.027 -0.026 -0.043 -0.022 -0.027 -0.131 -0.041Tajikistan -0.015 -0.026 -0.026 -0.039 -0.022 -0.027 -0.079 -0.037Zambia -0.015 -0.026 -0.026 -0.039 -0.021 -0.027 -0.074 -0.037Yemen -0.015 -0.026 -0.026 -0.039 -0.021 -0.026 -0.074 -0.037Malawi -0.015 -0.026 -0.025 -0.037 -0.021 -0.026 -0.062 -0.035Madagascar -0.015 -0.026 -0.025 -0.037 -0.021 -0.026 -0.062 -0.035Mali -0.015 -0.025 -0.025 -0.036 -0.021 -0.026 -0.060 -0.035Mongolia -0.015 -0.025 -0.025 -0.036 -0.021 -0.026 -0.059 -0.035Benin -0.015 -0.025 -0.025 -0.033 -0.021 -0.025 -0.047 -0.032Kenya -0.015 -0.025 -0.024 -0.032 -0.021 -0.025 -0.043 -0.031Sierra Leone -0.014 -0.024 -0.024 -0.032 -0.021 -0.025 -0.041 -0.031Nepal -0.014 -0.024 -0.024 -0.031 -0.021 -0.025 -0.041 -0.031Turkmenistan -0.014 -0.024 -0.024 -0.031 -0.021 -0.025 -0.040 -0.030Congo -0.014 -0.024 -0.024 -0.030 -0.021 -0.024 -0.038 -0.030Senegal -0.014 -0.024 -0.024 -0.030 -0.021 -0.024 -0.037 -0.029Vietnam -0.014 -0.024 -0.024 -0.030 -0.021 -0.024 -0.036 -0.029Bangladesh -0.014 -0.024 -0.024 -0.030 -0.021 -0.024 -0.036 -0.029Pakistan -0.014 -0.023 -0.023 -0.029 -0.020 -0.024 -0.034 -0.028Azerbaijan -0.013 -0.023 -0.023 -0.028 -0.020 -0.024 -0.033 -0.028Côte d'Ivoire -0.013 -0.023 -0.023 -0.028 -0.020 -0.024 -0.033 -0.028Paraguay -0.013 -0.023 -0.023 -0.028 -0.020 -0.023 -0.033 -0.028Uzbekistan -0.013 -0.023 -0.023 -0.028 -0.020 -0.023 -0.032 -0.027Kyrgyzstan -0.013 -0.023 -0.023 -0.028 -0.020 -0.023 -0.032 -0.027Cameroon -0.013 -0.023 -0.023 -0.028 -0.020 -0.023 -0.032 -0.027Moldova -0.013 -0.023 -0.023 -0.028 -0.020 -0.023 -0.032 -0.027Bolivia -0.013 -0.023 -0.023 -0.027 -0.020 -0.023 -0.032 -0.027Ecuador -0.013 -0.023 -0.023 -0.027 -0.020 -0.023 -0.031 -0.027Armenia -0.013 -0.023 -0.023 -0.027 -0.020 -0.023 -0.031 -0.027Sri Lanka -0.013 -0.023 -0.023 -0.027 -0.020 -0.023 -0.031 -0.027Jordan -0.013 -0.023 -0.023 -0.027 -0.020 -0.023 -0.030 -0.026Albania -0.013 -0.022 -0.022 -0.026 -0.020 -0.023 -0.030 -0.026Indonesia -0.013 -0.022 -0.022 -0.026 -0.020 -0.023 -0.029 -0.026Jamaica -0.013 -0.022 -0.022 -0.026 -0.020 -0.023 -0.029 -0.026Zimbabwe -0.013 -0.022 -0.022 -0.026 -0.020 -0.023 -0.029 -0.026Guinea -0.012 -0.022 -0.022 -0.026 -0.020 -0.023 -0.029 -0.026Syria -0.012 -0.022 -0.022 -0.026 -0.020 -0.022 -0.029 -0.025Georgia -0.012 -0.022 -0.022 -0.026 -0.020 -0.022 -0.029 -0.025
Middle-income countries:
Ukraine -0.012 -0.022 -0.022 -0.025 -0.020 -0.022 -0.028 -0.025Philippines -0.012 -0.022 -0.022 -0.025 -0.019 -0.022 -0.027 -0.025Peru -0.012 -0.022 -0.022 -0.025 -0.019 -0.022 -0.027 -0.025Botswana -0.012 -0.022 -0.022 -0.025 -0.019 -0.022 -0.027 -0.025Thailand -0.012 -0.022 -0.022 -0.025 -0.019 -0.022 -0.027 -0.025Morocco -0.012 -0.022 -0.022 -0.025 -0.019 -0.022 -0.027 -0.024Venezuela -0.012 -0.022 -0.022 -0.025 -0.019 -0.022 -0.027 -0.024Macedonia -0.012 -0.022 -0.021 -0.024 -0.019 -0.022 -0.027 -0.024Belize -0.012 -0.022 -0.021 -0.024 -0.019 -0.022 -0.027 -0.024
—Continued

38Cross-Price Elasticities of Demand Across 114 Countries / TB-1925
Economic Research Service / USDA
Appendix table 5
Cournot cross-price elasticity with changes in price for clothing and footwear, 114 countries in 19961—Continued
Food, Gross Transport & beverage, rent, fuel, House Medical communica- & tobacco & power operations care Education tion Recreation2 Other
Middle-income countries—Continued
Egypt -0.012 -0.022 -0.021 -0.024 -0.019 -0.022 -0.027 -0.024St. Vincent & Grenadines -0.011 -0.022 -0.021 -0.024 -0.019 -0.022 -0.027 -0.024Swaziland -0.011 -0.021 -0.021 -0.024 -0.019 -0.022 -0.026 -0.024Lebanon -0.011 -0.021 -0.021 -0.024 -0.019 -0.022 -0.026 -0.024Belarus -0.011 -0.021 -0.021 -0.024 -0.019 -0.022 -0.026 -0.024Kazakhstan -0.011 -0.021 -0.021 -0.024 -0.019 -0.022 -0.026 -0.024Dominica -0.011 -0.021 -0.021 -0.024 -0.019 -0.022 -0.026 -0.024Latvia -0.011 -0.021 -0.021 -0.024 -0.019 -0.021 -0.026 -0.024St. Lucia -0.011 -0.021 -0.021 -0.024 -0.019 -0.021 -0.026 -0.024Brazil -0.011 -0.021 -0.021 -0.024 -0.019 -0.021 -0.026 -0.024Bulgaria -0.011 -0.021 -0.021 -0.024 -0.019 -0.021 -0.026 -0.024Russia -0.011 -0.021 -0.021 -0.024 -0.019 -0.021 -0.026 -0.024Fiji -0.011 -0.021 -0.021 -0.024 -0.019 -0.021 -0.025 -0.023Grenada -0.011 -0.021 -0.021 -0.024 -0.019 -0.021 -0.025 -0.023Turkey -0.011 -0.021 -0.021 -0.024 -0.019 -0.021 -0.025 -0.023Lithuania -0.011 -0.021 -0.021 -0.023 -0.019 -0.021 -0.025 -0.023Romania -0.011 -0.021 -0.021 -0.023 -0.019 -0.021 -0.025 -0.023Iran -0.010 -0.021 -0.021 -0.023 -0.019 -0.021 -0.025 -0.023Mexico -0.010 -0.021 -0.021 -0.023 -0.019 -0.021 -0.025 -0.023Bahrain -0.010 -0.021 -0.021 -0.023 -0.019 -0.021 -0.025 -0.023Chile -0.010 -0.021 -0.021 -0.023 -0.019 -0.021 -0.025 -0.023Antigua & Barbuda -0.010 -0.021 -0.021 -0.023 -0.019 -0.021 -0.025 -0.023Poland -0.010 -0.021 -0.021 -0.023 -0.019 -0.021 -0.025 -0.023Trinidad & Tobago -0.010 -0.021 -0.021 -0.023 -0.019 -0.021 -0.024 -0.023Estonia -0.010 -0.021 -0.021 -0.023 -0.019 -0.021 -0.024 -0.023Gabon -0.010 -0.021 -0.021 -0.023 -0.019 -0.021 -0.024 -0.023Tunisia -0.010 -0.021 -0.020 -0.023 -0.019 -0.021 -0.024 -0.023St. Kitts & Nevis -0.010 -0.021 -0.020 -0.023 -0.019 -0.021 -0.024 -0.023Uruguay -0.010 -0.021 -0.020 -0.023 -0.019 -0.021 -0.024 -0.022Slovakia -0.010 -0.020 -0.020 -0.023 -0.019 -0.021 -0.024 -0.022Hungary -0.009 -0.020 -0.020 -0.022 -0.018 -0.021 -0.024 -0.022Argentina -0.009 -0.020 -0.020 -0.022 -0.018 -0.020 -0.023 -0.022Oman -0.009 -0.020 -0.020 -0.022 -0.018 -0.020 -0.023 -0.022Qatar -0.008 -0.020 -0.020 -0.022 -0.018 -0.020 -0.023 -0.022Slovenia -0.008 -0.020 -0.020 -0.022 -0.018 -0.020 -0.023 -0.022
High-income countries:
Czech Republic -0.008 -0.020 -0.020 -0.022 -0.018 -0.020 -0.023 -0.021Greece -0.008 -0.020 -0.020 -0.021 -0.018 -0.020 -0.022 -0.021Korea -0.008 -0.020 -0.020 -0.021 -0.018 -0.020 -0.022 -0.021Portugal -0.007 -0.020 -0.020 -0.021 -0.018 -0.020 -0.022 -0.021Spain -0.007 -0.020 -0.020 -0.021 -0.018 -0.020 -0.022 -0.021Ireland -0.007 -0.020 -0.020 -0.021 -0.018 -0.020 -0.022 -0.021Singapore -0.007 -0.020 -0.019 -0.021 -0.018 -0.020 -0.022 -0.021Mauritius -0.007 -0.019 -0.019 -0.021 -0.018 -0.020 -0.022 -0.021Israel -0.007 -0.019 -0.019 -0.021 -0.018 -0.020 -0.022 -0.021New Zealand -0.007 -0.019 -0.019 -0.021 -0.018 -0.020 -0.022 -0.021
—Continued

39Cross-Price Elasticities of Demand Across 114 Countries / TB-1925
Economic Research Service / USDA
Appendix table 5
Cournot cross-price elasticity with changes in price for clothing and footwear, 114 countries in 19961—Continued
Food, Gross Transport & beverage, rent, fuel, House Medical communica- & tobacco & power operations care Education tion Recreation2 Other
High-income countries—Continued
Finland -0.007 -0.019 -0.019 -0.021 -0.018 -0.020 -0.022 -0.021Bahamas -0.006 -0.019 -0.019 -0.021 -0.018 -0.019 -0.022 -0.021Sweden -0.006 -0.019 -0.019 -0.021 -0.018 -0.019 -0.022 -0.021Netherlands -0.006 -0.019 -0.019 -0.021 -0.018 -0.019 -0.022 -0.021France -0.005 -0.019 -0.019 -0.021 -0.018 -0.019 -0.021 -0.020United Kingdom -0.005 -0.019 -0.019 -0.021 -0.018 -0.019 -0.021 -0.020Belgium -0.005 -0.019 -0.019 -0.021 -0.018 -0.019 -0.021 -0.020Norway -0.005 -0.019 -0.019 -0.021 -0.018 -0.019 -0.021 -0.020Italy -0.005 -0.019 -0.019 -0.020 -0.018 -0.019 -0.021 -0.020Austria -0.005 -0.019 -0.019 -0.020 -0.018 -0.019 -0.021 -0.020Germany -0.005 -0.019 -0.019 -0.020 -0.018 -0.019 -0.021 -0.020Australia -0.005 -0.019 -0.019 -0.020 -0.018 -0.019 -0.021 -0.020Japan -0.005 -0.019 -0.019 -0.020 -0.017 -0.019 -0.021 -0.020Canada -0.005 -0.019 -0.019 -0.020 -0.017 -0.019 -0.021 -0.020Bermuda -0.004 -0.019 -0.019 -0.020 -0.017 -0.019 -0.021 -0.020Switzerland -0.004 -0.019 -0.019 -0.020 -0.017 -0.019 -0.021 -0.020Barbados -0.004 -0.019 -0.019 -0.020 -0.017 -0.019 -0.021 -0.020Hong Kong -0.004 -0.019 -0.019 -0.020 -0.017 -0.019 -0.021 -0.020Iceland -0.004 -0.019 -0.019 -0.020 -0.017 -0.019 -0.021 -0.020Denmark -0.004 -0.019 -0.019 -0.020 -0.017 -0.019 -0.021 -0.020Luxembourg -0.002 -0.019 -0.018 -0.020 -0.017 -0.019 -0.020 -0.020United States -0.002 -0.018 -0.018 -0.020 -0.017 -0.019 -0.020 -0.020
Low-income average -0.014 -0.024 -0.024 -0.031 -0.021 -0.024 -0.043 -0.030Middle-income average -0.011 -0.021 -0.021 -0.024 -0.019 -0.021 -0.025 -0.023High-income average -0.006 -0.019 -0.019 -0.021 -0.018 -0.019 -0.021 -0.0211Countries are reported based on ascending per capita real income levels.2As the estimated budget share was negative for Tanzania we do not report the elasticity for this country.
Source: Authors' calculation using the 1996 ICP data.
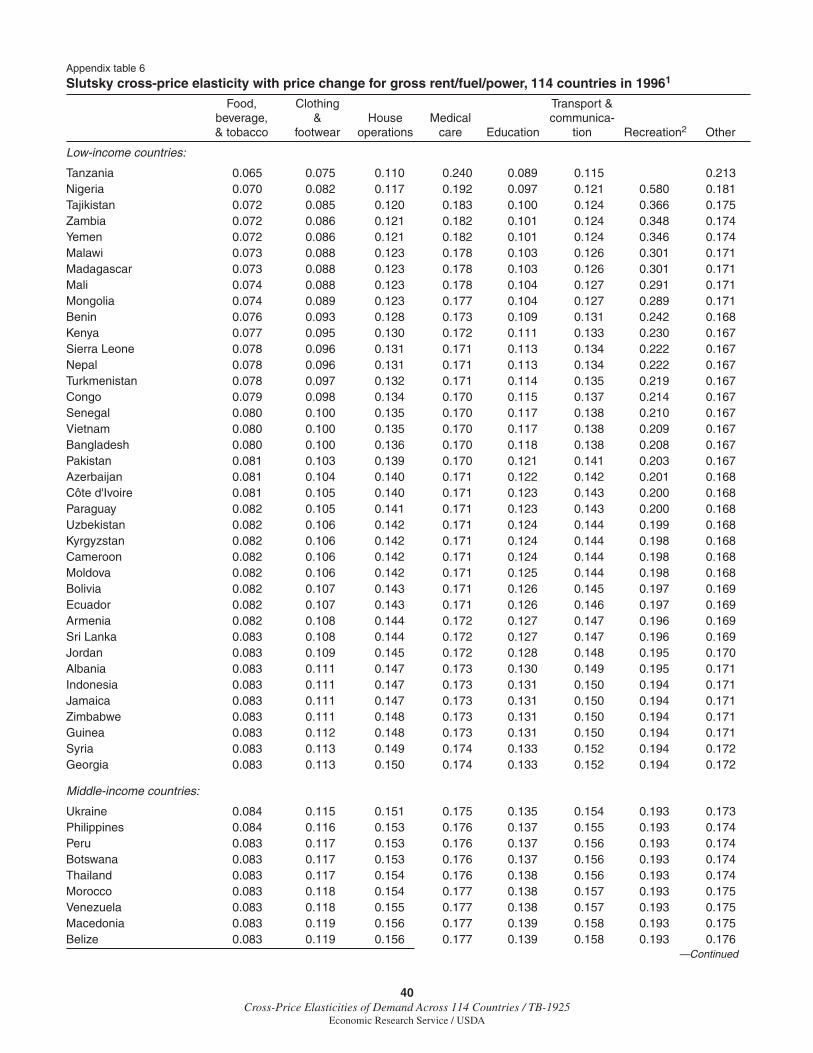
40Cross-Price Elasticities of Demand Across 114 Countries / TB-1925
Economic Research Service / USDA
Appendix table 6
Slutsky cross-price elasticity with price change for gross rent/fuel/power, 114 countries in 19961
Food, Clothing Transport & beverage, & House Medical communica- & tobacco footwear operations care Education tion Recreation2 Other
Low-income countries:
Tanzania 0.065 0.075 0.110 0.240 0.089 0.115 0.213Nigeria 0.070 0.082 0.117 0.192 0.097 0.121 0.580 0.181Tajikistan 0.072 0.085 0.120 0.183 0.100 0.124 0.366 0.175Zambia 0.072 0.086 0.121 0.182 0.101 0.124 0.348 0.174Yemen 0.072 0.086 0.121 0.182 0.101 0.124 0.346 0.174Malawi 0.073 0.088 0.123 0.178 0.103 0.126 0.301 0.171Madagascar 0.073 0.088 0.123 0.178 0.103 0.126 0.301 0.171Mali 0.074 0.088 0.123 0.178 0.104 0.127 0.291 0.171Mongolia 0.074 0.089 0.123 0.177 0.104 0.127 0.289 0.171Benin 0.076 0.093 0.128 0.173 0.109 0.131 0.242 0.168Kenya 0.077 0.095 0.130 0.172 0.111 0.133 0.230 0.167Sierra Leone 0.078 0.096 0.131 0.171 0.113 0.134 0.222 0.167Nepal 0.078 0.096 0.131 0.171 0.113 0.134 0.222 0.167Turkmenistan 0.078 0.097 0.132 0.171 0.114 0.135 0.219 0.167Congo 0.079 0.098 0.134 0.170 0.115 0.137 0.214 0.167Senegal 0.080 0.100 0.135 0.170 0.117 0.138 0.210 0.167Vietnam 0.080 0.100 0.135 0.170 0.117 0.138 0.209 0.167Bangladesh 0.080 0.100 0.136 0.170 0.118 0.138 0.208 0.167Pakistan 0.081 0.103 0.139 0.170 0.121 0.141 0.203 0.167Azerbaijan 0.081 0.104 0.140 0.171 0.122 0.142 0.201 0.168Côte d'Ivoire 0.081 0.105 0.140 0.171 0.123 0.143 0.200 0.168Paraguay 0.082 0.105 0.141 0.171 0.123 0.143 0.200 0.168Uzbekistan 0.082 0.106 0.142 0.171 0.124 0.144 0.199 0.168Kyrgyzstan 0.082 0.106 0.142 0.171 0.124 0.144 0.198 0.168Cameroon 0.082 0.106 0.142 0.171 0.124 0.144 0.198 0.168Moldova 0.082 0.106 0.142 0.171 0.125 0.144 0.198 0.168Bolivia 0.082 0.107 0.143 0.171 0.126 0.145 0.197 0.169Ecuador 0.082 0.107 0.143 0.171 0.126 0.146 0.197 0.169Armenia 0.082 0.108 0.144 0.172 0.127 0.147 0.196 0.169Sri Lanka 0.083 0.108 0.144 0.172 0.127 0.147 0.196 0.169Jordan 0.083 0.109 0.145 0.172 0.128 0.148 0.195 0.170Albania 0.083 0.111 0.147 0.173 0.130 0.149 0.195 0.171Indonesia 0.083 0.111 0.147 0.173 0.131 0.150 0.194 0.171Jamaica 0.083 0.111 0.147 0.173 0.131 0.150 0.194 0.171Zimbabwe 0.083 0.111 0.148 0.173 0.131 0.150 0.194 0.171Guinea 0.083 0.112 0.148 0.173 0.131 0.150 0.194 0.171Syria 0.083 0.113 0.149 0.174 0.133 0.152 0.194 0.172Georgia 0.083 0.113 0.150 0.174 0.133 0.152 0.194 0.172
Middle-income countries:
Ukraine 0.084 0.115 0.151 0.175 0.135 0.154 0.193 0.173Philippines 0.084 0.116 0.153 0.176 0.137 0.155 0.193 0.174Peru 0.083 0.117 0.153 0.176 0.137 0.156 0.193 0.174Botswana 0.083 0.117 0.153 0.176 0.137 0.156 0.193 0.174Thailand 0.083 0.117 0.154 0.176 0.138 0.156 0.193 0.174Morocco 0.083 0.118 0.154 0.177 0.138 0.157 0.193 0.175Venezuela 0.083 0.118 0.155 0.177 0.138 0.157 0.193 0.175Macedonia 0.083 0.119 0.156 0.177 0.139 0.158 0.193 0.175Belize 0.083 0.119 0.156 0.177 0.139 0.158 0.193 0.176
—Continued

41Cross-Price Elasticities of Demand Across 114 Countries / TB-1925
Economic Research Service / USDA
Appendix table 6
Slutsky cross-price elasticity with price change for gross rent/fuel/power, 114 countries in 19961—Continued
Food, Clothing Transport & beverage, & House Medical communica- & tobacco footwear operations care Education tion Recreation2 Other
Middle-income countries—Continued
Egypt 0.083 0.119 0.156 0.177 0.140 0.158 0.193 0.176St. Vincent & Grenadines 0.083 0.119 0.156 0.177 0.140 0.158 0.193 0.176Swaziland 0.083 0.120 0.157 0.178 0.141 0.159 0.193 0.176Lebanon 0.083 0.120 0.157 0.178 0.141 0.159 0.193 0.177Belarus 0.083 0.120 0.157 0.178 0.141 0.160 0.193 0.177Kazakhstan 0.083 0.121 0.157 0.178 0.142 0.160 0.193 0.177Dominica 0.083 0.121 0.158 0.178 0.142 0.160 0.193 0.177Latvia 0.083 0.122 0.159 0.179 0.143 0.161 0.193 0.178St. Lucia 0.083 0.122 0.159 0.179 0.143 0.161 0.194 0.178Brazil 0.083 0.122 0.159 0.179 0.143 0.161 0.194 0.178Bulgaria 0.083 0.122 0.159 0.179 0.143 0.161 0.194 0.178Russia 0.083 0.122 0.160 0.180 0.144 0.162 0.194 0.178Fiji 0.082 0.123 0.160 0.180 0.145 0.162 0.194 0.179Grenada 0.082 0.123 0.160 0.180 0.145 0.162 0.194 0.179Turkey 0.082 0.123 0.161 0.180 0.145 0.163 0.194 0.179Lithuania 0.082 0.124 0.161 0.181 0.146 0.163 0.194 0.179Romania 0.082 0.124 0.162 0.181 0.146 0.164 0.194 0.180Iran 0.081 0.125 0.163 0.182 0.147 0.165 0.195 0.180Mexico 0.081 0.125 0.163 0.182 0.147 0.165 0.195 0.181Bahrain 0.081 0.126 0.163 0.182 0.148 0.165 0.195 0.181Chile 0.081 0.126 0.164 0.183 0.148 0.166 0.195 0.181Antigua & Barbuda 0.081 0.126 0.164 0.183 0.148 0.166 0.195 0.181Poland 0.080 0.127 0.164 0.183 0.149 0.166 0.195 0.182Trinidad & Tobago 0.080 0.127 0.165 0.183 0.150 0.167 0.195 0.182Estonia 0.080 0.128 0.166 0.184 0.150 0.168 0.196 0.182Gabon 0.080 0.128 0.166 0.184 0.151 0.168 0.196 0.183Tunisia 0.079 0.128 0.166 0.184 0.151 0.168 0.196 0.183St. Kitts & Nevis 0.079 0.129 0.167 0.185 0.151 0.168 0.196 0.183Uruguay 0.079 0.129 0.167 0.185 0.151 0.169 0.196 0.183Slovakia 0.079 0.129 0.167 0.185 0.152 0.169 0.196 0.184Hungary 0.077 0.131 0.169 0.186 0.154 0.171 0.197 0.185Argentina 0.075 0.133 0.171 0.188 0.156 0.173 0.198 0.187Oman 0.074 0.133 0.172 0.189 0.157 0.174 0.199 0.187Qatar 0.073 0.135 0.173 0.189 0.158 0.175 0.199 0.188Slovenia 0.072 0.135 0.174 0.190 0.159 0.176 0.200 0.189
High-income countries:
Czech Republic 0.071 0.136 0.174 0.190 0.160 0.176 0.200 0.189Greece 0.069 0.137 0.176 0.192 0.161 0.178 0.201 0.190Korea 0.068 0.137 0.176 0.192 0.162 0.178 0.201 0.191Portugal 0.067 0.138 0.177 0.192 0.162 0.179 0.201 0.191Spain 0.067 0.138 0.177 0.192 0.162 0.179 0.201 0.191Ireland 0.066 0.138 0.178 0.193 0.163 0.179 0.202 0.192Singapore 0.065 0.139 0.178 0.193 0.164 0.180 0.202 0.192Mauritius 0.063 0.140 0.179 0.194 0.165 0.181 0.203 0.193Israel 0.062 0.140 0.180 0.195 0.165 0.181 0.203 0.194New Zealand 0.061 0.140 0.180 0.195 0.166 0.182 0.203 0.194
—Continued
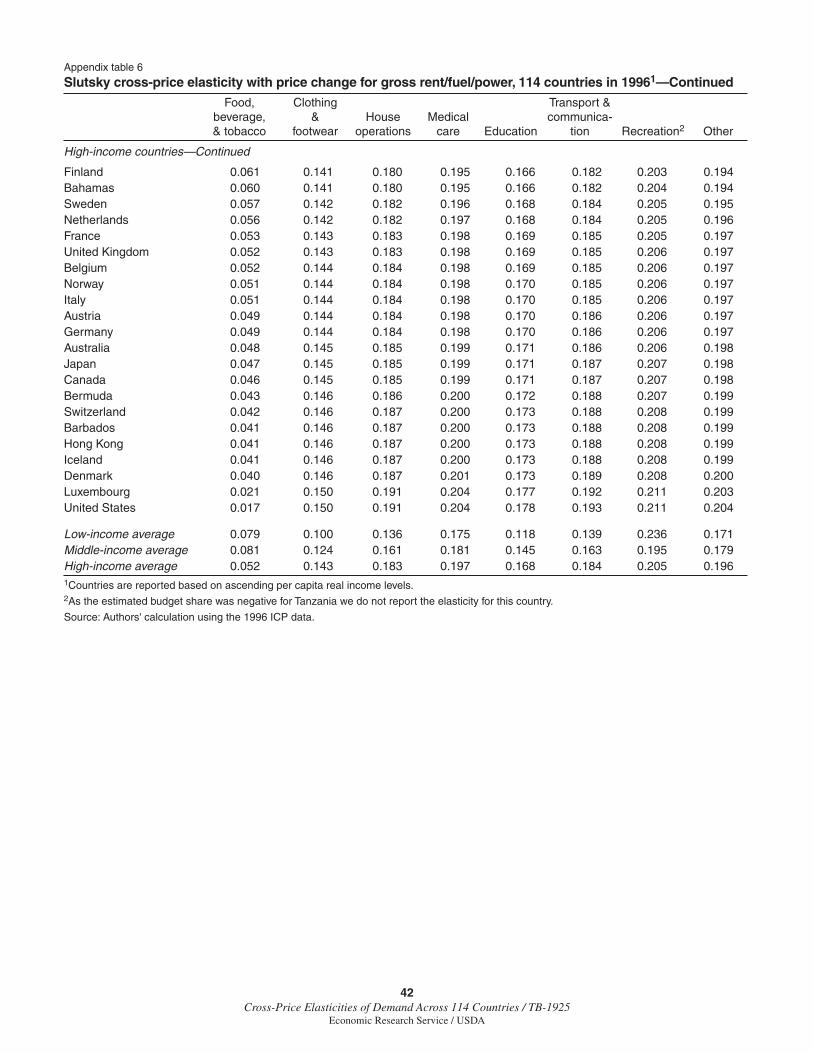
42Cross-Price Elasticities of Demand Across 114 Countries / TB-1925
Economic Research Service / USDA
Appendix table 6
Slutsky cross-price elasticity with price change for gross rent/fuel/power, 114 countries in 19961—Continued
Food, Clothing Transport & beverage, & House Medical communica- & tobacco footwear operations care Education tion Recreation2 Other
High-income countries—Continued
Finland 0.061 0.141 0.180 0.195 0.166 0.182 0.203 0.194Bahamas 0.060 0.141 0.180 0.195 0.166 0.182 0.204 0.194Sweden 0.057 0.142 0.182 0.196 0.168 0.184 0.205 0.195Netherlands 0.056 0.142 0.182 0.197 0.168 0.184 0.205 0.196France 0.053 0.143 0.183 0.198 0.169 0.185 0.205 0.197United Kingdom 0.052 0.143 0.183 0.198 0.169 0.185 0.206 0.197Belgium 0.052 0.144 0.184 0.198 0.169 0.185 0.206 0.197Norway 0.051 0.144 0.184 0.198 0.170 0.185 0.206 0.197Italy 0.051 0.144 0.184 0.198 0.170 0.185 0.206 0.197Austria 0.049 0.144 0.184 0.198 0.170 0.186 0.206 0.197Germany 0.049 0.144 0.184 0.198 0.170 0.186 0.206 0.197Australia 0.048 0.145 0.185 0.199 0.171 0.186 0.206 0.198Japan 0.047 0.145 0.185 0.199 0.171 0.187 0.207 0.198Canada 0.046 0.145 0.185 0.199 0.171 0.187 0.207 0.198Bermuda 0.043 0.146 0.186 0.200 0.172 0.188 0.207 0.199Switzerland 0.042 0.146 0.187 0.200 0.173 0.188 0.208 0.199Barbados 0.041 0.146 0.187 0.200 0.173 0.188 0.208 0.199Hong Kong 0.041 0.146 0.187 0.200 0.173 0.188 0.208 0.199Iceland 0.041 0.146 0.187 0.200 0.173 0.188 0.208 0.199Denmark 0.040 0.146 0.187 0.201 0.173 0.189 0.208 0.200Luxembourg 0.021 0.150 0.191 0.204 0.177 0.192 0.211 0.203United States 0.017 0.150 0.191 0.204 0.178 0.193 0.211 0.204
Low-income average 0.079 0.100 0.136 0.175 0.118 0.139 0.236 0.171Middle-income average 0.081 0.124 0.161 0.181 0.145 0.163 0.195 0.179High-income average 0.052 0.143 0.183 0.197 0.168 0.184 0.205 0.1961Countries are reported based on ascending per capita real income levels.2As the estimated budget share was negative for Tanzania we do not report the elasticity for this country.
Source: Authors' calculation using the 1996 ICP data.
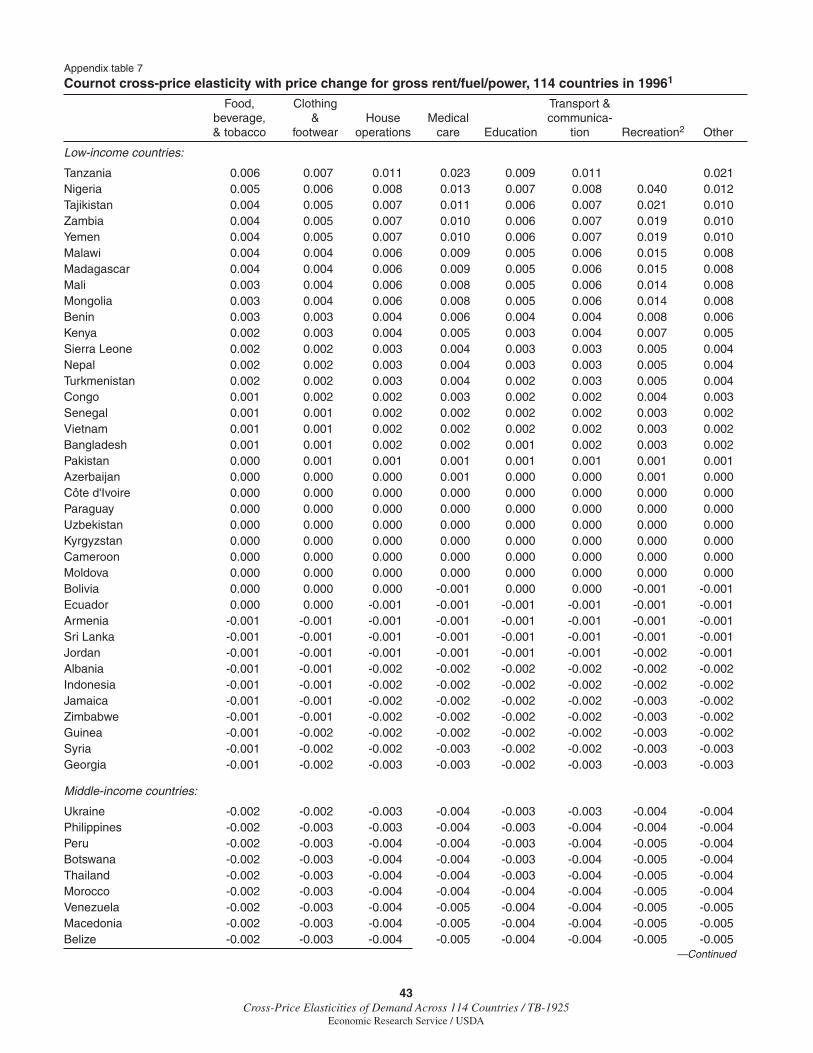
43Cross-Price Elasticities of Demand Across 114 Countries / TB-1925
Economic Research Service / USDA
Appendix table 7
Cournot cross-price elasticity with price change for gross rent/fuel/power, 114 countries in 19961
Food, Clothing Transport & beverage, & House Medical communica- & tobacco footwear operations care Education tion Recreation2 Other
Low-income countries:
Tanzania 0.006 0.007 0.011 0.023 0.009 0.011 0.021Nigeria 0.005 0.006 0.008 0.013 0.007 0.008 0.040 0.012Tajikistan 0.004 0.005 0.007 0.011 0.006 0.007 0.021 0.010Zambia 0.004 0.005 0.007 0.010 0.006 0.007 0.019 0.010Yemen 0.004 0.005 0.007 0.010 0.006 0.007 0.019 0.010Malawi 0.004 0.004 0.006 0.009 0.005 0.006 0.015 0.008Madagascar 0.004 0.004 0.006 0.009 0.005 0.006 0.015 0.008Mali 0.003 0.004 0.006 0.008 0.005 0.006 0.014 0.008Mongolia 0.003 0.004 0.006 0.008 0.005 0.006 0.014 0.008Benin 0.003 0.003 0.004 0.006 0.004 0.004 0.008 0.006Kenya 0.002 0.003 0.004 0.005 0.003 0.004 0.007 0.005Sierra Leone 0.002 0.002 0.003 0.004 0.003 0.003 0.005 0.004Nepal 0.002 0.002 0.003 0.004 0.003 0.003 0.005 0.004Turkmenistan 0.002 0.002 0.003 0.004 0.002 0.003 0.005 0.004Congo 0.001 0.002 0.002 0.003 0.002 0.002 0.004 0.003Senegal 0.001 0.001 0.002 0.002 0.002 0.002 0.003 0.002Vietnam 0.001 0.001 0.002 0.002 0.002 0.002 0.003 0.002Bangladesh 0.001 0.001 0.002 0.002 0.001 0.002 0.003 0.002Pakistan 0.000 0.001 0.001 0.001 0.001 0.001 0.001 0.001Azerbaijan 0.000 0.000 0.000 0.001 0.000 0.000 0.001 0.000Côte d'Ivoire 0.000 0.000 0.000 0.000 0.000 0.000 0.000 0.000Paraguay 0.000 0.000 0.000 0.000 0.000 0.000 0.000 0.000Uzbekistan 0.000 0.000 0.000 0.000 0.000 0.000 0.000 0.000Kyrgyzstan 0.000 0.000 0.000 0.000 0.000 0.000 0.000 0.000Cameroon 0.000 0.000 0.000 0.000 0.000 0.000 0.000 0.000Moldova 0.000 0.000 0.000 0.000 0.000 0.000 0.000 0.000Bolivia 0.000 0.000 0.000 -0.001 0.000 0.000 -0.001 -0.001Ecuador 0.000 0.000 -0.001 -0.001 -0.001 -0.001 -0.001 -0.001Armenia -0.001 -0.001 -0.001 -0.001 -0.001 -0.001 -0.001 -0.001Sri Lanka -0.001 -0.001 -0.001 -0.001 -0.001 -0.001 -0.001 -0.001Jordan -0.001 -0.001 -0.001 -0.001 -0.001 -0.001 -0.002 -0.001Albania -0.001 -0.001 -0.002 -0.002 -0.002 -0.002 -0.002 -0.002Indonesia -0.001 -0.001 -0.002 -0.002 -0.002 -0.002 -0.002 -0.002Jamaica -0.001 -0.001 -0.002 -0.002 -0.002 -0.002 -0.003 -0.002Zimbabwe -0.001 -0.001 -0.002 -0.002 -0.002 -0.002 -0.003 -0.002Guinea -0.001 -0.002 -0.002 -0.002 -0.002 -0.002 -0.003 -0.002Syria -0.001 -0.002 -0.002 -0.003 -0.002 -0.002 -0.003 -0.003Georgia -0.001 -0.002 -0.003 -0.003 -0.002 -0.003 -0.003 -0.003
Middle-income countries:
Ukraine -0.002 -0.002 -0.003 -0.004 -0.003 -0.003 -0.004 -0.004Philippines -0.002 -0.003 -0.003 -0.004 -0.003 -0.004 -0.004 -0.004Peru -0.002 -0.003 -0.004 -0.004 -0.003 -0.004 -0.005 -0.004Botswana -0.002 -0.003 -0.004 -0.004 -0.003 -0.004 -0.005 -0.004Thailand -0.002 -0.003 -0.004 -0.004 -0.003 -0.004 -0.005 -0.004Morocco -0.002 -0.003 -0.004 -0.004 -0.004 -0.004 -0.005 -0.004Venezuela -0.002 -0.003 -0.004 -0.005 -0.004 -0.004 -0.005 -0.005Macedonia -0.002 -0.003 -0.004 -0.005 -0.004 -0.004 -0.005 -0.005Belize -0.002 -0.003 -0.004 -0.005 -0.004 -0.004 -0.005 -0.005
—Continued
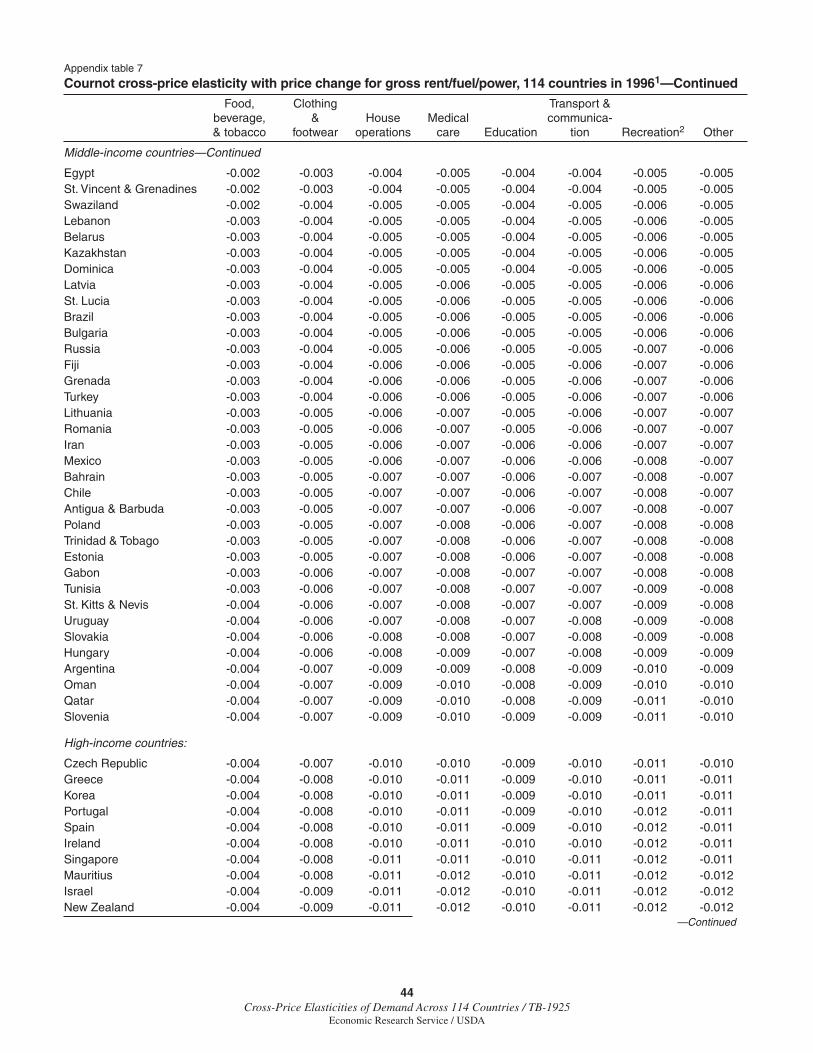
44Cross-Price Elasticities of Demand Across 114 Countries / TB-1925
Economic Research Service / USDA
Appendix table 7
Cournot cross-price elasticity with price change for gross rent/fuel/power, 114 countries in 19961—Continued
Food, Clothing Transport & beverage, & House Medical communica- & tobacco footwear operations care Education tion Recreation2 Other
Middle-income countries—Continued
Egypt -0.002 -0.003 -0.004 -0.005 -0.004 -0.004 -0.005 -0.005St. Vincent & Grenadines -0.002 -0.003 -0.004 -0.005 -0.004 -0.004 -0.005 -0.005Swaziland -0.002 -0.004 -0.005 -0.005 -0.004 -0.005 -0.006 -0.005Lebanon -0.003 -0.004 -0.005 -0.005 -0.004 -0.005 -0.006 -0.005Belarus -0.003 -0.004 -0.005 -0.005 -0.004 -0.005 -0.006 -0.005Kazakhstan -0.003 -0.004 -0.005 -0.005 -0.004 -0.005 -0.006 -0.005Dominica -0.003 -0.004 -0.005 -0.005 -0.004 -0.005 -0.006 -0.005Latvia -0.003 -0.004 -0.005 -0.006 -0.005 -0.005 -0.006 -0.006St. Lucia -0.003 -0.004 -0.005 -0.006 -0.005 -0.005 -0.006 -0.006Brazil -0.003 -0.004 -0.005 -0.006 -0.005 -0.005 -0.006 -0.006Bulgaria -0.003 -0.004 -0.005 -0.006 -0.005 -0.005 -0.006 -0.006Russia -0.003 -0.004 -0.005 -0.006 -0.005 -0.005 -0.007 -0.006Fiji -0.003 -0.004 -0.006 -0.006 -0.005 -0.006 -0.007 -0.006Grenada -0.003 -0.004 -0.006 -0.006 -0.005 -0.006 -0.007 -0.006Turkey -0.003 -0.004 -0.006 -0.006 -0.005 -0.006 -0.007 -0.006Lithuania -0.003 -0.005 -0.006 -0.007 -0.005 -0.006 -0.007 -0.007Romania -0.003 -0.005 -0.006 -0.007 -0.005 -0.006 -0.007 -0.007Iran -0.003 -0.005 -0.006 -0.007 -0.006 -0.006 -0.007 -0.007Mexico -0.003 -0.005 -0.006 -0.007 -0.006 -0.006 -0.008 -0.007Bahrain -0.003 -0.005 -0.007 -0.007 -0.006 -0.007 -0.008 -0.007Chile -0.003 -0.005 -0.007 -0.007 -0.006 -0.007 -0.008 -0.007Antigua & Barbuda -0.003 -0.005 -0.007 -0.007 -0.006 -0.007 -0.008 -0.007Poland -0.003 -0.005 -0.007 -0.008 -0.006 -0.007 -0.008 -0.008Trinidad & Tobago -0.003 -0.005 -0.007 -0.008 -0.006 -0.007 -0.008 -0.008Estonia -0.003 -0.005 -0.007 -0.008 -0.006 -0.007 -0.008 -0.008Gabon -0.003 -0.006 -0.007 -0.008 -0.007 -0.007 -0.008 -0.008Tunisia -0.003 -0.006 -0.007 -0.008 -0.007 -0.007 -0.009 -0.008St. Kitts & Nevis -0.004 -0.006 -0.007 -0.008 -0.007 -0.007 -0.009 -0.008Uruguay -0.004 -0.006 -0.007 -0.008 -0.007 -0.008 -0.009 -0.008Slovakia -0.004 -0.006 -0.008 -0.008 -0.007 -0.008 -0.009 -0.008Hungary -0.004 -0.006 -0.008 -0.009 -0.007 -0.008 -0.009 -0.009Argentina -0.004 -0.007 -0.009 -0.009 -0.008 -0.009 -0.010 -0.009Oman -0.004 -0.007 -0.009 -0.010 -0.008 -0.009 -0.010 -0.010Qatar -0.004 -0.007 -0.009 -0.010 -0.008 -0.009 -0.011 -0.010Slovenia -0.004 -0.007 -0.009 -0.010 -0.009 -0.009 -0.011 -0.010
High-income countries:
Czech Republic -0.004 -0.007 -0.010 -0.010 -0.009 -0.010 -0.011 -0.010Greece -0.004 -0.008 -0.010 -0.011 -0.009 -0.010 -0.011 -0.011Korea -0.004 -0.008 -0.010 -0.011 -0.009 -0.010 -0.011 -0.011Portugal -0.004 -0.008 -0.010 -0.011 -0.009 -0.010 -0.012 -0.011Spain -0.004 -0.008 -0.010 -0.011 -0.009 -0.010 -0.012 -0.011Ireland -0.004 -0.008 -0.010 -0.011 -0.010 -0.010 -0.012 -0.011Singapore -0.004 -0.008 -0.011 -0.011 -0.010 -0.011 -0.012 -0.011Mauritius -0.004 -0.008 -0.011 -0.012 -0.010 -0.011 -0.012 -0.012Israel -0.004 -0.009 -0.011 -0.012 -0.010 -0.011 -0.012 -0.012New Zealand -0.004 -0.009 -0.011 -0.012 -0.010 -0.011 -0.012 -0.012
—Continued

45Cross-Price Elasticities of Demand Across 114 Countries / TB-1925
Economic Research Service / USDA
Appendix table 7
Cournot cross-price elasticity with price change for gross rent/fuel/power, 114 countries in 19961—Continued
Food, Clothing Transport & beverage, & House Medical communica- & tobacco footwear operations care Education tion Recreation2 Other
High-income countries—Continued
Finland -0.004 -0.009 -0.011 -0.012 -0.010 -0.011 -0.013 -0.012Bahamas -0.004 -0.009 -0.011 -0.012 -0.010 -0.011 -0.013 -0.012Sweden -0.004 -0.009 -0.012 -0.012 -0.011 -0.012 -0.013 -0.012Netherlands -0.004 -0.009 -0.012 -0.013 -0.011 -0.012 -0.013 -0.012France -0.003 -0.009 -0.012 -0.013 -0.011 -0.012 -0.013 -0.013United Kingdom -0.003 -0.009 -0.012 -0.013 -0.011 -0.012 -0.013 -0.013Belgium -0.003 -0.009 -0.012 -0.013 -0.011 -0.012 -0.013 -0.013Norway -0.003 -0.009 -0.012 -0.013 -0.011 -0.012 -0.013 -0.013Italy -0.003 -0.009 -0.012 -0.013 -0.011 -0.012 -0.014 -0.013Austria -0.003 -0.010 -0.012 -0.013 -0.011 -0.012 -0.014 -0.013Germany -0.003 -0.010 -0.012 -0.013 -0.011 -0.012 -0.014 -0.013Australia -0.003 -0.010 -0.012 -0.013 -0.011 -0.012 -0.014 -0.013Japan -0.003 -0.010 -0.012 -0.013 -0.011 -0.013 -0.014 -0.013Canada -0.003 -0.010 -0.013 -0.013 -0.012 -0.013 -0.014 -0.013Bermuda -0.003 -0.010 -0.013 -0.014 -0.012 -0.013 -0.014 -0.014Switzerland -0.003 -0.010 -0.013 -0.014 -0.012 -0.013 -0.014 -0.014Barbados -0.003 -0.010 -0.013 -0.014 -0.012 -0.013 -0.014 -0.014Hong Kong -0.003 -0.010 -0.013 -0.014 -0.012 -0.013 -0.014 -0.014Iceland -0.003 -0.010 -0.013 -0.014 -0.012 -0.013 -0.014 -0.014Denmark -0.003 -0.010 -0.013 -0.014 -0.012 -0.013 -0.014 -0.014Luxembourg -0.002 -0.011 -0.014 -0.015 -0.013 -0.014 -0.015 -0.015United States -0.001 -0.011 -0.014 -0.015 -0.013 -0.014 -0.016 -0.015
Low-income average 0.001 0.001 0.002 0.003 0.002 0.002 0.005 0.003Middle-income average -0.003 -0.004 -0.006 -0.007 -0.005 -0.006 -0.007 -0.006High-income average -0.003 -0.009 -0.012 -0.013 -0.011 -0.012 -0.013 -0.0131Countries are reported based on ascending per capita real income levels.2As the estimated budget share was negative for Tanzania we do not report the elasticity for this country.
Source: Authors' calculation using the 1996 ICP data.
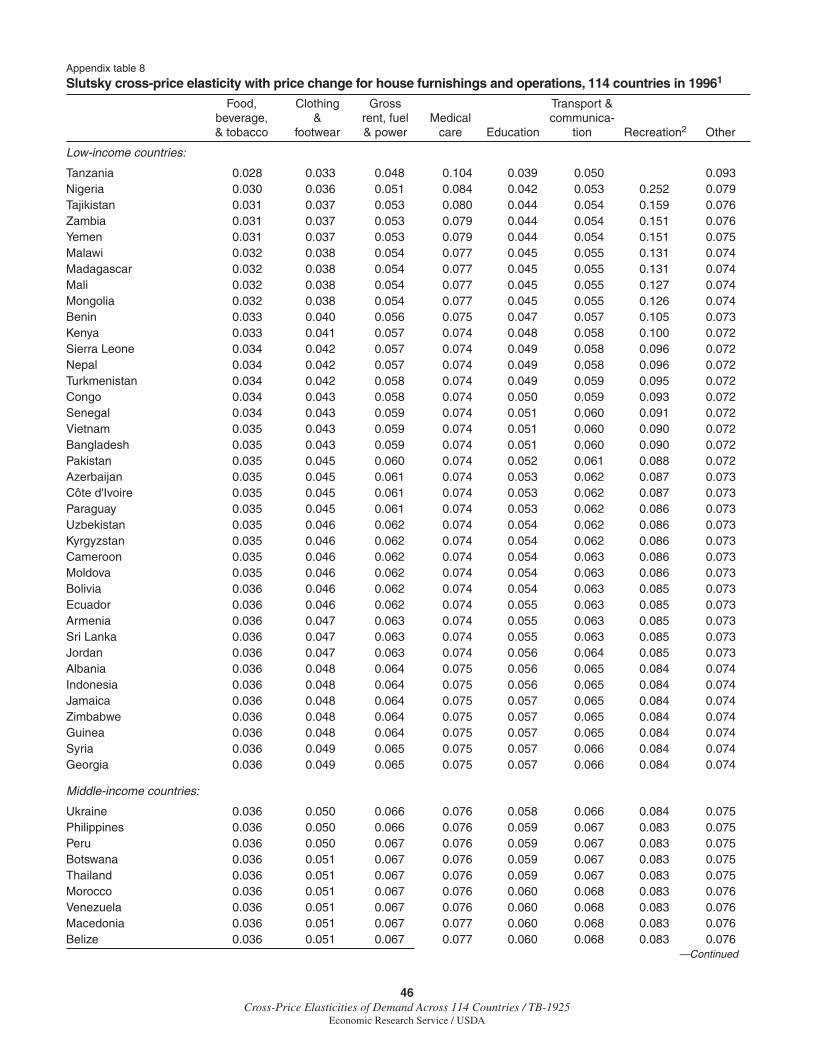
46Cross-Price Elasticities of Demand Across 114 Countries / TB-1925
Economic Research Service / USDA
Appendix table 8
Slutsky cross-price elasticity with price change for house furnishings and operations, 114 countries in 19961
Food, Clothing Gross Transport & beverage, & rent, fuel Medical communica- & tobacco footwear & power care Education tion Recreation2 Other
Low-income countries:
Tanzania 0.028 0.033 0.048 0.104 0.039 0.050 0.093Nigeria 0.030 0.036 0.051 0.084 0.042 0.053 0.252 0.079Tajikistan 0.031 0.037 0.053 0.080 0.044 0.054 0.159 0.076Zambia 0.031 0.037 0.053 0.079 0.044 0.054 0.151 0.076Yemen 0.031 0.037 0.053 0.079 0.044 0.054 0.151 0.075Malawi 0.032 0.038 0.054 0.077 0.045 0.055 0.131 0.074Madagascar 0.032 0.038 0.054 0.077 0.045 0.055 0.131 0.074Mali 0.032 0.038 0.054 0.077 0.045 0.055 0.127 0.074Mongolia 0.032 0.038 0.054 0.077 0.045 0.055 0.126 0.074Benin 0.033 0.040 0.056 0.075 0.047 0.057 0.105 0.073Kenya 0.033 0.041 0.057 0.074 0.048 0.058 0.100 0.072Sierra Leone 0.034 0.042 0.057 0.074 0.049 0.058 0.096 0.072Nepal 0.034 0.042 0.057 0.074 0.049 0.058 0.096 0.072Turkmenistan 0.034 0.042 0.058 0.074 0.049 0.059 0.095 0.072Congo 0.034 0.043 0.058 0.074 0.050 0.059 0.093 0.072Senegal 0.034 0.043 0.059 0.074 0.051 0.060 0.091 0.072Vietnam 0.035 0.043 0.059 0.074 0.051 0.060 0.090 0.072Bangladesh 0.035 0.043 0.059 0.074 0.051 0.060 0.090 0.072Pakistan 0.035 0.045 0.060 0.074 0.052 0.061 0.088 0.072Azerbaijan 0.035 0.045 0.061 0.074 0.053 0.062 0.087 0.073Côte d'Ivoire 0.035 0.045 0.061 0.074 0.053 0.062 0.087 0.073Paraguay 0.035 0.045 0.061 0.074 0.053 0.062 0.086 0.073Uzbekistan 0.035 0.046 0.062 0.074 0.054 0.062 0.086 0.073Kyrgyzstan 0.035 0.046 0.062 0.074 0.054 0.062 0.086 0.073Cameroon 0.035 0.046 0.062 0.074 0.054 0.063 0.086 0.073Moldova 0.035 0.046 0.062 0.074 0.054 0.063 0.086 0.073Bolivia 0.036 0.046 0.062 0.074 0.054 0.063 0.085 0.073Ecuador 0.036 0.046 0.062 0.074 0.055 0.063 0.085 0.073Armenia 0.036 0.047 0.063 0.074 0.055 0.063 0.085 0.073Sri Lanka 0.036 0.047 0.063 0.074 0.055 0.063 0.085 0.073Jordan 0.036 0.047 0.063 0.074 0.056 0.064 0.085 0.073Albania 0.036 0.048 0.064 0.075 0.056 0.065 0.084 0.074Indonesia 0.036 0.048 0.064 0.075 0.056 0.065 0.084 0.074Jamaica 0.036 0.048 0.064 0.075 0.057 0.065 0.084 0.074Zimbabwe 0.036 0.048 0.064 0.075 0.057 0.065 0.084 0.074Guinea 0.036 0.048 0.064 0.075 0.057 0.065 0.084 0.074Syria 0.036 0.049 0.065 0.075 0.057 0.066 0.084 0.074Georgia 0.036 0.049 0.065 0.075 0.057 0.066 0.084 0.074
Middle-income countries:
Ukraine 0.036 0.050 0.066 0.076 0.058 0.066 0.084 0.075Philippines 0.036 0.050 0.066 0.076 0.059 0.067 0.083 0.075Peru 0.036 0.050 0.067 0.076 0.059 0.067 0.083 0.075Botswana 0.036 0.051 0.067 0.076 0.059 0.067 0.083 0.075Thailand 0.036 0.051 0.067 0.076 0.059 0.067 0.083 0.075Morocco 0.036 0.051 0.067 0.076 0.060 0.068 0.083 0.076Venezuela 0.036 0.051 0.067 0.076 0.060 0.068 0.083 0.076Macedonia 0.036 0.051 0.067 0.077 0.060 0.068 0.083 0.076Belize 0.036 0.051 0.067 0.077 0.060 0.068 0.083 0.076
—Continued
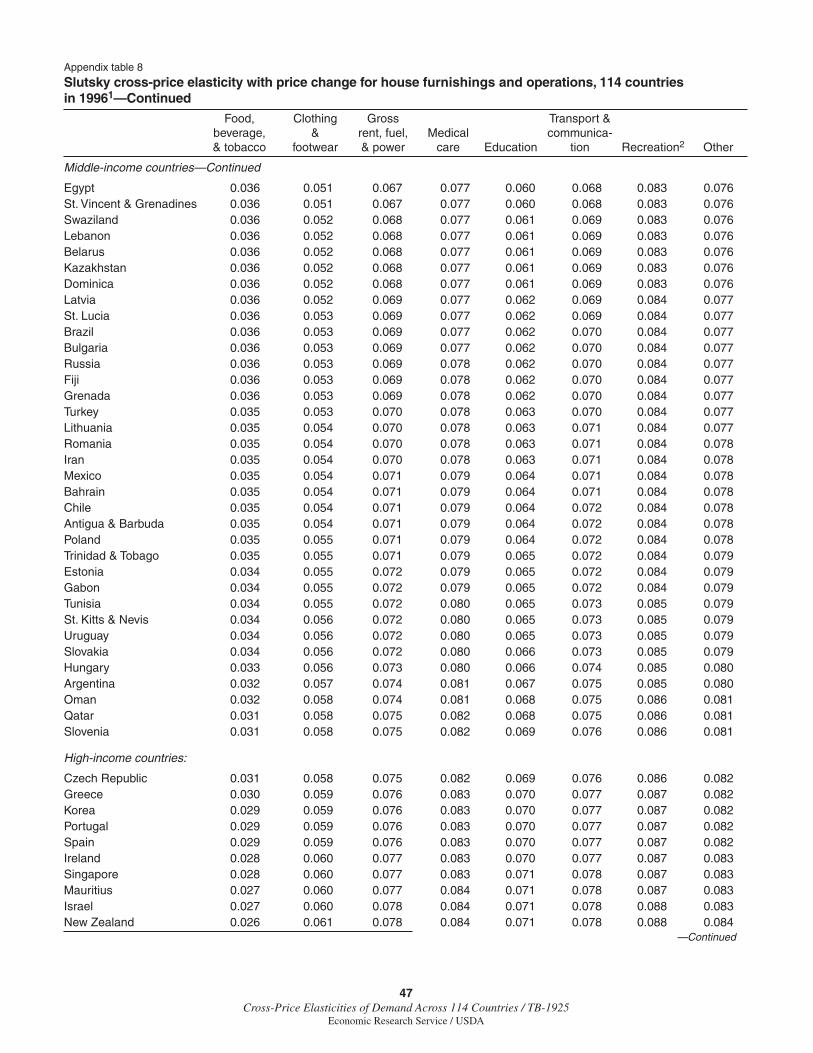
47Cross-Price Elasticities of Demand Across 114 Countries / TB-1925
Economic Research Service / USDA
Appendix table 8
Slutsky cross-price elasticity with price change for house furnishings and operations, 114 countries in 19961—Continued
Food, Clothing Gross Transport & beverage, & rent, fuel, Medical communica- & tobacco footwear & power care Education tion Recreation2 Other
Middle-income countries—Continued
Egypt 0.036 0.051 0.067 0.077 0.060 0.068 0.083 0.076St. Vincent & Grenadines 0.036 0.051 0.067 0.077 0.060 0.068 0.083 0.076Swaziland 0.036 0.052 0.068 0.077 0.061 0.069 0.083 0.076Lebanon 0.036 0.052 0.068 0.077 0.061 0.069 0.083 0.076Belarus 0.036 0.052 0.068 0.077 0.061 0.069 0.083 0.076Kazakhstan 0.036 0.052 0.068 0.077 0.061 0.069 0.083 0.076Dominica 0.036 0.052 0.068 0.077 0.061 0.069 0.083 0.076Latvia 0.036 0.052 0.069 0.077 0.062 0.069 0.084 0.077St. Lucia 0.036 0.053 0.069 0.077 0.062 0.069 0.084 0.077Brazil 0.036 0.053 0.069 0.077 0.062 0.070 0.084 0.077Bulgaria 0.036 0.053 0.069 0.077 0.062 0.070 0.084 0.077Russia 0.036 0.053 0.069 0.078 0.062 0.070 0.084 0.077Fiji 0.036 0.053 0.069 0.078 0.062 0.070 0.084 0.077Grenada 0.036 0.053 0.069 0.078 0.062 0.070 0.084 0.077Turkey 0.035 0.053 0.070 0.078 0.063 0.070 0.084 0.077Lithuania 0.035 0.054 0.070 0.078 0.063 0.071 0.084 0.077Romania 0.035 0.054 0.070 0.078 0.063 0.071 0.084 0.078Iran 0.035 0.054 0.070 0.078 0.063 0.071 0.084 0.078Mexico 0.035 0.054 0.071 0.079 0.064 0.071 0.084 0.078Bahrain 0.035 0.054 0.071 0.079 0.064 0.071 0.084 0.078Chile 0.035 0.054 0.071 0.079 0.064 0.072 0.084 0.078Antigua & Barbuda 0.035 0.054 0.071 0.079 0.064 0.072 0.084 0.078Poland 0.035 0.055 0.071 0.079 0.064 0.072 0.084 0.078Trinidad & Tobago 0.035 0.055 0.071 0.079 0.065 0.072 0.084 0.079Estonia 0.034 0.055 0.072 0.079 0.065 0.072 0.084 0.079Gabon 0.034 0.055 0.072 0.079 0.065 0.072 0.084 0.079Tunisia 0.034 0.055 0.072 0.080 0.065 0.073 0.085 0.079St. Kitts & Nevis 0.034 0.056 0.072 0.080 0.065 0.073 0.085 0.079Uruguay 0.034 0.056 0.072 0.080 0.065 0.073 0.085 0.079Slovakia 0.034 0.056 0.072 0.080 0.066 0.073 0.085 0.079Hungary 0.033 0.056 0.073 0.080 0.066 0.074 0.085 0.080Argentina 0.032 0.057 0.074 0.081 0.067 0.075 0.085 0.080Oman 0.032 0.058 0.074 0.081 0.068 0.075 0.086 0.081Qatar 0.031 0.058 0.075 0.082 0.068 0.075 0.086 0.081Slovenia 0.031 0.058 0.075 0.082 0.069 0.076 0.086 0.081
High-income countries:
Czech Republic 0.031 0.058 0.075 0.082 0.069 0.076 0.086 0.082Greece 0.030 0.059 0.076 0.083 0.070 0.077 0.087 0.082Korea 0.029 0.059 0.076 0.083 0.070 0.077 0.087 0.082Portugal 0.029 0.059 0.076 0.083 0.070 0.077 0.087 0.082Spain 0.029 0.059 0.076 0.083 0.070 0.077 0.087 0.082Ireland 0.028 0.060 0.077 0.083 0.070 0.077 0.087 0.083Singapore 0.028 0.060 0.077 0.083 0.071 0.078 0.087 0.083Mauritius 0.027 0.060 0.077 0.084 0.071 0.078 0.087 0.083Israel 0.027 0.060 0.078 0.084 0.071 0.078 0.088 0.083New Zealand 0.026 0.061 0.078 0.084 0.071 0.078 0.088 0.084
—Continued

48Cross-Price Elasticities of Demand Across 114 Countries / TB-1925
Economic Research Service / USDA
Appendix table 8
Slutsky cross-price elasticity with price change for house furnishings and operations, 114 countries in 19961—Continued
Food, Clothing Gross Transport & beverage, & rent, fuel Medical communica- & tobacco footwear & power care Education tion Recreation2 Other
High-income countries—Continued
Finland 0.026 0.061 0.078 0.084 0.071 0.078 0.088 0.084Bahamas 0.026 0.061 0.078 0.084 0.072 0.078 0.088 0.084Sweden 0.024 0.061 0.079 0.085 0.072 0.079 0.088 0.084Netherlands 0.024 0.061 0.079 0.085 0.072 0.079 0.088 0.084France 0.023 0.062 0.079 0.085 0.073 0.080 0.089 0.085United Kingdom 0.023 0.062 0.079 0.085 0.073 0.080 0.089 0.085Belgium 0.022 0.062 0.079 0.085 0.073 0.080 0.089 0.085Norway 0.022 0.062 0.079 0.085 0.073 0.080 0.089 0.085Italy 0.022 0.062 0.079 0.085 0.073 0.080 0.089 0.085Austria 0.021 0.062 0.080 0.085 0.073 0.080 0.089 0.085Germany 0.021 0.062 0.080 0.085 0.073 0.080 0.089 0.085Australia 0.021 0.062 0.080 0.086 0.074 0.080 0.089 0.085Japan 0.020 0.062 0.080 0.086 0.074 0.080 0.089 0.085Canada 0.020 0.063 0.080 0.086 0.074 0.081 0.089 0.085Bermuda 0.018 0.063 0.080 0.086 0.074 0.081 0.089 0.086Switzerland 0.018 0.063 0.081 0.086 0.074 0.081 0.089 0.086Barbados 0.018 0.063 0.081 0.086 0.074 0.081 0.089 0.086Hong Kong 0.018 0.063 0.081 0.086 0.074 0.081 0.090 0.086Iceland 0.018 0.063 0.081 0.086 0.074 0.081 0.090 0.086Denmark 0.017 0.063 0.081 0.086 0.075 0.081 0.090 0.086Luxembourg 0.009 0.065 0.082 0.088 0.076 0.083 0.091 0.087United States 0.007 0.065 0.083 0.088 0.077 0.083 0.091 0.088
Low-income average 0.034 0.043 0.059 0.076 0.051 0.060 0.102 0.074Middle-income average 0.035 0.053 0.070 0.078 0.063 0.070 0.084 0.077High-income average 0.023 0.061 0.079 0.085 0.073 0.079 0.088 0.0841Countries are reported based on ascending per capita real income levels.2As the estimated budget share was negative for Tanzania we do not report the elasticity for this country.
Source: Authors' calculation using the 1996 ICP data.

49Cross-Price Elasticities of Demand Across 114 Countries / TB-1925
Economic Research Service / USDA
Appendix table 9
Cournot cross-price elasticity with price change for house furnishings and operations, 114 countries in 19961
Food, Clothing Gross Transport & beverage, & rent, fuel, Medical communica- & tobacco footwear & power care Education tion Recreation2 Other
Low-income countries:
Tanzania 0.003 0.003 0.004 0.009 0.003 0.004 0.008Nigeria 0.002 0.002 0.003 0.005 0.003 0.003 0.016 0.005Tajikistan 0.002 0.002 0.003 0.004 0.002 0.003 0.008 0.004Zambia 0.002 0.002 0.003 0.004 0.002 0.003 0.008 0.004Yemen 0.002 0.002 0.003 0.004 0.002 0.003 0.007 0.004Malawi 0.001 0.002 0.002 0.003 0.002 0.002 0.006 0.003Madagascar 0.001 0.002 0.002 0.003 0.002 0.002 0.006 0.003Mali 0.001 0.002 0.002 0.003 0.002 0.002 0.005 0.003Mongolia 0.001 0.002 0.002 0.003 0.002 0.002 0.005 0.003Benin 0.001 0.001 0.002 0.002 0.001 0.002 0.003 0.002Kenya 0.001 0.001 0.001 0.002 0.001 0.001 0.002 0.002Sierra Leone 0.001 0.001 0.001 0.001 0.001 0.001 0.002 0.001Nepal 0.001 0.001 0.001 0.001 0.001 0.001 0.002 0.001Turkmenistan 0.001 0.001 0.001 0.001 0.001 0.001 0.002 0.001Congo 0.000 0.001 0.001 0.001 0.001 0.001 0.001 0.001Senegal 0.000 0.000 0.001 0.001 0.001 0.001 0.001 0.001Vietnam 0.000 0.000 0.001 0.001 0.000 0.001 0.001 0.001Bangladesh 0.000 0.000 0.000 0.001 0.000 0.001 0.001 0.001Pakistan 0.000 0.000 0.000 0.000 0.000 0.000 0.000 0.000Azerbaijan 0.000 0.000 0.000 0.000 0.000 0.000 0.000 0.000Côte d'Ivoire 0.000 0.000 0.000 0.000 0.000 0.000 0.000 0.000Paraguay 0.000 0.000 0.000 0.000 0.000 0.000 0.000 0.000Uzbekistan 0.000 0.000 0.000 0.000 0.000 0.000 0.000 0.000Kyrgyzstan 0.000 0.000 0.000 0.000 0.000 0.000 0.000 0.000Cameroon 0.000 0.000 0.000 0.000 0.000 0.000 0.000 0.000Moldova 0.000 0.000 0.000 0.000 0.000 0.000 0.000 0.000Bolivia 0.000 0.000 0.000 -0.001 0.000 0.000 -0.001 -0.001Ecuador 0.000 0.000 0.000 -0.001 0.000 -0.001 -0.001 -0.001Armenia 0.000 0.000 -0.001 -0.001 -0.001 -0.001 -0.001 -0.001Sri Lanka 0.000 0.000 -0.001 -0.001 -0.001 -0.001 -0.001 -0.001Jordan 0.000 -0.001 -0.001 -0.001 -0.001 -0.001 -0.001 -0.001Albania -0.001 -0.001 -0.001 -0.001 -0.001 -0.001 -0.001 -0.001Indonesia -0.001 -0.001 -0.001 -0.001 -0.001 -0.001 -0.001 -0.001Jamaica -0.001 -0.001 -0.001 -0.001 -0.001 -0.001 -0.001 -0.001Zimbabwe -0.001 -0.001 -0.001 -0.001 -0.001 -0.001 -0.001 -0.001Guinea -0.001 -0.001 -0.001 -0.001 -0.001 -0.001 -0.001 -0.001Syria -0.001 -0.001 -0.001 -0.001 -0.001 -0.001 -0.002 -0.001Georgia -0.001 -0.001 -0.001 -0.002 -0.001 -0.001 -0.002 -0.001
Middle-income countries:
Ukraine -0.001 -0.001 -0.002 -0.002 -0.001 -0.002 -0.002 -0.002Philippines -0.001 -0.001 -0.002 -0.002 -0.002 -0.002 -0.002 -0.002Peru -0.001 -0.001 -0.002 -0.002 -0.002 -0.002 -0.002 -0.002Botswana -0.001 -0.001 -0.002 -0.002 -0.002 -0.002 -0.002 -0.002Thailand -0.001 -0.001 -0.002 -0.002 -0.002 -0.002 -0.002 -0.002Morocco -0.001 -0.001 -0.002 -0.002 -0.002 -0.002 -0.002 -0.002Venezuela -0.001 -0.001 -0.002 -0.002 -0.002 -0.002 -0.002 -0.002Macedonia -0.001 -0.002 -0.002 -0.002 -0.002 -0.002 -0.003 -0.002Belize -0.001 -0.002 -0.002 -0.002 -0.002 -0.002 -0.003 -0.002
—Continued

50Cross-Price Elasticities of Demand Across 114 Countries / TB-1925
Economic Research Service / USDA
Appendix table 9
Cournot cross-price elasticity with price change for house furnishings and operations, 114 countries in 19961—Continued
Food, Clothing Gross Transport & beverage, & rent, fuel, Medical communica- & tobacco footwear & power care Education tion Recreation2 Other
Middle-income countries—Continued
Egypt -0.001 -0.002 -0.002 -0.002 -0.002 -0.002 -0.003 -0.002St. Vincent & Grenadines -0.001 -0.002 -0.002 -0.002 -0.002 -0.002 -0.003 -0.002Swaziland -0.001 -0.002 -0.002 -0.002 -0.002 -0.002 -0.003 -0.002Lebanon -0.001 -0.002 -0.002 -0.003 -0.002 -0.002 -0.003 -0.003Belarus -0.001 -0.002 -0.002 -0.003 -0.002 -0.002 -0.003 -0.003Kazakhstan -0.001 -0.002 -0.002 -0.003 -0.002 -0.002 -0.003 -0.003Dominica -0.001 -0.002 -0.002 -0.003 -0.002 -0.002 -0.003 -0.003Latvia -0.001 -0.002 -0.002 -0.003 -0.002 -0.002 -0.003 -0.003St. Lucia -0.001 -0.002 -0.002 -0.003 -0.002 -0.002 -0.003 -0.003Brazil -0.001 -0.002 -0.002 -0.003 -0.002 -0.002 -0.003 -0.003Bulgaria -0.001 -0.002 -0.002 -0.003 -0.002 -0.002 -0.003 -0.003Russia -0.001 -0.002 -0.003 -0.003 -0.002 -0.003 -0.003 -0.003Fiji -0.001 -0.002 -0.003 -0.003 -0.002 -0.003 -0.003 -0.003Grenada -0.001 -0.002 -0.003 -0.003 -0.002 -0.003 -0.003 -0.003Turkey -0.001 -0.002 -0.003 -0.003 -0.002 -0.003 -0.003 -0.003Lithuania -0.001 -0.002 -0.003 -0.003 -0.002 -0.003 -0.003 -0.003Romania -0.001 -0.002 -0.003 -0.003 -0.003 -0.003 -0.003 -0.003Iran -0.001 -0.002 -0.003 -0.003 -0.003 -0.003 -0.003 -0.003Mexico -0.001 -0.002 -0.003 -0.003 -0.003 -0.003 -0.004 -0.003Bahrain -0.001 -0.002 -0.003 -0.003 -0.003 -0.003 -0.004 -0.003Chile -0.001 -0.002 -0.003 -0.003 -0.003 -0.003 -0.004 -0.003Antigua & Barbuda -0.002 -0.002 -0.003 -0.003 -0.003 -0.003 -0.004 -0.003Poland -0.002 -0.002 -0.003 -0.003 -0.003 -0.003 -0.004 -0.003Trinidad & Tobago -0.002 -0.002 -0.003 -0.004 -0.003 -0.003 -0.004 -0.004Estonia -0.002 -0.003 -0.003 -0.004 -0.003 -0.003 -0.004 -0.004Gabon -0.002 -0.003 -0.003 -0.004 -0.003 -0.003 -0.004 -0.004Tunisia -0.002 -0.003 -0.003 -0.004 -0.003 -0.003 -0.004 -0.004St. Kitts & Nevis -0.002 -0.003 -0.003 -0.004 -0.003 -0.003 -0.004 -0.004Uruguay -0.002 -0.003 -0.003 -0.004 -0.003 -0.003 -0.004 -0.004Slovakia -0.002 -0.003 -0.003 -0.004 -0.003 -0.003 -0.004 -0.004Hungary -0.002 -0.003 -0.004 -0.004 -0.003 -0.004 -0.004 -0.004Argentina -0.002 -0.003 -0.004 -0.004 -0.004 -0.004 -0.005 -0.004Oman -0.002 -0.003 -0.004 -0.004 -0.004 -0.004 -0.005 -0.004Qatar -0.002 -0.003 -0.004 -0.005 -0.004 -0.004 -0.005 -0.005Slovenia -0.002 -0.003 -0.004 -0.005 -0.004 -0.004 -0.005 -0.005
High-income countries:
Czech Republic -0.002 -0.003 -0.004 -0.005 -0.004 -0.004 -0.005 -0.005Greece -0.002 -0.003 -0.004 -0.005 -0.004 -0.005 -0.005 -0.005Korea -0.002 -0.004 -0.005 -0.005 -0.004 -0.005 -0.005 -0.005Portugal -0.002 -0.004 -0.005 -0.005 -0.004 -0.005 -0.005 -0.005Spain -0.002 -0.004 -0.005 -0.005 -0.004 -0.005 -0.005 -0.005Ireland -0.002 -0.004 -0.005 -0.005 -0.004 -0.005 -0.005 -0.005Singapore -0.002 -0.004 -0.005 -0.005 -0.004 -0.005 -0.005 -0.005Mauritius -0.002 -0.004 -0.005 -0.005 -0.004 -0.005 -0.005 -0.005Israel -0.002 -0.004 -0.005 -0.005 -0.005 -0.005 -0.006 -0.005New Zealand -0.002 -0.004 -0.005 -0.005 -0.005 -0.005 -0.006 -0.005
—Continued
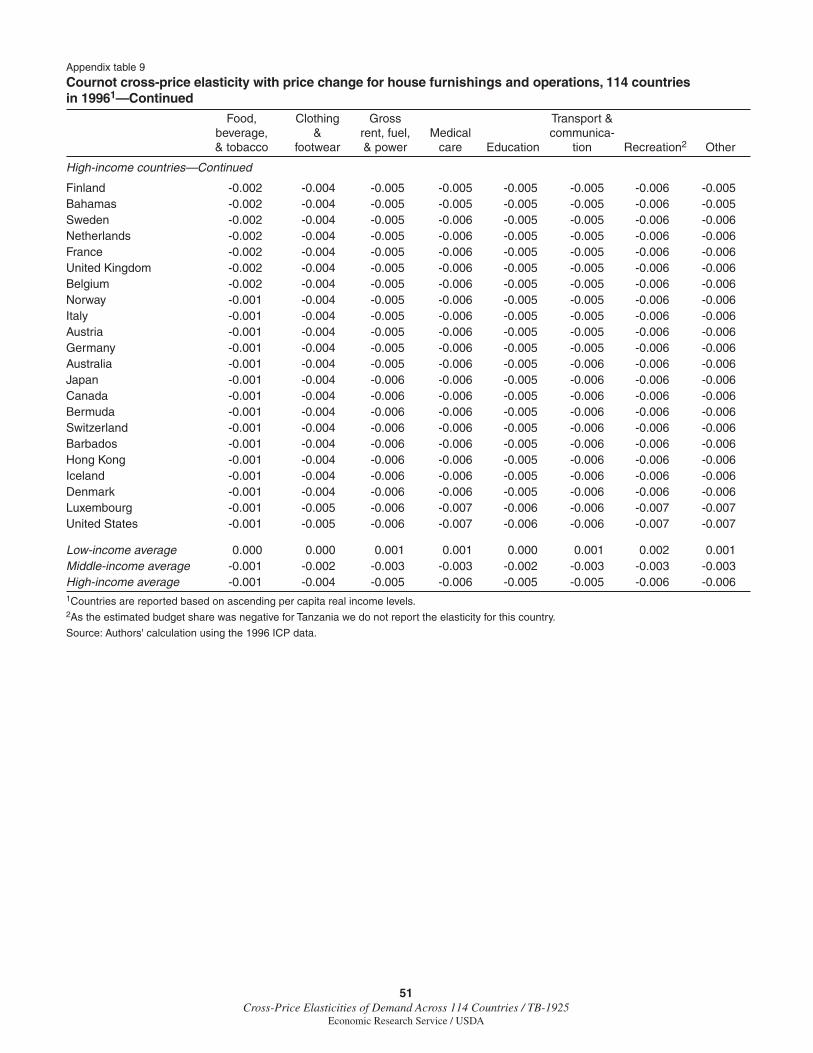
51Cross-Price Elasticities of Demand Across 114 Countries / TB-1925
Economic Research Service / USDA
Appendix table 9
Cournot cross-price elasticity with price change for house furnishings and operations, 114 countries in 19961—Continued
Food, Clothing Gross Transport & beverage, & rent, fuel, Medical communica- & tobacco footwear & power care Education tion Recreation2 Other
High-income countries—Continued
Finland -0.002 -0.004 -0.005 -0.005 -0.005 -0.005 -0.006 -0.005Bahamas -0.002 -0.004 -0.005 -0.005 -0.005 -0.005 -0.006 -0.005Sweden -0.002 -0.004 -0.005 -0.006 -0.005 -0.005 -0.006 -0.006Netherlands -0.002 -0.004 -0.005 -0.006 -0.005 -0.005 -0.006 -0.006France -0.002 -0.004 -0.005 -0.006 -0.005 -0.005 -0.006 -0.006United Kingdom -0.002 -0.004 -0.005 -0.006 -0.005 -0.005 -0.006 -0.006Belgium -0.002 -0.004 -0.005 -0.006 -0.005 -0.005 -0.006 -0.006Norway -0.001 -0.004 -0.005 -0.006 -0.005 -0.005 -0.006 -0.006Italy -0.001 -0.004 -0.005 -0.006 -0.005 -0.005 -0.006 -0.006Austria -0.001 -0.004 -0.005 -0.006 -0.005 -0.005 -0.006 -0.006Germany -0.001 -0.004 -0.005 -0.006 -0.005 -0.005 -0.006 -0.006Australia -0.001 -0.004 -0.005 -0.006 -0.005 -0.006 -0.006 -0.006Japan -0.001 -0.004 -0.006 -0.006 -0.005 -0.006 -0.006 -0.006Canada -0.001 -0.004 -0.006 -0.006 -0.005 -0.006 -0.006 -0.006Bermuda -0.001 -0.004 -0.006 -0.006 -0.005 -0.006 -0.006 -0.006Switzerland -0.001 -0.004 -0.006 -0.006 -0.005 -0.006 -0.006 -0.006Barbados -0.001 -0.004 -0.006 -0.006 -0.005 -0.006 -0.006 -0.006Hong Kong -0.001 -0.004 -0.006 -0.006 -0.005 -0.006 -0.006 -0.006Iceland -0.001 -0.004 -0.006 -0.006 -0.005 -0.006 -0.006 -0.006Denmark -0.001 -0.004 -0.006 -0.006 -0.005 -0.006 -0.006 -0.006Luxembourg -0.001 -0.005 -0.006 -0.007 -0.006 -0.006 -0.007 -0.007United States -0.001 -0.005 -0.006 -0.007 -0.006 -0.006 -0.007 -0.007
Low-income average 0.000 0.000 0.001 0.001 0.000 0.001 0.002 0.001Middle-income average -0.001 -0.002 -0.003 -0.003 -0.002 -0.003 -0.003 -0.003High-income average -0.001 -0.004 -0.005 -0.006 -0.005 -0.005 -0.006 -0.0061Countries are reported based on ascending per capita real income levels.2As the estimated budget share was negative for Tanzania we do not report the elasticity for this country.
Source: Authors' calculation using the 1996 ICP data.
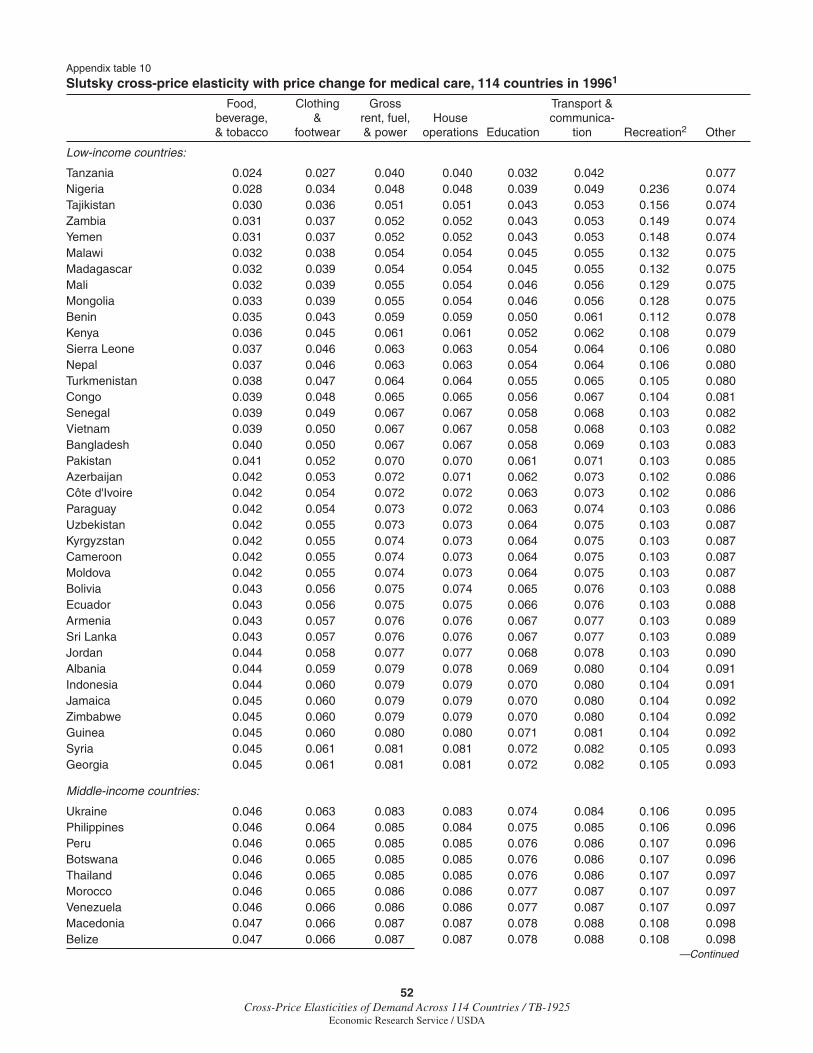
52Cross-Price Elasticities of Demand Across 114 Countries / TB-1925
Economic Research Service / USDA
Appendix table 10
Slutsky cross-price elasticity with price change for medical care, 114 countries in 19961
Food, Clothing Gross Transport & beverage, & rent, fuel, House communica- & tobacco footwear & power operations Education tion Recreation2 Other
Low-income countries:
Tanzania 0.024 0.027 0.040 0.040 0.032 0.042 0.077Nigeria 0.028 0.034 0.048 0.048 0.039 0.049 0.236 0.074Tajikistan 0.030 0.036 0.051 0.051 0.043 0.053 0.156 0.074Zambia 0.031 0.037 0.052 0.052 0.043 0.053 0.149 0.074Yemen 0.031 0.037 0.052 0.052 0.043 0.053 0.148 0.074Malawi 0.032 0.038 0.054 0.054 0.045 0.055 0.132 0.075Madagascar 0.032 0.039 0.054 0.054 0.045 0.055 0.132 0.075Mali 0.032 0.039 0.055 0.054 0.046 0.056 0.129 0.075Mongolia 0.033 0.039 0.055 0.054 0.046 0.056 0.128 0.075Benin 0.035 0.043 0.059 0.059 0.050 0.061 0.112 0.078Kenya 0.036 0.045 0.061 0.061 0.052 0.062 0.108 0.079Sierra Leone 0.037 0.046 0.063 0.063 0.054 0.064 0.106 0.080Nepal 0.037 0.046 0.063 0.063 0.054 0.064 0.106 0.080Turkmenistan 0.038 0.047 0.064 0.064 0.055 0.065 0.105 0.080Congo 0.039 0.048 0.065 0.065 0.056 0.067 0.104 0.081Senegal 0.039 0.049 0.067 0.067 0.058 0.068 0.103 0.082Vietnam 0.039 0.050 0.067 0.067 0.058 0.068 0.103 0.082Bangladesh 0.040 0.050 0.067 0.067 0.058 0.069 0.103 0.083Pakistan 0.041 0.052 0.070 0.070 0.061 0.071 0.103 0.085Azerbaijan 0.042 0.053 0.072 0.071 0.062 0.073 0.102 0.086Côte d'Ivoire 0.042 0.054 0.072 0.072 0.063 0.073 0.102 0.086Paraguay 0.042 0.054 0.073 0.072 0.063 0.074 0.103 0.086Uzbekistan 0.042 0.055 0.073 0.073 0.064 0.075 0.103 0.087Kyrgyzstan 0.042 0.055 0.074 0.073 0.064 0.075 0.103 0.087Cameroon 0.042 0.055 0.074 0.073 0.064 0.075 0.103 0.087Moldova 0.042 0.055 0.074 0.073 0.064 0.075 0.103 0.087Bolivia 0.043 0.056 0.075 0.074 0.065 0.076 0.103 0.088Ecuador 0.043 0.056 0.075 0.075 0.066 0.076 0.103 0.088Armenia 0.043 0.057 0.076 0.076 0.067 0.077 0.103 0.089Sri Lanka 0.043 0.057 0.076 0.076 0.067 0.077 0.103 0.089Jordan 0.044 0.058 0.077 0.077 0.068 0.078 0.103 0.090Albania 0.044 0.059 0.079 0.078 0.069 0.080 0.104 0.091Indonesia 0.044 0.060 0.079 0.079 0.070 0.080 0.104 0.091Jamaica 0.045 0.060 0.079 0.079 0.070 0.080 0.104 0.092Zimbabwe 0.045 0.060 0.079 0.079 0.070 0.080 0.104 0.092Guinea 0.045 0.060 0.080 0.080 0.071 0.081 0.104 0.092Syria 0.045 0.061 0.081 0.081 0.072 0.082 0.105 0.093Georgia 0.045 0.061 0.081 0.081 0.072 0.082 0.105 0.093
Middle-income countries:
Ukraine 0.046 0.063 0.083 0.083 0.074 0.084 0.106 0.095Philippines 0.046 0.064 0.085 0.084 0.075 0.085 0.106 0.096Peru 0.046 0.065 0.085 0.085 0.076 0.086 0.107 0.096Botswana 0.046 0.065 0.085 0.085 0.076 0.086 0.107 0.096Thailand 0.046 0.065 0.085 0.085 0.076 0.086 0.107 0.097Morocco 0.046 0.065 0.086 0.086 0.077 0.087 0.107 0.097Venezuela 0.046 0.066 0.086 0.086 0.077 0.087 0.107 0.097Macedonia 0.047 0.066 0.087 0.087 0.078 0.088 0.108 0.098Belize 0.047 0.066 0.087 0.087 0.078 0.088 0.108 0.098
—Continued
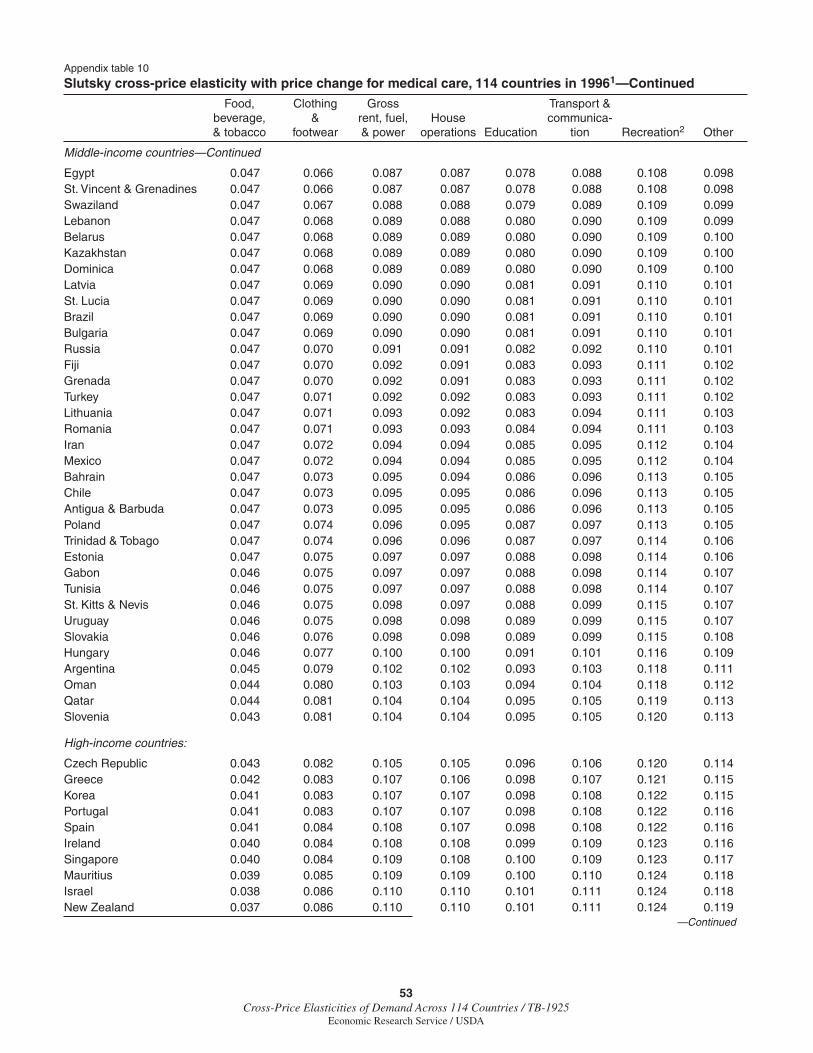
53Cross-Price Elasticities of Demand Across 114 Countries / TB-1925
Economic Research Service / USDA
Appendix table 10
Slutsky cross-price elasticity with price change for medical care, 114 countries in 19961—Continued
Food, Clothing Gross Transport & beverage, & rent, fuel, House communica- & tobacco footwear & power operations Education tion Recreation2 Other
Middle-income countries—Continued
Egypt 0.047 0.066 0.087 0.087 0.078 0.088 0.108 0.098St. Vincent & Grenadines 0.047 0.066 0.087 0.087 0.078 0.088 0.108 0.098Swaziland 0.047 0.067 0.088 0.088 0.079 0.089 0.109 0.099Lebanon 0.047 0.068 0.089 0.088 0.080 0.090 0.109 0.099Belarus 0.047 0.068 0.089 0.089 0.080 0.090 0.109 0.100Kazakhstan 0.047 0.068 0.089 0.089 0.080 0.090 0.109 0.100Dominica 0.047 0.068 0.089 0.089 0.080 0.090 0.109 0.100Latvia 0.047 0.069 0.090 0.090 0.081 0.091 0.110 0.101St. Lucia 0.047 0.069 0.090 0.090 0.081 0.091 0.110 0.101Brazil 0.047 0.069 0.090 0.090 0.081 0.091 0.110 0.101Bulgaria 0.047 0.069 0.090 0.090 0.081 0.091 0.110 0.101Russia 0.047 0.070 0.091 0.091 0.082 0.092 0.110 0.101Fiji 0.047 0.070 0.092 0.091 0.083 0.093 0.111 0.102Grenada 0.047 0.070 0.092 0.091 0.083 0.093 0.111 0.102Turkey 0.047 0.071 0.092 0.092 0.083 0.093 0.111 0.102Lithuania 0.047 0.071 0.093 0.092 0.083 0.094 0.111 0.103Romania 0.047 0.071 0.093 0.093 0.084 0.094 0.111 0.103Iran 0.047 0.072 0.094 0.094 0.085 0.095 0.112 0.104Mexico 0.047 0.072 0.094 0.094 0.085 0.095 0.112 0.104Bahrain 0.047 0.073 0.095 0.094 0.086 0.096 0.113 0.105Chile 0.047 0.073 0.095 0.095 0.086 0.096 0.113 0.105Antigua & Barbuda 0.047 0.073 0.095 0.095 0.086 0.096 0.113 0.105Poland 0.047 0.074 0.096 0.095 0.087 0.097 0.113 0.105Trinidad & Tobago 0.047 0.074 0.096 0.096 0.087 0.097 0.114 0.106Estonia 0.047 0.075 0.097 0.097 0.088 0.098 0.114 0.106Gabon 0.046 0.075 0.097 0.097 0.088 0.098 0.114 0.107Tunisia 0.046 0.075 0.097 0.097 0.088 0.098 0.114 0.107St. Kitts & Nevis 0.046 0.075 0.098 0.097 0.088 0.099 0.115 0.107Uruguay 0.046 0.075 0.098 0.098 0.089 0.099 0.115 0.107Slovakia 0.046 0.076 0.098 0.098 0.089 0.099 0.115 0.108Hungary 0.046 0.077 0.100 0.100 0.091 0.101 0.116 0.109Argentina 0.045 0.079 0.102 0.102 0.093 0.103 0.118 0.111Oman 0.044 0.080 0.103 0.103 0.094 0.104 0.118 0.112Qatar 0.044 0.081 0.104 0.104 0.095 0.105 0.119 0.113Slovenia 0.043 0.081 0.104 0.104 0.095 0.105 0.120 0.113
High-income countries:
Czech Republic 0.043 0.082 0.105 0.105 0.096 0.106 0.120 0.114Greece 0.042 0.083 0.107 0.106 0.098 0.107 0.121 0.115Korea 0.041 0.083 0.107 0.107 0.098 0.108 0.122 0.115Portugal 0.041 0.083 0.107 0.107 0.098 0.108 0.122 0.116Spain 0.041 0.084 0.108 0.107 0.098 0.108 0.122 0.116Ireland 0.040 0.084 0.108 0.108 0.099 0.109 0.123 0.116Singapore 0.040 0.084 0.109 0.108 0.100 0.109 0.123 0.117Mauritius 0.039 0.085 0.109 0.109 0.100 0.110 0.124 0.118Israel 0.038 0.086 0.110 0.110 0.101 0.111 0.124 0.118New Zealand 0.037 0.086 0.110 0.110 0.101 0.111 0.124 0.119
—Continued
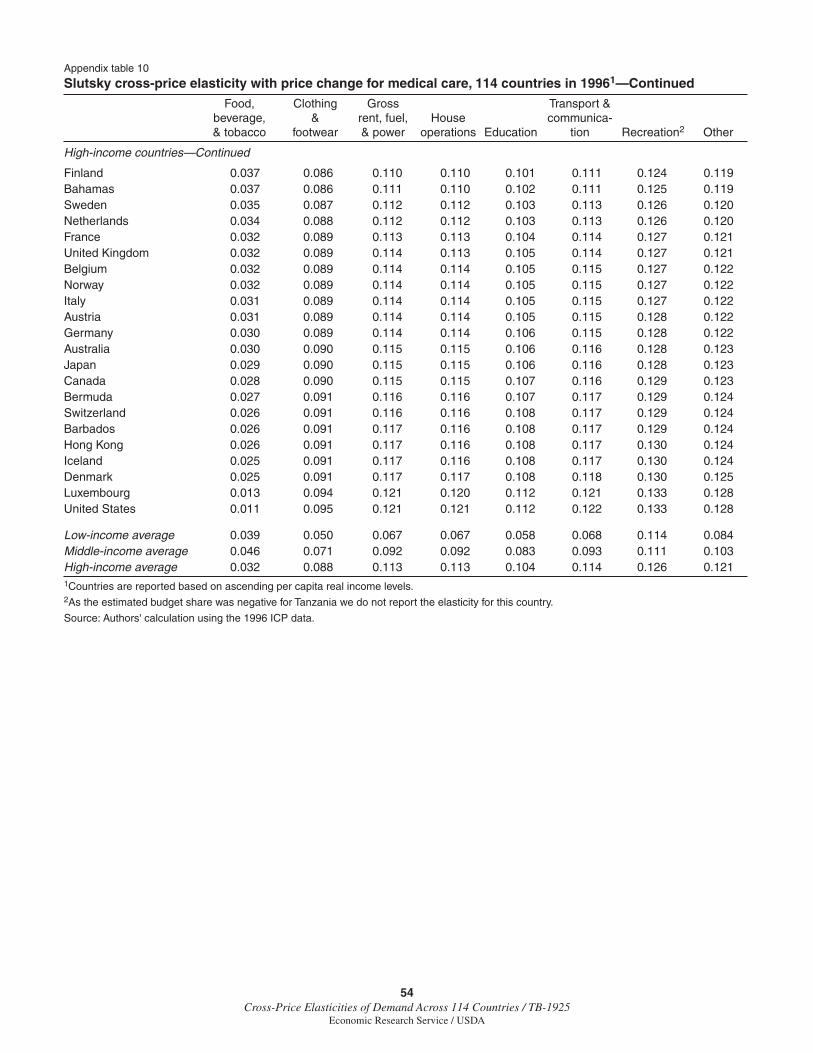
54Cross-Price Elasticities of Demand Across 114 Countries / TB-1925
Economic Research Service / USDA
Appendix table 10
Slutsky cross-price elasticity with price change for medical care, 114 countries in 19961—Continued
Food, Clothing Gross Transport & beverage, & rent, fuel, House communica- & tobacco footwear & power operations Education tion Recreation2 Other
High-income countries—Continued
Finland 0.037 0.086 0.110 0.110 0.101 0.111 0.124 0.119Bahamas 0.037 0.086 0.111 0.110 0.102 0.111 0.125 0.119Sweden 0.035 0.087 0.112 0.112 0.103 0.113 0.126 0.120Netherlands 0.034 0.088 0.112 0.112 0.103 0.113 0.126 0.120France 0.032 0.089 0.113 0.113 0.104 0.114 0.127 0.121United Kingdom 0.032 0.089 0.114 0.113 0.105 0.114 0.127 0.121Belgium 0.032 0.089 0.114 0.114 0.105 0.115 0.127 0.122Norway 0.032 0.089 0.114 0.114 0.105 0.115 0.127 0.122Italy 0.031 0.089 0.114 0.114 0.105 0.115 0.127 0.122Austria 0.031 0.089 0.114 0.114 0.105 0.115 0.128 0.122Germany 0.030 0.089 0.114 0.114 0.106 0.115 0.128 0.122Australia 0.030 0.090 0.115 0.115 0.106 0.116 0.128 0.123Japan 0.029 0.090 0.115 0.115 0.106 0.116 0.128 0.123Canada 0.028 0.090 0.115 0.115 0.107 0.116 0.129 0.123Bermuda 0.027 0.091 0.116 0.116 0.107 0.117 0.129 0.124Switzerland 0.026 0.091 0.116 0.116 0.108 0.117 0.129 0.124Barbados 0.026 0.091 0.117 0.116 0.108 0.117 0.129 0.124Hong Kong 0.026 0.091 0.117 0.116 0.108 0.117 0.130 0.124Iceland 0.025 0.091 0.117 0.116 0.108 0.117 0.130 0.124Denmark 0.025 0.091 0.117 0.117 0.108 0.118 0.130 0.125Luxembourg 0.013 0.094 0.121 0.120 0.112 0.121 0.133 0.128United States 0.011 0.095 0.121 0.121 0.112 0.122 0.133 0.128
Low-income average 0.039 0.050 0.067 0.067 0.058 0.068 0.114 0.084Middle-income average 0.046 0.071 0.092 0.092 0.083 0.093 0.111 0.103High-income average 0.032 0.088 0.113 0.113 0.104 0.114 0.126 0.1211Countries are reported based on ascending per capita real income levels.2As the estimated budget share was negative for Tanzania we do not report the elasticity for this country.
Source: Authors' calculation using the 1996 ICP data.

55Cross-Price Elasticities of Demand Across 114 Countries / TB-1925
Economic Research Service / USDA
Appendix table 11
Cournot cross-price elasticity with price change for medical care, 114 countries in 19961
Food, Clothing Gross Transport & beverage, & rent, fuel, House communica- & tobacco footwear & power operations Education tion Recreation2 Other
Low-income countries:
Tanzania 0.014 0.016 0.023 0.023 0.019 0.024 0.045Nigeria 0.012 0.014 0.021 0.020 0.017 0.021 0.101 0.032Tajikistan 0.012 0.014 0.019 0.019 0.016 0.020 0.059 0.028Zambia 0.011 0.014 0.019 0.019 0.016 0.020 0.055 0.027Yemen 0.011 0.014 0.019 0.019 0.016 0.020 0.055 0.027Malawi 0.011 0.013 0.018 0.018 0.015 0.019 0.045 0.026Madagascar 0.011 0.013 0.018 0.018 0.015 0.019 0.045 0.026Mali 0.011 0.013 0.018 0.018 0.015 0.019 0.043 0.025Mongolia 0.011 0.013 0.018 0.018 0.015 0.019 0.043 0.025Benin 0.010 0.012 0.017 0.017 0.014 0.017 0.032 0.022Kenya 0.010 0.012 0.016 0.016 0.014 0.016 0.028 0.021Sierra Leone 0.009 0.011 0.016 0.015 0.013 0.016 0.026 0.020Nepal 0.009 0.011 0.016 0.015 0.013 0.016 0.026 0.020Turkmenistan 0.009 0.011 0.015 0.015 0.013 0.016 0.025 0.019Congo 0.009 0.011 0.015 0.015 0.013 0.015 0.024 0.018Senegal 0.008 0.011 0.014 0.014 0.012 0.015 0.022 0.018Vietnam 0.008 0.010 0.014 0.014 0.012 0.014 0.022 0.017Bangladesh 0.008 0.010 0.014 0.014 0.012 0.014 0.022 0.017Pakistan 0.008 0.010 0.013 0.013 0.012 0.013 0.019 0.016Azerbaijan 0.007 0.010 0.013 0.013 0.011 0.013 0.018 0.015Côte d'Ivoire 0.007 0.009 0.013 0.013 0.011 0.013 0.018 0.015Paraguay 0.007 0.009 0.013 0.013 0.011 0.013 0.018 0.015Uzbekistan 0.007 0.009 0.012 0.012 0.011 0.013 0.017 0.015Kyrgyzstan 0.007 0.009 0.012 0.012 0.011 0.013 0.017 0.015Cameroon 0.007 0.009 0.012 0.012 0.011 0.012 0.017 0.015Moldova 0.007 0.009 0.012 0.012 0.011 0.012 0.017 0.015Bolivia 0.007 0.009 0.012 0.012 0.011 0.012 0.017 0.014Ecuador 0.007 0.009 0.012 0.012 0.010 0.012 0.016 0.014Armenia 0.007 0.009 0.012 0.012 0.010 0.012 0.016 0.014Sri Lanka 0.007 0.009 0.012 0.012 0.010 0.012 0.016 0.014Jordan 0.006 0.008 0.011 0.011 0.010 0.011 0.015 0.013Albania 0.006 0.008 0.011 0.011 0.010 0.011 0.014 0.013Indonesia 0.006 0.008 0.011 0.011 0.009 0.011 0.014 0.012Jamaica 0.006 0.008 0.011 0.011 0.009 0.011 0.014 0.012Zimbabwe 0.006 0.008 0.011 0.011 0.009 0.011 0.014 0.012Guinea 0.006 0.008 0.010 0.010 0.009 0.011 0.014 0.012Syria 0.006 0.008 0.010 0.010 0.009 0.010 0.013 0.012Georgia 0.006 0.008 0.010 0.010 0.009 0.010 0.013 0.012
Middle-income countries:
Ukraine 0.005 0.007 0.009 0.009 0.008 0.010 0.012 0.011Philippines 0.005 0.007 0.009 0.009 0.008 0.009 0.011 0.010Peru 0.005 0.007 0.009 0.009 0.008 0.009 0.011 0.010Botswana 0.005 0.007 0.009 0.009 0.008 0.009 0.011 0.010Thailand 0.005 0.007 0.009 0.009 0.008 0.009 0.011 0.010Morocco 0.005 0.007 0.009 0.009 0.008 0.009 0.011 0.010Venezuela 0.005 0.007 0.009 0.009 0.008 0.009 0.011 0.010Macedonia 0.004 0.006 0.008 0.008 0.007 0.008 0.010 0.009Belize 0.004 0.006 0.008 0.008 0.007 0.008 0.010 0.009
—Continued
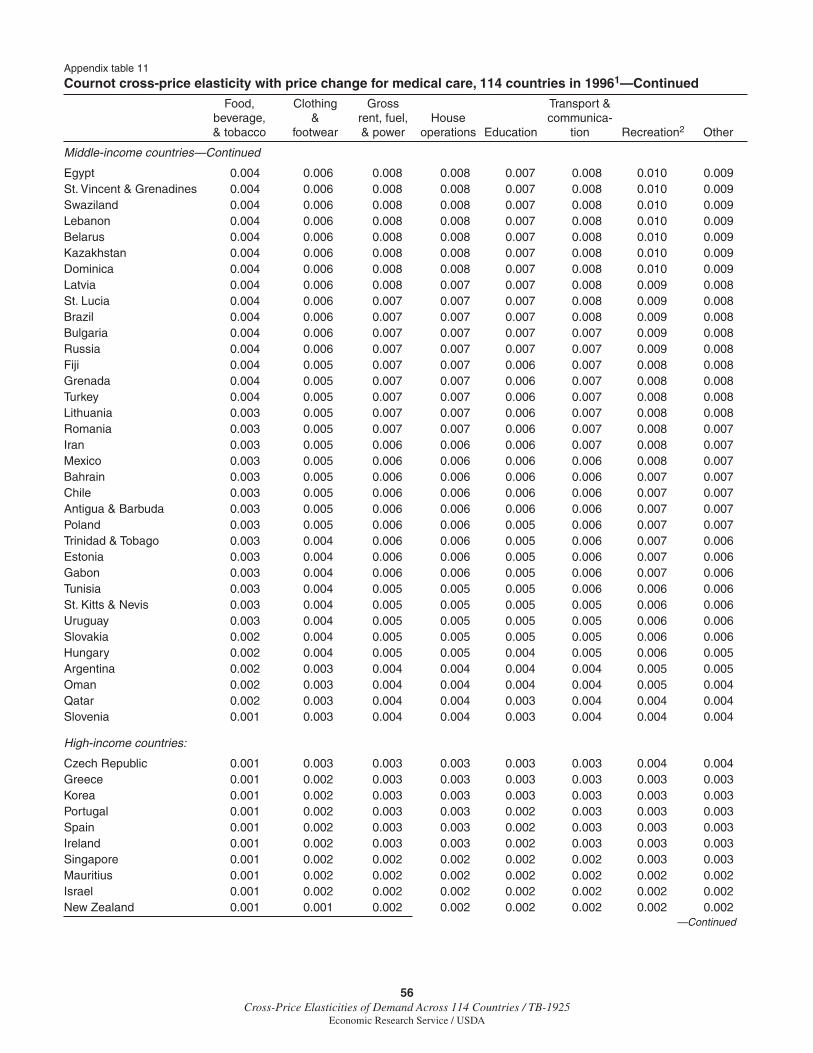
56Cross-Price Elasticities of Demand Across 114 Countries / TB-1925
Economic Research Service / USDA
Appendix table 11
Cournot cross-price elasticity with price change for medical care, 114 countries in 19961—Continued
Food, Clothing Gross Transport & beverage, & rent, fuel, House communica- & tobacco footwear & power operations Education tion Recreation2 Other
Middle-income countries—Continued
Egypt 0.004 0.006 0.008 0.008 0.007 0.008 0.010 0.009St. Vincent & Grenadines 0.004 0.006 0.008 0.008 0.007 0.008 0.010 0.009Swaziland 0.004 0.006 0.008 0.008 0.007 0.008 0.010 0.009Lebanon 0.004 0.006 0.008 0.008 0.007 0.008 0.010 0.009Belarus 0.004 0.006 0.008 0.008 0.007 0.008 0.010 0.009Kazakhstan 0.004 0.006 0.008 0.008 0.007 0.008 0.010 0.009Dominica 0.004 0.006 0.008 0.008 0.007 0.008 0.010 0.009Latvia 0.004 0.006 0.008 0.007 0.007 0.008 0.009 0.008St. Lucia 0.004 0.006 0.007 0.007 0.007 0.008 0.009 0.008Brazil 0.004 0.006 0.007 0.007 0.007 0.008 0.009 0.008Bulgaria 0.004 0.006 0.007 0.007 0.007 0.007 0.009 0.008Russia 0.004 0.006 0.007 0.007 0.007 0.007 0.009 0.008Fiji 0.004 0.005 0.007 0.007 0.006 0.007 0.008 0.008Grenada 0.004 0.005 0.007 0.007 0.006 0.007 0.008 0.008Turkey 0.004 0.005 0.007 0.007 0.006 0.007 0.008 0.008Lithuania 0.003 0.005 0.007 0.007 0.006 0.007 0.008 0.008Romania 0.003 0.005 0.007 0.007 0.006 0.007 0.008 0.007Iran 0.003 0.005 0.006 0.006 0.006 0.007 0.008 0.007Mexico 0.003 0.005 0.006 0.006 0.006 0.006 0.008 0.007Bahrain 0.003 0.005 0.006 0.006 0.006 0.006 0.007 0.007Chile 0.003 0.005 0.006 0.006 0.006 0.006 0.007 0.007Antigua & Barbuda 0.003 0.005 0.006 0.006 0.006 0.006 0.007 0.007Poland 0.003 0.005 0.006 0.006 0.005 0.006 0.007 0.007Trinidad & Tobago 0.003 0.004 0.006 0.006 0.005 0.006 0.007 0.006Estonia 0.003 0.004 0.006 0.006 0.005 0.006 0.007 0.006Gabon 0.003 0.004 0.006 0.006 0.005 0.006 0.007 0.006Tunisia 0.003 0.004 0.005 0.005 0.005 0.006 0.006 0.006St. Kitts & Nevis 0.003 0.004 0.005 0.005 0.005 0.005 0.006 0.006Uruguay 0.003 0.004 0.005 0.005 0.005 0.005 0.006 0.006Slovakia 0.002 0.004 0.005 0.005 0.005 0.005 0.006 0.006Hungary 0.002 0.004 0.005 0.005 0.004 0.005 0.006 0.005Argentina 0.002 0.003 0.004 0.004 0.004 0.004 0.005 0.005Oman 0.002 0.003 0.004 0.004 0.004 0.004 0.005 0.004Qatar 0.002 0.003 0.004 0.004 0.003 0.004 0.004 0.004Slovenia 0.001 0.003 0.004 0.004 0.003 0.004 0.004 0.004
High-income countries:
Czech Republic 0.001 0.003 0.003 0.003 0.003 0.003 0.004 0.004Greece 0.001 0.002 0.003 0.003 0.003 0.003 0.003 0.003Korea 0.001 0.002 0.003 0.003 0.003 0.003 0.003 0.003Portugal 0.001 0.002 0.003 0.003 0.002 0.003 0.003 0.003Spain 0.001 0.002 0.003 0.003 0.002 0.003 0.003 0.003Ireland 0.001 0.002 0.003 0.003 0.002 0.003 0.003 0.003Singapore 0.001 0.002 0.002 0.002 0.002 0.002 0.003 0.003Mauritius 0.001 0.002 0.002 0.002 0.002 0.002 0.002 0.002Israel 0.001 0.002 0.002 0.002 0.002 0.002 0.002 0.002New Zealand 0.001 0.001 0.002 0.002 0.002 0.002 0.002 0.002
—Continued
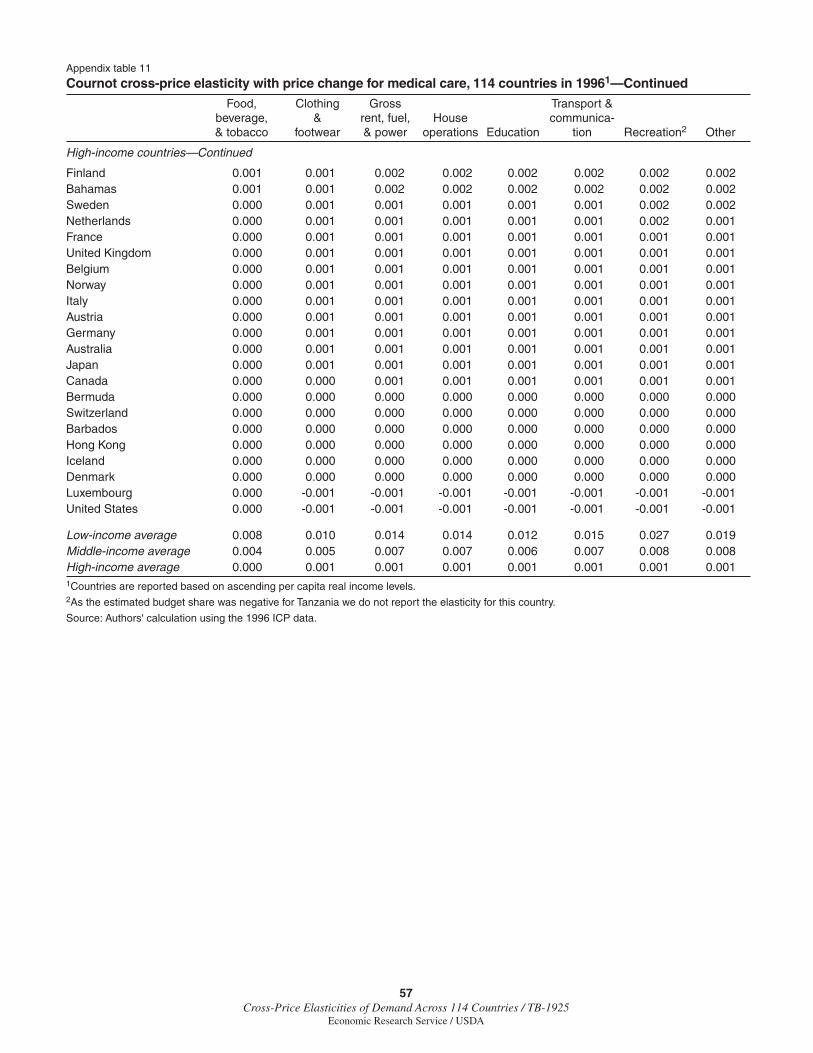
57Cross-Price Elasticities of Demand Across 114 Countries / TB-1925
Economic Research Service / USDA
Appendix table 11
Cournot cross-price elasticity with price change for medical care, 114 countries in 19961—Continued
Food, Clothing Gross Transport & beverage, & rent, fuel, House communica- & tobacco footwear & power operations Education tion Recreation2 Other
High-income countries—Continued
Finland 0.001 0.001 0.002 0.002 0.002 0.002 0.002 0.002Bahamas 0.001 0.001 0.002 0.002 0.002 0.002 0.002 0.002Sweden 0.000 0.001 0.001 0.001 0.001 0.001 0.002 0.002Netherlands 0.000 0.001 0.001 0.001 0.001 0.001 0.002 0.001France 0.000 0.001 0.001 0.001 0.001 0.001 0.001 0.001United Kingdom 0.000 0.001 0.001 0.001 0.001 0.001 0.001 0.001Belgium 0.000 0.001 0.001 0.001 0.001 0.001 0.001 0.001Norway 0.000 0.001 0.001 0.001 0.001 0.001 0.001 0.001Italy 0.000 0.001 0.001 0.001 0.001 0.001 0.001 0.001Austria 0.000 0.001 0.001 0.001 0.001 0.001 0.001 0.001Germany 0.000 0.001 0.001 0.001 0.001 0.001 0.001 0.001Australia 0.000 0.001 0.001 0.001 0.001 0.001 0.001 0.001Japan 0.000 0.001 0.001 0.001 0.001 0.001 0.001 0.001Canada 0.000 0.000 0.001 0.001 0.001 0.001 0.001 0.001Bermuda 0.000 0.000 0.000 0.000 0.000 0.000 0.000 0.000Switzerland 0.000 0.000 0.000 0.000 0.000 0.000 0.000 0.000Barbados 0.000 0.000 0.000 0.000 0.000 0.000 0.000 0.000Hong Kong 0.000 0.000 0.000 0.000 0.000 0.000 0.000 0.000Iceland 0.000 0.000 0.000 0.000 0.000 0.000 0.000 0.000Denmark 0.000 0.000 0.000 0.000 0.000 0.000 0.000 0.000Luxembourg 0.000 -0.001 -0.001 -0.001 -0.001 -0.001 -0.001 -0.001United States 0.000 -0.001 -0.001 -0.001 -0.001 -0.001 -0.001 -0.001
Low-income average 0.008 0.010 0.014 0.014 0.012 0.015 0.027 0.019Middle-income average 0.004 0.005 0.007 0.007 0.006 0.007 0.008 0.008High-income average 0.000 0.001 0.001 0.001 0.001 0.001 0.001 0.0011Countries are reported based on ascending per capita real income levels.2As the estimated budget share was negative for Tanzania we do not report the elasticity for this country.
Source: Authors' calculation using the 1996 ICP data.

58Cross-Price Elasticities of Demand Across 114 Countries / TB-1925
Economic Research Service / USDA
Appendix table 12
Slutsky cross-price elasticity with price change for education, 114 countries in 19961
Food, Clothing Gross Transport & beverage, & rent, fuel, House Medical communica- & tobacco footwear & power operations care tion Recreation2 Other
Low-income countries:
Tanzania 0.038 0.045 0.066 0.065 0.142 0.068 0.126Nigeria 0.039 0.046 0.066 0.065 0.107 0.067 0.323 0.101Tajikistan 0.039 0.046 0.066 0.065 0.099 0.067 0.199 0.095Zambia 0.039 0.046 0.066 0.065 0.098 0.067 0.188 0.094Yemen 0.039 0.046 0.066 0.065 0.098 0.067 0.187 0.094Malawi 0.039 0.047 0.066 0.065 0.095 0.067 0.161 0.091Madagascar 0.039 0.047 0.066 0.065 0.095 0.067 0.160 0.091Mali 0.039 0.047 0.066 0.065 0.094 0.067 0.155 0.091Mongolia 0.039 0.047 0.066 0.065 0.094 0.067 0.153 0.090Benin 0.039 0.048 0.066 0.066 0.089 0.067 0.124 0.086Kenya 0.039 0.048 0.066 0.066 0.087 0.067 0.117 0.085Sierra Leone 0.039 0.048 0.066 0.066 0.086 0.067 0.111 0.084Nepal 0.039 0.048 0.066 0.066 0.086 0.067 0.111 0.084Turkmenistan 0.039 0.048 0.066 0.066 0.085 0.067 0.109 0.083Congo 0.039 0.049 0.066 0.066 0.084 0.067 0.106 0.082Senegal 0.039 0.049 0.066 0.066 0.083 0.068 0.103 0.082Vietnam 0.039 0.049 0.066 0.066 0.083 0.068 0.102 0.081Bangladesh 0.039 0.049 0.067 0.066 0.083 0.068 0.102 0.081Pakistan 0.039 0.049 0.067 0.066 0.082 0.068 0.097 0.080Azerbaijan 0.039 0.050 0.067 0.067 0.081 0.068 0.096 0.080Côte d'Ivoire 0.039 0.050 0.067 0.067 0.081 0.068 0.095 0.080Paraguay 0.039 0.050 0.067 0.067 0.081 0.068 0.095 0.080Uzbekistan 0.039 0.050 0.067 0.067 0.081 0.068 0.094 0.079Kyrgyzstan 0.039 0.050 0.067 0.067 0.081 0.068 0.094 0.079Cameroon 0.039 0.050 0.067 0.067 0.081 0.068 0.093 0.079Moldova 0.039 0.050 0.067 0.067 0.081 0.068 0.093 0.079Bolivia 0.038 0.050 0.067 0.067 0.080 0.068 0.092 0.079Ecuador 0.038 0.050 0.067 0.067 0.080 0.068 0.092 0.079Armenia 0.038 0.050 0.067 0.067 0.080 0.068 0.091 0.079Sri Lanka 0.038 0.050 0.067 0.067 0.080 0.068 0.091 0.079Jordan 0.038 0.051 0.067 0.067 0.080 0.068 0.090 0.078Albania 0.038 0.051 0.068 0.067 0.079 0.068 0.089 0.078Indonesia 0.038 0.051 0.068 0.067 0.079 0.068 0.089 0.078Jamaica 0.038 0.051 0.068 0.067 0.079 0.068 0.089 0.078Zimbabwe 0.038 0.051 0.068 0.067 0.079 0.068 0.089 0.078Guinea 0.038 0.051 0.068 0.067 0.079 0.069 0.088 0.078Syria 0.038 0.051 0.068 0.068 0.079 0.069 0.088 0.078Georgia 0.038 0.051 0.068 0.068 0.079 0.069 0.088 0.078
Middle-income countries:
Ukraine 0.037 0.052 0.068 0.068 0.078 0.069 0.086 0.077Philippines 0.037 0.052 0.068 0.068 0.078 0.069 0.086 0.077Peru 0.037 0.052 0.068 0.068 0.078 0.069 0.086 0.077Botswana 0.037 0.052 0.068 0.068 0.078 0.069 0.086 0.077Thailand 0.037 0.052 0.068 0.068 0.078 0.069 0.085 0.077Morocco 0.037 0.052 0.068 0.068 0.078 0.069 0.085 0.077Venezuela 0.037 0.052 0.068 0.068 0.078 0.069 0.085 0.077Macedonia 0.037 0.052 0.068 0.068 0.078 0.069 0.085 0.077Belize 0.037 0.052 0.069 0.068 0.078 0.069 0.085 0.077
—Continued
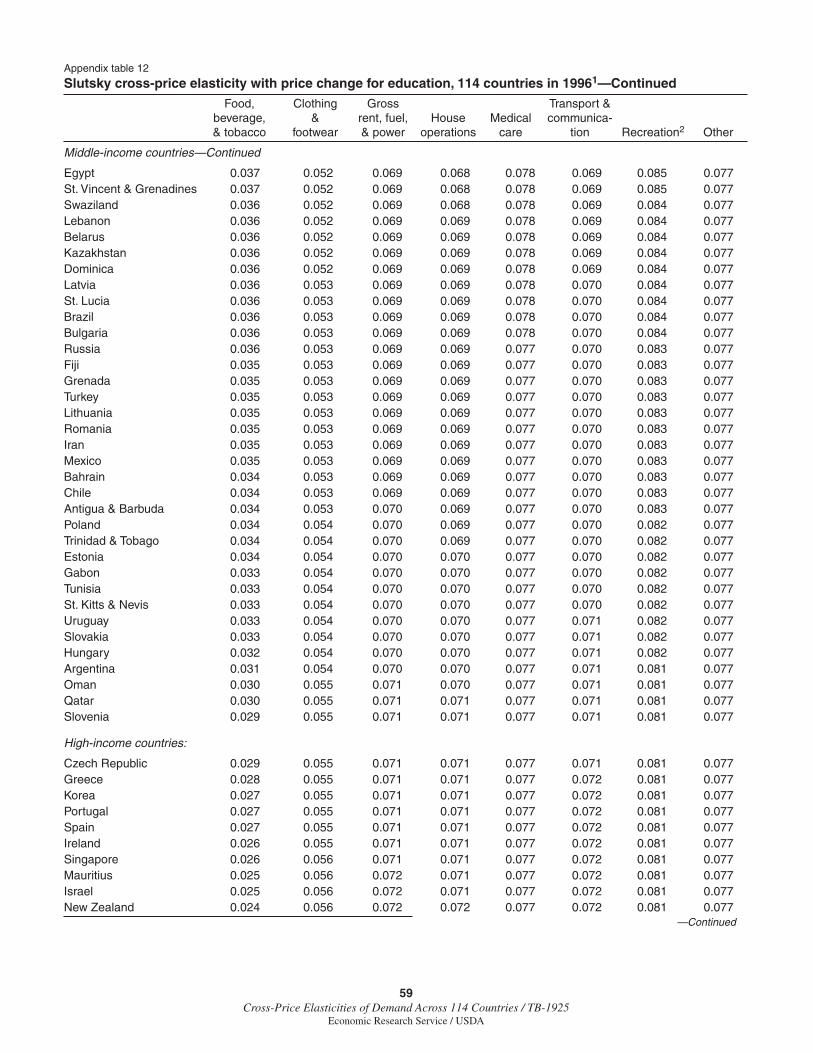
59Cross-Price Elasticities of Demand Across 114 Countries / TB-1925
Economic Research Service / USDA
Appendix table 12
Slutsky cross-price elasticity with price change for education, 114 countries in 19961—Continued
Food, Clothing Gross Transport & beverage, & rent, fuel, House Medical communica- & tobacco footwear & power operations care tion Recreation2 Other
Middle-income countries—Continued
Egypt 0.037 0.052 0.069 0.068 0.078 0.069 0.085 0.077St. Vincent & Grenadines 0.037 0.052 0.069 0.068 0.078 0.069 0.085 0.077Swaziland 0.036 0.052 0.069 0.068 0.078 0.069 0.084 0.077Lebanon 0.036 0.052 0.069 0.069 0.078 0.069 0.084 0.077Belarus 0.036 0.052 0.069 0.069 0.078 0.069 0.084 0.077Kazakhstan 0.036 0.052 0.069 0.069 0.078 0.069 0.084 0.077Dominica 0.036 0.052 0.069 0.069 0.078 0.069 0.084 0.077Latvia 0.036 0.053 0.069 0.069 0.078 0.070 0.084 0.077St. Lucia 0.036 0.053 0.069 0.069 0.078 0.070 0.084 0.077Brazil 0.036 0.053 0.069 0.069 0.078 0.070 0.084 0.077Bulgaria 0.036 0.053 0.069 0.069 0.078 0.070 0.084 0.077Russia 0.036 0.053 0.069 0.069 0.077 0.070 0.083 0.077Fiji 0.035 0.053 0.069 0.069 0.077 0.070 0.083 0.077Grenada 0.035 0.053 0.069 0.069 0.077 0.070 0.083 0.077Turkey 0.035 0.053 0.069 0.069 0.077 0.070 0.083 0.077Lithuania 0.035 0.053 0.069 0.069 0.077 0.070 0.083 0.077Romania 0.035 0.053 0.069 0.069 0.077 0.070 0.083 0.077Iran 0.035 0.053 0.069 0.069 0.077 0.070 0.083 0.077Mexico 0.035 0.053 0.069 0.069 0.077 0.070 0.083 0.077Bahrain 0.034 0.053 0.069 0.069 0.077 0.070 0.083 0.077Chile 0.034 0.053 0.069 0.069 0.077 0.070 0.083 0.077Antigua & Barbuda 0.034 0.053 0.070 0.069 0.077 0.070 0.083 0.077Poland 0.034 0.054 0.070 0.069 0.077 0.070 0.082 0.077Trinidad & Tobago 0.034 0.054 0.070 0.069 0.077 0.070 0.082 0.077Estonia 0.034 0.054 0.070 0.070 0.077 0.070 0.082 0.077Gabon 0.033 0.054 0.070 0.070 0.077 0.070 0.082 0.077Tunisia 0.033 0.054 0.070 0.070 0.077 0.070 0.082 0.077St. Kitts & Nevis 0.033 0.054 0.070 0.070 0.077 0.070 0.082 0.077Uruguay 0.033 0.054 0.070 0.070 0.077 0.071 0.082 0.077Slovakia 0.033 0.054 0.070 0.070 0.077 0.071 0.082 0.077Hungary 0.032 0.054 0.070 0.070 0.077 0.071 0.082 0.077Argentina 0.031 0.054 0.070 0.070 0.077 0.071 0.081 0.077Oman 0.030 0.055 0.071 0.070 0.077 0.071 0.081 0.077Qatar 0.030 0.055 0.071 0.071 0.077 0.071 0.081 0.077Slovenia 0.029 0.055 0.071 0.071 0.077 0.071 0.081 0.077
High-income countries:
Czech Republic 0.029 0.055 0.071 0.071 0.077 0.071 0.081 0.077Greece 0.028 0.055 0.071 0.071 0.077 0.072 0.081 0.077Korea 0.027 0.055 0.071 0.071 0.077 0.072 0.081 0.077Portugal 0.027 0.055 0.071 0.071 0.077 0.072 0.081 0.077Spain 0.027 0.055 0.071 0.071 0.077 0.072 0.081 0.077Ireland 0.026 0.055 0.071 0.071 0.077 0.072 0.081 0.077Singapore 0.026 0.056 0.071 0.071 0.077 0.072 0.081 0.077Mauritius 0.025 0.056 0.072 0.071 0.077 0.072 0.081 0.077Israel 0.025 0.056 0.072 0.071 0.077 0.072 0.081 0.077New Zealand 0.024 0.056 0.072 0.072 0.077 0.072 0.081 0.077
—Continued
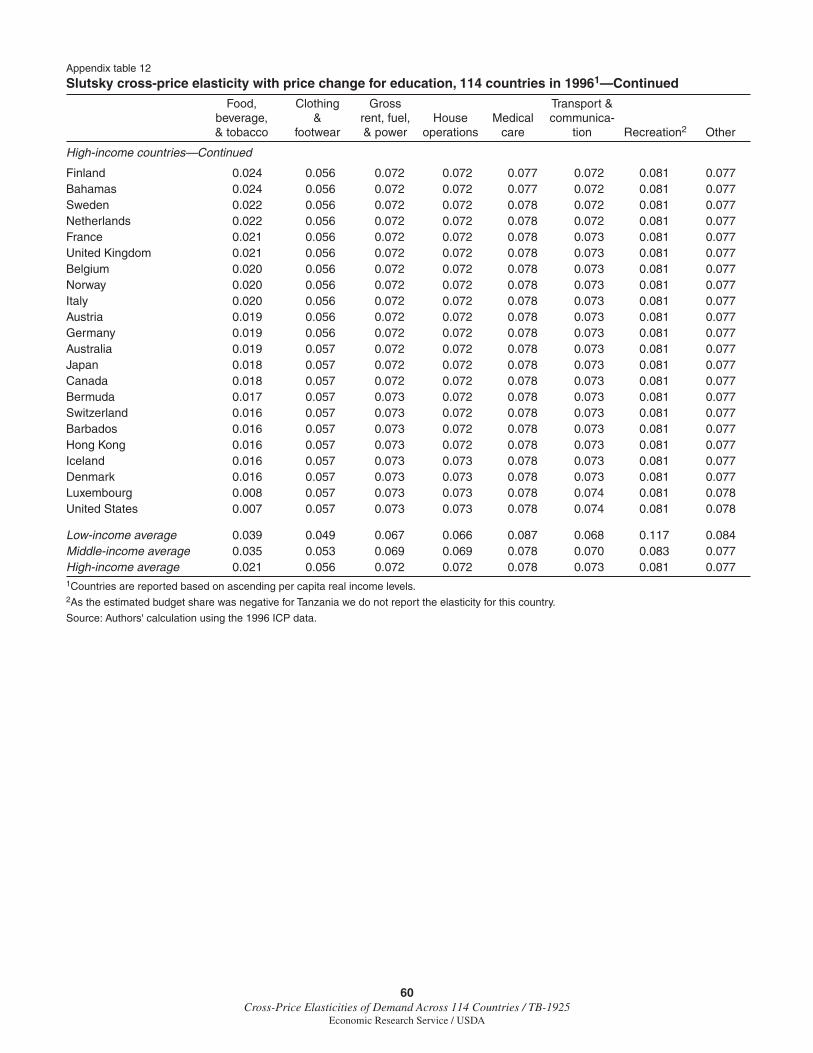
60Cross-Price Elasticities of Demand Across 114 Countries / TB-1925
Economic Research Service / USDA
Appendix table 12
Slutsky cross-price elasticity with price change for education, 114 countries in 19961—Continued
Food, Clothing Gross Transport & beverage, & rent, fuel, House Medical communica- & tobacco footwear & power operations care tion Recreation2 Other
High-income countries—Continued
Finland 0.024 0.056 0.072 0.072 0.077 0.072 0.081 0.077Bahamas 0.024 0.056 0.072 0.072 0.077 0.072 0.081 0.077Sweden 0.022 0.056 0.072 0.072 0.078 0.072 0.081 0.077Netherlands 0.022 0.056 0.072 0.072 0.078 0.072 0.081 0.077France 0.021 0.056 0.072 0.072 0.078 0.073 0.081 0.077United Kingdom 0.021 0.056 0.072 0.072 0.078 0.073 0.081 0.077Belgium 0.020 0.056 0.072 0.072 0.078 0.073 0.081 0.077Norway 0.020 0.056 0.072 0.072 0.078 0.073 0.081 0.077Italy 0.020 0.056 0.072 0.072 0.078 0.073 0.081 0.077Austria 0.019 0.056 0.072 0.072 0.078 0.073 0.081 0.077Germany 0.019 0.056 0.072 0.072 0.078 0.073 0.081 0.077Australia 0.019 0.057 0.072 0.072 0.078 0.073 0.081 0.077Japan 0.018 0.057 0.072 0.072 0.078 0.073 0.081 0.077Canada 0.018 0.057 0.072 0.072 0.078 0.073 0.081 0.077Bermuda 0.017 0.057 0.073 0.072 0.078 0.073 0.081 0.077Switzerland 0.016 0.057 0.073 0.072 0.078 0.073 0.081 0.077Barbados 0.016 0.057 0.073 0.072 0.078 0.073 0.081 0.077Hong Kong 0.016 0.057 0.073 0.072 0.078 0.073 0.081 0.077Iceland 0.016 0.057 0.073 0.073 0.078 0.073 0.081 0.077Denmark 0.016 0.057 0.073 0.073 0.078 0.073 0.081 0.077Luxembourg 0.008 0.057 0.073 0.073 0.078 0.074 0.081 0.078United States 0.007 0.057 0.073 0.073 0.078 0.074 0.081 0.078
Low-income average 0.039 0.049 0.067 0.066 0.087 0.068 0.117 0.084Middle-income average 0.035 0.053 0.069 0.069 0.078 0.070 0.083 0.077High-income average 0.021 0.056 0.072 0.072 0.078 0.073 0.081 0.0771Countries are reported based on ascending per capita real income levels.2As the estimated budget share was negative for Tanzania we do not report the elasticity for this country.
Source: Authors' calculation using the 1996 ICP data.
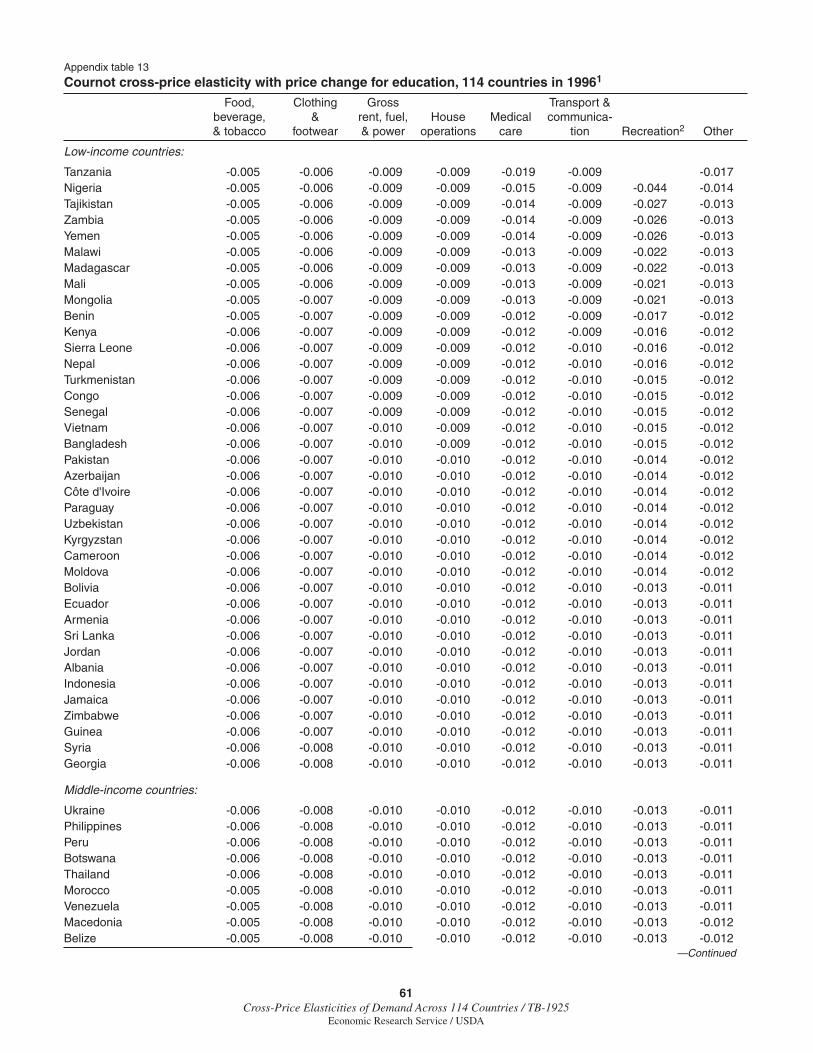
61Cross-Price Elasticities of Demand Across 114 Countries / TB-1925
Economic Research Service / USDA
Appendix table 13
Cournot cross-price elasticity with price change for education, 114 countries in 19961
Food, Clothing Gross Transport & beverage, & rent, fuel, House Medical communica- & tobacco footwear & power operations care tion Recreation2 Other
Low-income countries:
Tanzania -0.005 -0.006 -0.009 -0.009 -0.019 -0.009 -0.017Nigeria -0.005 -0.006 -0.009 -0.009 -0.015 -0.009 -0.044 -0.014Tajikistan -0.005 -0.006 -0.009 -0.009 -0.014 -0.009 -0.027 -0.013Zambia -0.005 -0.006 -0.009 -0.009 -0.014 -0.009 -0.026 -0.013Yemen -0.005 -0.006 -0.009 -0.009 -0.014 -0.009 -0.026 -0.013Malawi -0.005 -0.006 -0.009 -0.009 -0.013 -0.009 -0.022 -0.013Madagascar -0.005 -0.006 -0.009 -0.009 -0.013 -0.009 -0.022 -0.013Mali -0.005 -0.006 -0.009 -0.009 -0.013 -0.009 -0.021 -0.013Mongolia -0.005 -0.007 -0.009 -0.009 -0.013 -0.009 -0.021 -0.013Benin -0.005 -0.007 -0.009 -0.009 -0.012 -0.009 -0.017 -0.012Kenya -0.006 -0.007 -0.009 -0.009 -0.012 -0.009 -0.016 -0.012Sierra Leone -0.006 -0.007 -0.009 -0.009 -0.012 -0.010 -0.016 -0.012Nepal -0.006 -0.007 -0.009 -0.009 -0.012 -0.010 -0.016 -0.012Turkmenistan -0.006 -0.007 -0.009 -0.009 -0.012 -0.010 -0.015 -0.012Congo -0.006 -0.007 -0.009 -0.009 -0.012 -0.010 -0.015 -0.012Senegal -0.006 -0.007 -0.009 -0.009 -0.012 -0.010 -0.015 -0.012Vietnam -0.006 -0.007 -0.010 -0.009 -0.012 -0.010 -0.015 -0.012Bangladesh -0.006 -0.007 -0.010 -0.009 -0.012 -0.010 -0.015 -0.012Pakistan -0.006 -0.007 -0.010 -0.010 -0.012 -0.010 -0.014 -0.012Azerbaijan -0.006 -0.007 -0.010 -0.010 -0.012 -0.010 -0.014 -0.012Côte d'Ivoire -0.006 -0.007 -0.010 -0.010 -0.012 -0.010 -0.014 -0.012Paraguay -0.006 -0.007 -0.010 -0.010 -0.012 -0.010 -0.014 -0.012Uzbekistan -0.006 -0.007 -0.010 -0.010 -0.012 -0.010 -0.014 -0.012Kyrgyzstan -0.006 -0.007 -0.010 -0.010 -0.012 -0.010 -0.014 -0.012Cameroon -0.006 -0.007 -0.010 -0.010 -0.012 -0.010 -0.014 -0.012Moldova -0.006 -0.007 -0.010 -0.010 -0.012 -0.010 -0.014 -0.012Bolivia -0.006 -0.007 -0.010 -0.010 -0.012 -0.010 -0.013 -0.011Ecuador -0.006 -0.007 -0.010 -0.010 -0.012 -0.010 -0.013 -0.011Armenia -0.006 -0.007 -0.010 -0.010 -0.012 -0.010 -0.013 -0.011Sri Lanka -0.006 -0.007 -0.010 -0.010 -0.012 -0.010 -0.013 -0.011Jordan -0.006 -0.007 -0.010 -0.010 -0.012 -0.010 -0.013 -0.011Albania -0.006 -0.007 -0.010 -0.010 -0.012 -0.010 -0.013 -0.011Indonesia -0.006 -0.007 -0.010 -0.010 -0.012 -0.010 -0.013 -0.011Jamaica -0.006 -0.007 -0.010 -0.010 -0.012 -0.010 -0.013 -0.011Zimbabwe -0.006 -0.007 -0.010 -0.010 -0.012 -0.010 -0.013 -0.011Guinea -0.006 -0.007 -0.010 -0.010 -0.012 -0.010 -0.013 -0.011Syria -0.006 -0.008 -0.010 -0.010 -0.012 -0.010 -0.013 -0.011Georgia -0.006 -0.008 -0.010 -0.010 -0.012 -0.010 -0.013 -0.011
Middle-income countries:
Ukraine -0.006 -0.008 -0.010 -0.010 -0.012 -0.010 -0.013 -0.011Philippines -0.006 -0.008 -0.010 -0.010 -0.012 -0.010 -0.013 -0.011Peru -0.006 -0.008 -0.010 -0.010 -0.012 -0.010 -0.013 -0.011Botswana -0.006 -0.008 -0.010 -0.010 -0.012 -0.010 -0.013 -0.011Thailand -0.006 -0.008 -0.010 -0.010 -0.012 -0.010 -0.013 -0.011Morocco -0.005 -0.008 -0.010 -0.010 -0.012 -0.010 -0.013 -0.011Venezuela -0.005 -0.008 -0.010 -0.010 -0.012 -0.010 -0.013 -0.011Macedonia -0.005 -0.008 -0.010 -0.010 -0.012 -0.010 -0.013 -0.012Belize -0.005 -0.008 -0.010 -0.010 -0.012 -0.010 -0.013 -0.012
—Continued
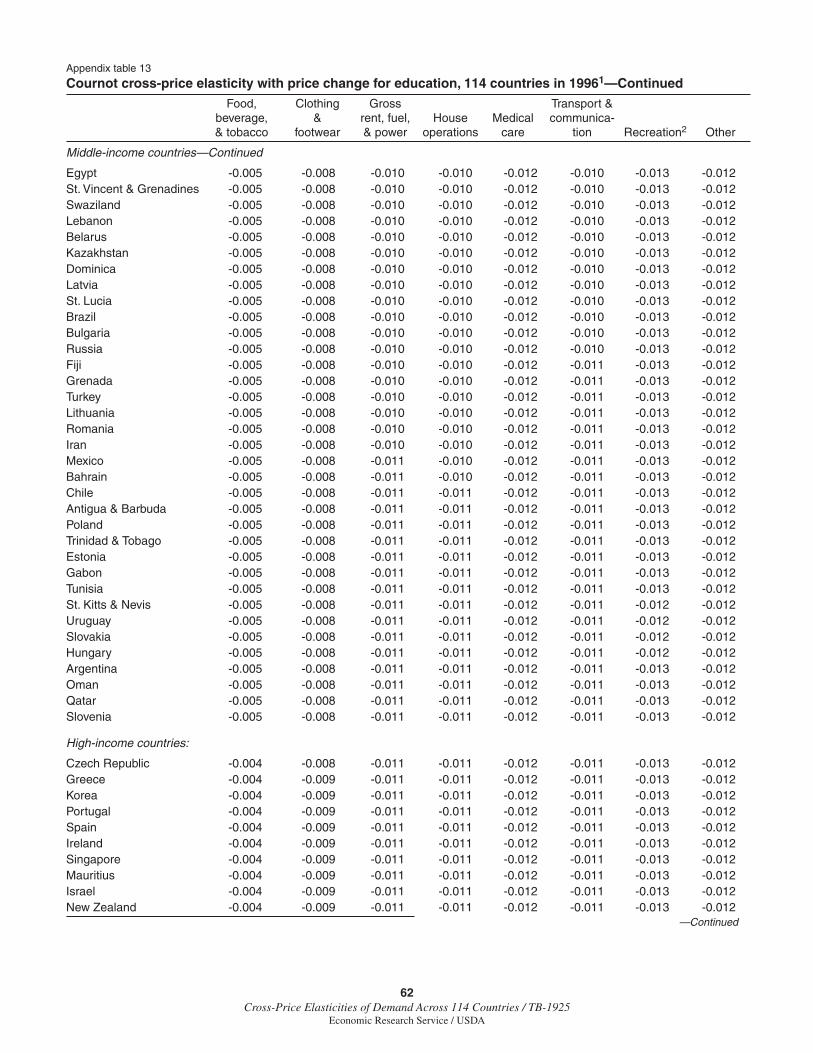
62Cross-Price Elasticities of Demand Across 114 Countries / TB-1925
Economic Research Service / USDA
Appendix table 13
Cournot cross-price elasticity with price change for education, 114 countries in 19961—Continued
Food, Clothing Gross Transport & beverage, & rent, fuel, House Medical communica- & tobacco footwear & power operations care tion Recreation2 Other
Middle-income countries—Continued
Egypt -0.005 -0.008 -0.010 -0.010 -0.012 -0.010 -0.013 -0.012St. Vincent & Grenadines -0.005 -0.008 -0.010 -0.010 -0.012 -0.010 -0.013 -0.012Swaziland -0.005 -0.008 -0.010 -0.010 -0.012 -0.010 -0.013 -0.012Lebanon -0.005 -0.008 -0.010 -0.010 -0.012 -0.010 -0.013 -0.012Belarus -0.005 -0.008 -0.010 -0.010 -0.012 -0.010 -0.013 -0.012Kazakhstan -0.005 -0.008 -0.010 -0.010 -0.012 -0.010 -0.013 -0.012Dominica -0.005 -0.008 -0.010 -0.010 -0.012 -0.010 -0.013 -0.012Latvia -0.005 -0.008 -0.010 -0.010 -0.012 -0.010 -0.013 -0.012St. Lucia -0.005 -0.008 -0.010 -0.010 -0.012 -0.010 -0.013 -0.012Brazil -0.005 -0.008 -0.010 -0.010 -0.012 -0.010 -0.013 -0.012Bulgaria -0.005 -0.008 -0.010 -0.010 -0.012 -0.010 -0.013 -0.012Russia -0.005 -0.008 -0.010 -0.010 -0.012 -0.010 -0.013 -0.012Fiji -0.005 -0.008 -0.010 -0.010 -0.012 -0.011 -0.013 -0.012Grenada -0.005 -0.008 -0.010 -0.010 -0.012 -0.011 -0.013 -0.012Turkey -0.005 -0.008 -0.010 -0.010 -0.012 -0.011 -0.013 -0.012Lithuania -0.005 -0.008 -0.010 -0.010 -0.012 -0.011 -0.013 -0.012Romania -0.005 -0.008 -0.010 -0.010 -0.012 -0.011 -0.013 -0.012Iran -0.005 -0.008 -0.010 -0.010 -0.012 -0.011 -0.013 -0.012Mexico -0.005 -0.008 -0.011 -0.010 -0.012 -0.011 -0.013 -0.012Bahrain -0.005 -0.008 -0.011 -0.010 -0.012 -0.011 -0.013 -0.012Chile -0.005 -0.008 -0.011 -0.011 -0.012 -0.011 -0.013 -0.012Antigua & Barbuda -0.005 -0.008 -0.011 -0.011 -0.012 -0.011 -0.013 -0.012Poland -0.005 -0.008 -0.011 -0.011 -0.012 -0.011 -0.013 -0.012Trinidad & Tobago -0.005 -0.008 -0.011 -0.011 -0.012 -0.011 -0.013 -0.012Estonia -0.005 -0.008 -0.011 -0.011 -0.012 -0.011 -0.013 -0.012Gabon -0.005 -0.008 -0.011 -0.011 -0.012 -0.011 -0.013 -0.012Tunisia -0.005 -0.008 -0.011 -0.011 -0.012 -0.011 -0.013 -0.012St. Kitts & Nevis -0.005 -0.008 -0.011 -0.011 -0.012 -0.011 -0.012 -0.012Uruguay -0.005 -0.008 -0.011 -0.011 -0.012 -0.011 -0.012 -0.012Slovakia -0.005 -0.008 -0.011 -0.011 -0.012 -0.011 -0.012 -0.012Hungary -0.005 -0.008 -0.011 -0.011 -0.012 -0.011 -0.012 -0.012Argentina -0.005 -0.008 -0.011 -0.011 -0.012 -0.011 -0.013 -0.012Oman -0.005 -0.008 -0.011 -0.011 -0.012 -0.011 -0.013 -0.012Qatar -0.005 -0.008 -0.011 -0.011 -0.012 -0.011 -0.013 -0.012Slovenia -0.005 -0.008 -0.011 -0.011 -0.012 -0.011 -0.013 -0.012
High-income countries:
Czech Republic -0.004 -0.008 -0.011 -0.011 -0.012 -0.011 -0.013 -0.012Greece -0.004 -0.009 -0.011 -0.011 -0.012 -0.011 -0.013 -0.012Korea -0.004 -0.009 -0.011 -0.011 -0.012 -0.011 -0.013 -0.012Portugal -0.004 -0.009 -0.011 -0.011 -0.012 -0.011 -0.013 -0.012Spain -0.004 -0.009 -0.011 -0.011 -0.012 -0.011 -0.013 -0.012Ireland -0.004 -0.009 -0.011 -0.011 -0.012 -0.011 -0.013 -0.012Singapore -0.004 -0.009 -0.011 -0.011 -0.012 -0.011 -0.013 -0.012Mauritius -0.004 -0.009 -0.011 -0.011 -0.012 -0.011 -0.013 -0.012Israel -0.004 -0.009 -0.011 -0.011 -0.012 -0.011 -0.013 -0.012New Zealand -0.004 -0.009 -0.011 -0.011 -0.012 -0.011 -0.013 -0.012
—Continued
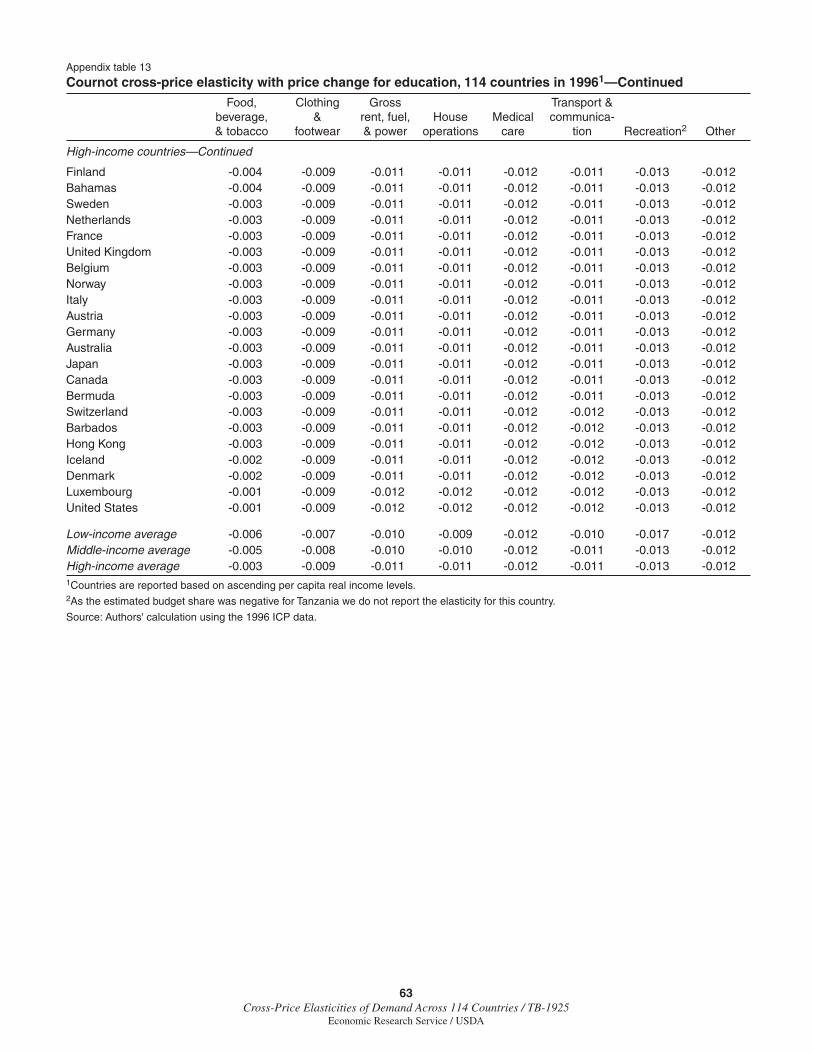
63Cross-Price Elasticities of Demand Across 114 Countries / TB-1925
Economic Research Service / USDA
Appendix table 13
Cournot cross-price elasticity with price change for education, 114 countries in 19961—Continued
Food, Clothing Gross Transport & beverage, & rent, fuel, House Medical communica- & tobacco footwear & power operations care tion Recreation2 Other
High-income countries—Continued
Finland -0.004 -0.009 -0.011 -0.011 -0.012 -0.011 -0.013 -0.012Bahamas -0.004 -0.009 -0.011 -0.011 -0.012 -0.011 -0.013 -0.012Sweden -0.003 -0.009 -0.011 -0.011 -0.012 -0.011 -0.013 -0.012Netherlands -0.003 -0.009 -0.011 -0.011 -0.012 -0.011 -0.013 -0.012France -0.003 -0.009 -0.011 -0.011 -0.012 -0.011 -0.013 -0.012United Kingdom -0.003 -0.009 -0.011 -0.011 -0.012 -0.011 -0.013 -0.012Belgium -0.003 -0.009 -0.011 -0.011 -0.012 -0.011 -0.013 -0.012Norway -0.003 -0.009 -0.011 -0.011 -0.012 -0.011 -0.013 -0.012Italy -0.003 -0.009 -0.011 -0.011 -0.012 -0.011 -0.013 -0.012Austria -0.003 -0.009 -0.011 -0.011 -0.012 -0.011 -0.013 -0.012Germany -0.003 -0.009 -0.011 -0.011 -0.012 -0.011 -0.013 -0.012Australia -0.003 -0.009 -0.011 -0.011 -0.012 -0.011 -0.013 -0.012Japan -0.003 -0.009 -0.011 -0.011 -0.012 -0.011 -0.013 -0.012Canada -0.003 -0.009 -0.011 -0.011 -0.012 -0.011 -0.013 -0.012Bermuda -0.003 -0.009 -0.011 -0.011 -0.012 -0.011 -0.013 -0.012Switzerland -0.003 -0.009 -0.011 -0.011 -0.012 -0.012 -0.013 -0.012Barbados -0.003 -0.009 -0.011 -0.011 -0.012 -0.012 -0.013 -0.012Hong Kong -0.003 -0.009 -0.011 -0.011 -0.012 -0.012 -0.013 -0.012Iceland -0.002 -0.009 -0.011 -0.011 -0.012 -0.012 -0.013 -0.012Denmark -0.002 -0.009 -0.011 -0.011 -0.012 -0.012 -0.013 -0.012Luxembourg -0.001 -0.009 -0.012 -0.012 -0.012 -0.012 -0.013 -0.012United States -0.001 -0.009 -0.012 -0.012 -0.012 -0.012 -0.013 -0.012
Low-income average -0.006 -0.007 -0.010 -0.009 -0.012 -0.010 -0.017 -0.012Middle-income average -0.005 -0.008 -0.010 -0.010 -0.012 -0.011 -0.013 -0.012High-income average -0.003 -0.009 -0.011 -0.011 -0.012 -0.011 -0.013 -0.0121Countries are reported based on ascending per capita real income levels.2As the estimated budget share was negative for Tanzania we do not report the elasticity for this country.
Source: Authors' calculation using the 1996 ICP data.
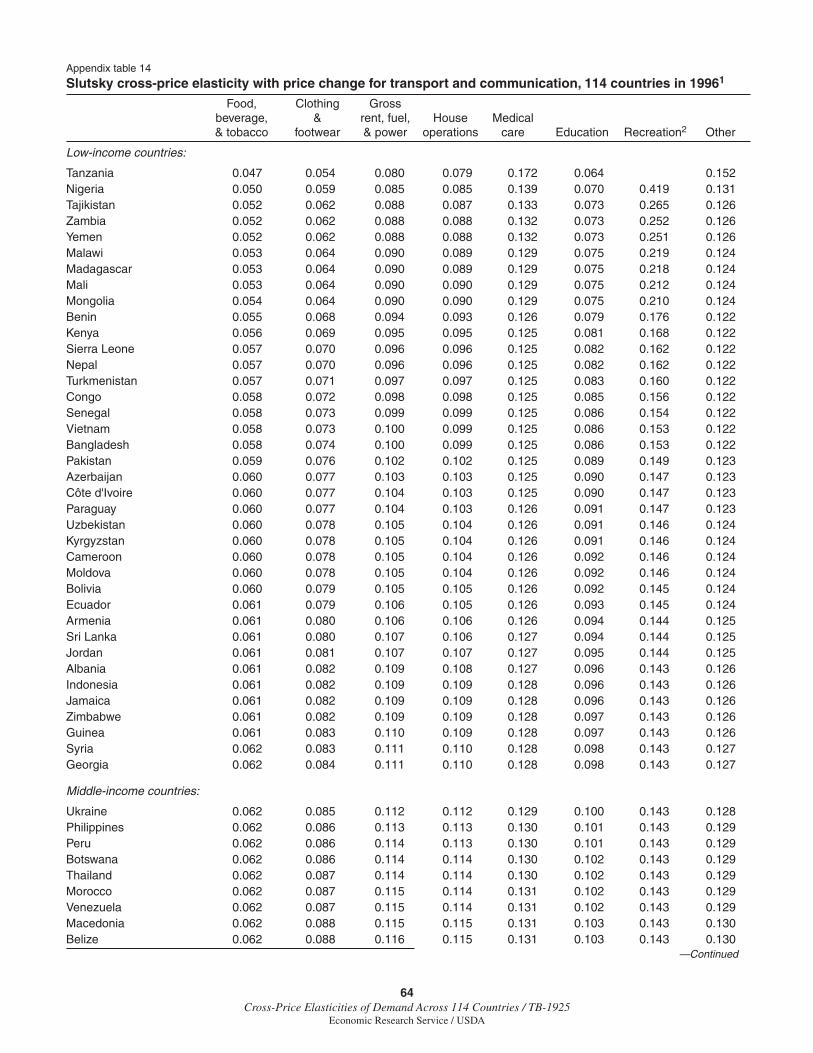
64Cross-Price Elasticities of Demand Across 114 Countries / TB-1925
Economic Research Service / USDA
Appendix table 14
Slutsky cross-price elasticity with price change for transport and communication, 114 countries in 19961
Food, Clothing Gross beverage, & rent, fuel, House Medical & tobacco footwear & power operations care Education Recreation2 Other
Low-income countries:
Tanzania 0.047 0.054 0.080 0.079 0.172 0.064 0.152Nigeria 0.050 0.059 0.085 0.085 0.139 0.070 0.419 0.131Tajikistan 0.052 0.062 0.088 0.087 0.133 0.073 0.265 0.126Zambia 0.052 0.062 0.088 0.088 0.132 0.073 0.252 0.126Yemen 0.052 0.062 0.088 0.088 0.132 0.073 0.251 0.126Malawi 0.053 0.064 0.090 0.089 0.129 0.075 0.219 0.124Madagascar 0.053 0.064 0.090 0.089 0.129 0.075 0.218 0.124Mali 0.053 0.064 0.090 0.090 0.129 0.075 0.212 0.124Mongolia 0.054 0.064 0.090 0.090 0.129 0.075 0.210 0.124Benin 0.055 0.068 0.094 0.093 0.126 0.079 0.176 0.122Kenya 0.056 0.069 0.095 0.095 0.125 0.081 0.168 0.122Sierra Leone 0.057 0.070 0.096 0.096 0.125 0.082 0.162 0.122Nepal 0.057 0.070 0.096 0.096 0.125 0.082 0.162 0.122Turkmenistan 0.057 0.071 0.097 0.097 0.125 0.083 0.160 0.122Congo 0.058 0.072 0.098 0.098 0.125 0.085 0.156 0.122Senegal 0.058 0.073 0.099 0.099 0.125 0.086 0.154 0.122Vietnam 0.058 0.073 0.100 0.099 0.125 0.086 0.153 0.122Bangladesh 0.058 0.074 0.100 0.099 0.125 0.086 0.153 0.122Pakistan 0.059 0.076 0.102 0.102 0.125 0.089 0.149 0.123Azerbaijan 0.060 0.077 0.103 0.103 0.125 0.090 0.147 0.123Côte d'Ivoire 0.060 0.077 0.104 0.103 0.125 0.090 0.147 0.123Paraguay 0.060 0.077 0.104 0.103 0.126 0.091 0.147 0.123Uzbekistan 0.060 0.078 0.105 0.104 0.126 0.091 0.146 0.124Kyrgyzstan 0.060 0.078 0.105 0.104 0.126 0.091 0.146 0.124Cameroon 0.060 0.078 0.105 0.104 0.126 0.092 0.146 0.124Moldova 0.060 0.078 0.105 0.104 0.126 0.092 0.146 0.124Bolivia 0.060 0.079 0.105 0.105 0.126 0.092 0.145 0.124Ecuador 0.061 0.079 0.106 0.105 0.126 0.093 0.145 0.124Armenia 0.061 0.080 0.106 0.106 0.126 0.094 0.144 0.125Sri Lanka 0.061 0.080 0.107 0.106 0.127 0.094 0.144 0.125Jordan 0.061 0.081 0.107 0.107 0.127 0.095 0.144 0.125Albania 0.061 0.082 0.109 0.108 0.127 0.096 0.143 0.126Indonesia 0.061 0.082 0.109 0.109 0.128 0.096 0.143 0.126Jamaica 0.061 0.082 0.109 0.109 0.128 0.096 0.143 0.126Zimbabwe 0.061 0.082 0.109 0.109 0.128 0.097 0.143 0.126Guinea 0.061 0.083 0.110 0.109 0.128 0.097 0.143 0.126Syria 0.062 0.083 0.111 0.110 0.128 0.098 0.143 0.127Georgia 0.062 0.084 0.111 0.110 0.128 0.098 0.143 0.127
Middle-income countries:
Ukraine 0.062 0.085 0.112 0.112 0.129 0.100 0.143 0.128Philippines 0.062 0.086 0.113 0.113 0.130 0.101 0.143 0.129Peru 0.062 0.086 0.114 0.113 0.130 0.101 0.143 0.129Botswana 0.062 0.086 0.114 0.114 0.130 0.102 0.143 0.129Thailand 0.062 0.087 0.114 0.114 0.130 0.102 0.143 0.129Morocco 0.062 0.087 0.115 0.114 0.131 0.102 0.143 0.129Venezuela 0.062 0.087 0.115 0.114 0.131 0.102 0.143 0.129Macedonia 0.062 0.088 0.115 0.115 0.131 0.103 0.143 0.130Belize 0.062 0.088 0.116 0.115 0.131 0.103 0.143 0.130
—Continued
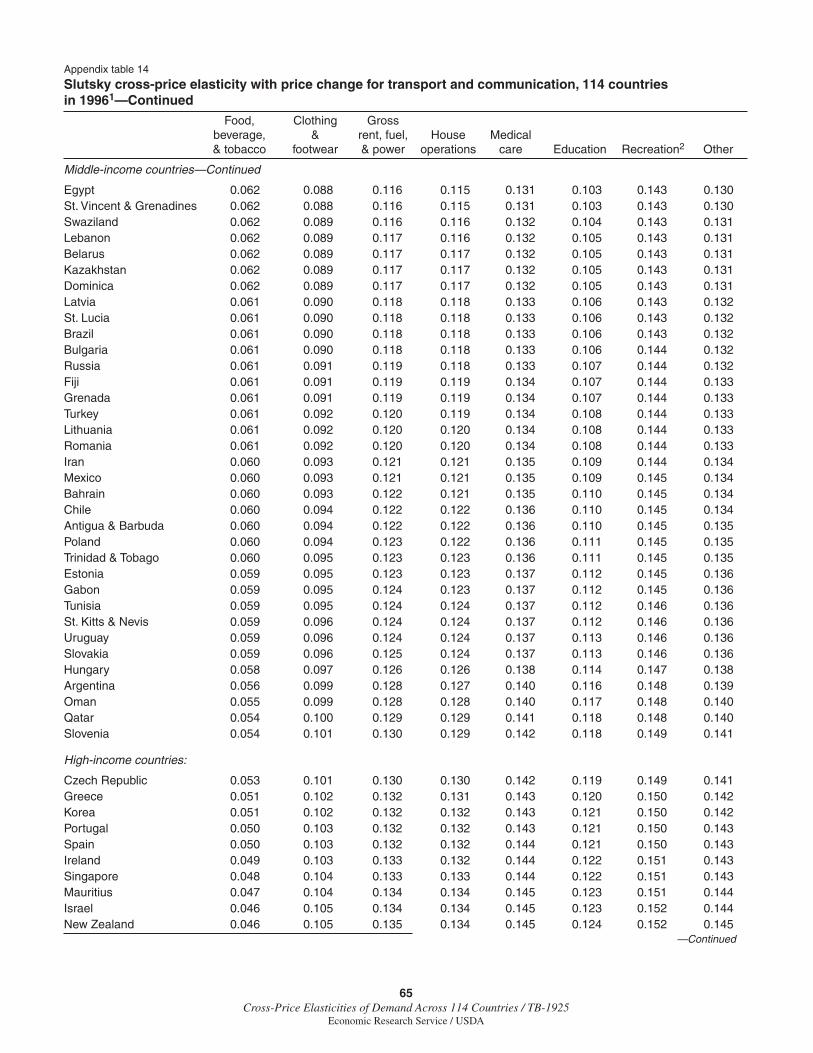
65Cross-Price Elasticities of Demand Across 114 Countries / TB-1925
Economic Research Service / USDA
Appendix table 14
Slutsky cross-price elasticity with price change for transport and communication, 114 countries in 19961—Continued
Food, Clothing Gross beverage, & rent, fuel, House Medical & tobacco footwear & power operations care Education Recreation2 Other
Middle-income countries—Continued
Egypt 0.062 0.088 0.116 0.115 0.131 0.103 0.143 0.130St. Vincent & Grenadines 0.062 0.088 0.116 0.115 0.131 0.103 0.143 0.130Swaziland 0.062 0.089 0.116 0.116 0.132 0.104 0.143 0.131Lebanon 0.062 0.089 0.117 0.116 0.132 0.105 0.143 0.131Belarus 0.062 0.089 0.117 0.117 0.132 0.105 0.143 0.131Kazakhstan 0.062 0.089 0.117 0.117 0.132 0.105 0.143 0.131Dominica 0.062 0.089 0.117 0.117 0.132 0.105 0.143 0.131Latvia 0.061 0.090 0.118 0.118 0.133 0.106 0.143 0.132St. Lucia 0.061 0.090 0.118 0.118 0.133 0.106 0.143 0.132Brazil 0.061 0.090 0.118 0.118 0.133 0.106 0.143 0.132Bulgaria 0.061 0.090 0.118 0.118 0.133 0.106 0.144 0.132Russia 0.061 0.091 0.119 0.118 0.133 0.107 0.144 0.132Fiji 0.061 0.091 0.119 0.119 0.134 0.107 0.144 0.133Grenada 0.061 0.091 0.119 0.119 0.134 0.107 0.144 0.133Turkey 0.061 0.092 0.120 0.119 0.134 0.108 0.144 0.133Lithuania 0.061 0.092 0.120 0.120 0.134 0.108 0.144 0.133Romania 0.061 0.092 0.120 0.120 0.134 0.108 0.144 0.133Iran 0.060 0.093 0.121 0.121 0.135 0.109 0.144 0.134Mexico 0.060 0.093 0.121 0.121 0.135 0.109 0.145 0.134Bahrain 0.060 0.093 0.122 0.121 0.135 0.110 0.145 0.134Chile 0.060 0.094 0.122 0.122 0.136 0.110 0.145 0.134Antigua & Barbuda 0.060 0.094 0.122 0.122 0.136 0.110 0.145 0.135Poland 0.060 0.094 0.123 0.122 0.136 0.111 0.145 0.135Trinidad & Tobago 0.060 0.095 0.123 0.123 0.136 0.111 0.145 0.135Estonia 0.059 0.095 0.123 0.123 0.137 0.112 0.145 0.136Gabon 0.059 0.095 0.124 0.123 0.137 0.112 0.145 0.136Tunisia 0.059 0.095 0.124 0.124 0.137 0.112 0.146 0.136St. Kitts & Nevis 0.059 0.096 0.124 0.124 0.137 0.112 0.146 0.136Uruguay 0.059 0.096 0.124 0.124 0.137 0.113 0.146 0.136Slovakia 0.059 0.096 0.125 0.124 0.137 0.113 0.146 0.136Hungary 0.058 0.097 0.126 0.126 0.138 0.114 0.147 0.138Argentina 0.056 0.099 0.128 0.127 0.140 0.116 0.148 0.139Oman 0.055 0.099 0.128 0.128 0.140 0.117 0.148 0.140Qatar 0.054 0.100 0.129 0.129 0.141 0.118 0.148 0.140Slovenia 0.054 0.101 0.130 0.129 0.142 0.118 0.149 0.141
High-income countries:
Czech Republic 0.053 0.101 0.130 0.130 0.142 0.119 0.149 0.141Greece 0.051 0.102 0.132 0.131 0.143 0.120 0.150 0.142Korea 0.051 0.102 0.132 0.132 0.143 0.121 0.150 0.142Portugal 0.050 0.103 0.132 0.132 0.143 0.121 0.150 0.143Spain 0.050 0.103 0.132 0.132 0.144 0.121 0.150 0.143Ireland 0.049 0.103 0.133 0.132 0.144 0.122 0.151 0.143Singapore 0.048 0.104 0.133 0.133 0.144 0.122 0.151 0.143Mauritius 0.047 0.104 0.134 0.134 0.145 0.123 0.151 0.144Israel 0.046 0.105 0.134 0.134 0.145 0.123 0.152 0.144New Zealand 0.046 0.105 0.135 0.134 0.145 0.124 0.152 0.145
—Continued

66Cross-Price Elasticities of Demand Across 114 Countries / TB-1925
Economic Research Service / USDA
Appendix table 14
Slutsky cross-price elasticity with price change for transport and communication, 114 countries in 19961—Continued
Food, Clothing Gross beverage, & rent, fuel, House Medical & tobacco footwear & power operations care Education Recreation2 Other
High-income countries—Continued
Finland 0.045 0.105 0.135 0.134 0.146 0.124 0.152 0.145Bahamas 0.045 0.105 0.135 0.135 0.146 0.124 0.152 0.145Sweden 0.042 0.106 0.136 0.136 0.147 0.125 0.153 0.146Netherlands 0.042 0.106 0.136 0.136 0.147 0.125 0.153 0.146France 0.039 0.107 0.137 0.137 0.148 0.126 0.154 0.147United Kingdom 0.039 0.107 0.137 0.137 0.148 0.126 0.154 0.147Belgium 0.039 0.107 0.138 0.137 0.148 0.127 0.154 0.147Norway 0.038 0.107 0.138 0.137 0.148 0.127 0.154 0.147Italy 0.038 0.107 0.138 0.137 0.148 0.127 0.154 0.147Austria 0.037 0.108 0.138 0.138 0.148 0.127 0.154 0.148Germany 0.037 0.108 0.138 0.138 0.148 0.127 0.154 0.148Australia 0.036 0.108 0.138 0.138 0.149 0.128 0.154 0.148Japan 0.035 0.108 0.139 0.138 0.149 0.128 0.155 0.148Canada 0.034 0.109 0.139 0.139 0.149 0.128 0.155 0.148Bermuda 0.032 0.109 0.140 0.139 0.150 0.129 0.155 0.149Switzerland 0.031 0.109 0.140 0.140 0.150 0.129 0.155 0.149Barbados 0.031 0.109 0.140 0.140 0.150 0.129 0.155 0.149Hong Kong 0.031 0.109 0.140 0.140 0.150 0.129 0.155 0.149Iceland 0.030 0.109 0.140 0.140 0.150 0.129 0.155 0.149Denmark 0.030 0.110 0.140 0.140 0.150 0.129 0.156 0.149Luxembourg 0.016 0.112 0.143 0.143 0.153 0.133 0.158 0.152United States 0.013 0.113 0.144 0.143 0.153 0.133 0.158 0.152
Low-income average 0.058 0.073 0.100 0.099 0.128 0.086 0.173 0.125Middle-income average 0.060 0.092 0.120 0.119 0.134 0.108 0.144 0.133High-income average 0.039 0.107 0.137 0.136 0.147 0.126 0.153 0.1461Countries are reported based on ascending per capita real income levels.2As the estimated budget share was negative for Tanzania we do not report the elasticity for this country.
Source: Authors' calculation using the 1996 ICP data.

67Cross-Price Elasticities of Demand Across 114 Countries / TB-1925
Economic Research Service / USDA
Appendix table 15
Cournot cross-price elasticity with price change for transport/communication, 114 countries in 19961
Food, Clothing Gross beverage, & rent, fuel, House Medical & tobacco footwear & power operations care Education Recreation2 Other
Low-income countries:
Tanzania 0.006 0.007 0.010 0.010 0.022 0.008 0.019Nigeria 0.005 0.006 0.008 0.008 0.013 0.006 0.039 0.012Tajikistan 0.004 0.005 0.007 0.007 0.011 0.006 0.021 0.010Zambia 0.004 0.005 0.007 0.007 0.010 0.006 0.020 0.010Yemen 0.004 0.005 0.007 0.007 0.010 0.006 0.019 0.010Malawi 0.004 0.004 0.006 0.006 0.009 0.005 0.015 0.009Madagascar 0.004 0.004 0.006 0.006 0.009 0.005 0.015 0.009Mali 0.004 0.004 0.006 0.006 0.009 0.005 0.014 0.008Mongolia 0.004 0.004 0.006 0.006 0.009 0.005 0.014 0.008Benin 0.003 0.004 0.005 0.005 0.007 0.004 0.009 0.006Kenya 0.003 0.003 0.004 0.004 0.006 0.004 0.008 0.006Sierra Leone 0.002 0.003 0.004 0.004 0.005 0.003 0.007 0.005Nepal 0.002 0.003 0.004 0.004 0.005 0.003 0.007 0.005Turkmenistan 0.002 0.003 0.004 0.004 0.005 0.003 0.006 0.005Congo 0.002 0.002 0.003 0.003 0.004 0.003 0.005 0.004Senegal 0.002 0.002 0.003 0.003 0.004 0.003 0.005 0.004Vietnam 0.002 0.002 0.003 0.003 0.004 0.002 0.004 0.004Bangladesh 0.002 0.002 0.003 0.003 0.004 0.002 0.004 0.003Pakistan 0.001 0.002 0.002 0.002 0.003 0.002 0.003 0.003Azerbaijan 0.001 0.001 0.002 0.002 0.002 0.002 0.003 0.002Côte d'Ivoire 0.001 0.001 0.002 0.002 0.002 0.001 0.002 0.002Paraguay 0.001 0.001 0.002 0.002 0.002 0.001 0.002 0.002Uzbekistan 0.001 0.001 0.001 0.001 0.002 0.001 0.002 0.002Kyrgyzstan 0.001 0.001 0.001 0.001 0.002 0.001 0.002 0.002Cameroon 0.001 0.001 0.001 0.001 0.002 0.001 0.002 0.002Moldova 0.001 0.001 0.001 0.001 0.002 0.001 0.002 0.002Bolivia 0.001 0.001 0.001 0.001 0.001 0.001 0.002 0.001Ecuador 0.001 0.001 0.001 0.001 0.001 0.001 0.001 0.001Armenia 0.000 0.001 0.001 0.001 0.001 0.001 0.001 0.001Sri Lanka 0.000 0.001 0.001 0.001 0.001 0.001 0.001 0.001Jordan 0.000 0.000 0.000 0.000 0.001 0.000 0.001 0.001Albania 0.000 0.000 0.000 0.000 0.000 0.000 0.000 0.000Indonesia 0.000 0.000 0.000 0.000 0.000 0.000 0.000 0.000Jamaica 0.000 0.000 0.000 0.000 0.000 0.000 0.000 0.000Zimbabwe 0.000 0.000 0.000 0.000 0.000 0.000 0.000 0.000Guinea 0.000 0.000 0.000 0.000 0.000 0.000 0.000 0.000Syria 0.000 0.000 0.000 0.000 -0.001 0.000 -0.001 -0.001Georgia 0.000 0.000 0.000 0.000 -0.001 0.000 -0.001 -0.001
Middle-income countries:
Ukraine -0.001 -0.001 -0.001 -0.001 -0.001 -0.001 -0.001 -0.001Philippines -0.001 -0.001 -0.001 -0.001 -0.001 -0.001 -0.002 -0.001Peru -0.001 -0.001 -0.001 -0.001 -0.002 -0.001 -0.002 -0.002Botswana -0.001 -0.001 -0.001 -0.001 -0.002 -0.001 -0.002 -0.002Thailand -0.001 -0.001 -0.001 -0.001 -0.002 -0.001 -0.002 -0.002Morocco -0.001 -0.001 -0.002 -0.002 -0.002 -0.001 -0.002 -0.002Venezuela -0.001 -0.001 -0.002 -0.002 -0.002 -0.001 -0.002 -0.002Macedonia -0.001 -0.001 -0.002 -0.002 -0.002 -0.002 -0.002 -0.002Belize -0.001 -0.001 -0.002 -0.002 -0.002 -0.002 -0.002 -0.002
—Continued
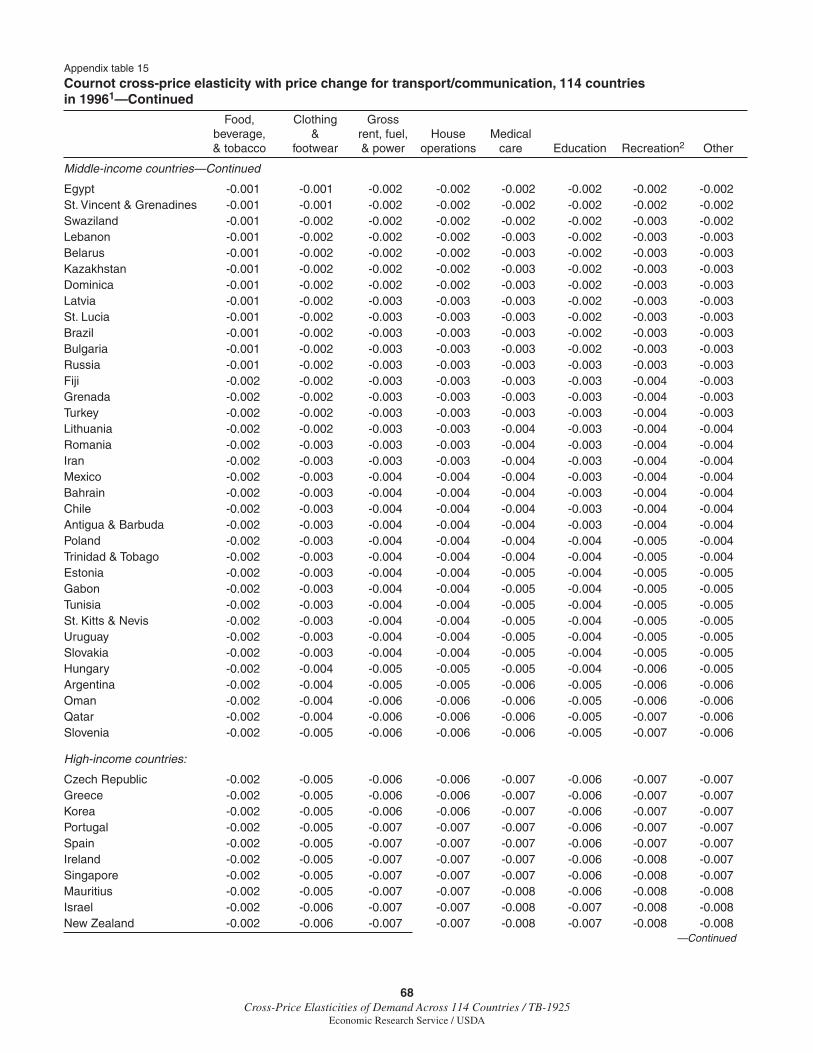
68Cross-Price Elasticities of Demand Across 114 Countries / TB-1925
Economic Research Service / USDA
Appendix table 15
Cournot cross-price elasticity with price change for transport/communication, 114 countries in 19961—Continued
Food, Clothing Gross beverage, & rent, fuel, House Medical & tobacco footwear & power operations care Education Recreation2 Other
Middle-income countries—Continued
Egypt -0.001 -0.001 -0.002 -0.002 -0.002 -0.002 -0.002 -0.002St. Vincent & Grenadines -0.001 -0.001 -0.002 -0.002 -0.002 -0.002 -0.002 -0.002Swaziland -0.001 -0.002 -0.002 -0.002 -0.002 -0.002 -0.003 -0.002Lebanon -0.001 -0.002 -0.002 -0.002 -0.003 -0.002 -0.003 -0.003Belarus -0.001 -0.002 -0.002 -0.002 -0.003 -0.002 -0.003 -0.003Kazakhstan -0.001 -0.002 -0.002 -0.002 -0.003 -0.002 -0.003 -0.003Dominica -0.001 -0.002 -0.002 -0.002 -0.003 -0.002 -0.003 -0.003Latvia -0.001 -0.002 -0.003 -0.003 -0.003 -0.002 -0.003 -0.003St. Lucia -0.001 -0.002 -0.003 -0.003 -0.003 -0.002 -0.003 -0.003Brazil -0.001 -0.002 -0.003 -0.003 -0.003 -0.002 -0.003 -0.003Bulgaria -0.001 -0.002 -0.003 -0.003 -0.003 -0.002 -0.003 -0.003Russia -0.001 -0.002 -0.003 -0.003 -0.003 -0.003 -0.003 -0.003Fiji -0.002 -0.002 -0.003 -0.003 -0.003 -0.003 -0.004 -0.003Grenada -0.002 -0.002 -0.003 -0.003 -0.003 -0.003 -0.004 -0.003Turkey -0.002 -0.002 -0.003 -0.003 -0.003 -0.003 -0.004 -0.003Lithuania -0.002 -0.002 -0.003 -0.003 -0.004 -0.003 -0.004 -0.004Romania -0.002 -0.003 -0.003 -0.003 -0.004 -0.003 -0.004 -0.004Iran -0.002 -0.003 -0.003 -0.003 -0.004 -0.003 -0.004 -0.004Mexico -0.002 -0.003 -0.004 -0.004 -0.004 -0.003 -0.004 -0.004Bahrain -0.002 -0.003 -0.004 -0.004 -0.004 -0.003 -0.004 -0.004Chile -0.002 -0.003 -0.004 -0.004 -0.004 -0.003 -0.004 -0.004Antigua & Barbuda -0.002 -0.003 -0.004 -0.004 -0.004 -0.003 -0.004 -0.004Poland -0.002 -0.003 -0.004 -0.004 -0.004 -0.004 -0.005 -0.004Trinidad & Tobago -0.002 -0.003 -0.004 -0.004 -0.004 -0.004 -0.005 -0.004Estonia -0.002 -0.003 -0.004 -0.004 -0.005 -0.004 -0.005 -0.005Gabon -0.002 -0.003 -0.004 -0.004 -0.005 -0.004 -0.005 -0.005Tunisia -0.002 -0.003 -0.004 -0.004 -0.005 -0.004 -0.005 -0.005St. Kitts & Nevis -0.002 -0.003 -0.004 -0.004 -0.005 -0.004 -0.005 -0.005Uruguay -0.002 -0.003 -0.004 -0.004 -0.005 -0.004 -0.005 -0.005Slovakia -0.002 -0.003 -0.004 -0.004 -0.005 -0.004 -0.005 -0.005Hungary -0.002 -0.004 -0.005 -0.005 -0.005 -0.004 -0.006 -0.005Argentina -0.002 -0.004 -0.005 -0.005 -0.006 -0.005 -0.006 -0.006Oman -0.002 -0.004 -0.006 -0.006 -0.006 -0.005 -0.006 -0.006Qatar -0.002 -0.004 -0.006 -0.006 -0.006 -0.005 -0.007 -0.006Slovenia -0.002 -0.005 -0.006 -0.006 -0.006 -0.005 -0.007 -0.006
High-income countries:
Czech Republic -0.002 -0.005 -0.006 -0.006 -0.007 -0.006 -0.007 -0.007Greece -0.002 -0.005 -0.006 -0.006 -0.007 -0.006 -0.007 -0.007Korea -0.002 -0.005 -0.006 -0.006 -0.007 -0.006 -0.007 -0.007Portugal -0.002 -0.005 -0.007 -0.007 -0.007 -0.006 -0.007 -0.007Spain -0.002 -0.005 -0.007 -0.007 -0.007 -0.006 -0.007 -0.007Ireland -0.002 -0.005 -0.007 -0.007 -0.007 -0.006 -0.008 -0.007Singapore -0.002 -0.005 -0.007 -0.007 -0.007 -0.006 -0.008 -0.007Mauritius -0.002 -0.005 -0.007 -0.007 -0.008 -0.006 -0.008 -0.008Israel -0.002 -0.006 -0.007 -0.007 -0.008 -0.007 -0.008 -0.008New Zealand -0.002 -0.006 -0.007 -0.007 -0.008 -0.007 -0.008 -0.008
—Continued
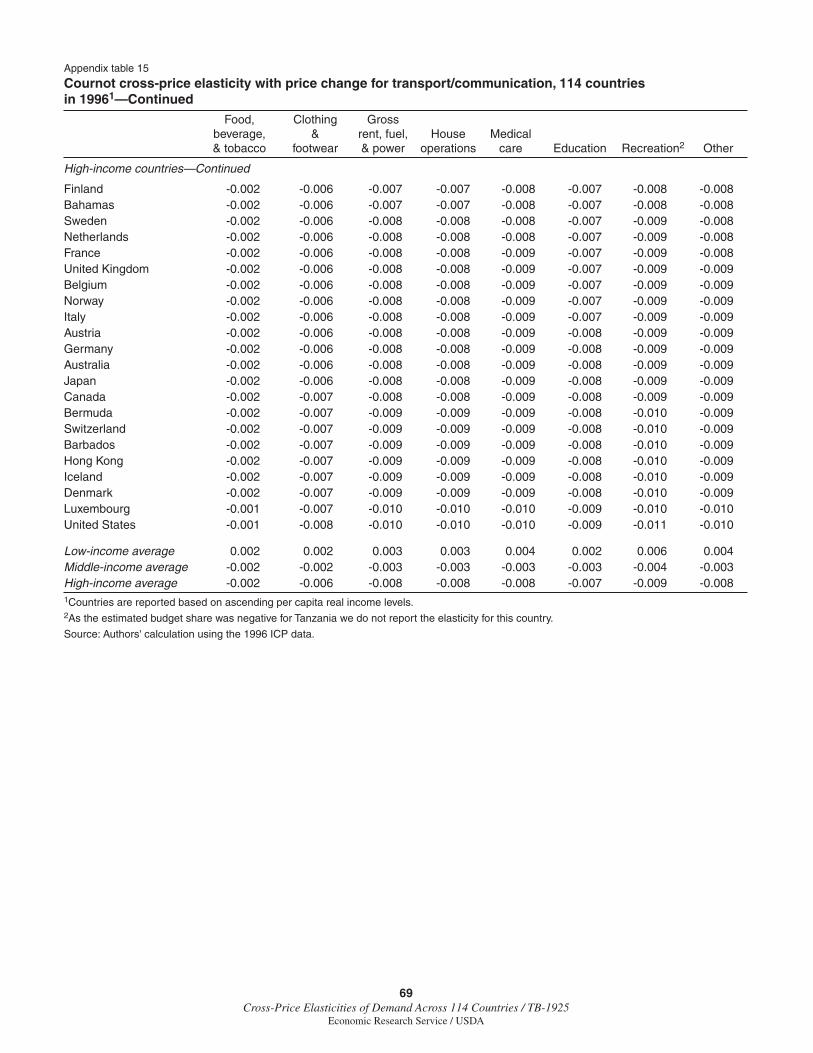
69Cross-Price Elasticities of Demand Across 114 Countries / TB-1925
Economic Research Service / USDA
Appendix table 15
Cournot cross-price elasticity with price change for transport/communication, 114 countries in 19961—Continued
Food, Clothing Gross beverage, & rent, fuel, House Medical & tobacco footwear & power operations care Education Recreation2 Other
High-income countries—Continued
Finland -0.002 -0.006 -0.007 -0.007 -0.008 -0.007 -0.008 -0.008Bahamas -0.002 -0.006 -0.007 -0.007 -0.008 -0.007 -0.008 -0.008Sweden -0.002 -0.006 -0.008 -0.008 -0.008 -0.007 -0.009 -0.008Netherlands -0.002 -0.006 -0.008 -0.008 -0.008 -0.007 -0.009 -0.008France -0.002 -0.006 -0.008 -0.008 -0.009 -0.007 -0.009 -0.008United Kingdom -0.002 -0.006 -0.008 -0.008 -0.009 -0.007 -0.009 -0.009Belgium -0.002 -0.006 -0.008 -0.008 -0.009 -0.007 -0.009 -0.009Norway -0.002 -0.006 -0.008 -0.008 -0.009 -0.007 -0.009 -0.009Italy -0.002 -0.006 -0.008 -0.008 -0.009 -0.007 -0.009 -0.009Austria -0.002 -0.006 -0.008 -0.008 -0.009 -0.008 -0.009 -0.009Germany -0.002 -0.006 -0.008 -0.008 -0.009 -0.008 -0.009 -0.009Australia -0.002 -0.006 -0.008 -0.008 -0.009 -0.008 -0.009 -0.009Japan -0.002 -0.006 -0.008 -0.008 -0.009 -0.008 -0.009 -0.009Canada -0.002 -0.007 -0.008 -0.008 -0.009 -0.008 -0.009 -0.009Bermuda -0.002 -0.007 -0.009 -0.009 -0.009 -0.008 -0.010 -0.009Switzerland -0.002 -0.007 -0.009 -0.009 -0.009 -0.008 -0.010 -0.009Barbados -0.002 -0.007 -0.009 -0.009 -0.009 -0.008 -0.010 -0.009Hong Kong -0.002 -0.007 -0.009 -0.009 -0.009 -0.008 -0.010 -0.009Iceland -0.002 -0.007 -0.009 -0.009 -0.009 -0.008 -0.010 -0.009Denmark -0.002 -0.007 -0.009 -0.009 -0.009 -0.008 -0.010 -0.009Luxembourg -0.001 -0.007 -0.010 -0.010 -0.010 -0.009 -0.010 -0.010United States -0.001 -0.008 -0.010 -0.010 -0.010 -0.009 -0.011 -0.010
Low-income average 0.002 0.002 0.003 0.003 0.004 0.002 0.006 0.004Middle-income average -0.002 -0.002 -0.003 -0.003 -0.003 -0.003 -0.004 -0.003High-income average -0.002 -0.006 -0.008 -0.008 -0.008 -0.007 -0.009 -0.0081Countries are reported based on ascending per capita real income levels.2As the estimated budget share was negative for Tanzania we do not report the elasticity for this country.
Source: Authors' calculation using the 1996 ICP data.
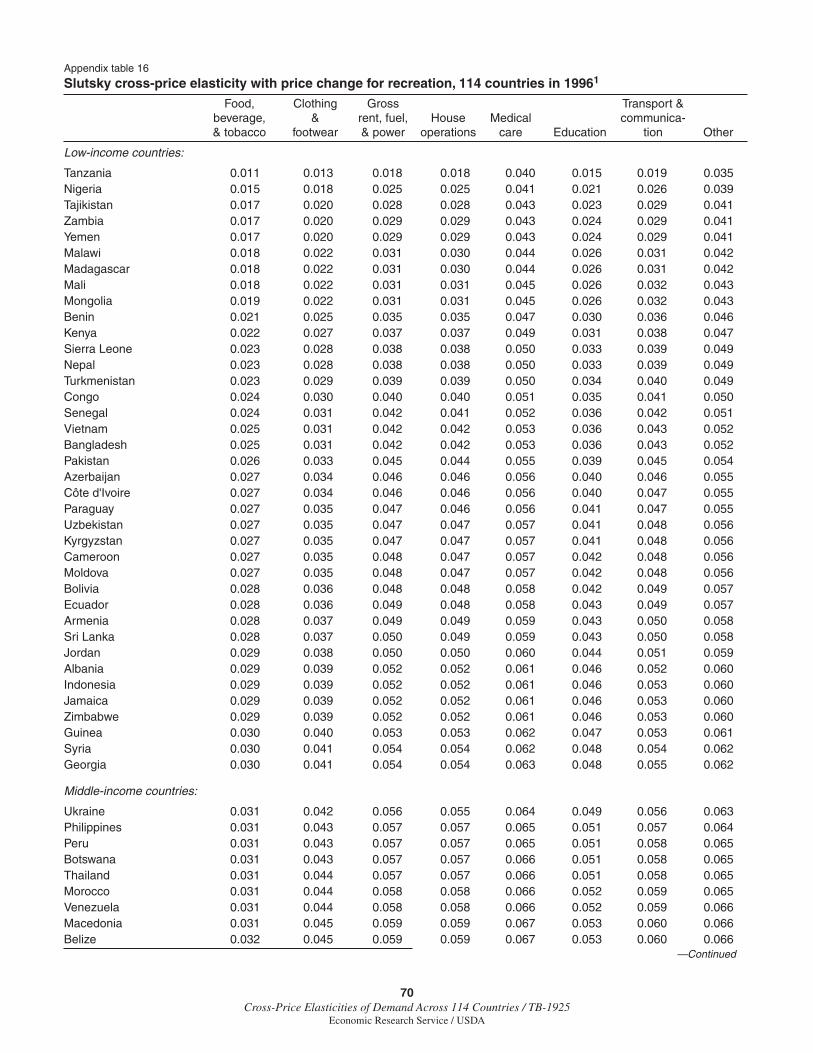
70Cross-Price Elasticities of Demand Across 114 Countries / TB-1925
Economic Research Service / USDA
Appendix table 16
Slutsky cross-price elasticity with price change for recreation, 114 countries in 19961
Food, Clothing Gross Transport & beverage, & rent, fuel, House Medical communica- & tobacco footwear & power operations care Education tion Other
Low-income countries:
Tanzania 0.011 0.013 0.018 0.018 0.040 0.015 0.019 0.035Nigeria 0.015 0.018 0.025 0.025 0.041 0.021 0.026 0.039Tajikistan 0.017 0.020 0.028 0.028 0.043 0.023 0.029 0.041Zambia 0.017 0.020 0.029 0.029 0.043 0.024 0.029 0.041Yemen 0.017 0.020 0.029 0.029 0.043 0.024 0.029 0.041Malawi 0.018 0.022 0.031 0.030 0.044 0.026 0.031 0.042Madagascar 0.018 0.022 0.031 0.030 0.044 0.026 0.031 0.042Mali 0.018 0.022 0.031 0.031 0.045 0.026 0.032 0.043Mongolia 0.019 0.022 0.031 0.031 0.045 0.026 0.032 0.043Benin 0.021 0.025 0.035 0.035 0.047 0.030 0.036 0.046Kenya 0.022 0.027 0.037 0.037 0.049 0.031 0.038 0.047Sierra Leone 0.023 0.028 0.038 0.038 0.050 0.033 0.039 0.049Nepal 0.023 0.028 0.038 0.038 0.050 0.033 0.039 0.049Turkmenistan 0.023 0.029 0.039 0.039 0.050 0.034 0.040 0.049Congo 0.024 0.030 0.040 0.040 0.051 0.035 0.041 0.050Senegal 0.024 0.031 0.042 0.041 0.052 0.036 0.042 0.051Vietnam 0.025 0.031 0.042 0.042 0.053 0.036 0.043 0.052Bangladesh 0.025 0.031 0.042 0.042 0.053 0.036 0.043 0.052Pakistan 0.026 0.033 0.045 0.044 0.055 0.039 0.045 0.054Azerbaijan 0.027 0.034 0.046 0.046 0.056 0.040 0.046 0.055Côte d'Ivoire 0.027 0.034 0.046 0.046 0.056 0.040 0.047 0.055Paraguay 0.027 0.035 0.047 0.046 0.056 0.041 0.047 0.055Uzbekistan 0.027 0.035 0.047 0.047 0.057 0.041 0.048 0.056Kyrgyzstan 0.027 0.035 0.047 0.047 0.057 0.041 0.048 0.056Cameroon 0.027 0.035 0.048 0.047 0.057 0.042 0.048 0.056Moldova 0.027 0.035 0.048 0.047 0.057 0.042 0.048 0.056Bolivia 0.028 0.036 0.048 0.048 0.058 0.042 0.049 0.057Ecuador 0.028 0.036 0.049 0.048 0.058 0.043 0.049 0.057Armenia 0.028 0.037 0.049 0.049 0.059 0.043 0.050 0.058Sri Lanka 0.028 0.037 0.050 0.049 0.059 0.043 0.050 0.058Jordan 0.029 0.038 0.050 0.050 0.060 0.044 0.051 0.059Albania 0.029 0.039 0.052 0.052 0.061 0.046 0.052 0.060Indonesia 0.029 0.039 0.052 0.052 0.061 0.046 0.053 0.060Jamaica 0.029 0.039 0.052 0.052 0.061 0.046 0.053 0.060Zimbabwe 0.029 0.039 0.052 0.052 0.061 0.046 0.053 0.060Guinea 0.030 0.040 0.053 0.053 0.062 0.047 0.053 0.061Syria 0.030 0.041 0.054 0.054 0.062 0.048 0.054 0.062Georgia 0.030 0.041 0.054 0.054 0.063 0.048 0.055 0.062
Middle-income countries:
Ukraine 0.031 0.042 0.056 0.055 0.064 0.049 0.056 0.063Philippines 0.031 0.043 0.057 0.057 0.065 0.051 0.057 0.064Peru 0.031 0.043 0.057 0.057 0.065 0.051 0.058 0.065Botswana 0.031 0.043 0.057 0.057 0.066 0.051 0.058 0.065Thailand 0.031 0.044 0.057 0.057 0.066 0.051 0.058 0.065Morocco 0.031 0.044 0.058 0.058 0.066 0.052 0.059 0.065Venezuela 0.031 0.044 0.058 0.058 0.066 0.052 0.059 0.066Macedonia 0.031 0.045 0.059 0.059 0.067 0.053 0.060 0.066Belize 0.032 0.045 0.059 0.059 0.067 0.053 0.060 0.066
—Continued
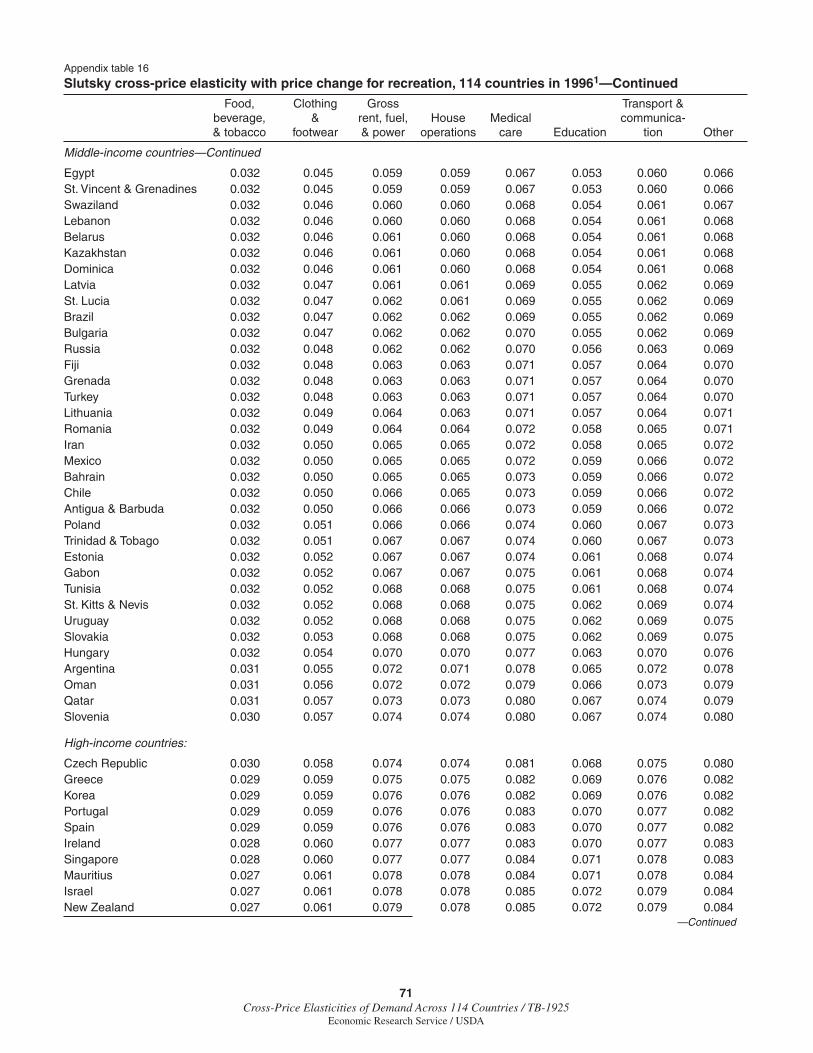
71Cross-Price Elasticities of Demand Across 114 Countries / TB-1925
Economic Research Service / USDA
Appendix table 16
Slutsky cross-price elasticity with price change for recreation, 114 countries in 19961—Continued
Food, Clothing Gross Transport & beverage, & rent, fuel, House Medical communica- & tobacco footwear & power operations care Education tion Other
Middle-income countries—Continued
Egypt 0.032 0.045 0.059 0.059 0.067 0.053 0.060 0.066St. Vincent & Grenadines 0.032 0.045 0.059 0.059 0.067 0.053 0.060 0.066Swaziland 0.032 0.046 0.060 0.060 0.068 0.054 0.061 0.067Lebanon 0.032 0.046 0.060 0.060 0.068 0.054 0.061 0.068Belarus 0.032 0.046 0.061 0.060 0.068 0.054 0.061 0.068Kazakhstan 0.032 0.046 0.061 0.060 0.068 0.054 0.061 0.068Dominica 0.032 0.046 0.061 0.060 0.068 0.054 0.061 0.068Latvia 0.032 0.047 0.061 0.061 0.069 0.055 0.062 0.069St. Lucia 0.032 0.047 0.062 0.061 0.069 0.055 0.062 0.069Brazil 0.032 0.047 0.062 0.062 0.069 0.055 0.062 0.069Bulgaria 0.032 0.047 0.062 0.062 0.070 0.055 0.062 0.069Russia 0.032 0.048 0.062 0.062 0.070 0.056 0.063 0.069Fiji 0.032 0.048 0.063 0.063 0.071 0.057 0.064 0.070Grenada 0.032 0.048 0.063 0.063 0.071 0.057 0.064 0.070Turkey 0.032 0.048 0.063 0.063 0.071 0.057 0.064 0.070Lithuania 0.032 0.049 0.064 0.063 0.071 0.057 0.064 0.071Romania 0.032 0.049 0.064 0.064 0.072 0.058 0.065 0.071Iran 0.032 0.050 0.065 0.065 0.072 0.058 0.065 0.072Mexico 0.032 0.050 0.065 0.065 0.072 0.059 0.066 0.072Bahrain 0.032 0.050 0.065 0.065 0.073 0.059 0.066 0.072Chile 0.032 0.050 0.066 0.065 0.073 0.059 0.066 0.072Antigua & Barbuda 0.032 0.050 0.066 0.066 0.073 0.059 0.066 0.072Poland 0.032 0.051 0.066 0.066 0.074 0.060 0.067 0.073Trinidad & Tobago 0.032 0.051 0.067 0.067 0.074 0.060 0.067 0.073Estonia 0.032 0.052 0.067 0.067 0.074 0.061 0.068 0.074Gabon 0.032 0.052 0.067 0.067 0.075 0.061 0.068 0.074Tunisia 0.032 0.052 0.068 0.068 0.075 0.061 0.068 0.074St. Kitts & Nevis 0.032 0.052 0.068 0.068 0.075 0.062 0.069 0.074Uruguay 0.032 0.052 0.068 0.068 0.075 0.062 0.069 0.075Slovakia 0.032 0.053 0.068 0.068 0.075 0.062 0.069 0.075Hungary 0.032 0.054 0.070 0.070 0.077 0.063 0.070 0.076Argentina 0.031 0.055 0.072 0.071 0.078 0.065 0.072 0.078Oman 0.031 0.056 0.072 0.072 0.079 0.066 0.073 0.079Qatar 0.031 0.057 0.073 0.073 0.080 0.067 0.074 0.079Slovenia 0.030 0.057 0.074 0.074 0.080 0.067 0.074 0.080
High-income countries:
Czech Republic 0.030 0.058 0.074 0.074 0.081 0.068 0.075 0.080Greece 0.029 0.059 0.075 0.075 0.082 0.069 0.076 0.082Korea 0.029 0.059 0.076 0.076 0.082 0.069 0.076 0.082Portugal 0.029 0.059 0.076 0.076 0.083 0.070 0.077 0.082Spain 0.029 0.059 0.076 0.076 0.083 0.070 0.077 0.082Ireland 0.028 0.060 0.077 0.077 0.083 0.070 0.077 0.083Singapore 0.028 0.060 0.077 0.077 0.084 0.071 0.078 0.083Mauritius 0.027 0.061 0.078 0.078 0.084 0.071 0.078 0.084Israel 0.027 0.061 0.078 0.078 0.085 0.072 0.079 0.084New Zealand 0.027 0.061 0.079 0.078 0.085 0.072 0.079 0.084
—Continued
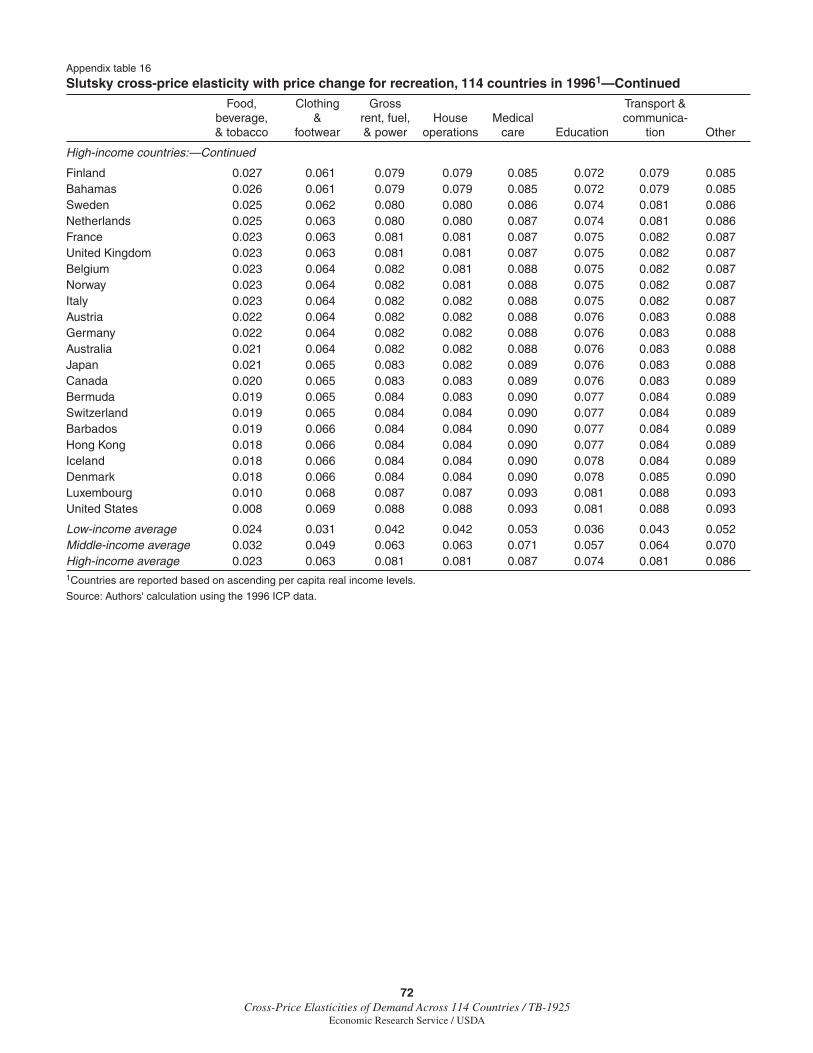
72Cross-Price Elasticities of Demand Across 114 Countries / TB-1925
Economic Research Service / USDA
Appendix table 16
Slutsky cross-price elasticity with price change for recreation, 114 countries in 19961—Continued
Food, Clothing Gross Transport & beverage, & rent, fuel, House Medical communica- & tobacco footwear & power operations care Education tion Other
High-income countries:—Continued
Finland 0.027 0.061 0.079 0.079 0.085 0.072 0.079 0.085Bahamas 0.026 0.061 0.079 0.079 0.085 0.072 0.079 0.085Sweden 0.025 0.062 0.080 0.080 0.086 0.074 0.081 0.086Netherlands 0.025 0.063 0.080 0.080 0.087 0.074 0.081 0.086France 0.023 0.063 0.081 0.081 0.087 0.075 0.082 0.087United Kingdom 0.023 0.063 0.081 0.081 0.087 0.075 0.082 0.087Belgium 0.023 0.064 0.082 0.081 0.088 0.075 0.082 0.087Norway 0.023 0.064 0.082 0.081 0.088 0.075 0.082 0.087Italy 0.023 0.064 0.082 0.082 0.088 0.075 0.082 0.087Austria 0.022 0.064 0.082 0.082 0.088 0.076 0.083 0.088Germany 0.022 0.064 0.082 0.082 0.088 0.076 0.083 0.088Australia 0.021 0.064 0.082 0.082 0.088 0.076 0.083 0.088Japan 0.021 0.065 0.083 0.082 0.089 0.076 0.083 0.088Canada 0.020 0.065 0.083 0.083 0.089 0.076 0.083 0.089Bermuda 0.019 0.065 0.084 0.083 0.090 0.077 0.084 0.089Switzerland 0.019 0.065 0.084 0.084 0.090 0.077 0.084 0.089Barbados 0.019 0.066 0.084 0.084 0.090 0.077 0.084 0.089Hong Kong 0.018 0.066 0.084 0.084 0.090 0.077 0.084 0.089Iceland 0.018 0.066 0.084 0.084 0.090 0.078 0.084 0.089Denmark 0.018 0.066 0.084 0.084 0.090 0.078 0.085 0.090Luxembourg 0.010 0.068 0.087 0.087 0.093 0.081 0.088 0.093United States 0.008 0.069 0.088 0.088 0.093 0.081 0.088 0.093
Low-income average 0.024 0.031 0.042 0.042 0.053 0.036 0.043 0.052Middle-income average 0.032 0.049 0.063 0.063 0.071 0.057 0.064 0.070High-income average 0.023 0.063 0.081 0.081 0.087 0.074 0.081 0.0861Countries are reported based on ascending per capita real income levels.
Source: Authors' calculation using the 1996 ICP data.
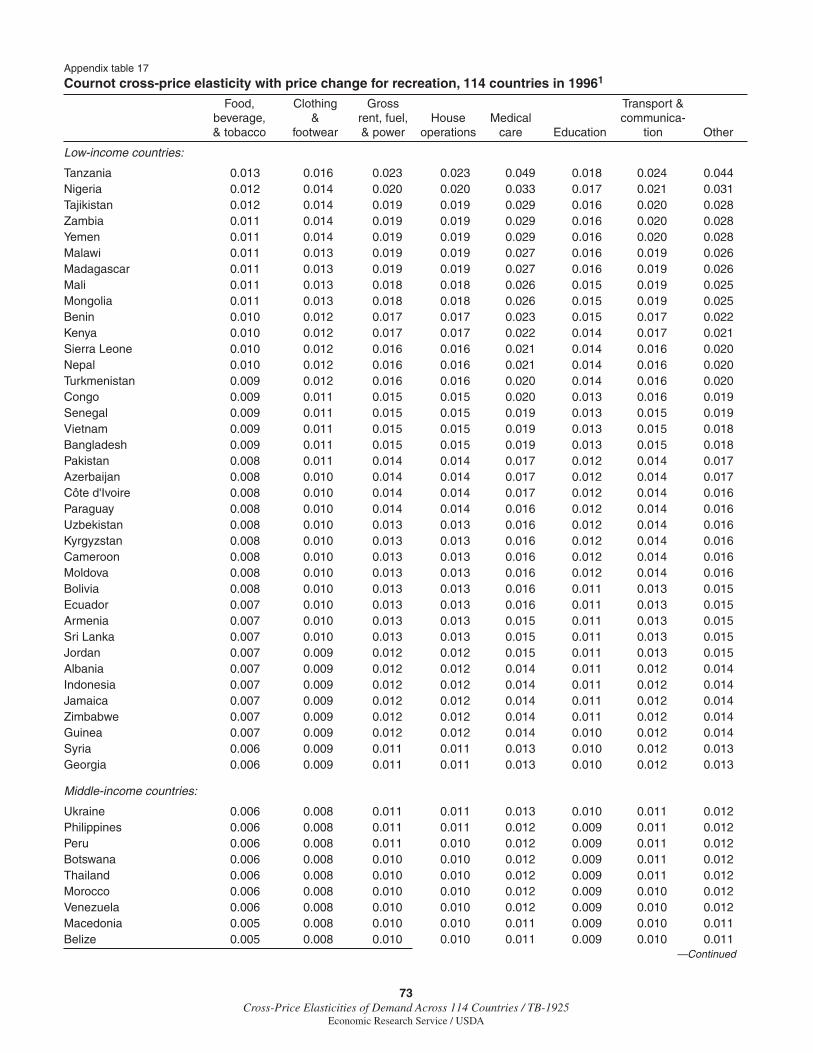
73Cross-Price Elasticities of Demand Across 114 Countries / TB-1925
Economic Research Service / USDA
Appendix table 17
Cournot cross-price elasticity with price change for recreation, 114 countries in 19961
Food, Clothing Gross Transport & beverage, & rent, fuel, House Medical communica- & tobacco footwear & power operations care Education tion Other
Low-income countries:
Tanzania 0.013 0.016 0.023 0.023 0.049 0.018 0.024 0.044Nigeria 0.012 0.014 0.020 0.020 0.033 0.017 0.021 0.031Tajikistan 0.012 0.014 0.019 0.019 0.029 0.016 0.020 0.028Zambia 0.011 0.014 0.019 0.019 0.029 0.016 0.020 0.028Yemen 0.011 0.014 0.019 0.019 0.029 0.016 0.020 0.028Malawi 0.011 0.013 0.019 0.019 0.027 0.016 0.019 0.026Madagascar 0.011 0.013 0.019 0.019 0.027 0.016 0.019 0.026Mali 0.011 0.013 0.018 0.018 0.026 0.015 0.019 0.025Mongolia 0.011 0.013 0.018 0.018 0.026 0.015 0.019 0.025Benin 0.010 0.012 0.017 0.017 0.023 0.015 0.017 0.022Kenya 0.010 0.012 0.017 0.017 0.022 0.014 0.017 0.021Sierra Leone 0.010 0.012 0.016 0.016 0.021 0.014 0.016 0.020Nepal 0.010 0.012 0.016 0.016 0.021 0.014 0.016 0.020Turkmenistan 0.009 0.012 0.016 0.016 0.020 0.014 0.016 0.020Congo 0.009 0.011 0.015 0.015 0.020 0.013 0.016 0.019Senegal 0.009 0.011 0.015 0.015 0.019 0.013 0.015 0.019Vietnam 0.009 0.011 0.015 0.015 0.019 0.013 0.015 0.018Bangladesh 0.009 0.011 0.015 0.015 0.019 0.013 0.015 0.018Pakistan 0.008 0.011 0.014 0.014 0.017 0.012 0.014 0.017Azerbaijan 0.008 0.010 0.014 0.014 0.017 0.012 0.014 0.017Côte d'Ivoire 0.008 0.010 0.014 0.014 0.017 0.012 0.014 0.016Paraguay 0.008 0.010 0.014 0.014 0.016 0.012 0.014 0.016Uzbekistan 0.008 0.010 0.013 0.013 0.016 0.012 0.014 0.016Kyrgyzstan 0.008 0.010 0.013 0.013 0.016 0.012 0.014 0.016Cameroon 0.008 0.010 0.013 0.013 0.016 0.012 0.014 0.016Moldova 0.008 0.010 0.013 0.013 0.016 0.012 0.014 0.016Bolivia 0.008 0.010 0.013 0.013 0.016 0.011 0.013 0.015Ecuador 0.007 0.010 0.013 0.013 0.016 0.011 0.013 0.015Armenia 0.007 0.010 0.013 0.013 0.015 0.011 0.013 0.015Sri Lanka 0.007 0.010 0.013 0.013 0.015 0.011 0.013 0.015Jordan 0.007 0.009 0.012 0.012 0.015 0.011 0.013 0.015Albania 0.007 0.009 0.012 0.012 0.014 0.011 0.012 0.014Indonesia 0.007 0.009 0.012 0.012 0.014 0.011 0.012 0.014Jamaica 0.007 0.009 0.012 0.012 0.014 0.011 0.012 0.014Zimbabwe 0.007 0.009 0.012 0.012 0.014 0.011 0.012 0.014Guinea 0.007 0.009 0.012 0.012 0.014 0.010 0.012 0.014Syria 0.006 0.009 0.011 0.011 0.013 0.010 0.012 0.013Georgia 0.006 0.009 0.011 0.011 0.013 0.010 0.012 0.013
Middle-income countries:
Ukraine 0.006 0.008 0.011 0.011 0.013 0.010 0.011 0.012Philippines 0.006 0.008 0.011 0.011 0.012 0.009 0.011 0.012Peru 0.006 0.008 0.011 0.010 0.012 0.009 0.011 0.012Botswana 0.006 0.008 0.010 0.010 0.012 0.009 0.011 0.012Thailand 0.006 0.008 0.010 0.010 0.012 0.009 0.011 0.012Morocco 0.006 0.008 0.010 0.010 0.012 0.009 0.010 0.012Venezuela 0.006 0.008 0.010 0.010 0.012 0.009 0.010 0.012Macedonia 0.005 0.008 0.010 0.010 0.011 0.009 0.010 0.011Belize 0.005 0.008 0.010 0.010 0.011 0.009 0.010 0.011
—Continued
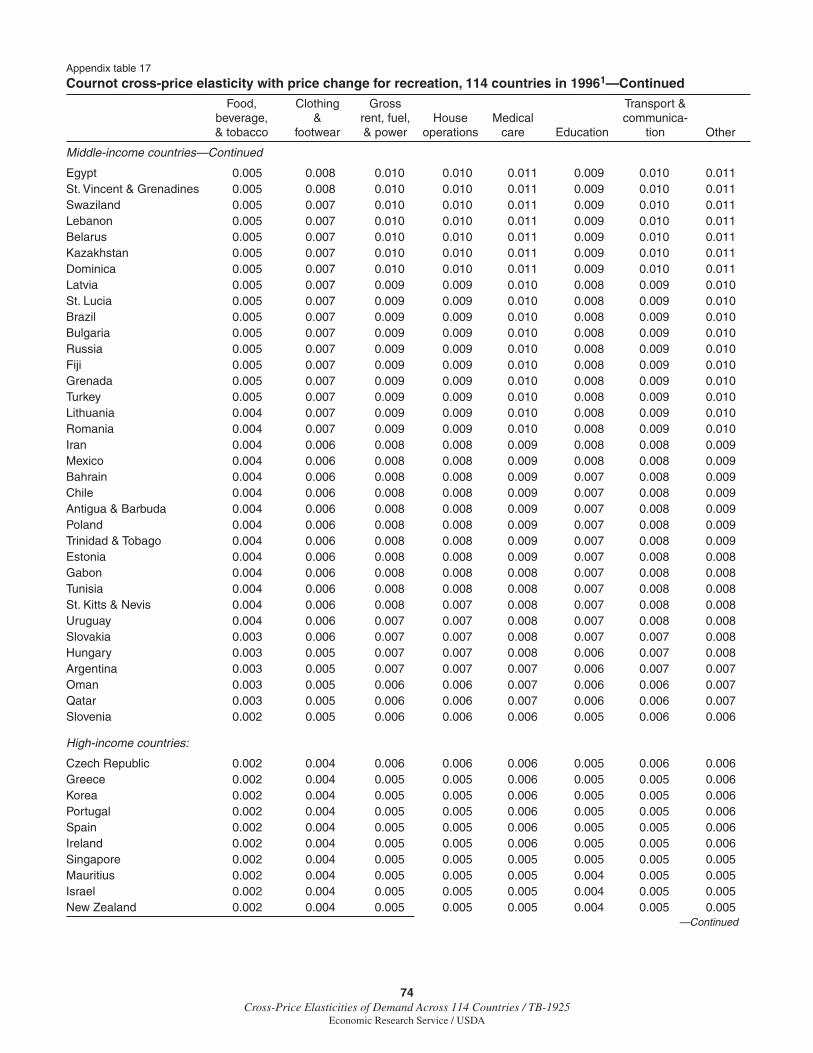
74Cross-Price Elasticities of Demand Across 114 Countries / TB-1925
Economic Research Service / USDA
Appendix table 17
Cournot cross-price elasticity with price change for recreation, 114 countries in 19961—Continued
Food, Clothing Gross Transport & beverage, & rent, fuel, House Medical communica- & tobacco footwear & power operations care Education tion Other
Middle-income countries—Continued
Egypt 0.005 0.008 0.010 0.010 0.011 0.009 0.010 0.011St. Vincent & Grenadines 0.005 0.008 0.010 0.010 0.011 0.009 0.010 0.011Swaziland 0.005 0.007 0.010 0.010 0.011 0.009 0.010 0.011Lebanon 0.005 0.007 0.010 0.010 0.011 0.009 0.010 0.011Belarus 0.005 0.007 0.010 0.010 0.011 0.009 0.010 0.011Kazakhstan 0.005 0.007 0.010 0.010 0.011 0.009 0.010 0.011Dominica 0.005 0.007 0.010 0.010 0.011 0.009 0.010 0.011Latvia 0.005 0.007 0.009 0.009 0.010 0.008 0.009 0.010St. Lucia 0.005 0.007 0.009 0.009 0.010 0.008 0.009 0.010Brazil 0.005 0.007 0.009 0.009 0.010 0.008 0.009 0.010Bulgaria 0.005 0.007 0.009 0.009 0.010 0.008 0.009 0.010Russia 0.005 0.007 0.009 0.009 0.010 0.008 0.009 0.010Fiji 0.005 0.007 0.009 0.009 0.010 0.008 0.009 0.010Grenada 0.005 0.007 0.009 0.009 0.010 0.008 0.009 0.010Turkey 0.005 0.007 0.009 0.009 0.010 0.008 0.009 0.010Lithuania 0.004 0.007 0.009 0.009 0.010 0.008 0.009 0.010Romania 0.004 0.007 0.009 0.009 0.010 0.008 0.009 0.010Iran 0.004 0.006 0.008 0.008 0.009 0.008 0.008 0.009Mexico 0.004 0.006 0.008 0.008 0.009 0.008 0.008 0.009Bahrain 0.004 0.006 0.008 0.008 0.009 0.007 0.008 0.009Chile 0.004 0.006 0.008 0.008 0.009 0.007 0.008 0.009Antigua & Barbuda 0.004 0.006 0.008 0.008 0.009 0.007 0.008 0.009Poland 0.004 0.006 0.008 0.008 0.009 0.007 0.008 0.009Trinidad & Tobago 0.004 0.006 0.008 0.008 0.009 0.007 0.008 0.009Estonia 0.004 0.006 0.008 0.008 0.009 0.007 0.008 0.008Gabon 0.004 0.006 0.008 0.008 0.008 0.007 0.008 0.008Tunisia 0.004 0.006 0.008 0.008 0.008 0.007 0.008 0.008St. Kitts & Nevis 0.004 0.006 0.008 0.007 0.008 0.007 0.008 0.008Uruguay 0.004 0.006 0.007 0.007 0.008 0.007 0.008 0.008Slovakia 0.003 0.006 0.007 0.007 0.008 0.007 0.007 0.008Hungary 0.003 0.005 0.007 0.007 0.008 0.006 0.007 0.008Argentina 0.003 0.005 0.007 0.007 0.007 0.006 0.007 0.007Oman 0.003 0.005 0.006 0.006 0.007 0.006 0.006 0.007Qatar 0.003 0.005 0.006 0.006 0.007 0.006 0.006 0.007Slovenia 0.002 0.005 0.006 0.006 0.006 0.005 0.006 0.006
High-income countries:
Czech Republic 0.002 0.004 0.006 0.006 0.006 0.005 0.006 0.006Greece 0.002 0.004 0.005 0.005 0.006 0.005 0.005 0.006Korea 0.002 0.004 0.005 0.005 0.006 0.005 0.005 0.006Portugal 0.002 0.004 0.005 0.005 0.006 0.005 0.005 0.006Spain 0.002 0.004 0.005 0.005 0.006 0.005 0.005 0.006Ireland 0.002 0.004 0.005 0.005 0.006 0.005 0.005 0.006Singapore 0.002 0.004 0.005 0.005 0.005 0.005 0.005 0.005Mauritius 0.002 0.004 0.005 0.005 0.005 0.004 0.005 0.005Israel 0.002 0.004 0.005 0.005 0.005 0.004 0.005 0.005New Zealand 0.002 0.004 0.005 0.005 0.005 0.004 0.005 0.005
—Continued

75Cross-Price Elasticities of Demand Across 114 Countries / TB-1925
Economic Research Service / USDA
Appendix table 17
Cournot cross-price elasticity with price change for recreation, 114 countries in 19961—Continued
Food, Clothing Gross Transport & beverage, & rent, fuel, House Medical communica- & tobacco footwear & power operations care Education tion Other
High-income countries—Continued
Finland 0.002 0.004 0.005 0.005 0.005 0.004 0.005 0.005Bahamas 0.002 0.004 0.005 0.005 0.005 0.004 0.005 0.005Sweden 0.001 0.003 0.004 0.004 0.005 0.004 0.004 0.004Netherlands 0.001 0.003 0.004 0.004 0.004 0.004 0.004 0.004France 0.001 0.003 0.004 0.004 0.004 0.004 0.004 0.004United Kingdom 0.001 0.003 0.004 0.004 0.004 0.004 0.004 0.004Belgium 0.001 0.003 0.004 0.004 0.004 0.004 0.004 0.004Norway 0.001 0.003 0.004 0.004 0.004 0.004 0.004 0.004Italy 0.001 0.003 0.004 0.004 0.004 0.003 0.004 0.004Austria 0.001 0.003 0.004 0.004 0.004 0.003 0.004 0.004Germany 0.001 0.003 0.004 0.004 0.004 0.003 0.004 0.004Australia 0.001 0.003 0.004 0.004 0.004 0.003 0.004 0.004Japan 0.001 0.003 0.004 0.004 0.004 0.003 0.004 0.004Canada 0.001 0.003 0.003 0.003 0.004 0.003 0.003 0.004Bermuda 0.001 0.003 0.003 0.003 0.004 0.003 0.003 0.004Switzerland 0.001 0.003 0.003 0.003 0.003 0.003 0.003 0.003Barbados 0.001 0.003 0.003 0.003 0.003 0.003 0.003 0.003Hong Kong 0.001 0.002 0.003 0.003 0.003 0.003 0.003 0.003Iceland 0.001 0.002 0.003 0.003 0.003 0.003 0.003 0.003Denmark 0.001 0.002 0.003 0.003 0.003 0.003 0.003 0.003Luxembourg 0.000 0.002 0.002 0.002 0.002 0.002 0.002 0.002United States 0.000 0.002 0.002 0.002 0.002 0.002 0.002 0.002
Low-income average 0.009 0.011 0.015 0.015 0.020 0.013 0.015 0.019Middle-income average 0.004 0.007 0.009 0.009 0.010 0.008 0.009 0.010High-income average 0.001 0.003 0.004 0.004 0.004 0.004 0.004 0.0041Countries are reported based on ascending per capita real income levels.
Source: Authors' calculation using the 1996 ICP data.
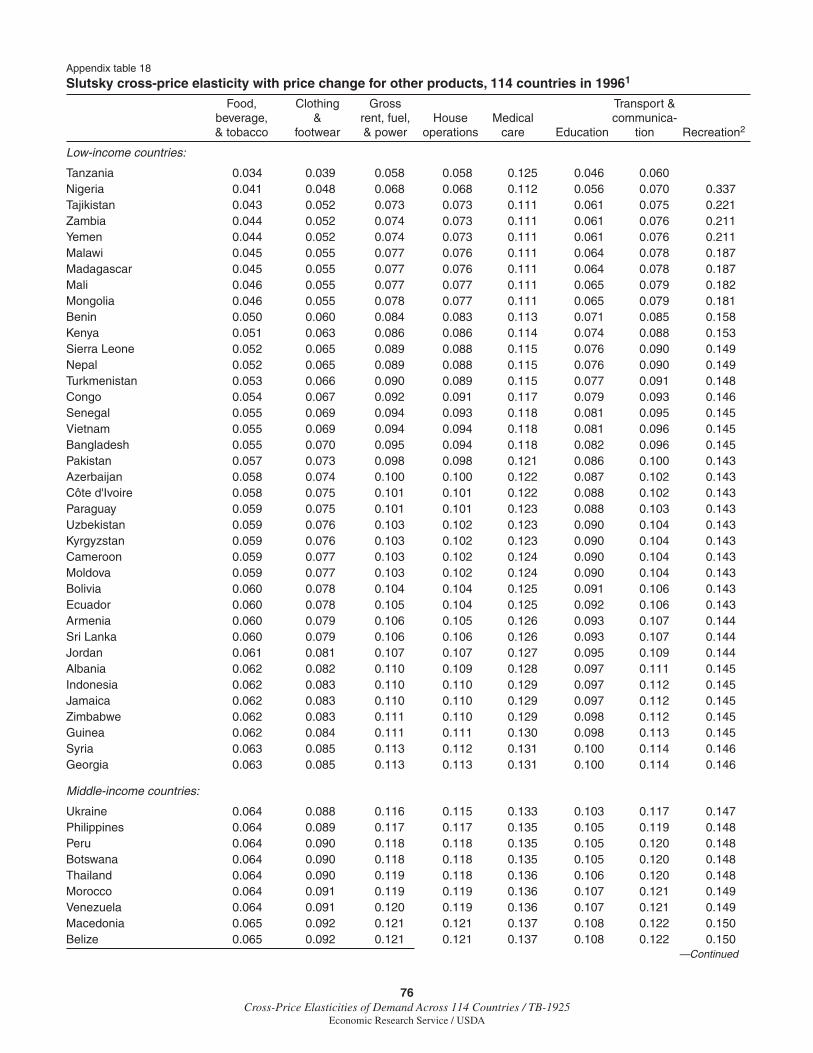
76Cross-Price Elasticities of Demand Across 114 Countries / TB-1925
Economic Research Service / USDA
Appendix table 18
Slutsky cross-price elasticity with price change for other products, 114 countries in 19961
Food, Clothing Gross Transport & beverage, & rent, fuel, House Medical communica- & tobacco footwear & power operations care Education tion Recreation2
Low-income countries:
Tanzania 0.034 0.039 0.058 0.058 0.125 0.046 0.060 Nigeria 0.041 0.048 0.068 0.068 0.112 0.056 0.070 0.337Tajikistan 0.043 0.052 0.073 0.073 0.111 0.061 0.075 0.221Zambia 0.044 0.052 0.074 0.073 0.111 0.061 0.076 0.211Yemen 0.044 0.052 0.074 0.073 0.111 0.061 0.076 0.211Malawi 0.045 0.055 0.077 0.076 0.111 0.064 0.078 0.187Madagascar 0.045 0.055 0.077 0.076 0.111 0.064 0.078 0.187Mali 0.046 0.055 0.077 0.077 0.111 0.065 0.079 0.182Mongolia 0.046 0.055 0.078 0.077 0.111 0.065 0.079 0.181Benin 0.050 0.060 0.084 0.083 0.113 0.071 0.085 0.158Kenya 0.051 0.063 0.086 0.086 0.114 0.074 0.088 0.153Sierra Leone 0.052 0.065 0.089 0.088 0.115 0.076 0.090 0.149Nepal 0.052 0.065 0.089 0.088 0.115 0.076 0.090 0.149Turkmenistan 0.053 0.066 0.090 0.089 0.115 0.077 0.091 0.148Congo 0.054 0.067 0.092 0.091 0.117 0.079 0.093 0.146Senegal 0.055 0.069 0.094 0.093 0.118 0.081 0.095 0.145Vietnam 0.055 0.069 0.094 0.094 0.118 0.081 0.096 0.145Bangladesh 0.055 0.070 0.095 0.094 0.118 0.082 0.096 0.145Pakistan 0.057 0.073 0.098 0.098 0.121 0.086 0.100 0.143Azerbaijan 0.058 0.074 0.100 0.100 0.122 0.087 0.102 0.143Côte d'Ivoire 0.058 0.075 0.101 0.101 0.122 0.088 0.102 0.143Paraguay 0.059 0.075 0.101 0.101 0.123 0.088 0.103 0.143Uzbekistan 0.059 0.076 0.103 0.102 0.123 0.090 0.104 0.143Kyrgyzstan 0.059 0.076 0.103 0.102 0.123 0.090 0.104 0.143Cameroon 0.059 0.077 0.103 0.102 0.124 0.090 0.104 0.143Moldova 0.059 0.077 0.103 0.102 0.124 0.090 0.104 0.143Bolivia 0.060 0.078 0.104 0.104 0.125 0.091 0.106 0.143Ecuador 0.060 0.078 0.105 0.104 0.125 0.092 0.106 0.143Armenia 0.060 0.079 0.106 0.105 0.126 0.093 0.107 0.144Sri Lanka 0.060 0.079 0.106 0.106 0.126 0.093 0.107 0.144Jordan 0.061 0.081 0.107 0.107 0.127 0.095 0.109 0.144Albania 0.062 0.082 0.110 0.109 0.128 0.097 0.111 0.145Indonesia 0.062 0.083 0.110 0.110 0.129 0.097 0.112 0.145Jamaica 0.062 0.083 0.110 0.110 0.129 0.097 0.112 0.145Zimbabwe 0.062 0.083 0.111 0.110 0.129 0.098 0.112 0.145Guinea 0.062 0.084 0.111 0.111 0.130 0.098 0.113 0.145Syria 0.063 0.085 0.113 0.112 0.131 0.100 0.114 0.146Georgia 0.063 0.085 0.113 0.113 0.131 0.100 0.114 0.146
Middle-income countries:
Ukraine 0.064 0.088 0.116 0.115 0.133 0.103 0.117 0.147Philippines 0.064 0.089 0.117 0.117 0.135 0.105 0.119 0.148Peru 0.064 0.090 0.118 0.118 0.135 0.105 0.120 0.148Botswana 0.064 0.090 0.118 0.118 0.135 0.105 0.120 0.148Thailand 0.064 0.090 0.119 0.118 0.136 0.106 0.120 0.148Morocco 0.064 0.091 0.119 0.119 0.136 0.107 0.121 0.149Venezuela 0.064 0.091 0.120 0.119 0.136 0.107 0.121 0.149Macedonia 0.065 0.092 0.121 0.121 0.137 0.108 0.122 0.150Belize 0.065 0.092 0.121 0.121 0.137 0.108 0.122 0.150
—Continued
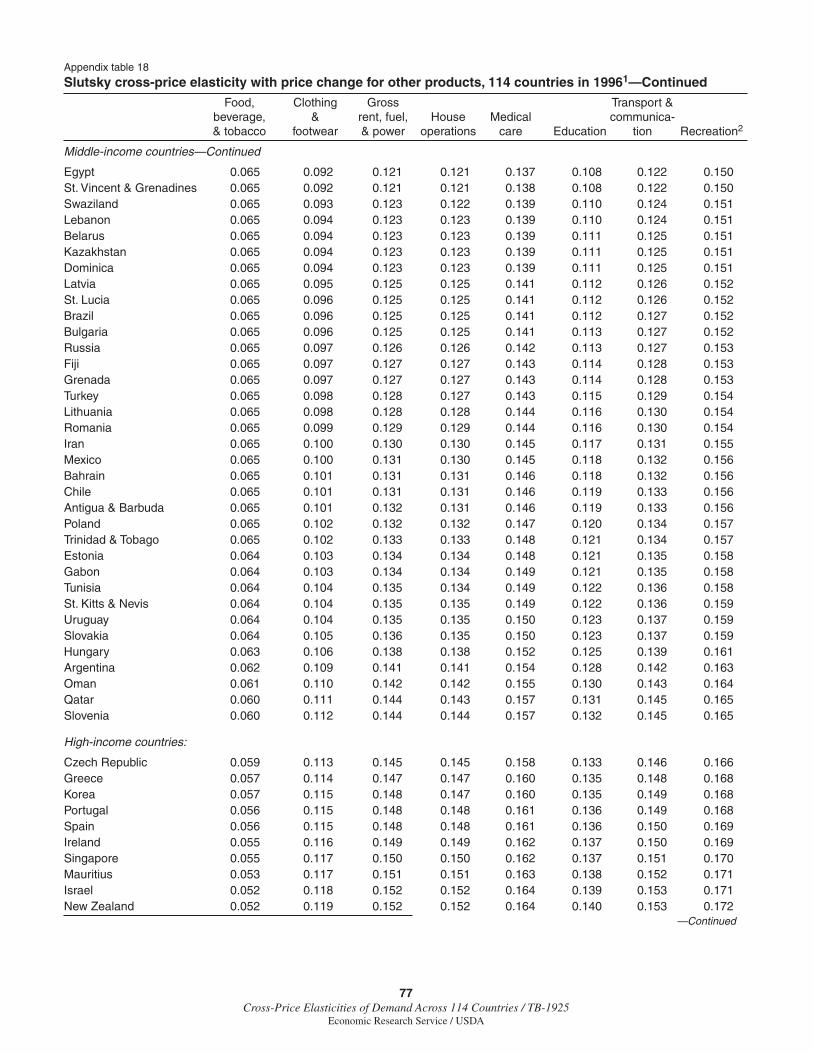
77Cross-Price Elasticities of Demand Across 114 Countries / TB-1925
Economic Research Service / USDA
Appendix table 18
Slutsky cross-price elasticity with price change for other products, 114 countries in 19961—Continued
Food, Clothing Gross Transport & beverage, & rent, fuel, House Medical communica- & tobacco footwear & power operations care Education tion Recreation2
Middle-income countries—Continued
Egypt 0.065 0.092 0.121 0.121 0.137 0.108 0.122 0.150St. Vincent & Grenadines 0.065 0.092 0.121 0.121 0.138 0.108 0.122 0.150Swaziland 0.065 0.093 0.123 0.122 0.139 0.110 0.124 0.151Lebanon 0.065 0.094 0.123 0.123 0.139 0.110 0.124 0.151Belarus 0.065 0.094 0.123 0.123 0.139 0.111 0.125 0.151Kazakhstan 0.065 0.094 0.123 0.123 0.139 0.111 0.125 0.151Dominica 0.065 0.094 0.123 0.123 0.139 0.111 0.125 0.151Latvia 0.065 0.095 0.125 0.125 0.141 0.112 0.126 0.152St. Lucia 0.065 0.096 0.125 0.125 0.141 0.112 0.126 0.152Brazil 0.065 0.096 0.125 0.125 0.141 0.112 0.127 0.152Bulgaria 0.065 0.096 0.125 0.125 0.141 0.113 0.127 0.152Russia 0.065 0.097 0.126 0.126 0.142 0.113 0.127 0.153Fiji 0.065 0.097 0.127 0.127 0.143 0.114 0.128 0.153Grenada 0.065 0.097 0.127 0.127 0.143 0.114 0.128 0.153Turkey 0.065 0.098 0.128 0.127 0.143 0.115 0.129 0.154Lithuania 0.065 0.098 0.128 0.128 0.144 0.116 0.130 0.154Romania 0.065 0.099 0.129 0.129 0.144 0.116 0.130 0.154Iran 0.065 0.100 0.130 0.130 0.145 0.117 0.131 0.155Mexico 0.065 0.100 0.131 0.130 0.145 0.118 0.132 0.156Bahrain 0.065 0.101 0.131 0.131 0.146 0.118 0.132 0.156Chile 0.065 0.101 0.131 0.131 0.146 0.119 0.133 0.156Antigua & Barbuda 0.065 0.101 0.132 0.131 0.146 0.119 0.133 0.156Poland 0.065 0.102 0.132 0.132 0.147 0.120 0.134 0.157Trinidad & Tobago 0.065 0.102 0.133 0.133 0.148 0.121 0.134 0.157Estonia 0.064 0.103 0.134 0.134 0.148 0.121 0.135 0.158Gabon 0.064 0.103 0.134 0.134 0.149 0.121 0.135 0.158Tunisia 0.064 0.104 0.135 0.134 0.149 0.122 0.136 0.158St. Kitts & Nevis 0.064 0.104 0.135 0.135 0.149 0.122 0.136 0.159Uruguay 0.064 0.104 0.135 0.135 0.150 0.123 0.137 0.159Slovakia 0.064 0.105 0.136 0.135 0.150 0.123 0.137 0.159Hungary 0.063 0.106 0.138 0.138 0.152 0.125 0.139 0.161Argentina 0.062 0.109 0.141 0.141 0.154 0.128 0.142 0.163Oman 0.061 0.110 0.142 0.142 0.155 0.130 0.143 0.164Qatar 0.060 0.111 0.144 0.143 0.157 0.131 0.145 0.165Slovenia 0.060 0.112 0.144 0.144 0.157 0.132 0.145 0.165
High-income countries:
Czech Republic 0.059 0.113 0.145 0.145 0.158 0.133 0.146 0.166Greece 0.057 0.114 0.147 0.147 0.160 0.135 0.148 0.168Korea 0.057 0.115 0.148 0.147 0.160 0.135 0.149 0.168Portugal 0.056 0.115 0.148 0.148 0.161 0.136 0.149 0.168Spain 0.056 0.115 0.148 0.148 0.161 0.136 0.150 0.169Ireland 0.055 0.116 0.149 0.149 0.162 0.137 0.150 0.169Singapore 0.055 0.117 0.150 0.150 0.162 0.137 0.151 0.170Mauritius 0.053 0.117 0.151 0.151 0.163 0.138 0.152 0.171Israel 0.052 0.118 0.152 0.152 0.164 0.139 0.153 0.171New Zealand 0.052 0.119 0.152 0.152 0.164 0.140 0.153 0.172
—Continued
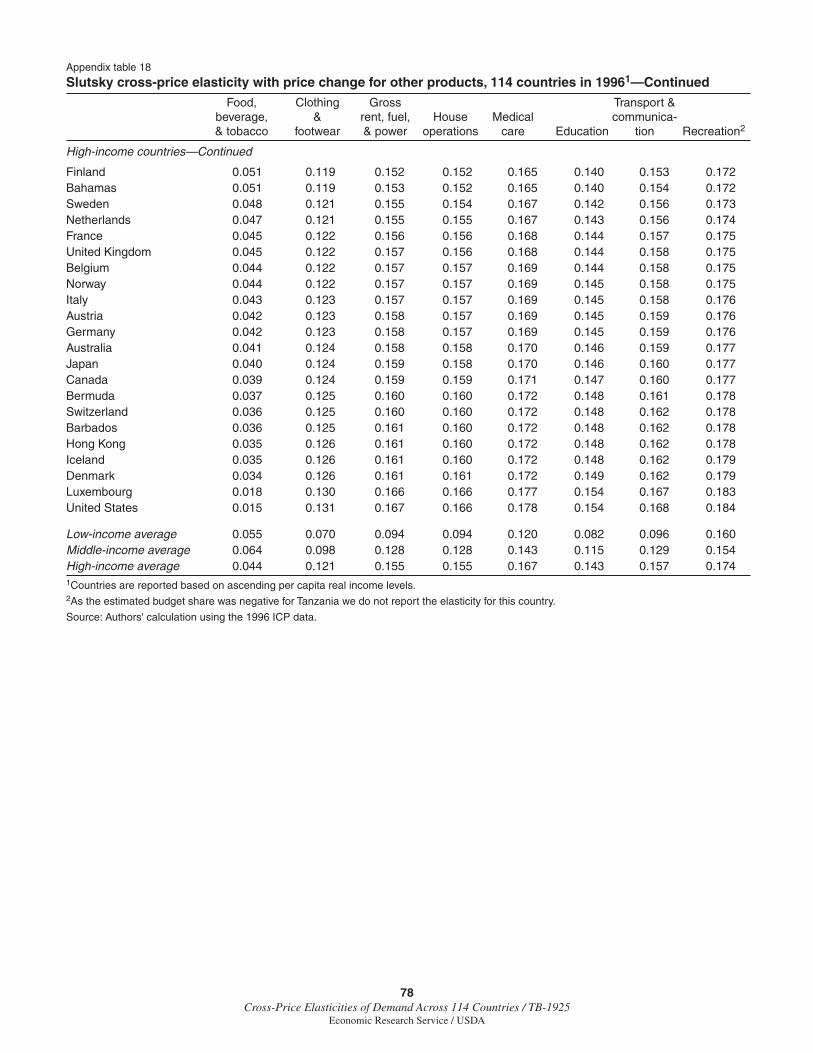
78Cross-Price Elasticities of Demand Across 114 Countries / TB-1925
Economic Research Service / USDA
Appendix table 18
Slutsky cross-price elasticity with price change for other products, 114 countries in 19961—Continued
Food, Clothing Gross Transport & beverage, & rent, fuel, House Medical communica- & tobacco footwear & power operations care Education tion Recreation2
High-income countries—Continued
Finland 0.051 0.119 0.152 0.152 0.165 0.140 0.153 0.172Bahamas 0.051 0.119 0.153 0.152 0.165 0.140 0.154 0.172Sweden 0.048 0.121 0.155 0.154 0.167 0.142 0.156 0.173Netherlands 0.047 0.121 0.155 0.155 0.167 0.143 0.156 0.174France 0.045 0.122 0.156 0.156 0.168 0.144 0.157 0.175United Kingdom 0.045 0.122 0.157 0.156 0.168 0.144 0.158 0.175Belgium 0.044 0.122 0.157 0.157 0.169 0.144 0.158 0.175Norway 0.044 0.122 0.157 0.157 0.169 0.145 0.158 0.175Italy 0.043 0.123 0.157 0.157 0.169 0.145 0.158 0.176Austria 0.042 0.123 0.158 0.157 0.169 0.145 0.159 0.176Germany 0.042 0.123 0.158 0.157 0.169 0.145 0.159 0.176Australia 0.041 0.124 0.158 0.158 0.170 0.146 0.159 0.177Japan 0.040 0.124 0.159 0.158 0.170 0.146 0.160 0.177Canada 0.039 0.124 0.159 0.159 0.171 0.147 0.160 0.177Bermuda 0.037 0.125 0.160 0.160 0.172 0.148 0.161 0.178Switzerland 0.036 0.125 0.160 0.160 0.172 0.148 0.162 0.178Barbados 0.036 0.125 0.161 0.160 0.172 0.148 0.162 0.178Hong Kong 0.035 0.126 0.161 0.160 0.172 0.148 0.162 0.178Iceland 0.035 0.126 0.161 0.160 0.172 0.148 0.162 0.179Denmark 0.034 0.126 0.161 0.161 0.172 0.149 0.162 0.179Luxembourg 0.018 0.130 0.166 0.166 0.177 0.154 0.167 0.183United States 0.015 0.131 0.167 0.166 0.178 0.154 0.168 0.184
Low-income average 0.055 0.070 0.094 0.094 0.120 0.082 0.096 0.160Middle-income average 0.064 0.098 0.128 0.128 0.143 0.115 0.129 0.154High-income average 0.044 0.121 0.155 0.155 0.167 0.143 0.157 0.1741Countries are reported based on ascending per capita real income levels.2As the estimated budget share was negative for Tanzania we do not report the elasticity for this country.
Source: Authors' calculation using the 1996 ICP data.
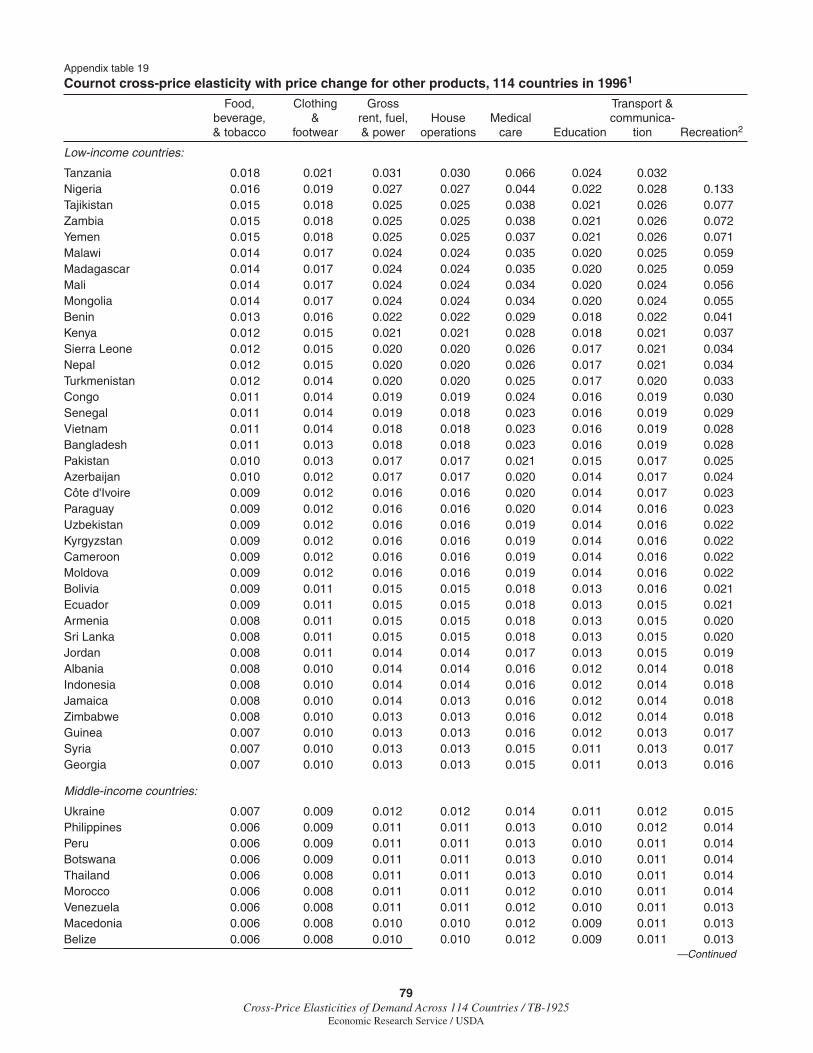
79Cross-Price Elasticities of Demand Across 114 Countries / TB-1925
Economic Research Service / USDA
Appendix table 19
Cournot cross-price elasticity with price change for other products, 114 countries in 19961
Food, Clothing Gross Transport & beverage, & rent, fuel, House Medical communica- & tobacco footwear & power operations care Education tion Recreation2
Low-income countries:
Tanzania 0.018 0.021 0.031 0.030 0.066 0.024 0.032 Nigeria 0.016 0.019 0.027 0.027 0.044 0.022 0.028 0.133Tajikistan 0.015 0.018 0.025 0.025 0.038 0.021 0.026 0.077Zambia 0.015 0.018 0.025 0.025 0.038 0.021 0.026 0.072Yemen 0.015 0.018 0.025 0.025 0.037 0.021 0.026 0.071Malawi 0.014 0.017 0.024 0.024 0.035 0.020 0.025 0.059Madagascar 0.014 0.017 0.024 0.024 0.035 0.020 0.025 0.059Mali 0.014 0.017 0.024 0.024 0.034 0.020 0.024 0.056Mongolia 0.014 0.017 0.024 0.024 0.034 0.020 0.024 0.055Benin 0.013 0.016 0.022 0.022 0.029 0.018 0.022 0.041Kenya 0.012 0.015 0.021 0.021 0.028 0.018 0.021 0.037Sierra Leone 0.012 0.015 0.020 0.020 0.026 0.017 0.021 0.034Nepal 0.012 0.015 0.020 0.020 0.026 0.017 0.021 0.034Turkmenistan 0.012 0.014 0.020 0.020 0.025 0.017 0.020 0.033Congo 0.011 0.014 0.019 0.019 0.024 0.016 0.019 0.030Senegal 0.011 0.014 0.019 0.018 0.023 0.016 0.019 0.029Vietnam 0.011 0.014 0.018 0.018 0.023 0.016 0.019 0.028Bangladesh 0.011 0.013 0.018 0.018 0.023 0.016 0.019 0.028Pakistan 0.010 0.013 0.017 0.017 0.021 0.015 0.017 0.025Azerbaijan 0.010 0.012 0.017 0.017 0.020 0.014 0.017 0.024Côte d'Ivoire 0.009 0.012 0.016 0.016 0.020 0.014 0.017 0.023Paraguay 0.009 0.012 0.016 0.016 0.020 0.014 0.016 0.023Uzbekistan 0.009 0.012 0.016 0.016 0.019 0.014 0.016 0.022Kyrgyzstan 0.009 0.012 0.016 0.016 0.019 0.014 0.016 0.022Cameroon 0.009 0.012 0.016 0.016 0.019 0.014 0.016 0.022Moldova 0.009 0.012 0.016 0.016 0.019 0.014 0.016 0.022Bolivia 0.009 0.011 0.015 0.015 0.018 0.013 0.016 0.021Ecuador 0.009 0.011 0.015 0.015 0.018 0.013 0.015 0.021Armenia 0.008 0.011 0.015 0.015 0.018 0.013 0.015 0.020Sri Lanka 0.008 0.011 0.015 0.015 0.018 0.013 0.015 0.020Jordan 0.008 0.011 0.014 0.014 0.017 0.013 0.015 0.019Albania 0.008 0.010 0.014 0.014 0.016 0.012 0.014 0.018Indonesia 0.008 0.010 0.014 0.014 0.016 0.012 0.014 0.018Jamaica 0.008 0.010 0.014 0.013 0.016 0.012 0.014 0.018Zimbabwe 0.008 0.010 0.013 0.013 0.016 0.012 0.014 0.018Guinea 0.007 0.010 0.013 0.013 0.016 0.012 0.013 0.017Syria 0.007 0.010 0.013 0.013 0.015 0.011 0.013 0.017Georgia 0.007 0.010 0.013 0.013 0.015 0.011 0.013 0.016
Middle-income countries:
Ukraine 0.007 0.009 0.012 0.012 0.014 0.011 0.012 0.015Philippines 0.006 0.009 0.011 0.011 0.013 0.010 0.012 0.014Peru 0.006 0.009 0.011 0.011 0.013 0.010 0.011 0.014Botswana 0.006 0.009 0.011 0.011 0.013 0.010 0.011 0.014Thailand 0.006 0.008 0.011 0.011 0.013 0.010 0.011 0.014Morocco 0.006 0.008 0.011 0.011 0.012 0.010 0.011 0.014Venezuela 0.006 0.008 0.011 0.011 0.012 0.010 0.011 0.013Macedonia 0.006 0.008 0.010 0.010 0.012 0.009 0.011 0.013Belize 0.006 0.008 0.010 0.010 0.012 0.009 0.011 0.013
—Continued
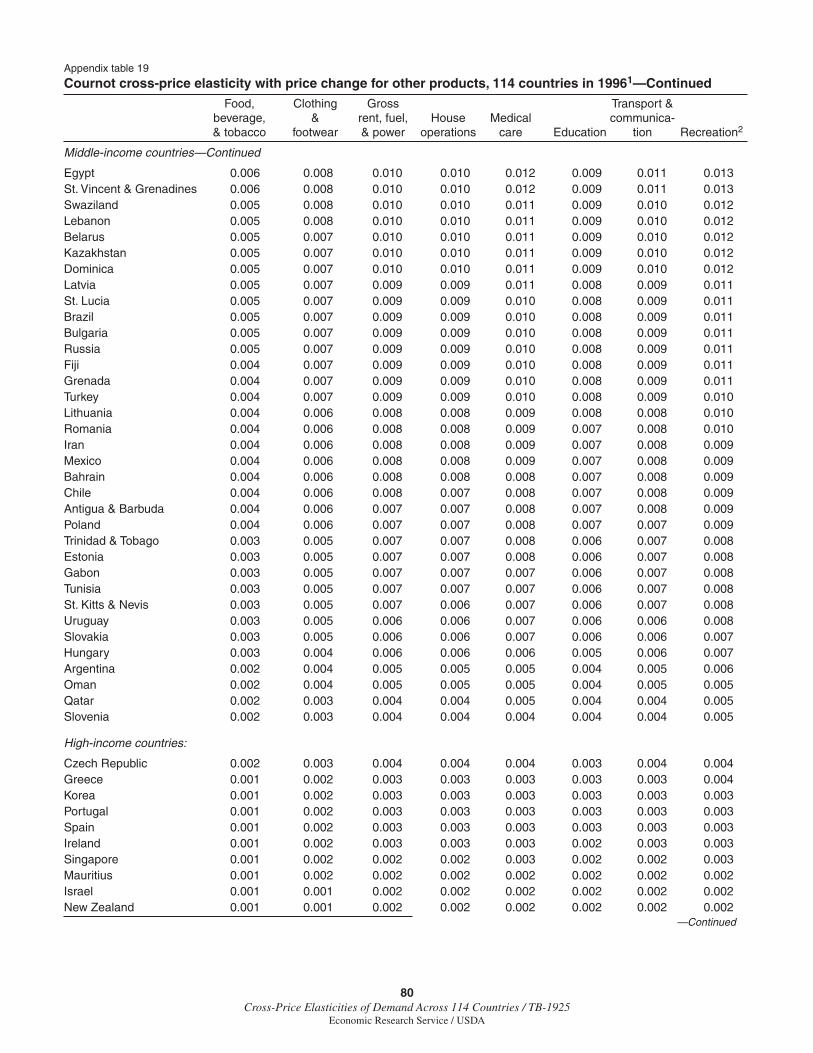
80Cross-Price Elasticities of Demand Across 114 Countries / TB-1925
Economic Research Service / USDA
Appendix table 19
Cournot cross-price elasticity with price change for other products, 114 countries in 19961—Continued
Food, Clothing Gross Transport & beverage, & rent, fuel, House Medical communica- & tobacco footwear & power operations care Education tion Recreation2
Middle-income countries—Continued
Egypt 0.006 0.008 0.010 0.010 0.012 0.009 0.011 0.013St. Vincent & Grenadines 0.006 0.008 0.010 0.010 0.012 0.009 0.011 0.013Swaziland 0.005 0.008 0.010 0.010 0.011 0.009 0.010 0.012Lebanon 0.005 0.008 0.010 0.010 0.011 0.009 0.010 0.012Belarus 0.005 0.007 0.010 0.010 0.011 0.009 0.010 0.012Kazakhstan 0.005 0.007 0.010 0.010 0.011 0.009 0.010 0.012Dominica 0.005 0.007 0.010 0.010 0.011 0.009 0.010 0.012Latvia 0.005 0.007 0.009 0.009 0.011 0.008 0.009 0.011St. Lucia 0.005 0.007 0.009 0.009 0.010 0.008 0.009 0.011Brazil 0.005 0.007 0.009 0.009 0.010 0.008 0.009 0.011Bulgaria 0.005 0.007 0.009 0.009 0.010 0.008 0.009 0.011Russia 0.005 0.007 0.009 0.009 0.010 0.008 0.009 0.011Fiji 0.004 0.007 0.009 0.009 0.010 0.008 0.009 0.011Grenada 0.004 0.007 0.009 0.009 0.010 0.008 0.009 0.011Turkey 0.004 0.007 0.009 0.009 0.010 0.008 0.009 0.010Lithuania 0.004 0.006 0.008 0.008 0.009 0.008 0.008 0.010Romania 0.004 0.006 0.008 0.008 0.009 0.007 0.008 0.010Iran 0.004 0.006 0.008 0.008 0.009 0.007 0.008 0.009Mexico 0.004 0.006 0.008 0.008 0.009 0.007 0.008 0.009Bahrain 0.004 0.006 0.008 0.008 0.008 0.007 0.008 0.009Chile 0.004 0.006 0.008 0.007 0.008 0.007 0.008 0.009Antigua & Barbuda 0.004 0.006 0.007 0.007 0.008 0.007 0.008 0.009Poland 0.004 0.006 0.007 0.007 0.008 0.007 0.007 0.009Trinidad & Tobago 0.003 0.005 0.007 0.007 0.008 0.006 0.007 0.008Estonia 0.003 0.005 0.007 0.007 0.008 0.006 0.007 0.008Gabon 0.003 0.005 0.007 0.007 0.007 0.006 0.007 0.008Tunisia 0.003 0.005 0.007 0.007 0.007 0.006 0.007 0.008St. Kitts & Nevis 0.003 0.005 0.007 0.006 0.007 0.006 0.007 0.008Uruguay 0.003 0.005 0.006 0.006 0.007 0.006 0.006 0.008Slovakia 0.003 0.005 0.006 0.006 0.007 0.006 0.006 0.007Hungary 0.003 0.004 0.006 0.006 0.006 0.005 0.006 0.007Argentina 0.002 0.004 0.005 0.005 0.005 0.004 0.005 0.006Oman 0.002 0.004 0.005 0.005 0.005 0.004 0.005 0.005Qatar 0.002 0.003 0.004 0.004 0.005 0.004 0.004 0.005Slovenia 0.002 0.003 0.004 0.004 0.004 0.004 0.004 0.005
High-income countries:
Czech Republic 0.002 0.003 0.004 0.004 0.004 0.003 0.004 0.004Greece 0.001 0.002 0.003 0.003 0.003 0.003 0.003 0.004Korea 0.001 0.002 0.003 0.003 0.003 0.003 0.003 0.003Portugal 0.001 0.002 0.003 0.003 0.003 0.003 0.003 0.003Spain 0.001 0.002 0.003 0.003 0.003 0.003 0.003 0.003Ireland 0.001 0.002 0.003 0.003 0.003 0.002 0.003 0.003Singapore 0.001 0.002 0.002 0.002 0.003 0.002 0.002 0.003Mauritius 0.001 0.002 0.002 0.002 0.002 0.002 0.002 0.002Israel 0.001 0.001 0.002 0.002 0.002 0.002 0.002 0.002New Zealand 0.001 0.001 0.002 0.002 0.002 0.002 0.002 0.002
—Continued
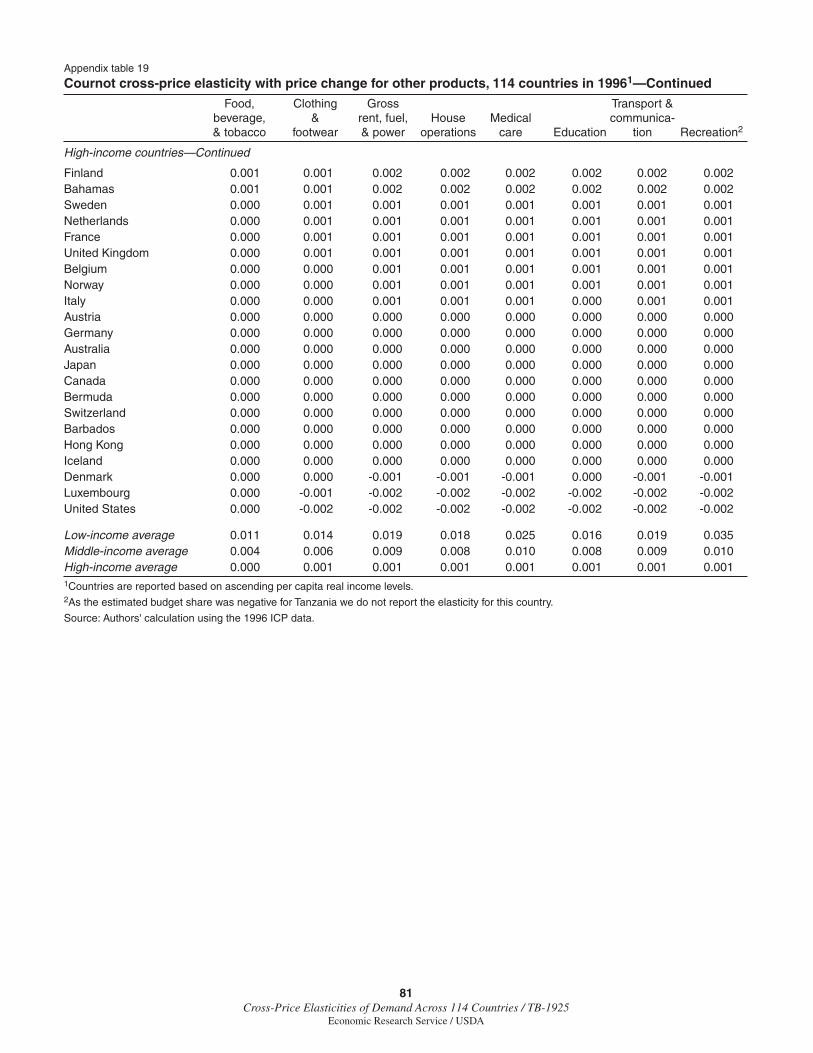
81Cross-Price Elasticities of Demand Across 114 Countries / TB-1925
Economic Research Service / USDA
Appendix table 19
Cournot cross-price elasticity with price change for other products, 114 countries in 19961—Continued
Food, Clothing Gross Transport & beverage, & rent, fuel, House Medical communica- & tobacco footwear & power operations care Education tion Recreation2
High-income countries—Continued
Finland 0.001 0.001 0.002 0.002 0.002 0.002 0.002 0.002Bahamas 0.001 0.001 0.002 0.002 0.002 0.002 0.002 0.002Sweden 0.000 0.001 0.001 0.001 0.001 0.001 0.001 0.001Netherlands 0.000 0.001 0.001 0.001 0.001 0.001 0.001 0.001France 0.000 0.001 0.001 0.001 0.001 0.001 0.001 0.001United Kingdom 0.000 0.001 0.001 0.001 0.001 0.001 0.001 0.001Belgium 0.000 0.000 0.001 0.001 0.001 0.001 0.001 0.001Norway 0.000 0.000 0.001 0.001 0.001 0.001 0.001 0.001Italy 0.000 0.000 0.001 0.001 0.001 0.000 0.001 0.001Austria 0.000 0.000 0.000 0.000 0.000 0.000 0.000 0.000Germany 0.000 0.000 0.000 0.000 0.000 0.000 0.000 0.000Australia 0.000 0.000 0.000 0.000 0.000 0.000 0.000 0.000Japan 0.000 0.000 0.000 0.000 0.000 0.000 0.000 0.000Canada 0.000 0.000 0.000 0.000 0.000 0.000 0.000 0.000Bermuda 0.000 0.000 0.000 0.000 0.000 0.000 0.000 0.000Switzerland 0.000 0.000 0.000 0.000 0.000 0.000 0.000 0.000Barbados 0.000 0.000 0.000 0.000 0.000 0.000 0.000 0.000Hong Kong 0.000 0.000 0.000 0.000 0.000 0.000 0.000 0.000Iceland 0.000 0.000 0.000 0.000 0.000 0.000 0.000 0.000Denmark 0.000 0.000 -0.001 -0.001 -0.001 0.000 -0.001 -0.001Luxembourg 0.000 -0.001 -0.002 -0.002 -0.002 -0.002 -0.002 -0.002United States 0.000 -0.002 -0.002 -0.002 -0.002 -0.002 -0.002 -0.002
Low-income average 0.011 0.014 0.019 0.018 0.025 0.016 0.019 0.035Middle-income average 0.004 0.006 0.009 0.008 0.010 0.008 0.009 0.010High-income average 0.000 0.001 0.001 0.001 0.001 0.001 0.001 0.0011Countries are reported based on ascending per capita real income levels.2As the estimated budget share was negative for Tanzania we do not report the elasticity for this country.
Source: Authors' calculation using the 1996 ICP data.