the benefits of the troubled families programme to … benefits of the troubled families programme...
TRANSCRIPT

March 2015 Department for Communities and Local Government
The Benefits of the Troubled Families Programme to the Taxpayer

© Crown copyright, 2015
Copyright in the typographical arrangement rests with the Crown.
You may re-use this information (not including logos) free of charge in any format or medium, under the terms of the Open Government Licence. To view this licence,http://www.nationalarchives.gov.uk/doc/open-government-licence/version/3/ or write to the Information Policy Team, The National Archives, Kew, London TW9 4DU, or email: [email protected].
This document/publication is also available on our website at www.gov.uk/dclg
If you have any enquiries regarding this document/publication, complete the form at http://forms.communities.gov.uk/ or write to us at:
Department for Communities and Local Government Fry Building 2 Marsham Street London SW1P 4DF Telephone: 030 3444 0000
For all our latest news and updates follow us on Twitter: https://twitter.com/CommunitiesUK
March 2015
ISBN: 978-1-4098-4529-4

The Benefits of the Troubled Families Programme to the Taxpayer
Executive Summary The Troubled Families Programme is delivering one of the toughest public service challenges set by this government - to transform the lives of families with multiple and complex problems. These are families who have an average of nine significant problems, including domestic violence, unemployment, mental illness, drug abuse and poor school attendance. Local councils and their partners have delivered this programme with undoubted success: over 105,000 families have had their lives turned around as of the end of February 2015, representing 90% of the total families identified for help and bringing the final 120,000 within reach. That’s 105,000 families with truanting children back in school for three consecutive terms, young offenders committing significantly less crime, reduced levels of antisocial behaviour across the family and over 10,000 adults in sustained work. But, as the Prime Minister said when he launched the programme in 2011, the Troubled Families Programme is also about reducing the disproportionate burden of cost to the taxpayer that these families bring. The government invested £448 million over three years in the Troubled Families Programme and the challenge is to discover whether, in addition to the benefits to individual families, there have been savings for the public purse. It’s not good enough to say that it is likely that this programme has been successful and saved money – it needs to be proved. This is a difficult thing to do: local public services are not traditionally asked to track the outcomes of real families using services and quantify the savings (or costs) that may result from their work with them. However, the Troubled Families Programme is testing its success in just this way – challenging the way services have typically worked and monitored success, helping build the skills and capabilities to do just that, and requiring the sharing of information across services in ways not previously undertaken. Over the last few months, the Troubled Families Programme been working closely with a small group of ‘exemplar’ councils to develop and complete this piece of work and show others how they may adopt a similar approach. The resulting analysis provides important lessons for the future of the Troubled Families Programme and indeed other public services. As the programme expands to work with up to an additional 400,000 troubled families, with a broader range of problems; and seeks to achieve even more ambitious changes to the way services are delivered to families, the costs and financial benefits will rightly come under intensified scrutiny. At a time when there are pressures on local budgets, the Troubled Families Programme needs to show that it is not only the best way to help families for the long term, but it also reduces costs on budgets across a range of services including health, criminal justice, and education.

Key Costs and Savings The policy paper that follows gives detailed examples of savings that have been made and costs that have been avoided for many parts of public services in these seven exemplar areas.
1. Average financial benefit to the public purse per family across the 7 areas amounts to £11,200 per family.
2. In Manchester, for every £1 invested in the programme, £2.20 in gross benefits was
realised, £1.94 in Redcar & Cleveland, £1.96 in Wandsworth, and £1.80 in Bristol.
3. The average cost of services reacting to families’ needs for the year before the programme intervened across the 7 areas was £26,200. This increases to £44,000 for the most complex families. Intervention costs on average only £5,214.
4. In Derbyshire and Redcar & Cleveland, the average cost of a troubled family in terms of welfare benefits is over £7,000 in the year before entering the programme – over 70% more expensive than the national average.
5. In criminal justice benefits alone, for every 4 families helped, the equivalent of a police
officer’s starting salary could be saved.
6. In the small London Borough of Wandsworth, total benefits from criminal justice costs added up to nearly £1.2m.
7. Salford has identified financial benefits to health services of £1,700 on average per
family. These benefits follow a nearly 60% reduction in alcohol misuse and a 50% reduction in drug misuse in the 12 months following intervention.
8. Wandsworth has reduced domestic violence in families by 70%. This benefited the
borough financially by over £70,000 - and that’s only counting cases where convictions were sought.
9. Significant improvements in school attendance for children saw a financial benefit of
£750,000 across the 7 areas involved. 10. In Manchester, the cost to social services of involvement with a family who is not
receiving family intervention was up to £38,000 per family on average – the equivalent of the wages of 2 social workers for a year.

What is family intervention? The Troubled Families Programme promotes a different approach to working with families in order to help them turn their lives around:
• By working with the whole family in a way which recognises their problems interact and influence each other, rather than viewing them as individuals with problems;
• Using a dedicated worker or dedicated team to get to the underlying problems, rather than individual services responding to the presenting problems of each family member;
• By developing a relationship with the family, being persistent and
building trust with them in order to challenge them to make the changes they need to, step by step, rather than containing and monitoring their problems; and
• Where necessary, drawing in specialist services in a sequenced way at
the right time for the family, rather than services being available on the basis of meeting thresholds and availability.
Through working with families in this way, problems such as domestic violence, dysfunctional relationships, mental and physical health problems can be addressed, families can start to function and the outward manifestations of those problems start to improve – children are back in school, there is reduced crime and antisocial behaviour, parents can start to think about their future, training and preparation for work.
Measuring the Cost Benefit of the Troubled Families Programme In May 2014, the Troubled Families Team provided all local authorities and their partners with an online cost savings calculator. This tool, using unit costs and methods agreed with HM Treasury and other government departments, is tailored to the family problems most relevant to the programme. Based on the most credible data and methodologies available, it provides a robust assessment of the savings that have been identified following work with real families as part of the Troubled Families Programme. This work represents a

huge cultural shift for local authorities and public services. Never before has local government as a whole been asked to systematically account for its service delivery in terms of the savings achieved locally and centrally. Over the last four months, the Troubled Families Team has worked intensively with seven of the most advanced local authorities to complete the troubled families cost savings calculator: Bristol, Derbyshire, the City of Manchester, Redcar & Cleveland, Salford, Staffordshire and the London Borough of Wandsworth. Their work has formed a detailed picture of the costs and fiscal benefits resulting from their local delivery of the programme and the service transformation they have undertaken as a result. We are incredibly grateful for the hard work and commitment of these areas to support the production of this report. A technical annex is provided separately and documents the methodologies used. This report showcases the work undertaken by these ‘exemplar’ areas. All of the examples remain ‘work in progress’, as areas are continually refining and improving the evidence available. As the Troubled Families Programme evaluation concludes later this year, further evidence will be derived from the work of a broader group of local areas and from the programme’s national cost benefit analysis. Nonetheless, the work of the ‘exemplars’ tells a compelling story of the unaffordable costs of service inaction or failure and the significant benefits of a new approach. Before Family Intervention: The Cost of Troubled Families In Understanding Troubled Families1, findings from the programme’s national evaluation revealed that troubled families have, on average, nine serious problems on entry to the programme. These include disproportionate levels of unemployment, crime, housing problems, poor school attendance, poor health, and domestic violence. These problems, in addition to the indisputable human cost, all generate costs for the taxpayer and, typically, reactive services like the police, children’s social work teams, and A&E departments bear the brunt. Across the seven local areas covered in this report, an average of £26,200 per was spent in the 12 months before families started receiving support as part of the Troubled Families Programme2 and an average of over £44,000 was spent on a sub-group of these families who warranted the most intensive forms of family intervention. All of this money was spent purely reacting to their problems - not solving them or addressing their underlying causes. This includes the cost of police, social work, health and housing crisis interventions, alongside significant welfare benefit costs associated with high levels of unemployment and ill-health. It is likely to be a conservative estimate – the full cost could be much greater – as it is based purely on the 39 measures covered in the cost savings calculator whereas there are many other costs that they may be incurring (for example, there are no agreed unit costs for police call outs and the cost of children being placed on a Child Protection Plan so these are not current covered in the cost savings calculator).
1https://www.gov.uk/government/uploads/system/uploads/attachment_data/file/336430/Understanding_Troubled_Families_web_format.pdf 2 This estimate is calculated by summing the total reported cost of all the exemplar families, divided by the total number of exemplar families. Some variations in local approaches to the cost savings calculator may affect this estimate.

To put this cost in context, across all public services, the government spends an average of £12,8003 a year on each household in England. This means the average reactive expenditure on troubled families in these areas before the programme was over twice the national average and nearly three and a half times more for the most complex families. This shows the disproportionate level of spending on troubled families before they become part of the Troubled Families Programme. The highest proportion of costs for Derbyshire and Redcar & Cleveland was attributed to welfare benefit costs, such as Jobseekers Allowance, Employment Support Allowance and Income Support. In these areas, the average cost of a troubled family to the welfare benefit bill was over £7,000 in the year before entering the Troubled Families Programme. This makes troubled families over 70% more expensive in terms of welfare benefits than the national average4. Given the expense of troubled families to the country’s welfare benefit bill, the Troubled Families Programme has focused on supporting families towards work. In the current programme, this has been delivered with the help of over 150 Jobcentre Plus secondees5 into local troubled families teams and, so far, over 10,000 families have moved into sustained work. In the expanded Troubled Families Programme, from April 2015, this resource will be doubled, strengthening our efforts to move families into jobs. For the City of Manchester, the highest cost was attributed to local authority social services. These costs include children who are taken into care, children who are deemed ‘in need’ by social workers, and social work visits to family homes, alongside indirect costs such as the cost of domestic violence and children excluded from school. This cost to social services reached a peak for Manchester of nearly £38,000 per family in the 12 months before the programme was introduced. To put this in context, this is the equivalent of the annual salary of two social workers per troubled family6. For Bristol, Salford and the London Borough of Wandsworth the highest cost was attributed to the police, prison, probation, and youth offending services. These costs related to high numbers of first time entrants to the criminal justice system, numbers of adults in prison, drug and alcohol abuse, and crimes such as common assault, criminal damage and shoplifting. In all three areas, these costs equated to around one-third of all reactive expenditure on troubled families in the year before entering the programme7: that is an average cost of nearly £9,000 per family – equivalent to nearly six months’ salary for a Prison Officer8.
3 This is based on analysis undertaken by the Department of Communities and Local Government, taking account only of those areas of public spending which are covered in the calculator. It uses data from Public Expenditure Statistical Analysis (Table 10.1), DfE truancy statistics (https://www.gov.uk/government/statistics/permanent-and-fixed-period-exclusions-in-england-2012-to-2013), the New Economy Unit Cost Database, LA Revenue Outturn data (https://www.gov.uk/government/statistics/local-authority-revenue-expenditure-and-financing-in-england-2013-to-2014-final-outturn), ONS measures of the total benefit spend per household (http://www.ons.gov.uk/ons/dcp171778_367431.pdf) and data relating to the comparable household size from the programme’s national independent evaluation. 4 The national average is £4,150 per household http://www.ons.gov.uk/ons/dcp171778_367431.pdf. This figure excludes retired households. 5 Known as ‘Troubled Families Employment Advisors’ 6 www.nationacareersservices.direct.gov.uk – the starting salaries for social workers range for £19,000 to £21,000 per year. The annual salaries for an experienced social worker range from £26,000 to £40,000 per year. 7 Bristol: 37% of all costs, Salford: 35% of all costs, and Wandsworth: 30% of all costs. 8 https://www.gov.uk/government/organisations/hm-prison-service/about/recruitment

Taking the ‘exemplar’ areas as a whole, this shows the breadth of expenditure across public services, resulting from the absence of effective family interventions. While a significant proportion of this falls to local authorities, the imperative to act is far from theirs alone. After Family Intervention: The Benefits The Troubled Families Programme’s payment-by-results scheme captures three main outcomes achieved with families: improvements in school attendance; significant reductions in youth crime and anti-social behaviour; and sustained work. However, these headline goals do not tell the full story: just as the costs of the troubled families fall across public services before they begin receiving support, the work of the ‘exemplar’ areas has shown that the fiscal benefits are distributed across public services. On average across the ‘exemplar’ areas, fiscal benefits9 totalling £11,20010 per family were identified in the 12 months after receiving support. This means families across these areas were committing less crime, experiencing less domestic violence, using fewer emergency health services, and needed less supervision and support from social workers. This is likely to be a conservative estimate: longer-term savings come from the improved life chances of the children in particular, as they avoid unemployment, ill-health and crime in later life. However, given the immediacy of public spending pressures across the piece, showing such high levels of return in the year following support is impressive. The Cost Benefit of Family Intervention
Ultimately, local authorities and their partners are using the cost savings calculator to establish whether the investment made in family intervention is worthwhile: does the local delivery of the Troubled Families Programme offer good value for money for the taxpayer? Early findings from the ‘exemplar’ areas suggest the case for investment is strong and credible. In Manchester, the gross fiscal benefit per family over three years was £7,580, while the additional costs of delivering a family intervention to these families was an average of £4,00011. This means, over the lifetime of the Troubled Families Programme, for every £1 invested in family intervention, local public services receive an estimated £1.89 in gross benefits. Looking across the three years, Manchester’s estimated return on its investment improved each year. This may indicate that the local authority’s cost effectiveness in turning around families has continually improved over the lifetime of the programme. The benefits are expected to reach their peak this year when, for every £1 invested in family intervention, local public services receive an estimated £2.20 in gross benefits. This suggests that the benefits of this approach may continue to improve following the
9 This figure is gross. The gross fiscal benefit refers to amount of public money which may has been saved or whose expenditure has been avoided, before deducting any further costs (e.g. the cost of interventions). 10 This figure is indicative of the immediate fiscal benefits that could be achieved through the programme as local approaches aren’t all directly comparable. These benefits may not all necessarily be cashable. 11 This figure takes account of any money that was already being spent on targeted services for these/ similar families before the programme. This means the costs of what is often called ‘business as usual’ have been deducted to provide a net cost for the investments in new family interventions.
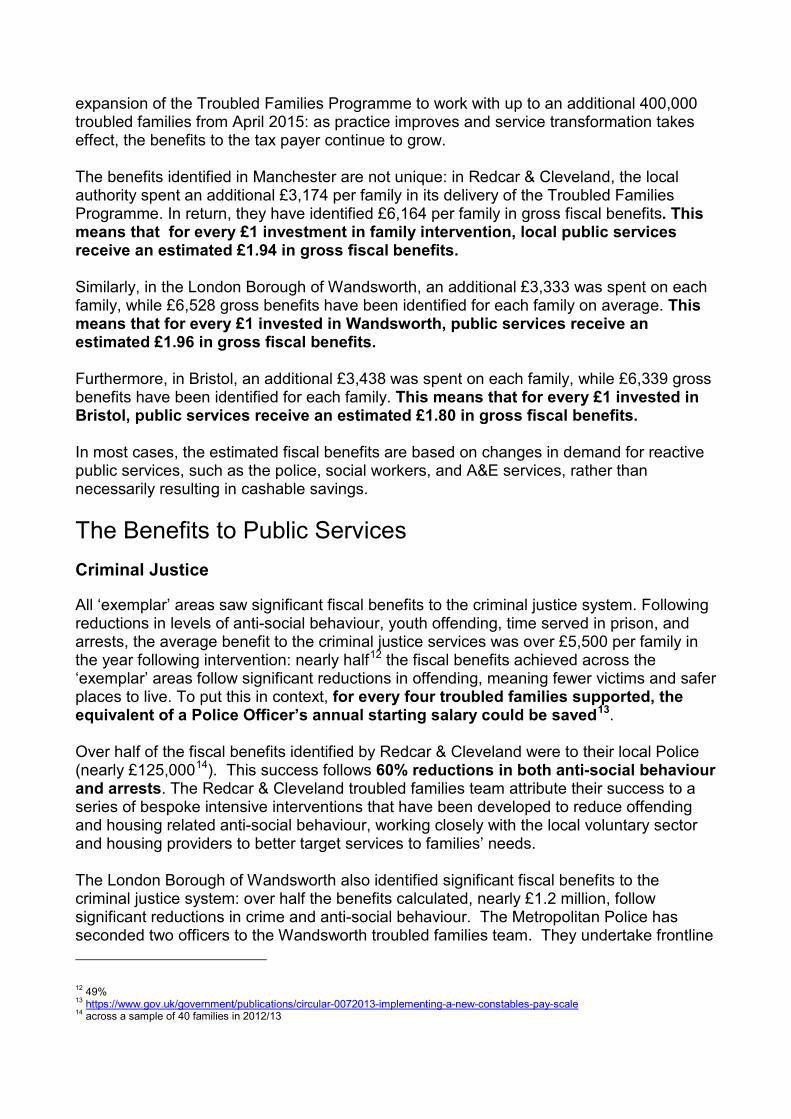
expansion of the Troubled Families Programme to work with up to an additional 400,000 troubled families from April 2015: as practice improves and service transformation takes effect, the benefits to the tax payer continue to grow. The benefits identified in Manchester are not unique: in Redcar & Cleveland, the local authority spent an additional £3,174 per family in its delivery of the Troubled Families Programme. In return, they have identified £6,164 per family in gross fiscal benefits. This means that for every £1 investment in family intervention, local public services receive an estimated £1.94 in gross fiscal benefits. Similarly, in the London Borough of Wandsworth, an additional £3,333 was spent on each family, while £6,528 gross benefits have been identified for each family on average. This means that for every £1 invested in Wandsworth, public services receive an estimated £1.96 in gross fiscal benefits. Furthermore, in Bristol, an additional £3,438 was spent on each family, while £6,339 gross benefits have been identified for each family. This means that for every £1 invested in Bristol, public services receive an estimated £1.80 in gross fiscal benefits. In most cases, the estimated fiscal benefits are based on changes in demand for reactive public services, such as the police, social workers, and A&E services, rather than necessarily resulting in cashable savings. The Benefits to Public Services Criminal Justice
All ‘exemplar’ areas saw significant fiscal benefits to the criminal justice system. Following reductions in levels of anti-social behaviour, youth offending, time served in prison, and arrests, the average benefit to the criminal justice services was over £5,500 per family in the year following intervention: nearly half12 the fiscal benefits achieved across the ‘exemplar’ areas follow significant reductions in offending, meaning fewer victims and safer places to live. To put this in context, for every four troubled families supported, the equivalent of a Police Officer’s annual starting salary could be saved13. Over half of the fiscal benefits identified by Redcar & Cleveland were to their local Police (nearly £125,00014). This success follows 60% reductions in both anti-social behaviour and arrests. The Redcar & Cleveland troubled families team attribute their success to a series of bespoke intensive interventions that have been developed to reduce offending and housing related anti-social behaviour, working closely with the local voluntary sector and housing providers to better target services to families’ needs. The London Borough of Wandsworth also identified significant fiscal benefits to the criminal justice system: over half the benefits calculated, nearly £1.2 million, follow significant reductions in crime and anti-social behaviour. The Metropolitan Police has seconded two officers to the Wandsworth troubled families team. They undertake frontline 12 49% 13 https://www.gov.uk/government/publications/circular-0072013-implementing-a-new-constables-pay-scale 14 across a sample of 40 families in 2012/13

work with families where there are high levels of offending, particularly amongst young people, while also providing daily intelligence and crime updates to other key workers in the team. This level of integration provides live information to the troubled families team, who can then move quickly to address families’ offending behaviour.
Domestic Violence
The programme’s national evaluation has shown that nearly a third15 of troubled families were known to be experiencing domestic violence on entry to the programme16. By comparison, national estimates suggest that 7% of women experience domestic violence in a year17. The fiscal costs of this domestic violence fall across criminal justice services, most notably the police, and include significant costs to the NHS - not to mention the emotional harm to victims and the economic costs for those who are unable to work as a result. The London Borough of Wandsworth recorded a nearly 70%18 reduction in domestic violence across their families in the year following family intervention. Wandsworth adopted a conservative approach to its measurement by only including domestic violence incidents where the victim pressed charges and the incident was logged as a crime, with a follow up investigation19 . This means the fiscal benefits are likely to be understated, but they nonetheless total nearly £70,00020. Wandsworth attribute this success to their model of integrated, whole family working, including a full-time domestic violence support worker who is seconded to the local authority from Victim Support21. The support worker works as part of a multi-disciplinary troubled families team of key workers. The team also includes a clinical psychologist and an adult mental health worker who both work with families to address many of the consequences of domestic violence and abuse, including its impact on the relationship between parents and their children and problems such as depression, anxiety and lowered confidence across family members. Health
Health problems are pervasive across troubled families. The Troubled Families Programme’s national evaluation has shown that families have disproportionately high levels of health problems compared to the general population on entry to the programme: 71% of families included someone with at least one health problem; nearly half22 included an adult with a mental health problem; a third of children were suffering from a mental health problem; nearly a third23 of families included an adult with a long-standing condition
15 29% 16 https://www.gov.uk/government/uploads/system/uploads/attachment_data/file/336430/Understanding_Troubled_Families_web_format.pdf 17 http://www.parliament.uk/briefing-papers/SN06337/domestic-violence 18 69% 19 This method was used consistently to measure incidents of domestic violence both before and after receiving support through the Troubled Families Programme. 20 £66,725 21 Victim Support is an independent charity which specialises in helping people cope with the effects of crime. 22 46% 23 32%

or disability; and one-in-five families included a child or children with a long-standing condition or disability24. All ‘exemplar’ areas estimated fiscal benefits to health services. These benefits stem from reductions in drug and alcohol misuse; improvements in child and adult mental health; and reductions in A&E visits, all of which have significant resource implications for the NHS, alongside indirect costs to other services like the police. Salford is a prime example with average benefits to health services of £1,700 per family. Many of these benefits flow from their work in tackling drug and alcohol problems within families: drug misuse nearly halved25 and alcohol misuse reduced by 60% in the year following support. As with criminal justice benefits, it is unlikely that many health benefits will result in immediately cashable savings. Instead, this reduced demand on health services will play an important role in enabling the NHS and other health partners to meet other pressures, including demands on A&E services. Manchester also identified significant fiscal benefits to local NHS partners. Over the 3 years of the programme, across a sample of over 200 families, Manchester resolved entirely the drug and alcohol issues of over a third26 of individuals in the programme. To achieve this, Manchester has invested significantly in the expansion of its family intervention service, including specialist alcohol treatment expertise. Similarly, the London Borough of Wandsworth also estimated significant fiscal benefits to the NHS of over £230,000 over the last three years. This was also attributable to a 40% reduction in adults involved in drug and alcohol misuse following support and significant reductions in adult mental health problems27. Wandsworth’s troubled families team includes two embedded specialist health workers, five health trainers, a specialist drugs and alcohol worker and two specialist mental health workers for both adults and children. This level of integration and whole family working is the key to their success. Education
Latest figures suggest there were over 300,000 children who were persistently absent from school across England28, at an estimated annual fiscal cost of over £530 million29. This includes costs to the education system, health services, the criminal justice system, and local authority social services. The seven exemplar areas reported significant improvements to levels of persistent truancy. They identified a total fiscal benefit of over £750,000 in the year following support. This should be considered in the context of the significant social and economic benefits of ensuring children attend school regularly. Extensive evidence shows that persistent truancy seriously affects the future life chances of children, including poor educational
24 https://www.gov.uk/government/uploads/system/uploads/attachment_data/file/336430/Understanding_Troubled_Families_web_format.pdf 25 down 49% 26 35% 27 down a fifth 28 https://www.gov.uk/government/statistics/pupil-absence-in-schools-in-england-2012-to-2013. Since 2011, this measure has been set by the Department for Education as missing more than 15% of possible sessions. 29 This is the fiscal unit cost times 301,000. The figures provided relate to 2012/13

attainment, higher likelihood of teenage pregnancy, criminal behaviour, and unemployment in later life, with damaging consequences for generations to come30 31. In Bristol, over a quarter32 of their overall fiscal benefits related to improvements in education outcomes, with two-thirds of children in troubled families no longer persistently truanting following support. Bristol worked closely with local head teachers to identify the children who would benefit most from the programme and to prioritise them for family intervention. In the London Borough of Wandsworth, the savings identified following improvements in school attendance were nearly £275,000, equating to 15% of the council’s total Education Welfare Service’s budget. This significant benefit to the council’s education budget follows work with a minority of its pupils (just 1% are within the Troubled Families Programme)33. To achieve this success, key workers in the area’s Family Recovery Project work intensively with families to ensure children attended school regularly. This includes working in the family to ensure parents get children up in the mornings, ready and into school. This is about modelling the right behaviour for parents so they see and know how to improve their children’s attendance. Children’s Services
Rising numbers of looked after children and children deemed ‘in need’34 represent an increasing budget and wider resource pressure on local authorities. It costs over £1,500 for a social worker to assess35 whether a child needs their on-going supervision. If the risks escalate and a child is taken into care, this cost rapidly increases to nearly £45,000 per year36. The early identification of risk factors that put children at risk of harm and, in turn, swift responses to these risks are the key to preventing the escalation of needs and costs. Given the human and financial imperative to improve outcomes for children, this has been a priority for many local authorities in their delivery of the Troubled Families Programme. Bristol, Salford, Staffordshire, Wandsworth and Manchester all identified fiscal benefits in this area. Over the three years, Manchester identified average benefits to their children’s services of over £1,300 per family. To achieve this, they have halved the number child ‘in need’ cases in the year after families have received support from the programme. These outcomes are down to their effective earlier intervention with these families, using
30 Wilson, V, Malcolm, H, Edward, S and Davidson, J (2005) ‘Bunking off: The impact of truancy on pupils and teachers’, British Educational Research Journal, Vol. 34(1) p.3; Reid, K (1999) Truancy and Schools, London: Routledge; Barnes, M, Green, R, Ross, A (2011), ‘Understanding vulnerable young people: Analysis from the Longitudinal Study of Young People in England, Research Report DFE-RR118 NatCen report for DfE, March 2011. 31 http://www.thinknpc.org/publications/misspent-youth/ 32 26% 33 According to the latest Department for Education School Census statistics there are 41,885 children on the headcount of schools (all types) in Wandsworth: https://www.gov.uk/government/statistics/schools-pupils-and-their-characteristics-january-2014. The Troubled Families Team in Wandsworth worked with 331 children in this period. 34 Section 17, Children Act 1989 35 A Common Assessment Framework or local equivalent.; these costs are taken from the Manchester New Economy Unit Cost Database, found at http://neweconomymanchester.com/stories/832-unit_cost_database 36 http://neweconomymanchester.com/stories/832-unit_cost_database

an intensive family intervention approach to tackle problems such as domestic violence, substance misuse, and mental health difficulties across families. While some areas have identified fiscal benefits in the 12 months following support by the Troubled Families Programme, others have not. In part, this reflects the extent to which local troubled families teams have uncovered previously unmet need, alerted social workers and worked with them to ensure the right support is in place to protect children from harm. While this may mean short term increases in expenditure, it does mean children are rightly receiving the support they need, when they need it and, with this the prompt identification of these previously unidentified needs, it is likely longer-term fiscal, social and economic costs may be avoided. Conclusion This report underlines the disproportionate cost of the historic failure of public services to tackle more effectively the problems facing troubled families. The need for a more effective and efficient approach is made more important within the current public spending context: business as usual is simply unaffordable. However, the estimated benefits to the tax payer in this report indicate that local government and its partners have recognised the potential benefits and seized the opportunity presented by the Troubled Families Programme to turn around the lives of families who would otherwise place a significant demand on a broad range of services – from the police call outs, to social work teams; from welfare benefits to schools. While the findings in this report are promising, they are just the start. The Troubled Families Programme has not only challenged public services to improve the lives of families, but it is driving forward a sharper focus on the costs and benefits of family intervention. The troubled families cost savings calculator provides local public services with a means by which to systemically capture the real fiscal benefits achieved with families supported by the programme. These local cost benefit analyses will sit alongside the wider findings of the programme’s national independent evaluation. These include a national impact study, whereby the full impact of the programme will be assessed. This assessment of the programme’s added value will then be costed, using the same measures in the cost savings calculator, to provide a national cost benefit analysis. The findings of this work will be available in the summer. This in-depth approach to understanding where every pound of tax payer’s money is spent in relation to troubled families will form a central part of the expanded Troubled Families Programme from 2015 onwards. The cost savings calculator will be further refined, building on knowledge from the current programme, and every local authority will complete it to shape their approach to delivery and local investment decisions. Ultimately, the benefits identified through the troubled families cost savings calculator are not about spending reductions: they represent real families leading better lives, lower dependency on public services and more effective delivery of those services where needed. They reflect the potential of the programme as an opportunity for public services to work differently together for better results.
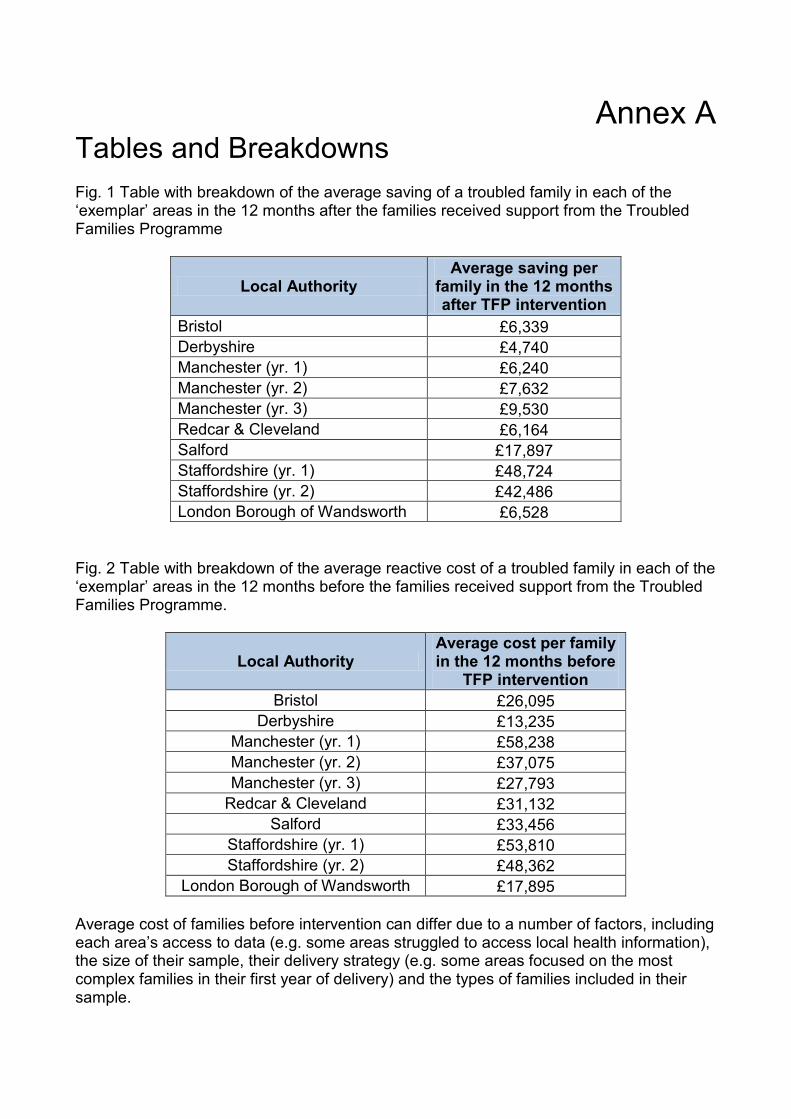
Annex A Tables and Breakdowns Fig. 1 Table with breakdown of the average saving of a troubled family in each of the ‘exemplar’ areas in the 12 months after the families received support from the Troubled Families Programme
Local Authority Average saving per
family in the 12 months after TFP intervention
Bristol £6,339 Derbyshire £4,740 Manchester (yr. 1) £6,240 Manchester (yr. 2) £7,632 Manchester (yr. 3) £9,530 Redcar & Cleveland £6,164 Salford £17,897 Staffordshire (yr. 1) £48,724 Staffordshire (yr. 2) £42,486 London Borough of Wandsworth £6,528
Fig. 2 Table with breakdown of the average reactive cost of a troubled family in each of the ‘exemplar’ areas in the 12 months before the families received support from the Troubled Families Programme.
Local Authority Average cost per family in the 12 months before
TFP intervention Bristol £26,095
Derbyshire £13,235 Manchester (yr. 1) £58,238 Manchester (yr. 2) £37,075 Manchester (yr. 3) £27,793
Redcar & Cleveland £31,132 Salford £33,456
Staffordshire (yr. 1) £53,810 Staffordshire (yr. 2) £48,362
London Borough of Wandsworth £17,895 Average cost of families before intervention can differ due to a number of factors, including each area’s access to data (e.g. some areas struggled to access local health information), the size of their sample, their delivery strategy (e.g. some areas focused on the most complex families in their first year of delivery) and the types of families included in their sample.

Fig 3. The proportion of reactive costs that accrue to different parts of the public sector, broken down by Local Authority.
Fig 4. Estimated saving per family, by local authority and service type.
Local Authority Crime Health Education Social Services
Employment & the
Economy Housing
Bristol £3,317 £471 £1,661 £382 £512 -£4 Derbyshire £514 £2,162 £659 -£322 £1,727 £0 Manchester (yr. 1) £1,918 £1,163 £621 £534 -£253 £2,257 Manchester (yr. 2) £2,752 £862 £122 £1,438 £620 £1,838 Manchester (yr. 3) £4,759 £237 £415 £2,002 £1,582 £533 Redcar & Cleveland £6,044 £557 £265 -£1,090 £406 -£18 Salford £10,472 £2,003 £2,890 £1,416 £699 £416 Staffordshire (yr. 1) £22,691 £1,033 £2,180 £13,377 £8,711 £732 Staffordshire (yr. 2) £22,346 £862 £2,341 £13,671 £2,645 £621 London Borough of Wandsworth £4,189 £829 £1,604 -£336 £247 -£5
Local Authority HM Treasury NHS Ministry of
Justice Police Local
Authority (Schools)
Local Authority (Housing)
Local Authority
(Social services)
Bristol 15% 7% 27% 5% 8% 0% 11%
Derbyshire 36% 11% 12% 4% 4% 0% 21% Manchester (yr. 1) 16% 6% 5% 1% 1% 4% 58%
Manchester (yr. 2) 19% 8% 8% 2% 1% 6% 44%
Manchester (yr. 3) 22% 10% 14% 5% 2% 4% 26%
Redcar & Cleveland 24% 9% 18% 15% 1% 1% 14%
Salford 19% 10% 26% 3% 7% 1% 7% Staffordshire (yr. 1) 15% 3% 28% 3% 2% 1% 18%
Staffordshire (yr. 2) 8% 3% 31% 3% 2% 1% 20%
London Borough of Wandsworth 22% 11% 23% 7% 5% 1% 8%

Fig 5. Estimated fiscal cost per family prior to intervention, by local authority and agency
Average cost of families before intervention can differ due to a number of factors, including each area’s access to data (e.g. some areas struggled to access local health information), the size of their sample, their delivery strategy (e.g. some areas focused on the most complex families in their first year of delivery) and the types of families included in their sample.
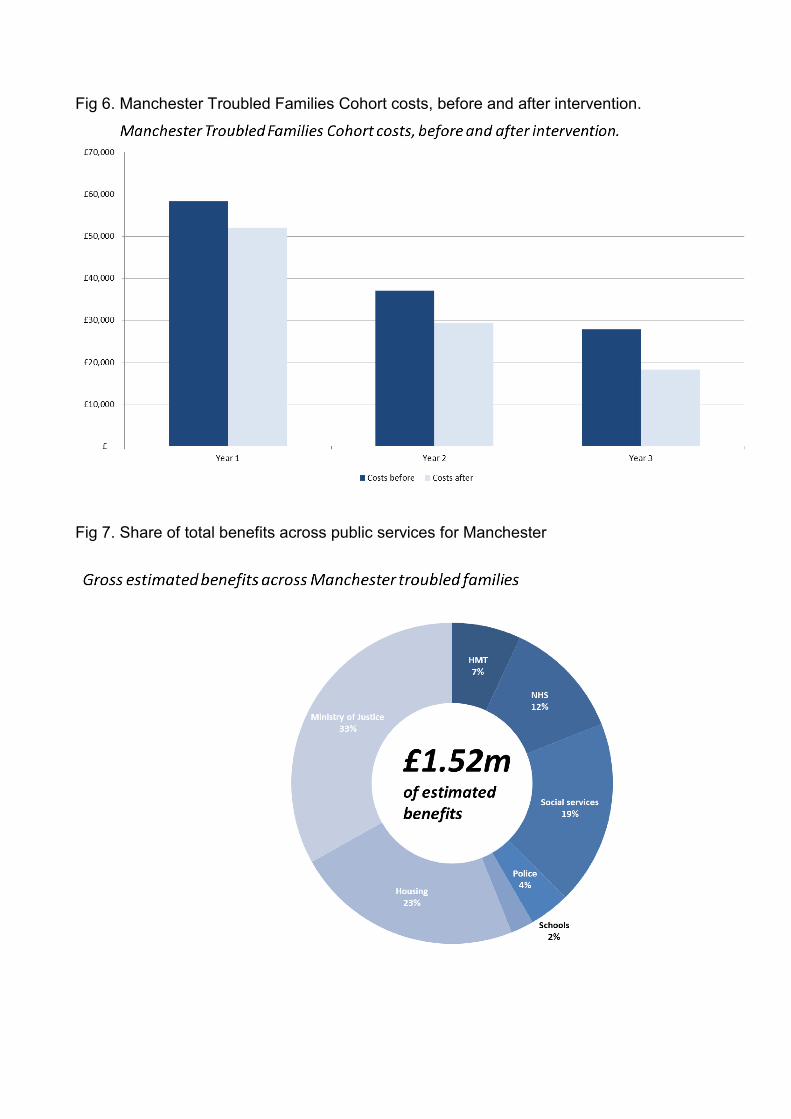
Fig 6. Manchester Troubled Families Cohort costs, before and after intervention.
Fig 7. Share of total benefits across public services for Manchester