troubled families programme annual report 2020
TRANSCRIPT

Improving families’ lives:
Annual report of the Troubled Families Programme 2019-2020


Improving families’ lives:
Annual report of the Troubled Families Programme 2019-2020
Including further findings of the national evaluation of the Troubled Families Programme
Presented to Parliament pursuant to Section (3) 6 of the Welfare Reform and Work Act 2016

© Crown copyright, 2020
Copyright in the typographical arrangement rests with the Crown.
You may re-use this information (not including logos) free of charge in any format or medium, under the terms of the Open Government Licence. To view this licence visit http://www.nationalarchives.gov.uk/doc/open-government-licence/version/3/
This document/publication is also available on our website at www.gov.uk/mhclg
If you have any enquiries regarding this document/publication, complete the form at http://forms.communities.gov.uk/ or write to us at:
Ministry of Housing, Communities and Local Government Fry Building 2 Marsham Street London SW1P 4DF Telephone: 030 3444 0000
For all our latest news and updates follow us on Twitter: https://twitter.com/mhclg
June 2020
ISBN: 978-1-5286-1814-4
CCS1119457608 06/20

5
Contents
Foreword – Luke Hall MP 6
Executive summary 7
National programme developments 9
Further funding for 2020-21 9
Financial framework update 9
Early Help System Guide 9
Supporting Families Against Youth Crime 10
Trialling the earned autonomy funding model 10
Delivering through devolved arrangements for Greater Manchester 11
Driving local performance 11
Promoting good practice 12
Evaluation progress 12
Successful family outcomes 13
Increase in successful family outcomes 13
Validation of claims 14
Evaluation findings 15
Research published alongside this report 15
Improving family outcomes 16
Transforming local services 20
Economic benefits 23
Annex A: Successful outcomes by local authority 2019-2020 24

6
Foreword – Luke Hall MP
I was delighted to have been appointed as the minister for the Troubled Families Programme which is an important part of this government’s work to support families.
I believe that a strong society needs strong families. The Troubled Families Programme provides intensive support to families facing multiple interconnected problems. I have seen for myself the fantastic work
taking place across the country and the importance of this support.
The programme recognises the importance of the family unit by considering all the interconnected needs of different family members. A single keyworker supports the family and coordinates services around a single plan. Alongside this the programme is encouraging system change. It encourages local services to work together in a much more integrated way by focussing on outcomes and by sharing data.
The Troubled Families Programme is one of the most rigorously evaluated programmes in government. Last year’s impact evaluation findings showed that the programme is making a positive impact in reducing children’s social care need, crime and Jobseeker’s Allowance claimants. It also provides value for money. The cost benefit analysis showed that every £1 spent on the programme delivers £2.28 of benefits.
This strong evidence base led us to commit in our manifesto to improve the Troubled Families Programme and champion family hubs to service vulnerable families with intensive, integrated support they need to care for children. The government is already acting on this manifesto commitment by providing up to £165m of additional funding to continue the current programme until 2021.
I am pleased to see the increases in successful family outcomes reported by local authorities. This report shows a significant increase in outcomes achieved by the programme over the last year. Now over 350,000 families have achieved successful family outcomes and many more have been worked with as part of the programme. Every successful family outcome represents a family’s life changed for the better.
This report provides further analysis to show who the programme is working for and how it is working. This provides us with useful evidence to consider in implementing our commitment to improve the Troubled Families Programme in the future.
Luke Hall Minister for the Troubled Families Programme Ministry of Housing, Communities and Local Government.

7
Executive summary
The Troubled Families Programme has received new investment to extend the programme for an additional year. The additional government funding of up to £165m will enable the current programme to continue until the end of 2020-21. This reflects the government’s manifesto commitment to improve the Troubled Families Programme and the government’s belief that a strong society needs strong families.
The national programme has been improved to ensure it continues to support delivery of government priorities. The updated financial framework ensures the programme is supporting priorities for early years, serious violence and homelessness. It extends eligibility for the programme to expectant parents and it clarifies eligibility criteria to encourage local areas to prioritise families affected by child sexual exploitation, gang and knife crime and those at risk of homelessness. This is accompanied by refreshed guidance for areas on transformation of local services.
The programme’s Supporting Families Against Youth Crime fund has provided £9.5m of additional funding over two years. The fund supports additional activity to address youth and knife crime in places of high need. An evaluation of the fund will provide evidence on promising practice in this area.
Local places report a significant increase in successful family outcomes funded by the programme. The latest performance data shows the number of positive family outcomes recorded by local places in the last year. Successful family outcomes have risen from 171,890 in March 2019 to 350,105 by 5 April 2020. This steep rise at the end of the programme reflects the early investment in services by local areas and the time required to achieve change with families who face complex problems.
Data analysis indicates that the programme is achieving outcomes by 1. providing extra support to families alongside statutory services for families with multiple complex needs and 2. intervening earlier with less complex families to address issues before they get worse.
1. Providing extra support alongside statutory services for families with complex needs.
Data analysis shows that the programme is having a positive impact on those who are already in contact with statutory services (children’s social care and the criminal justice system). This suggests that the programme is adding value to already existing work. Qualitative research indicates this could be by coordinating multiple services working with families to ensure the family is getting the right help at the right time and is engaging with specialist services.
2. Intervening with families to address issues before they get worse.
Data analysis shows the increase in use of Child Protection Plans for children on the programme is concentrated amongst children who were not previously in the child social care system. This suggests that the programme is effectively identifying families’ unmet needs and ensuring they receive appropriate support. There are also indications from the case study research that local programmes may be preventing escalation to children’s
8
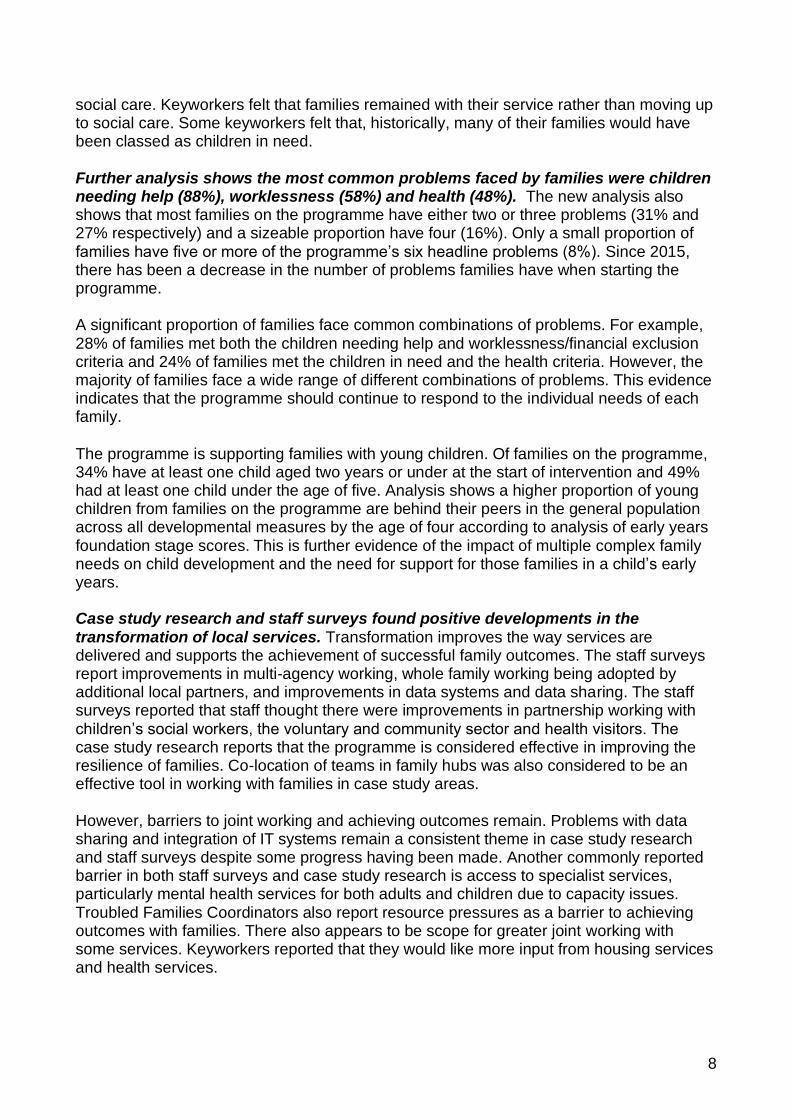
social care. Keyworkers felt that families remained with their service rather than moving up to social care. Some keyworkers felt that, historically, many of their families would have been classed as children in need.
Further analysis shows the most common problems faced by families were children needing help (88%), worklessness (58%) and health (48%). The new analysis also shows that most families on the programme have either two or three problems (31% and 27% respectively) and a sizeable proportion have four (16%). Only a small proportion of families have five or more of the programme’s six headline problems (8%). Since 2015, there has been a decrease in the number of problems families have when starting the programme.
A significant proportion of families face common combinations of problems. For example, 28% of families met both the children needing help and worklessness/financial exclusion criteria and 24% of families met the children in need and the health criteria. However, the majority of families face a wide range of different combinations of problems. This evidence indicates that the programme should continue to respond to the individual needs of each family.
The programme is supporting families with young children. Of families on the programme, 34% have at least one child aged two years or under at the start of intervention and 49% had at least one child under the age of five. Analysis shows a higher proportion of young children from families on the programme are behind their peers in the general population across all developmental measures by the age of four according to analysis of early years foundation stage scores. This is further evidence of the impact of multiple complex family needs on child development and the need for support for those families in a child’s early years.
Case study research and staff surveys found positive developments in the transformation of local services. Transformation improves the way services are delivered and supports the achievement of successful family outcomes. The staff surveys report improvements in multi-agency working, whole family working being adopted by additional local partners, and improvements in data systems and data sharing. The staff surveys reported that staff thought there were improvements in partnership working with children’s social workers, the voluntary and community sector and health visitors. The case study research reports that the programme is considered effective in improving the resilience of families. Co-location of teams in family hubs was also considered to be an effective tool in working with families in case study areas.
However, barriers to joint working and achieving outcomes remain. Problems with data sharing and integration of IT systems remain a consistent theme in case study research and staff surveys despite some progress having been made. Another commonly reported barrier in both staff surveys and case study research is access to specialist services, particularly mental health services for both adults and children due to capacity issues. Troubled Families Coordinators also report resource pressures as a barrier to achieving outcomes with families. There also appears to be scope for greater joint working with some services. Keyworkers reported that they would like more input from housing services and health services.

9
National programme developments
The national team works closely with local authorities and other public services across the country to inform future programme development. This section sets out significant developments in the national programme over the past year.
Further funding for 2020-21
The government believes that a strong society needs strong families and is committed to implementing its manifesto commitment to improve the Troubled Families Programme to serve vulnerable families with the intensive, integrated support they need - from the early years and throughout their lives. In January 2020, the government committed to a further £165m funding for the Troubled Families Programme in 2020-21. Within this funding, local authorities will receive double the previous sum of the Service Transformation Grant enabling them to increase investment in the transformation that improves the reach and capacity of family support.
Financial framework update
The government has published a revised financial framework for the programme for 2020-21. The framework sets out the rules of operation for the programme including eligibility criteria and standards to be met for a payment by results claim. This updated framework provides stability to local authorities with a significant degree of continuity while including iterative changes to ensure the programme is delivering on government priorities. The new framework extends eligibility for the programme to expectant parents and clarifies eligibility criteria to encourage areas to prioritise families affected by child sexual exploitation, gang and knife crime and risk of homelessness.
Early Help System Guide
The programme first introduced guidance on service transformation in 2016. This was known as the Service Transformation Maturity Model. Since then, local programmes have made significant progress on transformation as confirmed by the national evaluation’s case study research. Four years on from the introduction of the maturity model, the national team has provided updated guidance to reflect the latest practice particularly in the use of data and building community capacity. The new guide is known as the Early Help System Guide. It is designed to be used by the whole local partnership and should enable better planning to make the early help system more sustainable and deliver better support for families. The national team is encouraging areas to ensure their transformation plans are included in their local early help strategy.

10
Supporting Families Against Youth Crime
The Supporting Families Against Youth Crime fund was set up as a two-year, £9.5 million initiative to promote whole family working to address youth crime. The fund supports targeted interventions to prevent and address offending behaviour including youth and gang crime. The funded projects work with the whole family to tackle the root causes of violence and help prevent involvement of young people in crime and violence in the first place.
The programme has commissioned Ipsos MORI to provide an evaluation of the Supporting Families Against Youth Crime fund. This evaluation will be used to inform future policy making across Whitehall in this important area. Promising practice could be put forward for more testing in the future. The national team has already been proactive in sharing learning through events, supporting the Prime Minister’s Serious Youth Violence Summit in April 2019, continuing to support the development of Violence Reduction Units, and the delivery of the 2018 Serious Violence Strategy. Findings from the national evaluation show that the programme is effective in reducing crime, analysis showed a reduction of 15% for juvenile convictions and 38% in juvenile custody. Preventing and tackling youth crime continues to be a priority for the Troubled Families Programme.
Trialling the earned autonomy funding model
Early in 2018, 14 local authorities moved to a new up-front funding model in order to test whether a different funding approach would speed up service reform and delivery of whole family working. The selected areas were Barking and Dagenham, Brighton and Hove, Bristol, Camden, Cheshire West and Chester, Durham, Ealing, Islington, Kent, Leeds, Liverpool, Sheffield, Staffordshire and Westminster. They receive all their funding up-front rather than submitting payment by results claims.
The Ipsos MORI case study research includes a section on earned autonomy areas which found the approach was popular with the local authorities taking part. In the research, local authorities reported that in most cases, the up-front funding has enabled their plans to materialise faster than would otherwise have been possible. Greater certainty on the funding model has helped authorities increase partnership working and jointly plan. Earned autonomy will continue to March 2021 and the progress of these areas will continue to inform policy thinking on future funding models.
Across these areas there are examples of innovative whole family, multi-agency responses to domestic abuse and in housing services. Whole system workforce development initiatives feature in many, where partners are agreeing and embedding a common practice model or approach to working with families, meaning families will receive the same response irrelevant of which public service ‘front door’ they walk through. There has been a growth in team around the school approaches where multi professional groups are working together, in some places guided by data, to ensure a whole family response to all children in the school. In some areas, the use of data and development of cohort and population level outcomes has led to greater collaboration between partners at a strategic level leading to a more effective joined up response for the benefit of whole communities.
11
Delivering through devolved arrangements for Greater Manchester
Since 2017 the ten councils across the Greater Manchester city-region have received Troubled Families funding from MHCLG as part of devolved arrangements through a single pot known as the Reform Investment Fund. Greater Manchester report that managing Troubled Families funding through this approach has enabled the city-region to develop a sense of shared accountability for the use of Troubled Families funding. This has helped thousands of families get access to the support they need and aligned wider service transformation ambitions, most notably a move towards place-based early help models. Evidence from their evaluation of the programme is showing some successes as well as some challenges, giving focus to their transformation work. For example, it indicates that 62% of families that are supported do not go on to require support from children’s statutory services.
Driving local performance
The national team provide support to all areas delivering the programme. Alongside this, intensive help and advice has been made available to areas whose performance was below the national average on successful family outcomes and service reform. In these local authorities, a number of tools and practices have been introduced to drive performance and scale up delivery.
The programme has implemented a highly successful practice lead and secondment model, allowing practice leads with expertise in key issues such as data management, service transformation and partnerships to deliver the relevant expertise that authorities need. Continued and increased use of the team's performance diagnostic tool has established a menu of options for local authorities to utilise to address barriers. This tool has been developed for peer learning allowing examples of good practice and experience to be developed and shared among authorities. A 162% increase in successful family outcomes for lower performing areas between 2018-19 suggests that performance in these areas has significantly improved and this intensive approach has been successful.
The national team also provided dashboards to local authorities including both local level data from the national evaluation and numbers of successful family outcomes. This supports local areas to monitor performance and benchmark results against other areas. Continued local authority visits and liaison with external stakeholders also helps the programme build and maintain links with areas struggling to deliver and evidence whole family working.
In the staff survey, Troubled Families Coordinators are positive about the success of the national team, particularly in terms of providing support to those delivering the programme (70%).

12
Promoting good practice
Learning and sharing good practice from those delivering the programme has been a key element of supporting areas. The national team has been publishing examples of good practice throughout the year. The Troubled Families blog has highlighted many examples of good practice from different areas of the country and on different subject areas from parental conflict to emotional health. The latest Ipsos MORI case study research published alongside this report has a focus on providing examples of good practice. The programme team delivered nine regional meetings involving the majority of top tier local authorities sharing best practice on, localities and integration; digital; working with universal partners and communities. This insight into good practice and critical challenge supports future programme development.
Evaluation progress
Following publication of the results of the impact analysis in 2019, evaluation work has focussed on looking at what is driving the programme’s positive results. A summary of the latest findings is included in the final section of this report. In the coming year, the evaluation will continue to focus on which elements are producing positive outcomes for which families. This evidence will support the government’s manifesto commitment to improve the Troubled Families Programme.

13
Successful family outcomes
Each successful family outcome1 represents a positive change in a family’s life. Therefore, family outcomes targets are one of the main ways that government measures success on the programme. For most local places this is measured through a payment by results claim. Fourteen areas have earned autonomy status and Greater Manchester has a devolution deal with government. These areas receive all their funding up front and do not make payment by results claims. However, they continue to track and report on successful family outcomes reflecting the importance of this measure.
Increase in successful family outcomes
The programme has seen an upward trajectory of successful family outcomes over the last year. This is a major achievement and a reflection of all the good work by local authorities, their partners and most importantly families themselves. The latest figures submitted in April 2020 show that the programme has funded areas to work with 399,960 eligible families. However, local authorities have reported to us that they are working in a whole family way with at least 700,000 families. As of 5 April 2020, 350,105 families had reported successful family outcomes up from 171,890 last year, an increase of 178,215 families. Of these, 30,073 families have adults that have moved into sustained employment, an increase of 9,689 since last year. This steep rise at the end of the programme reflects work over the previous five years and the time required to achieve change with families who face complex problems. Figure 1: Number of families supported and achieved progress with on the Troubled Families Programme up to April 2020 compared to March 2019 and March 2018
1 Unlike the national evaluation’s net impact analysis, successful family outcomes figures are not measured against a comparison group, therefore we do not know how many of those outcomes have been achieved as a direct result of the programme.
289,809
92,245
6,477
380,249
171,890
20,384
399,960
350,105
30,073
0
50,000
100,000
150,000
200,000
250,000
300,000
350,000
400,000
450,000
Funded by the programme Achieved significant andsustained progress
Achieved continuousemployment
Num
ber
of
fam
ilies
2018 2019 2020

14
Although this report highlights successful family outcomes, it is important to stress that we also measure success in terms of how areas (with their partners) are reforming their collective response to families. This includes how those reforms are being embedded to ensure families in the future will receive consistent whole family support. There is also evidence in the case study research that where families have not yet met the high bar set for a successful family outcome measure to be achieved, they may well have made significant progress and that too should be celebrated.
Validation of claims
The programme’s validation process for payment by results claims ensures that local programmes are meeting the national programme requirements. It is referred to as the ‘spot check’ process. It involves visits to view local data systems and case files, as well as meetings with service managers and keyworkers. This process checks whether families are eligible for the programme, that local practice adheres to the whole family working principles, and that there is evidence that the outcomes have been achieved. MHCLG has completed 237 spot checks up until March 2020. All local authorities have undertaken the process once, and MHCLG is now undertaking a second round. The vast majority (97%) of claims have been found to be valid, with invalid claims removed from the claims total. Feedback is provided to local areas on their claims and on their data systems. These national claims validation procedures are in addition to local auditing and assurance of claims.

15
Evaluation findings
The national evaluation of the programme looks at whether the programme is achieving its aims and if so how. It looks at the impact of the programme on families, the level and form of service transformation, the fiscal and economic benefits of the programme and how it is achieving change. The evaluation uses a range of research methods. Findings from these research methods are published throughout the course of the programme as they become available. This is the fifth evaluation publication and four pieces of new evidence are published alongside this report. Previous publications are available at gov.uk.
Research published alongside this report
1. Analysis of national and local datasets – part 5 (MHCLG analysis)
The report builds on the findings of the previous outcome reports. It includes analysis on whether the programme has been more effective for some families than others and analysis on the number and combinations of problems families are facing.
2. Case study research - part 4 of 4 (by Ipsos MORI)
This is the fourth wave of case study research and the final round of this research on the programme. Case study research looks at families’ experience of the programme and how local services are changing. This round of research also covered specific points of interest to the national team such as working with children’s social care, worklessness and financial exclusion, data sharing, the earned autonomy funding model and details on how areas were preparing for the possible end of the programme in 2020. The research consists of in-depth qualitative interviews with families, keyworkers and senior managers in five local authority case study areas. Higher performing areas were chosen for this phase to enable researchers to highlight good practice. Ipsos MORI also conducted online forums with family keyworkers and earned autonomy leads.
3. Staff surveys - part 4 of 5 (by Ipsos MORI)
Three separate staff surveys are conducted every year for Troubled Families Coordinators, keyworkers and Troubled Families Employment Advisers across the country. The fieldwork for these latest surveys was completed between October and December 2018. As data is available over a four-year period, the report compares the latest results with previous years to look at trends over time. The findings of the three staff surveys are consistent about the positive views of the programme but also the constraints. Over time the number of responses from Troubled Families Employment Advisors and keyworkers has increased but the number of Troubled Families Coordinators has decreased (118 in 2015, 89 in 2018). The results are based on self-reported perceptions of staff rather than system data.

16
4. Family survey additional analysis (by Ipsos MORI)
This additional analysis of family survey data looks at 1. outcomes over time for different groups and 2. experiences for different groups of people compared to the average (this shows us how needs differ for different groups). In 2015, the first family survey included asking 1,145 families about their lives. In 2017, the follow up family survey re-interviewed 654 families. They asked the same questions to look at how their lives had changed. They also asked about families' experiences and thoughts on the help they received. This section of the report summarises the most significant findings from the research published alongside this report. The summaries are organised around the three aims of the programme: 1. Improving family outcomes, 2. Transforming local services and 3. Making savings for the taxpayer (economic benefits).
Improving family outcomes
Who does the programme work for?
Data analysis2 builds on findings of overall impact of the programme published in March 2019. This new data analysis focuses on children’s services and offending outcomes and looks at which individuals and families the programme is benefiting the most. On children’s services, the analysis shows two significant findings 1. the programme has an impact for those who have been involved with children’s social care in the year before joining the programme. In particular, those already on a child in need plan or on a Child Protection Plan are less likely to be in touch with children’s social care after joining the programme. 2. The results also suggest that the programme is uncovering unmet need. After joining the programme, the proportion of children on a Child Protection Plan increases amongst those not previously on a child in need plan and not in contact with children’s social care. This supports the theory that the increase in Child Protection Plans seen in the impact analysis is due to the programme uncovering unmet need.
On offending, the programme also appears to have had a more positive impact on offending outcomes for those families with a recent criminal history, i.e. reducing the probability of cautions and convictions among families with a conviction in the year before the programme or identified as meeting the programme’s crime and anti-social behaviour criterion. This may suggest that the programme is having a greater effect amongst families who were already identified as having problems with offending behaviour.
How do individual outcomes change over time?
Analysis to track individual outcomes over time suggested that the status of children changed after starting on the programme for most children who were interacting with any children’s social care service before they joined the programme. The majority of children who were looked after, on a Child Protection Plan or a children in need plan were only in
2 Interaction effects models were developed to test the difference in impacts (i.e. the relative difference) of the programme between sub-groups. See the outcomes report; Part 5 for fuller explanation and results.

17
touch with universal services and not in touch with statutory children’s services two years later. The same analysis for offending behaviour also suggests that the majority of adults and juveniles who had been convicted or given a custodial sentence before they joined the programme had improved offending outcomes. Their contact with the criminal justice system in the two-year period after joining had stopped or was at least reduced in its severity. The family survey analysis also looks at changes over time for particular groups. The analysis shows all groups have seen statistically significant positive changes for the majority of outcomes between the first family survey and the follow up family survey. It looked at whether life improved for the following groups: lone parents, adults with a history of partner abuse, workless households, families with more than two children and adults with a positive experience3 of the programme. For all groups there are positive changes in employment, education, crime and anti-social behaviour, and service experience. However, some groups see more mixed outcomes on health and wellbeing, and on financial exclusion.
How is the programme having a positive impact?
This analysis considered together with previous findings provides an indication of the mechanisms by which the programme may be having an impact, and how these mechanisms differ for different families. Although, it is difficult to draw definitive conclusions, our hypothesis is that there are two relatively distinct mechanisms by which the programme may be having an impact, with two different groups of families. Mechanism 1 – Providing support alongside existing public services (children’s social care and criminal justice services) with families who have entrenched, complex needs. The programme seems to be improving outcomes for families who are working with statutory public services. The case study research reports that part of the role of keyworkers is coordinating public service delivery, and that they are effective at doing this. There is strong qualitative evidence that keyworkers are working with other professionals who are already in contact with the families (most notably social workers, the police and youth offending teams), co-ordinating multiple services, working across families’ multiple needs and addressing some of the underlying problems that statutory services struggle to deal with, such as anti-social behaviour and children at risk of harm. This approach appears to be effective at reducing reliance on high cost and high intensity public services, particularly amongst children in these families. The positive results from the impact evaluation, particularly around reductions in the proportions of looked after children, juvenile convictions and juvenile custodial sentences, show that the programme has been effective at reducing families’ use of these services. The latest analysis published alongside this report suggests that the programme has had this effect by
3 Based on responses to question QW2SE7, Very helpful: Overall, how helpful, if at all, have you found having << key worker name>> working with you and your family?

18
providing effective and focused support to families that were already interacting with services before they joined the programme.
Mechanism 2 –Intervention with families who have lower identified needs and less
contact with statutory services to stop problems getting worse.
The programme also seems to be working with families that have had less contact with statutory public services, but who have unmet needs, or their problems are at risk of getting worse. The overall impact analysis published in March 2019 showed an increase in the proportion of children on Child Protection Plans. The data analysis published alongside this report suggests this increase is concentrated amongst children who were not previously in the child social care system, suggesting that the programme is effectively identifying at-risk families and ensuring they are receiving the services they need. The case study research and staff surveys corroborate these findings. The case study research found that early help and social care services are working closely together to achieve better outcomes for families before, during and after episodes in children’s social care. It also found positive changes in case study areas in terms of joint working between social workers and children’s social care over the past couple of years. There are also indications from the case study research that local programmes may be preventing escalation to children’s social care. Keyworkers felt that families remained with their service rather than moving up to social care. Some keyworkers felt that, historically, many of their families would have been classed as children in need. In the latest wave of the staff survey, 82% of keyworkers reported that they think the programme is effective at preventing children becoming a child in need, 76% saying the programme is very or fairly effective in preventing step-up to a Child Protection Plan and 68% saying it has been very or fairly effective in preventing children becoming looked after. Therefore, there is evidence that the programme works across the continuum of need. It provides support to families at the earliest point possible but where there is significant risk of harm to a child cases are escalated to statutory Child Protection Plan status.
Further analysis of families' problems
To better understand the problems faced by families, analysts looked at the criteria that had been met for families on the programme. They must meet a minimum of two criteria to be eligible for the programme. This new analysis shows that the most families on the programme have either two or three problems (31% and 27% respectively) and a sizeable proportion have four (16%). Only a small proportion of families have five or six of the programme’s six headline problems (8%)4. The most common problem faced by families was children needing help (88%), the second most common problem was worklessness at 58% and the third most common was health (48%).
4 The remaining 18% met fewer than 2 criteria. This could be due to data quality issues, the reliance of local authorities on local discretion to include families with other needs on the programme or because families met only one criterion.

19
Figure 2: Proportion of families meeting each criterion for the programme.
The data analysis of each cohort of families joining suggests some reduction in the number of problems faced by families when they join the programme over time. There has been a small increase in the number of families meeting two criteria and a small decrease in the number of families meeting four, five and six criteria. There are numerous possibilities for why we may be seeing this. It may be that the most serious cases were worked with earlier in the programme or that services have more recently struggled to deal with more complex families because of resource constraints. However, further research would be needed to investigate this. A significant proportion of families face common combinations of problems. For example, 28% of families met both the children needing help and worklessness/financial exclusion criteria and 24% of families met the children in need and the health criteria. Therefore, there is some evidence that there are sizeable sub-populations of families on the programme with similar needs. However, the majority of families face a wide range of different combinations of problems. This evidence indicates that the programme should continue to respond to the individual needs of each family. The additional analysis of the family survey also shows some common combinations of problems. The second part of the analysis looks at the needs of different groups (families with different characteristics). It shows a clear association between unemployment/financial exclusion and long-term health conditions/mental health. These issues appear related to those that are risk factors for a child in need of help, the most prevalent criterion in the data. According to the family survey analysis, unemployed people are more likely to have trouble keeping up with bills, have two or more loan or credit products, have a long-term disability, less likely to own their home or have qualifications. People who are in work are more satisfied with life overall. Those with long standing illness or disabilities are less likely to be employed and own their own home. They are more likely to be struggling to keep up with bills, have experienced partner leaving/family break up or sexual abuse in their home since they became an adult. There is a consistency between the family survey and data analysis in terms of combinations of problems.
88
58
48
4034
21
0
10
20
30
40
50
60
70
80
90
100
Childneeding
help
Financialexclusion
Health Schoolattendance
Domesticabuse
Crime andASB
Pro
po
rtio
n o
f fa
mili
es o
n th
e
Tro
ub
led
Fa
mili
es P
rog
ram
me
(%
)
Criteria met

20
Figure 3: Most common combination of issues faced for families meeting 2 or 3 headline criteria.
The case study research and staff surveys also show the interconnection between worklessness and health. The case study research refers to drug and alcohol issues and access to mental health services as common barriers to work. The Troubled Families Employment Advisor staff survey reports mental health as the top gap in provision and the top issue faced by families. Data analysis also shows that the programme is supporting families with young children. Of families on the programme, 34% have at least one child aged two years or under at the start of intervention and 49% had at least one child under the age of five. Analysis of the early years foundation scores shows a higher proportion of young children from families on the programme are behind their peers in the general school population across all developmental measures by the age of four. This is further evidence of the impact of multiple complex family needs on child development and the need for support for families in a child’s early years.
Transforming local services
Transformation of services can improve the way services are delivered and supports the achievement of successful family outcomes. In making changes to services, local areas are guided by the principles of the programme of earlier intervention, a focus on outcomes and data, whole family working and multi-agency working. The service transformation guidance provides further detail of what transformation could look like. The latest case study research and staff surveys provide updated evidence on the level and form of service transformation. Research has been taking place since 2015 enabling it to observe changes over time. Overall, the case study research reports positive developments in service transformation. However, areas have implemented a variety of
14
16
22
14
24
28
0 5 10 15 20 25 30
3
2
1
Proportion of families on the Troubled Families Programme (%)
Rank,
most com
mon c
om
bin
ations o
f is
sues e
xp
eri
enced
2 criteria 3 criteria
Child needing help / financial exclusion
Child needing help / financial exclusion / health
Child in need / health
Child needing help / financial exclusion / education attendance
Child needing help / domestic violence
Child needing help / health / education attendance

21
different models. The programme remains consistently popular with both staff and families. Families report positive experiences, strong relationships with keyworkers and help that they considered made a difference to their lives. Staff think the approach is effective at achieving lasting change and is a positive way of working. Troubled Families Coordinators remain positive about the programme’s effectiveness in achieving long-term positive change in families’ circumstances (87%) and wider system reform (79%). Local staff said that a shift towards earlier intervention had led to greater identification of need and preventative work. Troubled Families Coordinators remain positive about the programme’s effectiveness in achieving a focus on early intervention (85%). This is consistent with last year (86%). In the case study research section on preparing for 2020, Troubled Families Coordinators reported that the principles underpinning the programme such as early intervention, prevention and identifying risk are sufficiently integrated into service planning. The case study research also reported that local staff said that a shift to earlier intervention had led to greater identification of need. The case study sections on mental health and knife crime both report examples of good practice in seeking to identify needs early. Staff indicated that a certain amount of early help activity was dependent on funding received through the Troubled Families Programme. On outcomes and data, improvements have been made but challenges remain. The staff survey found that 72% of Troubled Families Coordinators remain positive about the programme’s effectiveness in achieving data sharing between agencies. The case study research finds that practitioners have sought to make improvements to data sharing between agencies and partners since the first year of the evaluation in 2015. Since then, data sharing has led to progress in identifying families that require support, and aided partners to coordinate the services they provide to families. Elements of good practice cited by the report include having software-based case management systems in place for both the local authority services and partner organisations and having the resource and expertise to manage this. In addition, data sharing agreements have been used to establish a clear legal basis for sharing data and helped local authorities demonstrate compliance with the General Data Protection Regulation (GDPR). However, there were still barriers to data sharing that persisted across the case study areas in the final round of case study research. These can be grouped into three areas: 1. culture/engagement barriers - partners such as schools and GP practices were still reluctant to share data with outside agencies, 2. Information governance barriers - for example partners had concerns around the training and compliance of all local partners with the GDPR; And 3. Technical barriers - harmonisation of IT systems were costly and time intensive. It found that health partners were particularly reluctant to share information and there is high sensitivity around health data. Local authorities stress the need for sufficient funding to support information sharing.
Whole family working is being adopted by additional local agencies. Troubled Families Coordinators remain positive about the programme’s effectiveness in achieving whole family working (99%). This has been consistently high. However, there is further evidence that whole family working is being adopted by additional partner services. Troubled Families Coordinators are increasingly confident that children’s social care (90%), youth offending teams (66%) and health visitors (61%) have the skills to deliver whole family working but challenges remain particularly in police (25%) and housing (40%). Keyworkers were viewed as trusted, supportive professionals, ensuring that

22
families build the skills they need to help them overcome challenges and meet their goals. This view has been consistent over the four years of case study research and remains so in the final wave. Multi-agency working has improved particularly with children’s social workers and the voluntary and community sector. Troubled Families Coordinators report that they feel more of a common purpose, commissioning services designed to deliver whole family outcomes, up from 54% to 67%. The case study research says that partnership working has increased, and the programme’s principles have become embedded in the wider system. The staff survey shows that the programme is being delivered increasingly by other lead professionals from across local public services rather than dedicated troubled families intervention workers (see figure 4). Since 2015, the number of dedicated keyworkers delivering the programme has decreased and the number of other lead workers delivering the programme has increased significantly. This may indicate that the programme is being increasingly integrated into the wider system. The case study research also found evidence of more close working between children’s social care and troubled families teams. The staff survey corroborates this. Troubled Families Coordinators are more positive about their programme’s links to wider local and national transformation programmes in children’s services (87% to 94%) and increasingly for health (54% to 65%). Good practice in multi-agency working identified by the case study research includes common communication protocols, co-location, workforce development at a multi-agency level, engaging the voluntary sector and establishing coherent multi-agency leadership in an area. Co-location of teams in family hubs was also considered to be an effective tool in working with families. However, barriers to joint working remain. Access to mental health services is consistently reported across the research as a barrier to achieving outcomes. Consistent with the findings from 2015, 2016 and 2017, the staff survey results show that keyworkers require greater engagement with mental health services for children (57%) foremost, followed by those for adults (51%), and housing services (30%). For Troubled Families Employment Advisors, mental health continues to be the most commonly faced main barrier to work or training for families. The case study research found that waiting list for specialist services, particularly Child and Adolescent Mental Health Services (CAMHS), is a barrier to achieving outcomes with families. Resource challenges are also cited.

23
Figure 4: Average number of staff in different roles delivering the programme
Data taken from Ipsos MORI Troubled Families Coordinator Staff survey.
Economic benefits
Cost Benefit Analysis published alongside the net impact analysis in 2019 suggested the programme is providing a net benefit to the taxpayer by reducing demand on high cost acute services. The analysis shows that every £1 spent on the programme delivers £2.28 of benefits. This is based on a limited set of measures for which we have impact analysis and uses conservative estimates.
77
53
72
89
27
53
44 45
58 8 8
2 2 2 2
0
10
20
30
40
50
60
70
80
90
100
2015 2016 2017 2018
Me
an
nu
mb
er
(F
TE
) o
f tr
ou
ble
d fa
mili
es
pro
gra
mm
e s
taff p
er
LA
Year
Other leadprofessionals fromother public services
Dedicated troubledfamilies interventionworkers
Management andsupport staff in thetroubled familiesteam (excludingdata analysts)
Data analysts

24
Annex A: Successful outcomes by local authority 2019-2020
Local authority Local Programme Start
Date
Funded families on the programme at March
2020**
Number of families achieving successful
outcomes up to 5th April 2020
Number of families achieving significant and sustained progress up to
5th April 2020
Number of families achieving continuous
employment up to 5th April 2020
Barking and Dagenham* Sep-2014
2,470 2,352 1,934 418
Barnet Sep-2014 2,220 2,220 2,162 58
Barnsley Jan-2015 2,210 2,210 1,829 381
Bath and North East Somerset Sep-2014
700 700 634 66
BCP**** 2,216 2,216 2,133 83
Bedford Jan-2015 920 920 907 13
Bexley Jan-2015 1,410 1,258 1,214 44
Birmingham Apr-2015 14,300 10,856 10,496 360
Blackburn with Darwen Jan-2015
1,670 1,402 1,340 62
Blackpool Sep-2014 1,830 1,253 1,224 29
Bracknell Forest Jan-2015 400 391 374 17
Bradford Sep-2014 6,070 2,560 2,111 449
Brent Jan-2015 3,210 3,210 2,825 385
Brighton and Hove* Jan-2015
2,280 1,946 1,775 171
Bristol* Sep-2014 4,100 4,100 3,050 1,050
Bromley Sep-2014 1,700 1,700 1,630 70

25
Buckinghamshire Jan-2015 1,860 1,507 1,342 165
Calderdale Sep-2014 1,650 1,593 1,404 189
Cambridgeshire Jan-2015 2,840 2,500 2,248 252
Camden* Apr-2015 2,100 1,499 1,442 57
Central Bedfordshire Apr-2015
1,120 1,120 1,087 33
Cheshire East Apr-2015 1,900 1,900 1,841 59
Cheshire West and Chester* Jan-2015
1,820 1,820 1,651 169
Cornwall Apr-2015 4,010 4,010 3,818 192
Coventry Jan-2015 3,160 1,071 702 369
Croydon Jan-2015 3,050 3,050 2,880 170
Cumbria Apr-2015 3,380 3,380 3,229 151
Darlington Jan-2015 930 712 640 72
Derby Jan-2015 2,230 1,463 1,304 159
Derbyshire Sep-2014 4,510 4,233 3,493 740
Devon Apr-2015 4,280 4,125 4,055 70
Doncaster Apr-2015 2,950 2,950 2,430 520
Dorset Jan-2015 1,874 1,874 1,748 126
Dudley Sep-2014 2,440 1,382 1,306 76
Durham* Sep-2014 4,360 4,360 3,865 495
Ealing* Apr-2015 3,010 2,576 2,087 489
East Riding of Yorkshire Jan-2015
1,670 1,597 1,409 188
East Sussex Jan-2015 3,450 2,504 2,455 49
Enfield Jan-2015 2,970 2,970 2,198 772

26
Essex Jan-2015 7,570 7,570 6,904 666
Gateshead Sep-2014 1,930 1,930 1,720 210
Gloucestershire Jan-2015 2,980 2,980 2,674 306
Greater Manchester* Sep-2014
27,230 26,965 26,511 454
Greenwich Sep-2014 2,780 2,592 2,289 303
Hackney Sep-2015 3,510 3,510 3,155 355
Halton Jan-2015 1,350 1,350 1,159 191
Hammersmith and Fulham Jan-2015
1,690 1,642 1,409 233
Hampshire Jan-2015 5,540 1,487 1,263 224
Haringey Sep-2014 3,130 2,798 2,525 273
Harrow Apr-2015 1,330 839 804 35
Hartlepool Sep-2014 1,000 1,000 914 86
Havering Sep-2014 1,450 1,351 1,288 63
Herefordshire Jan-2015 1,090 776 690 86
Hertfordshire Apr-2015 4,670 4,670 4,558 112
Hillingdon Apr-2015 1,990 1,990 1,908 82
Hounslow Jan-2015 2,100 2,100 2,068 32
Isle of Wight Apr-2015 1,000 559 414 145
Islington* Jan-2015 2,630 1,565 1,335 230
Kensington and Chelsea Sep-2015
1,130 1,014 862 152
Kent* Jan-2015 9,200 9,200 8,862 338
Kingston upon Hull Jan-2015
3,510 2,353 2,027 326

27
Kingston upon Thames Apr-2015
680 680 667 13
Kirklees Jan-2015 3,740 3,575 3,345 230
Knowsley Sep-2014 2,010 2,010 1,889 121
Lambeth Sep-2014 3,480 3,480 2,923 557
Lancashire Sep-2015 8,620 8,620 8,054 566
Leeds* Sep-2014 6,900 6,673 5,768 905
Leicester Jan-2015 3,940 2,488 2,313 175
Leicestershire Sep-2014 2,770 2,770 2,102 668
Lewisham Jan-2015 3,170 2,938 2,831 107
Lincolnshire Jan-2015 4,760 4,760 4,159 601
Liverpool* Sep-2014 6,760 6,760 3,968 2,792
Luton Jan-2015 1,940 1,940 1,864 76
Medway Towns Apr-2015 2,060 2,060 1,865 195
Merton Sep-2014 1,150 831 822 9
Middlesbrough Sep-2014 1,860 1,860 1,785 75
Milton Keynes Apr-2015 1,600 1,600 1,589 11
Newcastle upon Tyne Sep-2014
3,010 2,199 2,149 50
Newham Apr-2015 4,020 2,627 2,562 65
Norfolk Apr-2015 5,680 3,547 3,378 169
North East Lincolnshire Jan-2015
1,700 1,536 1,525 11
North Lincolnshire Jan-2015 1,260 854 822 32
North Somerset Sep-2014 1,010 1,010 993 17
North Tyneside Jan-2015 1,480 1,480 1,405 75

28
North Yorkshire Sep-2014 2,700 2,700 2,515 185
Northamptonshire Jan-2015 4,420 1,210 1,048 162
Northumberland Jan-2015 2,120 1,848 1,754 94
Nottingham Jan-2015 3,840 3,840 3,096 744
Nottinghamshire Jan-2015 5,170 3,764 3,286 478
Oxfordshire Sep-2014 2,850 2,850 2,683 167
Peterborough Jan-2015 1,730 1,730 1,524 206
Plymouth Sep-2014 2,380 2,380 2,163 217
Portsmouth Jan-2015 1,900 1,365 1,202 163
Reading Apr-2015 1,170 904 802 102
Redbridge Sep-2014 1,990 1,990 1,890 100
Redcar and Cleveland Sep-2014
1,290 1,048 960 88
Richmond upon Thames Sep-2014
650 650 642 8
Rotherham Apr-2015 2,500 2,500 2,186 314
Rutland Apr-2015 100 100 99 1
Sandwell Jan-2015 3,920 3,920 3,712 208
Sefton Jan-2015 2,130 2,130 1,962 168
Sheffield* Sep-2014 5,360 5,360 5,079 281
Shropshire Jan-2015 1,580 871 744 127
Slough Apr-2015 1,260 877 876 1
Solihull Jan-2015 1,210 1,149 1,069 80
Somerset Jan-2015 3,000 3,000 2,829 171
South Gloucestershire Sep-2014
1,050 951 890 61

29
South Tyneside Apr-2015 1,430 1,167 930 237
Southampton Sep-2014 2,230 1,077 829 248
Southend-on-Sea Jan-2015 1,480 1,085 1,021 64
Southwark Apr-2015 3,340 3,340 2,917 423
St. Helens Jan-2015 1,710 1,666 1,575 91
Staffordshire* Jan-2015 4,680 3,528 3,347 181
Stockton-on-Tees Jan-2015 1,560 1,560 1,480 80
Stoke-on-Trent Apr-2015 2,890 2,625 2,339 286
Suffolk Jan-2015 4,110 3,778 3,597 181
Sunderland Jan-2015 2,540 1,946 1,811 135
Surrey Sep-2014 3,700 2,730 2,612 118
Sutton Apr-2015 1,110 710 684 26
Swindon Jan-2015 1,310 1,310 1,271 39
Telford and Wrekin Jan-2015
1,360 1,081 1,001 80
Thurrock Apr-2015 1,220 1,220 1,162 58
Torbay Apr-2015 1,180 1,180 1,087 93
Tower Hamlets Apr-2015 3,660 2,287 2,244 43
Wakefield Sep-2014 3,030 3,030 2,903 127
Walsall Jan-2015 2,830 2,830 2,661 169
Waltham Forest Jan-2015 2,990 2,990 2,916 74
Wandsworth Sep-2014 2,190 1,855 1,703 152
Warrington Apr-2015 1,250 968 896 72
Warwickshire Sep-2014 2,790 2,790 2,720 70
West Berkshire Sep-2014 540 415 317 98
West Sussex Sep-2014 3,940 3,940 3,790 150

30
Westminster* Sep-2015 2,080 1,592 1,309 283
Wiltshire Jan-2015 1,990 1,990 1,930 60
Windsor and Maidenhead Jan-2015
460 286 242 44
Wirral Jan-2015 3,000 1,975 1,920 55
Wokingham Apr-2015 340 195 151 44
Wolverhampton Apr-2015 2,890 2,890 2,524 366
Worcestershire Jan-2015 3,180 2,582 2,508 74
York Jan-2015 950 321 235 86
Total 399,960 350,105 320,032 30,073
Footnotes
* Earned Autonomy areas (and Greater Manchester which delivers the programme under a devolution agreement) no longer submit numbers of familyoutcomes for payment by results purposes. Instead they report successful family outcomes achieved for sustained and significant progress and continuousemployment.
**We know that areas are working with a far greater number of families than they have been paid for. As at March 2020 local authorities reported that over 755,000 families were on the programme. However, it is not a requirement for areas to report the full number of unfunded families on the programme so it is not consistently available for all areas and has not been included in the breakdown above.
*** Areas had a deadline of 5th April 2020 to submit the number of families achieving family outcomes in this financial year. This was extended from the original deadline of 26th March 2020 due to the Covid-19 pandemic.
**** All results are subject to spot check.
***** Greater Manchester is currently in the process of refreshing its employment data.
******On 1 April 2019 the councils previously serving Bournemouth, Christchurch and Poole were replaced by Bournemouth, Christchurch and Poole Council, known as BCP. The numbers attributed to BCP represent the combined target for the predecessor areas and takes account of the progress in each of those areas prior to reorganisation.