teresa audesirk • gerald audesirk • bruce e. byers
TRANSCRIPT

Biology: Life on Earth Eighth Edition
Lecture for Chapter 26 Population Growth
and Regulation
Copyright © 2008 Pearson Prentice Hall, Inc.
Teresa Audesirk • Gerald Audesirk • Bruce E. Byers


Chapter 26 Outline
• 26.1 How Does Population Size Change? p. 514
• 26.2 How Is Population Growth Regulated? p. 515
• 26.3 How Are Populations Distributed in Space and Time? p. 524
• 26.4 How Is the Human Population Changing? p. 526

Section 26.1 Outline
• 26.1 How Does Population Size Change? – Biotic Potential Can Produce Exponential
Growth

The Study of Ecology
• Ecology: the study of interrelationships between living things and their nonliving environment

The Study of Ecology
• The environment consists of two components – Abiotic component: nonliving, such as soil
and weather – Biotic component: all living forms of life

The Study of Ecology
• Ecology can be studied at several organizational levels – Organism: An individual – Populations: all members of a single species
living in a given time and place and actually or potentially interbreeding
– Ecosystem: all the interacting populations in a given time and place

The Study of Ecology
• Ecology can be studied at several organizational levels – Communities: all the organisms and their
nonliving environment in a defined area – Biosphere: all life on Earth


How Does Population Size Change?
• Several processes can change the size of populations – Birth and immigration add individuals to a
population – Death and emigration remove individuals
from the population
How Does Population Size Change?
• Change in population size = (births – deaths) + (immigrants – emigrants)

How Does Population Size Change?
• Ignoring migration, population size is determined by two opposing forces – Biotic potential: the maximum rate at which
a population could increase when birth rate is maximal and death rate minimal
How Does Population Size Change?
• Ignoring migration, population size is determined by two opposing forces – Environmental resistance: limits set by the
living and nonliving environment that decrease birth rates and/or increase death rates (examples: food, space, and predation)

Population Growth
• The growth rate (r) of a population is the change in the population size per individual over some time interval
• Determined by Growth rate (r) = birth rate (b) – death rate (d)

Population Growth
• Birth rate (b) is the average number of births per individual per unit time – Example: if there are 5 births among 10
individuals, b = 5/10 = 0.5

Population Growth
• Death rate (d) is the proportion of individuals dying per unit time – Example: if 4 of 10 individuals die, d = 4/10
= 0.4 – Thus, r = b – d = 0.5 – 0.4 = 0.1

Population Growth
• Population growth per unit of time can be calculated by multiplying growth rate (r) by the original population size (N)
Population growth (G) = rN • In the previous example, population
growth = rN = 0.1(10) = 1, so the population has grown by one individual

Population Growth
• To determine the size of the population at the end of the time period, add the population growth (rN) to the initial population size (N) = N + rN = 10 + 0.1(10) = 10 + 1 = 11

Exponential Growth
• Exponential growth occurs when a population continuously grows at a fixed percentage of its size at the beginning of each time period – This results in a J-shaped growth curve


Biotic Potential
• Biotic potential is influenced by several factors
(1) The age at which the organism first reproduces
– Populations that have their offspring earlier in life tend to grow at a faster rate


Biotic Potential
(2) The frequency at which reproduction occurs
(3) The average number of offspring produced each time
(4) The length of the organism's reproductive life span
(5) The death rate of individuals – Increased death rates can slow the rate of
population growth significantly

Section 26.2 Outline
• 26.2 How Is Population Growth Regulated? – Exponential Growth Only Occurs Under
Special Conditions – Environmental Resistance Limits Population
Growth

Exponential Growth
• Exponential growth cannot continue indefinitely
• All populations that exhibit exponential growth must eventually stabilize or crash

Exponential Growth
• Exponential growth can be observed in populations that undergo boom-and-bust cycles – Periods of rapid growth followed by a sudden
massive die-off

Exponential Growth
• Example – Each year cyanobacteria in a lake may
exhibit exponential growth when conditions are ideal, but crash when they have depleted their nutrient supply

Exponential Growth
• Temporary exponential growth can occur when population-controlling factors are relaxed, such as – When food supply is increased – When predators are reduced

Exponential Growth
• When exotic species are introduced into a new ecosystem, population numbers may explode due to lack of natural predators

Exponential Growth
• When species are protected, e.g. the whooping crane population has grown exponentially since they were protected from hunting and human disturbance in 1940


Environmental Resistance
• Many populations that exhibit exponential growth eventually stabilize
• Environmental resistance limits population growth – As resources become depleted, reproduction
slows

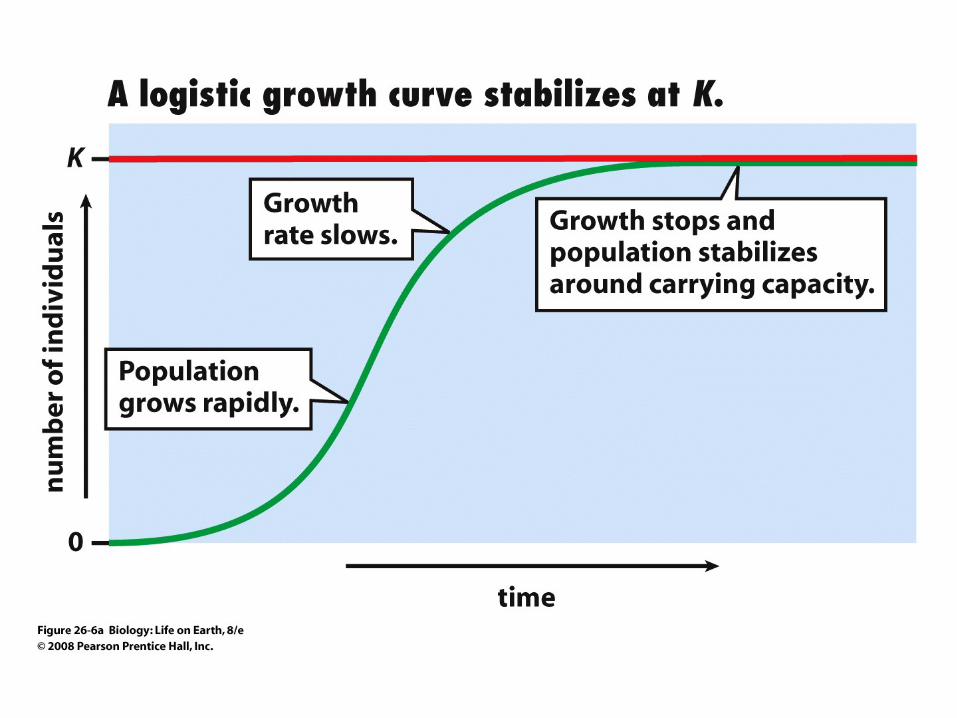
Environmental Resistance
• This growth pattern, where populations increase to the maximum number sustainable by their environment, is called logistic growth
• When this growth pattern is plotted, it results in an S-shaped growth curve (or S-curve)

Environmental Resistance
• Carrying capacity (K) is the maximum population size that can be sustained by an ecosystem for an extended time without damage to the ecosystem

Environmental Resistance
• Logistic population growth can occur in nature when a species moves into a new habitat, e.g. barnacles colonizing bare rock along a rocky ocean shoreline
• Initially, new settlers may find ideal conditions that allow their population to grow almost exponentially
• As population density increases, individuals compete for space, energy, and nutrients

Environmental Resistance
• These forms of environmental resistance can reduce the reproductive rate and average life span and increase the death rate of young
• As environmental resistance increases, population growth slows and eventually stops

Environmental Resistance
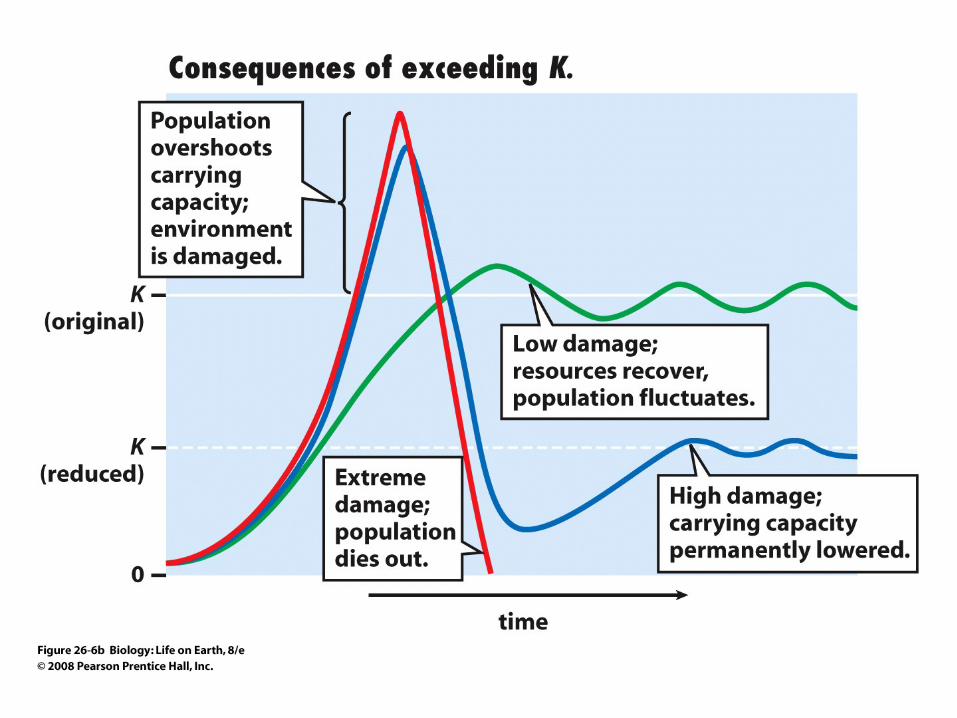
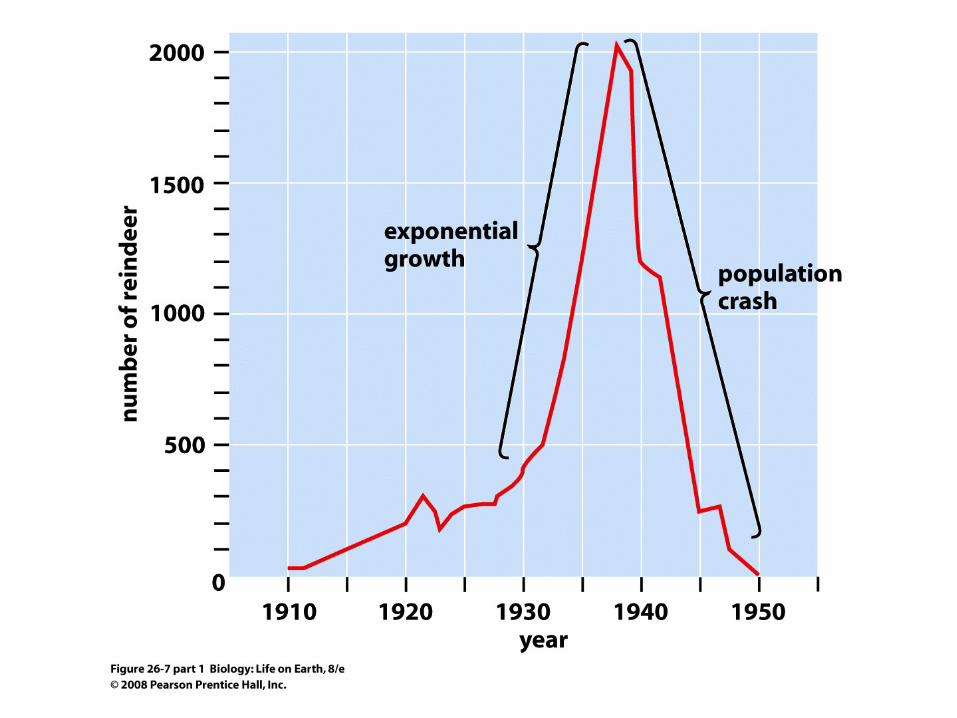
• If a population far exceeds the carrying capacity, excess demands decimate crucial resources
• This can permanently and severely reduce K, causing the population to decline to a fraction of its former size or disappear entirely
Environmental Resistance
• Example: Pribilof Island reindeer populations


Environmental Resistance
• In nature, conditions are never completely stable, so both K and the population size will vary somewhat from year to year
• However, environmental resistance ideally maintains populations at or below the carrying capacity of their environment

Environmental Resistance
• Environmental resistance can be classified into two broad categories – Density-independent factors – Density-dependent factors

Density-Independent Factors
• Density-independent factors limit populations regardless of their density – Examples: climate, weather, floods, fires,
pesticide use, pollutant release, and overhunting

Density-Independent Factors
• Some species have evolved means of limiting their losses – Examples: – Migration – Dormancy

Density-Dependent Factors
• Density-dependent factors become more effective as population density increases
• Exert negative feedback effect on population size
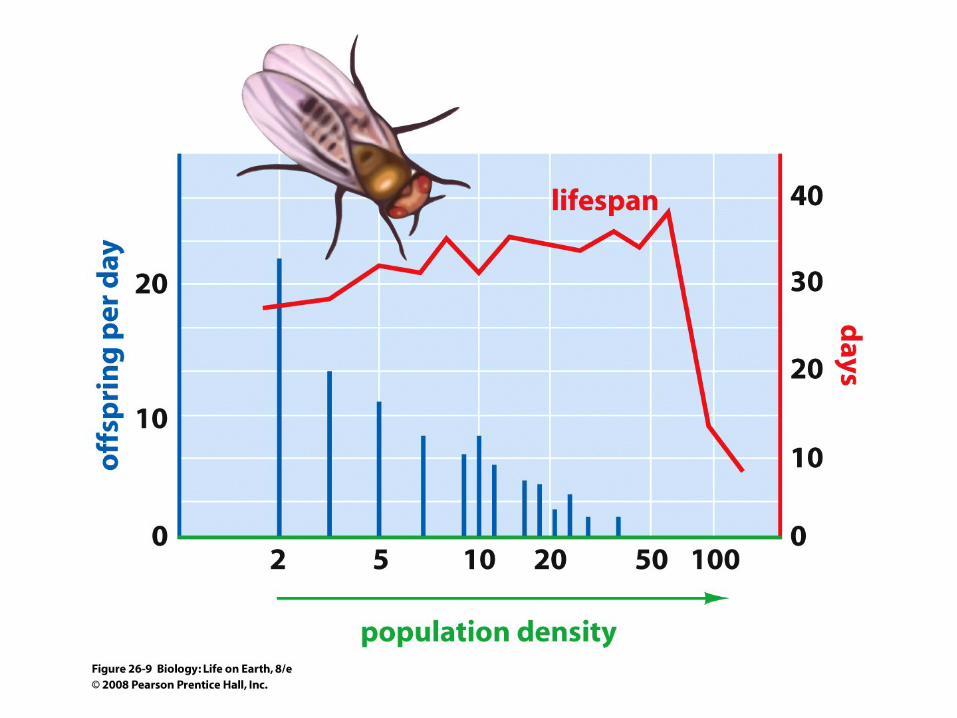
Density-Dependent Factors
• Density-dependent factors can cause birth rates to drop and/or death rates to increase – Population growth slows resulting in an S-
shaped growth curve (or S-curve)

Density-Dependent Factors
• At carrying capacity, each individual's share of resources is just enough to allow it to replace itself in the next generation
• At carrying capacity birth rate (b) = death rate (d)

Density-Dependent Factors
• Carrying capacity is determined by the continuous availability of resources
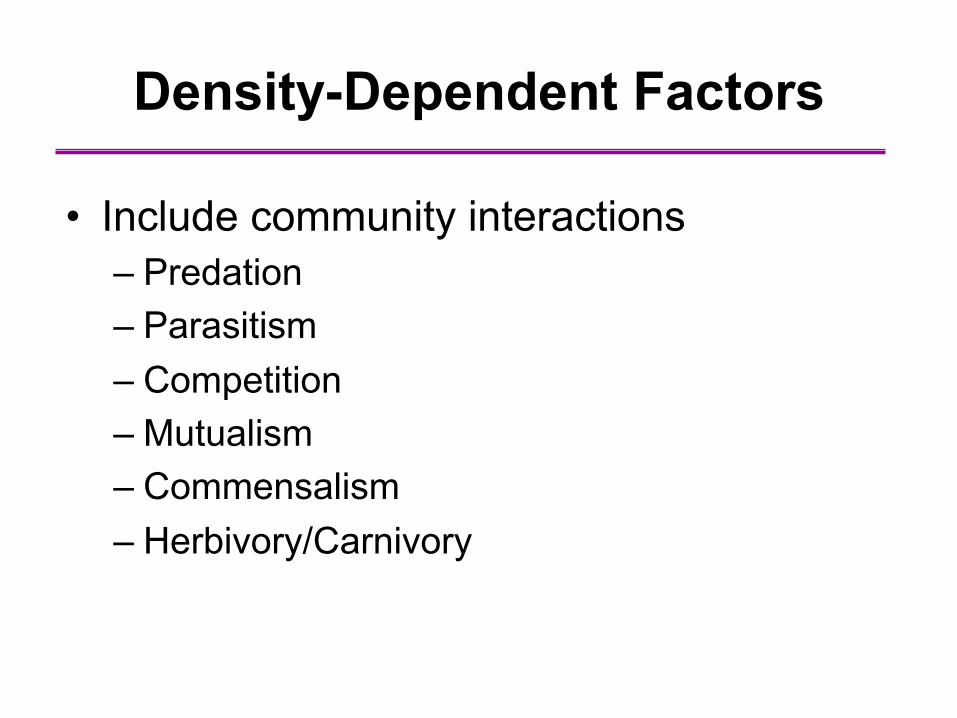
Density-Dependent Factors
• Include community interactions – Predation – Parasitism – Competition – Mutualism – Commensalism – Herbivory/Carnivory
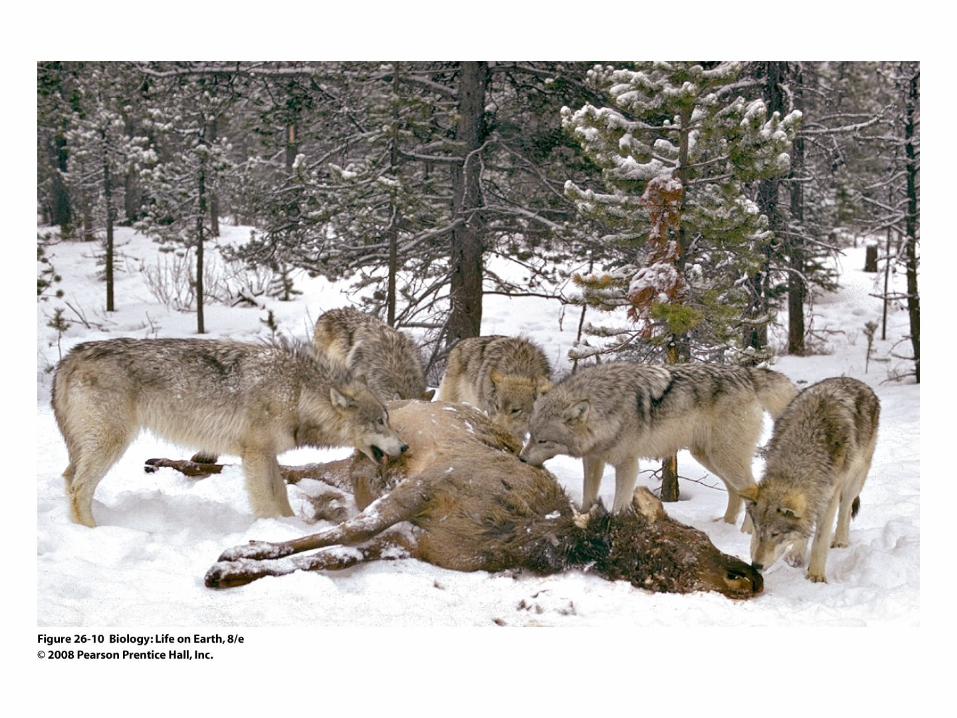
Predation
• Predation involves a predator killing a prey organism in order to eat it – Example: a pack of grey wolves hunting an
elk
Predation
• Predators exert density-dependent controls on a population – Increased prey availability can increase birth
rates and/or decrease death rates of predators
• Prey population losses will increase

Parasitism
• Parasitism involves a parasite living on or in a host organism, feeding on it but not generally killing it – Examples: bacterium causing Lyme disease,
some fungi, intestinal worms, ticks, and some protists

Parasitism
• While parasites seldom directly kill their hosts, they may weaken them enough that death due to other causes is more likely
• Parasites spread more readily in large populations

Competition for Resources
• Competition – Describes the interaction among individuals
who attempt to utilize a resource that is limited relative to the demand for it

Competition for Resources
• Competition intensifies as populations grow and near carrying capacity
• For two organisms to compete, they must share the same resource(s)
Competition for Resources
• Competition may be divided into two groups based on the species identity of the competitors – Interspecific competition is between
individuals of different species – Intraspecific competition is between
individuals of the same species

Competition for Resources
• Intense local competition may drive organisms to emigrate, though mortality may be intense – Example: swarming in locusts


Section 26.3 Outline
• 26.3 How Are Populations Distributed in Space and Time? – Populations Exhibit Different Spatial
Distributions – Survivorship in Populations Follows Three
Basic Patterns
Spatial Distributions
• The spatial pattern in which individuals are dispersed within a given area is that population’s distribution, which may vary with time
Spatial Distributions
• There are three major types of spatial distributions – Clumped – Uniform – Random


Spatial Distributions
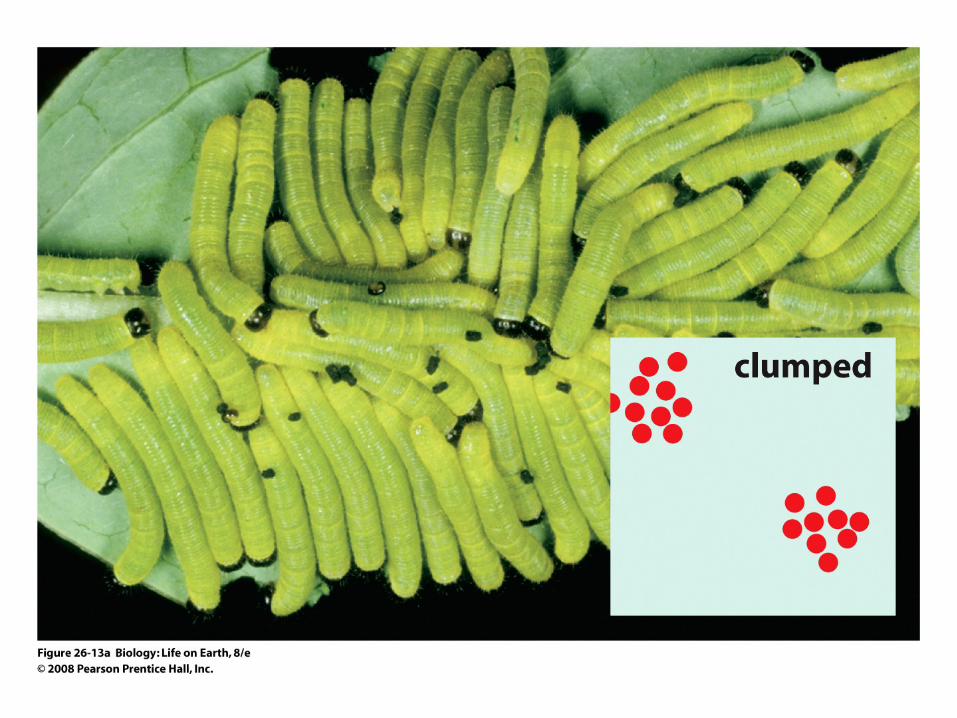
• Clumped distribution – includes family and social groups
• Examples: elephant herds, wolf packs, prides of lions, flocks of birds, and schools of fish
• Advantages – Provides many eyes that can search for localized
food sources – Confuses predators with sheer numbers – Cooperation for hunting more effectively

Spatial Distributions
• Uniform distribution – constant distance maintained between individuals; common among territorial animals defending scarce resources or defending breeding territories
• Examples: iguanas, shorebirds, tawny owls • Advantage: a uniform distribution helps ensure
adequate resources for each individual
Spacial Distributions
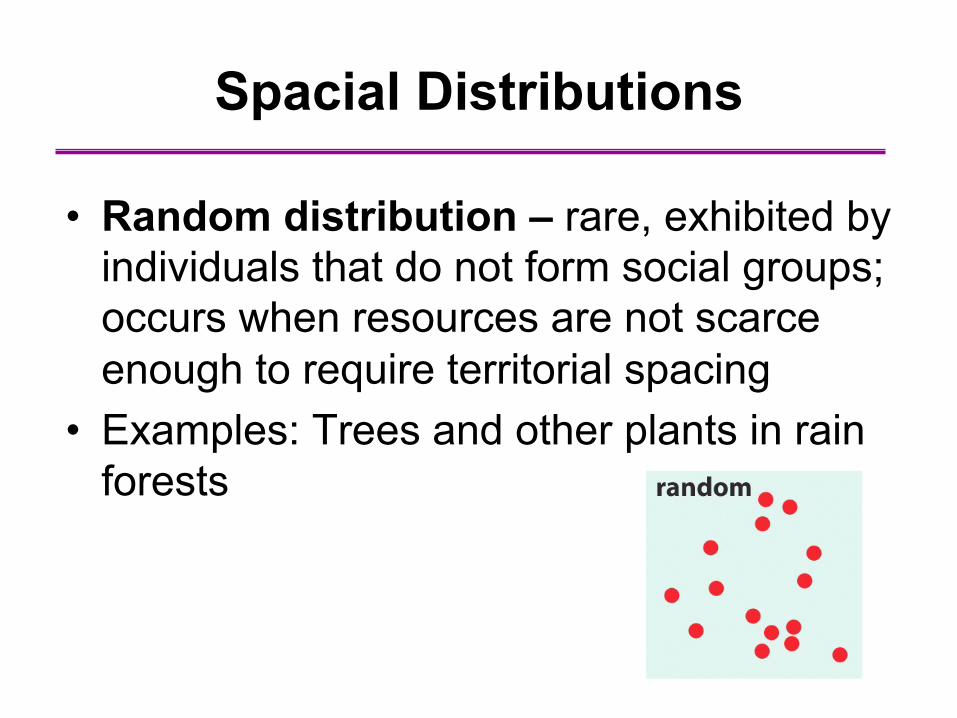
• Random distribution – rare, exhibited by individuals that do not form social groups; occurs when resources are not scarce enough to require territorial spacing
• Examples: Trees and other plants in rain forests
Survivorship in Populations
• Survivorship describes the pattern of survival in a population
• Life tables track groups of organisms born at the same time throughout their life span, recording how many continue to survive in each succeeding year

Survivorship in Populations
• A survivorship curve for a population can be produced by graphing life table survivorship data – Y-axis: the log of the number of individuals
surviving to a particular age – X-axis: age

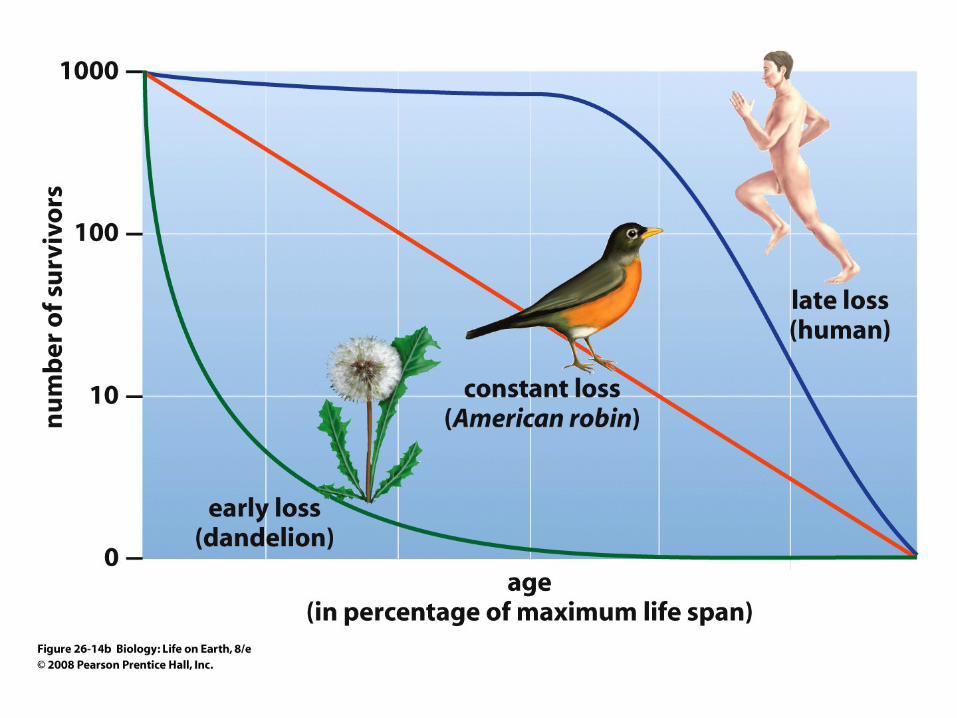
Survivorship in Populations
• Three types of survivorship curves can be distinguished – Late loss (Type I) – Constant loss (Type II) – Early loss (Type III)

Survivorship in Populations
• "Late loss" curves: seen in many animals with few offspring that receive substantial parental care; are convex in shape, with low mortality until individuals reach old age – Examples: humans and many large mammals

Survivorship in Populations
• "Constant loss" curves: an approximate straight line, indicates an equal chance of dying at any age – Example: some bird species

Survivorship in Populations
• "Early loss" curves: high early mortality as most offspring fail to become established; are concave in shape – Typical of most plants and many animals that
do not receive parental care – Examples: most invertebrates and fish

Section 26.4 Outline
• 26.4 How Is the Human Population Changing? – Demographers Track Changes in Human
Populations – The Human Population Continues to Grow
Rapidly – Population Growth Is Unevenly Distributed – The Current Age Structure of a Population
Predicts Its Future Growth

Demography
• Demography is the branch of science that studies the changing human population
• Demographers track population changes in different countries and regions
• Demographic data are used to formulate policies in public health, housing, education, employment, immigration, and environmental protection

Rapid Human Population Growth
• In the last few centuries, the human population has grown at nearly an exponential rate – Follows a J-shaped growth curve


Rapid Human Population Growth
• Over the last decade, the rate of human population growth seems to be stabilizing – 75-80 million people added per year
• Are we entering the final bend of the S-shaped growth curve?

Technological Advances
• Most species must "make due" with the resources in an area
• Humans have manipulated the environment to increase the Earth’s carrying capacity

Population Age Structure
• Age structure – Refers to the distribution of human
populations according to age groups

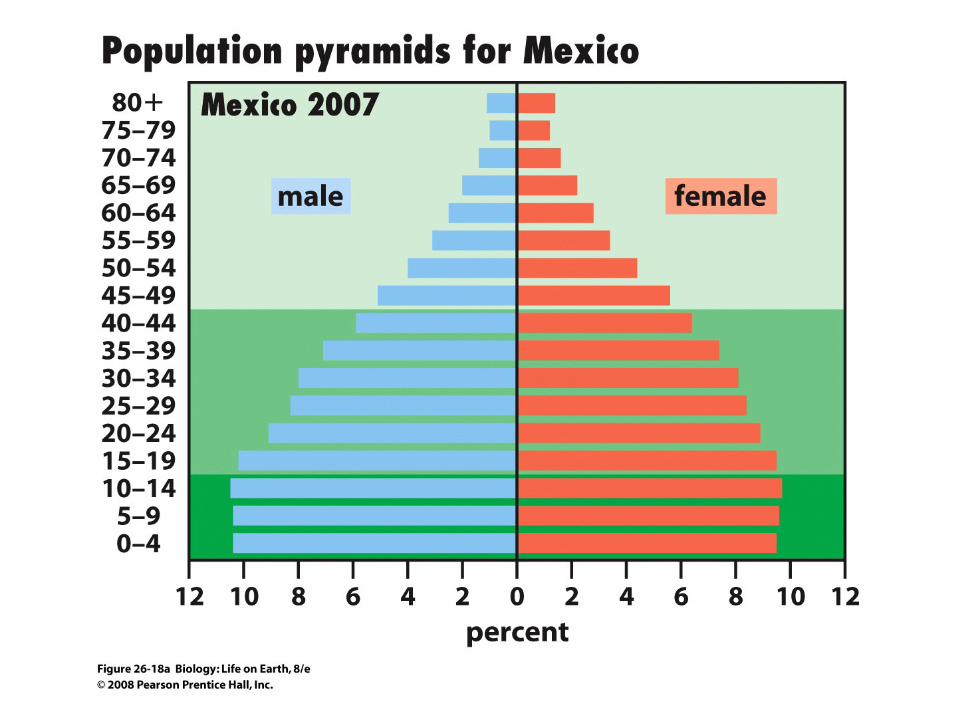
Population Age Structure
• Age structure can be shown graphically – Age is shown on the vertical axis – The number of individuals in each age group
is shown on the horizontal axis, with males and females placed on opposite sides

Population Age Structure
• All age-structure diagrams peak at the maximum life span, but the shape below the peak reveals if the population is expanding, stable, or shrinking

Population Age Structure
• Population is expanding – Reproductive-age adults have more children
than they need to replace themselves – Pyramid-shaped – Example: Mexico

Population Age Structure
• Population is stable – Reproductive-age adults have just the
children they need to replace themselves – Relatively straight sides – Example: Sweden

Population Age Structure
• Population is shrinking – Reproductive-age adults have fewer children
than they need to replace themselves – Narrow base – Example: Italy


Population Age Structure
• Average-age structure diagrams have been made for developed and developing countries with predictions for 2025 and 2050…
