techniques for estimating specific yield and specific retention from
TRANSCRIPT
TECHNIQUES FOR ESTIMATING SPECIFIC YIELD AND SPECIFIC RETENTION FROM GRAIN-SIZE DATA AND GEOPHYSICAL LOGS FROM CLASTIC BEDROCK AQUIFERS
by S.G. Robson
U.S. GEOLOGICAL SURVEY
Water-Resources Investigations Report 93-4198
Prepared in cooperation with the
COLORADO DEPARTMENT OF NATURAL RESOURCES,
DIVISION OF WATER RESOURCES,
OFFICE OF THE STATE ENGINEER and the
CASTLE PINES METROPOLITAN DISTRICT
Denver, Colorado 1993
U.S. DEPARTMENT OF THE INTERIOR
BRUCE BABBITT, Secretary
U.S. GEOLOGICAL SURVEY
Robert M. Hirsch, Acting Director
The use of trade, product, industry, or firm names is for descriptive purposes only and does not imply endorsement by the U.S. Government.
For additional information write to: Copies of this report can be purchased from:
District Chief U.S. Geological Survey U.S. Geological Survey Earth Science Information Center Box 25046, MS 415 Open-File Reports Section Denver Federal Center Box 25286, MS 517 Denver, CO 80225 Denver Federal Center
Denver, CO 80225
CONTENTS
Abstract ................................................................................................................................................................................ 1Introduction .......................................................................................................................................................................... 1
Purpose and scope ...................................................................................................................................................... 2Background ................................................................................................................................................................ 2
Specific-yield and specific-retention estimates from grain-size data ................................................................................... 4Porosity estimates from geophysical logs ............................................................................................................................ 10
Quality-control errors ................................................................................................................................................. 10Stochastic errors ......................................................................................................................................................... 11Mean grain-density errors .......................................................................................................................................... 11Rugosity errors ........................................................................................................................................................... 11Porosity determination ............................................................................................................................................... 12
Specific-yield estimates from geophysical logs ................................................................................................................... 13Nuclear magnetism log .............................................................................................................................................. 13Effective-porosity log................................................................................................................................................. 14Apparent grain-density log ......................................................................................................................................... 15
Summary .............................................................................................................................................................................. 18References cited ................................................................................................................................................................... 18
FIGURES
1. Map showing location of test site............................................................................................................................. 32-8. Graphs showing:
2. Relations among specific yield, specific retention, porosity, and grain size.................................................. 43. Grain-size distribution for sample 57............................................................................................................. 54. Linear regression relation of specific retention on grain-size characteristics................................................ 75. Relation of porosity from core samples and density porosity logs for holes Cl and Cl A............................ 126. Linear regression relation of specific yield on effective porosity.................................................................. 157. Linear regression relation of specific yield divided by porosity on apparent grain density........................... 168. Calculated specific-yield log and related caliper, gamma, resistivity, and porosity logs for a
200-foot interval in well USGS...................................................................................................................... 17
TABLES
1. Regression equations and statistics for grain-size and specific-retention characteristics......................................... 62. Mean specific retention measured by core analyses and calculated from the grain-size regression model
for a regression and a verification data set................................................................................................................ 93. Mean specific yield from laboratory analyses of core, effective-porosity regression,
and apparent grain-density regression....................................................................................................................... 15
CONTENTS
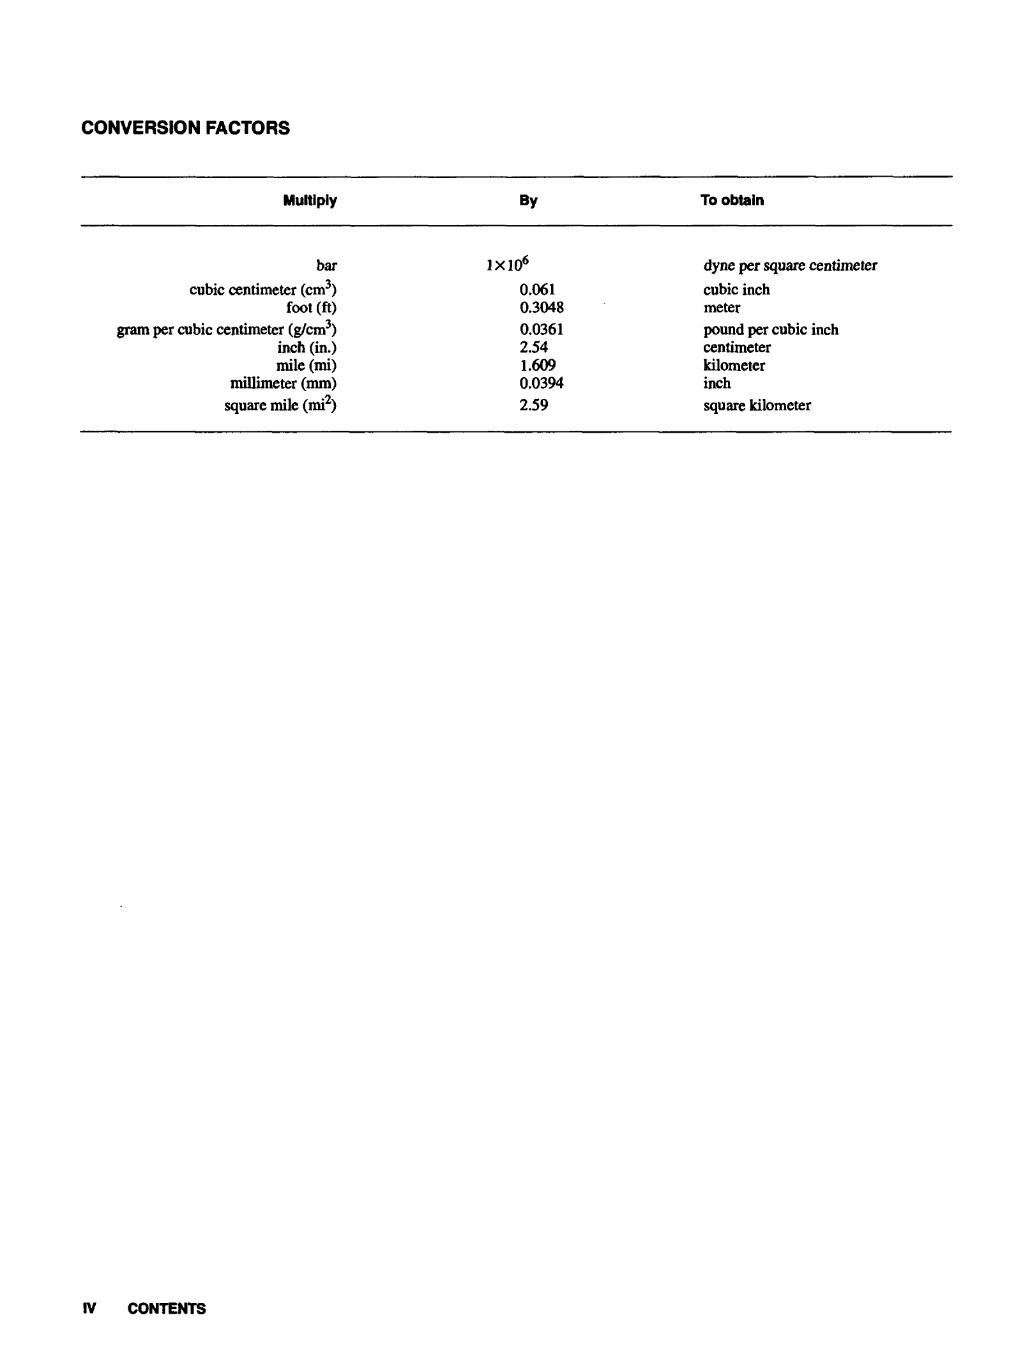
CONVERSION FACTORS
Multiply By To obtain
barcubic centimeter (cm3)
foot (ft)gram per cubic centimeter (g/cm3)
inch (in.)mile (mi)
millimeter (mm)square mile (mi2)
1X1060.0610.30480.03612.541.6090.03942.59
dyne per square centimetercubic inchmeterpound per cubic inchcentimeterkilometerinchsquare kilometer
IV CONTENTS
Techniques for Estimating Specific Yield and Specific Retention from Grain-Size Data and Geophysical Logs from Clastic Bedrock Aquifers
ByS.G. Robson
Abstract
Specific yield and specific retention are aquifer characteristics that are important in deter mining the volume of water in storage in an aqui fer. These characteristics can be determined by laboratory analyses of undisturbed samples of aquifer material. However, quicker, less costly alternatives to these laboratory analyses can be developed. This report presents techniques for estimating specific yield and specific retention based on grain-size analyses and on interpretation of borehole geophysical logs.
Least-squares linear regression analysis of specific yield and specific retention on grain-size characteristics produced five regression equations that can be used to estimate specific retention from grain-size information. Specific yield can be cal culated from specific retention by use of porosity data from geophysical logs.
Evaluation of various porosity logs indi cates that the density porosity log is well suited to measuring porosity in aquifer materials. Effects of errors in density porosity logs can be minimized by calculation of mean porosity for borehole intervals rather than relying on porosity values at specific depths.
Effective-porosity logs and apparent grain- density logs are produced by computer-assisted well-log evaluation programs used by commercial geophysical logging companies. Regression anal ysis of specific-yield data from core analyses on effective porosity defined an equation useful for estimating specific yield from effective porosity. Regression analysis of specific yield divided by porosity on apparent grain density produced another equation for estimating specific yield. Both log-interpretation techniques produce mean specific-yield estimates that are comparable to the mean values obtained by laboratory analyses of core samples.
INTRODUCTION
Increasing demands for potable water have caused increased exploration and evaluation of bedrock aquifers as possible sources of water supply. The vol ume of water that can be potentially recovered from a deep aquifer can be difficult to determine; yet, this vol ume is an important factor to be considered in planning and in development of an aquifer. In some areas (Colorado, for example), the rate of withdrawal from a bedrock well is regulated on the basis of the volume of recoverable water in storage in the aquifer under the well owner's land. Such statutes were enacted to pre vent overutilization of a finite ground-water resource and can limit pumping in areas where aquifers have smaller volumes of recoverable water in storage.
Specific yield is the aquifer characteristic of principal importance in calculating the volume of recoverable water in storage in unconfined and con fined aquifers. In an unconfined aquifer, the water table is within the porous material of the aquifer. Water is released from storage as the water table declines, and water drains by gravity from the pore spaces. Specific yield is a measure of mis volume of water released from storage as the water table declines. In a confined aquifer, the water level is above an impermeable con fining layer, and a water-level decline initially releases water from storage by the elastic change in volume of the aquifer (as measured by storage coefficient). How ever, once the water level declines below the base of the confining layer, the aquifer becomes unconfined and water is again released by gravity drainage (as measured by specific yield). Specific yield typically is about 1,000 times larger than storage coefficient for most aquifers so the volume of water released from elastic storage usually is negligibly small in compari son to the volume released from gravity drainage.
The Castle Pines Metropolitan District provides water from bedrock aquifers of the Denver basin to res idential communities and golf courses in an area about 20 mi south of Denver, Colo. In October 1987, the Dis trict completed a core drilling project that recovered about 3,100 ft of drill core from the bedrock formations at Castle Pines. The U.S. Geological Survey and the Colorado State University working in cooperation with
Abstract
the Colorado Department of Natural Resources, Divi sion of Water Resources, Office of the State Engineer, and the Castle Pines Metropolitan District then began a study to better define the hydrologic characteristics of the bedrock aquifers in the area. The purpose of this work was to obtain detailed geologic and hydrologic data pertaining to the bedrock aquifers and to develop and evaluate new techniques for estimating aquifer characteristics by use of core analyses, aquifer testing, and geophysical logging.
Purpose and Scope
This report describes techniques for estimating the specific yield and specific retention of an aquifer from grain-size analyses of aquifer samples and from borehole geophysical logs. The techniques described are based on empirical correlations between indepen dent and dependent variables that are analyzed by least-squares linear regression. Regression analyses of specific retention on grain-size characteristics, and regression of specific yield or specific yield divided by porosity on geophysical-log response each produced statistically significant relations. The validity of some of the techniques is demonstrated, and a specific-yield log calculated from other geophysical logs is described.
Data used in this report are contained in Robson and Banta (1993); sample handling and analyses proce dures are described in McWhorter and Garcia (1990), Raforth and Jehn (1990), and Robson and Banta (1993). A previous report pertaining to this test site (Robson and Banta, 1990) describes techniques for estimating aquifer specific storage on the basis of barometric efficiency, aquifer testing, or aquifer- compression measurements.
Background
Data for work described in this report were obtained at a test site located about 20 mi south of Den ver (fig. 1) at an altitude of 6,610 ft on the hilly western margin of the Denver basin. In July 1985, an irrigation well (well A3) was completed in the Arapahoe aquifer at a total depth of 2,398 ft. In February 1987, Jehn Water Consultants undertook drilling of a core hole (hole Cl) at a site 58 ft southeast of well A3 (fig. 1). Core was recovered to a depth of 1,957 ft, at which point the core barrel was lost, forcing abandonment of the hole after the upper 1,955 ft of hole was logged (Raforth and Jehn, 1990). A second core hole (hole C1A) was drilled to 1,895 ft at a site 68 ft south- southeast of well A3 (fig. 1). Coring continued from
1,895 to 3,110 ft and was followed by geophysical logging. Both core holes were subsequently filled by injection of cement grout and abandoned. In October 1987, well USGS was drilled for the U.S. Geological Survey to a depth of 2,400 ft at a site 50 ft east of well A3 (fig. 1). After extensive geophysical logging of well USGS, 2,400 ft of steel casing was grouted into the hole and gun perforated through the Arapahoe aqui fer to form an observation well. Well USGS was capped at the completion of the study.
The test site is underlain by the four principal bedrock aquifers of the Denver basin aquifer system (Robson, 1987). The Dawson aquifer is the shallowest of these aquifers and is underlain by the Denver aqui fer, the Arapahoe aquifer, and the Laramie-Fox Hills aquifer. The three uppermost aquifers were considered in this work. The three aquifers consist of poorly to moderately consolidated, interlayered conglomerate, sandstone, siltstone, and mudstone. Sandstone is the most prevalent water-yielding material and ranges from very fine- to coarse-grained, poorly to well-sorted arkosic and quartzose sandstone. Mudstone units form confining layers within and between the principal aqui fers. Mudstone generally consists of poorly to moder ately sorted, very fine sand, silt, and clay. No carbonate rocks are present in these Denver basin aquifers.
Specific yield is defined (Lohman and others, 1972) as the ratio of (1) the volume of water that a sat urated rock will yield by gravity drainage to (2) the vol ume of the rock. This definition implies that gravity drainage has reached equilibrium. In drainage experi ments, equilibrium is difficult to achieve because of the incomplete drainage of heterogeneous aquifer materi als and the slow drainage of the unsaturated zone, par ticularly in fine-grained materials. As a result, specific yield calculated from field-drainage experiments of limited duration (such as aquifer tests) usually is smaller than the true specific yield of the aquifer mate rial. Specific yields determined through use of centri fuge or porous-plate laboratory techniques have been shown (Neuman, 1987) to be less affected by slow drainage and, thus, are better indicators of the equilib rium specific yield of aquifer materials. Porosity, spe cific yield, and specific retention are related and commonly are expressed in dimensionless units:
<)> = SY + SR,
where<)> = the porosity,SY = the specific yield, andSR = the specific retention.
(1)
Techniques for Estimating Specific Yield and Specific Retention from Grain-Size Dsta and Geophysical Logs from Clastic Bedrock Aquifers

105° 104°52'30"
39°3T30'
39°30'
WELL A3 WELL USGS 50 FEET
R. 68 W. R. 67 W.
5 MILES_J___I
5 KILOMETERS
Figure 1. Location of test site.
INTRODUCTION 3
SPECIFIC-YIELD AND SPECIFIC- RETENTION ESTIMATES FROM GRAIN-SIZE DATA
Although specific yield and specific retention can be determined by laboratory analyses of undis turbed samples of aquifer material, this technique is costly and slow because of the difficulty of recovering undisturbed core samples and the complexity of laboratory techniques used to analyze the samples. Estimating specific yield and specific retention by use of grain-size data has the potential to greatly decrease the cost and time involved in determining specific yield and specific retention. The aquifer samples used in grain-size analyses can be disturbed samples, thus eliminating the need for core drilling. Disturbed samples can be collected by wireline sidewall coring or from drill cuttings that have not been significantly contaminated by drilling mud or other cuttings. Also, grain-size analyses are relatively simple determina tions and are less costly and time consuming than laboratory determinations of specific yield and specific retention.
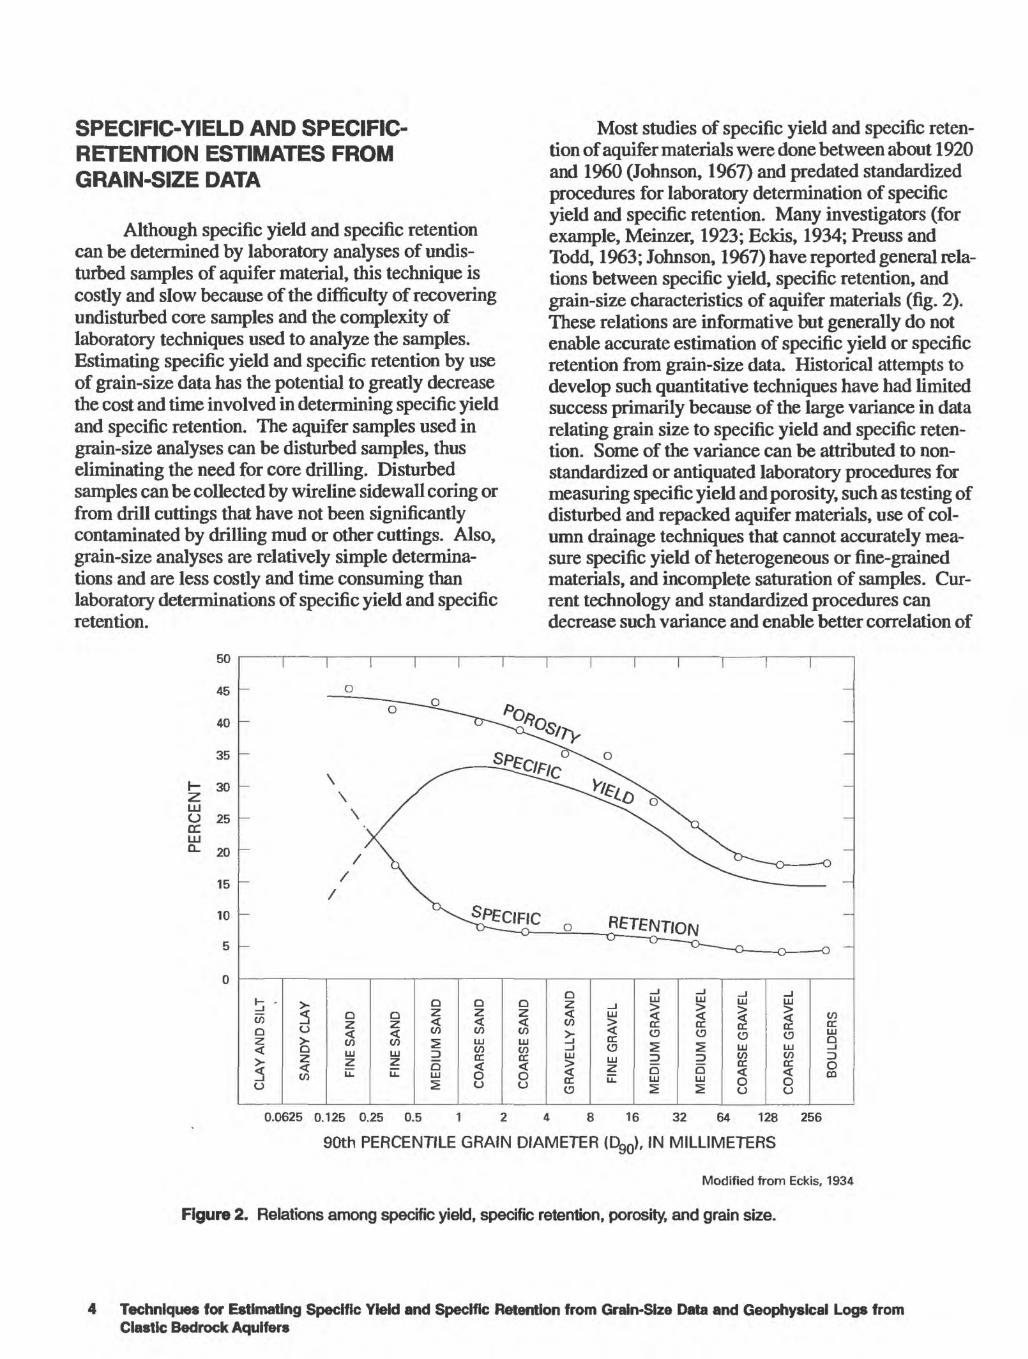
Most studies of specific yield and specific reten tion of aquifer materials were done between about 1920 and 1960 (Johnson, 1967) and predated standardized procedures for laboratory determination of specific yield and specific retention. Many investigators (for example, Meinzer, 1923; Eckis, 1934; Preuss and Todd, 1963; Johnson, 1967) have reported general rela tions between specific yield, specific retention, and grain-size characteristics of aquifer materials (fig. 2). These relations are informative but generally do not enable accurate estimation of specific yield or specific retention from grain-size data. Historical attempts to develop such quantitative techniques have had limited success primarily because of the large variance in data relating grain size to specific yield and specific reten tion. Some of the variance can be attributed to non- standardized or antiquated laboratory procedures for measuring specific yield and porosity, such as testing of disturbed and repacked aquifer materials, use of col umn drainage techniques that cannot accurately mea sure specific yield of heterogeneous or fine-grained materials, and incomplete saturation of samples. Cur rent technology and standardized procedures can decrease such variance and enable better correlation of
50
45
40
35
I- 30
LUO 25
LLJ°- 20
15
10
5
0
in o
5CJ
cj
I
Q
<CO LU
LU COoc§CJ
Q
<CO LLJ CO CE <OCJ
Q
cn CDLLJ 2
Q2Q
COcc§CJ
COcc§CJ
COcnLU Q_i
OCO
0.0625 0.125 0.25 0.5 1 2 4 8 16 32 64 128 256
90th PERCENTILE GRAIN DIAMETER (D^0), IN MILLIMETERS
Figure 2.
Modified from Eckis, 1934
Relations among specific yield, specific retention, porosity, and grain size.
Techniques for Estimating Specific Yield and Specific Retention from Grain-Size Data and Geophysical Logs from Clastic Bedrock Aquifers
grain-size characteristics with specific yield or specific retention.
Data used in this study were obtained by labora tory analyses of undisturbed samples of consolidated- rock core from hole Cl or C1A. Core samples were selected from carefully stored intact segments of drill core (Raforth and Jehn, 1990), sealed in jeweler's wax, and transported to the laboratory where each sample was sawed into three 3/4 in.-thick disks for analyses. Core analyses consisted of porosity and specific- retention determinations on three specimens from each depth sampled and grain-size analyses on the samples that were subsequently disaggregated. Mean porosity and specific retention were calculated from the three specimens for each sample, and specific yield was cal culated by use of equation 1. Porosity was determined by use of a helium gas-expansion porosimeter and a mercury-immersion displacement porometer; specific retention was calculated from moisture-retention data at 13.5 bars in a porous-plate apparatus (American Society for Testing and Materials, 1977; McWhorter and Garcia, 1990). A pore pressure of 13.5 bars was chosen for the test because specific yields of clastic sediments are very close to equilibrium at this and
higher pressures. Grain-size data were obtained from mechanical sieve analyses.
Least-squares linear regression analysis of specific-yield and specific-retention data on various grain-size characteristics indicated that the best regres sion equations (those that had the largest coefficient of correlation and smallest standard error of estimate) all had specific retention as the dependent variable. These regression equations were used in preference to the less well-correlated regression equations that had specific yield as the dependent variable because specific yield can be calculated from specific retention by use of equation 1 and porosity data obtained from geophysical logs or laboratory analyses.
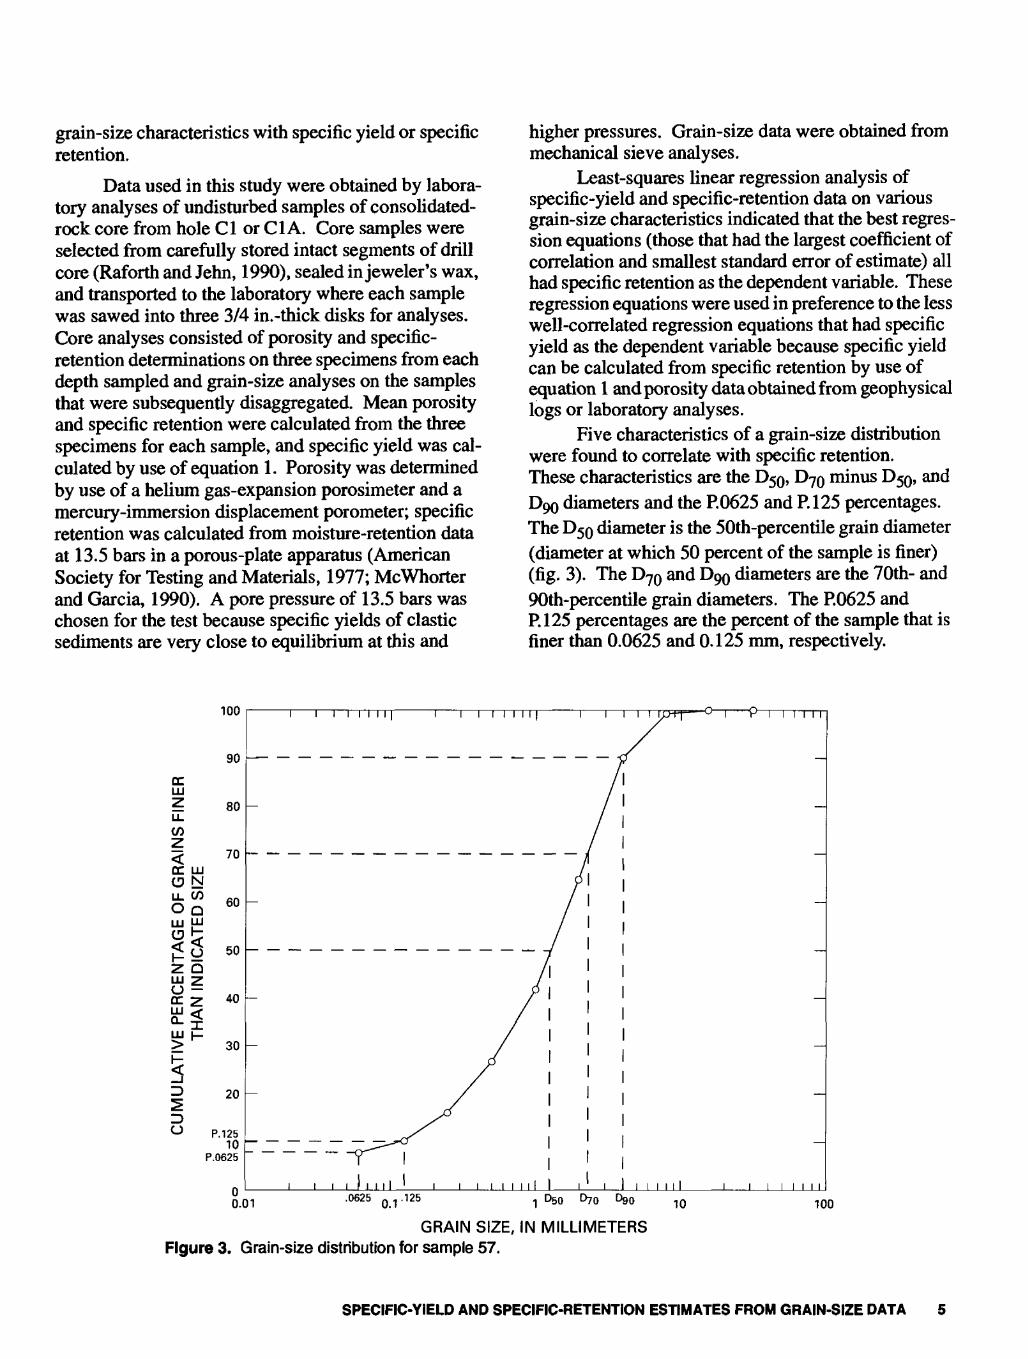
Five characteristics of a grain-size distribution were found to correlate with specific retention. These characteristics are the D$Q, D7Q minus D$Q, andDQO diameters and the P.0625 and P. 125 percentages. The DSQ diameter is the 50th-percentile grain diameter (diameter at which 50 percent of the sample is finer) (fig. 3). The D70 and D90 diameters are the 70th- and 90th-percentile grain diameters. The P.0625 and P. 125 percentages are the percent of the sample that is finer than 0.0625 and 0.125 mm, respectively.
0.01 - 0625 0.1 - 125 1 °50 °70 D90 10
GRAIN SIZE, IN MILLIMETERS Figure 3. Grain-size distribution for sample 57.
100
SPECIFIC-YIELD AND SPECIFIC-RETENTION ESTIMATES FROM GRAIN-SIZE DATA
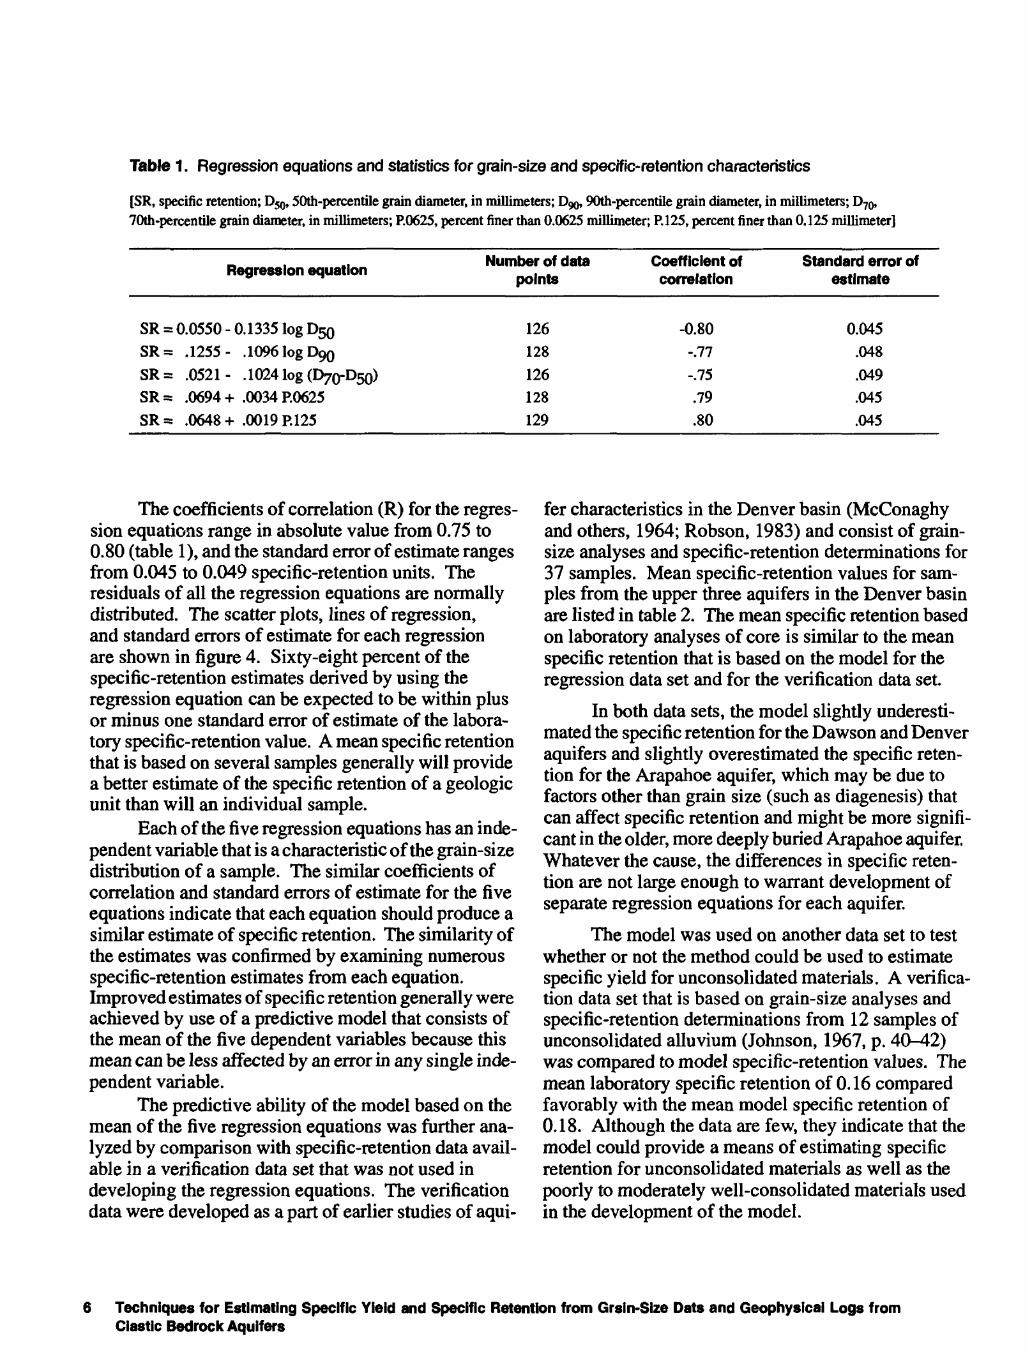
Table 1 . Regression equations and statistics for grain-size and specific-retention characteristics
[SR, specific retention; D50,50th-percentile grain diameter, in millimeters; 090,90th-percentile grain diameter, in millimeters; D70> 70th-percentile grain diameter, in millimeters; P.0625, percent finer than 0.0625 millimeter; P.125, percent finer than 0.125 millimeter]
Regression equation
SR = 0.0550 - 0.1335 log DSQ
SR= .1255- .1096 log 090
SR= .0521- .1024 log (1)70-050)
SR= .0694+ .0034 P.0625
SR= .0648+ .0019 P. 125
Number of data points
126
128
126
128
129
Coefficient of correlation
-0.80-.77
-.75
.79
.80
Standard error of estimate
0.045
.048
.049
.045
.045
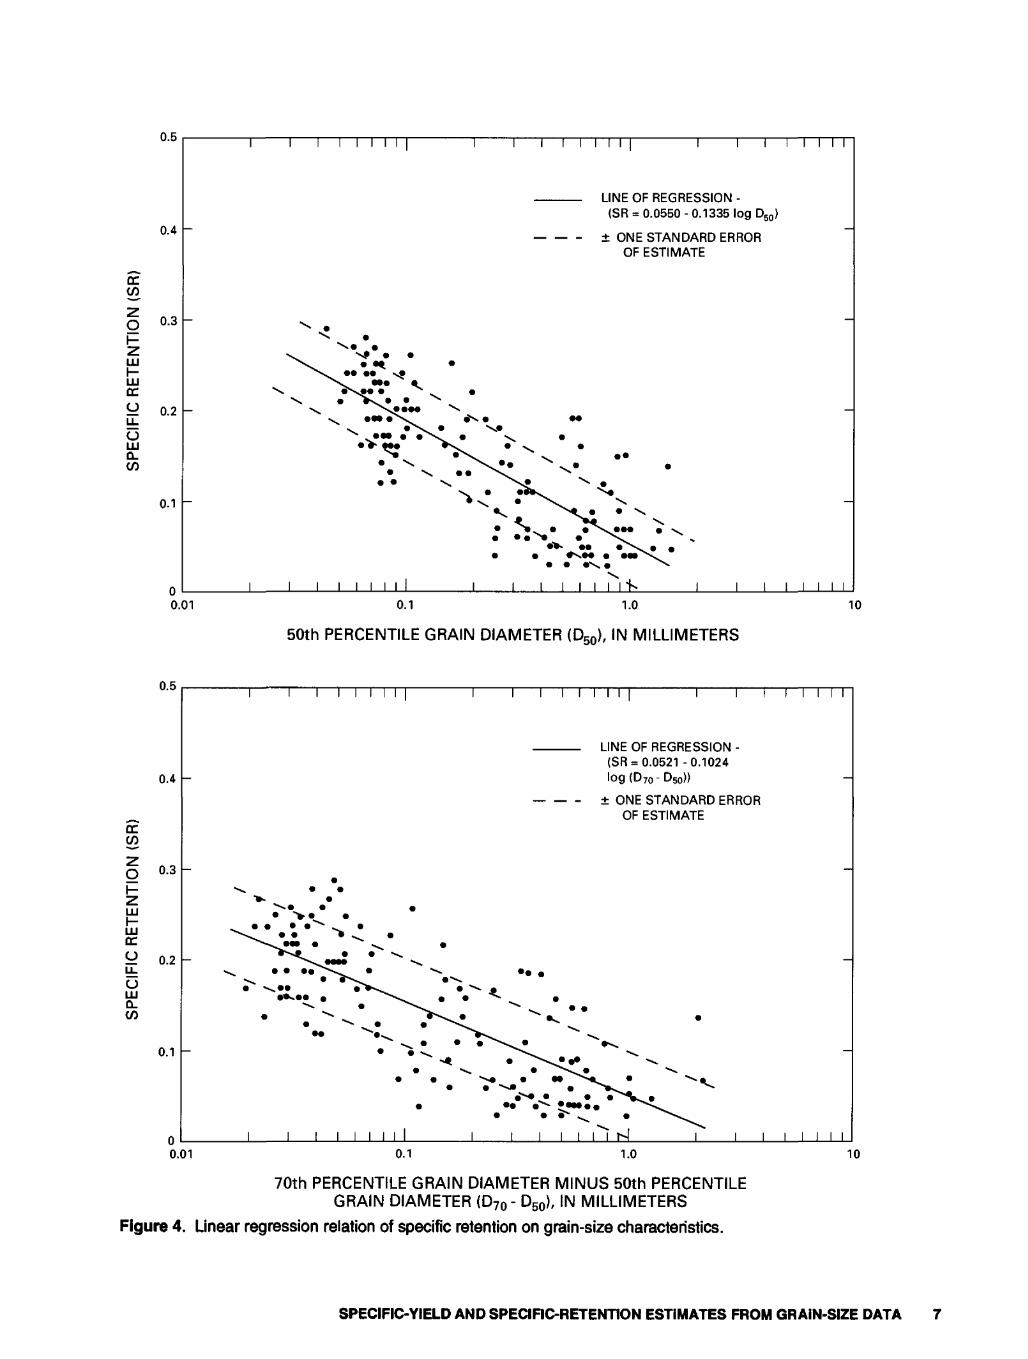
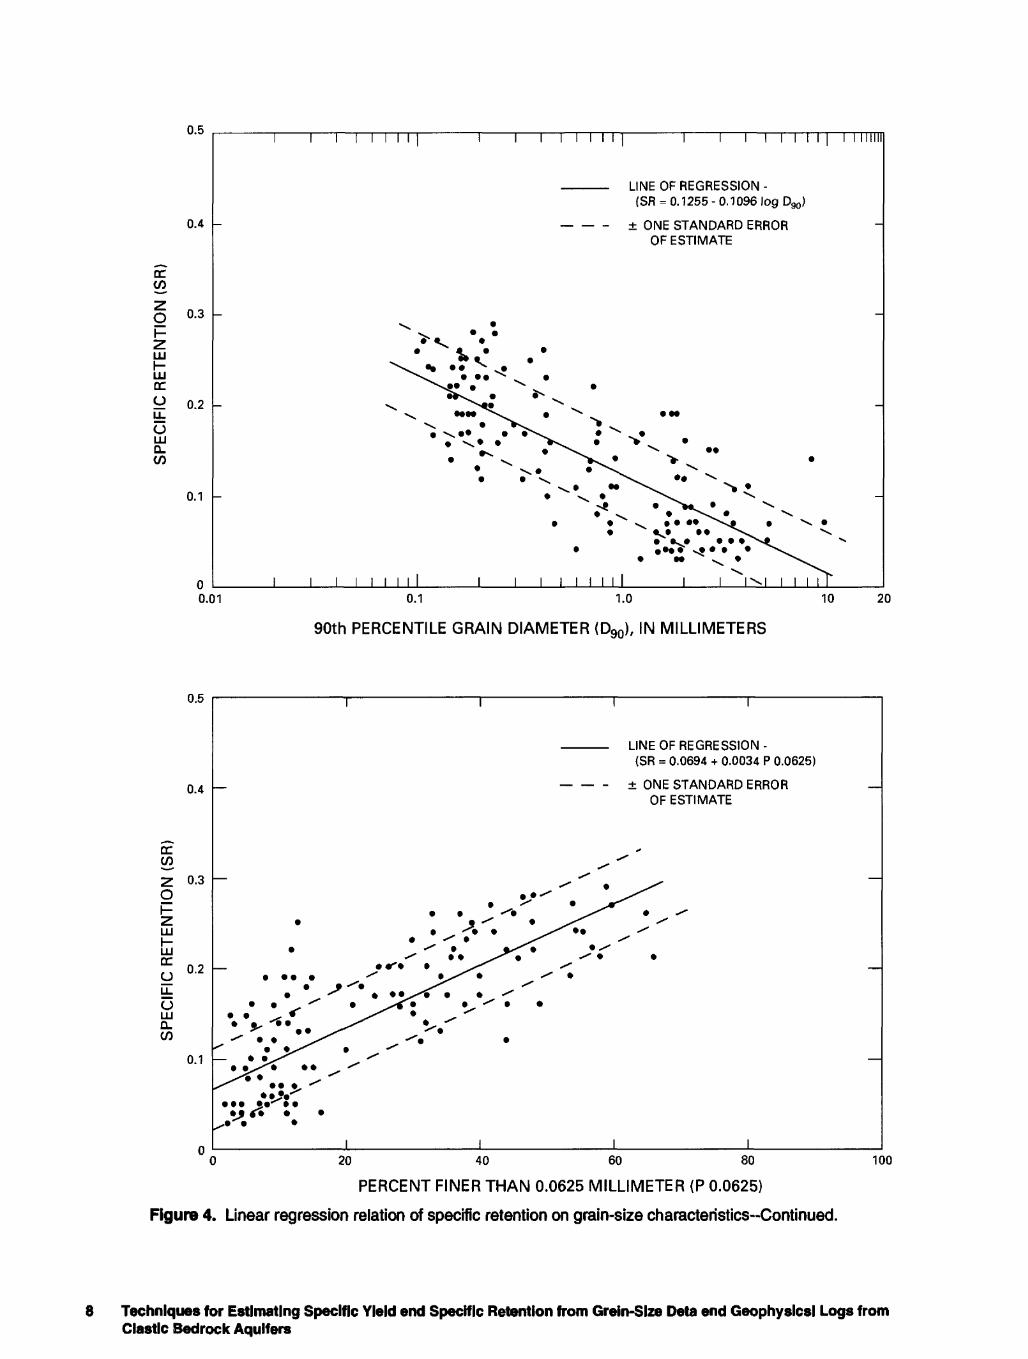
The coefficients of correlation (R) for the regres sion equations range in absolute value from 0.75 to 0.80 (table 1), and the standard error of estimate ranges from 0.045 to 0.049 specific-retention units. The residuals of all the regression equations are normally distributed. The scatter plots, lines of regression, and standard errors of estimate for each regression are shown in figure 4. Sixty-eight percent of the specific-retention estimates derived by using the regression equation can be expected to be within plus or minus one standard error of estimate of the labora tory specific-retention value. A mean specific retention that is based on several samples generally will provide a better estimate of the specific retention of a geologic unit than will an individual sample.
Each of the five regression equations has an inde pendent variable that is a characteristic of the grain-size distribution of a sample. The similar coefficients of correlation and standard errors of estimate for the five equations indicate that each equation should produce a similar estimate of specific retention. The similarity of the estimates was confirmed by examining numerous specific-retention estimates from each equation. Improved estimates of specific retention generally were achieved by use of a predictive model that consists of the mean of the five dependent variables because this mean can be less affected by an error in any single inde pendent variable.
The predictive ability of the model based on the mean of the five regression equations was further ana lyzed by comparison with specific-retention data avail able in a verification data set that was not used in developing the regression equations. The verification data were developed as a part of earlier studies of aqui
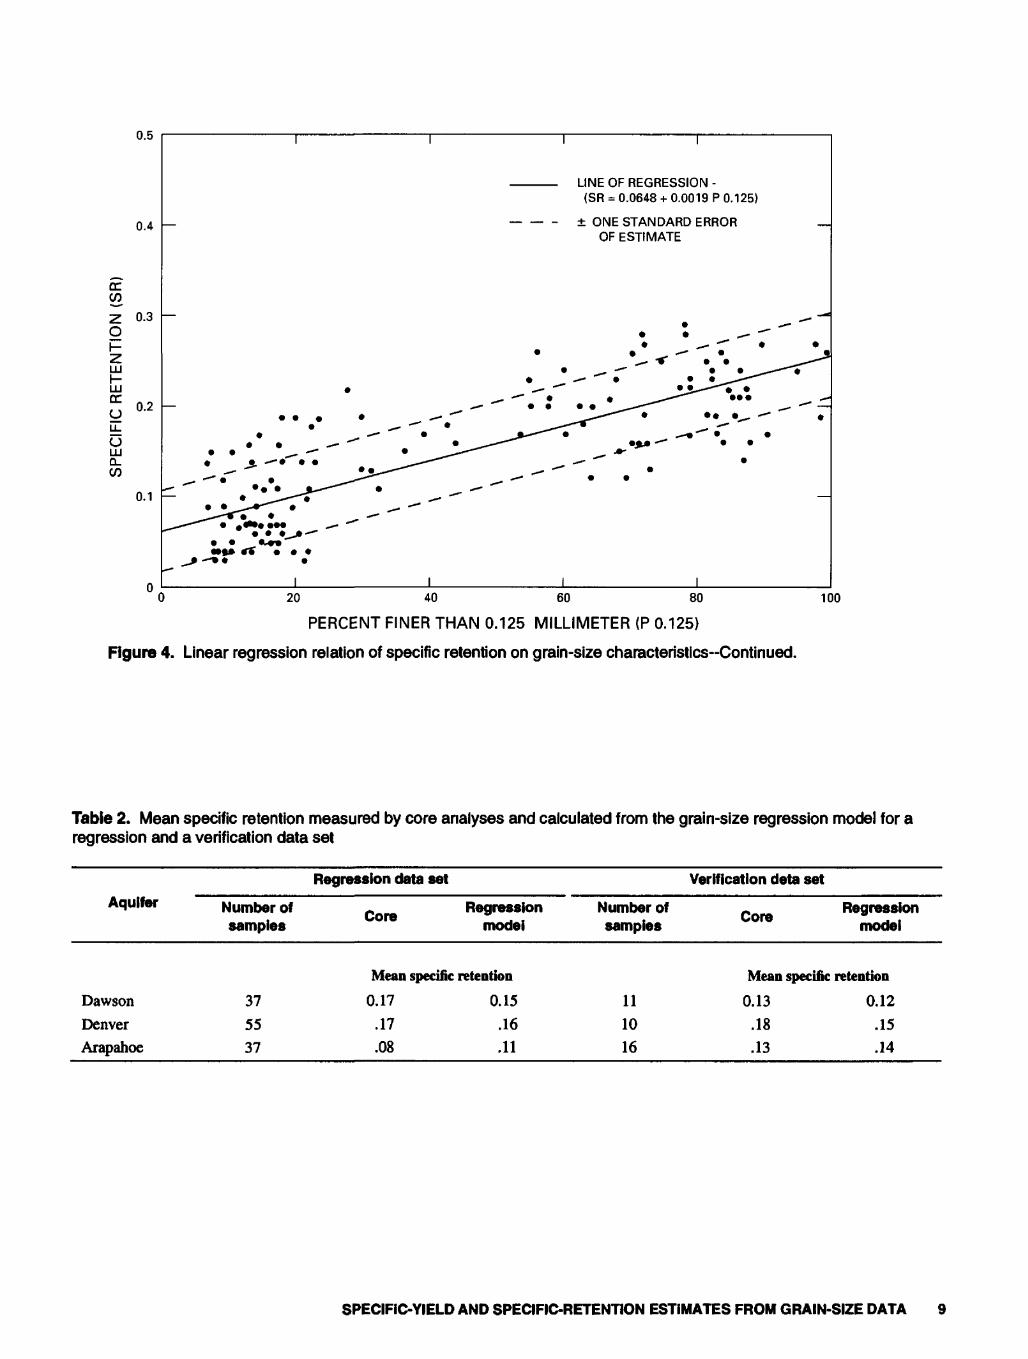
fer characteristics in the Denver basin (McConaghy and others, 1964; Robson, 1983) and consist of grain- size analyses and specific-retention determinations for 37 samples. Mean specific-retention values for sam ples from the upper three aquifers in the Denver basin are listed in table 2. The mean specific retention based on laboratory analyses of core is similar to the mean specific retention that is based on the model for the regression data set and for the verification data set.
In both data sets, the model slightly underesti mated the specific retention for the Dawson and Denver aquifers and slightly overestimated the specific reten tion for the Arapahoe aquifer, which may be due to factors other than grain size (such as diagenesis) that can affect specific retention and might be more signifi cant in the older, more deeply buried Arapahoe aquifer. Whatever the cause, the differences in specific reten tion are not large enough to warrant development of separate regression equations for each aquifer.
The model was used on another data set to test whether or not the method could be used to estimate specific yield for unconsolidated materials. A verifica tion data set that is based on grain-size analyses and specific-retention determinations from 12 samples of unconsolidated alluvium (Johnson, 1967, p. 40-42) was compared to model specific-retention values. The mean laboratory specific retention of 0.16 compared favorably with the mean model specific retention of 0.18. Although the data are few, they indicate that the model could provide a means of estimating specific retention for unconsolidated materials as well as the poorly to moderately well-consolidated materials used in the development of the model.
Techniques for Estimating Specific Yield and Specific Retention from Grsin-Size Dats and Geophysical Logs from Clastic Bedrock Aquifers
DC V)
0.5
0.4
0.3
0.2 LL.O LLJ Q.
0.1
00.01
LINE OF REGRESSION -(SR = 0.0550 - 0.1335 log D50 )
- ± ONE STANDARD ERROR OF ESTIMATE
0.1 1.0
50th PERCENTILE GRAIN DIAMETER (D50 ), IN MILLIMETERS
10
DC C/3
0.5
0.4
0.3
0.2 LL.O LLJ Q. C/3
0.1
0.01
LINE OF REGRESSION - (SR = 0.0521 -0.1024 log(D 7o-D5o))
- ± ONE STANDARD ERROR OF ESTIMATE
I I I I I I0.1 1.0
70th PERCENTILE GRAIN DIAMETER MINUS 50th PERCENTILE GRAIN DIAMETER (D70 - D50 ), IN MILLIMETERS
Figure 4. Linear regression relation of specific retention on grain-size characteristics.
10
SPECIFIC-YIELD AND SPECIFIC-RETENTION ESTIMATES FROM GRAIN-SIZE DATA 7
0.5
0.4
0.3
DC
U 0.2 LLO LUD-
0.1
niiinr i i | rn
00.01
LINE OF REGRESSION -(SR = 0.1255 - 0.1096 log D90 )
- ± ONE STANDARD ERROR OF ESTIMATE
0.1 1.0
90th PERCENTILE GRAIN DIAMETER (D90 ), IN MILLIMETERS
10 20
U
Q_in
0.5
0.4
0.3
0.2
0.1
LINE OF REGRESSION - (SR = 0.0694 + 0.0034 P 0.0625)
± ONE STANDARD ERROR OF ESTIMATE
I0 20 40 60 80
PERCENT FINER THAN 0.0625 MILLIMETER (P 0.0625)
Figure 4. Linear regression relation of specific retention on grain-size characteristics-Continued.
100
8 Techniques for Estimating Specific Yield end Specific Retention from Grein-Size Deta end Geophysics! Logs from Clastic Bedrock Aquifers
DC
DC OLL.
0 LU0.
0.5
0.4
0.3
0.2
0.1
LINE OF REGRESSION - (SR = 0.0648 + 0.0019 P 0.125)
± ONE STANDARD ERROR OF ESTIMATE
0 20 40 60 80
PERCENT FINER THAN 0.125 MILLIMETER (P 0.125)
Figure 4. Linear regression relation of specific retention on grain-size characteristics-Continued.
100
Table 2. Mean specific retention measured by core analyses and calculated from the grain-size regression model for a regression and a verification data set
AquiferRegression data set Verification deta set
Number of samples Core Regression
modelNumber of samples Core Regression
model
DawsonDenverArapahoe
375537
Mean specific retention
0.17 0.15.17 .16.08 .11
111016
Mean specific retention
0.13 0.12.18 .15.13 .14
SPECIFIC-YIELD AND SPECIFIC-RETENTION ESTIMATES FROM GRAIN-SIZE DATA 9
POROSITY ESTIMATES FROM GEOPHYSICAL LOGS
Porosity data derived from geophysical logs are of value in calculating specific yield from the specific- retention/grain-size regression model and also are an integral part of other techniques for estimating specific yield from geophysical logs. Because geophysical logs can be subject to error or application limitations, the effects of log errors on porosity and specific-yield estimates need to be investigated.
The porosity of a formation can be determined by use of geophysical logs, such as sonic logs, neutron logs, or density logs. Each of these logs can accurately estimate the porosity of a formation if equipment and conditions in the borehole closely approximate the assumptions used in developing the logs. Sonic logs are based on a number of assumptions that cannot be evaluated readily in the borehole without analyses of core samples. This limitation makes the sonic log the poorest indicator of porosity among the three logs (Keys, 1990). Neutron logs and density logs can pro duce comparable results. However, neutron logs are best suited to measuring porosity of dense materials of small porosity, and density logs are best suited to mea suring porosity of low density materials of large poros ity. The low density, large porosity clastic materials of most aquifers are appropriate for porosity evaluation by density logs. This conclusion is further supported by Patchett and Coalson (1979, p. 11) who reported that "multiple porosity logs do not necessarily improve the ability to obtain porosity from logs in sandstones," and by Johnson and Linke (1978) who concluded that, for sandstones in the MacKenzie Delta, the density log alone yielded more accurate porosity estimates than multi-porosity methods. Density logs were selected as the principal porosity log for the work described in this report because of the potential accuracy of the log in sandstone environments, the general ease of log inter pretation, and the greater availability of this log in the water-well industry. Additional information on log ging procedures and log interpretations is contained in Hearst and Nelson (1985) and Tittmann (1986).
A density log measures the bulk density of a for mation by use of Compton scattered gamma radiation. A radioactive source that emits medium-energy gamma radiation is held against the borehole wall by the log ging tool. Gamma radiation interacts with electrons in the atoms of the formation in a process called Compton scattering. In this process, the medium energy gamma radiation is absorbed by the electrons and lower energy gamma radiation is emitted. This lower energy radia tion is detected and counted by the logging tool as an indication of the electron density in the formation. The
known atomic and molecular structure of common water-filled geologic materials enables bulk density to be calculated from electron density.
A density porosity log is calculated from the bulk density log by use of the equation:
(2)
where<|) = the porosity, Pg = the grain density, Pb = the bulk density, and Pf = the fluid density.
In freshwater aquifers composed of clastic mate rials, grain density is assumed to equal the mean graindensity of most clastic sediments (2.65 g/cm3) and fluiddensity is assumed to be 1.0 g/cm3 .
Some errors in density porosity logs can be iden tified, and remedial steps can be taken to decrease the effect of the error on specific yield estimated from the log. Errors in density porosity logs primarily are caused by:
1. The quality control of the logging equipment and procedures.
2. The stochastic nature of the radioactive logging process.
3. The assumed mean grain density of 2.65 g/cm .
4. The irregularity (rugosity) of the borehole.
Quality-Control Errors
Quality control in geophysical logging has been reported by Patchett and Coalson (1979) to be some what variable. Density porosity logs were shown to range from grossly erroneous (logs indicating porosity less than zero) to a set of 93 logs from the Wattenberg gas field in Colorado, 48 of which indicated identical porosities in a calibration interval. Only 16 of the 93 logs required a bulk-density correction greater than± 0.02 g/cm3 to also indicate the correct porosity in the calibration interval. The log corrections had a mean of zero, a standard deviation of 0.018 g/cm , range of-0.08 to +0.03 g/cm3, and were approximately nor mally distributed.
For comparison, the bulk density was calculated for a 20-ft sandstone interval from 1,915 to 1,935 ft, using logs from wells A3, USGS, and holes Cl and Cl A. The four logs were run at different times by dif-
10 Techniques for Estimating Specific Yield and Specific Retention from Grain-Size Data and Geophysical Logs from Clastic Bedrock Aquifers

ferent logging companies. The mean bulk density of the interval was 2.23 g/cm3 in hole Cl and well USGS,2.22 g/cm3 in hole C1A, and 2.20 g/cm3 in well A3. The maximum correction needed to produce an identi cal bulk density among the four logs was +0.03 g/cm3 . In a formation that has a grain density of 2.65 g/cm3, a0.03-g/cm3 correction to bulk density produces a minor change in calculated porosity of 0.02 porosity units.
Although a small porosity error was associated with quality control in the four logs at the test site, a large potential error was identified by Patchett and Coalson (1979) in a much larger sampling of wells. If a log normalization procedure was implemented before the log was used to estimate porosity or specific yield, some quality-control errors could be eliminated. Most normalization procedures (Neinast and Knox, 1973) require identification of calibration beds in which the correct log response can be determined from core anal yses or by examination of many logs from nearby wells. This technique probably is not feasible in the Denver basin aquifer system (or other large aquifer sys tems) because of the few core data available, the size of the system (the Denver basin extends through6,700 mi2), and the discontinuous or lenticular nature of the lithologic units. In the absence of a rigorous nor malization procedure, a comparison of all density logs from nearby wells would at least ensure that the log to be used in porosity or specific-yield estimates is rea sonable and representative of conditions indicated in other logs.
Stochastic Errors
A density log, like any nuclear log, has a stochas tic component in the log response caused by the ran dom process of radioactive decay. Instantaneous readings from a radiation detector can vary widely. More meaningful readings can be obtained by averag ing the readings over time. In geophysical logging, the rate of movement of the logging tool up the borehole determines the duration of the averaging period at any given depth. A practical compromise is needed to achieve adequate averaging time, while still maintain ing a workable logging speed. The resulting density log is not an exact measure of the radiation (and hence bulk density) at each depth. This is indicated by a com parison of me density log and a 215-ft repeat section of the log, both run in hole Cl A. Differences between the response of the two logs at 1-ft depth intervals have amean of zero, a standard deviation of 0.03 g/cm3 , a range of -0.09 to +0.11 g/cm3, and a normal distribu
tion. These statistics indicate that repeated logging of an interval likely will produce identical mean values of bulk density for the interval, but that density values at specific depths can vary from log to log. Likewise, if a density porosity log is used to estimate porosity or spe cific yield, log values would be better used to calculate a mean value for a depth interval rather than to deter mine the porosity or specific yield at a specific depth.
Mean Grain-Density Errors
The grain density for a sandstone matrix com monly is set to 2.65 g/cm3 in density logging, and this value is used in equation 2 to calculate the porosity shown on the porosity log. The mean grain density for 139 core samples from holes Cl and C1A that have corresponding grain-size data (Robson and Banta,1993) also is 2.65 g/cm3 . However, the frequency distribution of the density data is bimodal because the coarser grained samples have a different mean and mode than do the finer grained samples. The mean grain density for the coarser grained (sandstone) sam ples is 2.63 g/cm3 ; the mean density for the finer grained (mudstone) samples is 2.68 g/cm3 . The0.05-g/cm3 difference in mean densities produces a minor difference in calculated porosity of 0.02 porosity units. The range in grain density measured in the139 core samples (2.59 to 2.79 g/cm3) produces a 0.08 difference in porosity. The large range again indi cates the need for porosity and specific yield to be calculated as a mean for a depth interval rather than a value for a specific depth.
Rugosity Errors
The density log is very sensitive to the rugosity of the borehole because any void between the logging tool and the borehole wall is registered on the log as a decrease in bulk density and as an increase in porosity. Density logging tools generally are pad mounted and decentralized to ensure close coupling between the tool and the borehole, and density logs are run in conjunc tion with a caliper that measures borehole diameter. The caliper data are used to make corrections to the density log to compensate for changes in borehole diameter. In some logging tools, dual detectors of dif ferent spacing and depths of investigation are used to more effectively compensate for borehole rugosity. Both means of compensation are adequate to correct for gradual changes in diameter of a circular borehole
POROSITY ESTIMATES FROM GEOPHYSICAL LOGS 11
but cannot always compensate for rugosity due to washouts, which can cause abrupt changes in diameter or an irregular shape in the borehole.
The poorly to moderately consolidated forma tions in the Denver basin are easily eroded by bento- nitic drilling fluids, and washouts can be common, particularly in mudstone or similar fine-grained units. Forty-six core samples correlated to intervals in well USGS where logs indicated washouts were present. About 83 percent of these samples were mud- stone. The mean specific yield of these mudstone sam ples was 0.03. Appropriate drilling techniques and control of drilling-fluid characteristics can be used to decrease the frequency of washouts. The erroneous log bulk density and porosity associated with washout intervals precludes use of these data in estimating spe cific yield. However, the specific yield of fine-grained units is small and can be assumed to equal zero. By use of this assumption, washouts in fine-grained materials generally will not adversely affect the mean specific yield calculated for a water-yielding interval.
Porosity Determination
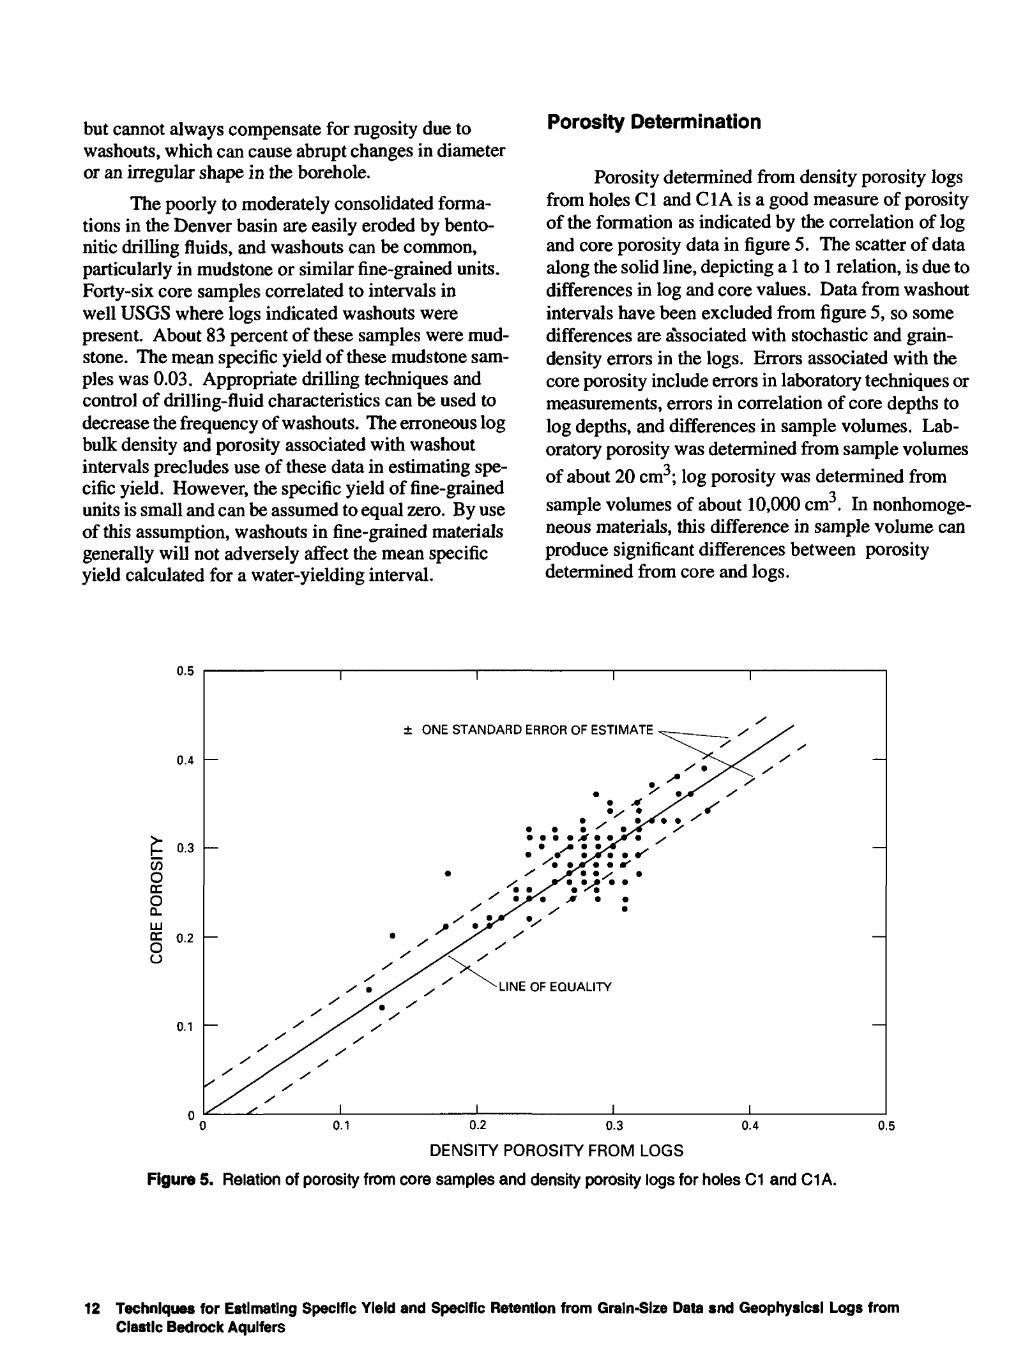
Porosity determined from density porosity logs from holes Cl and Cl A is a good measure of porosity of the formation as indicated by the correlation of log and core porosity data in figure 5. The scatter of data along the solid line, depicting a 1 to 1 relation, is due to differences in log and core values. Data from washout intervals have been excluded from figure 5, so some differences are associated with stochastic and grain- density errors in the logs. Errors associated with the core porosity include errors in laboratory techniques or measurements, errors in correlation of core depths to log depths, and differences in sample volumes. Lab oratory porosity was determined from sample volumesof about 20 cm3 ; log porosity was determined from
sample volumes of about 10,000 cm3 . In nonhomoge- neous materials, this difference in sample volume can produce significant differences between porosity determined from core and logs.
0.5
0.4
£ 0.3C/5 O DC
2 Hig 0.2
(J
0.1
± ONE STANDARD ERROR OF ESTIMATE -
LINE OF EQUALITY
0.1 0.40.2 0.3
DENSITY POROSITY FROM LOGS
Figure 5. Relation of porosity from core samples and density porosity logs for holes C1 and C1 A.
0.5
12 Techniques for Estimating Specific Yield and Specific Retention from Grain-Size Data snd Geophysics! Logs from Clastic Bedrock Aquifers
Correlation of porosity data is better between core data and log data from the core holes than between core data from the core holes and log data from well USGS. The standard error of estimate for core porosity data compared to log porosity data from holes Cl and C1A (fig. 5) is 0.029 porosity units. A similar correlation between core porosity data from the core holes and log porosity data from well USGS has a stan dard error of estimate of 0.047 porosity units. Increased variance is introduced in the data by compar ing core data to log data from a hole other than the core hole. A similar increase in variance can be expected in subsequent regression relations of specific yield derived from core data on log data from well USGS.
SPECIFIC-YIELD ESTIMATES FROM GEOPHYSICAL LOGS
Although laboratory measurements of specific yield can be made on core samples, and specific yield can be estimated from laboratory grain-size determinations, a considerable reduction in time, cost, and effort could be achieved if specific yield could be estimated directly from geophysical logs. Logs commonly used in the water-well industry, such as spontaneous potential, natural gamma, and resistivity have little potential for use in estimating specific yield. However, other logs more commonly used in the petroleum industry, such as free-fluid index, effective porosity, and apparent grain density have considerable potential for use in estimating specific yield. Each of these logs is an interpretative log produced as part of a computer-assisted well-evaluation package available from commercial geophysical-logging companies. Schlumberger's NML and Cyberlook log interpretation packages (Schlumberger Well Services, 1987) were used to produce the free-fluid index, effective-porosity, and apparent grain-density logs used in this report.
Nuclear Magnetism Log
In general, specific yield is a measure of the vol ume of water that is free to move through and drain from the pore space of a rock. A free-fluid index is a measure of the volume of water that is not bound elec trically or chemically to the rock matrix and, thus, is free to move within the pore spaces of a rock. The sim ilarity of these two definitions indicates that a free-fluid index log could provide a means for estimating specific yield.
In Schlumberger's nuclear magnetism log, the logging tool measures the precession of the magnetic moment of protons in the Earth's magnetic field
(Schlumberger Well Services, 1987). Under natural conditions, the spin of protons in hydrogen nuclei of unbound fluids is approximately aligned with the Earth's magnetic field. When a strong polarizing mag netic field is applied, the proton spin can be reoriented approximately perpendicular to the Earth's field. In the logging tool, a polarizing field is produced for a few seconds to cause proton polarization; then the field is quickly shut off. The realigned protons quickly begin processing about the Earth's field as they revert back (relax) to their original orientation. The spin preces sion induces a sinusoidal signal in a receiver coil in the logging tool. The amplitude of the signal is propor tional to the number of affected protons in the material surrounding the tool. Nonhomogeneities in the Earth's magnetic field cause the spins to dephase as they pre- cess, resulting in an exponential decay in signal strength with time. Protons in the nucleus of hydrogen atoms contained in solids or in water molecules bound to the surfaces of solids have very short relaxation times generally less than a few hundred microsec onds. Protons in free water in the pore space of a rock have much longer relaxation times generally hun dreds of milliseconds. If the measurement of the relax ation signal is delayed for 25 to 30 milliseconds after the beginning of free precession, only the signal from free or unbound fluid in the pore space is measured by the logging tool. The recorded signal is the free-fluid index log, which is described in greater detail by Her- rick and others (1979).
The protons in the water in the borehole produce a relaxation signal that is indistinguishable from that produced by the protons in the formation water. The borehole signal is eliminated by the addition of magne tite to the drilling fluid before logging. The magnetite shortens the relaxation time of the borehole fluid signal so the signal is largely attenuated during the 25- to 30-millisecond delay period. Unfortunately, the mag netite also can shorten the signal from the formation water if the magnetite invades the formation (the depth of investigation of the logging tool is about 1 in.) (Herrick and others, 1979).
Analyses of the free-fluid index log run in well USGS indicate that the log response is very sub dued through the entire depth of the hole and only attains specific yields of 0.20 to 0.40 that are measured in the core at a few thin intervals in the lower part of the hole. Analyses of the log response by Schlumberger log analysts indicated that the logging tools and inter pretative software apparently functioned correctly, and that the lack of signal shown on the log was due to the invasion of magnetite into the formation. Analyses of the micronormal and microinverse logs indicate that mudcake on the borehole wall is thicker in the lower
SPECIFIC-YIELD ESTIMATES FROM GEOPHYSICAL LOGS 13

part of the hole. The thinner mudcake in the upper part of the hole could have enabled greater magnetite inva sion in this area than in the lower part of the hole, and is consistent with the response of the free-fluid index log, which indicates a smaller signal in the upper part of the hole than in the lower part of the hole. Although nuclear magnetism logging has been used successfully in the deep wells of the petroleum industry for many years, results of this work seem to indicate that nuclear magnetism logging using magnetite doping might not be applicable to relatively shallow wells in highly per meable materials, where drilling methods generally do not produce a thick, impermeable mudcake.
Effective-Porosity Log
An effective-porosity log is produced as part of the Cyberlook log-interpretation package. Schlum- berger Well Services (1987, p. 120) defines effective porosity as:
"Effective porosity is that porosity associ ated with the non-shale phase of the shaly sand. It is the porosity that would exist if the shale and the water bound to the clays were removed, leaving only the clean sand phase."
The similarity between this definition and the definition of specific yield implies that an effective- porosity log also can provide a means for estimating specific yield. Log values of effective porosity gener ally are larger than the corresponding specific yield in well-sorted coarse-grained materials and are smaller than the corresponding specific yield in clayey materi als. In coarse-grained materials, effective porosity is a measure of the total pore space of the rock, whereas specific yield is a measure of only the drainable part of the total pore space. In clayey materials, effective porosity is zero by definition, whereas specific yield is generally slightly greater than zero.
An effective-porosity log is calculated by use of the equation:
(3)
where(|>e = effective porosity,
(|>t = total porosity,
I,, = clay index, and
(|>c = porosity of clay.
Crossplots of density and neutron-porosity logs are used to define (|>t and (|>c; the minimum shale index log can be used to define I,,.
The feasibility of using effective porosity to estimate specific yield was evaluated by use of a least- squares linear regression analysis of specific yield from holes Cl and C1A on effective porosity from the log for well USGS. The core data used for the regression anal ysis consisted of 145 specific-yield determinations made on core samples from holes Cl and C1A. The core-sample intervals were correlated from holes Cl and C1A to well USGS, and selected samples were excluded from consideration if they failed to meet the following criteria:
1. Lithology and general geophysical log response at the core-sample depth had to be similar between holes Cl, C1A, and weU USGS.
2. The log response in well USGS must be relatively uniform at the correlated depth so a small error in depth correlation would not make a large dif ference in log value.
3. The borehole of well USGS at the correlated depth had to be of uniform diameter so hole rugosity would not adversely affect log response.
Samples that meet all these criteria were well suited for comparison to log response. The resulting data set consisted of 64 samples 19 from the Dawson aquifer, 20 from the Denver aquifer, and 25 from the Arapahoe aquifer. Core data from the Laramie Forma tion were few and were excluded from consideration.
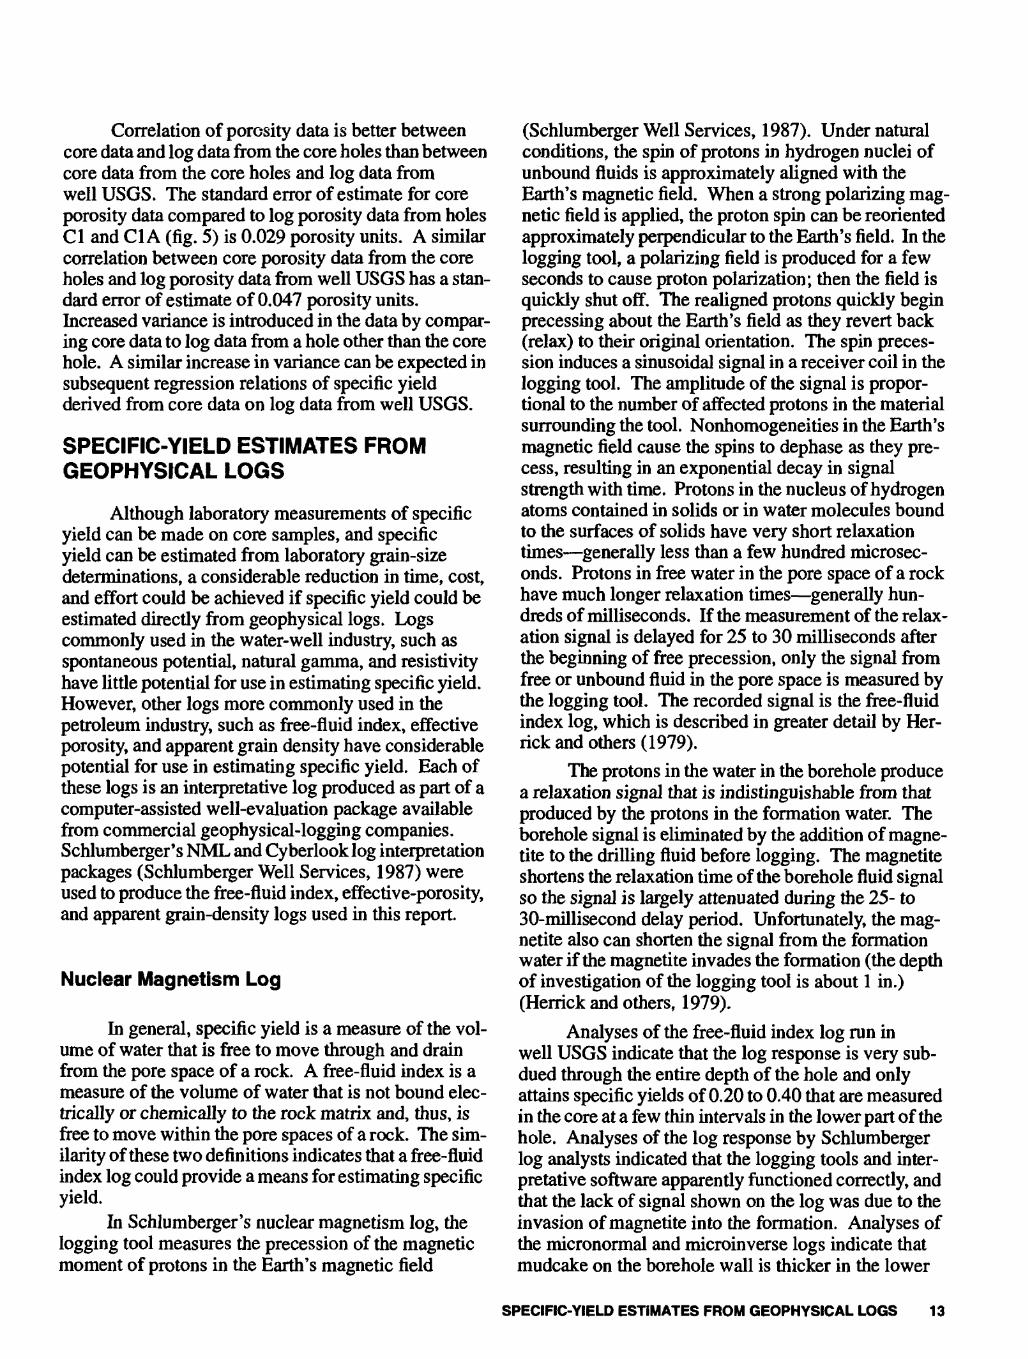
The regression equation of specific yield on effective porosity (fig. 6) has a coefficient of correlation of 0.84 and a standard error of estimate of 0.05 specific-yield units. This level of correlation indi cates that effective porosity can be a valid indicator of specific yield, provided that specific yield is calculated as a mean of several determinations. Mean specific- yield values (table 3) calculated for each aquifer from laboratory analyses of core are shown to be similar to the mean specific yield calculated from the effective- porosity regression. Sixty-eight percent of new specific-yield estimates that are derived by use of the regression equation can be expected to be within plus or minus 0.05 specific-yield units of the laboratory specific-yield value.
14 Techniques for Estimating Specific Yield and Specific Retention from Grain-Size Data and Geophysical Logs from Clastic Bedrock Aquifers
CO
Q_l UJ
OLL.
CJ LU Q_ CO
LINE OF REGRESSION - (SY = 0.0159 + 0.7677 <t>e )
± ONE STANDARD ERROR OF ESTIMATE
0.1
0.2 0.3
EFFECTIVE POROSITY (4>e )
Figure 6. Linear regression relation of specific yield on effective porosity.
Table 3. Mean specific yield from laboratory analyses of core, effective-porosity regression, and apparent grain- density regression
Mean specific yield
Aquifer
DawsonDenver
Arapahoe
Number of
samples
192025
Core analyses
0.15.16.22
Effective- porosity regres
sion
0.16.16.21
Apparent grain-
density regres
sion
0.15.16
.20
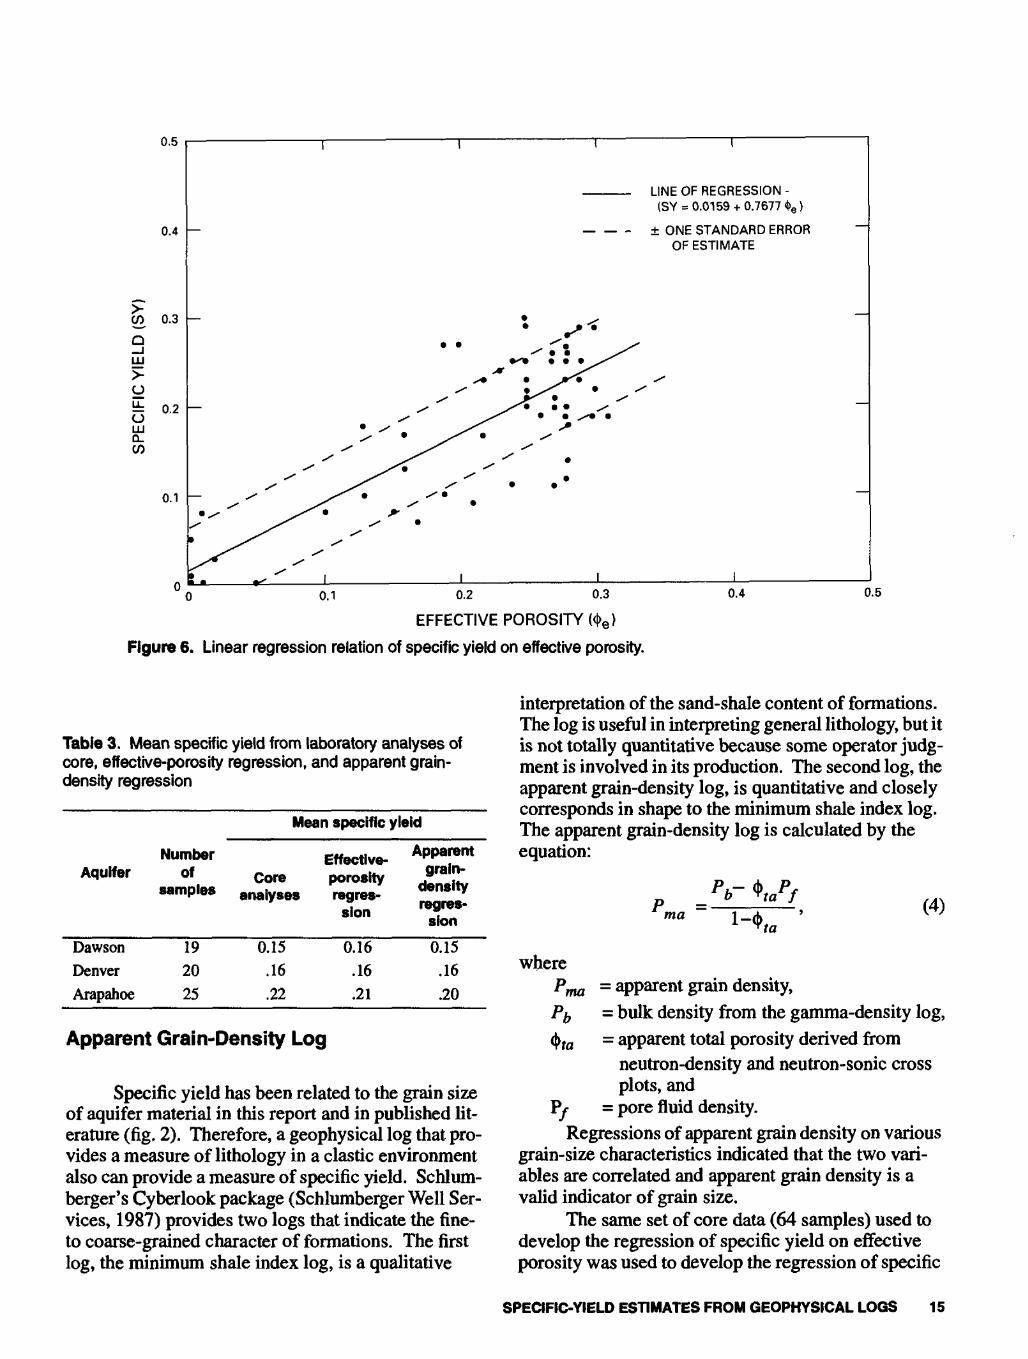
Apparent Grain-Density Log
Specific yield has been related to the grain size of aquifer material in this report and in published lit erature (fig. 2). Therefore, a geophysical log that pro vides a measure of lithology in a clastic environment also can provide a measure of specific yield. Schlum- berger's Cyberlook package (Schlumberger Well Ser vices, 1987) provides two logs that indicate the fine- to coarse-grained character of formations. The first log, the minimum shale index log, is a qualitative
interpretation of the sand-shale content of formations. The log is useful in interpreting general lithology, but it is not totally quantitative because some operator judg ment is involved in its production. The second log, the apparent grain-density log, is quantitative and closely corresponds in shape to the minimum shale index log. The apparent grain-density log is calculated by the equation:
ma ~" (4)r ta
where P,ma Pb
..
= apparent grain density,= bulk density from the gamma-density log,= apparent total porosity derived from
neutron-density and neutron-sonic crossplots, and
= pore fluid density.Regressions of apparent grain density on various
grain-size characteristics indicated that the two vari ables are correlated and apparent grain density is a valid indicator of grain size.
The same set of core data (64 samples) used to develop the regression of specific yield on effective porosity was used to develop the regression of specific
SPECIFIC-YIELD ESTIMATES FROM GEOPHYSICAL LOGS 15
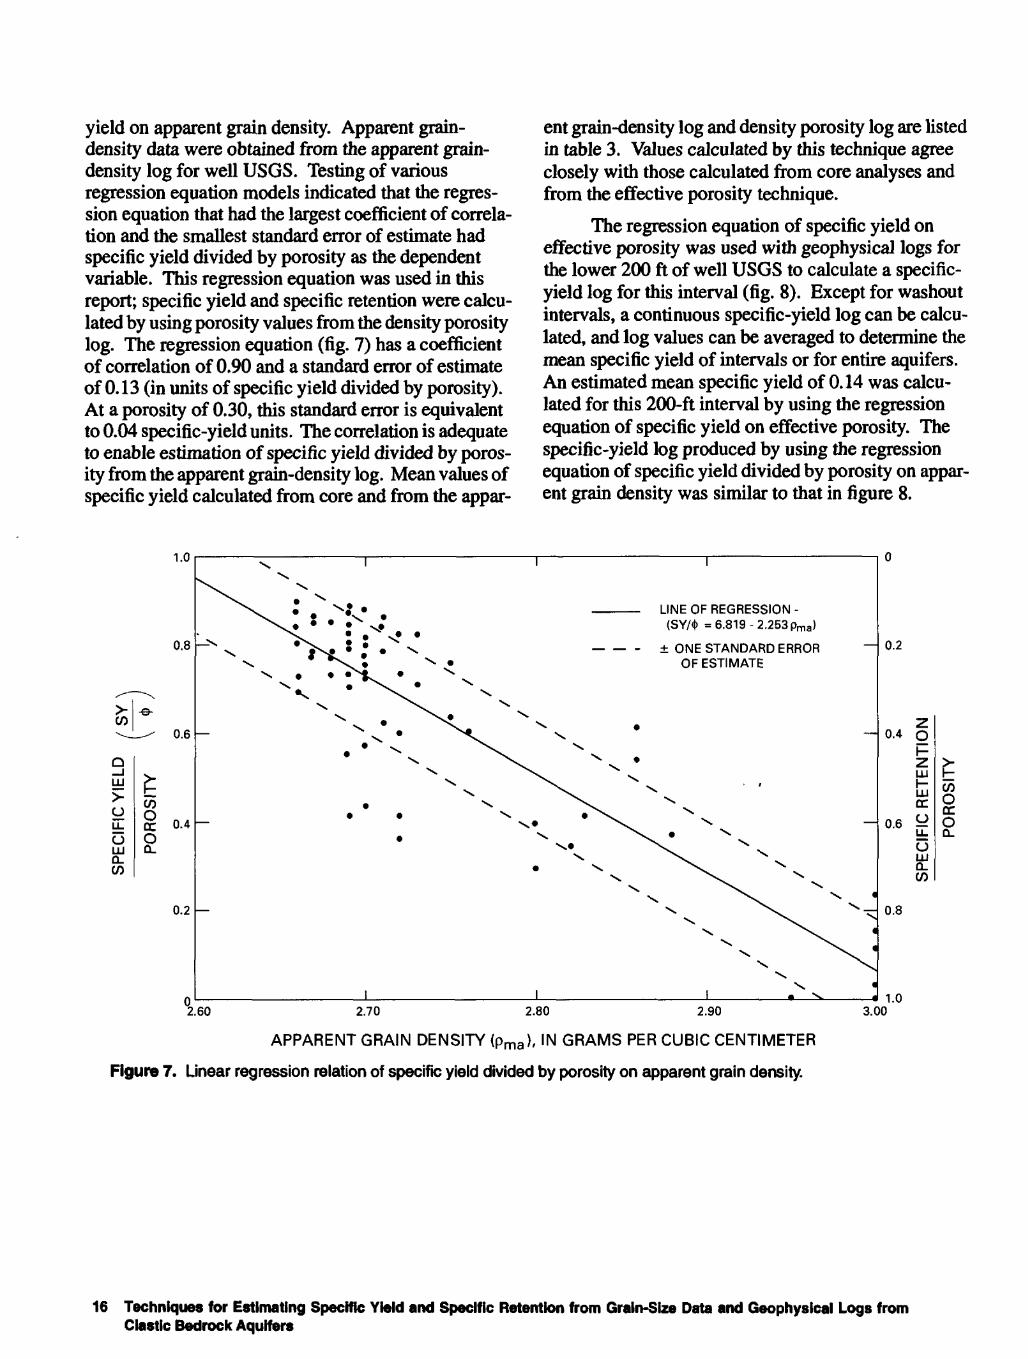
yield on apparent grain density. Apparent grain- density data were obtained from the apparent grain- density log for well USGS. Testing of various regression equation models indicated that the regres sion equation that had the largest coefficient of correla tion and the smallest standard error of estimate had specific yield divided by porosity as the dependent variable. This regression equation was used in this report; specific yield and specific retention were calcu lated by using porosity values from the density porosity log. The regression equation (fig. 7) has a coefficient of correlation of 0.90 and a standard error of estimate of 0.13 (in units of specific yield divided by porosity). At a porosity of 0.30, this standard error is equivalent to 0.04 specific-yield units. The correlation is adequate to enable estimation of specific yield divided by poros ity from the apparent grain-density log. Mean values of specific yield calculated from core and from the appar
ent grain-density log and density porosity log are listed in table 3. Values calculated by this technique agree closely with those calculated from core analyses and from the effective porosity technique.
The regression equation of specific yield on effective porosity was used with geophysical logs for the lower 200 ft of well USGS to calculate a specific- yield log for this interval (fig. 8). Except for washout intervals, a continuous specific-yield log can be calcu lated, and log values can be averaged to determine the mean specific yield of intervals or for entire aquifers. An estimated mean specific yield of 0.14 was calcu lated for this 200-ft interval by using the regression equation of specific yield on effective porosity. The specific-yield log produced by using the regression equation of specific yield divided by porosity on appar ent grain density was similar to that in figure 8.
CO
oLLJ Q_ CO
£CO
O Q_
1.0
0.8
0.6
0.4
0.2
LINE OF REGRESSION -(SY/* =6.819-2.253 pma )
- ± ONE STANDARD ERROR OF ESTIMATE
°2
0.2
0.4
H
CC
0.6 |
O
sCO
0.8
£COO cr O
60 2.70 2.80 2.90 3.00
APPARENT GRAIN DENSITY (pma ), IN GRAMS PER CUBIC CENTIMETER
Figure 7. Linear regression relation of specific yield divided by porosity on apparent grain density.
1.0
16 Techniques for Estimating Specific Yield and Specific Retention from Grain-Size Data and Geophysical Logs from Clastic Bedrock Aquifers

6
DEPTH,BOREHOLE DIAMETER, IN
IN INCHES FEET
2,200 "
,CALIPER
,GAMMA
V[WASH- C ' OUT -
2,300
2,400
RESISTIVITY, IN OHM - METERS
10 100 1,000SPECIFIC YIELD, IN PERCENT 30 20 10 0
RESISTIVITY
DENSITY POROSITY
,r'
100 200
GAMMA RADIATION, IN API UNITS
40 30 20 10 0
DENSITY POROSITY, IN PERCENT
Figure 8. Calculated specific-yield log and related caliper, gamma, resistivity, and porosity logs for a 200-foot interval in well USGS.
SPECIFIC-YIELD ESTIMATES FROM GEOPHYSICAL LOGS 17
SUMMARY
This work has described several techniques for estimating aquifer specific yield and specific retention based on least-squares linear regression analysis using aquifer grain-size data, effective-porosity logs, and apparent grain-density logs. Specific retention can be estimated by use of any of five regression equations of specific retention on grain-size characteristics. Spe cific yield then can be calculated from specific reten tion by use of porosity values from density-porosity logs or from laboratory analyses. This technique is an alternative to determining specific yield and specific retention through laboratory analyses of undisturbed core samples. The regression technique is faster and less costly than the laboratory technique but can pro duce specific-yield and specific-retention estimates of lesser accuracy than the laboratory technique, particu larly if individual determinations are compared.
Specific retention based on laboratory analyses of core was compared to corresponding specific reten tion estimates derived from grain-size regression equa tions. These direct comparisons were made for the regression data set, a separate verification data set, and a small data set representing an unconsolidated alluvial aquifer. In each case, the mean specific retention from the grain-size regression was comparable to that deter mined by laboratory analyses.
Effective-porosity logs and apparent grain-den sity logs are produced as part of computer-assisted well-log evaluation programs available through com mercial geophysical-logging companies. Regression analysis of specific yield on effective porosity provided a means for estimating specific yield from effective porosity, and a specific-yield log was produced. Regression analysis of specific yield divided by poros ity data on apparent grain density provided another means for estimating specific yield. Both log interpre tation techniques produced mean specific-yield esti mates for the upper three bedrock aquifers in the Denver basin that are comparable to the mean values obtained from laboratory analyses of core.
Errors in the production of density porosity logs and the magnitude of the standard error of estimate from the regression equations indicate the value of using a mean specific yield or specific retention for a geologic interval. Mean specific-yield values are good measures of the mean laboratory values, but individual regression and laboratory values can vary considerably.
REFERENCES CITED
American Society for Testing and Materials, 1977, Standard test method for capillary-moisture relationships for
fine-textured soils by pressure-membrane apparatus: American Society for Testing and Materials, ASTM D3152-72 (reapproved 1977), p. 479^86.
Eckis, Rollin, 1934, South coastal-basin investigation Geology and ground-water storage capacity of valley fill: California Department of Public Works, Water Resources Division, Bulletin 45, 279 p.
Hearst, J.A., and Nelson, P.H., 1985, Well logging for phys ical properties: New York, McGraw-Hill Book Co., 571 p.
Herrick, R.C., Couturie, S.H., and Best, D.L., 1979, An improved nuclear magnetism logging system and its application to formation evaluation: Society of Petro leum Engineers, 54th Annual Fall Technical Confer ence and Exhibition, Las Vegas, paper no. 54, 8 p.
Johnson, A.I., 1967, Specific yield Compilation of specific yields for various materials: U.S. Geological Survey Water-Supply Paper 1662-D, 74 p.
Johnson, W.L., and Linke, W.A., 1978, Some practical appli cations to improve formation evaluation of sandstones in the MacKenzie Delta: Transactions of the 19th Annual Logging Symposium, SPWLA Paper C.
Keys, W.S., 1990, Borehole geophysics applied to ground- water investigations: U.S. Geological Survey Tech niques of Water-Resources Investigations, book 2, chap. E2,150 p.
Lohman, S.W, and others, 1972, Definitions of selected ground-water terms Revisions and conceptual refine ments: U.S. Geological Survey Water-Supply Paper 1988, 21 p.
McConaghy, J.A., Chase, G.H., Boettcher, A.J., and Major, T.J., 1964, Hydrogeologic data of the Denver basin, Colorado: Colorado Water Conservation Board Basic- Data Report 15, 224 p.
McWhorter, D.B., and Garcia, A.J., 1990, The concept of specific yield and its evaluation by laboratory measure ments: Groundwater Engineering and Management Conference, Denver, Colo., 1990, Proceedings, p. 235-246.
Meinzer, O.E., 1923, The occurrence of ground water in the United States: U.S. Geological Survey Water-Supply Paper 489, 321 p.
Neinast, G.S., and Knox, C.C., 1973, Normalization of well log data: Transactions of the 14th Annual Logging Symposium, SPWLA Paper I, p. 1-19.
Neuman, S.P., 1987, On methods of determining specific yield: Ground Water, v. 25, no. 6, p. 679-684.
Patchett, J.G., and Coalson, E.B., 1979, The determination of porosity in sandstones and shaley sandstones Part one, quality control: The Log Analyst, v. 20, no. 6, p. 3-12.
18 Techniques for Estimating Specific Yield and Specific Retention from Grsin-SIze Dsta and Geophysics! Logs from Clastic Bedrock Aquifers
Preuss, F.A., and Todd, O.K., 1963, Specific yield of uncon- solidated alluvium: Berkeley, University of California, Water Resources Center Contribution 76, 22 p.
Raforth, R.L., and Jehn, J.L., 1990, Preliminary results from the coring of the Denver basin aquifers: Groundwater Engineering and Management Conference, Denver, Colo., 1990, Proceedings, p. 247-258.
Robson, S.G., 1983, Hydraulic characteristics of the princi pal bedrock aquifers in the Denver basin, Colorado: U.S. Geological Survey Hydrologic Investigations Atlas HA-659, 3 sheets, scale 1:500,000.
__1987, Bedrock aquifers in the Denver basin, Colo rado A quantitative water-resources appraisal: U.S. Geological Survey Professional Paper 1257,73 p.
Robson, S.G., and Banta, E.R., 1990, Determination of spe cific storage by measurement of aquifer compression near a pumping well: Ground Water, v. 28, no. 6, p. 868-874.
__1993, Data from core analyses, aquifer testing, and geo physical logging of Denver basin bedrock aquifers at Castle Pines, Colorado: U.S. Geological Survey Open-File Report 93-442,94 p.
Schlumberger Well Services, 1987, Log interpretation prin ciples/applications: Houston, Tex., 198 p.
Tittman, Jay, 1986, Geophysical well logging: Orlando, Academic Press, Inc., 175 p.
REFERENCES CITED 19
U.S. GOVERNMENT PRINTING OFFICE: 1993 573-191 / 80014 REGION NO. 8