5.vehicle specific power approach to estimating on-road nh3 emissions from light-duty vehicles
TRANSCRIPT

8/3/2019 5.Vehicle Specific Power Approach to Estimating on-Road NH3 Emissions From Light-Duty Vehicles
http://slidepdf.com/reader/full/5vehicle-specific-power-approach-to-estimating-on-road-nh3-emissions-from 1/6
Vehicle Specific Power Approach toEstimating On-Road NH3 Emissionsfrom Light-Duty VehiclesT A O H U A I , † , § T H O M A S D . D U R B I N , * , †
T E D Y O U N G L O V E , ‡ G E O R G E S C O R A , †
M A T T H E W B A R T H , † A N DJ O S E P H M . N O R B E C K †
Department of Chemical and Environmental Engineering,College of Engineering, Center for Environmental Researchand Technology (CE-CERT), and Statistical Collaboratory,University of California, Riverside, California 92521
NH3 emissions from motor vehicles have been the subjectof a number of recent studies due to their potentialimpact on ambient particulate matter (PM). Highly time-resolved NH3 emissions can be measured and correlatedwith specific driving events utilizing a tunable diodelaser (TDL). It is possible to incorporate NH3 emissionswith this new information into models that can be used topredict emissions inventories from vehicles. The newergeneration of modal models are based on modal events,with the data collected at second-by-second time resolution,unlike the bag-based emission inventory models such asEMFACand MOBILE. Thedevelopment of an NH3 modal modelis described in this paper. This represents one of thefirst attempts to incorporate vehicle NH3 emissions into acomprehensive emissions model. This model was usedin conjunction with on-road driving profiles to estimate theemissions of SULEV, ULEV, and LEV vehicles to be 9.4 (4.1, 21.8 ( 5.2, and 34.9 ( 6.0 mg/mi, respectively. We alsoimplement this new NH3 model to predict and evaluate the NH3 emission inventory in the South Coast air basin(SoCAB).
IntroductionThere is an increasing trend toward theuse of models basedon modal or instantaneous emissions as models of vehicleemissionscontinueto evolve. These newer modelsare basedon real-time emissions datathat is representative of as many modes of operation as possible, unlike bag-based emissioninventory models such as EMFAC and MOBILE. The new U.S.Environment Protection Agency(U.S. EPA)mobile sourceinventory model, motor vehicle emissions simulator (MOVES),usesvehiclespecific power (VSP),a roadload-based quantity,as the primary variable in modeling emissions (1, 2 ). EPA
conducted a “shoot-out” modeling study as part of EPA’sMOVES modeling evaluation and found that approachesusing binning of data by operational mode as well as VSP were both promising for modeling emissions (1, 2 ).
Currently, some other models are also making efforts touse modal data. One of the newer-generation models based
on modal events is the comprehensive modal emissionsmodel (CMEM) by Barth et al. (3). CMEM uses a physical,power-demand modal modeling approach based on aparametrized analytical representation of emissions produc-
tion (3). The parameters used in the model vary according to the vehicle type, engine, and emission technology, andinclude vehicle mass, engine size, aerodynamic drag coef-ficient, etc. North Carolina State Universityis conducting anexploratory research to understand the relation betweenvehicle emissions and traffic control measures (4). TheGeorgia Institute of Technology also developed a motorvehicle emissions model to account for emissions as afunction of vehicle operating profiles (5 ).
Vehicle emission models have primarily focused onregulated emissions. Unregulated emissions, such as am-monia (NH3), have not been included due to limitations inthe available data. Recently, experimental work has shownthat NH3 emissions from vehicles may be more significantthan previously thought (6 -8). Higher ambient NH3 emis-sions could contribute to increased levels of secondary particulatematter (PM), a concern because of adverse healtheffects related to respiratory and cardiovascular diseases inhumans and decreased visibility in both urban and ruralareas.
For NH3, only in the past few years have techniques beendeveloped that provide sufficient time resolution for modalmodeling. Durbin et al. (9 ) and Huai et al. (10 ) utilized asensitive and highlytime-resolved tunable diode laser (TDL)system for raw exhaust NH3 measurements from vehicles.Theimportanceof theTDL measurementsis shownin Figure1, which compares the TDL raw emissions with FTIRmeasurements through the dilution tunnel. It is apparentthat FTIR measurements are broader and have an extendedtail. This is due to the greater residence time of the FTIR cellcompared to that of the TDL and the fact that the FTIR
measurements are made through the dilution tunnel whereadsorption/desorption effects can be considerable for NH3.This results in the FTIR underestimating the peak NH3
emissions but overestimating emissions in periods whereoperation is less transient. The TDL is also capable of raw exhaustNH3 measurements,which providesan improvementin sensitivity needed for low-emission vehicles. Many of theprevious chassis dynamometer and tunnel studies of NH3
emissions have used filter-based techniques (6 , 11, 12 ) toobtain integrated results and, hence, do not provide datathat can be used in modal emission models.
Huai et al. (10 ) showed that a number of factors cancontribute to the formation of NH3 in vehicle exhaust by
* Correspondingauthorphone: (951)781-5794; fax: (951)781-5790;e-mail: [email protected].
† College of Engineering, Center for Environmental Research andTechnology.
‡ Statistical Collaboratory.§ Present address: California Air Resources Board, Research
Division, 1001 I Street, P.O. Box 2815, Sacramento, CA 95812.
FIGURE 1. TDL vs FTIR NH3 comparison.
Environ. Sci. Technol. 2005, 39, 9595-9600
10.1021/es050120c CCC: $30.25 © 2005 American Chemical Society VOL. 39, NO. 24, 2005 / ENVIRONMENTAL SCIENCE & TECHNOLOGY 9 9595
Published on Web 11/05/2005

8/3/2019 5.Vehicle Specific Power Approach to Estimating on-Road NH3 Emissions From Light-Duty Vehicles
http://slidepdf.com/reader/full/5vehicle-specific-power-approach-to-estimating-on-road-nh3-emissions-from 2/6
analyzing the TDL NH3 results for a set eight modern light-duty vehicles. NH3 emissions vary considerably depending on the vehicle, its associated emission control technology,and driving cycle. Real-time emissions data show that NH3
emissions areprimarily generated during accelerationevents.
More specifically, higher NH3 emissions were found underhigh-VSP events with rich A/F ratios. These factors indicatethat NH3 emissions can be incorporated into models, suchasMOVES and CMEM, that can be used to predictemissionsinventories from vehicles.
The objective of the present work is to incorporate NH3
data into a VSP/modal modeling framework. Two modeling approaches were used in this study. First, second-by-secondNH3 emissions data were used to calculate NH3 emissionrates using a VSPbinning methodology,as proposedfor EPA’sMOVES model (1). Parameter sets for a piecewise linearregression module were then estimated for each vehicle, as well for a composite vehicle by technology category. Finally,the NH3 emissions module is appliedto estimate the currentNH3 emission inventoryin theSouthCoastair basin (SoCAB)anddemonstratethe trend of NH3 emissionsinventories from
the future mobile source fleet.
NH3 Modal Database DevelopmentThe data set used for the modeling approach for this study was based on a subset of eight vehicles. The test matrix wascomposed of late model vehicles and included two super-ultra-low-emissionvehicles(SULEV),two ultralow-emissionvehicles (ULEV), and four low-emission vehicles (LEV), asshown in Table 1. It should be noted that although light-dutytrucks andpassengercars inthe same emissions category (i.e.,LEV) arecertified to different standards, theyare groupedtogether in this study due to limited data in each category. All vehicles were tested over a range of cycles including theFTP75, US06, MEC01v7, NYCC, and hot running 505 (10 ).The data and analysis for this studyare restricted to the TDL
data. The average NH3 emissions over each cycle are alsoprovided in Table 1. More details on these experimentalresults can be found elsewhere (10 ).
Development of the VSP Modeling FrameworkTwo approaches were used for the development of the NH3
versusVSP framework. Thefirst approach wasa VSPbinning methodology similar to the approach used by EPA (1). Thesecond approach used a piecewise linear regression withtwo linear slopes, an intercept, and a break point estimatedfrom the data. Both methods were developed using the eighttest vehicles and modal NH3 data over the range of cyclesused for each vehicle.
VSP is defined here as the instantaneous power per unitmass of thevehicle. The main advantages of using VSP as anindependent variable for studyingthe hot stabilized emissionsof passenger cars and light-duty trucks are three: specificpower is directly measurable, it captures most of the
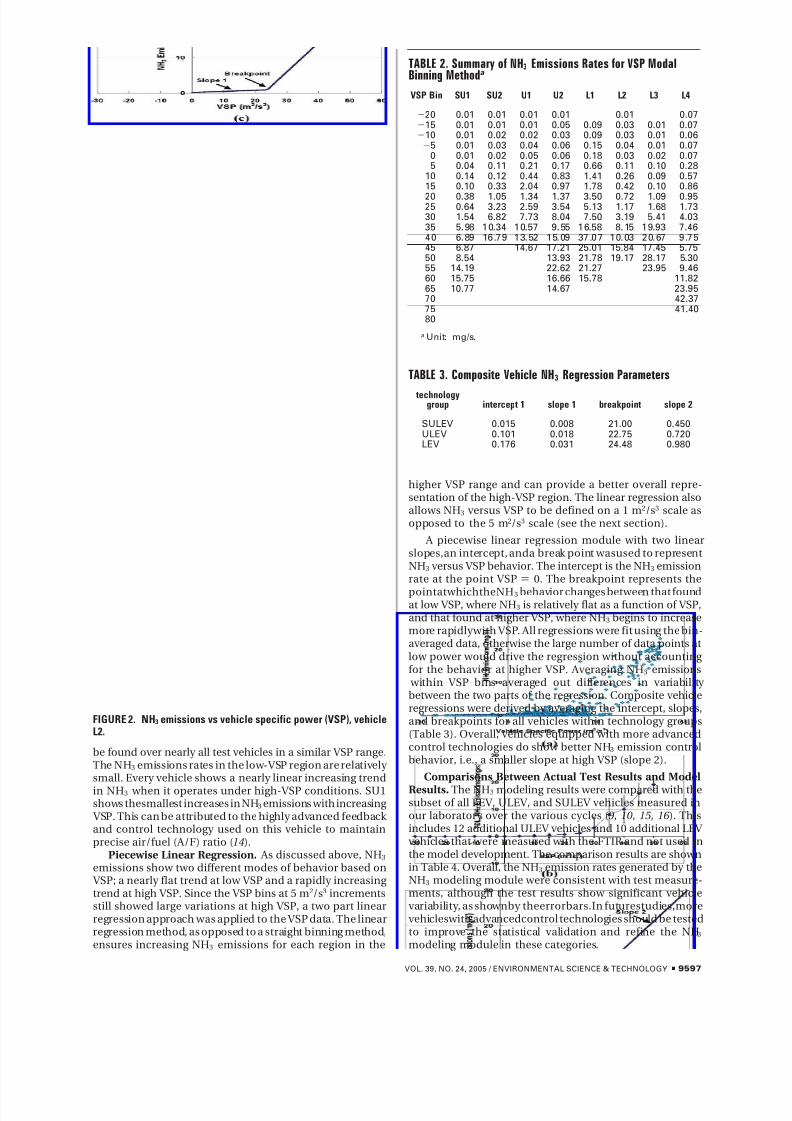
dependence of emissions on engine operating parameters,and certification driving cycles are defined as a speed versustime trace and can also be specified in terms of VSP (13). Anadditional advantage of VSP is it can quantify emissionsregardless of the physical parameters of the vehicle, such asvehicletype,weight,engine size, etc. A plotof NH3 emissionsagainstVSPis providedin Figure 2afor oneof theLEVvehicles(L2). The results show the bimodal nature of NH3 emissions with respect to VSP that is key to the framework developedhere. Theequation utilizedfor VSPis similarto that reportedby Jimenez-Palacios (13) withthe actual dynamometer roadload coefficients. The VSP equation used is as follows:
where v mps ) velocity (m/s); a ) acceleration (m/s2); M )vehicle test weight (kg); v kmph ) velocity (km/h); A (kg), B(kg/(km/h)), and C (kg/(km/h)2) ) dynamometer road loadcoefficients; i ) “mass factor”, which is the equivalenttranslationalmass of the rotatingcomponents (wheels,gears,shafts, etc.) of the powertrain. We utilize a factor of 0.1 fori similar to that used by Jimenez-Palacios (13). Also, g )acceleration of gravity (m/s2); 9.80665 ) 1 kg/N.
VSPModal Binning. A VSPbinningmethodology, as usedto develop EPA’s MOVES modeling framework (1), wasinitially applied to process the raw modal NH3 emissionsdata. At the second-by-second level of time resolution, there was considerable variability in the emissions. The dataweretherefore binned by VSP increments of 5 m2/s3 as presentedin Figure 2b. The VSP binning methodology demonstratedtwo different behaviors in NH3 emissions: one flat and onesloped. There is still considerable variation in each bin dueto limited data, however, especially in high-VSP zones. Thedata points in Figure 2b show the average values of NH3
emissions ineach VSPbin.Errorbars represent onestandarddeviation of the data in the bin. It is important to note thatthe breakpoints of all test vehicles are consistently withinthe range of the 20-25 m2/s3 VSP bin. Since the standardFTP has a maximum VSP of 22 m2/s3, testing over cyclesmore aggressive than the FTP is needed to develop accurateNH3 estimates for real-world conditions.
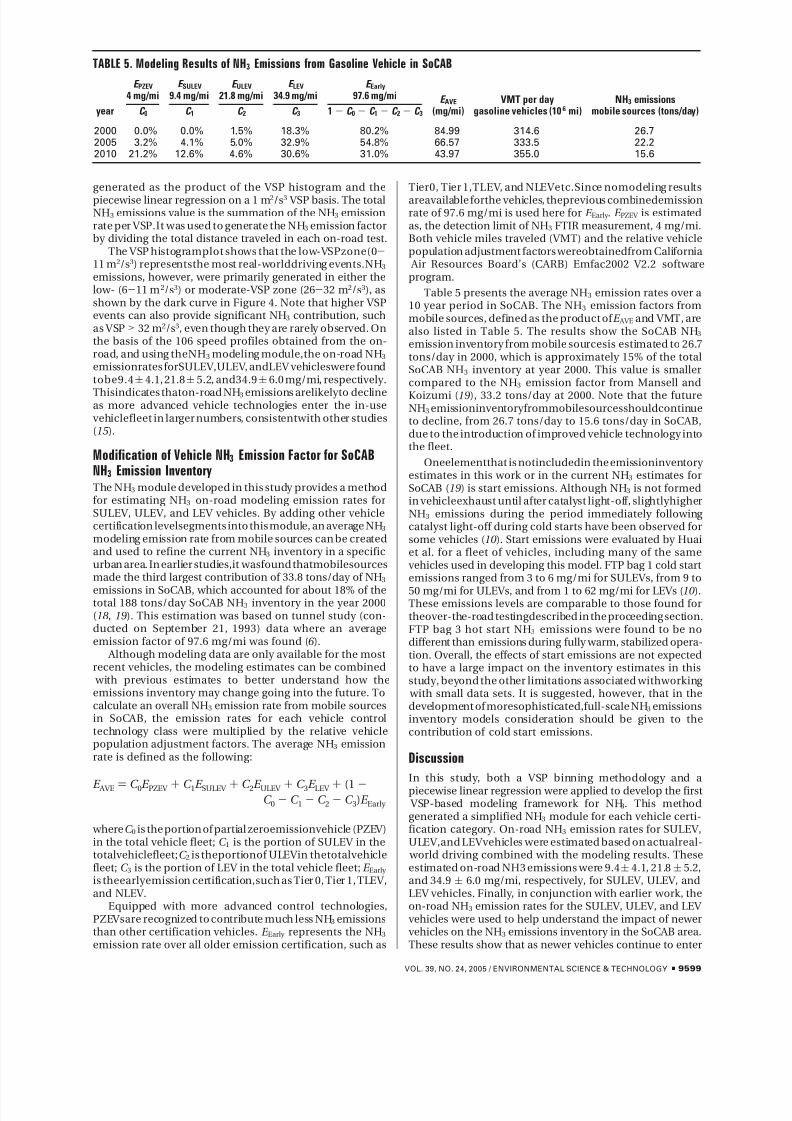
A summary of NH3 emissions rates for this VSP binning method is presented in Table 2. In general, breakpoints can
TABLE 1. Description of Test Vehicles and NH3 Emissions Rates a
vehicle ID SU1 SU2 U1 U2 L1 L2 L3 L4
MY 2000 2001 2001 2001 2000 2001 2001 2001OEM Honda Nissan Chrysler Acura Jeep Ford Chevrolet Chevroletmodel Accord Sentra CA Sebring CL Grand Cherokee Taurus Cavalier Silveradocertification SULEV SULEV ULEV ULEV LEV LEV LEV LEVdisplacement (L) 2.3 1.8 2.4 3.2 4.7 3.0 2.4 5.3mileage (mi) 11958 6592 19677 20523 29571 23553 22482 8380vehicle typeb PC PC PC PC LDT PC PC LDTtest wt (lb) 3250 3000 3750 3750 4500 3625 3125 4750
NH3 Emissions Rates (g/mi)FTPc 0.002 0.003 0.023 0.009 0.029 0.001 0.001 0.028hot running 505d 0.002 0.003 0.003 0.021 0.002 0.029NYCCd 0.011 0.011 0.021 0.028 0.002 0.083US06c 0.007 0.030 0.138 0.089 0.231 0.031 0.029 0.064MEC01v7d 0.019 0.071 0.098 0.099 0.190 0.078 0.081 0.065
a Test vehicleswere conductedwith original equipment (OE) as-received catalyst.The test fuelused for thisproject was a commercial CaliforniaPhase 2 gasoline doped to 30 ppmw sulfur, a value close to the average sulfur level of California gasoline. b PC: passenger car; LDT: light-dutytruck. c FTPand US06 results areaveragesfor duplicateor triplicate tests. d NYCC,hot running 505, andMEC01v7resultsare based onsingle tests.
VSP (kW/metric ton ) m2/s3) ) v mps[a(1 + i) + g
(grade) + 9.80665( A + Bv kmph + Cv kmph2)/ M ]
9596 9 ENVIRONMENTAL SCIENCE & TECHNOLOGY / VOL. 39, NO. 24, 2005
8/3/2019 5.Vehicle Specific Power Approach to Estimating on-Road NH3 Emissions From Light-Duty Vehicles
http://slidepdf.com/reader/full/5vehicle-specific-power-approach-to-estimating-on-road-nh3-emissions-from 3/6
be found over nearly all test vehicles in a similar VSP range.The NH3 emissions rates in the low-VSP region are relatively small. Every vehicle shows a nearly linear increasing trendin NH3 when it operates under high-VSP conditions. SU1shows thesmallest increases in NH3 emissions with increasing VSP. This can be attributed to the highly advanced feedback and control technology used on this vehicle to maintainprecise air/fuel (A/F) ratio (14).
Piecewise Linear Regression. As discussed above, NH3
emissions show two different modes of behavior based on VSP; a nearly flat trend at low VSP and a rapidly increasing trend at high VSP. Since the VSP bins at 5 m2/s3 incrementsstill showed large variations at high VSP, a two part linearregression approach was applied to the VSP data. The linearregression method, as opposed to a straight binning method,ensures increasing NH3 emissions for each region in the
higher VSP range and can provide a better overall repre-sentation of the high-VSP region. The linear regression alsoallows NH3 versus VSP to be defined on a 1 m2/s3 scale asopposed to the 5 m2/s3 scale (see the next section).
A piecewise linear regression module with two linearslopes,an intercept, anda break point wasused to representNH3 versus VSP behavior. The intercept is the NH3 emissionrate at the point VSP ) 0. The breakpoint represents the
pointatwhichtheNH3 behavior changes between that foundat low VSP, where NH3 is relatively flat as a function of VSP,and that found at higher VSP, where NH3 begins to increasemore rapidlywith VSP. All regressions were fit using the bin-averaged data, otherwise the large number of data points atlow power would drive the regression without accounting for the behavior at higher VSP. Averaging NH3 emissions within VSP bins averaged out differences in variability between the two parts of the regression. Composite vehicleregressions were derived by averaging the intercept, slopes,and breakpoints for all vehicles within technology groups(Table 3). Overall, vehicles equipped with more advancedcontrol technologies do show better NH3 emission controlbehavior, i.e., a smaller slope at high VSP (slope 2).
Comparisons Between Actual Test Results and Model
Results. The NH3 modeling results were compared with thesubset of all LEV, ULEV, and SULEV vehicles measured inour laboratory over the various cycles (9 , 10 , 15 , 16 ). Thisincludes 12 additional ULEV vehicles and 10 additional LEV vehicles that were measured with the FTIR and not used inthe model development. The comparison results are shownin Table 4. Overall, the NH3 emission rates generated by theNH3 modeling module were consistent with test measure-ments, although the test results show significant vehiclevariability, as shownby theerrorbars.In futurestudies,morevehicleswith advancedcontrol technologies should be testedto improve the statistical validation and refine the NH3
modeling module in these categories.
FIGURE 2. NH3 emissions vs vehicle specific power (VSP), vehicleL2.
TABLE 2. Summary of NH3 Emissions Rates for VSP ModalBinning Method a
VSP Bin SU1 SU2 U1 U2 L1 L2 L3 L4
-20 0.01 0.01 0.01 0.01 0.01 0.07-15 0.01 0.01 0.01 0.05 0.09 0.03 0.01 0.07-10 0.01 0.02 0.02 0.03 0.09 0.03 0.01 0.06-5 0.01 0.03 0.04 0.06 0.15 0.04 0.01 0.07
0 0.01 0.02 0.05 0.06 0.18 0.03 0.02 0.075 0.04 0.11 0.21 0.17 0.66 0.11 0.10 0.28
10 0.14 0.12 0.44 0.83 1.41 0.26 0.09 0.5715 0.10 0.33 2.04 0.97 1.78 0.42 0.10 0.86
20 0.38 1.05 1.34 1.37 3.50 0.72 1.09 0.9525 0.64 3.23 2.59 3.54 5.13 1.17 1.68 1.7330 1.54 6.82 7.73 8.04 7.50 3.19 5.41 4.0335 5. 98 1 0.34 1 0.57 9. 55 1 6.58 8. 15 1 9.93 7.4640 6.89 16.79 13.52 15.09 37.07 10.03 20.67 9.7545 6.87 14.67 17.21 25.01 15.84 17.45 5.7550 8.54 13.93 21.78 19.17 28.17 5.3055 14.19 22.62 21.27 23.95 9.4660 15.75 16.66 15.78 11.8265 10.77 14.67 23.9570 42.3775 41.4080
a Unit: mg/s.
TABLE 3. Composite Vehicle NH3 Regression Parameters
technologygroup intercept 1 slope 1 breakpoint slope 2
SULEV 0.015 0.008 21.00 0.450ULEV 0.101 0.018 22.75 0.720LEV 0.176 0.031 24.48 0.980
VOL. 39, NO. 24, 2005 / ENVIRONMENTAL SCIENCE & TECHNOLOGY 9 9597

8/3/2019 5.Vehicle Specific Power Approach to Estimating on-Road NH3 Emissions From Light-Duty Vehicles
http://slidepdf.com/reader/full/5vehicle-specific-power-approach-to-estimating-on-road-nh3-emissions-from 4/6
Pilot Implementation of NH3 Emission ModelThe NH3 modeling module was combined with activity datafrom a separate on-road project to provide an estimate of on-roadNH3 emissions rates (17 ). Thison-road measurementproject included multiple test vehicles and provided the real- world driving behavior from tests run over a road course inSouthern California. The road course includes cold start,freeway, arterial, and residential sections. The same roadcourse was driven threetimes in 1 day: morning, noon, andafternoon. This generates a variety of traffic conditions. A total of 106on-road drivingtests providedvalidspeed profiles.Both on-board diagnostic(OBD) and global position system(GPS) speed data are available in this project. Actual speeddata was determined by comparing the OBD and GPS data.
The speed profile for one of the typical real-world tests
is presentedin Figure 3. Thisfreeway,arterial,and residentialcombination road course presents real-world driving condi-tions that are comparable to a combination of the FTP75and US06. It is also interesting to note that different driving time periods (morning, noon, and afternoon) showed nosignificant difference in the histogram of VSP.
On the basis of the NH3 modeling module, on-road NH3
emissionsrates canbe estimated/predicatedmathematically when the actual speed andemission certification level of thevehicles are obtained. The process for estimating an NH3
on-road modeling emissions rate is demonstrated in Figure4.Here,the VSPhistogramrepresents thenumber of secondsspent in each of the 1 m2/s3 bins. NH3 emissions rates were
TABLE 4. Validation of NH3 Measurements over 5 Different Test Cycles
modeled (mg/mi) measured (mg/mi)a ,b
FTP US06 MEC01v7 hot running 505 NYCC FTP US06 MEC01v7 hot running 505 NYCC
SULEV 4.3 33.6 41.8 4.5 5.3 2.5 ( 1.3 (2) 18.3 ( 16.0 (2) 35.6 ( 50.3 (2) 1.2 ( 1.7 ( 2) 5. 3( 7.4 (2)ULEV 16.3 52.4 65.6 15.7 21.4 14.7 ( 19.0 (14) 78.7 ( 49.6 (11) 98.5( 0. 6 (2) 9.4 ( 15.0 (5) 16.0 ( 6.4 (2)LEV 28.7 70.8 86.8 27.6 38.0 13.6 ( 20.5 (14) 66.2 ( 79.7 (12) 103.5( 57.8 (4) 12.1 ( 17.4 (8) 28.4 ( 38.7 (4)
a Values are averages (one standard deviation variation. The number of vehicles for each emission factor is provided in parentheses. Resultsfor 30 ppmw sulfur fuel. b Durbin and co-workers (9 , 15 ), Huai and co-workers (10 , 16 ).
FIGURE 3. Real-world driving profile.
FIGURE 4. Estimate process of NH3 modeling emissions rates.
9598 9 ENVIRONMENTAL SCIENCE & TECHNOLOGY / VOL. 39, NO. 24, 2005
8/3/2019 5.Vehicle Specific Power Approach to Estimating on-Road NH3 Emissions From Light-Duty Vehicles
http://slidepdf.com/reader/full/5vehicle-specific-power-approach-to-estimating-on-road-nh3-emissions-from 5/6
generated as the product of the VSP histogram and the
piecewise linear regression on a 1 m2/s3 VSP basis. The totalNH3 emissions value is the summation of the NH3 emissionrate per VSP.It was used to generate the NH3 emission factorby dividing the total distance traveled in each on-road test.
The VSP histogramplot shows that the low-VSPzone(0-11 m2/s3) representsthe most real-worlddriving events.NH3
emissions, however, were primarily generated in either thelow- (6-11 m 2/s3) or moderate-VSP zone (26-32 m2/s3), asshown by the dark curve in Figure 4. Note that higher VSPevents can also provide significant NH3 contribution, suchas VSP> 32 m2/s3, even though they are rarely observed. Onthe basis of the 106 speed profiles obtained from the on-road, and using theNH3 modeling module,the on-road NH3
emissionrates forSULEV,ULEV, andLEV vehicleswere foundtobe9.4( 4.1, 21.8( 5.2, and34.9( 6.0 mg/mi, respectively.
Thisindicates thaton-road NH3 emissions arelikelyto declineas more advanced vehicle technologies enter the in-usevehiclefleet in larger numbers, consistentwith other studies(15 ).
Modification of Vehicle NH3 Emission Factor for SoCABNH3 Emission InventoryThe NH3 module developed in this study provides a methodfor estimating NH3 on-road modeling emission rates forSULEV, ULEV, and LEV vehicles. By adding other vehiclecertification levelsegments into this module, an average NH3
modeling emission rate from mobile sources can be createdand used to refine the current NH3 inventory in a specificurban area. In earlier studies,it wasfound thatmobilesourcesmade the third largest contribution of 33.8 tons/day of NH3
emissions in SoCAB, which accounted for about 18% of thetotal 188 tons/day SoCAB NH3 inventory in the year 2000(18, 19 ). This estimation was based on tunnel study (con-ducted on September 21, 1993) data where an averageemission factor of 97.6 mg/mi was found (6 ).
Although modeling data are only available for the mostrecent vehicles, the modeling estimates can be combined with previous estimates to better understand how theemissions inventory may change going into the future. Tocalculate an overall NH3 emission rate from mobile sourcesin SoCAB, the emission rates for each vehicle controltechnology class were multiplied by the relative vehiclepopulation adjustment factors. The average NH3 emissionrate is defined as the following:
where C 0 is the portion of partial zeroemissionvehicle (PZEV)in the total vehicle fleet; C 1 is the portion of SULEV in thetotalvehiclefleet;C 2 is theportionof ULEVin thetotalvehiclefleet; C 3 is the portion of LEV in the total vehicle fleet; E Early
is theearlyemission certification,such as Tier 0, Tier 1, TLEV,and NLEV.
Equipped with more advanced control technologies,PZEVsare recognized to contribute much less NH3 emissionsthan other certification vehicles. E Early represents the NH3
emission rate over all older emission certification, such as
Tier0, Tier 1,TLEV, and NLEVetc.Since nomodeling results
areavailable forthe vehicles, theprevious combinedemissionrate of 97.6 mg/mi is used here for E Early . E PZEV is estimatedas, the detection limit of NH3 FTIR measurement, 4 mg/mi.Both vehicle miles traveled (VMT) and the relative vehiclepopulation adjustment factors wereobtainedfrom California Air Resources Board’s (CARB) Emfac2002 V2.2 softwareprogram.
Table 5 presents the average NH3 emission rates over a10 year period in SoCAB. The NH3 emission factors frommobile sources, defined as the product of E AVE and VMT, arealso listed in Table 5. The results show the SoCAB NH3
emission inventory from mobile sourcesis estimated to 26.7tons/day in 2000, which is approximately 15% of the totalSoCAB NH3 inventory at year 2000. This value is smallercompared to the NH3 emission factor from Mansell and
Koizumi (19 ), 33.2 tons/day at 2000. Note that the futureNH3 emissioninventoryfrommobilesourcesshouldcontinueto decline, from 26.7 tons/day to 15.6 tons/day in SoCAB,due to the introduction of improved vehicle technology intothe fleet.
Oneelementthat is notincludedin the emissioninventory estimates in this work or in the current NH3 estimates forSoCAB (19 ) is start emissions. Although NH3 is not formedin vehicleexhaust until after catalyst light-off, slightlyhigherNH3 emissions during the period immediately following catalyst light-off during cold starts have been observed forsome vehicles (10 ). Start emissions were evaluated by Huaiet al. for a fleet of vehicles, including many of the samevehicles used in developing this model. FTP bag 1 cold startemissions ranged from 3 to 6 mg/mi for SULEVs, from 9 to
50 mg/mi for ULEVs, and from 1 to 62 mg/mi for LEVs (10 ).These emissions levels are comparable to those found fortheover-the-road testingdescribed in the proceeding section.FTP bag 3 hot start NH3 emissions were found to be nodifferent than emissions during fully warm, stabilized opera-tion. Overall, the effects of start emissions are not expectedto have a large impact on the inventory estimates in thisstudy, beyond the other limitations associated withworking with small data sets. It is suggested, however, that in thedevelopment of moresophisticated,full-scale NH3 emissionsinventory models consideration should be given to thecontribution of cold start emissions.
Discussion
In this study, both a VSP binning methodology and apiecewise linear regression were applied to develop the first VSP-based modeling framework for NH3. This methodgenerated a simplified NH3 module for each vehicle certi-fication category. On-road NH3 emission rates for SULEV,ULEV,and LEVvehicles were estimated based on actualreal- world driving combined with the modeling results. Theseestimated on-road NH3 emissions were 9.4( 4.1, 21.8( 5.2,and 34.9 ( 6.0 mg/mi, respectively, for SULEV, ULEV, andLEV vehicles. Finally, in conjunction with earlier work, theon-road NH3 emission rates for the SULEV, ULEV, and LEV vehicles were used to help understand the impact of newervehicles on the NH3 emissions inventory in the SoCAB area.These results show that as newer vehicles continue to enter
TABLE 5. Modeling Results of NH3 Emissions from Gasoline Vehicle in SoCAB
E PZEV
4 mg/miE SULEV
9.4 mg/miE ULEV
21.8 mg/miE LEV
34.9 mg/miE Early
97.6 mg/mi
year C 0 C 1 C 2 C 3 1 - C 0 - C 1 - C 2 - C 3
E AVE
(mg/mi)VMT per day
gasoline vehicles (106 mi)NH3 emissions
mobile sources (tons/day)
2000 0.0% 0.0% 1.5% 18.3% 80.2% 84.99 314.6 26.72005 3.2% 4.1% 5.0% 32.9% 54.8% 66.57 333.5 22.22010 21.2% 12.6% 4.6% 30.6% 31.0% 43.97 355.0 15.6
E AVE ) C 0E PZEV + C 1E SULEV + C 2E ULEV + C 3E LEV + (1 -C 0 - C 1 - C 2 - C 3)E Early
VOL. 39, NO. 24, 2005 / ENVIRONMENTAL SCIENCE & TECHNOLOGY 9 9599

8/3/2019 5.Vehicle Specific Power Approach to Estimating on-Road NH3 Emissions From Light-Duty Vehicles
http://slidepdf.com/reader/full/5vehicle-specific-power-approach-to-estimating-on-road-nh3-emissions-from 6/6
the fleet, there should be steady decline in NH3 emissioninventories, even when increasing VMT is accounted for.
This NH3 emission modulewas initially developedfor theLEV, ULEV, and SULEV vehicle/technology groups. Moredetailed data for older vehicle/technology groups will beneeded to expand the capabilities of the model to otherportions of the fleet. The piecewise linear regressions gavepromisingresults on thevehiclestestedso far, butadditionaltests will be necessary. The accuracy of NH3 emissions forspecificVSP bins will also improve asmore data aregathered, which would also improve the results for the binning
methodology. As discussed in a pervious study, rich air/fuelratios can also contribute higher NH3 emissions (10 ).Therefore, other factors, such as vehicle maintenance andmalfunctioning, should also be considered in future NH3
emission inventories.
AcknowledgmentsThe authors acknowledge the contribution and support of Dave Martis, Joseph Calhoun, Ross Rettig, Joe Gil, and Joe Valdez of the Vehicle Emissions Research Laboratory at CE-CERT who performed the emissions testing on the vehicles. Wethank theCoordinating ResearchCouncil (underContractE-60)and the U.S.Environmental ProtectionAgency for theirfinancial and technical support of this project.
Literature Cited(1) Koupal, J.;Michaels,H.; Cumberworth, M.;Bailey,C.; Brzezinski,
D. EPA’s Plan for MOVES: A Comprehensive Mobile SourceEmissionsModel. Proceedingsof the12th CRCOn-Road VehicleEmissions Workshop, San Diego, CA, April 15-17, 2002.
(2) Frey, H. C.; Unal, A. Recommended Strategy for On-BoardEmission Data Analysis and Collection forthe NewGenerationModel.Proceedingsof the12th CRCOn-Road VehicleEmissions
Workshop, San Diego, CA, April 15-17, 2002.(3) Barth, M.; An, F.; Younglove, T.; Scora, G.; Levine, C.; Ross, M.;
Wenzel, T. Development of a Comprehensive Modal Emissions Model ; Final Report by the University of California’s College of Engineering-Center for Environmental Research and Technol-ogy, Riverside, CA for the National Cooperative Highway Research Program under contract NCHRP 25-11, 2000.
(4) Rouphail, N. M.; Frey, H. C.; Colyar, J. D.; Unal, A. VehicleEmissions and Traffic Measures: Exploratory Analysis of FieldObservations at Signalized Arterials. Presented at the 80th
Annual Meeting of the Transportation Research Board, Wash-ington, DC, Jan, 2001.
(5) Bachman,W. H. A GIS-BasedModal Modelof AutomobileExhaust Emissions ; Final Report by the Civil and Environmental Engi-neering, Center for Geographic Information Systems, GeorgiaInstitute of Technology, Atlanta, Georgia for the U. S. Envi-ronmental Protection Agency, Air Pollution Prevention andControl Division under contract CR823020, 1998.
(6) Fraser,M. P.;Cass, G.R. Detection of excessammoniaemissionsfrom in-use vehicles and the implications for fine particlecontrol. Environ. Sci. Technol. 1998, 32 , 3535-3539.
(7) Kean, A. J.; Harley, R. A.; Littlejohn, D.; Kendall, G. R. On-roadmeasurement of ammonia and other motor vehicle exhaustemissions. Environ. Sci. Technol. 2000, 32 , 3535-3539.
(8) Baum, M. M.; Kiyomiya, E. S.; Kumar, S.; Lappas, A. M.; Lord,H. C., III. Multicomponent remote sensing of vehicle exhaustby dispersive absorption spectroscopy. 1. Effect of fuel typeand catalystperformance. Environ.Sci. Technol.2000, 34,2851-2858.
(9) Durbin, T. D.; Miller, J. W.; Pisano, J. T.; Sauer, C.; Rhee, S. H.;Huai, T.; Younglove, T. The Effect of sulfur and NH 3 and other Regulated Emissions from Late Model Vehicles ; Final Report forthe Coordinating Research Council Project E-60, by the Uni-versityof Californiaat Riverside’sBournsCollege ofEngineering s
Centerfor Environmental Researchand Technology,May, 2003.(10) Huai, T.; Durbin, T. D.; Miller, J. W.; Pisano, J. T.; Sauer, C. G.;
Rhee,S. H.;Norbeck,J. M. Investigationof NH3 emissions fromnew technology vehicles as a function of vehicle operating conditions. Environ. Sci. Technol. 2003, 37 (21), 4841-4847.
(11) Gertler, A. W.; Sagebiel, J. C.; Cahill, T. A. Measurements of Ammonia Emissions from Vehicles in a Highway Tunnel.Proceedings of the 11th CRC On-road Vehicle Emissions
Workshop, San Diego, CA, March 26-28, 2001.(12) Graham, L. Gaseous and Particulate Matter Emissions from In-
Use Light-duty Gasoline Motor Vehicles ; Report no. 99-67;Environment Canada, Environmental Technology Center, Emis-sions Research and Measurement Division: Canada, 1999.
(13) Jimenez-Palacios, J. L. Understanding and Quantifying Motor Vehicle Emissions with Vehicle Specific Power and TILDASRemote Sensing. Ph. D. Thesis, Massachusetts Institute of Technology, Cambridge, MA, 1999.
(14) Kitagawa, H.; Mibe, T.; Okamatsu, K.; Yasui, Y. L4-Engine Development for a Super Ultralow Emissions Vehicle ; SAETechnical Paper No. 2000-01-0887; 2000.
(15) Durbin, T. D.; Wilson, R. D.; Norbeck, J. M.; Miller, J. W.; Huai,T.; Rhee, S. Estimates of the emission rates of ammonia fromlight-duty vehicles using standard chassis dynamometer testcycles. Atmos. Environ. 2002, 36 , 1475-1482.
(16) Huai, T.; Durbin, T. D.; Rhee, S. H.; Miller, J. W.; Norbeck, J. M.The Impact of Gasoline Fuel Sulfur Levels on NH3 and N2OEmissions. Proceedings of the 12th CRC On-Road VehicleEmissions Workshop, San Diego, CA, April, 2002.
(17) Malcolm, C.; Younglove, T.; Barth, M.; Davis, N. Mobile sourceemissions: Analysis of spatial variability in vehicle activity patterns and vehicle fleet distributions. Transp. Res. Rec . 2003,No. 1842, 91-98.
(18) Chitjian, M.; Koizumi, J.; Botsford, C. W.; Mansell, G.; Winegar,E. Final1997 Gridded Ammonia Emission Inventory Update for the South Coast Air Basin; Final Report to the South Coast Air
Quality Management District under contract 99025, August,2000.(19) Mansell,G. E.;Koizumi,J. Development of an Updated Gridded
Ammonia Emission Inventory for the South Coast Air Basin;Prepared forthe South Coast AirQuality ManagementDistrict,Diamond Bar, CA 91765, 2000.
Received for review January 18, 2005. Revised manuscript received September 14, 2005. Accepted October 5, 2005.
ES050120C
9600 9 ENVIRONMENTAL SCIENCE & TECHNOLOGY / VOL. 39, NO. 24, 2005