estimating ecosystem functional features from intra-specific trait data
TRANSCRIPT

A new method for estimating functional components at taxon and community levels using intraspecific trait data �Cayetano Gu#érrez-‐Cánovas1,2, David Sánchez-‐Fernández2,
Josefa Velasco2, Andrés Millán2 & Núria Bonada4
1: 3: 4: 2:

Why a new method to estimate functional diversity? �
• Biodiversity is a mul?-‐facet concept
• Ecological studies tradi?onally focused on the taxonomic components
• Func?onal features related with environmental filtering, evolu#on and ecosystem func#oning
• Recent methodological advances allowed for calcula?ng func?onal components from mul?ple traits at community level

Key papers: Villéger et al. (2008) Ecology Laliberté & Legendre, (2010) Ecology Mouillot et al. (2013) Trends Eco Ev R packages: ade4, FD (dbFD), ca#,
Estimation of functional components: the mean-trait approach�
Why a new method to estimate functional diversity? �
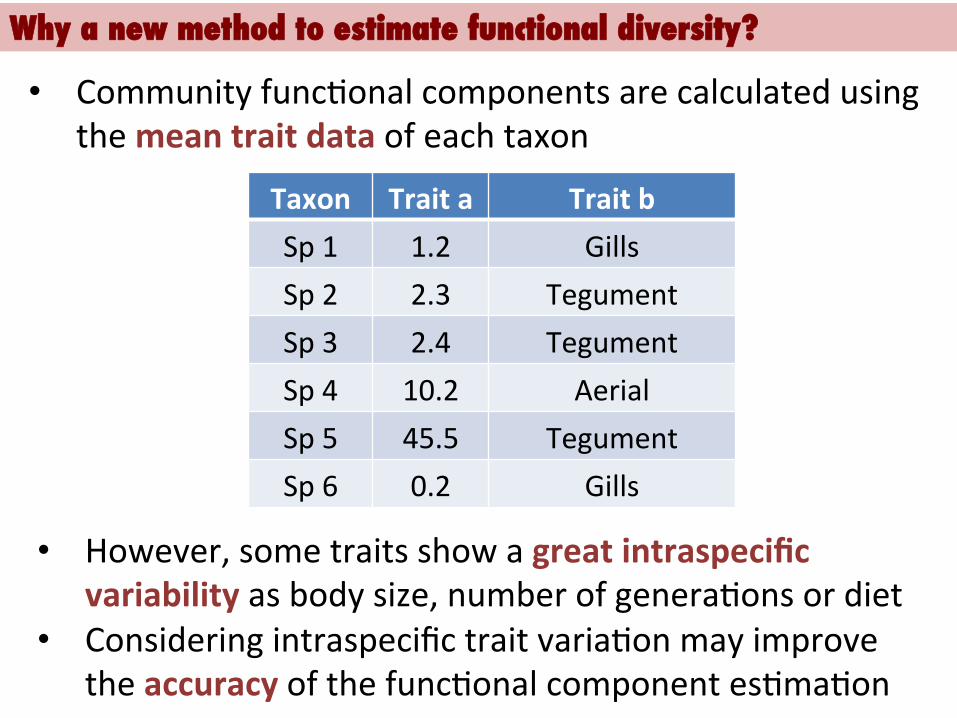
• Community func?onal components are calculated using the mean trait data of each taxon
Taxon Trait a Trait b Sp 1 1.2 Gills Sp 2 2.3 Tegument Sp 3 2.4 Tegument Sp 4 10.2 Aerial Sp 5 45.5 Tegument Sp 6 0.2 Gills
• However, some traits show a great intraspecific variability as body size, number of genera?ons or diet
• Considering intraspecific trait varia?on may improve the accuracy of the func?onal component es?ma?on

Taxon a1 a2 a3 a4 a5 a6 a7 b1 b2
G1 0.0 0.4 0.4 0.2 0.0 0.0 0.0 1.0 0.0
G2 0.0 0.0 0.0 0.0 0.4 0.4 0.2 0.0 1.0
G3 0.0 0.2 0.4 0.4 0.0 0.0 0.0 0.5 0.5
G4 0.2 0.2 0.2 0.2 0.2 0.0 0.0 0.5 0.5
G5 0.2 0.2 0.2 0.2 0.2 0.0 0.0 0.3 0.7
G6 0.2 0.2 0.2 0.2 0.2 0.0 0.0 0.1 0.9
Taxa x traits matrix (Fuzzy coding)
Rows: taxa (usually, genus of aquatic organisms) Columns: categories of biological traits a and b
Aquatic trait databases: �fuzzy coding data includes intraspecific variability�

Dimensionality reduc#on (PCA): building a Func#onal Space
Limita#ons: Taxon-‐level metrics Low-‐richness communi?es (< 3 taxa) Func?onal redundancy (poten?al informa?on loss)
Taxon 1 Taxon 2 Taxon 3 Taxon 4 Taxon 5 Taxon 6
Trait 1
Trait 2

Why a new method to estimate functional diversity? �
Goal: To develop a set of indexes able to work with fuzzy coding data to produce taxon and community level func?onal indexes based on intra-‐specific trait data
Addi#onal aims: • Showcase of new features • To compare the new method with popular approaches
based on mean-‐trait values

(a) building a Func#onal Space (PCA)
Taxon 1 Taxon 2 Taxon 3 Taxon 4 Taxon 5 Taxon 6
Trait category 1
Trait category 2
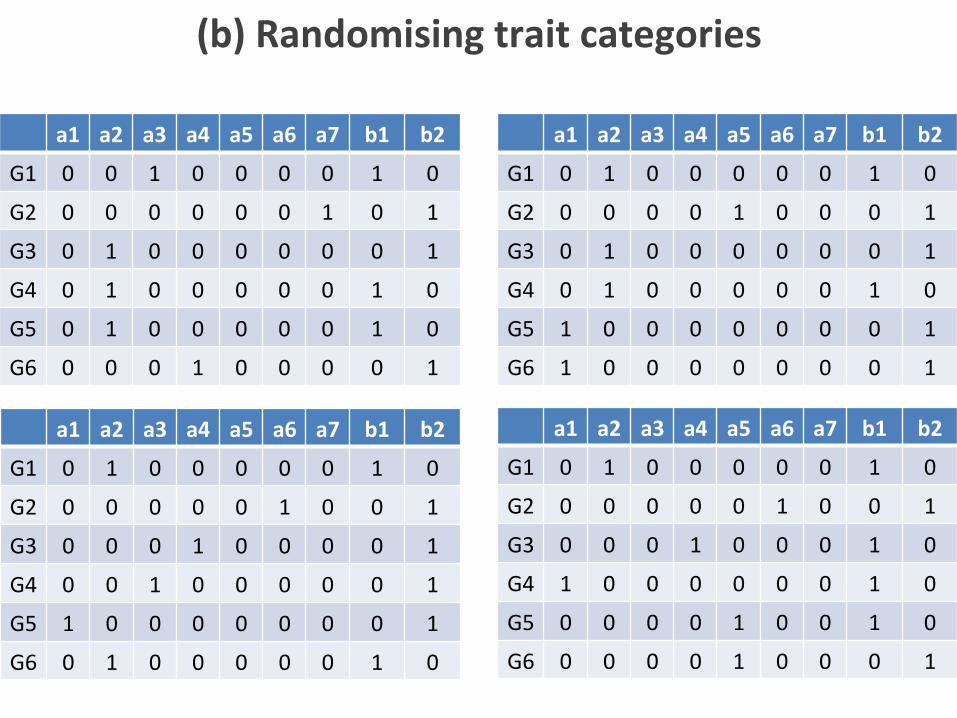
How? Performing a PCA on the raw fuzzy coded matrix to retain the relevant func?onal axis
a1 a2 a3 a4 a5 a6 a7 b1 b2
G1 0 0 1 0 0 0 0 1 0
G2 0 0 0 0 0 0 1 0 1
G3 0 1 0 0 0 0 0 0 1
G4 0 1 0 0 0 0 0 1 0
G5 0 1 0 0 0 0 0 1 0
G6 0 0 0 1 0 0 0 0 1
a1 a2 a3 a4 a5 a6 a7 b1 b2
G1 0 1 0 0 0 0 0 1 0
G2 0 0 0 0 0 1 0 0 1
G3 0 0 0 1 0 0 0 0 1
G4 0 0 1 0 0 0 0 0 1
G5 1 0 0 0 0 0 0 0 1
G6 0 1 0 0 0 0 0 1 0
a1 a2 a3 a4 a5 a6 a7 b1 b2
G1 0 1 0 0 0 0 0 1 0
G2 0 0 0 0 1 0 0 0 1
G3 0 1 0 0 0 0 0 0 1
G4 0 1 0 0 0 0 0 1 0
G5 1 0 0 0 0 0 0 0 1
G6 1 0 0 0 0 0 0 0 1
a1 a2 a3 a4 a5 a6 a7 b1 b2
G1 0 1 0 0 0 0 0 1 0
G2 0 0 0 0 0 1 0 0 1
G3 0 0 0 1 0 0 0 1 0
G4 1 0 0 0 0 0 0 1 0
G5 0 0 0 0 1 0 0 1 0
G6 0 0 0 0 1 0 0 0 1
(b) Randomising trait categories

(c) Projec#ng the randomised trait categories onto the func#onal space Taxon 1
Taxon 2 Taxon 3 Taxon 4 Taxon 5 Taxon 6
The clouds of points of each taxon represents the suite of poten#al func#onal variability based on the probability of each trait category to be present in a random individual belonging to that taxon

(d) Mean Taxon func#onal richness (tRic) Taxon 1 Taxon 2 Taxon 3 Taxon 4 Taxon 5 Taxon 6
f
e
d
c
a b
tRic =niche_ areai
i=a
n
∑n

Taxon 1 Taxon 2 Taxon 3 Taxon 4 Taxon 5 Taxon 6
c
ab
bc
FSim =
2×overlapping_ areaijniche_ areai + niche_ areaji=a, j=b
n
∑
number _of _ pairs
(e) Func#onal similarity (FSim)
b
a
d
cd

(f) Func#onal richness (FRic) Taxon 1 Taxon 2 Taxon 3 Taxon 4 Taxon 5 Taxon 6
Area filled by the convex hull

(g) Func#onal dispersion (FDis) Taxon 1 Taxon 2 Taxon 3 Taxon 4 Taxon 5 Taxon 6
FDis =dist(i, j )
i=a, j=b
n
∑
n
dist(x,y) = x − xc( )2 + y− yc( )2

(h) Func#onal redundancy (FR) Taxon 1 Taxon 2 Taxon 3 Taxon 4 Taxon 5 Taxon 6
c
a
b
FR = overlaping_ areaiji=a, j=b
n
∑

Func%ontal*axis*1*Func%o
ntal*axis*2
*
Func%ontal*axis*1*Func%o
ntal*axis*2
*
Func%ontal*axis*1*Func%o
ntal*axis*2
*
Func%ontal*axis*1*Func%o
ntal*axis*2
*
Func%ontal*axis*1*Func%o
ntal*axis*2
*
(d)$Taxon*func%onal*richness*
(e)$Func%onal*similarity*between*taxa*
(f)$Func%onal*richness*
(g)$Func%onal*dispersion*
(h)$Func%onal*redundancy*
Func%ontal*axis*1*Func%o
ntal*axis*2
*
Trait*categories*
0.2$c1$ c2$ c3$
0.8$ 0.0$T1$0.2$0.8$ 0.0$T2$0.3$0.3$ 0.4$T3$Ta
xa*
1$c1$ c2$ c3$
0$ 0$T1$0$ 1$ 0$T2$0$ 0$ 1$T3$
0$c1$ c2$ c3$
1$ 0$T1$0$ 1$ 0$T2$0$ 1$ 0$T3$
1$c1$ c2$ c3$
0$ 0$T1$0$ 1$ 0$T2$1$ 0$ 0$T3$
1$c1$ c2$ c3$
0$ 0$T1$1$ 0$ 0$T2$0$ 0$ 1$T3$
0$c1$ c2$ c3$
1$ 0$T1$0$ 1$ 0$T2$0$ 1$ 0$T3$
1$c1$ c2$ c3$
0$ 0$T1$1$ 0$ 0$T2$0$ 0$ 1$T3$
(a)$Defining*a*reduced*func%onal*
space*(PCA)*
(b)$Randomising*matrices*
(c)$Projec%ng*randomised*trait*combina%ons*into*func%onal*
space*

Let’s see some applications:�
Ecological niche drivers Do more func+onally generalised organisms occupy a wider ecological niche? Rela#onship between ecological and func#onal niche widths (Taxon func#onal richness) of stream invertebrates, based on intraspecific biological and ecological traits (Source: Tachet et al., 2002)

20 30 40 50
020
40
Bryozoa
Functional niche
Ecol
ogic
al n
iche
20 40 60 80 100
020
40
Turbellaria
Functional niche
Ecol
ogic
al n
iche
50 100 150
020
40
Oligochaeta
Functional niche
Ecol
ogic
al n
iche
40 80 120
020
40
Hirudinea
Functional niche
Ecol
ogic
al n
iche
50 100 150 200
020
40
Gastropoda
Functional niche
Ecol
ogic
al n
iche
50 100 150 200 250
020
40
Bivalvia
Functional niche
Ecol
ogic
al n
iche
40 60 80 100
020
40
Crustacea
Functional niche
Ecol
ogic
al n
iche
50 150 2500
2040
Ephemeroptera
Functional niche
Ecol
ogic
al n
iche
50 150 250
020
40
Plecoptera
Functional niche
Ecol
ogic
al n
iche
50 100 150 200
020
40
Odonata
Functional niche
Ecol
ogic
al n
iche
50 150 250
020
40
Heteroptera
Functional niche
Ecol
ogic
al n
iche
50 70 90
020
40
Lepidoptera
Functional nicheEc
olog
ical
nic
he
50 100 150 200 250
020
40
Coleoptera
Functional niche
Ecol
ogic
al n
iche
0 100 200 300
020
40
Trichoptera
Functional niche
Ecol
ogic
al n
iche
50 150 250
020
40Diptera
Functional niche
Ecol
ogic
al n
iche
R2=0.18
R2=0.41
R2=0.50
R2=0.18
R2=0.25 R2=0.20
Ecological and functional niche sizes �

Let’s see some applications:�
Community assembly Do organisms that share common biological features occupy similar ecological niches? Rela#onship between the rela#ve overlap in ecological and func#onal niches (Func#onal similarity) of stream invertebrates, based on intraspecific biological and ecological traits (Source: Tachet et al., 2002)

0.0 0.2 0.4 0.6
0.0
0.4
0.8
Bryozoa
Functional overlap
Ecol
ogic
al o
verla
p
0.0 0.2 0.4 0.6 0.8
0.0
0.4
0.8
Turbellaria
Functional overlap
Ecol
ogic
al o
verla
p
0.0 0.2 0.4 0.6 0.8
0.0
0.4
0.8
Oligochaeta
Functional overlap
Ecol
ogic
al o
verla
p
0.3 0.4 0.5 0.6 0.7 0.8
0.0
0.4
0.8
Hirudinea
Functional overlap
Ecol
ogic
al o
verla
p
0.0 0.2 0.4 0.6 0.8
0.0
0.4
0.8
Gastropoda
Functional overlap
Ecol
ogic
al o
verla
p
0.0 0.2 0.4 0.6
0.0
0.4
0.8
Bivalvia
Functional overlap
Ecol
ogic
al o
verla
p
0.0 0.2 0.4 0.6 0.8
0.0
0.4
0.8
Crustacea
Functional overlap
Ecol
ogic
al o
verla
p
0.0 0.2 0.4 0.6 0.8
0.0
0.4
0.8
Ephemeroptera
Functional overlap
Ecol
ogic
al o
verla
p
0.2 0.4 0.6 0.8
0.0
0.4
0.8
Plecoptera
Functional overlap
Ecol
ogic
al o
verla
p0.0 0.2 0.4 0.6 0.8
0.0
0.4
0.8
Odonata
Functional overlap
Ecol
ogic
al o
verla
p
0.0 0.2 0.4 0.6 0.8
0.0
0.4
0.8
Heteroptera
Functional overlap
Ecol
ogic
al o
verla
p
0.55 0.65 0.750.
00.
40.
8
Lepidoptera
Functional overlap
Ecol
ogic
al o
verla
p
0.0 0.2 0.4 0.6 0.8 1.0
0.0
0.4
0.8
Coleoptera
Functional overlap
Ecol
ogic
al o
verla
p
0.0 0.2 0.4 0.6 0.8
0.0
0.4
0.8
Trichoptera
Functional overlap
Ecol
ogic
al o
verla
p
0.0 0.2 0.4 0.6 0.8
0.0
0.4
0.8
Diptera
Functional overlap
Ecol
ogic
al o
verla
p
R2=0.27 R2=0.07
R2=0.04 R2=0.22
R2=0.20
R2=0.04 R2=0.12 R2=0.10
Pairwise ecological and functional niche overlap�

Let’s see some applications:�
Responses to environmental change Do community func+onal features show non-‐random responses along stress gradients?
Changes in the func#onal features of stream insects (EPT + OCH) along gradients of stress (salinity and land-‐use): Comparing intra-‐specific trait data vs mean-‐trait data

6 8 10 12
510
15F.
Ric
hnes
s
6 8 10 12
0.0
0.4
0.8
0 1 2 3 4
510
15
0 1 2 3 4
0.0
0.4
0.8
6 8 10 122.0
2.5
3.0
3.5
4.0
F. D
ispe
rsio
n
6 8 10 12
0.0
1.0
2.0
3.0
0 1 2 3 42.0
2.5
3.0
3.5
4.0
0 1 2 3 4
0.0
1.0
2.0
3.0
6 8 10 12
12
34
56
78
log(Conductivity)
log(
F. R
edun
danc
y)
6 8 10 12
1.0
1.5
2.0
2.5
log(Conductivity)0 1 2 3 4
12
34
56
78
log(Land−use intensity+1)0 1 2 3 4
1.0
1.5
2.0
2.5
log(Land−use intensity+1)
R2=0.65
R2=0.14
R2=0.29
R2=0.27 R2=0.53
R2=0.74
R2=0.17 R2=0.13
R2=0.15
R2=0.13
R2=0.17 R2=0.72
Salinity dbFD dbFD Novel method Novel method
Land use
β0 *** β1 ***
β0 *** β1 ***
β0 *** β1 ***
β0 *** β1 ***
β0 *** β1 ***
β0 *** Β1 ns
β0 *** β1 **
β0 *** β1 **
β0 * β1 **
β0 *** β1 ***
β0 *** β1 **
β0 *** Β1 ns

• The novel method provides additional features able to test fundamental ecological hypotheses
• Multiple functional axes (different responses / functions)
• The new method performed better in 4 out 6 comparisons (explained variance)
• Novel method showed a better performance against
null models (all cases vs. 4 out 6)
• This novel method may provide additional indexes in the same multidimensional space and a useful approach to analyse patterns of aquatic biodiversity
Conclusions �
