tbr 1q11 oracle initial response
DESCRIPTION
Technology Business Research is a different kind of research company. Our bottoms-up approach provides a look at the technology industry unlike anything you’ve seen before. We analyze company performance in professional services, networking and mobility, computing and hardware, and software on a quarterly basis, leveraging our data to create industry benchmarks and landscapes that provide a business perspective on leaders and laggards and their business plans. We are experts in the business of technology.TRANSCRIPT

Oracle
SOFTWARE BUSINESS QUARTERLYSM
1Q11 INITIAL RESPONSE
Publish Date: March 25, 2011
Author: Jessica Breen ([email protected]), SBQ Analyst
Content Editor: Stuart Williams, SBQ Practice Manager
First Calendar Quarter 2011
Third Fiscal Quarter 2011 Ended Feb. 28, 2011
TBR
T EC H N O LO G Y B U S I N ES S R ES EAR C H , I N C .

TBR
Oracle 1Q11 Initial Response | Software Business Quarterly ©2011 Technology Business Research, Inc. 2
Executive Summary
Oracle Objectives Become the leading provider of an integrated stack to provide complete IT solutions from hardware to applications
• Oracle maintains integration across its software pieces in database, middleware, applications and business intelligence. The company emphasized the value of its business intelligence portfolio during 1Q11 to show use cases that provided customers with insight.
• Sales and units shipped for Exadata and Exalogic grew 50% quarterly as Oracle realizes deals in its pipeline.
Add $1.5 billion in hardware operating profits in FY11, and $2 billion in FY12 – difficult to break out now
• Hardware sales reached $1.66 billion; however, Oracle missed the mark on its guidance for Hardware Systems Products by $100 million. Oracle is trading volume for margin.
• While the cost of selling hardware was upwards of 50% for Sun, Oracle pruned that cost to 46% of hardware sales in 1Q11. This is an indication that Oracle is realizing some gained efficiencies in hardware by focusing on driving high margins.
Take enterprise applications market share leadership away from SAP through the release of Java applications
• Oracle Fusion Applications will stimulate new revenue growth in license, maintenance and services with its full release in CY11; however, SAP’s release of in-memory computing applications will likely slow down the near 30% year-to-year growth rate in applications seen this quarter.
TBR Position • Oracle’s long-term strategy of building and
acquiring an integrated stack is succeeding across income and balance sheets and cash flow measures.
• The software-to-software integration accounts for the majority of the company’s success, and hardware-to-software integrations are beginning to make strong contributions.
The results don’t lie – Oracle’s big bet on an integrated stack is paying off
ORCL 1Q11 PERFORMANCE VS. EXPECTATIONS
(in $ millions) Consensus Guidance Range Actual
Revenue 8,400$ $ 8,450 - 8,700 8,764$
Operating Income N/A N/A 3,300$
Non-GAAP EPS $0.47 $0.48-$0.50 0.54$
ORCL 2Q11 GUIDANCE AND EXPECTATIONS
(in $ millions) TBR Estimate Consensus Guidance Range
Revenue 10,634$ 10,490$ $ 10,450 - 10,830
Operating Income 3,570$ N/A N/A
Non-GAAP EPS N/A $0.66 $0.69 - $0.73
TBR
Oracle 1Q11 Initial Response | Software Business Quarterly ©2011 Technology Business Research, Inc. 3
1
1
1
Key Developments
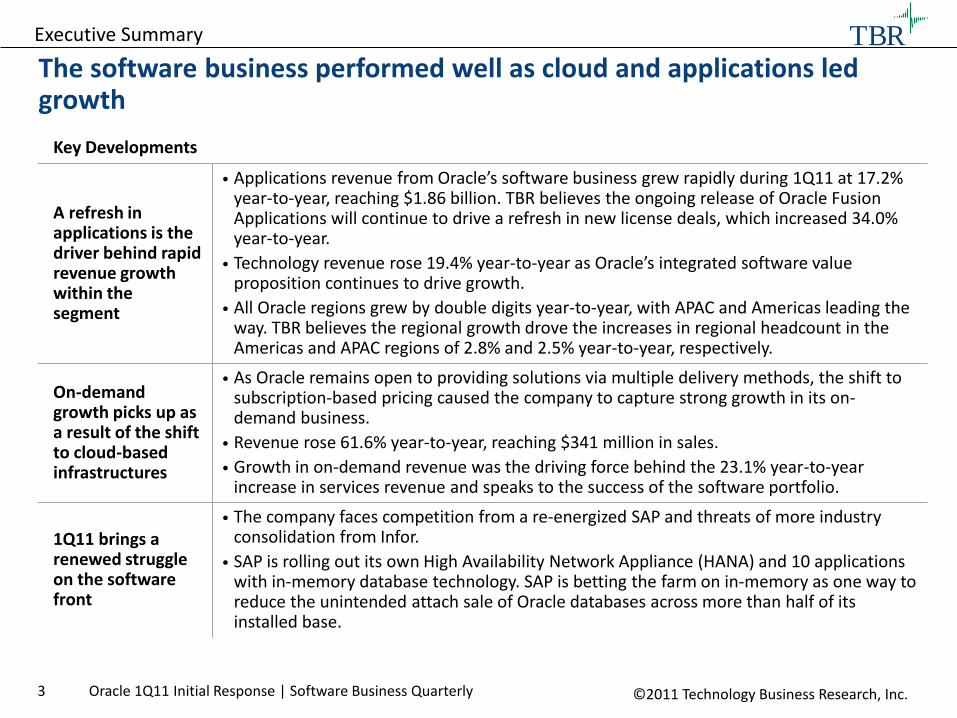
A refresh in applications is the driver behind rapid revenue growth within the segment
• Applications revenue from Oracle’s software business grew rapidly during 1Q11 at 17.2% year-to-year, reaching $1.86 billion. TBR believes the ongoing release of Oracle Fusion Applications will continue to drive a refresh in new license deals, which increased 34.0% year-to-year.
• Technology revenue rose 19.4% year-to-year as Oracle’s integrated software value proposition continues to drive growth.
• All Oracle regions grew by double digits year-to-year, with APAC and Americas leading the way. TBR believes the regional growth drove the increases in regional headcount in the Americas and APAC regions of 2.8% and 2.5% year-to-year, respectively.
On-demand growth picks up as a result of the shift to cloud-based infrastructures
• As Oracle remains open to providing solutions via multiple delivery methods, the shift to subscription-based pricing caused the company to capture strong growth in its on-demand business.
• Revenue rose 61.6% year-to-year, reaching $341 million in sales.
• Growth in on-demand revenue was the driving force behind the 23.1% year-to-year increase in services revenue and speaks to the success of the software portfolio.
1Q11 brings a renewed struggle on the software front
• The company faces competition from a re-energized SAP and threats of more industry consolidation from Infor.
• SAP is rolling out its own High Availability Network Appliance (HANA) and 10 applications with in-memory database technology. SAP is betting the farm on in-memory as one way to reduce the unintended attach sale of Oracle databases across more than half of its installed base.
Executive Summary
The software business performed well as cloud and applications led growth

TBR
Oracle 1Q11 Initial Response | Software Business Quarterly ©2011 Technology Business Research, Inc. 4
Key Developments
Oracle attacked HP’s Integrity server base by dropping support for Itanium
• TBR believes Oracle made a measured decision to discontinue development for Itanium processors to reduce a competitive threat to its SPARC-based hardware in the enterprise server and high-performance computing market.
• By reducing competition for its SPARC line of hardware, Oracle is trying to force HP and Intel to remain producers of lower-margin x86-based systems.
• The Itanium disruption will allow Oracle to gain hardware customers among its existing software subscribers on Integrity; however, the aggressive move will also enable competitor IBM to provide alternative options to customers who are unhappy with an all-Oracle solution.
Hardware comparisons from a year ago inflated growth
• The hardware business increased 263% year-to-year on one month of Sun revenue from $458 million in 1Q10 to $1,664 million in 1Q11. It was not all good news, however, as hardware systems products missed guidance by nearly $100 million, at $1,035 million.
• Oracle is attempting to replicate IBM’s success with fully-integrated, mission-critical solutions of hardware and software. Oracle’s model will lock customers into long-term, value-priced relationships, in which they will be willing to pay the premium for powerful solutions.
Oracle’s integrated stack strategy drives attach sales of software in addition to hardware growth
• Oracle’s integrated stack strategy led to business success during the quarter, as all business units grew in unison. Oracle’s ability to deliver hardware with its own software and add-on services contributed to organic revenue growth during the quarter.
• President Mark Hurd reported a 50% increase in sequential sales growth of Exadata and Exalogic units as adoption of the systems ramps up.
Executive Summary
Oracle plays hardball to drive its hardware business

TBR
Oracle 1Q11 Initial Response | Software Business Quarterly ©2011 Technology Business Research, Inc. 5
Executive Summary
Segment Revenue Performance and Strategies
Segment Financials
New License License revenue increased to $2.2 billion as a result of strong application growth on the year.
Maintenance
License Updates and Support revenue grew 36.9% year-to-year to $3.7 billion, as customer support attach and renewal rates remained at high levels.
Consulting Consulting revenue increased 18.6% year-to-year to $772 million, as consumer spending continued to rise.
On-Demand On-Demand revenue rose 61.6% year-to-year to $341 million following continued adoption of cloud offerings.
Education Education revenue grew 20.3% year-to-year to $83 million as new customers trained staff to use products.
Hardware Hardware revenue increased to $1.7 billion in 1Q11, driven by strong sales from the Exadata/Exalogic product line.
On-demand hybrid hosting, SaaS and managed services allow Oracle to sell more software by enabling flexible consumption
$1,718 $3,135 $1,286 $1,999 $2,214
$3,637
$3,297 $3,431
$3,450 $3,645 $3,740
$3,877
$931
$1,108 $1,068 $1,185 $1,146 $1,203
$458 $1,831 $1,698 $1,753 $1,664 $1,917
0%10%20%30%40%50%60%70%80%90%
100%
1Q10 2Q10 3Q10 4Q10 1Q11 2Q11 Est.
Perc
en
t of
To
tal R
eve
nue
ORACLE SEGMENT CONTRIBUTIONS
Hardware Product Consulting, On Demand, & Education
Maintenance New LicenseSOURCE: TBR AND ORACLE
TBR
21.2%
46.8%
13.1%
19.0%
0%
25%
50%
75%
2Q08 3Q08 4Q08 1Q09 2Q09 3Q09 4Q09 1Q10 2Q10 3Q10 4Q10 1Q11 2Q11Est.
Perc
en
t Ap
ps
Rev
enue
ORACLE PERCENT REVENUE BY SEGMENT
Applications Technology Services Hardware
TBR
SOURCE: TBR AND ORACLE
Sun

TBR
Oracle 1Q11 Initial Response | Software Business Quarterly ©2011 Technology Business Research, Inc. 6
Financial Model Strategy
Revenues • Services revenue growth continued in 1Q11, driven
by new license revenue growth in the quarter as well as continued success of hardware services from the Sun acquisition.
• License revenue increased 28.9% year-to-year, from $1.72 billion to $2.21 billion in 1Q11.
• Software updates and maintenance rose 13.4% year-to-year to $3.74 billion, or 42.7% of revenue.
Expenses • Cost of sales rose 41.8% year-to-year as a result of
low hardware and services gross margins. • S&M expenses increased 30.4% year-to-year as a
result of additional headcount and acquisitions. • G&A expenses rose 21.2% year-to-year as a result of
acquisitions in 1Q11. • R&D expenses increased 36.9 year-to-year as a result
of increased headcount through additional investment in R&D.
Margins • Gross profit increased 35.4% year-to-year, while
gross margin remained relatively flat, decreasing only 80 basis points year-to-year.
• Operating margin rose 530 basis point year-to-year, as Oracle continues to work out a profit-aware model for hardware.
-10%0%10%20%30%40%50%60%70%80%90%
-10.0%0.0%
10.0%20.0%30.0%40.0%50.0%60.0%70.0%80.0%90.0%
1Q09 2Q09 3Q09 4Q09 1Q10 2Q10 3Q10 4Q10 1Q11 2Q11Est.
Re
ven
ue
Gro
wth
Mar
gins
Calendar Quarter
ORACLE PROFITABILITY AND GROWTH
Gross Margin Operating Margin Net Margin Revenue Growth Year-to-Year
SOURCE: TBR AND ORACLE
TBR
18.5%
23.0%
3.3%
12.9%
0%
5%
10%
15%
20%
25%
30%
2Q08 3Q08 4Q08 1Q09 2Q09 3Q09 4Q09 1Q10 2Q10 3Q10 4Q10 1Q11 2Q11Est.
Perc
en
t of R
eve
nu
e
ORACLE PERCENT EXPENSE BY FUNCTION
COGS S&M G&A R&D
TBR
SOURCE: TBR AND ORACLE
Sun
Gross margins decreased slightly year-to-year on increased sales through a balance of hardware and software systems

TBR
Oracle 1Q11 Initial Response | Software Business Quarterly ©2011 Technology Business Research, Inc. 7
Go-to-Market & Product Strategies
• Oracle recently held a Business Intelligence (BI) forum to illustrate current market offerings and provide insight as to the future direction of BI development. Tobin Gilman, VP of BI and Enterprise Performance Management (EPM), gave an overview of Oracle’s market placement and developments in the product pipeline.
• As Oracle builds out its BI platform, the CRM and ERP offerings anchor to the BI network, allowing for highly integrated processing of data and management of information. The race to a mobile BI system is the focus of development at Oracle.
• The 2007 acquisition of Hyperion, a performance management system developer, allowed Oracle to build out its analytical application network, further expanding opportunities within the BI platform and complimentary system expansion.
• TBR believes the BI platform and resulting innovations will serve as an outlet for organic growth as the market recognizes a shift in highly integrated complete-system capabilities, and ultimately the opportunities made available via the mobile-processing revolution.
HW + SW Offerings
BI
Apps
MW
DB
OS
Consult
Premium
Base Support
Education
Services Offerings
Servers
Storage
Product Strategies
• Integrate BI capabilities across the portfolio to drive Finance and Operations
• Invest in new Fusion platforms while sustaining acquired applications platforms
• Acquire industry applications to add domain specialization and access new markets
• Leverage integrated hardware and software through product releases like the Exadata
• Drive a profit-aware hardware business to increase profitability
• Expand addressable markets in unstructured data and data warehousing
Service Strategies
• Enable, educate and facilitate partner delivery of services and solution customization to end-customers
• Leverage acquired expertise in applications, middleware and systems architecture to enable successful deployments and expansion of Oracle footprint in accounts
• Expand delivery options through On-Demand investments
• Deliver services and support directly to large end-users that require a direct relationship with Oracle On-demand
The future of BI technology at Oracle combines fully integrated operations with mobile convenience

TBR
Oracle 1Q11 Initial Response | Software Business Quarterly ©2011 Technology Business Research, Inc. 8
Go-to-Market & Product Strategies
Continued support for the Java community is imperative for Oracle to retain its developer community, in addition to gaining new developers in the widely-used language base to add a level of customization • Oracle announced the nomination of SouJava, a Java Users Group in Brazil, as its newest representative on the
committee of Java Community Process (JCP) executives. Gaining worldwide Java users will enable Oracle to expand customization of its applications by region to gain better global adoption.
• TBR believes the formation of a strong base for the Java development network is the key to creating a pool of developers. The development pool will have the ability to access enterprise-grade capabilities to enhance partner market capitalization.
• Oracle extended its partner network to incorporate the Java development network. The Oracle Partner Network (OPN) encompasses the partnerships of silver, gold, platinum and diamond tiered partners which provides levels of differentiation based on participation.
• Oracle also provides resources for Java developers, like developer links, blogs, new technologies and downloads, within the Oracle Technology Network. The additional support enables Oracle to sustain its developer pool and attract new members.
Oracle 1Q11 Revenue Mix By Segment
Services $1.15 billion
Applications $1.86 billion
Databases & Middleware
$4.10 billion
Hardware $1.66 billion
21%
13%
19%
47%
Indirect Sales Strategies
• Leverage partners to provide sales coverage across a large global base; reuse field enablement, support and training material made for the direct sales force
• Support partners with development tools, templates, marketing resources, development funds and training/certification
• Manage partners and distributors on territories and joint engagements
Direct Sales Strategies
• Target largest accounts directly to expand Oracle footprint and wallet share
• Provide a higher level of services to the top 1,000 accounts to drive higher margins and increase customer satisfaction
• Sustain customer contact and control of accounts by handling support contract renewals directly
Oracle will sustain the preeminence of Java by investing in the technology and its communities and partners

TBR
Oracle 1Q11 Initial Response | Software Business Quarterly ©2011 Technology Business Research, Inc. 9
Resource Management Strategy
Investments • In February, Oracle announced its acquisition of a branch
of nDevr, an Australia-based environmental reporting software company. The intellectual property will enable Oracle to create greenhouse gas emission solutions.
• Oracle completed the acquisition of ATG; the acquisition will fuel Oracle’s ability to target e-commerce customers to expand its presence in the retail industry.
Strategy
• Oracle intends to restructure headcount distribution to increase areas like Sales & Marketing to penetrate deeper into top 100 accounts. President Mark Hurd reported an addition of 1,500 sales resources in 1Q11, and indicated more will need to be added to support Oracle’s growth.
• Headcount increased substantially by 1,380 year-to-year, as Oracle added headcount across all business functions to support growth after integrating and reorganizing Sun personnel.
Executive Changes
Christian Smith was hired as the Vice President of Sales. He was formerly VP of Worldwide Sales, Optimized Services from the acquired company, Art Technology Group (ATG).
$3,284 $4,509
$2,167
$2,815 $953
$1,440
$0
$2,000
$4,000
$6,000
$8,000
$10,000
1Q10 1Q11
In $
Mil
lio
ns
ORACLE REVENUE BY REGION
Asia-Pacific
EMEA
Americas
SOURCE: ORACLE
TBR
44,554 45,825
38,372 39,340
23,566 22,705
0
20,000
40,000
60,000
80,000
100,000
120,000
1Q10 1Q11
Tota
l Hea
dco
un
t
Ca lendar Quarter
ORACLE HEADCOUNT BY REGION
EMEA
APAC
Americas
TBR
SOURCE: ORACLE
TBR
SOURCE: ORACLE
Business success across all product lines resulted in Oracle scaling up headcount during the quarter

TBR
Oracle 1Q11 Initial Response | Software Business Quarterly ©2011 Technology Business Research, Inc. 10
Income Statement ORACLE CORP.
Consolidated Statement of Income
(in $ Thousands Except Share Data)
CALENDAR QUARTER 1Q10 2Q10 3Q10 4Q10 1Q11 2Q11 Est.
FISCAL QUARTER F3Q10 F4Q10 F1Q11 F2Q11 F3Q11 F4Q11
Net Sales 6,404,000$ 9,505,000$ 7,502,000$ 8,582,000$ 8,764,000$ 10,634,000$
Cost of Sales 1,419,000 2,242,000 2,062,000 2,157,000 2,012,000 2,620,000
Gross Profit 4,985,000$ 7,263,000$ 5,440,000$ 6,425,000$ 6,752,000$ 8,014,000$
Sales and Marketing 1,241,000 1,745,000 1,333,000 1,530,000 1,618,000 1,989,000
General and Administrative 236,000 293,000 272,000 156,000 286,000 351,000
Research and Development 823,000 1,063,000 1,103,000 1,119,000 1,127,000 1,382,000
Amort. of Intangible Assets 502,000 605,000 603,000 614,000 612,000 610,000
Other Expenses (Acq. & Restruc.) 340,000 257,000 212,000 236,000 122,000 112,000
Operating Income 1,843,000$ 3,300,000$ 1,917,000$ 2,770,000$ 2,987,000$ 3,570,000$
Other, Net (261,000) (225,000) (122,000) (124,000) (188,000) (200,000)
EBIT 1,582,000$ 3,075,000$ 1,795,000$ 2,646,000$ 2,799,000$ 3,370,000$
Provision for Income Taxes 393,000 711,000 443,000 776,000 683,000 800,000
Net Income 1,189,000$ 2,364,000$ 1,352,000$ 1,870,000$ 2,116,000$ 2,570,000$
Net Income per Share 0.23$ 0.46$ 0.27$ 0.37$ 0.41$ 0.50$
Shares Outstanding 5,076,000 5,090,000 5,083,000 5,117,000 5,149,000 5,149,000
AS A PERCENTAGE OF REVENUE
Net Sales 100.0% 100.0% 100.0% 100.0% 100.0% 100.0%
Cost of Sales 22.2% 23.6% 27.5% 25.1% 23.0% 24.6%
Gross Margin 77.8% 76.4% 72.5% 74.9% 77.0% 75.4%
Sales & Marketing 19.4% 18.4% 17.8% 17.8% 18.5% 18.7%
General & Administrative 3.7% 3.1% 3.6% 1.8% 3.3% 3.3%
SG&A 23.1% 21.4% 21.4% 19.6% 21.7% 22.0%
R&D 12.9% 11.2% 14.7% 13.0% 12.9% 13.0%
Operating Margin 28.8% 34.7% 25.6% 32.3% 34.1% 33.6%
Other, Net -4.1% -2.4% -1.6% -1.4% -2.1% -1.9%
EBITD 24.7% 32.4% 23.9% 30.8% 31.9% 31.7%
Income Taxes 6.1% 7.5% 5.9% 9.0% 7.8% 7.5%
Net Margin 18.6% 24.9% 18.0% 21.8% 24.1% 24.2%
YEAR-TO-YEAR CHANGE
Net Sales 17.4% 38.5% 48.4% 46.5% 36.9% 11.9%
Cost of Sales 27.7% 90.2% 104.6% 96.8% 41.8% 16.9%
Gross Profit 14.8% 27.8% 34.5% 34.9% 35.4% 10.3%
Sales and Marketing 17.7% 31.6% 38.9% 35.0% 30.4% 49.2%
General and Administrative 22.9% 36.9% 35.3% -14.8% 21.2% 29.0%
SG&A 18.5% 32.3% 38.2% 28.1% 28.9% 14.8%
R&D 21.6% 45.4% 67.1% 58.1% 36.9% 30.0%
Operating Income -5.0% 14.4% 10.2% 27.2% 62.1% 8.2%
Other, Net 100.8% 73.1% -31.5% -20.0% -28.0% -11.1%
EBITD -12.6% 11.7% 14.9% 30.8% 76.9% 9.6%
Income Taxes -18.3% -17.6% 1.1% 37.3% 73.8% 12.5%
Net Income -10.5% 25.0% 20.3% 28.3% 78.0% 8.7%
SOURCE: ORACLE AND TBR ESTIMATES
TBR

TBR
Oracle 1Q11 Initial Response | Software Business Quarterly ©2011 Technology Business Research, Inc. 11
Balance Sheet ORACLE CORP.
Consolidated Balance Sheets
(in $ Thousands)
CALENDAR QUARTER 1Q10 2Q10 3Q10 4Q10 1Q11
FISCAL QUARTER F3Q10 F4Q10 F1Q11 F2Q11 F3Q11
ASSETS
Current Assets
Cash and cash equivalents 9,331,000$ 9,914,000$ 12,018,000$ 10,420,000$ 11,864,000$
Marketable securities 8,158,000$ 8,555,000$ 11,619,000$ 14,425,000$ 12,491,000$
Accounts Receivable - Net 3,898,000 5,585,000 3,721,000 4,406,000 4,495,000
Deferred Tax Assets 978,000 1,159,000 1,142,000 1,219,000 1,193,000
Other 1,299,000 1,532,000 1,529,000 2,017,000 2,140,000
Total Current Assets 23,979,000 27,004,000 30,264,000 32,723,000 32,459,000
Long-term Cash Investments - - - - -
Property, Plant, Equip. (Net of Dep.) 2,869,000 2,763,000 2,835,000 2,870,000 2,894,000
Goodwill and Intangible Assets 30,283,000 29,746,000 30,025,000 29,415,000 29,749,000
Other, Net 2,255,000 2,065,000 2,131,000 2,235,000 2,564,000
Total Assets 59,386,000$ 61,578,000$ 65,255,000$ 67,243,000$ 67,666,000$
LIABILITIES AND EQUITY
Current Liabilities
Short Term Borrowings 4,220,000$ 3,145,000$ 2,260,000$ 2,255,000$ -$
Accounts Payable 616,000$ 775,000$ 706,000$ 762,000$ 673,000$
Income Taxes Payable - - - - -
Customer Advances and Unearned Rev. 5,389,000 5,900,000 6,903,000 5,742,000 5,849,000
Other 4,026,000 4,871,000 3,931,000 4,577,000 4,760,000
Total Current Liabilities 14,251,000 14,691,000 13,800,000 13,336,000 11,282,000
Long-term Debt 11,498,000 11,510,000 14,778,000 14,780,000 14,752,000
Long-term Liabilities 1,172,000 1,059,000 1,137,000 1,136,000 3,078,000
Deferred Income Taxes 3,275,000 2,695,000 2,679,000 2,791,000 1,145,000
Deferred Tax Liabilities 339,000 424,000 349,000 350,000 350,000
Total Liabilities 30,535,000 30,379,000 32,743,000 32,393,000 30,607,000
Total Stockholders' Equity 28,851,000 31,199,000 32,512,000 34,850,000 37,059,000
Total Liabilities & Equity 59,386,000$ 61,578,000$ 65,255,000$ 67,243,000$ 67,666,000$
FINANCIAL RATIOS
Day Sales Outstanding 54.8 52.9 44.6 46.2 46.2
Fixed Asset Turnover 10.6 13.5 10.7 12.0 12.2
Days Cash Outstanding 246 175 284 261 250
Total Asset Turnover 0.45 0.63 0.47 0.52 0.52
Debt/Asset Ratio 0.51 0.49 0.50 0.48 0.45
Current Ratio 1.68 1.84 2.19 2.45 2.88
Return on Assets 10.9% 11.1% 10.9% 11.0% 12.0%
Return on Equity 21.5% 22.0% 21.6% 21.8% 23.4%
Annual Revenue Per Employee $284,053 $293,976 $301,835 $312,357 $261,181
Number of Employees 106,492 104,569 105,236 105,730 107,870
SOURCE: ORACLE AND TBR
TBR

About Us Technology Business Research is a leading independent technology market research and consulting firm specializing in the business and financial analyses of hardware, software, networking equipment, wireless, portal and professional services vendors. Serving a global clientele, TBR provides timely and accurate market research and business intelligence in formats that are tailored to clients’ needs. Our analysts are available to further address client-specific issues or information needs on an inquiry or proprietary consulting basis. TBR has been empowering corporate decision makers since 1996. To learn how our analysts can address your unique business needs, please visit our website or contact us today.
Contact Us
1.603.929.1166 [email protected] www.tbri.com 11 Merrill Drive Hampton, NH 03842 USA
TBR
T EC H N O LO G Y B U S I N ES S R ES EAR C H , I N C .
This report is based on information made available to the public by the vendor and other public sources. No representation is made that this information is accurate or complete. Technology Business Research will not be held liable or responsible for any decisions that are made based on this information. This report is not a recommendation to purchase securities. This report is copyright-protected and supplied for the sole use of the recipient. Contact Technology Business Research, Inc. for permission to reproduce.