apresentação 1q11 en
TRANSCRIPT
11
Resultados do 4T10
EARNINGS RESULTS
1Q11
2
Disclaimer
This presentation contains statements that are forward-looking within the meaning of Section 27A of the Securities Act of 1933 and Section 21E of the Securities Exchange Act of 1934. Such forward-looking statements are only predictions and are not guarantees of future performance. Investors are cautioned that any such forward-looking statements are and will be, as the case may be, subject to many risks, uncertainties and factors relating to the operations and business environments of General Shopping and its subsidiaries that may cause the actual results of the companies to be materially different from any future results expressed or implied in such forward-looking statements.
This material is published solely for informational purposes and is not to be construed as a solicitation or an offer to buy or sell any securities or related financial instruments and should not be treated as giving investment advice. It is not targeted to the specific investment objectives, financial situation or particular needs of any recipient. No representation or warranty, either express or implied, is provided in relation to the accuracy, completeness or reliability of the information contained herein. This material should not be regarded by recipients as a substitute for the exercise of their own judgment.
Any opinions expressed in this material are expressed as of this date and subject to change without notice and General Shopping is not under the obligation to update or keep current the information contained herein. General Shopping and the respective affiliates, directors, partners and employees accept no liability whatsoever for any loss or damage of any kind arising out of the use of all or any part of this material. You should consult with your own legal, regulatory, tax, business, investment, financial and accounting advisers to the extent that you deem it necessary, and make your own investment, hedging and trading decision (including decisions regarding the suitability of this transaction) based upon your own judgment and advice from such advisers as you deem necessary and not upon any views expressed in this material.
3
Agenda
Company Overview
Financial Performance
4Desempenho FinanceiroFinancial Performance
5
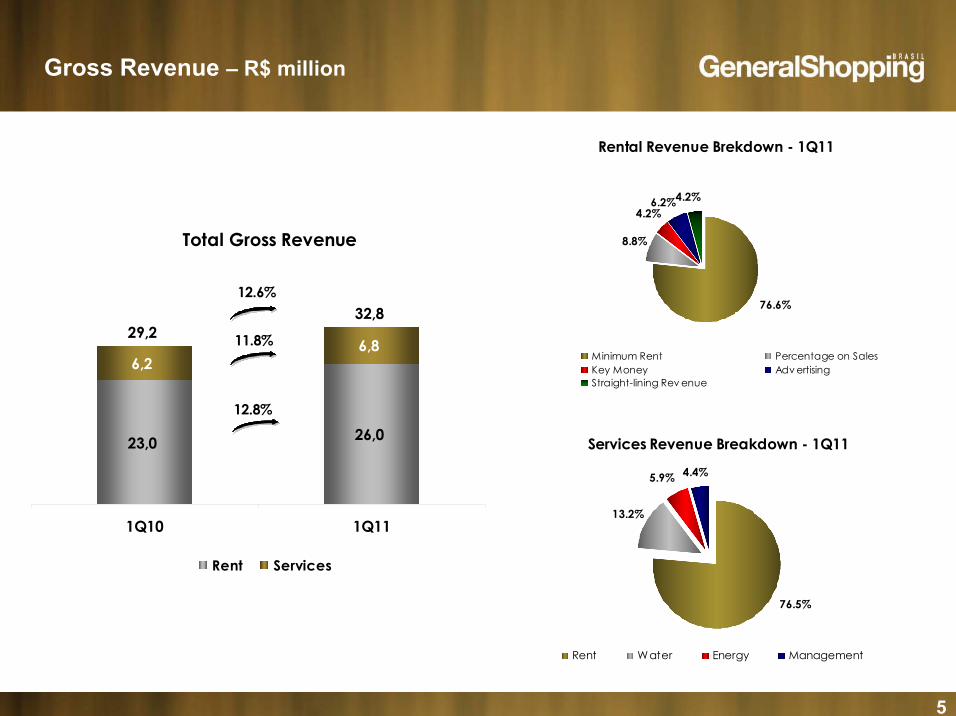
Gross Revenue – R$ million
Total Gross Revenue
6,26,8
29,232,8
26,023,0
1Q10 1Q11
Rent Services
12.6%
12.8%
11.8%
Rental Revenue Brekdown - 1Q11
8.8%
4.2%6.2%4.2%
76.6%
Minimum Rent Percentage on SalesKey Money Adv ertisingStraight-lining Rev enue
Services Revenue Breakdown - 1Q11
13.2%
5.9% 4.4%
76.5%
Rent Water Energy Management
6
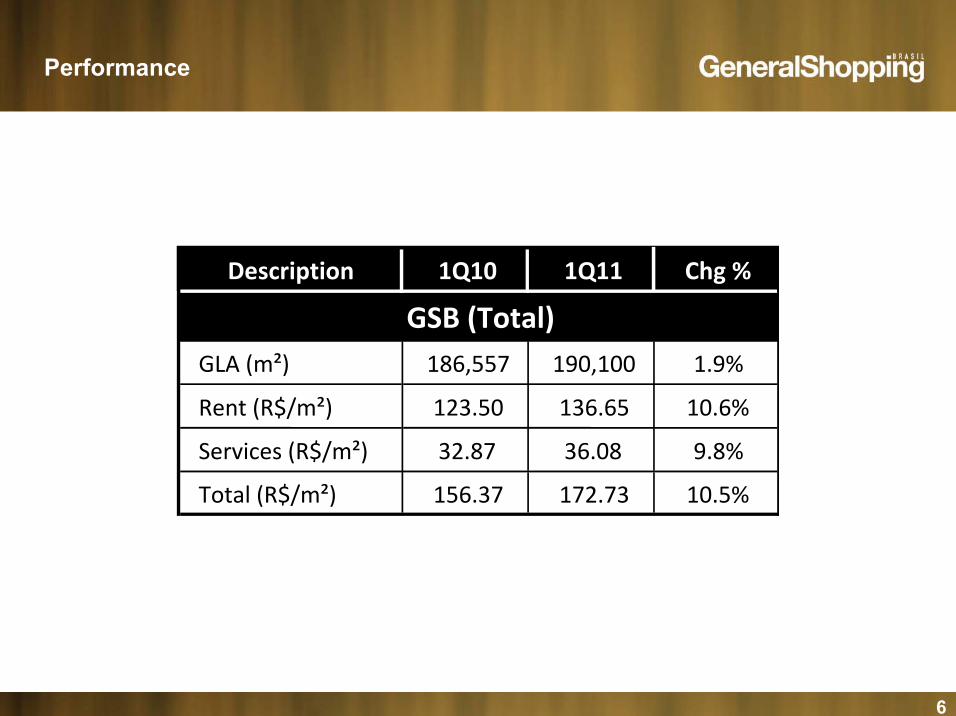
Performance
Description 1Q10 1Q11 Chg %
GSB (Total)GLA (m²) 186,557 190,100 1.9%
Rent (R$/m²) 123.50 136.65 10.6%
Services (R$/m²) 32.87 36.08 9.8%
Total (R$/m²) 156.37 172.73 10.5%
7
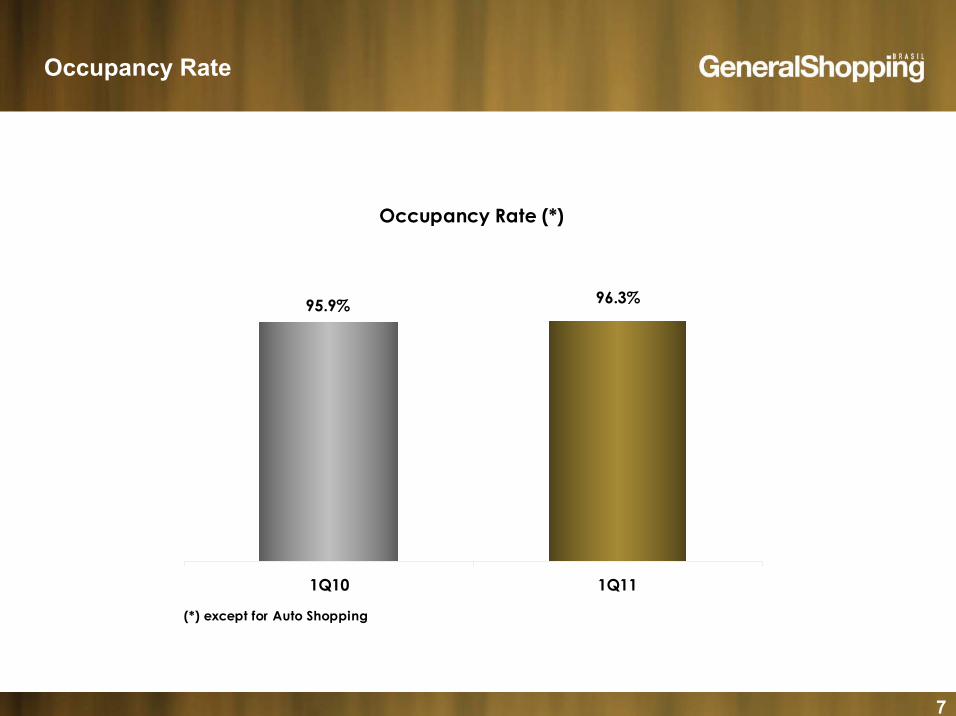
Occupancy Rate
Occupancy Rate (*)
96.3%95.9%
1Q10 1Q11
(*) except for Auto Shopping
8
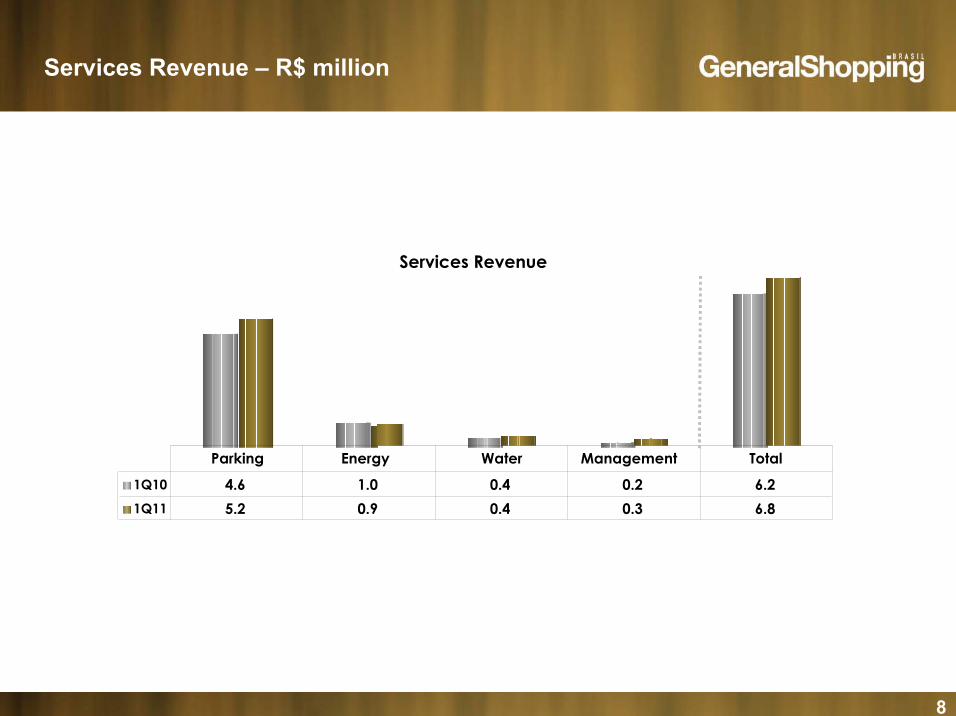
Services Revenue – R$ million
Services Revenue
1Q10 4.6 1.0 0.4 0.2 6.2 1Q11 5.2 0.9 0.4 0.3 6.8
Parking Energy Water Management Total
9
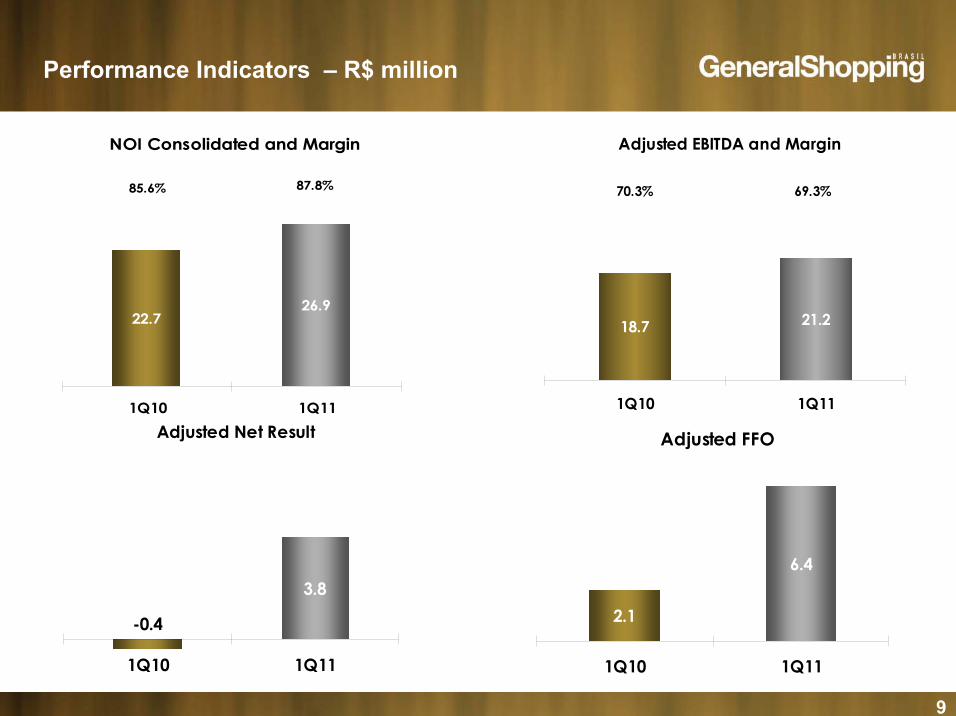
NOI Consolidated and Margin
22.726.9
85.6% 87.8%
1Q10 1Q11
Adjusted EBITDA and Margin
18.7 21.2
70.3% 69.3%
1Q10 1Q11
Adjusted Net Result
3.8
-0.4
1Q10 1Q11
Adjusted FFO
2.1
6.4
1Q10 1Q11
Performance Indicators – R$ million
10
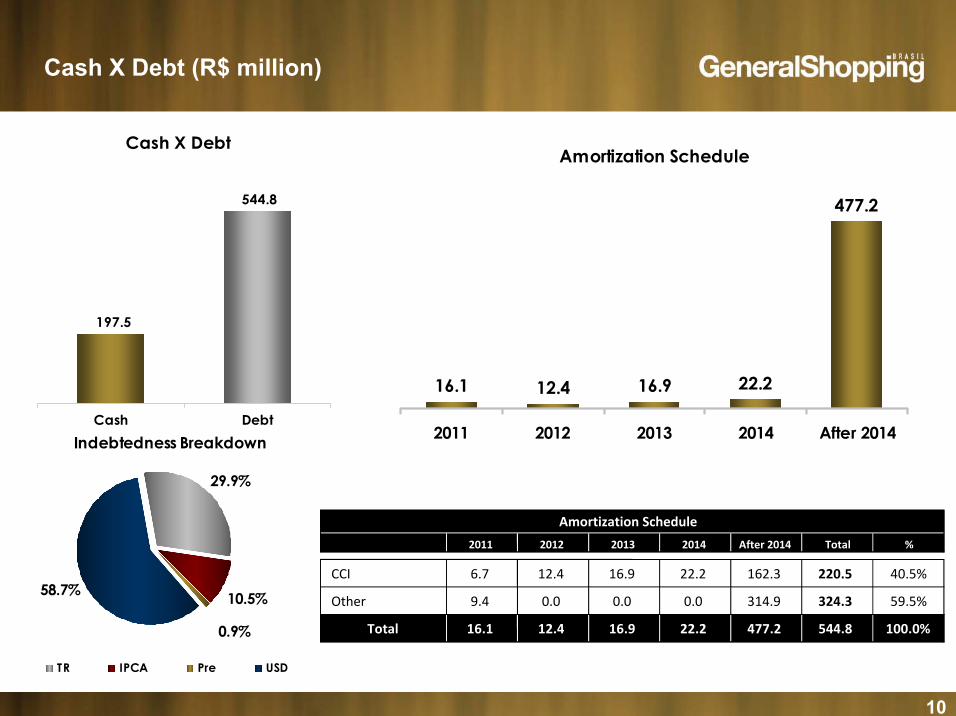
Amortization Schedule
16.1 12.4 16.9 22.2
477.2
2011 2012 2013 2014 After 2014Indebtedness Breakdown
29.9%
58.7%
0.9%
10.5%
TR IPCA Pre USD
Cash X Debt
197.5
544.8
Cash Debt
Cash X Debt (R$ million)
Amortization Schedule
R$ Million 2011 2012 2013 2014 After 2014 Total %
CCI 6.7 12.4 16.9 22.2 162.3 220.5 40.5%
Other 9.4 0.0 0.0 0.0 314.9 324.3 59.5%
Total 16.1 12.4 16.9 22.2 477.2 544.8 100.0%

11Visão Geral da GSBCompany Overview
12
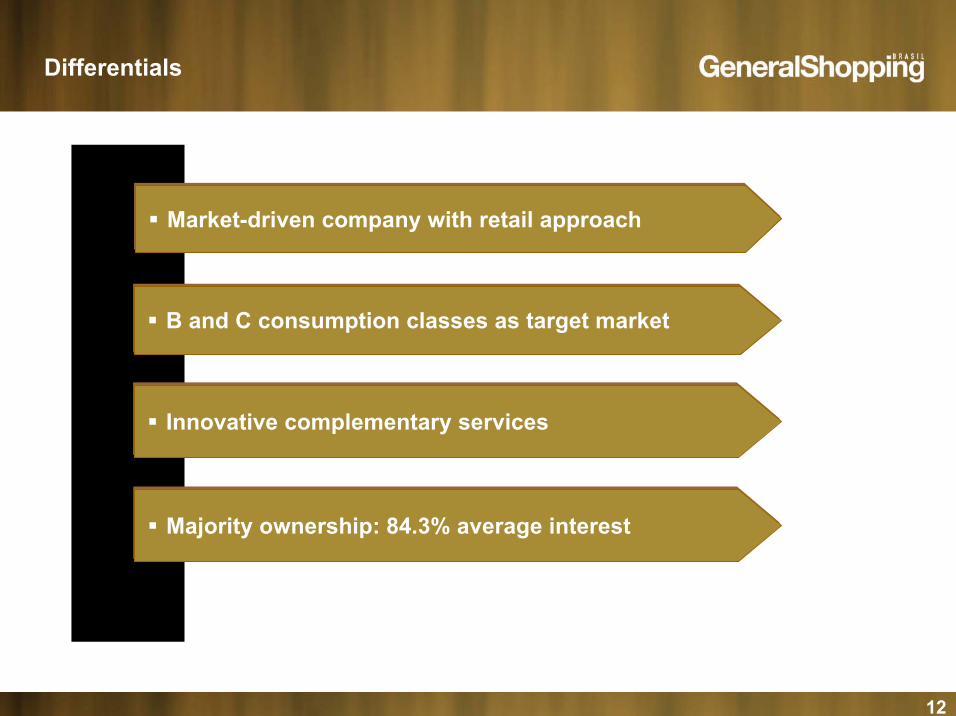
Differentials
Market-driven company with retail approachMarket-driven company with retail approach
B and C consumption classes as target marketB and C consumption classes as target market
Innovative complementary servicesInnovative complementary services
Majority ownership: 84.3% average interestMajority ownership: 84.3% average interest
13
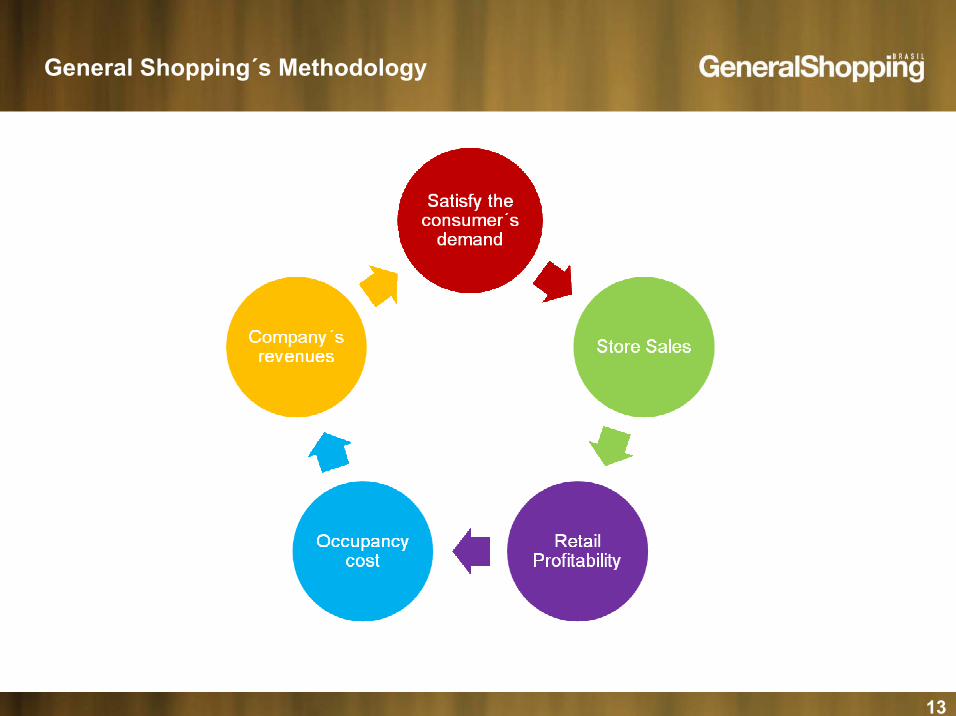
General Shopping´s Methodology
14
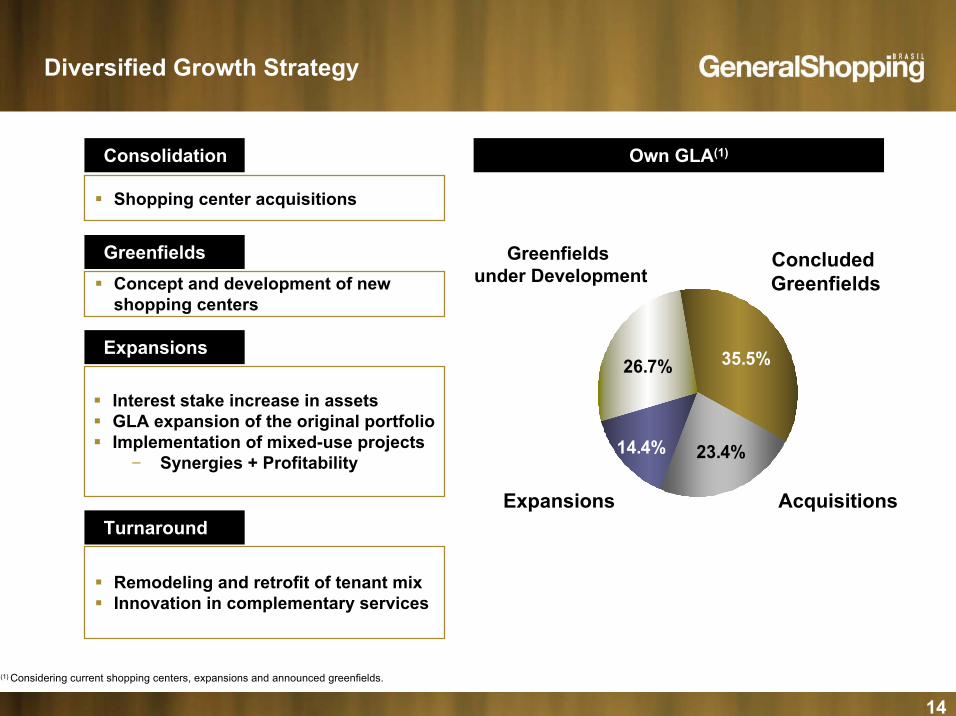
Diversified Growth Strategy
Own GLA(1)
Concluded Greenfields
AcquisitionsExpansions
Greenfieldsunder Development
Consolidation
Shopping center acquisitions
GreenfieldsConcept and development of new shopping centers
Expansions
Interest stake increase in assetsGLA expansion of the original portfolioImplementation of mixed-use projects
− Synergies + Profitability
Turnaround
Remodeling and retrofit of tenant mixInnovation in complementary services
(1) Considering current shopping centers, expansions and announced greenfields.
35.5%
23.4%14.4%
26.7%
15
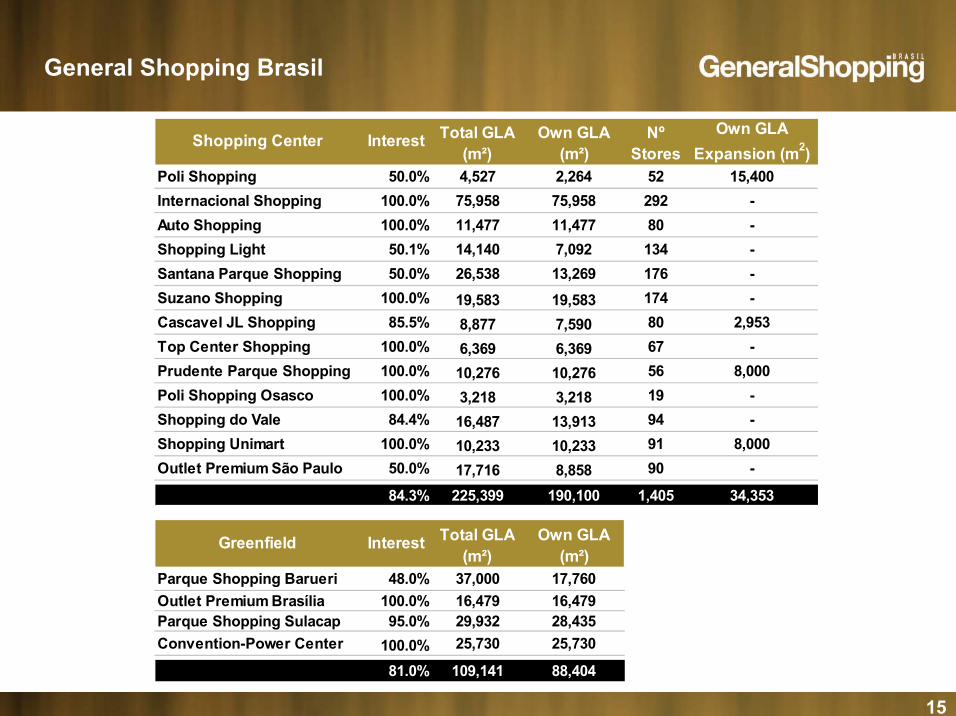
General Shopping Brasil
Poli Shopping 50.0% 4,527 2,264 52 15,400Internacional Shopping 100.0% 75,958 75,958 292 -Auto Shopping 100.0% 11,477 11,477 80 -Shopping Light 50.1% 14,140 7,092 134 -Santana Parque Shopping 50.0% 26,538 13,269 176 -Suzano Shopping 100.0% 19,583 19,583 174 -Cascavel JL Shopping 85.5% 8,877 7,590 80 2,953Top Center Shopping 100.0% 6,369 6,369 67 -Prudente Parque Shopping 100.0% 10,276 10,276 56 8,000Poli Shopping Osasco 100.0% 3,218 3,218 19 -Shopping do Vale 84.4% 16,487 13,913 94 -Shopping Unimart 100.0% 10,233 10,233 91 8,000Outlet Premium São Paulo 50.0% 17,716 8,858 90 -
84.3% 225,399 190,100 1,405 34,353
Parque Shopping Barueri 48.0% 37,000 17,760Outlet Premium Brasília 100.0% 16,479 16,479Parque Shopping Sulacap 95.0% 29,932 28,435Convention-Power Center 100.0% 25,730 25,730
81.0% 109,141 88,404
Own GLA Expansion (m2)
Shopping Center Interest Nº Stores
Total GLA (m²)
Own GLA(m²)
Greenfield Interest Total GLA (m²)
Own GLA(m²)
16
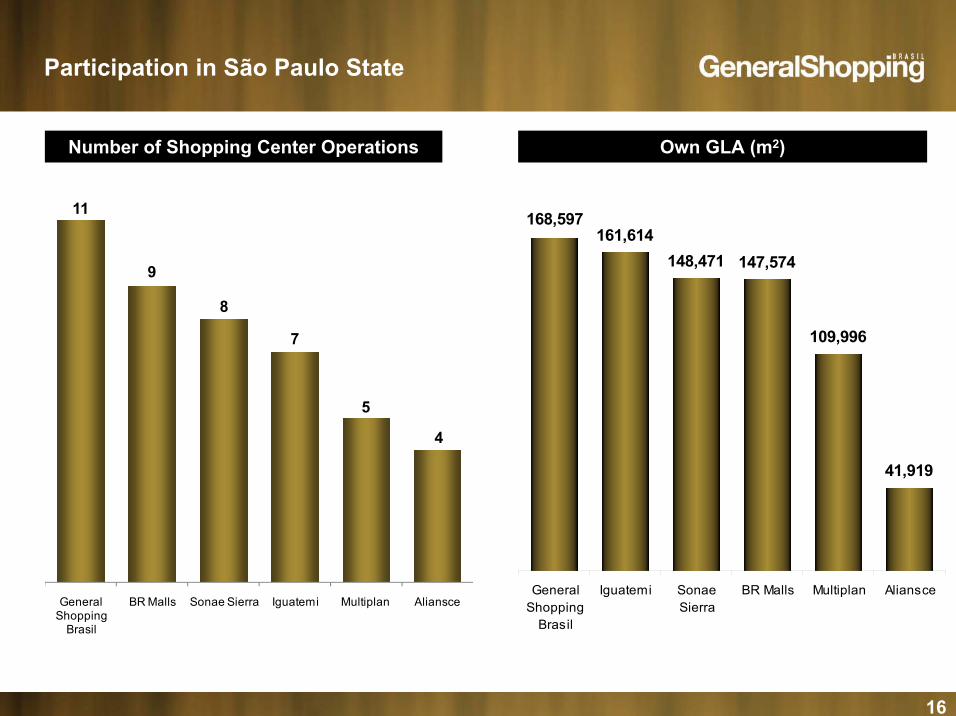
Participation in São Paulo State
11
9
8
7
5
4
General Shopping
Brasil
BR Malls Sonae Sierra Iguatemi Multiplan Aliansce
Number of Shopping Center Operations Own GLA (m2)
161,614148,471 147,574
109,996
41,919
168,597
GeneralShopping
Brasil
Iguatemi SonaeSierra
BR Malls Multiplan Aliansce
17
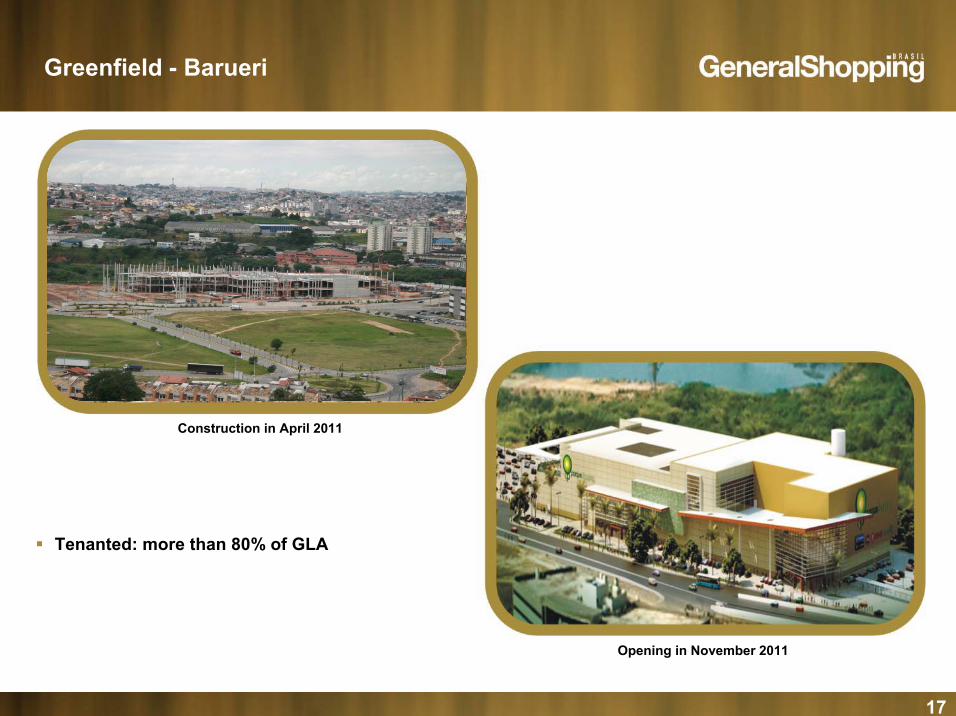
Greenfield - Barueri
Construction in April 2011
Opening in November 2011
Tenanted: more than 80% of GLA
18
Greenfield - Sulacap
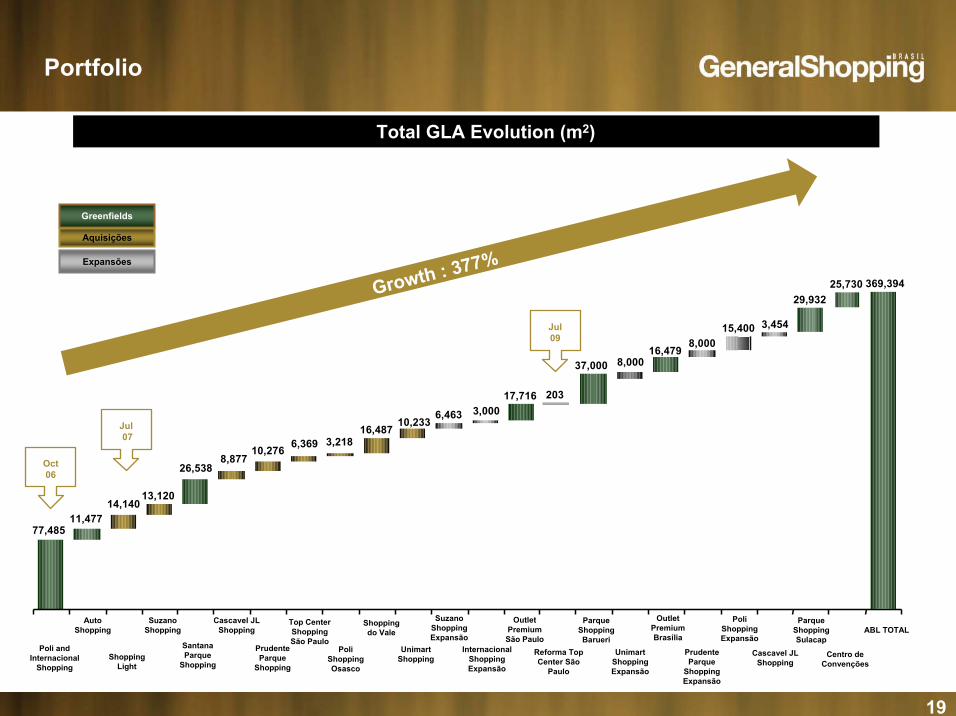
19
Growth : 377%
Total GLA Evolution (m2)
Greenfields
Aquisições
Expansões
369,39425,730
77,485
13,120
26,5388,877
6,36910,2763,218
16,48710,233
6,463
14,14011,477
Poli and Internacional
Shopping
Auto Shopping
Shopping Light
SuzanoShopping
Santana Parque
Shopping
Cascavel JL Shopping
PrudenteParque
Shopping
Top Center Shopping São Paulo
PoliShopping Osasco
Shopping do Vale
UnimartShopping
SuzanoShopping Expansão
InternacionalShopping Expansão
Outlet Premium São Paulo
Reforma Top Center São
Paulo
ParqueShopping Barueri
UnimartShopping Expansão
Outlet Premium Brasília
PrudenteParque
Shopping Expansão
Centro de Convenções
17,716 203
37,000
Oct06
Jul07
ABL TOTAL
3,000
Jul09
PoliShopping Expansão
Cascavel JL Shopping
ParqueShopping Sulacap
8,00016,479
8,00015,400 3,454
29,932
Portfolio
20
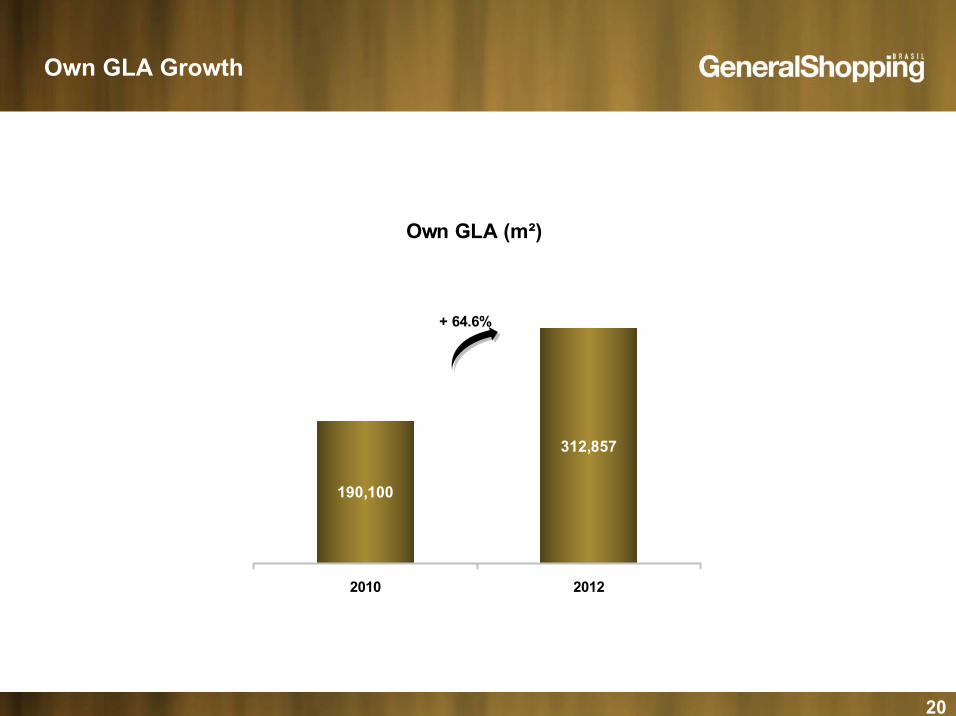
Own GLA Growth
Own GLA (m²)
190,100
312,857
2010 2012
+ 64.6%
21
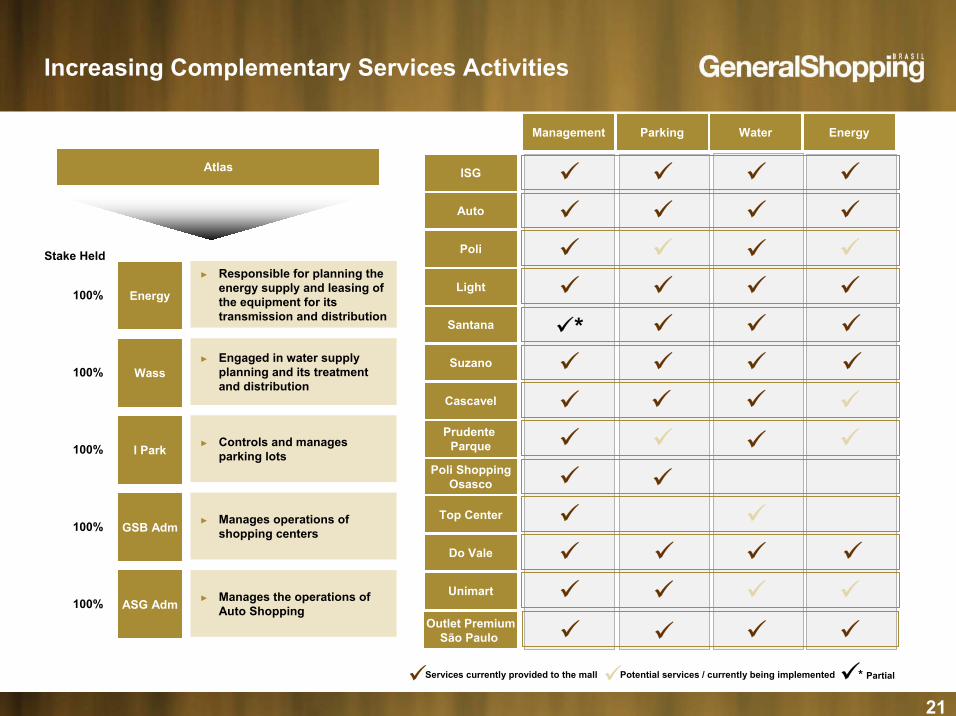
Increasing Complementary Services Activities
*
Atlas
Energy
Wass
I Park
GSB Adm
ASG Adm
Stake Held
100%
100%
100%
100%
100%
Services currently provided to the mall Potential services / currently being implemented
Management Parking Water Energy
* Partial
► Responsible for planning the energy supply and leasing of the equipment for its transmission and distribution
► Engaged in water supply planning and its treatment and distribution
► Controls and manages parking lots
► Manages operations of shopping centers
► Manages the operations of Auto Shopping
ISG
Auto
Poli
Light
Santana
Cascavel
PrudenteParque
Poli ShoppingOsasco
Top Center
Do Vale
Unimart
Suzano
Outlet Premium São Paulo

22
Perpetual Bonds Issue
Size: US$ 50.0 million
Issuance yield at 101% par
Amount in Reais: R$ 78.9 million(*)
Coupon: 10.0% per year
Perpetual Bonds
(*) In capture date: 04/19/2011

23
(*) In 05/13/2011
Stock Performance
Stock Performance(Basis 100 – 06/30/10)
R$ 13.20*61.2%
63,235*3.8%
0
20
40
60
80
100
120
140
160
180
Jun-
10
Jul-1
0
Aug
-10
Sep-
10
Oct
-10
Nov
-10
Dec
-10
Jan-
11
Feb-
11
Mar
-11
Apr
-11
GSHP3 Ibovespa
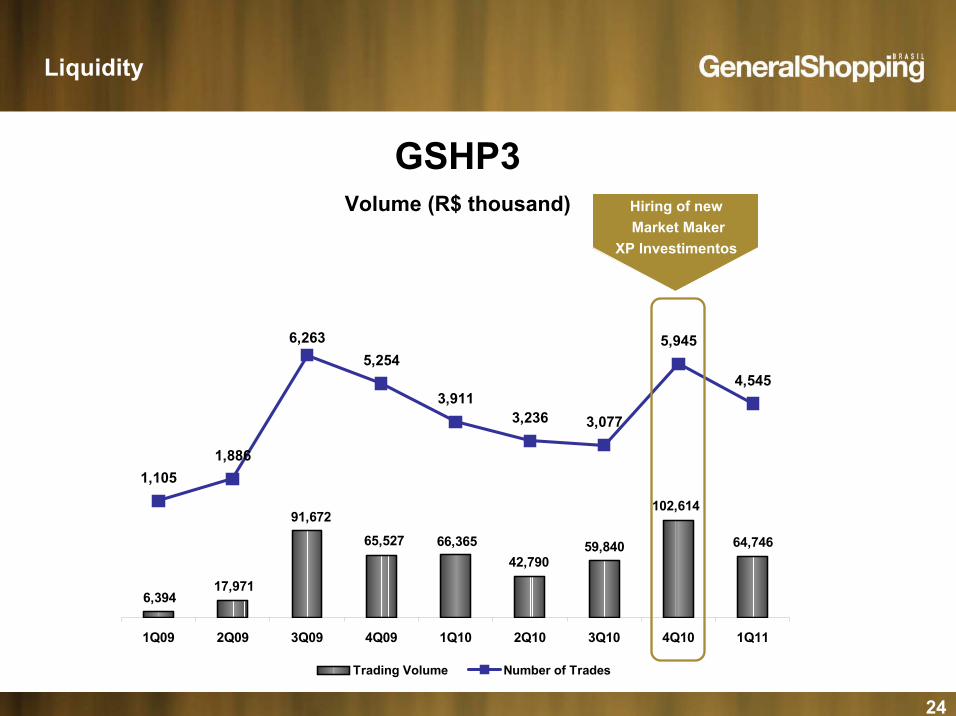
64,746
102,614
59,84042,790
66,36565,527
91,672
17,9716,394
1,105
6,2635,254
3,236 3,077
4,545
5,945
3,911
1,886
1Q09 2Q09 3Q09 4Q09 1Q10 2Q10 3Q10 4Q10 1Q11
Trading Volume Number of Trades
24
Liquidity
GSHP3Volume (R$ thousand) Hiring of new
Market Maker XP Investimentos
25
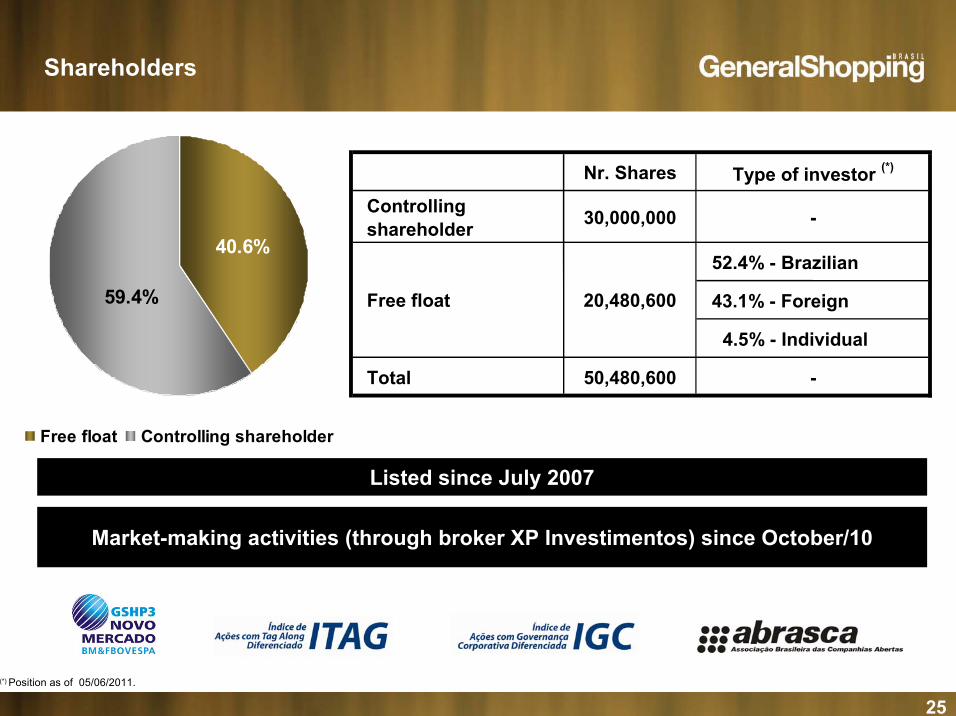
Shareholders
Market-making activities (through broker XP Investimentos) since October/10
59.4%
40.6%
Free float Controlling shareholder
Listed since July 2007
(*) Position as of 05/06/2011.
Nr. Shares Type of investor (*)
Controllingshareholder 30,000,000 -
52.4% - Brazilian
43.1% - Foreign
4.5% - Individual
Total 50,480,600 -
Free float 20,480,600
26
Contacts
GSB INVESTOR RELATIONS
Alessandro Poli VeroneziInvestor Relations Director
Marcio SniokaInvestor Relations Manager
55 11 3159-5100
www.generalshopping.com.br