1q11 investors update
TRANSCRIPT
Energy Company of ChoiceMay, 2011 www.medcoenergi.com
PT Medco Energi Internasional Tbk.
1Q11 Investors’ Update
Table of Contents
Content Page
The Overview: Profile & Assets Portfolio 3
Shareholding Structure 4
Business Profile 5
Assets Portfolio 6
Projects Milestones 8
Business Performance: Financial & Operational KPIs 11
Financial KPIs 12
Breakdown by Business Segments 15
Business Development: Reserves , Exploration & Capex 18
Reserves Profile 1Q11 19
Capex Profile 22
Highlights: Projects Initiatives 24
Overview:
Profile & Assets Portfolio
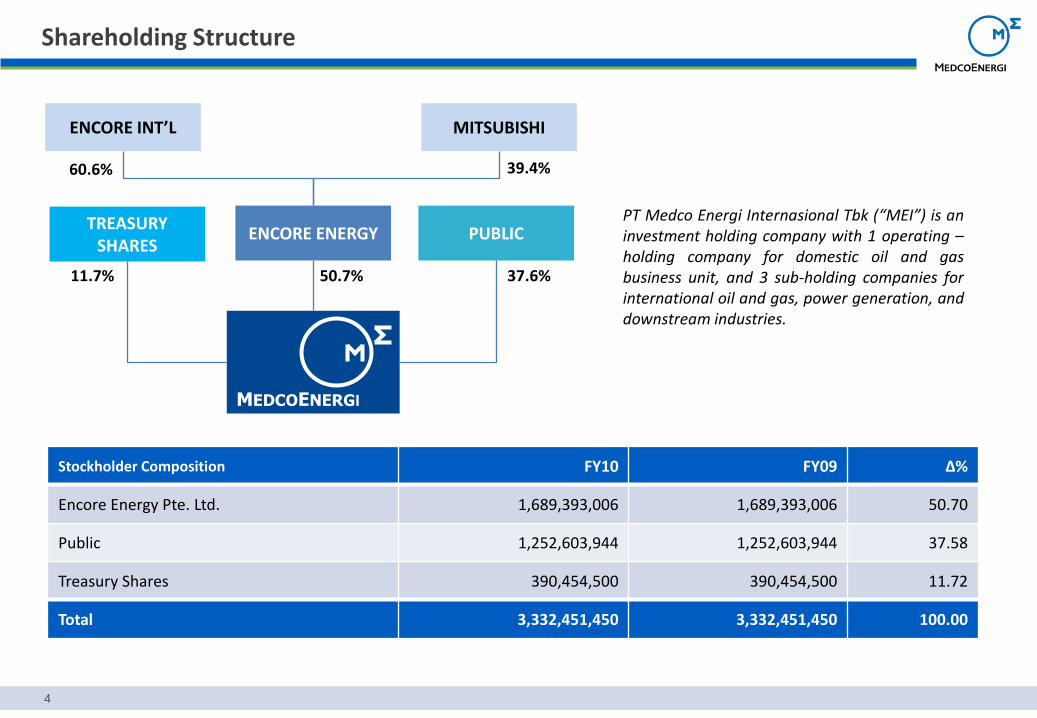
Shareholding Structure
4
ENCORE INT’L MITSUBISHI
TREASURY SHARES
ENCORE ENERGY PUBLIC
60.6% 39.4%
37.6%11.7% 50.7%
PT Medco Energi Internasional Tbk (“MEI”) is aninvestment holding company with 1 operating –holding company for domestic oil and gasbusiness unit, and 3 sub-holding companies forinternational oil and gas, power generation, anddownstream industries.
Stockholder Composition FY10 FY09 ∆%
Encore Energy Pte. Ltd. 1,689,393,006 1,689,393,006 50.70
Public 1,252,603,944 1,252,603,944 37.58
Treasury Shares 390,454,500 390,454,500 11.72
Total 3,332,451,450 3,332,451,450 100.00
MEDCOENERGI
Business Profile
5
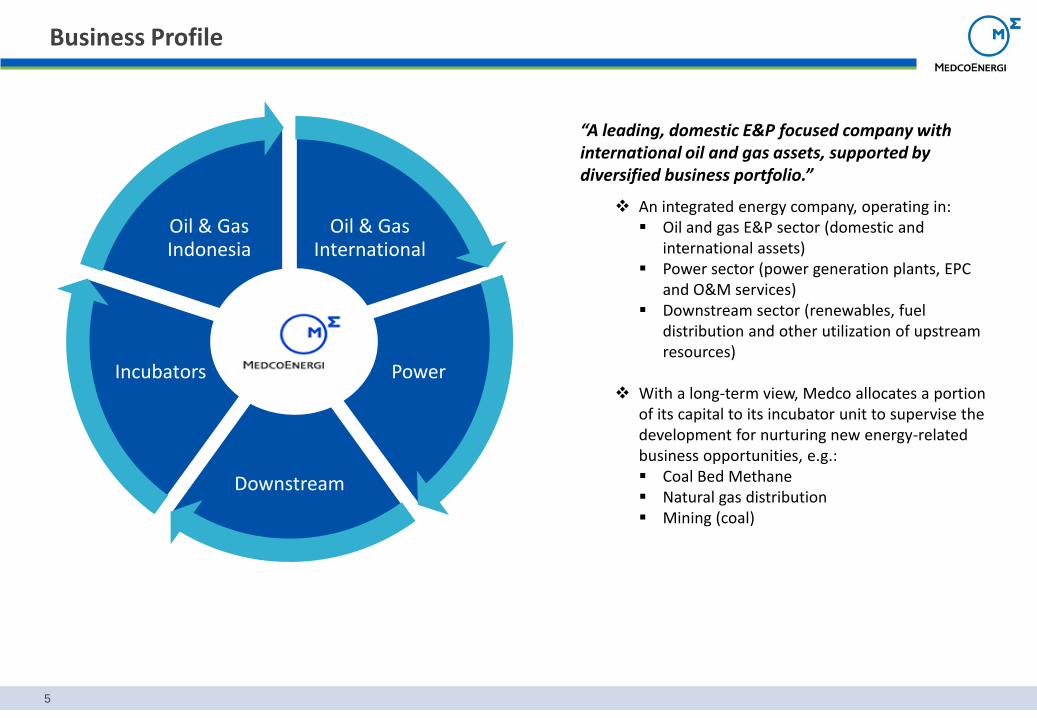
Oil & Gas International
Power
Downstream
Incubators
Oil & Gas Indonesia
An integrated energy company, operating in: Oil and gas E&P sector (domestic and
international assets) Power sector (power generation plants, EPC
and O&M services) Downstream sector (renewables, fuel
distribution and other utilization of upstream resources)
With a long-term view, Medco allocates a portion of its capital to its incubator unit to supervise the development for nurturing new energy-related business opportunities, e.g.: Coal Bed Methane Natural gas distribution Mining (coal)
“A leading, domestic E&P focused company with international oil and gas assets, supported by diversified business portfolio.”
OMAN
CAMBODIA
USA
YEMEN
TUNISIA
LIBYA
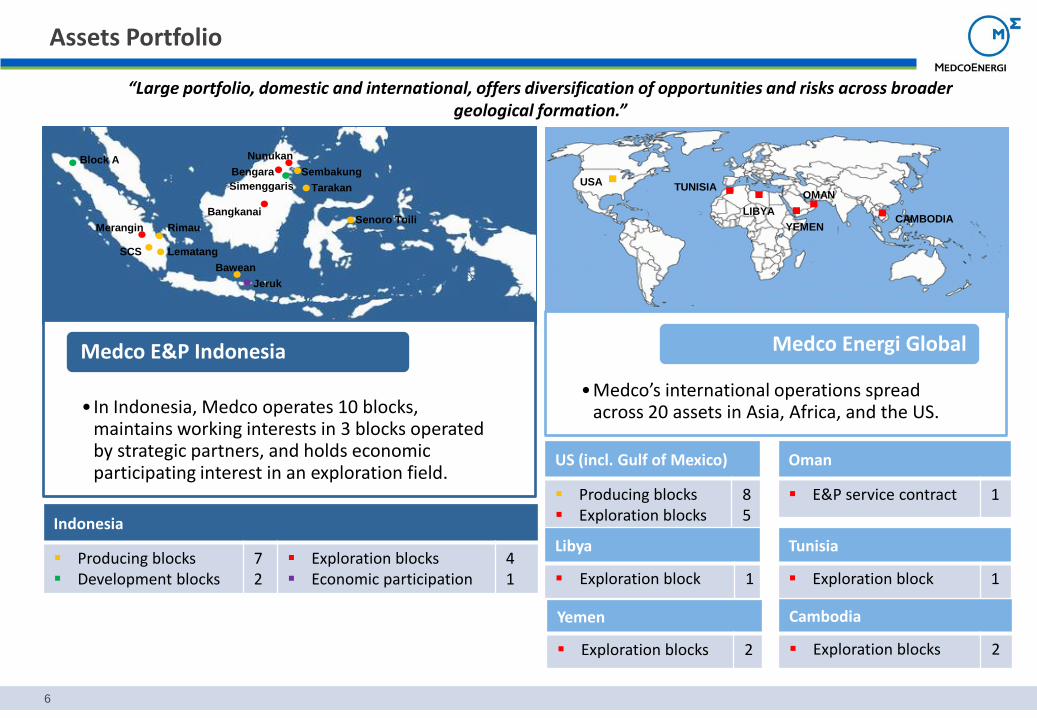
•Medco’s international operations spread across 20 assets in Asia, Africa, and the US.
Medco Energi Global
Assets Portfolio
6
• In Indonesia, Medco operates 10 blocks, maintains working interests in 3 blocks operated by strategic partners, and holds economic participating interest in an exploration field.
Medco E&P Indonesia
US (incl. Gulf of Mexico)
Producing blocks Exploration blocks
85
Yemen
Exploration blocks 2
Oman
E&P service contract 1
Cambodia
Exploration blocks 2
Indonesia
Producing blocks Development blocks
72
Exploration blocks Economic participation
41
“Large portfolio, domestic and international, offers diversification of opportunities and risks across broader geological formation.”
Tunisia
Exploration block 1
Libya
Exploration block 1
Senoro Toili
Block A
Rimau
Bangkanai
Bengara
Nunukan
Simenggaris Tarakan
Sembakung
Jeruk
Bawean
SCS Lematang
Merangin
Assets Portfolio (cont’d)
7
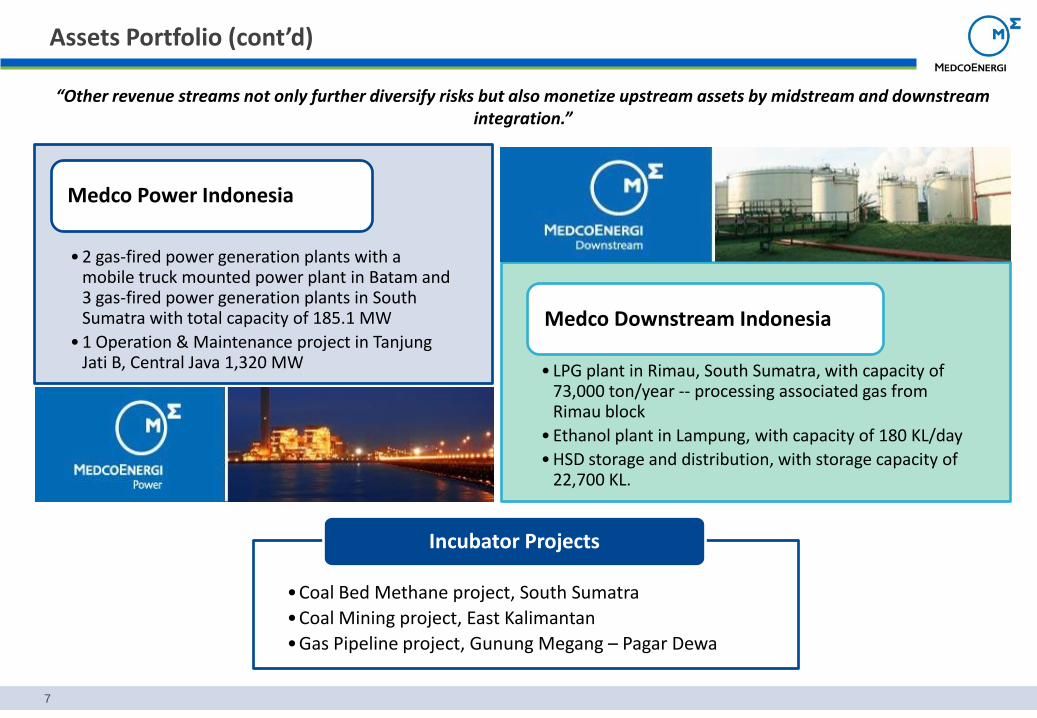
“Other revenue streams not only further diversify risks but also monetize upstream assets by midstream and downstream integration.”
• 2 gas-fired power generation plants with a mobile truck mounted power plant in Batam and 3 gas-fired power generation plants in South Sumatra with total capacity of 185.1 MW
• 1 Operation & Maintenance project in Tanjung Jati B, Central Java 1,320 MW
Medco Power Indonesia
• LPG plant in Rimau, South Sumatra, with capacity of 73,000 ton/year -- processing associated gas from Rimau block
• Ethanol plant in Lampung, with capacity of 180 KL/day
• HSD storage and distribution, with storage capacity of 22,700 KL.
Medco Downstream Indonesia
•Coal Bed Methane project, South Sumatra
•Coal Mining project, East Kalimantan
•Gas Pipeline project, Gunung Megang – Pagar Dewa
Incubator Projects
Projects Milestones
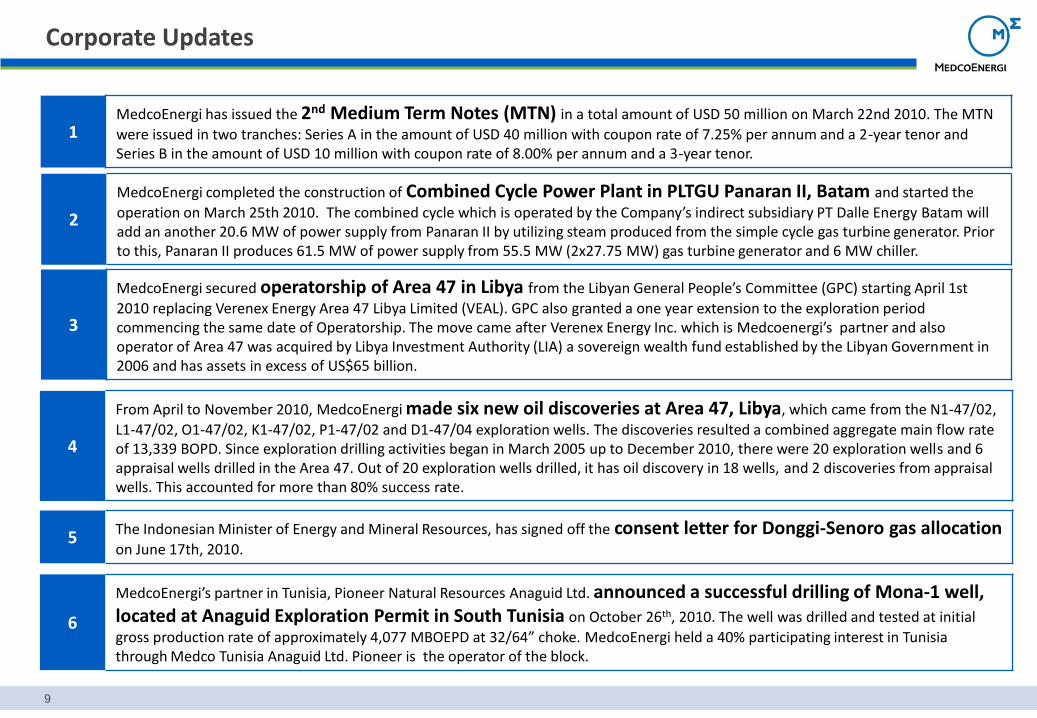
1MedcoEnergi has issued the 2nd Medium Term Notes (MTN) in a total amount of USD 50 million on March 22nd 2010. The MTN
were issued in two tranches: Series A in the amount of USD 40 million with coupon rate of 7.25% per annum and a 2-year tenor andSeries B in the amount of USD 10 million with coupon rate of 8.00% per annum and a 3-year tenor.
9
2
MedcoEnergi completed the construction of Combined Cycle Power Plant in PLTGU Panaran II, Batam and started the
operation on March 25th 2010. The combined cycle which is operated by the Company’s indirect subsidiary PT Dalle Energy Batam will add an another 20.6 MW of power supply from Panaran II by utilizing steam produced from the simple cycle gas turbine generator. Prior to this, Panaran II produces 61.5 MW of power supply from 55.5 MW (2x27.75 MW) gas turbine generator and 6 MW chiller.
3
MedcoEnergi secured operatorship of Area 47 in Libya from the Libyan General People’s Committee (GPC) starting April 1st
2010 replacing Verenex Energy Area 47 Libya Limited (VEAL). GPC also granted a one year extension to the exploration period commencing the same date of Operatorship. The move came after Verenex Energy Inc. which is Medcoenergi’s partner and also operator of Area 47 was acquired by Libya Investment Authority (LIA) a sovereign wealth fund established by the Libyan Government in 2006 and has assets in excess of US$65 billion.
5 The Indonesian Minister of Energy and Mineral Resources, has signed off the consent letter for Donggi-Senoro gas allocation on June 17th, 2010.
4
From April to November 2010, MedcoEnergi made six new oil discoveries at Area 47, Libya, which came from the N1-47/02,
L1-47/02, O1-47/02, K1-47/02, P1-47/02 and D1-47/04 exploration wells. The discoveries resulted a combined aggregate main flow rate of 13,339 BOPD. Since exploration drilling activities began in March 2005 up to December 2010, there were 20 exploration wells and 6 appraisal wells drilled in the Area 47. Out of 20 exploration wells drilled, it has oil discovery in 18 wells, and 2 discoveries from appraisal wells. This accounted for more than 80% success rate.
Corporate Updates
6
MedcoEnergi’s partner in Tunisia, Pioneer Natural Resources Anaguid Ltd. announced a successful drilling of Mona-1 well, located at Anaguid Exploration Permit in South Tunisia on October 26th, 2010. The well was drilled and tested at initial
gross production rate of approximately 4,077 MBOEPD at 32/64” choke. MedcoEnergi held a 40% participating interest in Tunisia through Medco Tunisia Anaguid Ltd. Pioneer is the operator of the block.
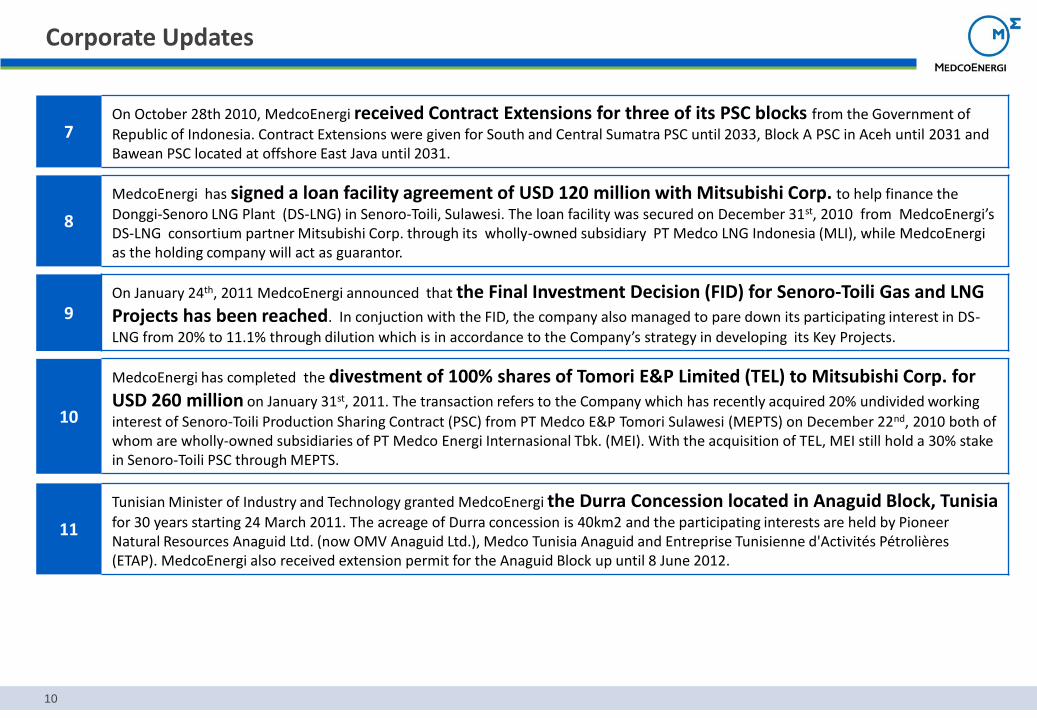
9On January 24th, 2011 MedcoEnergi announced that the Final Investment Decision (FID) for Senoro-Toili Gas and LNG Projects has been reached. In conjuction with the FID, the company also managed to pare down its participating interest in DS-
LNG from 20% to 11.1% through dilution which is in accordance to the Company’s strategy in developing its Key Projects.
10
10
MedcoEnergi has completed the divestment of 100% shares of Tomori E&P Limited (TEL) to Mitsubishi Corp. for USD 260 million on January 31st, 2011. The transaction refers to the Company which has recently acquired 20% undivided working
interest of Senoro-Toili Production Sharing Contract (PSC) from PT Medco E&P Tomori Sulawesi (MEPTS) on December 22nd, 2010 both of whom are wholly-owned subsidiaries of PT Medco Energi Internasional Tbk. (MEI). With the acquisition of TEL, MEI still hold a 30% stake in Senoro-Toili PSC through MEPTS.
8
MedcoEnergi has signed a loan facility agreement of USD 120 million with Mitsubishi Corp. to help finance the
Donggi-Senoro LNG Plant (DS-LNG) in Senoro-Toili, Sulawesi. The loan facility was secured on December 31st, 2010 from MedcoEnergi’sDS-LNG consortium partner Mitsubishi Corp. through its wholly-owned subsidiary PT Medco LNG Indonesia (MLI), while MedcoEnergias the holding company will act as guarantor.
Corporate Updates
7On October 28th 2010, MedcoEnergi received Contract Extensions for three of its PSC blocks from the Government of
Republic of Indonesia. Contract Extensions were given for South and Central Sumatra PSC until 2033, Block A PSC in Aceh until 2031 and Bawean PSC located at offshore East Java until 2031.
11
Tunisian Minister of Industry and Technology granted MedcoEnergi the Durra Concession located in Anaguid Block, Tunisia for 30 years starting 24 March 2011. The acreage of Durra concession is 40km2 and the participating interests are held by Pioneer Natural Resources Anaguid Ltd. (now OMV Anaguid Ltd.), Medco Tunisia Anaguid and Entreprise Tunisienne d'Activités Pétrolières (ETAP). MedcoEnergi also received extension permit for the Anaguid Block up until 8 June 2012.

Business Performance: Financial & Operational KPIs
12
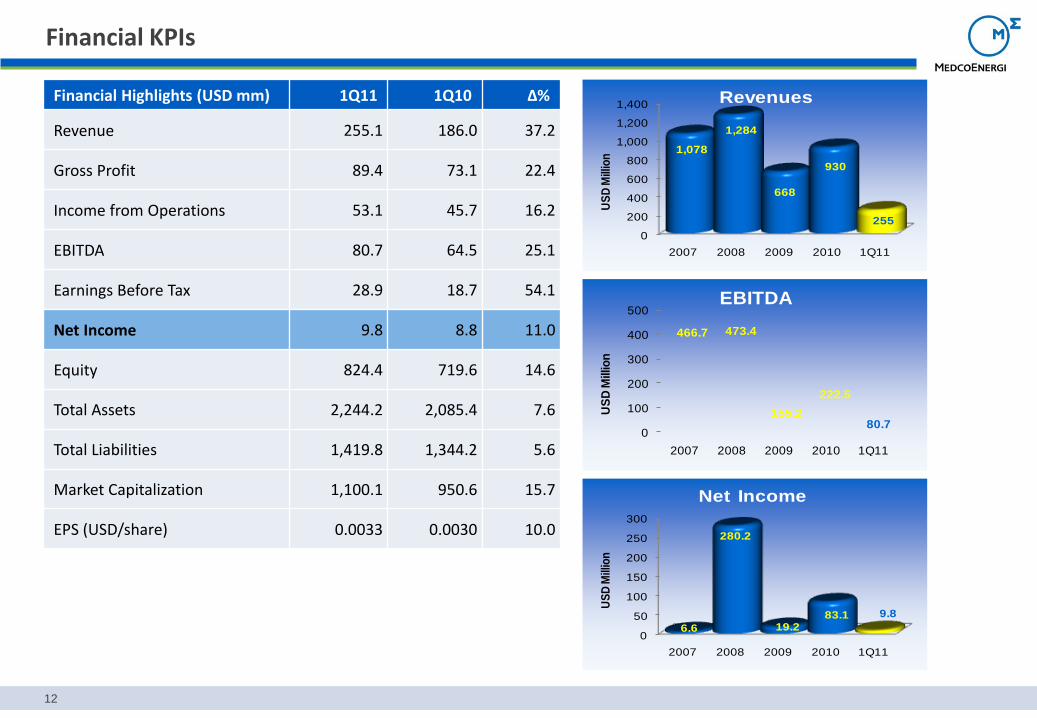
Financial Highlights (USD mm) 1Q11 1Q10 ∆%
Revenue 255.1 186.0 37.2
Gross Profit 89.4 73.1 22.4
Income from Operations 53.1 45.7 16.2
EBITDA 80.7 64.5 25.1
Earnings Before Tax 28.9 18.7 54.1
Net Income 9.8 8.8 11.0
Equity 824.4 719.6 14.6
Total Assets 2,244.2 2,085.4 7.6
Total Liabilities 1,419.8 1,344.2 5.6
Market Capitalization 1,100.1 950.6 15.7
EPS (USD/share) 0.0033 0.0030 10.0
0
200
400
600
800
1,000
1,200
1,400
2007 2008 2009 2010 1Q11
1,078
1,284
668
930
255
US
D M
illio
n
Revenues
0
100
200
300
400
500
2007 2008 2009 2010 1Q11
466.7 473.4
155.2
222.5
80.7
US
D M
illio
n
EBITDA
0
50
100
150
200
250
300
2007 2008 2009 2010 1Q11
6.6
280.2
19.283.1 9.8
US
D M
illio
n
Net Income
Financial KPIs
13
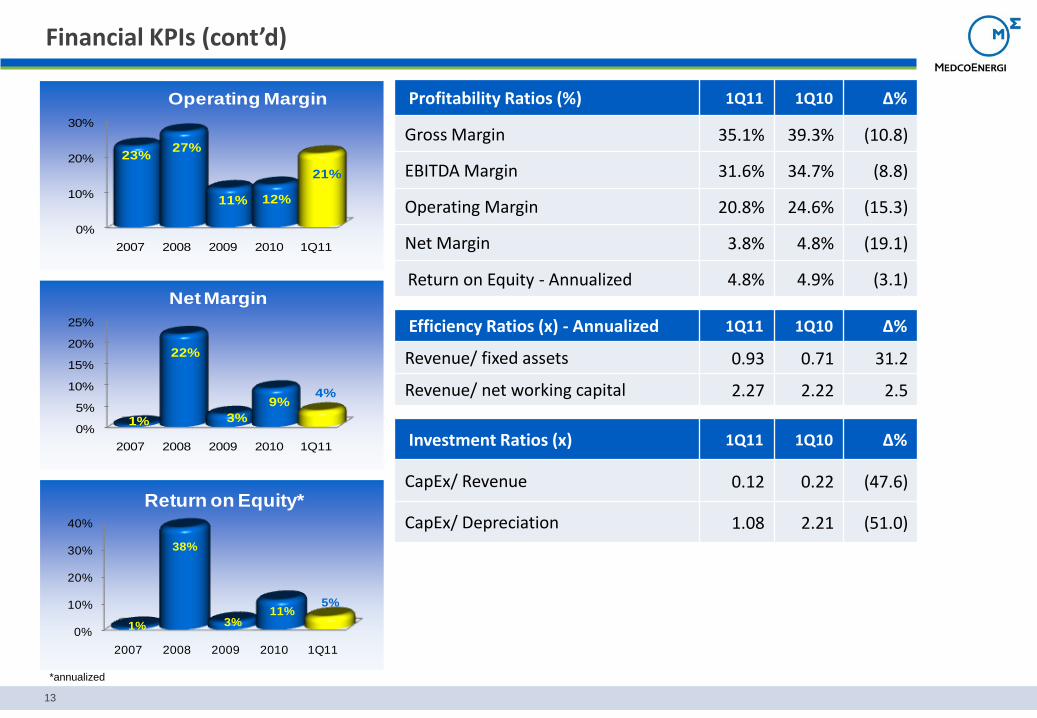
Profitability Ratios (%) 1Q11 1Q10 ∆%
Gross Margin 35.1% 39.3% (10.8)
EBITDA Margin 31.6% 34.7% (8.8)
Operating Margin 20.8% 24.6% (15.3)
Net Margin 3.8% 4.8% (19.1)
Return on Equity - Annualized 4.8% 4.9% (3.1)
Efficiency Ratios (x) - Annualized 1Q11 1Q10 ∆%
Revenue/ fixed assets 0.93 0.71 31.2
Revenue/ net working capital 2.27 2.22 2.5
Investment Ratios (x) 1Q11 1Q10 ∆%
CapEx/ Revenue 0.12 0.22 (47.6)
CapEx/ Depreciation 1.08 2.21 (51.0)
0%
5%
10%
15%
20%
25%
2007 2008 2009 2010 1Q11
1%
22%
3%
9%4%
Net Margin
0%
10%
20%
30%
2007 2008 2009 2010 1Q11
23%27%
11% 12%
21%
Operating Margin
0%
10%
20%
30%
40%
2007 2008 2009 2010 1Q11
1%
38%
3%11%
5%
Return on Equity*
Financial KPIs (cont’d)
*annualized
14
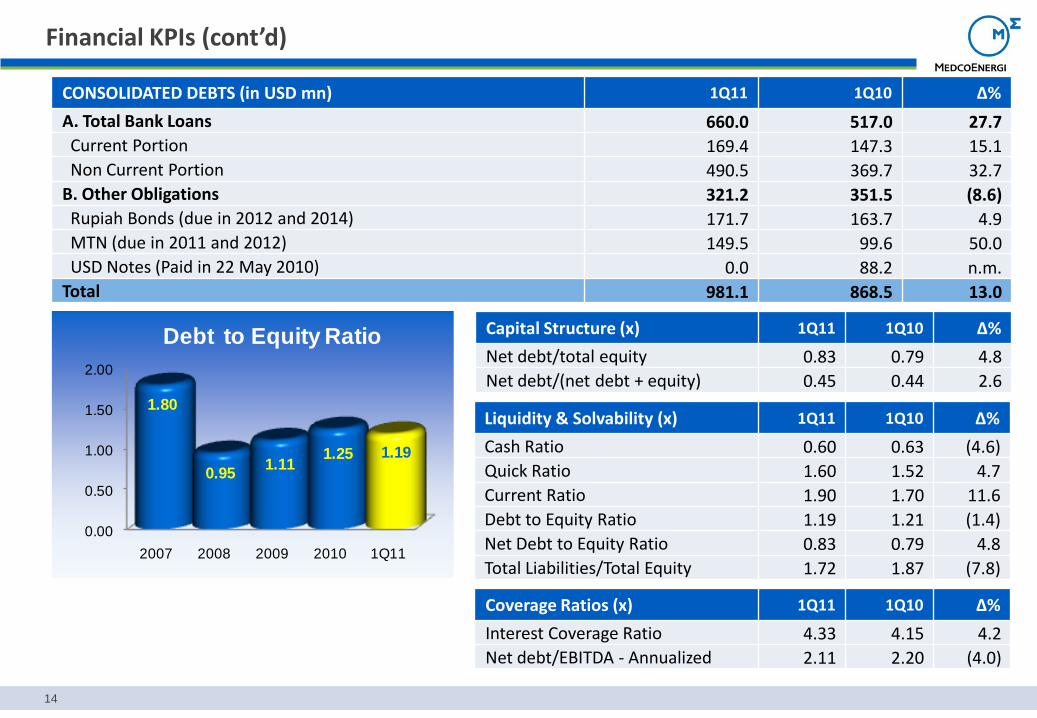
CONSOLIDATED DEBTS (in USD mn) 1Q11 1Q10 ∆%
A. Total Bank Loans 660.0 517.0 27.7
Current Portion 169.4 147.3 15.1
Non Current Portion 490.5 369.7 32.7
B. Other Obligations 321.2 351.5 (8.6)
Rupiah Bonds (due in 2012 and 2014) 171.7 163.7 4.9
MTN (due in 2011 and 2012) 149.5 99.6 50.0
USD Notes (Paid in 22 May 2010) 0.0 88.2 n.m.
Total 981.1 868.5 13.0
Coverage Ratios (x) 1Q11 1Q10 ∆%
Interest Coverage Ratio 4.33 4.15 4.2
Net debt/EBITDA - Annualized 2.11 2.20 (4.0)
Capital Structure (x) 1Q11 1Q10 ∆%
Net debt/total equity 0.83 0.79 4.8
Net debt/(net debt + equity) 0.45 0.44 2.6
Liquidity & Solvability (x) 1Q11 1Q10 ∆%
Cash Ratio 0.60 0.63 (4.6)
Quick Ratio 1.60 1.52 4.7
Current Ratio 1.90 1.70 11.6
Debt to Equity Ratio 1.19 1.21 (1.4)
Net Debt to Equity Ratio 0.83 0.79 4.8
Total Liabilities/Total Equity 1.72 1.87 (7.8)
0.00
0.50
1.00
1.50
2.00
2007 2008 2009 2010 1Q11
1.80
0.951.11
1.25 1.19
Debt to Equity Ratio
Financial KPIs (cont’d)
15
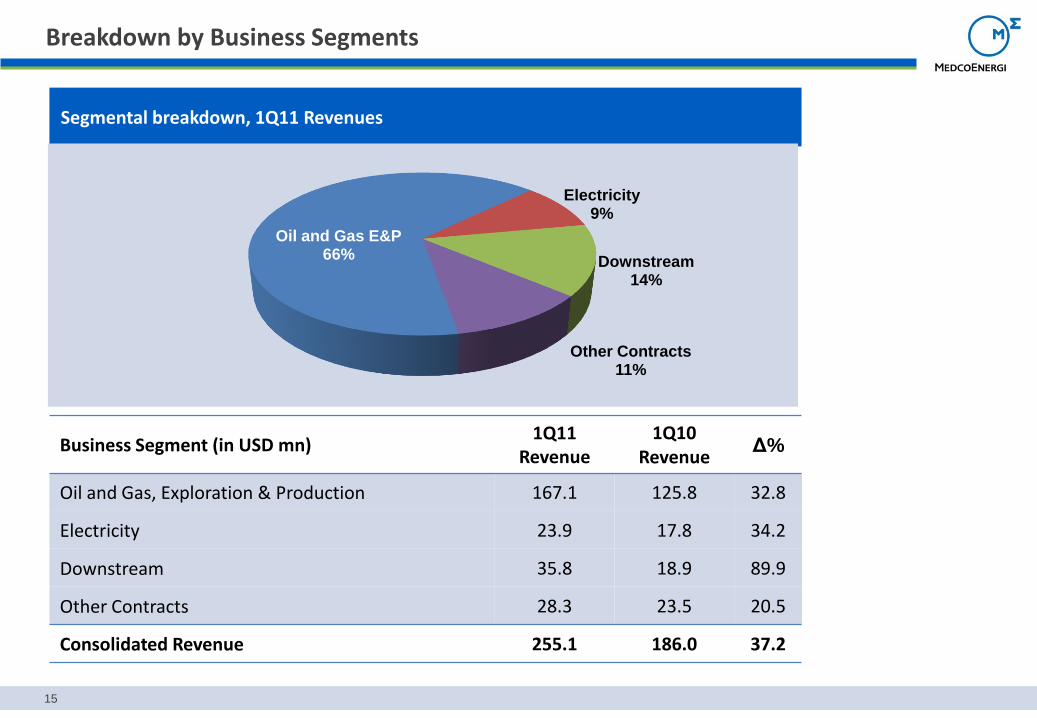
Business Segment (in USD mn)1Q11
Revenue1Q10
RevenueΔ%
Oil and Gas, Exploration & Production 167.1 125.8 32.8
Electricity 23.9 17.8 34.2
Downstream 35.8 18.9 89.9
Other Contracts 28.3 23.5 20.5
Consolidated Revenue 255.1 186.0 37.2
Segmental breakdown, 1Q11 Revenues
Breakdown by Business Segments
Oil and Gas E&P66%
Electricity9%
Downstream14%
Other Contracts11%
16
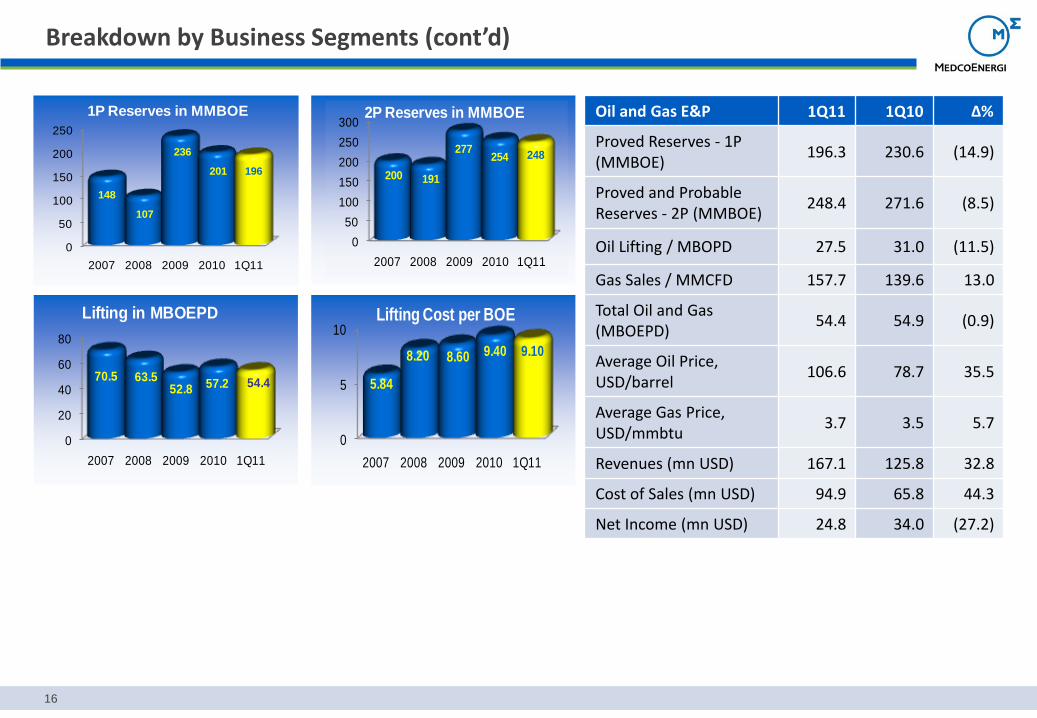
Oil and Gas E&P 1Q11 1Q10 ∆%
Proved Reserves - 1P (MMBOE)
196.3 230.6 (14.9)
Proved and Probable Reserves - 2P (MMBOE)
248.4 271.6 (8.5)
Oil Lifting / MBOPD 27.5 31.0 (11.5)
Gas Sales / MMCFD 157.7 139.6 13.0
Total Oil and Gas (MBOEPD)
54.4 54.9 (0.9)
Average Oil Price, USD/barrel
106.6 78.7 35.5
Average Gas Price, USD/mmbtu
3.7 3.5 5.7
Revenues (mn USD) 167.1 125.8 32.8
Cost of Sales (mn USD) 94.9 65.8 44.3
Net Income (mn USD) 24.8 34.0 (27.2)
0
50
100
150
200
250
2007 2008 2009 2010 1Q11
148
107
236
201 196
1P Reserves in MMBOE
0
50
100
150
200
250
300
2007 2008 2009 2010 1Q11
200 191
277254 248
2P Reserves in MMBOE
0
5
10
2007 2008 2009 2010 1Q11
5.84
8.20 8.60 9.40 9.10
Lifting Cost per BOE
0
20
40
60
80
2007 2008 2009 2010 1Q11
70.5 63.552.8 57.2 54.4
Lifting in MBOEPD
Breakdown by Business Segments (cont’d)
17
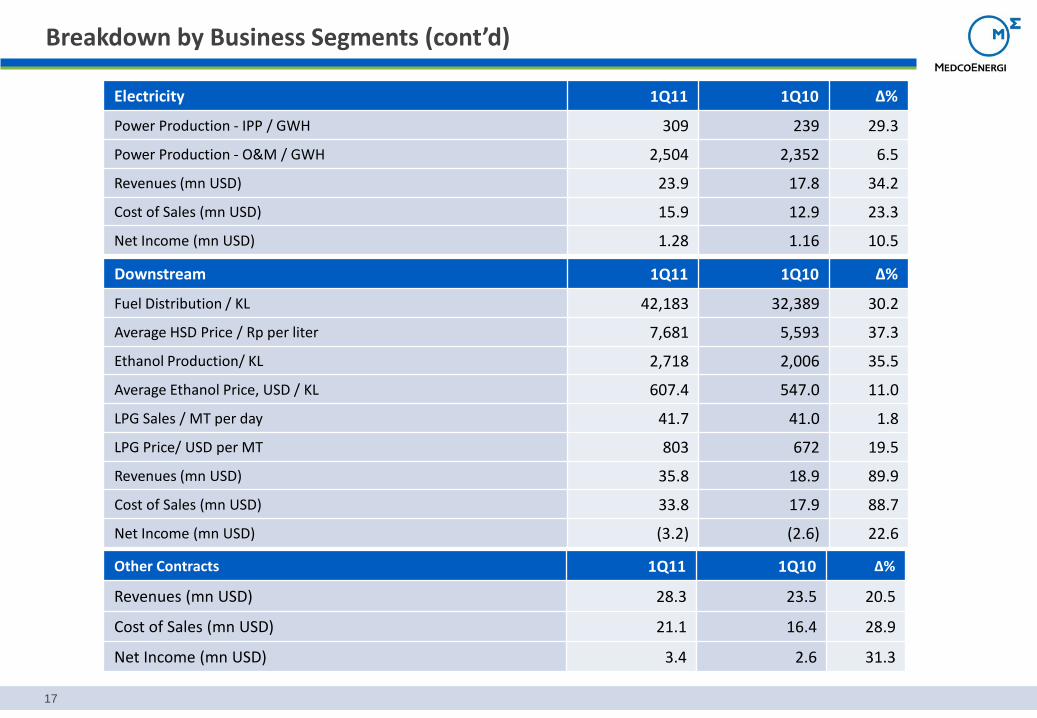
Electricity 1Q11 1Q10 ∆%
Power Production - IPP / GWH 309 239 29.3
Power Production - O&M / GWH 2,504 2,352 6.5
Revenues (mn USD) 23.9 17.8 34.2
Cost of Sales (mn USD) 15.9 12.9 23.3
Net Income (mn USD) 1.28 1.16 10.5
Downstream 1Q11 1Q10 ∆%
Fuel Distribution / KL 42,183 32,389 30.2
Average HSD Price / Rp per liter 7,681 5,593 37.3
Ethanol Production/ KL 2,718 2,006 35.5
Average Ethanol Price, USD / KL 607.4 547.0 11.0
LPG Sales / MT per day 41.7 41.0 1.8
LPG Price/ USD per MT 803 672 19.5
Revenues (mn USD) 35.8 18.9 89.9
Cost of Sales (mn USD) 33.8 17.9 88.7
Net Income (mn USD) (3.2) (2.6) 22.6
Other Contracts 1Q11 1Q10 ∆%
Revenues (mn USD) 28.3 23.5 20.5
Cost of Sales (mn USD) 21.1 16.4 28.9
Net Income (mn USD) 3.4 2.6 31.3
Breakdown by Business Segments (cont’d)
Business Development:Reserves & Exploration Program
Libya-47 Senoro Toili Bangkanai Simenggaris
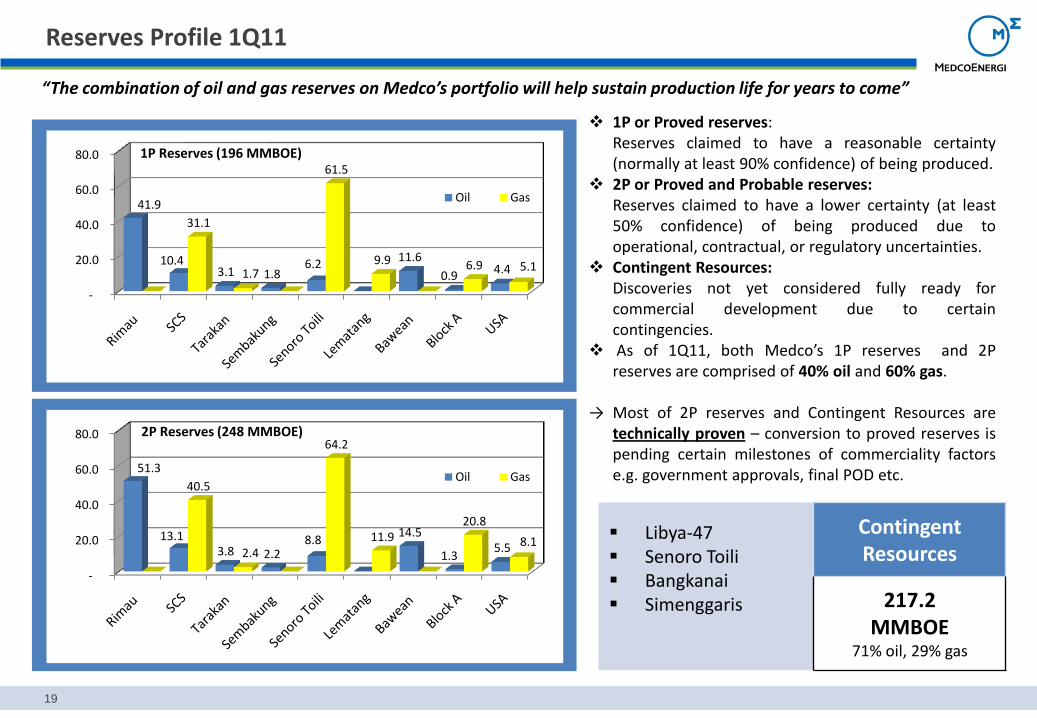
1P or Proved reserves:Reserves claimed to have a reasonable certainty(normally at least 90% confidence) of being produced.
2P or Proved and Probable reserves:Reserves claimed to have a lower certainty (at least50% confidence) of being produced due tooperational, contractual, or regulatory uncertainties.
Contingent Resources:Discoveries not yet considered fully ready forcommercial development due to certaincontingencies.
As of 1Q11, both Medco’s 1P reserves and 2Preserves are comprised of 40% oil and 60% gas.
→ Most of 2P reserves and Contingent Resources aretechnically proven – conversion to proved reserves ispending certain milestones of commerciality factorse.g. government approvals, final POD etc.
Contingent Resources
217.2MMBOE
71% oil, 29% gas
“The combination of oil and gas reserves on Medco’s portfolio will help sustain production life for years to come”
19
Reserves Profile 1Q11
-
20.0
40.0
60.0
80.0
41.9
10.4 3.1 1.8
6.2 11.6
0.9 4.4
31.1
1.7
61.5
9.9 6.9 5.1
Oil Gas
1P Reserves (196 MMBOE)
-
20.0
40.0
60.0
80.0
51.3
13.1 3.8 2.2
8.8 14.5
1.3 5.5
40.5
2.4
64.2
11.9 20.8
8.1
Oil Gas
2P Reserves (248 MMBOE)
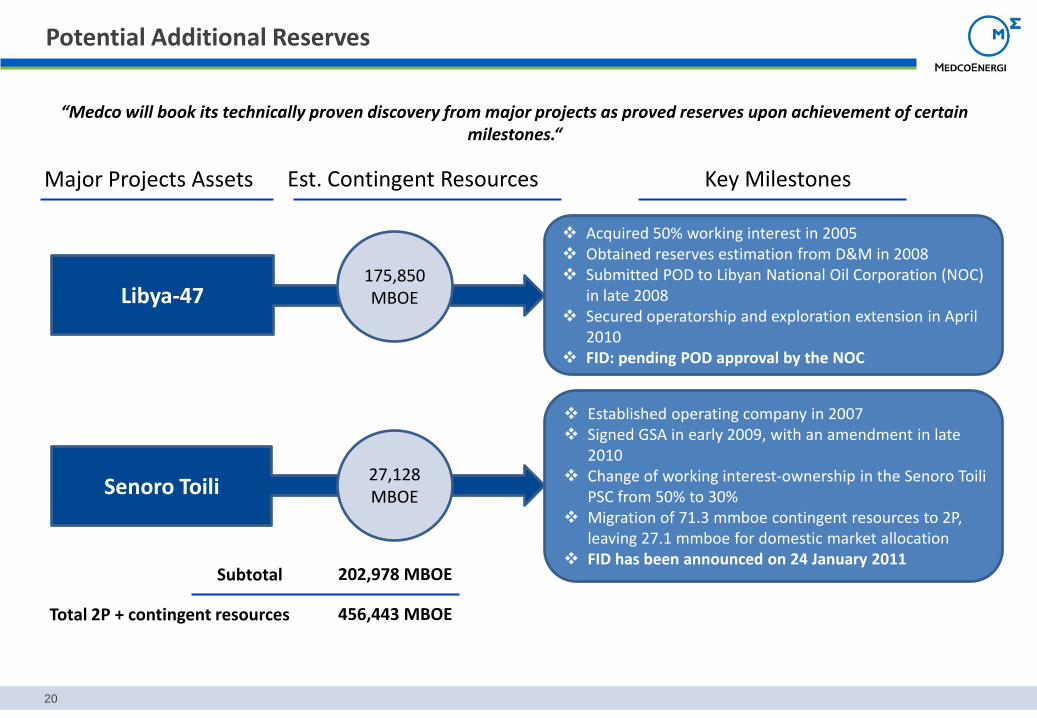
Libya-47
Established operating company in 2007 Signed GSA in early 2009, with an amendment in late
2010 Change of working interest-ownership in the Senoro Toili
PSC from 50% to 30% Migration of 71.3 mmboe contingent resources to 2P,
leaving 27.1 mmboe for domestic market allocation FID has been announced on 24 January 2011
Acquired 50% working interest in 2005 Obtained reserves estimation from D&M in 2008 Submitted POD to Libyan National Oil Corporation (NOC)
in late 2008 Secured operatorship and exploration extension in April
2010 FID: pending POD approval by the NOC
“Medco will book its technically proven discovery from major projects as proved reserves upon achievement of certain milestones.“
175,850 MBOE
Subtotal 202,978 MBOE
Major Projects Assets Est. Contingent Resources Key Milestones
Total 2P + contingent resources 456,443 MBOE
20
Senoro Toili27,128 MBOE
Potential Additional Reserves
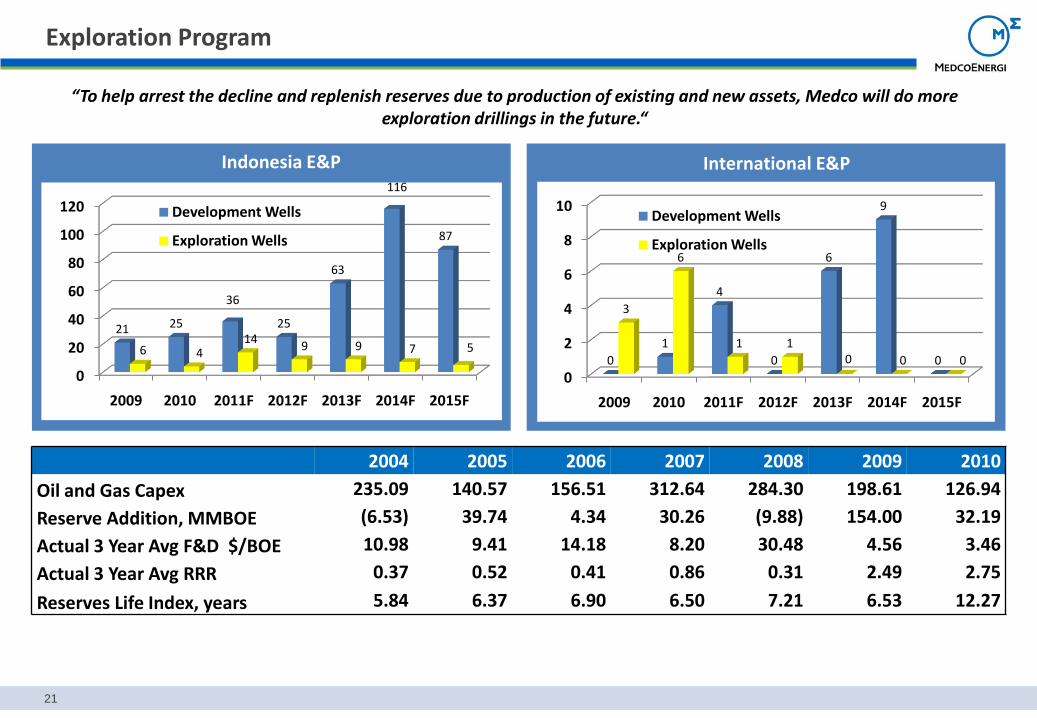
“To help arrest the decline and replenish reserves due to production of existing and new assets, Medco will do more exploration drillings in the future.“
21
Exploration Program
2004 2005 2006 2007 2008 2009 2010
Oil and Gas Capex 235.09 140.57 156.51 312.64 284.30 198.61 126.94
Reserve Addition, MMBOE (6.53) 39.74 4.34 30.26 (9.88) 154.00 32.19
Actual 3 Year Avg F&D $/BOE 10.98 9.41 14.18 8.20 30.48 4.56 3.46
Actual 3 Year Avg RRR 0.37 0.52 0.41 0.86 0.31 2.49 2.75
Reserves Life Index, years 5.84 6.37 6.90 6.50 7.21 6.53 12.27
0
20
40
60
80
100
120
2009 2010 2011F 2012F 2013F 2014F 2015F
21 25
36
25
63
116
87
6 414
9 9 7 5
Development Wells
Exploration Wells
Indonesia E&P
0
2
4
6
8
10
2009 2010 2011F 2012F 2013F 2014F 2015F
0
1
4
0
6
9
0
3
6
1 10 0 0
Development Wells
Exploration Wells
International E&P
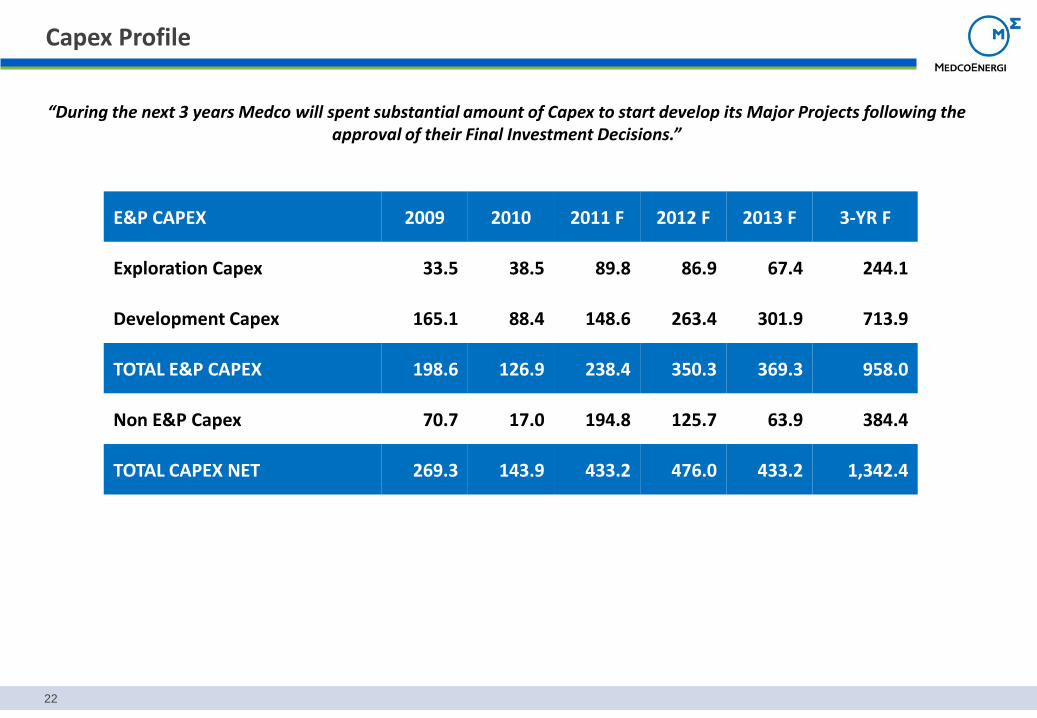
“During the next 3 years Medco will spent substantial amount of Capex to start develop its Major Projects following the approval of their Final Investment Decisions.”
22
Capex Profile
E&P CAPEX 2009 2010 2011 F 2012 F 2013 F 3-YR F
Exploration Capex 33.5 38.5 89.8 86.9 67.4 244.1
Development Capex 165.1 88.4 148.6 263.4 301.9 713.9
TOTAL E&P CAPEX 198.6 126.9 238.4 350.3 369.3 958.0
Non E&P Capex 70.7 17.0 194.8 125.7 63.9 384.4
TOTAL CAPEX NET 269.3 143.9 433.2 476.0 433.2 1,342.4
23
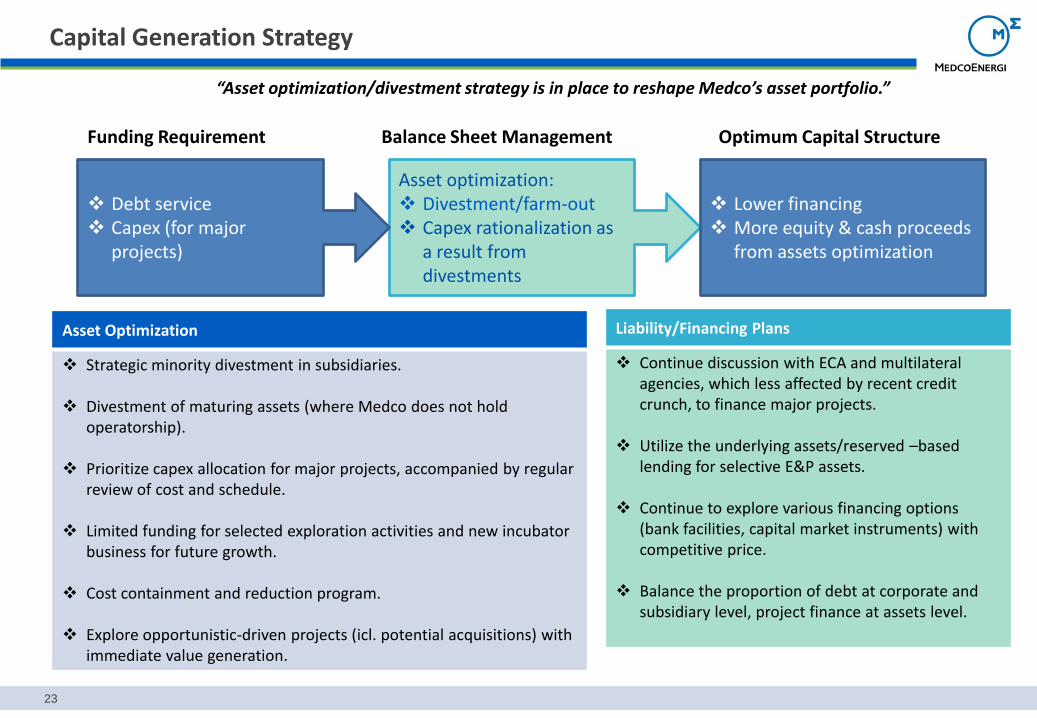
Asset Optimization
Strategic minority divestment in subsidiaries.
Divestment of maturing assets (where Medco does not hold operatorship).
Prioritize capex allocation for major projects, accompanied by regular review of cost and schedule.
Limited funding for selected exploration activities and new incubator business for future growth.
Cost containment and reduction program.
Explore opportunistic-driven projects (icl. potential acquisitions) with immediate value generation.
Liability/Financing Plans
Continue discussion with ECA and multilateral agencies, which less affected by recent credit crunch, to finance major projects.
Utilize the underlying assets/reserved –based lending for selective E&P assets.
Continue to explore various financing options (bank facilities, capital market instruments) with competitive price.
Balance the proportion of debt at corporate and subsidiary level, project finance at assets level.
Funding Requirement Balance Sheet Management Optimum Capital Structure
“Asset optimization/divestment strategy is in place to reshape Medco’s asset portfolio.”
Asset optimization: Divestment/farm-out Capex rationalization as
a result from divestments
Lower financing More equity & cash proceeds
from assets optimization
Debt service Capex (for major
projects)
Capital Generation Strategy
Highlights: Projects Initiatives
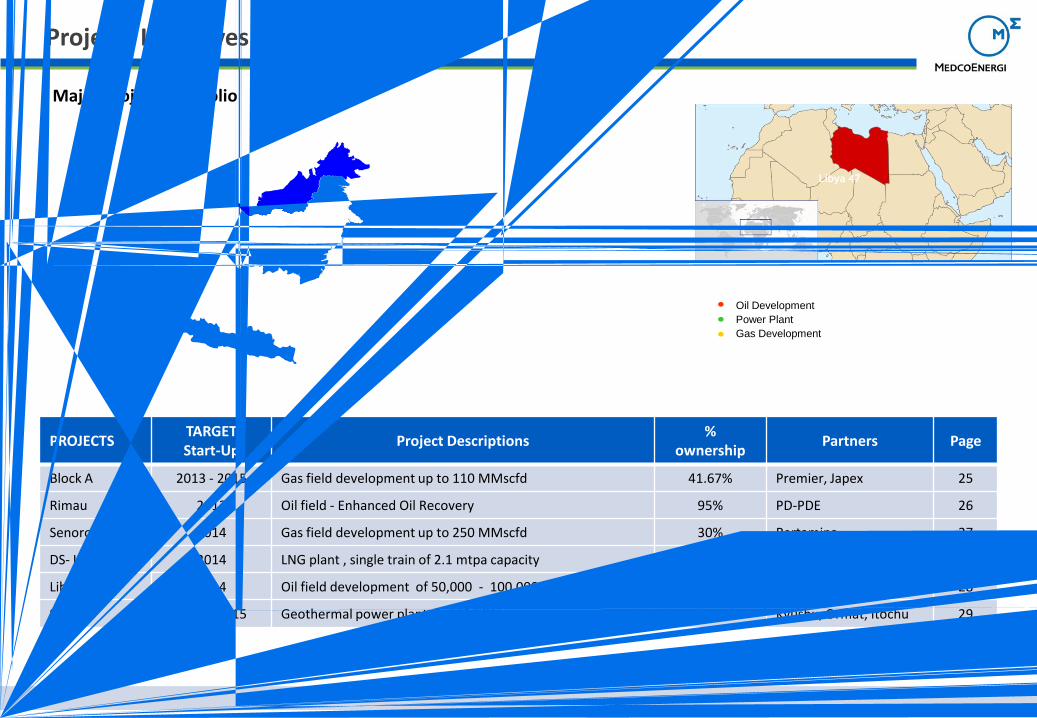
PROJECTSTARGET Start-Up
Project Descriptions%
ownershipPartners Page
Block A 2013 - 2015 Gas field development up to 110 MMscfd 41.67% Premier, Japex 25
Rimau 2013 Oil field - Enhanced Oil Recovery 95% PD-PDE 26
Senoro 2014 Gas field development up to 250 MMscfd 30% Pertamina 27
DS- LNG 2014 LNG plant , single train of 2.1 mtpa capacity 11.1% Pertamina, Mitsubishi 27
Libya 47 2014 Oil field development of 50,000 - 100,000 bopd 50% Verenex (LIA) 28
Sarulla 2014 - 2015 Geothermal power plant, 3x110 MW 37.25% Kyushu, Ormat, Itochu 29
Major Projects Portfolio
Oil Development
Power Plant
Gas Development
Libya 47
25
Projects Initiatives
SINGA LEMATANGSumateraKalimantanJ a
w
aSulawesiPapua BLOCK ASENORORIMAU EORLNG Plant SARULLA
Projects Initiatives (cont’d)
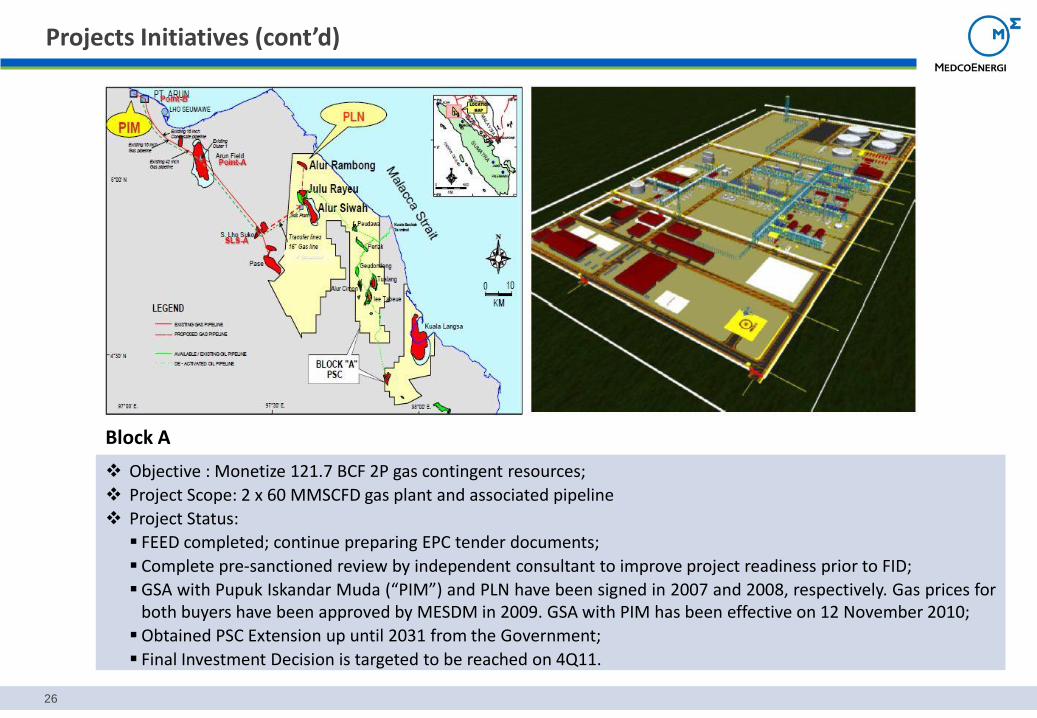
Block A
26
Objective : Monetize 121.7 BCF 2P gas contingent resources;
Project Scope: 2 x 60 MMSCFD gas plant and associated pipeline
Project Status:
FEED completed; continue preparing EPC tender documents;
Complete pre-sanctioned review by independent consultant to improve project readiness prior to FID;
GSA with Pupuk Iskandar Muda (“PIM”) and PLN have been signed in 2007 and 2008, respectively. Gas prices forboth buyers have been approved by MESDM in 2009. GSA with PIM has been effective on 12 November 2010;
Obtained PSC Extension up until 2031 from the Government;
Final Investment Decision is targeted to be reached on 4Q11.
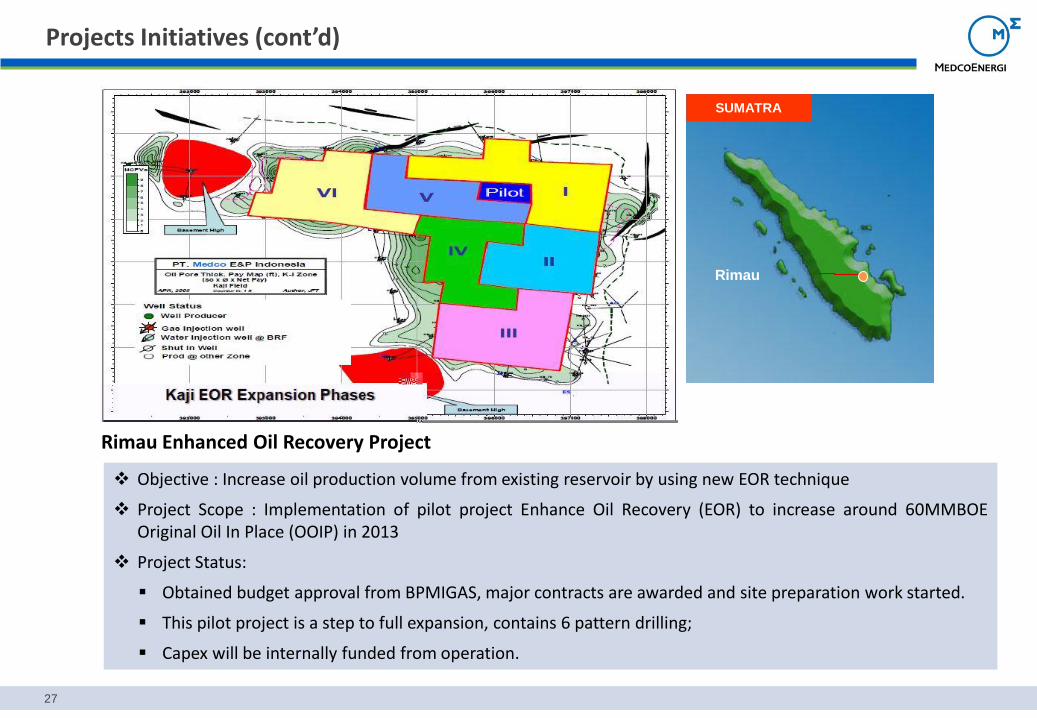
Rimau Enhanced Oil Recovery Project
SUMATRA
Rimau
Objective : Increase oil production volume from existing reservoir by using new EOR technique
Project Scope : Implementation of pilot project Enhance Oil Recovery (EOR) to increase around 60MMBOEOriginal Oil In Place (OOIP) in 2013
Project Status:
Obtained budget approval from BPMIGAS, major contracts are awarded and site preparation work started.
This pilot project is a step to full expansion, contains 6 pattern drilling;
Capex will be internally funded from operation.
27
Projects Initiatives (cont’d)
28
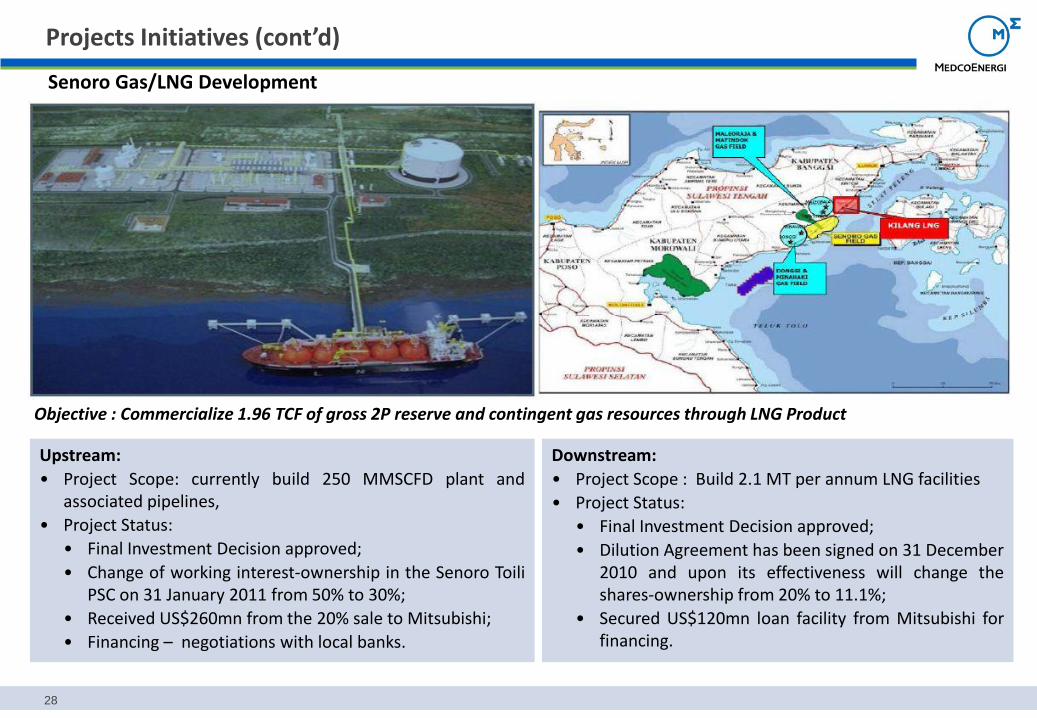
Senoro Gas/LNG Development
Objective : Commercialize 1.96 TCF of gross 2P reserve and contingent gas resources through LNG Product
Projects Initiatives (cont’d)
Upstream:
• Project Scope: currently build 250 MMSCFD plant andassociated pipelines,
• Project Status:
• Final Investment Decision approved;
• Change of working interest-ownership in the Senoro ToiliPSC on 31 January 2011 from 50% to 30%;
• Received US$260mn from the 20% sale to Mitsubishi;
• Financing – negotiations with local banks.
Downstream:
• Project Scope : Build 2.1 MT per annum LNG facilities
• Project Status:
• Final Investment Decision approved;
• Dilution Agreement has been signed on 31 December2010 and upon its effectiveness will change theshares-ownership from 20% to 11.1%;
• Secured US$120mn loan facility from Mitsubishi forfinancing.
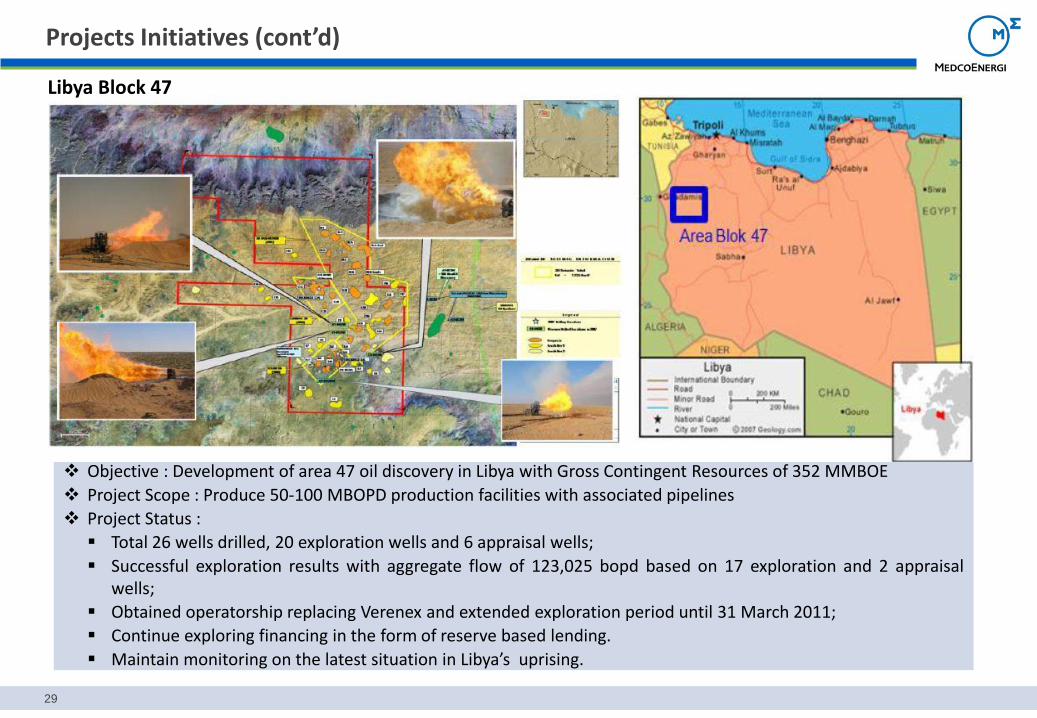
Objective : Development of area 47 oil discovery in Libya with Gross Contingent Resources of 352 MMBOE
Project Scope : Produce 50-100 MBOPD production facilities with associated pipelines
Project Status :
Total 26 wells drilled, 20 exploration wells and 6 appraisal wells;
Successful exploration results with aggregate flow of 123,025 bopd based on 17 exploration and 2 appraisalwells;
Obtained operatorship replacing Verenex and extended exploration period until 31 March 2011;
Continue exploring financing in the form of reserve based lending.
Maintain monitoring on the latest situation in Libya’s uprising.
Projects Initiatives (cont’d)
29
Libya Block 47
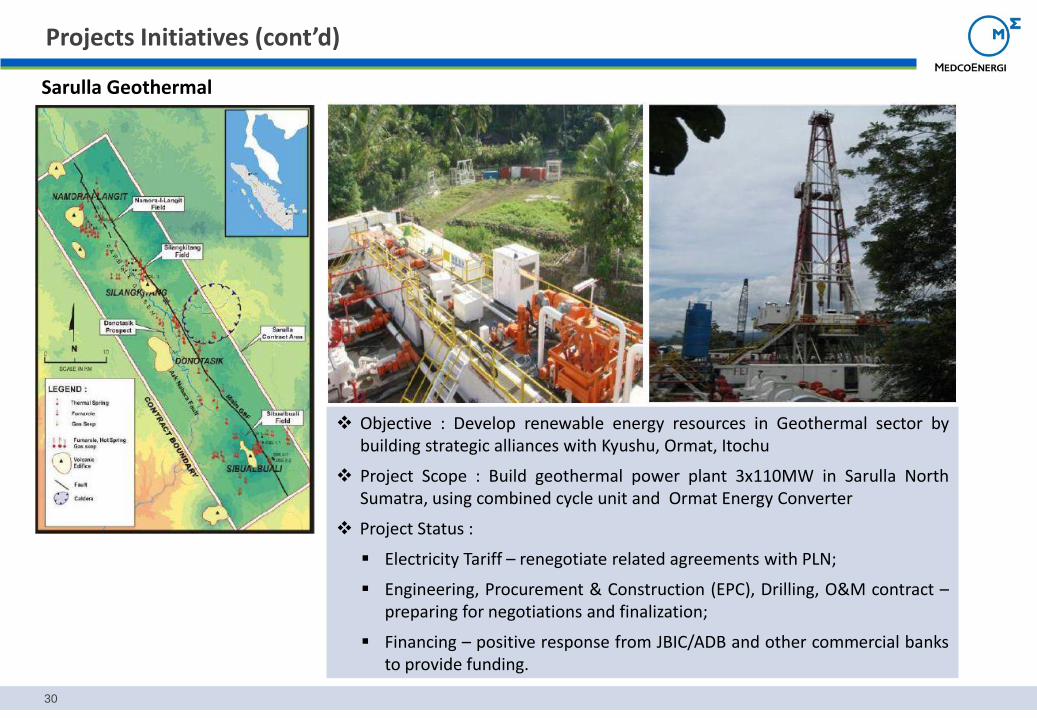
Sarulla Geothermal
Objective : Develop renewable energy resources in Geothermal sector bybuilding strategic alliances with Kyushu, Ormat, Itochu
Project Scope : Build geothermal power plant 3x110MW in Sarulla NorthSumatra, using combined cycle unit and Ormat Energy Converter
Project Status :
Electricity Tariff – renegotiate related agreements with PLN;
Engineering, Procurement & Construction (EPC), Drilling, O&M contract –preparing for negotiations and finalization;
Financing – positive response from JBIC/ADB and other commercial banksto provide funding.
30
Projects Initiatives (cont’d)
This document contains certain results of operation, and may also contain certain projections, plans,strategies, policies and objectives of the Company, which could be treated as forward lookingstatements within the meaning of applicable law. Forwards looking statements, by their nature,involve risks and uncertainties that could cause actual results and development to differ materiallyfrom those expressed or implied in these statements. PT MEDCO ENERGI INTERNASIONAL TBK. doesnot guarantee that any action, which should have been taken in reliance on this document will bringspecific results as expected.
Disclaimer
31
Company address:PT Medco Energi Internasional Tbk.The Energy Building 52nd FloorSCBD Lot 11AJl. Jend. Sudirman, Jakarta 12190IndonesiaP. +62-21 2995 3000F. +62-21 2995 3001
Investor Relations:
Nusky SuyonoM. +62-816 895 928Email: [email protected]
Nugraha AdiM. +62-819 815 815Email: [email protected]
Website: www.medcoenergi.com