t mtbe contaminated water using uv/c advanced … · information description production 65% of the...
TRANSCRIPT

TREATMENT OF MTBE CONTAMINATED WATER USINGUV/CHLORINE ADVANCED OXIDATION PROCESS
By
A. Kedir, B. Tawabini, A. Shaibani, A. Bukhari
Feb.19th, 2015
1
Water Arabia 2015Le Meridien |Khobar, Saudi Arabia

Presentation Outline
1. Introduction
2. Research Objective
3. Methodology
4. Result and discussion
5. Conclusion
2

Introduction
Information Description
Production 65% of the world MTBE production in volume by China, USA, Saudi Arabia,
Netherlands and South Korea,
Uses 90% used as gasoline additive to raise the oxygen content
11-15% by volume blended with gasoline
Physicochemical
properties
High solubility in water : 50,000 mg/L, 30times more soluble than Benzene
Low Koc : difficult to be adsorbed
low Henry’s constant (0.02-0.05 at 25 C) – difficult to strip out
Resistant to microbial decomposition in water
3
Methyl-Tertiary Butyl Ether (MTBE)
(WHO, 2005; USEPA; ATSDR; Health Canada 2006; PME)
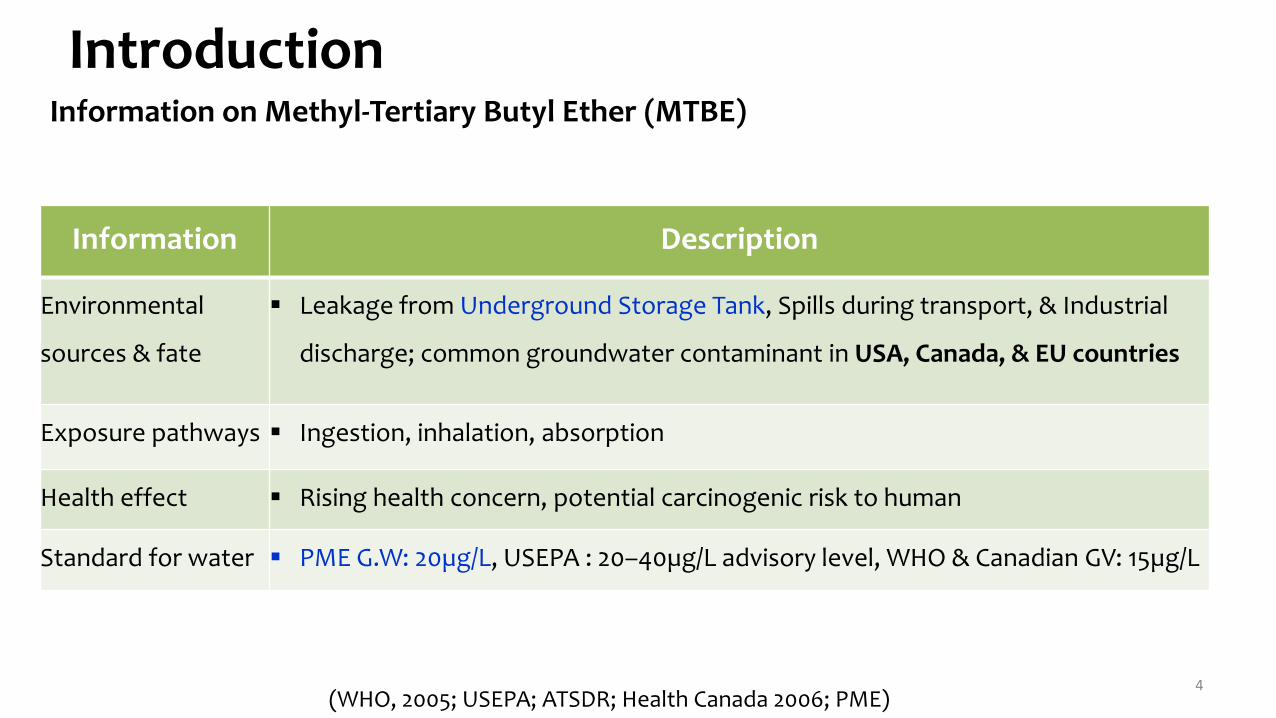
Introduction
Information Description
Environmental
sources & fate
Leakage from Underground Storage Tank, Spills during transport, & Industrial
discharge; common groundwater contaminant in USA, Canada, & EU countries
Exposure pathways Ingestion, inhalation, absorption
Health effect Rising health concern, potential carcinogenic risk to human
Standard for water PME G.W: 20µg/L, USEPA : 20–40µg/L advisory level, WHO & Canadian GV: 15µg/L
4
Information on Methyl-Tertiary Butyl Ether (MTBE)
(WHO, 2005; USEPA; ATSDR; Health Canada 2006; PME)

Different treatment methods used for MTBE removal
MTBE Removal methods Comment
Adsorption (GAC) Low affinity to solids/spent adsorbent disposal
Air Stripping Expensive , have higher operating costs
& water to air contaminant transfer
Biodegradation Less efficient, long treatment time, not well developed
Advanced oxidation
processes
A promising technology that completely mineralize the
contaminants into H2O & CO2
(Levchuk, Bhatnagar et al. 2014)
Hamid and Ali, 2004

Different treatment methods used for MTBE removal
6 Hamid and Ali, 2004
UV + O3, H2O2, Fenton, TiO2,
ChlorineOH• + MTBE
TBF, TBA, Acetone
CO2+H2O
(Ray et al., 2006)
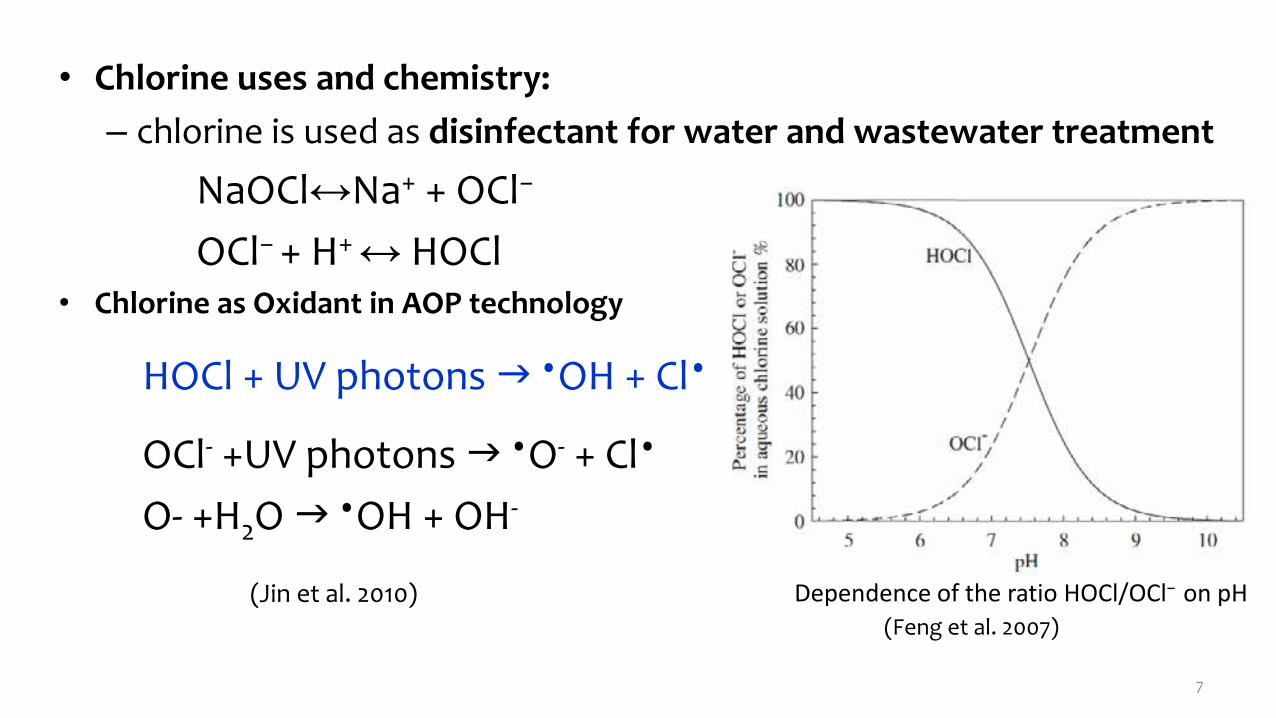
• Chlorine uses and chemistry:
– chlorine is used as disinfectant for water and wastewater treatment
NaOCl↔Na+ + OCl−
OCl− + H+ ↔ HOCl• Chlorine as Oxidant in AOP technology
HOCl + UV photons •OH + Cl•
OCl- +UV photons •O- + Cl•
O- +H2O •OH + OH-
(Jin et al. 2010)
7
Dependence of the ratio HOCl/OCl− on pH(Feng et al. 2007)
8
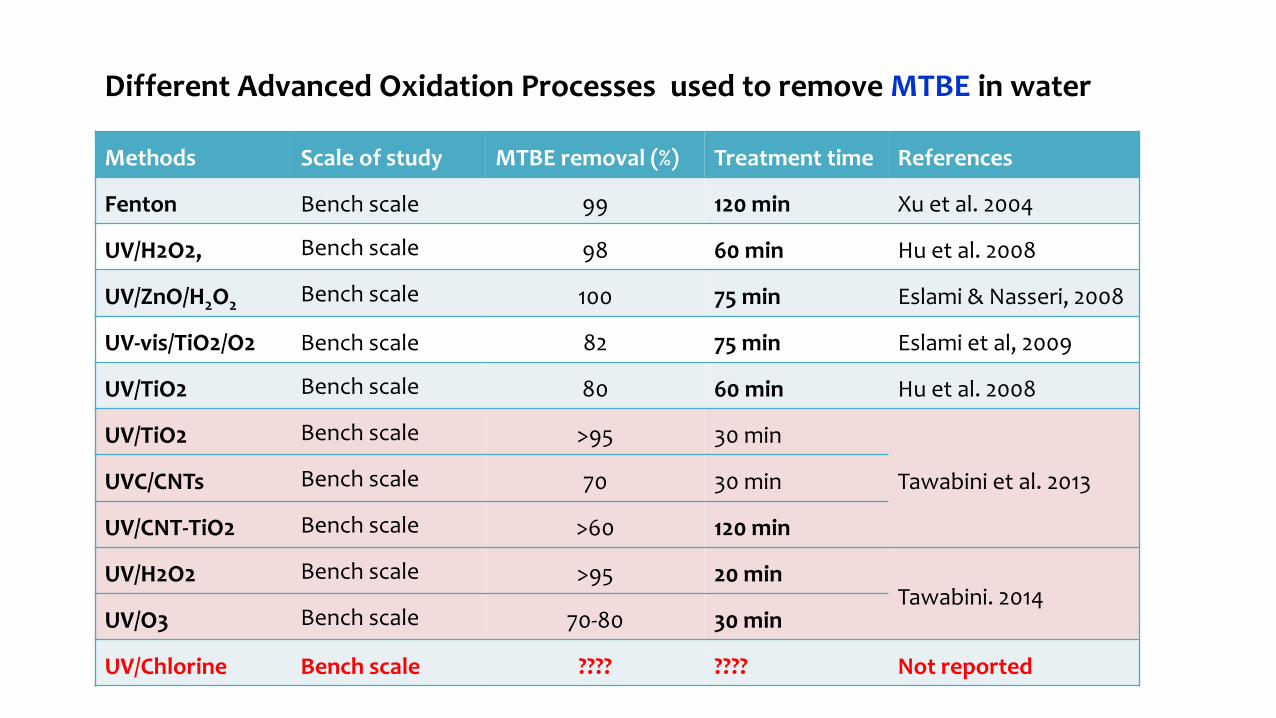
Methods Scale of study MTBE removal (%) Treatment time References
Fenton Bench scale 99 120 min Xu et al. 2004
UV/H2O2, Bench scale 98 60 min Hu et al. 2008
UV/ZnO/H2O2Bench scale 100 75 min Eslami & Nasseri, 2008
UV-vis/TiO2/O2 Bench scale 82 75 min Eslami et al, 2009
UV/TiO2 Bench scale 80 60 min Hu et al. 2008
UV/TiO2 Bench scale >95 30 min
Tawabini et al. 2013 UVC/CNTs Bench scale 70 30 min
UV/CNT-TiO2 Bench scale >60 120 min
UV/H2O2 Bench scale >95 20 minTawabini. 2014
UV/O3 Bench scale 70-80 30 min
UV/Chlorine Bench scale ???? ???? Not reported
Different Advanced Oxidation Processes used to remove MTBE in water
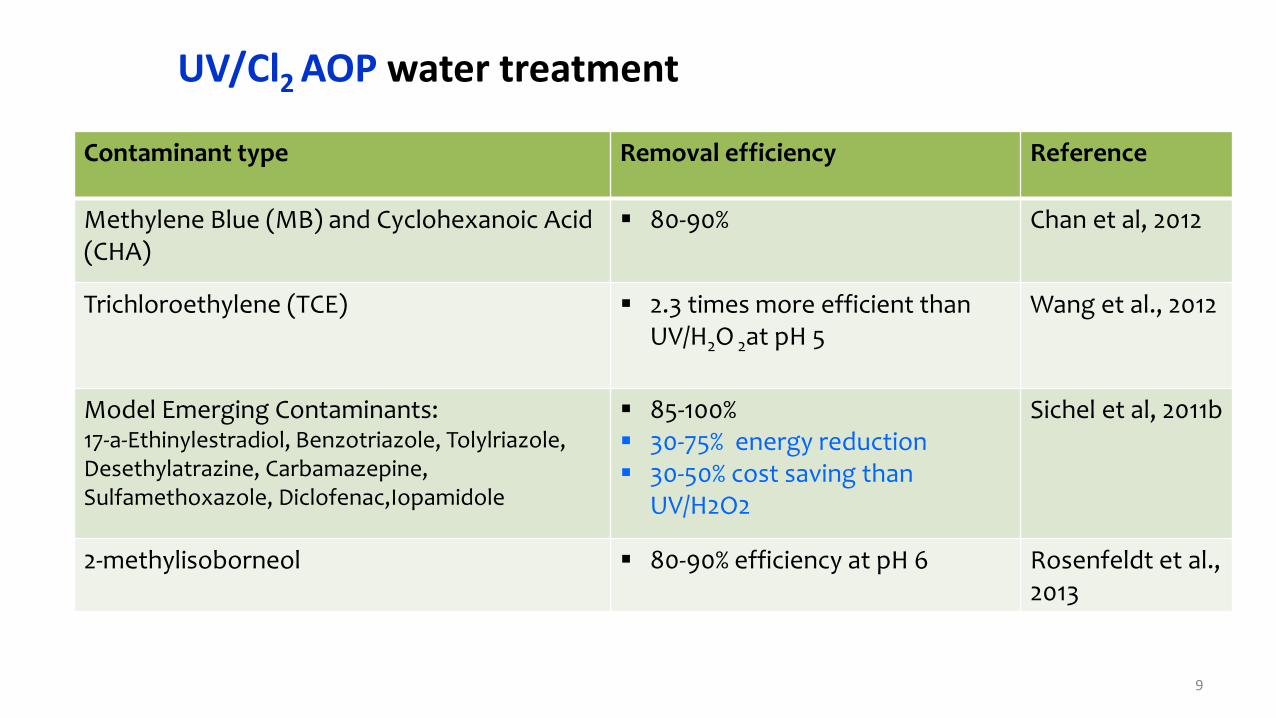
Contaminant type Removal efficiency Reference
Methylene Blue (MB) and Cyclohexanoic Acid (CHA)
80-90% Chan et al, 2012
Trichloroethylene (TCE) 2.3 times more efficient than UV/H2O 2at pH 5
Wang et al., 2012
Model Emerging Contaminants:17-a-Ethinylestradiol, Benzotriazole, Tolylriazole, Desethylatrazine, Carbamazepine, Sulfamethoxazole, Diclofenac,Iopamidole
85-100% 30-75% energy reduction 30-50% cost saving than
UV/H2O2
Sichel et al, 2011b
2-methylisoborneol 80-90% efficiency at pH 6 Rosenfeldt et al., 2013
9
UV/Cl2 AOP water treatment

Research Motivation and Objectives
High production and wide use of MTBE, growing Health concern, & regulated
MTBE is the common ground water pollutants and expensive to treat
There is need for investigating an alternative treatment technologies to remove
MTBE in water
No work has been reported on the removal of MTBE in water by UV/chlorine AOP
The main objective of this study was to assess the efficiency of
MTBE removal in water using UV/Chlorine AOP
10

Methodology
• Instruments used
NORMAG Photo-reactor
Thermo Scientific GC-MS
Desktop pH meter
11Thermo GC/MS with HS/P&T

Methods…. Experimental setup
Reactor /vesselHoused with two types of UV:
a) LP UV: 6.5x10⁻³ W/cm2, 254 nmb) MP UV: 5.3 x 10⁻² W/cm2, 200-400 nm
UV power unit Circulation pump (Hostaflon®)
Experiment procedure 1. Adjust pH of the water 2. Spike MTBE (1ppm)3. 10min circulation to homogenize 4. Treatment types (Chlorine alone, UV alone, UV/chlorine)5. Monitoring MTBE residual and byproducts after certain time interval
NORMAG Photo-reactor
UV Lamp
UV Power
Source Circulation Pump
Sample vessel
Thermometer
12

Methods….• Sample analysis
– EPA Method 524.2 protocol was used for MTBE & byproducts analysis
• Quality control– Ultra pure Deionized Water
– Instrument calibration (R2>0.99)
– Replicate experiment
– Duplicate analysis
• Data analysis and presentation – MS Excel sheet 2010
– Graphs , & tables
– Electrical Energy per Order (EEO)
13
MTBEY = 278312+12219.1*X R^2 = 0.9999 W: Equal
0 2000 4000ppb
0
20000000
40000000
60000000
Are
a
TBFY = 15924+2624.77*X R^2 = 0.9977 W: Equal
0 200 400 600ppb
0
500000
1000000
1500000
Are
a

Result and discussion
20

21
0
20
40
60
80
100
120
0 5 10 15 30
% M
TBE
Re
sid
ual
Time (min)
25 ppm Cl2 + LP-UV @ pH 5
25 ppm Cl2 + LP-UV @ pH 7
25 ppm Cl2 + LP-UV @ pH 9
0
20
40
60
80
100
120
0 5 10 15 30
% M
TBE
Re
sid
ual
Time (min)
25 ppm Cl2 + MP-UV @ pH 5
25 ppm Cl2 + MP-UV @ pH 7
25 ppm Cl2 + MP-UV @ pH 9
Figure 1. . Effect of pH 0n MTBE degradation with LP UV/Cl2 Figure 2. Effect of pH 0n MTBE degradation with MP UV/Cl2
Effect of pH on the MTBE degradation with LP & MP UV/Cl2

Effect of pH on the MTBE degradation with LP & MP UV/Cl2
After 30 min >99% MTBE removal observed regardless of pH
LP UV is more efficient for both MTBE and its byproducts removal concurrently
The MTBE degradation could be due to:
UV photolysis and/or
Oxidation by OH radical and free chlorine
In UV/Cl2, OH radical is a major reason for degradation due to higher quantum yield, and
less radical scavenging effect by HOCl than H2O2 (Rosenfeldt et al., 2013)
OH radical attack on O-C (71%) and methyl group (29%) (Baus & Brauch, 2007)
23
24
0
20
40
60
80
100
120
0 5 10 15 30
% M
TBE
Re
sid
ual
Time (min)
Control @ pH 5 10 ppm Cl2 + LP-UV @ pH 5
25 ppm Cl2 + LP-UV @ pH 5 50 ppm Cl2 + LP-UV @ pH 5
0
20
40
60
80
100
120
0 5 10 15 30
% M
TBE
Re
sid
ual
Time(Min)
Control @pH 7 MP-UV + 2 ppm Cl2
MP-UV+ 5 ppm Cl2 MP-UV + 10 ppm Cl2
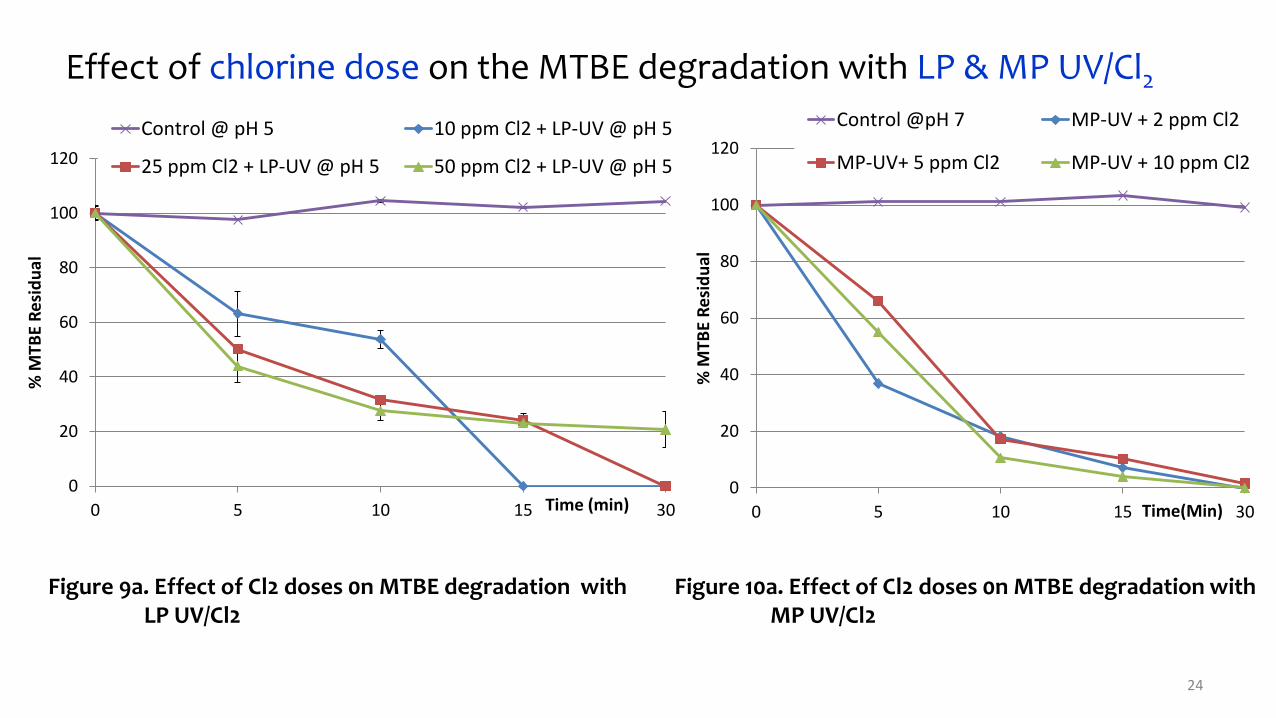
Figure 9a. Effect of Cl2 doses 0n MTBE degradation with LP UV/Cl2
Figure 10a. Effect of Cl2 doses 0n MTBE degradation withMP UV/Cl2
Effect of chlorine dose on the MTBE degradation with LP & MP UV/Cl2
Effect of chlorine dose on the MTBE degradation with LP & MP UV/Cl2
At lower Cl2 dose >99% MTBE remove was achieved for both UV lamps
The higher Cl2 dose might have scavenging effect on the OH radical
Other studies reported :
80-90% removal of Methylisobreneol (MIB) by UV/Cl2 (Rosenfeldt et al., 2013)
>95% of MTBE removal by LP &MP UV/H2O2 after 20 min, 70-80% by LP&MP UV/O3 in
30min (Tawabini 2014)
The differences mainly due to the water quality differences, initial MTBE
concentration and the OH radical yied
26

MTBE removal in groundwaterby UV/Cl2 AOP
Optimization criteria: Higher MTBE removal efficiency Lower concentrations of byproducts Minimum chlorine dose Short treatment time Less electrical energy
Optimum condition obtained: • LP UV with 10ppm Cl2 at pH 5, 30 min
>99% MTBE removal in GW was achieved and superior than other AOPs
27
0
20
40
60
80
100
120
0 5 10 15 30
% M
TBE
Re
sid
ual
Time (min)
LP-UV + 10 ppm Cl2
LP-UV alone
0
50
100
150
200
250
300
350
400
0 5 10 15 30C
on
cen
trat
ion
(p
pb
)Time (min)
AcetoneTBATBF
Figure 11a. MTBE degradation in groundwater with LP UV/Cl2
Figure 11b. TBF concentration

Comparison of MTBE removal efficiency & EEO of UV/Cl2 & other AOP
28
AOP type Scale of study MTBE removal (%) Treatment timeEEO (kWh/m3)
References
UV/TiO2 Bench scale >95 30 min Not reported
Tawabini et al. 2013 UVC/CNTs Bench scale 70 30 min Not reported
UV/CNT-TiO2 Bench scale >60 120 min Not reported
UV/O3 Bench scale 70-80 30 min Not reportedTawabini. 2014
UV/H2O2 Bench scale >95 20 min 4.16-5.55
UV/Cl2 Bench scale >99 15-30 4.01-6.90 This work
The MTBE removal obtained by UV/Cl2 is more efficient than other AOPs
The EEO determined for UV/Cl2 is consistent with other studies (Baus & Brauch 200, Tawabini 2014)
The overall operation cost of UV/Cl2 is cheaper than UV/H2O2 (Rosenfeldt et al., 2013)

Conclusion
>99% MTBE removal efficiency was achieved using LPUV/Cl2 in both DI water & groundwater
Less chemical consumption, short treatmenttime and relatively low EEO was attained
29

Recommendations
• The following recommendations are proposed:
– Further study is need on chlorine based chemical oxidation process
– The chlorine based advanced oxidation process in combination with
other oxidant should be investigated
– The cost estimation for UV/Cl2 in terms of energy and operation
needs further investigation at pilot scale
30

Acknowledgment
• I would like thank
– Earth Sciences Department for allowing me to conduct this study in the Env’tal lab and different support during the study
– Center for Environment and Water (CEW)
31

32