supporting information - benthamopen.com · cross-fitting of residual dipolar couplings the open...
TRANSCRIPT

The Open Spectroscopy Journal, 2010, 4, i-xvi i
Open Access
SUPPORTING INFORMATION
Cross-Fitting of Residual Dipolar Couplings
Grit Kummerlöwe, Sebastian Schmitt, Burkhard Luy
Department Chemie, Technische Universität München, Lichtenbergstraße 4, Garching, Germany
Table S1. Chemical Shifts(a)
of Cholesterol and 5- -Cholestan-3-one in CDCl3
cholesterol 5- -cholestan-3-one
Group 13
C [ppm] 1Ha
(b) [ppm]
1Hb
(b) [ppm]
13C [ppm]
1Ha
(b) [ppm]
1Hb
(b) [ppm]
C1 37.3 1.1 ( ) 1.9 ( ) 38.6 1.3 ( ) 2.0 ( )
C2 31.6 1.5 ( ) 1.8 ( ) 38.1 2.3 ( ) 2.4 ( )
C3 71.7 3.5 - 212.1 - -
C4 42.3 2.2 2.3 44.7 2.1 ( ) 2.2 ( )
C5 141.2 - - 46.7 1.5 -
C6 121.6 5.4 - 29.0 1.3 1.3
C7 31.9 1.5 ( ) 2.0 ( ) 31.7 0.9 ( ) 1.7 ( )
C8 31.9 1.5 - 35.4 1.4 -
C9 50.2 0.9 - 53.9 0.7 -
C10 36.9 - - 36.0 - -
C11 21.1 1.5 1.5 21.5 1.4 ( ) 1.5 ( )
C12 39.8 1.2 ( ) 2.0 ( ) 39.9 1.1 ( ) 2.0 ( )
C13 42.7 - - 43.0 - -
C14 56.8 1.0 - 56.3 1.0 -
C15 24.3 1.1 1.6 24.2 1.1 1.6
C16 28.3 1.3 1.8 28.3 1.2 1.8
C17 56.2 1.1 - 56.3 1.1 -
C18 11.9 0.7 - 12.1 0.7 -
C19 19.4 1.0 - 11.4 1.0 -
C20 35.8 1.4 - 35.8 1.4 -
C21 18.8 0.9 - 18.7 0.9 -
C22 36.2 1.0 1.4 36.2 1.0 1.3
C23 23.9 1.2 1.4 23.8 1.1 1.3
C24 39.6 1.1 1.2 39.5 1.1 1.1
C25 28.0 1.5 - 28.0 1.5 -
C26 22.7 0.9 - 22.8 0.9 -
C27 22.9 0.9 - 22.6 0.8 -
(a) Chemical shifts are referenced to the solvent signals: 1H (CHCl3) = 7.26 ppm and 13C (CDCl3) = 77.2 ppm. (b) The prochiral assignment for H and H protons was done with the help of measured RDCs (see tables (S2) and (S4)). Protons a and b have not been assigned to position and wherever no or inconclusive RDCs were measured.

ii The Open Spectroscopy Journal, 2010, Volume 4 Kummerlöwe et al.
Fig. (S1). Structure and nomenclature of cholesterol (A), 5- -cholestan-3-one (B) and their diastereomers 10- -cholesterol (C) and 5- -
cholestan-3-one (D).
QUALITY FACTOR FOR VALIDATION OF FITS:
To compare fits of measured RDCs against different structural models, a quality factor for these fits is necessary. On the one hand it should consider how strong measured and back-calculated values differ and, on the other hand, it should take into ac-count the experimental error of the measured values. This is described by
2 defined as:
with xmeas. and xcalc. being the measured and back-calculated values, respectively, and xmeas. being the experimental errors of xmeas. As
2 increases with an increasing number n of measured values, we found the best measure for the quality of a fit would
be the normalized n/2, which should be as high as possible.
The quality factor is optimized for the comparison of different fits to a single set of experimental RDCs, including the impor-tant individual maximum error estimates for the measured values. Other quality factors are available which are adapted to other specifications. Therefore we give for comparison also the correlation coefficient, R, and the quality factor by Cornilescu et al., Q,[1] in all tables of the Supporting Information.

Cross-Fitting of Residual Dipolar Couplings The Open Spectroscopy Journal, 2010, Volume 4 iii
Table S2. Couplings of Cholesterol Measured in Solution (1JCH) and in the Stretched PDMS Gel (
1TCH), Corresponding RDCs (
1DCH)
and RDCs Back Calculated with the bestFit Option of PALES (SVD-Fit) [2, 3]. All Couplings are Given in Hz
Group (a)
1JCH
1TCH =
1JCH +
1DCH
1DCH (exp)
1DCH (calc) (SVD-fit)
C18-H18 124.3 ± 0.3 117.3 ± 0.5 -7.0 ± 0.6(b) (1.9)(b)
C19-H19 125.6 ± 0.3 119.0 ± 0.5 -6.6 ± 0.6(b) (1.8)(b)
C16-H16a 125.3 ± 3.0 125.6 ± 5.0 0.3 ± 5.8 -(c)
C16-H16b 129.7 ± 3.0 134.8 ± 5.0 5.1 ± 5.8 -(c)
C15-H15b 130.0 ± 3.0 144.0 ± 5.0 14.0 ± 5.8 -(c)
C2-H2 129.3 ± 2.5 140.6 ± 3.0 11.3 ± 3.9 9.6
C2-H2 125.2 ± 2.5 141.3 ± 3.0 16.1 ± 3.9 16.5
C8-H8 122.0 ± 3.0 142.7 ± 8.0 20.7 ± 8.5 22.3
C7-H7 126.5 ± 3.0 140.7 ± 5.0 14.2 ± 5.8 11.7
C1-H1 128.4 ± 1.0 137.4 ± 1.0 9.0 ± 1.4 9.1
C1-H1 124.3 ± 0.8 142.5 ± 1.2 18.2 ± 1.4 19.2
C12-H12 123.2 ± 1.0 145.6 ± 1.0 22.4 ± 1.4 21.8
C12-H12 127.0 ± 1.0 132.1 ± 1.0 5.1 ± 1.4 4.6
C6-H6 152.7 ± 0.3 154.3 ± 3.0 1.6 ± 3.0 2.2
C9-H9 122.4 ± 0.5 146.0 ± 4.0 23.6 ± 4.0 21.7
C3-H3 142.1 ± 0.5 161.4 ± 1.5 19.3 ± 1.6 17.9
C21-H21 124.1 ± 0.3 119.2 ± 0.5 -4.9 ± 0.6 -(d)
C25-H25 124.8 ± 0.5 135.6 ± 0.8 10.8 ± 0.9 -(d)
C20-H20 123.6 ± 0.5 146.9 ± 1.0 23.3 ± 1.1 -(d)
C27-H27 124.1 ± 0.3 124.3 ± 0.3 -0.2 ± 0.4 -(d)
C26-H26 124.1 ± 0.3 123.9 ± 0.3 0.2 ± 0.4 -(d)
C23-H23a 124.1 ± 1.0 142.2 ± 5.0 18.1 ± 5.1 -(d)
C23-H23b 124.3 ± 1.0 129.5 ± 2.5 5.2 ± 2.7 -(d)
C22-H22a 123.0 ± 5.0 148.6 ± 4.0 25.6 ± 6.4 -(d)
C22-H22b 126.0 ± 10.0 134.7 ± 3.0 8.7 ± 10.4 -(d)
Group 2JHH 2THH = 2JHH + 2DHH 2DHH (exp) 2DHH (calc) (SVD-fit)
H16 -H16 -12.0 ± 2.0 5.7 ± 3.0 17.7 ± 3.6 -(c)
H15 -H15 -11.0 ± 3.0 3.0 ± 3.0 14.0 ± 4.2 -(c)
H2 -H2 -12.2 ± 1.0 6.7 ± 2.0 18.9 ± 2.2 20.6
H7 -H7 -16.0 ± 3.0 1.7 ± 5.0 17.7 ± 5.8 19.8
H1 -H1 -13.0 ± 1.0 2.0 ± 2.0 15.0 ± 2.2 15.8
H12 -H12 -12.2 ± 1.0 2.0 ± 2.0 14.2 ± 2.2 14.1
H4 -H4 -12.7 ± 2.0 3.0 ± 2.0 15.7 ± 2.8 16.8
(a) The prochiral assignment for all H and H protons was determined by fitting all possible permutations with the -bestFit option of PALES [2, 3] and selecting the one with the best fitting result (in terms of highest n/ 2 value). (b) DCH-couplings of methyl-groups have been converted to the corresponding DCC-couplings[4]: (DCC(C18-C13) = 1.9 ± 0.2 Hz; DCC(C19-C10) = 1.8 ± 0.2 Hz). (c) As couplings in the D-ring did not fit in the initial fittings (see main text) they were not used in further fittings. (d) Couplings measured in the flexible side chain were not used for PALES fits.

iv The Open Spectroscopy Journal, 2010, Volume 4 Kummerlöwe et al.
Table S3. RDCs Measured on Cholesterol and RDCs Back Calculated for Cholesterol and 10- -Cholesterol for the -bestFit Method
(SVD), the Fit with Fixed Orientation Given by the Alignment Tensor of 5- -Cholestan-3-one (Cross-fitting) and Fit with
Orientation Predicted by PALES [2, 3]. Additionally Alignment Tensor Parameters and Quality Factors for the Different
fits are Given: Axial and Rhombic Components (Da, Dr) and Principal Axes of the Alignment Tensor (Axx, Ayy, Azz) with
their Corresponding Eigenvectors (EV), Number of RDCs used for Fitting (n) and Quality Factors 2, n/
2, Correlation
Factor (R) and Quality Factor by Cornilescu et al. [1]. All Couplings are Given in Hz
D (exp) D (calc) (SVD-fit) D (calc) (cross-fitting) D (calc) (predicted C1-C27)
Group
Cholesterol 10 Cholesterol Cholesterol 10 Cholesterol Cholesterol 10 Cholesterol
C18-C13 1.9 ± 0.2 1.9 2.0 2.0 2.0 1.8 2.0
C19-C10 1.8 ± 0.2 1.8 1.6 2.0 0.5 1.7 1.2
C2-H2 11.3 ± 3.9 9.6 10.9 5.0 4.6 4.9 7.8
C2-H2 16.1 ± 3.9 16.5 16.1 20.7 22.9 15.0 18.2
C8-H8 20.7 ± 8.5 22.3 21.3 25.4 25.2 21.7 20.6
C7-H7 14.2 ± 5.8 11.7 23.0(a) 7.2 23.9(a) 6.5 22.4(a)
C1-H1 9.0 ± 1.4 9.1 6.7(a) 7.5 5.3 11.2 11.5(a)
C1-H1 18.2 ± 1.4 19.2 17.9(a) 23.3 8.8 18.2 12.8(a)
C12-H12 22.4 ± 1.4 21.8 20.9 24.6 24.8 21.3 20.7
C12-H12 5.1 ± 1.4 4.6 6.0 3.5 3.7 8.7 12.5
C6-H6 1.6 ± 3.0 2.2 5.7 2.1 8.5 7.1 9.5
C9-H9 23.6 ± 4.0 21.7 18.7 24.4 24.7 21.2 19.0
C3-H3 19.3 ± 1.6 17.9 18.6 22.0 4.2 16.7 14.9
H2 -H2 18.9 ± 2.2 20.6 23.8 21.9 18.9 19.6 20.7
H7 -H7 17.7 ± 5.8 19.8 19.2 20.7 11.7 18.4 15.3
H1 -H1 15.0 ± 2.2 15.8 15.6 15.1 14.8 15.3 14.8
H12 -H12 14.2 ± 2.2 14.1 15.4 13.0 13.4 15.5 19.8
H4 -H4 15.7 ± 2.8 16.8 13.9 16.3 2.5 15.9 14.7
Da -3.94E-04 -3.56E-04 -3.97E-04 -3.72E-04 -4.06E-04
Dr -6.44E-05 -1.31E-04 -1.10E-04 -7.02E-05 -6.97E-05
Axx 2.98E-04 1.59E-04 2.32E-04 2.67E-04 3.02E-04
Ayy 4.91E-04 5.53E-04 5.62E-04 4.77E-04 5.11E-04
Azz -7.89E-04 -7.12E-04 -7.94E-04 -7.44E-04 -8.12E-04
EV Axx -0.48; 0.85;
-0.22 -0.36; 0.93; -0.09 -0.45; 0.87; -0.19
-0.34; 0.92;
-0.17
-0.24; 0.92;
-0.31
EV Ayy -0.58; -0.12;
0.80 -0.43; -0.08; 0.90 -0.65; -0.17; 0.74
-0.61; -0.08;
0.79 -0.55; 0.13; 0.83
EV Azz 0.65; 0.52;
0.55 0.83; 0.36; 0.43 0.62; 0.45; 0.64
0.71; 0.38;
0.59 0.80; 0.37; 0.47
n 18 18 18 18 18 18
2 3.32 16.96 30.71 225.07 21.17 82.82
n/ 2 5.42 1.06 0.59 0.08 0.85 0.22
R 0.984 0.911 0.940 0.679 0.900 0.800
Q 0.082 0.195 0.214 0.435 0.198 0.275
(a) H and H proton assignment was permutated compared to the assignment of cholesterol. (Of all possible permutations of the prochiral methylene groups
only the fit with the best result is shown.)

Cross-Fitting of Residual Dipolar Couplings The Open Spectroscopy Journal, 2010, Volume 4 v
Fig. (S2). Comparison of RDCs measured on cholesterol and back-calculated for the structures of cholesterol (left: A, C, E) and 10- -
cholesterol (right: B, D, F) using the -bestFit option of PALES (SVD-fit) [2, 3] (top: A, B), the cross-fitting approach with the alignment
tensor determined for 5- -cholestan-3-one in PDMS/CDCl3 (middle: C, D) and the prediction by PALES (SVD-fit) [2, 3] (bottom: E, F). The
structures are shown with color-coded bonds denoting the deviation between measured and back-calculated RDCs for the different fits. The
corresponding alignment tensors are visualized with their principal axis systems (black: Azz; gray: Ayy; white: Axx). For all three methods the
cholesterol structure (left) gives clearly the better fit. The direct SVD-fit for 10- -cholesterol (B) results in an alignment tensor which differs
most significantly from the alignment tensors for all other fits, since it tries to match RDCs measured on cholesterol to the wrong structural
model (see also Figure S6). It therefore has the least ability to distinguish the diastereomers. In contrast the fit with the fixed orientation given
by the alignment tensor of 5- -cholestan-3-one (D) shows small deviations (yellow) in regions similar to cholesterol (C-ring) and strong de-
viations (red) for those different to cholesterol (A- and B-ring).
vi The Open Spectroscopy Journal, 2010, Volume 4 Kummerlöwe et al.
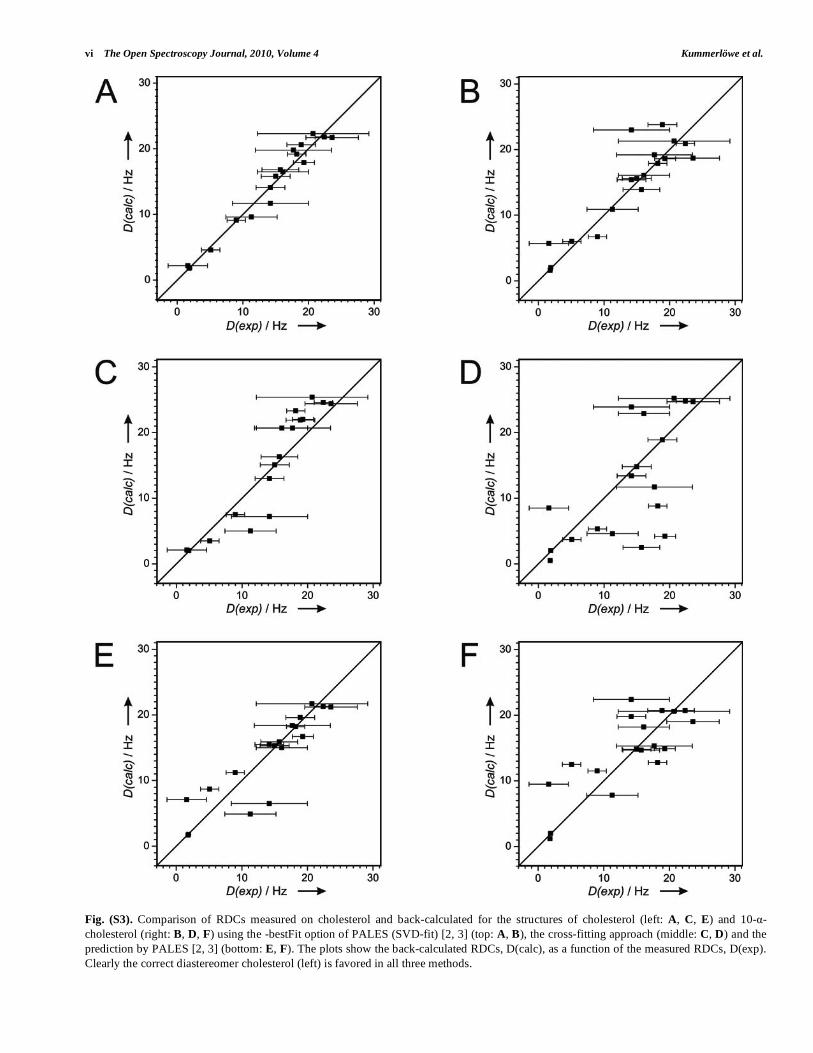
Fig. (S3). Comparison of RDCs measured on cholesterol and back-calculated for the structures of cholesterol (left: A, C, E) and 10- -
cholesterol (right: B, D, F) using the -bestFit option of PALES (SVD-fit) [2, 3] (top: A, B), the cross-fitting approach (middle: C, D) and the
prediction by PALES [2, 3] (bottom: E, F). The plots show the back-calculated RDCs, D(calc), as a function of the measured RDCs, D(exp).
Clearly the correct diastereomer cholesterol (left) is favored in all three methods.

Cross-Fitting of Residual Dipolar Couplings The Open Spectroscopy Journal, 2010, Volume 4 vii
Table S4. Couplings of 5- -Cholestan-3-one Measured in Solution (1JCH) and in the Stretched PDMS gel (
1TCH), Corresponding
RDCs (1DCH) and RDCs Back Calculated with the bestFit Option of PALES (SVD-fit) [2, 3]. All Couplings are Given in Hz
Group (a)
1JCH
1TCH =
1JCH +
1DCH
1DCH (exp)
1DCH (calc) (SVD-fit)
C19-H19 124.4 ± 0.2 117.2 ± 0.8 -7.2 ± 0.8(b) (2.1)(b)
C18-H18 124.1 ± 0.2 116.9 ± 0.5 -7.2 ± 0.5(b) (2.0)(b)
C16-H16a 125.6 ± 3.0 123.7 ± 5.0 -1.9 ± 5.8 -(c)
C16-H16b 129.9 ± 2.0 138.4 ± 3.0 8.5 ± 5.4 -(c)
C15-H15a 126.6 ± 1.0 138.2 ± 5.0 11.6 ± 5.1 -(c)
C15-H15b 130.1 ± 1.0 144.1 ± 5.0 14.0 ± 5.1 -(c)
C11-H11 122.1 ± 0.2 148.8 ± 3.0 26.7 ± 3.0 24.4
C11-H11 125.5 ± 0.2 131.0 ± 3.0 5.5 ± 3.0 3.9
C7-H7 127.9 ± 0.2 132.0 ± 5.0 4.1 ± 5.0 2.5
C7-H7 122.8 ± 0.3 148.7 ± 1.5 25.9 ± 1.5 24.6
C8-H8 122.5 ± 0.3 149.7 ± 1.0 27.2 ± 1.0 25.2
C2-H2 134.1 ± 1.0 141.0 ± 3.0 6.9 ± 3.2 6.4
C2-H2 122.4 ± 1.0 143.5 ± 3.0 21.1 ± 3.2 20.5
C1-H1 129.6 ± 0.7 136.9 ± 1.0 7.3 ± 1.2 7.6
C1-H1 125.8 ± 0.7 146.5 ± 1.5 20.7 ± 1.7 23.5
C12-H12 123.1 ± 0.5 150.5 ± 1.5 27.4 ± 1.6 24.8
C12-H12 127.0 ± 0.5 131.3 ± 1.0 4.3 ± 1.1 3.8
C4-H4 132.6 ± 0.7 139.3 ± 0.8 6.7 ± 1.1 6.9
C4-H4 122.3 ± 0.7 145.0 ± 1.5 22.7 ± 1.7 23.1
C5-H5 123.3 ± 2.0 151.1 ± 3.0 27.8 ± 3.6 24.3
C9-H9 121.3 ± 0.5 145.0 ± 1.0 23.7 ± 1.1 24.7
C21-H21 124.1 ± 0.2 119.1 ± 0.7 -5.0 ± 0.7 -(d)
C25-H25 124.8 ± 0.2 136.2 ± 0.8 11.4 ± 0.8 -(d)
C20-H20 124.0 ± 0.2 147.3 ± 1.0 23.3 ± 1.0 -(d)
C27-H27 124.2 ± 0.2 123.7 ± 0.3 -0.5 ± 0.4 -(d)
C26-H26 124.0 ± 0.2 124.2 ± 0.3 0.2 ± 0.4 -(d)
C23-H23a 124.0 ± 1.8 144.5 ± 8.0 20.5 ± 8.2 -(d)
C23-H23b 123.5 ± 3.0 132.0 ± 8.0 8.5 ± 8.5 -(d)
C22-H22a 123.0 ± 3.0 149.7 ± 5.0 26.7 ± 5.8 -(d)
C22-H22b 125.8 ± 1.0 134.5 ± 5.0 8.7 ± 5.1 -(d)
Group 2JHH 2THH = 2JHH + 2DHH 2DHH (exp) 2DHH (calc) (SVD-fit)
H16 -H16 -10.1 ± 2.0 7.1 ± 3.0 17.2 ± 3.6 -(c)
H15 -H15 -9.9 ± 2.0 5.8 ± 3.0 15.7 ± 3.6 -(c)
H11 -H11 -13.2 ± 1.0 0.0 ± 3.0 13.2 ± 3.2 17.6
H7 -H7 -11.8 ± 1.0 3.0 ± 3.0 14.8 ± 3.2 17.4
H2 -H2 -15.2 ± 1.5 3.0 ± 3.0 18.2 ± 3.4 22.6
H1 -H1 -12.8 ± 1.0 4.2 ± 3.0 17.0 ± 3.2 16.9
H12 -H12 -11.8 ± 1.5 1.5 ± 3.0 13.3 ± 3.4 13.8
H4 -H4 -14.6 ± 1.5 2.4 ± 3.0 17.0 ± 3.4 18.9
(a) The prochiral assignment for all H and H protons was determined by fitting all possible permutations with the -bestFit option of PALES [2, 3] and selecting the one with the best fitting result (in term of highest n/ 2 value). (b) DCH-couplings of methyl-groups have been converted to the corresponding DCC-couplings[4]: (DCC(C19-C10) = 1.9 ± 0.2 Hz; DCC(C18-C13) = 1.9 ± 0.1 Hz) (c) As couplings in the D-ring did not fit in the initial fittings (see main text) they were not used in further fittings. (d) Couplings measured in the flexible side chain were not used for PALES fits.

viii The Open Spectroscopy Journal, 2010, Volume 4 Kummerlöwe et al.
Table S5. RDCs Measured on 5- -Cholestan-3-one and RDCs Back Calculated for 5- -Cholestan-3-one and 5- -Cholestan-3-one a
for the bestFit Method (SVD), the Fit with Fixed Orientation Given by the Alignment Tensor of 5- -Cholestan-3-one
(Cross-fitting) and Fit with Orientation Predicted by PALES [2, 3]. Additionally Alignment Tensor Parameters and Qual-
ity Factors for the Different Fits are Given: Axial and Rhombic Components (Da, Dr) and Principal Axes of the Alignment
Tensor (Axx, Ayy, Azz) with Their Corresponding Eigenvectors (EV), Number of RDCs used for Fitting (n) and Quality
Factors 2, n/
2, Correlation Factor (R) and Quality Factor by Cornilescu et al. [1]. All Couplings are Given in Hz
D (exp) D (calc) (SVD-fit) D (calc) (cross-fitting) D (calc) (predicted C1-C27)
Group
5 Cholestan3one 5 Cholestan3one 5 Cholestan3one 5 Cholestan3one 5 Cholestan3one 5 Cholestan3one 5 Cholestan3one
C19-C10 1.9 ± 0.2 2.1 2.2 1.8 1.7 1.9 1.8
C18-C13 1.9 ± 0.1 2.0 1.7 1.9 1.9 2.0 1.9
C11-H11 26.7 ± 3.0 24.4 22.8 21.5 21.7 23.0 22.0
C11-H11 5.5 ± 3.0 3.9 -9.1 9.0 7.9 1.4 -0.7
C7-H7 4.1 ± 5.0 2.5 -11.2 7.8 6.5 -0.2 -2.6
C7-H7 25.9 ± 1.5 24.5 24.7 21.1 21.8 22.5 22.2
C8-H8 27.2 ± 1.0 25.2 25.5 22.4 22.2 23.9 22.6
C2-H2 6.9 ± 3.2 6.4 -4.9 10.8 1.4(a) 4.7 2.8
C2-H2 21.1 ± 3.2 20.5 26.6 15.7 10.4(a) 16.0 6.1
C1-H1 7.3 ± 1.2 7.6 5.5 9.4 7.5(a) 13.0 11.5(a)
C1-H1 20.7 ± 1.7 23.5 30.0 18.6 14.7(a) 20.0 14.5(a)
C12-H12 27.4 ± 1.6 24.8 24.4 21.8 21.9 23.3 22.2
C12-H12 4.3 ± 1.1 3.8 4.0 5.0 5.0 10.6 11.7
C4-H4 6.7 ± 1.1 6.9 5.3(a) 8.6 5.1(a) 13.0 -10.4
C4-H4 22.7 ± 1.7 23.1 11.0(a) 17.2 -15.4(a) 19.1 11.8
C5-H5 27.8 ± 3.6 24.3 -0.5 20.0 -23.1 21.5 -19.3
C9-H9 23.7 ± 1.1 24.7 25.3 21.5 21.5 23.0 22.0
H11 -H11 13.2 ± 3.2 17.5 10.4 18.2 17.6 17.1 14.5
H7 -H7 14.8 ± 3.2 17.4 9.5 18.1 16.9 16.8 13.3
H2 -H2 18.2 ± 3.4 22.6 26.8 20.9 17.9 21.5 19.6
H1 -H1 17.0 ± 3.2 16.9 16.7 16.9 13.7 17.9 12.4
H12 -H12 13.3 ± 3.4 13.7 6.3 14.7 14.5 17.6 16.4
H4 -H4 17.0 ± 3.4 18.8 7.7 18.2 -12.7 19.4 -2.6
Da -3.97E-04 -4.29E-04 -3.94E-04 -4.32E-04 -4.04E-04
Dr -1.10E-04 -2.08E-04 -6.44E-05 -6.63E-05 -7.87E-05
Axx 2.32E-04 1.17E-04 2.98E-04 3.33E-04 2.86E-04
Ayy 5.62E-04 7.41E-04 4.91E-04 5.32E-04 5.22E-04
Azz -7.94E-04 -8.58E-04 -7.89E-04 -8.64E-04 -8.08E-04
EV Axx -0.45; 0.87; -0.19 0.54; -0.84; -0.99 -0.48; 0.85; -0.22 -0.31; 0.94; -0.16 -0.36; 0.93; -0.08
EV Ayy -0.65; -0.17; 0.74 0.65; 0.49; -0.59 -0.58; -0.12; 0.80 -0.62; -0.07; 0.78 -0.62; -0.18; 0.77
EV Azz 0.62; 0.45; 0.64 0.54; 0.25; 0.80 0.65; 0.52; 0.55 0.72; 0.34; 0.61 0.70; 0.33; 0.64
n 23 23 23 23 23 23
2 20.21 231.92 87.04 865.19 133.31 634.70
n/ 2 1.13 0.10 0.26 0.03 0.17 0.04
R 0.974 0.741 0.929 0.203 0.902 0.429
Q 0.114 0.514 0.212 0.849 0.216 0.700
(a) H and H proton assignment was permutated compared to the assignment of 5- -cholestan-3-one. (Of all possible permutations of the prochiral methylene groups only the fit with the best result is shown).

Cross-Fitting of Residual Dipolar Couplings The Open Spectroscopy Journal, 2010, Volume 4 ix
Fig. (S4). Comparison of RDCs measured on 5- -cholestan-3-one and back-calculated for the structures of 5- -cholestan-3-one (left: A, C,
E) and 5- -cholestan-3-one (right: B, D, F) using the -bestFit option PALES [2, 3] (top: A, B), the cross-fitting approach with the alignment
tensor determined for cholesterol in PDMS/CDCl3 (middle: C, D) and the prediction by PALES [2, 3] (bottom: E, F). The structures are
shown with color-coded bonds denoting the deviation between measured and back-calculated RDCs for the different fits. The corresponding
alignment tensors are visualized with their principal axis systems (black: Azz; gray: Ayy; white: Axx). For all three methods the
5- -cholestan-3-one structure (left) gives clearly the better fit.

x The Open Spectroscopy Journal, 2010, Volume 4 Kummerlöwe et al.
Fig. (S5). Comparison of RDCs measured on 5- -cholestan-3-one and back-calculated for the structures of 5- -cholestan-3-one (left: A, C,
E) and 5- -cholestan-3-one (right: B, D, F) using the -bestFit option of PALES [2, 3] (top: A, B), the cross-fitting approach (middle: C, D)
and the prediction by PALES [2, 3] (bottom: E, F).The plots show the back-calculated RDCs, D(calc), as a function of the measured RDCs,
D(exp). Clearly the correct diastereomer 5- -cholestan-3-one (left) is favored in all three methods.

Cross-Fitting of Residual Dipolar Couplings The Open Spectroscopy Journal, 2010, Volume 4 xi
Fig. (S6). Visualization of the alignment tensor of different steroids as obtained with the SVD method. RDCs measured on cholesterol in a
stretched PDMS/CDCl3 gel have been fitted with the SVD method (-bestFit option in PALES) to the structural models of cholesterol (A) and
its diastereomer 10- -cholesterol (C) and RDCs measured on 5- -cholestan-3-one in a stretched PDMS/CDCl3 gel have been fitted with the
SVD method (-bestFit option in PALES) to the structural models of 5- -cholestan-3-one (B) and its diastereomer 5- -cholestan-3-one (D).
All structures are shown with color-coded bonds representing negative (red) and positive (blue) RDCs and the principle axes of the corre-
sponding alignment tensors are drawn next to it.
Apparently the alignment tensors of cholesterol and 5- -cholestan-3-one in a stretched PDMS/CDCl3 gel are very similar but not fully identi-
cal. In contrast, the alignment tensors obtained by fitting experimental RDCs against the structure of a wrong diastereomer (C, D) differ sig-
nificantly from those for the correct diastereomers (A, B).

xii The Open Spectroscopy Journal, 2010, Volume 4 Kummerlöwe et al.
Out of the 18 measured RDCs of cholesterol, various subsets of 15, 12, 9, 8, 7 and 6 RDCs were generated by random selection of RDC-
combinations. As with a decreasing number of RDCs within a subset the influence of the actual composition of the subset increases, we cre-
ated the more subsets the less RDCs are contained within the subsets.
Table S6. Composition of RDCs used in Each Subset with 18, 15, 12, 9 or 8 RDCs
Name of Subset
Group D [Hz]
18
A
15
A
15
B
15
C
12
A
12
B
12
C
12
D
12
E
9A
9B
9C
9D
9E
9F
9G
9H
8A
8B
8C
8D
8E
8F
8G
8H
8I
8J
C18-C13 1.9 ± 0.2 x / x x / x x / x x / x / x / x / x / / x / / / x / x
C19-C10 1.8 ± 0.2 x x x x / x x / x / x x x / x x / / x x x / x / x x /
C2-H2 11.3 ± 3.9 x x / x x x x x / x / / x x x x / x / x / x x / x / /
C2-H2 16.1 ± 3.9 x x x x x x x x / / x / / x x x / / x / / x x x / / x
C8-H8 20.7 ± 8.5 x x x / / x x / x x / x / / / x / / / x x / / x / x /
C7-H7 14.2 ± 5.8 x / x x x x x x / / x x x / / x / x / / / x / x / / /
C1-H1 9.0 ± 1.4 x x x x x x x / x x / / x x / x / / x / / / / x / x /
C1-H1 18.2 ± 1.4 x x x x x / / x x / x / / x x x / x / x x / / / x / x
C12-H12 22.4 ± 1.4 x / x x x / / x x x / x / / x x / / x / x x x / x / /
C12-H12 5.1 ± 1.4 x x x x / x / x x / x x x / x / x / x x / x x x / x x
C6-H6 1.6 ± 3.0 x x / x x x / / x x / / x x / / x x / x / / / x / / x
C9-H9 23.6 ± 4.0 x x x / x / x x x / x / / x / / x / x / x / / x / x /
C3-H3 19.3 ± 1.6 x x x x x / x x / x / x / / / / x x / / / x / x / / x
H2 -H2 18.9 ± 2.2 x x x x x x / x / / x x x / x / x / x / / / x / / x /
H7 -H7 17.7 ± 5.8 x x / x x / x x x x / / x x x / x / / x x / x / / x /
H1 -H1 15.0 ± 2.2 x x x x x / x / x / x / / x x / x x / / x / x / x / x
H12 -H12 14.2 ± 2.2 x x x / / x / x x x / x / / / / x / x / / x / / x x /
H4 -H4 15.7 ± 2.8 x x x x / x x x / / x / x / / / x x / x / x / / x / x
x = RDC used in this subset, / = RDC not used in this subset.
Table S7. Composition of RDCs used in Each Subset with 7 or 6 RDCs
Name of Subset
Group D [Hz] 7A
7B
7C
7D
7E
7F
7G
7H
7I
7J
7K
7L
6A
6B
6C
6D
6E
6F
6G
6H
6I
6J
6K
6L
6M
6N
6O
C18-C13 1.9 ± 0.2 x / x / / x / / / / x / x / / x / / x / / / x / / x /
C19-C10 1.8 ± 0.2 / x / x x x / / x / / x / x / x / / x / / x / / x / /
C2-H2 11.3 ± 3.9 / / x / x x x / x / / / / / x / x / x / / / / x / x /
C2-H2 16.1 ± 3.9 x x / / / / x / / x / x x / / / x / x / / / x / / / x
C8-H8 20.7 ± 8.5 x / / x / / x / x x / x / x / / / x x / / x / / x / /
C7-H7 14.2 ± 5.8 / / x / x / / x / / x / / / x / / x x / / / / x / x /
C1-H1 9.0 ± 1.4 / x / / x / / x / / / / x / / / / x / x / x x / / / /
C1-H1 18.2 ± 1.4 x / / / / / / / x / / x / x / x / / / x / / / x / x x
C12-H12 22.4 ± 1.4 / / x / / x / x x / x x / / x x / / / x / / x / x / /
C12-H12 5.1 ± 1.4 / x / x / / / x / x / / x / / / x / / x / x / / / / x
C6-H6 1.6 ± 3.0 x / / x / / x / / x / / / x / / x / / x / / / / x / /
C9-H9 23.6 ± 4.0 / / x / x / x / x / x / / / x / / x / x / / x / / / x
C3-H3 19.3 ± 1.6 / x / / / / x / / / x x x / / / / x / / x x / / / x /
H2 -H2 18.9 ± 2.2 x / / x / / / x / x / / / x / / / x / / x / / x / / x
H7 -H7 17.7 ± 5.8 / / x / x / / x / x / / / / x x / / / / x / x / x / /
H1 -H1 15.0 ± 2.2 / x / / x x / / x / x x x / / x / / / / x / / / / x /
H12 -H12 14.2 ± 2.2 / / x x / x x / / / x / / x / / x / / / x x / x / / x
H4 -H4 15.7 ± 2.8 x x / x / x / x / x / / / / x / x / / / x / / x x / /
x = RDC used in this subset, / = RDC not used in this subset.

Cross-Fitting of Residual Dipolar Couplings The Open Spectroscopy Journal, 2010, Volume 4 xiii
To investigate the influence of the flexible side chain on the orientation predicted by PALES [2, 3] we created several pdb-files of both steroids with decreasing length of the side-chain. The alkyl chain has been shortened stepwise and the resulting fragments are named after the containing carbon atoms (e.g. C1-C24 is the fragment with carbon atoms 1 to 24 and all adjacent oxygen and hy-drogen atoms. Accordingly C1-C27 is the whole steroid molecule). With all steroid fragments prediction of alignment and back-calculation of the measured RDCs were performed with PALES (-stPales mode) assuming a rod-shaped alignment medium (-pf1 flag) and including all hydrogen atoms (-H flag) [2, 3]. The concentration of the alignment medium (-wv flag) [2, 3] which only scales the resulting RDCs linearly, was varied in steps of 0.001 to give the best result (best n/
2 value).
Table S8. RDCs Measured on Cholesterol and RDCs Back Calculated for Various Cholesterol Fragments as Result of the Orienta-
tion Predicted by PALES [2, 3]. Alignment Tensor Parameters and Quality Factors for the Different Fits are Given: Axial
and Rhombic Components (Da, Dr) and Principal Axes of the Alignment Tensor (Axx, Ayy, Azz) with Their Corresponding
Eigenvectors (EV), Number of RDCs used for Fitting (n) and Quality Factors 2, n/
2, Correlation Factor (R) and Quality
Factor by Cornilescu et al. [1] (Q). Additionally the Concentration (-wv) used for the Best Prediction is Given. All
Couplings are Given in Hz
D (calc) according to prediction by PALES for the fragment of cholesterol
Group D (exp)
C1-C27 C1-C26 C1-C25 C1-C24 C1-C23 C1-C22 C1-C21 C1-C20
C18-C13 1.9 ± 0.2 1.8 1.8 1.8 1.9 1.8 1.8 1.8 1.7
C19-C10 1.8 ± 0.2 1.7 1.7 1.8 1.8 1.8 1.8 1.8 1.8
C2-H2 11.3 ± 3.9 4.9 5.7 4.5 10.5 7.1 10.9 8.6 6.2
C2-H2 16.1 ± 3.9 15.0 14.5 16.7 15.8 18.4 17.8 19.2 18.8
C8-H8 20.7 ± 8.5 21.7 21.2 21.1 22.3 21.8 22.0 21.6 22.3
C7-H7 14.2 ± 5.8 6.5 7.9 7.2 12.8 9.4 12.7 10.0 9.4
C1-H1 9.0 ± 1.4 11.2 12.8 11.5 10.4 7.3 5.4 2.2 8.0
C1-H1 18.2 ± 1.4 18.2 17.7 19.1 18.7 20.3 19.9 20.7 20.7
C12-H12 22.4 ± 1.4 21.3 20.8 20.8 21.7 21.5 21.7 21.3 21.4
C12-H12 5.1 ± 1.4 8.7 9.8 7.9 5.7 2.8 0.2 -2.7 3.1
C6-H6 1.6 ± 3.0 7.1 8.2 6.1 3.4 0.4 -2.7 -5.3 1.8
C9-H9 23.6 ± 4.0 21.2 20.7 20.8 21.6 21.5 21.6 21.2 21.3
C3-H3 19.3 ± 1.6 16.7 16.2 17.9 17.3 19.4 18.9 19.9 19.7
H2 -H2 18.9 ± 2.2 19.6 19.5 18.4 21.0 19.0 20.1 18.9 19.4
H7 -H7 17.7 ± 5.8 18.4 18.6 17.3 20.4 17.9 19.2 17.6 19.0
H1 -H1 15.0 ± 2.2 15.3 15.9 16.5 16.1 15.8 15.2 13.5 14.1
H12 -H12 14.2 ± 2.2 15.5 15.6 14.9 14.5 13.1 12.4 10.4 10.9
H4 -H4 15.7 ± 2.8 15.9 16.4 17.3 16.9 17.0 16.5 15.1 15.4
Da -3.72E-04 -3.89E-04 -3.81E-04 -4.10E-04 -3.73E-04 -3.84E-04 -3.48E-04 -3.88E-04
Dr -7.02E-05 -5.27E-05 -5.41E-05 -5.74E-05 -7.02E-05 -6.62E-05 -8.58E-05 -7.29E-05
Axx 2.67E-04 3.10E-04 2.99E-04 3.24E-04 2.68E-04 2.85E-04 2.19E-04 2.78E-04
Ayy 4.77E-04 4.68E-04 4.62E-04 4.96E-04 4.78E-04 4.83E-04 4.76E-04 4.97E-04
Azz -7.44E-04 -7.79E-04 -7.61E-04 -8.20E-04 -7.46E-04 -7.68E-04 -6.95E-04 -7.76E-04
EV Axx
-0.34; 0.92;
-0.17
-0.39; 0.91;
-0.14
-0.34; 0.90;
-0.28
-0.52; 0.84;
-0.15
0.40; -0.84;
-0.37
0.50; -0.80;
0.34
0.47; -0.78;
0.43
-0.52; 0.83;
-0.18
EV Ayy
-0.61; -0.08;
0.79
-0.59; -0.12;
0.80
-0.67; -0.02;
0.74
-0.53;
-0.19; 0.82
-0.69; -0.01;
0.73
-0.63; -0.06;
0.78
0.70; 0.03;
-0.71
-0.62;
-0.23; 0.75
EV Azz
0.71; 0.38;
0.59
0.71; 0.39;
0.59
0.66; 0.43;
0.61
0.67; 0.51;
0.55
0.61; 0.54;
0.58
0.60; 0.60;
0.53
0.54; 0.63;
0.55
0.58;
0.50; 0.64
n 18 18 18 18 18 18 18 18
2 21.17 33.57 18.26 5.48 10.35 24.45 69.94 12.57
n/ 2 0.85 0.54 0.99 3.29 1.74 0.74 0.26 1.43
R 0.900 0.890 0.911 0.981 0.970 0.976 0.952 0.959
Q 0.198 0.205 0.187 0.09 0.128 0.135 0.228 0.145
-wv 0.049 0.050 0.057 0.064 0.068 0.073 0.074 0.088
xiv The Open Spectroscopy Journal, 2010, Volume 4 Kummerlöwe et al.
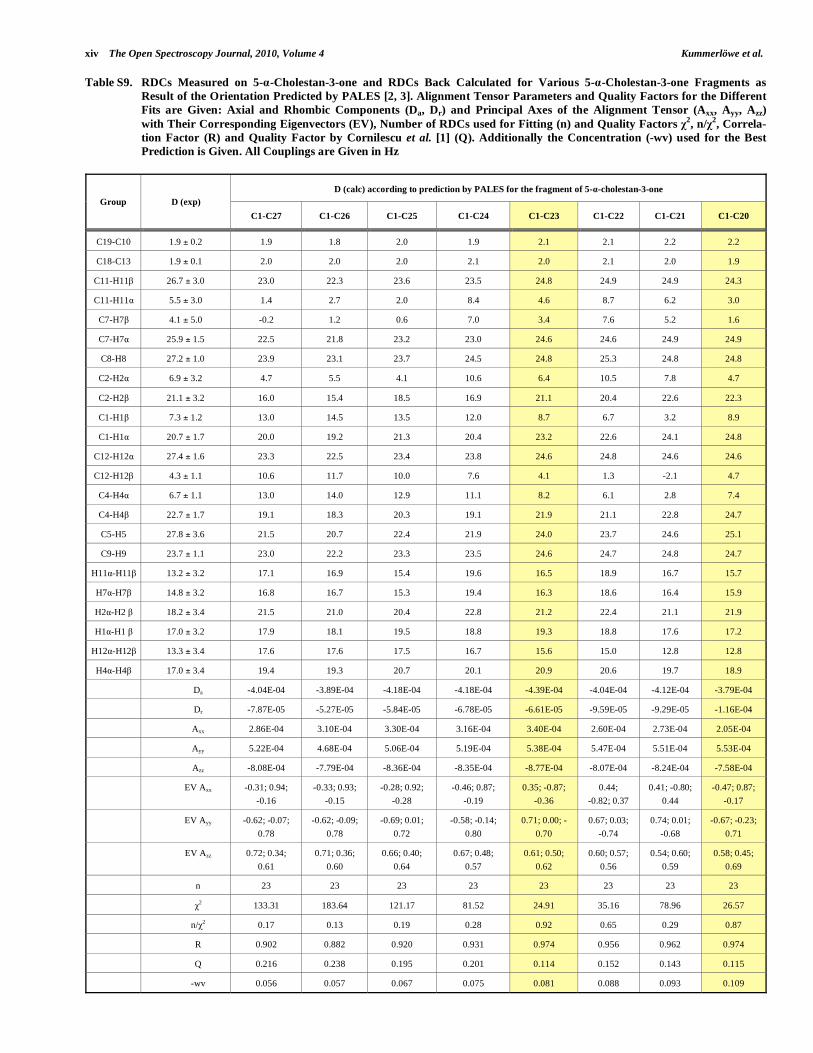
Table S9. RDCs Measured on 5- -Cholestan-3-one and RDCs Back Calculated for Various 5- -Cholestan-3-one Fragments as
Result of the Orientation Predicted by PALES [2, 3]. Alignment Tensor Parameters and Quality Factors for the Different
Fits are Given: Axial and Rhombic Components (Da, Dr) and Principal Axes of the Alignment Tensor (Axx, Ayy, Azz)
with Their Corresponding Eigenvectors (EV), Number of RDCs used for Fitting (n) and Quality Factors 2, n/
2, Correla-
tion Factor (R) and Quality Factor by Cornilescu et al. [1] (Q). Additionally the Concentration (-wv) used for the Best
Prediction is Given. All Couplings are Given in Hz
D (calc) according to prediction by PALES for the fragment of 5- -cholestan-3-one
Group D (exp)
C1-C27 C1-C26 C1-C25 C1-C24 C1-C23 C1-C22 C1-C21 C1-C20
C19-C10 1.9 ± 0.2 1.9 1.8 2.0 1.9 2.1 2.1 2.2 2.2
C18-C13 1.9 ± 0.1 2.0 2.0 2.0 2.1 2.0 2.1 2.0 1.9
C11-H11 26.7 ± 3.0 23.0 22.3 23.6 23.5 24.8 24.9 24.9 24.3
C11-H11 5.5 ± 3.0 1.4 2.7 2.0 8.4 4.6 8.7 6.2 3.0
C7-H7 4.1 ± 5.0 -0.2 1.2 0.6 7.0 3.4 7.6 5.2 1.6
C7-H7 25.9 ± 1.5 22.5 21.8 23.2 23.0 24.6 24.6 24.9 24.9
C8-H8 27.2 ± 1.0 23.9 23.1 23.7 24.5 24.8 25.3 24.8 24.8
C2-H2 6.9 ± 3.2 4.7 5.5 4.1 10.6 6.4 10.5 7.8 4.7
C2-H2 21.1 ± 3.2 16.0 15.4 18.5 16.9 21.1 20.4 22.6 22.3
C1-H1 7.3 ± 1.2 13.0 14.5 13.5 12.0 8.7 6.7 3.2 8.9
C1-H1 20.7 ± 1.7 20.0 19.2 21.3 20.4 23.2 22.6 24.1 24.8
C12-H12 27.4 ± 1.6 23.3 22.5 23.4 23.8 24.6 24.8 24.6 24.6
C12-H12 4.3 ± 1.1 10.6 11.7 10.0 7.6 4.1 1.3 -2.1 4.7
C4-H4 6.7 ± 1.1 13.0 14.0 12.9 11.1 8.2 6.1 2.8 7.4
C4-H4 22.7 ± 1.7 19.1 18.3 20.3 19.1 21.9 21.1 22.8 24.7
C5-H5 27.8 ± 3.6 21.5 20.7 22.4 21.9 24.0 23.7 24.6 25.1
C9-H9 23.7 ± 1.1 23.0 22.2 23.3 23.5 24.6 24.7 24.8 24.7
H11 -H11 13.2 ± 3.2 17.1 16.9 15.4 19.6 16.5 18.9 16.7 15.7
H7 -H7 14.8 ± 3.2 16.8 16.7 15.3 19.4 16.3 18.6 16.4 15.9
H2 -H2 18.2 ± 3.4 21.5 21.0 20.4 22.8 21.2 22.4 21.1 21.9
H1 -H1 17.0 ± 3.2 17.9 18.1 19.5 18.8 19.3 18.8 17.6 17.2
H12 -H12 13.3 ± 3.4 17.6 17.6 17.5 16.7 15.6 15.0 12.8 12.8
H4 -H4 17.0 ± 3.4 19.4 19.3 20.7 20.1 20.9 20.6 19.7 18.9
Da -4.04E-04 -3.89E-04 -4.18E-04 -4.18E-04 -4.39E-04 -4.04E-04 -4.12E-04 -3.79E-04
Dr -7.87E-05 -5.27E-05 -5.84E-05 -6.78E-05 -6.61E-05 -9.59E-05 -9.29E-05 -1.16E-04
Axx 2.86E-04 3.10E-04 3.30E-04 3.16E-04 3.40E-04 2.60E-04 2.73E-04 2.05E-04
Ayy 5.22E-04 4.68E-04 5.06E-04 5.19E-04 5.38E-04 5.47E-04 5.51E-04 5.53E-04
Azz -8.08E-04 -7.79E-04 -8.36E-04 -8.35E-04 -8.77E-04 -8.07E-04 -8.24E-04 -7.58E-04
EV Axx -0.31; 0.94;
-0.16
-0.33; 0.93;
-0.15
-0.28; 0.92;
-0.28
-0.46; 0.87;
-0.19
0.35; -0.87;
-0.36
0.44;
-0.82; 0.37
0.41; -0.80;
0.44
-0.47; 0.87;
-0.17
EV Ayy -0.62; -0.07;
0.78
-0.62; -0.09;
0.78
-0.69; 0.01;
0.72
-0.58; -0.14;
0.80
0.71; 0.00; -
0.70
0.67; 0.03;
-0.74
0.74; 0.01;
-0.68
-0.67; -0.23;
0.71
EV Azz 0.72; 0.34;
0.61
0.71; 0.36;
0.60
0.66; 0.40;
0.64
0.67; 0.48;
0.57
0.61; 0.50;
0.62
0.60; 0.57;
0.56
0.54; 0.60;
0.59
0.58; 0.45;
0.69
n 23 23 23 23 23 23 23 23
2 133.31 183.64 121.17 81.52 24.91 35.16 78.96 26.57
n/ 2 0.17 0.13 0.19 0.28 0.92 0.65 0.29 0.87
R 0.902 0.882 0.920 0.931 0.974 0.956 0.962 0.974
Q 0.216 0.238 0.195 0.201 0.114 0.152 0.143 0.115
-wv 0.056 0.057 0.067 0.075 0.081 0.088 0.093 0.109

Cross-Fitting of Residual Dipolar Couplings The Open Spectroscopy Journal, 2010, Volume 4 xv
Table S10. RDCs Measured on Sodium Cholate and RDCs Back Calculated for Sodium Cholate with the SVD Method, the Fit with
Fixed Orientation Given by the Alignment Tensor of 5- -Cholestan-3-one (Cross-fitting) and Fit with Orientation Pre-
dicted by PALES [2, 3]. Additionally Alignment Tensor Parameters and Quality Factors for the Different Fits are
Given: Axial and Rhombic Components (Da, Dr) and Principal Axes of the Alignment Tensor (Axx, Ayy, Azz) with their
Corresponding Eigenvectors (EV), Number of RDCs used for Fitting (n) and Quality Factors 2, n/
2, Correlation Factor
(R) and Quality Factor by Cornilescu et al. [1] (Q). All Couplings are Given in Hz
Group 1DCH (exp)
(a)
1DCH (calc) (SVD-fit)
1DCH (calc) (cross-fitting)
1DCH (calc) (predicted)
C3-H3 1.5 ± 1.0 1.9 -22.7 0.0553
C5-H5 0.9 ± 1.0 0.5 -16.8 0.0530
C7-H7 2.5 ± 1.0 2.7 1.3 -0.0024
C8-H8 -7.8 ± 1.0 -7.2 25.3 -0.0570
C9-H9 -7.5 ± 1.0 -7.0 24.8 -0.0560
C12-H12 1.6 ± 1.0 1.4 3.7 -0.0307
C14-H14 -6.6 ± 1.0 -6.9 24.2 -0.0546
C17-H17 -6.0 ± 1.0 -6.8 23.8 -0.0533
Da -8.047E-05 -3.97E-04 1.16E-06
Dr -3.11E-05 -1.10E-04 8.66E-08
Axx 3.38E-05 2.32E-04 -1.03E-06
Ayy 1.27E-04 5.62E-04 -1.29E-06
Azz -1.61E-04 -7.94E-04 2.31E-06
EV Axx -0.08; 0.98; 0.16 -0.45; 0.87; -0.19 -0.54; 0.84; 0.04
EV Ayy 0.74; -0.05; 0.68 -0.65; -0.17; 0.74 -0.53; -0.38; 0.76
EV Azz -0.67; -0.17; 0.72 0.62; 0.45; 0.64 0.65; 0.39; 0.65
n 8 8 8
2 4.35 4881.82 205.30
n/2 5.42 0.002 0.04
R 0.994 -0.867 0.782
Q 0.094 4.839 0.992
(a) Experimental data from Mangoni et al. [5]. As no experimental errors are given in by Mangoni et al. [5] they were set to 1Hz for the fitting with PALES.
Fig. (S7). Structure and nomenclature of sodium cholate.

xvi The Open Spectroscopy Journal, 2010, Volume 4 Kummerlöwe et al.
Fig. (S8). Comparison of alignment tensors for steroids in different alignment media. RDCs have been measured for cholesterol (A)
and 5- -cholestan-3-one (B) in stretched PDMS/CDCl3 gels and for sodium cholate (C) in a compressed PAA/D2O gel. The structures are
shown with color-coded bonds representing negative (red) and positive (blue) RDCs and the axes of the corresponding alignment tensors (as
obtained with the -bestFit option of PALES [2, 3]) next to it.
REFERENCES
[1] Cornilescu G, Marquardt JL, Ottiger M, Bax A. Validation of protein structure from anisotropic carbonyl chemical shifts in a dilute liquid crystalline phase. J Am Chem Soc 1998; 120: 6836-7.
[2] Zweckstetter M, Bax A. Prediction of sterically induced alignment in a dilute liquid crystalline phase: Aid to protein structure determination by NMR. J Am Chem Soc 2000; 122: 3791-2.
[3] Zweckstetter M. NMR: prediction of molecular alignment from structure using the PALES software. Nat Protoc 2008; 3: 679-90. [4] Verdier L, Sakhaii P, Zweckstetter M, Griesinger C. Measurement of long range H,C couplings in natural products in orienting media: a tool for struc-
ture eluciation of natural products. J Magn Reson 2003; 163: 353-9. [5] Mangoni A, Esposito V, Randazzo A. Configuration assignment in small organic molecules via residual dipolar couplings. Chem Commun 2003: 154-
5.