carlo camilloni and michele vendruscolo · using pseudocontact shifts and residual dipolar...
TRANSCRIPT
Using Pseudocontact Shifts and Residual Dipolar Couplings as ExactNMR Restraints for the Determination of Protein StructuralEnsemblesCarlo Camilloni and Michele Vendruscolo*
Department of Chemistry, University of Cambridge, Cambridge CB2 1EW, United Kingdom
*S Supporting Information
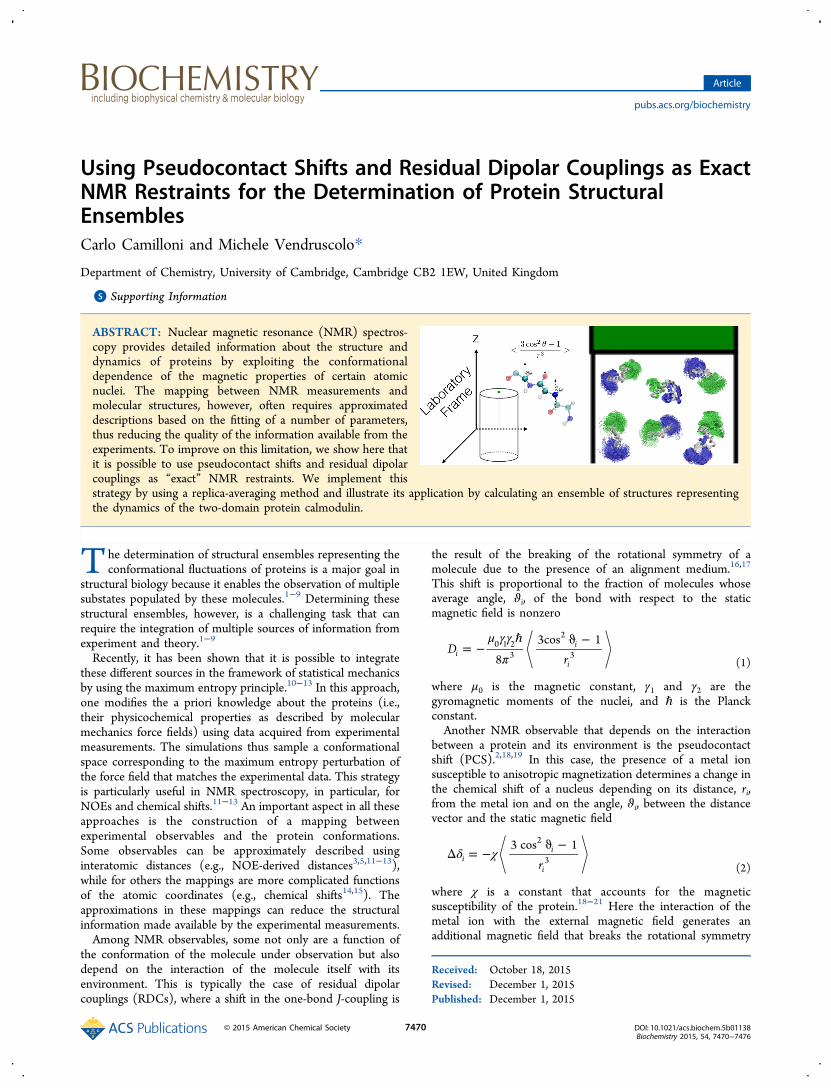
ABSTRACT: Nuclear magnetic resonance (NMR) spectros-copy provides detailed information about the structure anddynamics of proteins by exploiting the conformationaldependence of the magnetic properties of certain atomicnuclei. The mapping between NMR measurements andmolecular structures, however, often requires approximateddescriptions based on the fitting of a number of parameters,thus reducing the quality of the information available from theexperiments. To improve on this limitation, we show here thatit is possible to use pseudocontact shifts and residual dipolarcouplings as “exact” NMR restraints. We implement thisstrategy by using a replica-averaging method and illustrate its application by calculating an ensemble of structures representingthe dynamics of the two-domain protein calmodulin.
The determination of structural ensembles representing theconformational fluctuations of proteins is a major goal in
structural biology because it enables the observation of multiplesubstates populated by these molecules.1−9 Determining thesestructural ensembles, however, is a challenging task that canrequire the integration of multiple sources of information fromexperiment and theory.1−9
Recently, it has been shown that it is possible to integratethese different sources in the framework of statistical mechanicsby using the maximum entropy principle.10−13 In this approach,one modifies the a priori knowledge about the proteins (i.e.,their physicochemical properties as described by molecularmechanics force fields) using data acquired from experimentalmeasurements. The simulations thus sample a conformationalspace corresponding to the maximum entropy perturbation ofthe force field that matches the experimental data. This strategyis particularly useful in NMR spectroscopy, in particular, forNOEs and chemical shifts.11−13 An important aspect in all theseapproaches is the construction of a mapping betweenexperimental observables and the protein conformations.Some observables can be approximately described usinginteratomic distances (e.g., NOE-derived distances3,5,11−13),while for others the mappings are more complicated functionsof the atomic coordinates (e.g., chemical shifts14,15). Theapproximations in these mappings can reduce the structuralinformation made available by the experimental measurements.Among NMR observables, some not only are a function of
the conformation of the molecule under observation but alsodepend on the interaction of the molecule itself with itsenvironment. This is typically the case of residual dipolarcouplings (RDCs), where a shift in the one-bond J-coupling is
the result of the breaking of the rotational symmetry of amolecule due to the presence of an alignment medium.16,17
This shift is proportional to the fraction of molecules whoseaverage angle, ϑi, of the bond with respect to the staticmagnetic field is nonzero
μ γγπ
= −ℏ ϑ −
Dr8
3cos 1i
i
i
0 1 23
2
3(1)
where μ0 is the magnetic constant, γ1 and γ2 are thegyromagnetic moments of the nuclei, and ℏ is the Planckconstant.Another NMR observable that depends on the interaction
between a protein and its environment is the pseudocontactshift (PCS).2,18,19 In this case, the presence of a metal ionsusceptible to anisotropic magnetization determines a change inthe chemical shift of a nucleus depending on its distance, ri,from the metal ion and on the angle, ϑi, between the distancevector and the static magnetic field
δ χΔ = −ϑ −
r3 cos 1
ii
i
2
3(2)
where χ is a constant that accounts for the magneticsusceptibility of the protein.18−21 Here the interaction of themetal ion with the external magnetic field generates anadditional magnetic field that breaks the rotational symmetry
Received: October 18, 2015Revised: December 1, 2015Published: December 1, 2015
Article
pubs.acs.org/biochemistry
© 2015 American Chemical Society 7470 DOI: 10.1021/acs.biochem.5b01138Biochemistry 2015, 54, 7470−7476
of the metal ion. If the metal ion is bound to a protein then alsothe rotational symmetry of the protein due to its tumbling isbroken, and each atomic nucleus of the protein feels theadditional magnetic field to an extent proportional to itsdistance from the metal ion and to the local symmetry breaking,as indeed molecules not bound to the metal ion are practicallynot affected.To introduce a description of this type of observable that
does not depend on the environment, it is common tointroduce a reference framework where the average effect of theenvironment on a conformation is given in terms of analignment tensor.16,17 This alignment tensor can either bedetermined from the data themselves22 or by modeling theinteraction of the molecule with the environment.23 While theformer approach assumes that the system is a rigid body,22
which complicates the study of the dynamics, the latter can, atleast in principle, describe correctly the dynamics of the system.In particular for charged media, however, the modeling of theinteractions can be quite challenging.An alternative to the introduction of an alignment tensor is
to work in the laboratory reference frame, with the NMR staticmagnetic field defining the z direction, and use the NMRmeasurements to model at the same time the protein and itsinteractions with the environment.24 This “tensor free”approach has been implemented using RDCs as restraints inreplica-averaged molecular dynamics simulations, whereaveraged observables over multiple replicas of a protein arerestrained with respect to the corresponding experimentaldata.24−26 It can also be recast in an approach where thedirection of the field is an addition degree of freedom that canbe optimized using the maximum entropy principle thusallowing the use of multiple alignment media.27
In this approach RDC and PCS restraints can be considered“exact”, at least to the extent to which it is possible to assumethat eqs 1 and 2 describe exactly the phenomena underobservation and as far as the maximum entropy principleprovides an accurate framework to infer the structuralensembles underlying the experimental data. Indeed we arehere not limited by the approximations resulting either from arigid body assumption or from an inaccurate description of theinteraction between the medium and the system. Furthermore,the restraints do not depend on any additional parameter; inparticular, they can be applied using the correlation betweenthe observables calculated using, respectively, eqs 1 and 2,averaged over the replicas, and the experimental data. The useof the correlation allows one to compare the observablescalculated using eqs 1 and 2 with the experimental data up to amultiplicative constant whose specific value does not affect theresults of the calculations. We note, however, that the structuralensembles resulting from “exact” structural restraints shouldnot be considered as “exact” themselves, even if ourimplementation of eqs 1 and 2 does not involve freeparameters, because the calculations required to obtain theensembles require other approximations, including in particularthe use of a specific force field in the molecular dynamicssimulations.Having recently applied this approach to RDCs measured in
an alignment medium,24 we show here that the approach ismore general by extending it to the use of PCSs and RDCsmeasured in the presence of paramagnetic metal ions, by usingthe case of the two-domain protein calmodulin in its calcium-bound state2,28−30 (Ca2+−CaM).
■ METHODSMolecular Dynamics Simulations. Molecular dynamics
simulations of the calcium-bound state of calmodulin (Ca2+−CaM) were performed using the CHARMM22* force field inexplicit solvent. All the simulations were run in GROMACS31
using PLUMED 2.32 The van der Waals interactions and short-range electrostatic effects were implemented with a cutoff at 1.0nm; long-range electrostatic effects were treated with theparticle mesh Ewald method33 on a mesh of 0.12 nm. Allsimulations were carried out in the isothermal−isobaricensemble by thermosetting the system with the Bussithermostat34 and controlling the pressure with the Parrinel-lo−Rahman barostat.35 The starting conformation was takenfrom an available X-ray structure36 (PDB code 1CLL). Thisstructure was solvated with 17 400 water molecules and 16 Na+
ions in a dodecahedron box of 550 nm3 of volume. A 30 nspreliminary simulation was used to select 16 startingconformations.
Replica-Averaged Metadynamics (RAM) Simulations.RAM simulations37 were performed using either pseudocontactshifts (PCSs) alone or PCSs and residual dipolar couplings(RDCs) as replica-averaged restraints, while metadynamics wasimplemented as well-tempered bias exchange.38 In RAMsimulations, the number of replicas is such that the larger istheir number the better is the approximation of the maximumentropy principle11 and the sampling of the conformationalspace due to the higher number of replicas used for biasexchange.39 Sixteen replicas of the system were simulated inparallel at 305 K with a restraint applied on the correlationbetween the experimental and replica-averaged back-calculatedPCSs and on the correlation between experimental and replica-averaged back-calculated RDCs. The starting conformationswere selected as described above by extracting a frame every 2ns from preliminary 30 ns long simulations.For each PCS and each replica, we calculate both the
distance, ri, between the metal ion and the affected nucleus iand the angle ϑi between the distance vector and the z-axis (seeeq 1). Using 16 replicas, we calculate the replica-averaged PCSas
∑δΔ = −ϑ −
= r1
163 cos 1
i
i
i1
16 2
3(3)
This same approach is used for RDCs, where distances andangles are calculated for each bond vector as (see eq 2)
∑μ γγπ
= −ℏ ϑ −
=
Dr
116 8
3 cos 1
i
i
i
0 1 23
1
16 2
3(4)
Given all the PCSs or RDCs, we then calculate theircorrelations with the experimental data. For the PCSs, a linearrestraint is applied on the correlation as
δ δρ Δ Δ= − −V K [ ( , ) 1]PCS PCScalcd expt
(5)
and for the RDCs, a similar restraints is applied as
ρ= − −V K D D[ ( , ) 1]RDC RDCcalcd expt
(6)
where ρ(Δδcalcd,Δδexpt) is the coefficient of correlation betweencalculated (Δδcalcd) and experimental (Δδexpt) PCS values, andρ(Dcalcd,Dexpt) is the coefficient of correlation betweencalculated (Dcalcd) and experimental (Dexpt) RDC values.
Biochemistry Article
DOI: 10.1021/acs.biochem.5b01138Biochemistry 2015, 54, 7470−7476
7471

A preliminary 10 ns long simulation was used to linearlyincrease the restraint force up to 10 000 kJ/mol, in such a wayto maximize the correlation before starting the bias-exchangemetadynamics sampling. This force constant has been chosenas the largest for which the simulation was stable, in agreementwith the maximum entropy principle prescription.11,12
We also note that the use of PCSs and RDCs as exact NMRrestraints can be implemented in other methods to use NMRdata in combination with molecular simulations.3,9,29,30 Inparticular, the replica-averaging tensor-free approach can beused to optimize the orientations of multiple rigid structures ina way that reproduces the common alignment tensor.26
No Free Parameters Are Required in the Simulations.Scaling Factor. In many standard approaches to use NMR dataas structural restraints in the simulations, the matching betweenexperimental and calculated values is enforced by minimizingthe sum of the squares of the differences between them
∑= − −V K D D( )i
i iNMR NMRcalcd expt 2
(7)
where the sum runs over the number of available experimentaldata points, Di
calcd and Diexpt are, respectively, the calculated and
experimental data points, and KNMR is the strength of therestraint term, which in the maximum entropy principleapproach should be taken as large as the numerical stabilityof the simulations allows. This approach requires a scalingfactor in the calculation of the Di
calcd values; otherwise eq 7 cannever become zero. By contrast in eqs 5 and 6, the restraintterm involves a correlation between experimental andcalculated values, and hence it can be minimized withoutintroducing a scaling factor.24−26 This procedure is of particularimportance when leading with flexible systems where thescaling factor can be a function of the conformation, becausemore extended structures can be more aligned than compactones.Rhombic Alignment. A rhombic alignment can be present
when there are dynamics in the external degrees of freedom. Incase of RDCs measured in the presence of an alignmentmedium, these dynamics result in different interchangingorientations of the protein; in the case of PCSs, theparamagnetic center can have multiple alignments with themagnetic field. In the replica method that we use in this work,the replicas distribute themselves automatically between thedifferent orientations under the effect of the restraint term (eq6). Hence there is no need to define a rhombic parameter toweight the different orientations.24−26
Back-Calculation of NMR Observables. By imposingPCSs and RDCs as structural restraints using the approachdescribed here, we not only provide information on the relativedistances between atoms but also on the orientation ofinteratomic vectors with respect to a predefined z direction,thus resulting in a breaking of the rotational symmetry of themolecule. As a consequence in the resulting ensemble, theabsolute positions of each conformation are meaningful andneeded to back calculate PCSs and RDCs directly from eqs 1and 2 a posteriori.Implementation of the Collective Variables. Bias-
exchange metadynamics was set up using one collective variable(CV) per replica, five collective variables were selected in orderto enhance the sampling of the relative motion of the twodomains and applied on three different replicas, and a singlereplica was left unbiased. The selected CVs were (1) theALPHABETA calculated over the φ and ψ angles for residues
between 74 and 83, (2) the DIHCOR calculated over the ψangles for successive residues between 74 and 83, (3) theALPHARMSD (α-helical content) for residues 63 to 81, (4)the ALPHARMSD (α-helical content) for residues 77 to 94,and (5) the DHENERGY, Debye−Huckel energy, between thetwo domains calculated using only the charged side-chainsbelonging to the two domains. The choice of the above CVswas based on the previous observation of the role played bylinker residues, by the observation that the C-terminal α-helixof the NTD and the N-terminal α-helix of CTD can be foundformed to a different extent in the PDB, and by observing thelarge amount of charged residues present in both domains.Gaussians deposition was performed with an initial rate of0.125 kJ/(mol·ps), a bias-factor of 10, and σ values set to 0.2,0.1, 0.11, 0.11, and 0.5 for the above five CVs, respectively.Furthermore, in order to limit the extent of accessible space
along each collective variable and correctly treat the problem ofthe borders, we set the bias as constant outside a definedinterval for each CV,40 because it has been shown that thisapproach lead to a correct reconstruction of a one-dimensionalfree energy landscape inside the chosen range; intervals wereset to 0−20, 0−10, 4−14, 4−14, and −10−36 for the five CVs,respectively. Each replica have been evolved for 130 ns, withexchange trials every 50 ps. The control unrestrainedsimulation has been performed with the same bias-exchangesetup.
Convergence of the Simulations. The convergence ofthe sampling was assessed by monitoring the differences of thefree energies in the range between 0 and 25 kJ/mol atincreasing simulation length during the simulations andbetween replicas biased on the same CV. After the first 90ns, the free energy landscapes are stable within less than 1 kJ/mol, suggesting that all the relevant minima in the landscapehave been found, and the average changes in the free energylandscapes over the last 40 ns of simulations are below 1 kJ/mol. Replica-exchange is optimal with an average exchangeprobability per replica of 35% and with all replicas exchangingrelatively uniformly among them. Each replica samples multipleregions of the CV space thus enabling the sampling of multipleminima and suggesting an overall ergodic behavior. Takentogether these results suggest that the free energies that weobtained from the RAM simulations are on average correctwithin less than 1 kJ/mol (Figures S1−S3). The reweighting ofthe trajectories has been performed using the weightedhistogram analysis (WHAM).41,42
Availability of the Method. All above methods areavailable in PLUMED 232 (www.plumed.org). A sample scriptis provided in the Supporting Information.
Sketch-Map Analysis. Sketch-map collective variables havebeen calculated using as input the φ and ψ dihedral angles forresidues from 63 to 94 to keep into account the system fromthe NTD C-terminal to the CTD N-terminal α-helix.
■ RESULTSStructural Ensembles from Replica-Averaged Meta-
dynamics Simulations. We performed replica-averagedmetadynamics (RAM) simulations37 of Ca2+−CaM in explicitsolvent (see Methods). The averaging of the experimental datawas performed over 16 replicas of the protein, and the samplingwas enhanced using metadynamics along five collectivevariables each applied on three different replicas leaving onereplica without any metadynamics bias (see Methods). Wegenerated three ensembles: a control unrestrained ensemble
Biochemistry Article
DOI: 10.1021/acs.biochem.5b01138Biochemistry 2015, 54, 7470−7476
7472
(MD ensemble) without structural restraints, an ensemble inwhich PCS restraints were added to the force field (PCSensemble), and an ensemble where both the PCSs and RDCsmeasured in the presence of Tb3+ as a paramagnetic metal2,29
were used as restraints (PCS+RDC ensemble). The structuresin the PCS+RDC ensemble are available as SupportingInformation in PDB format together with their statisticalweights in order to enable statistical averages to be calculated.The Tb3+ data set consists of 32 PCSs for residues in the N-terminal domain (NTD), 82 PCSs for residues in the C-terminal domain (CTD), and 32 RDCs for bonds in the CTD.Validation of the Structural Ensembles. To validate our
results, we used an additional data set of PCSs and RDCsmeasured in the presence of another paramagnetic ion (Tm3+),which consists of 82 PCSs for residues in the NTD, 82 PCSsfor residues in the CTD and 30 RDCs for bonds in the CTD.The correlation between the Tb3+ and Tm3+ RDC data sets is0.5 with an overlap of 80% between the nuclei for which ameasurement is available (Figure S4). The PCSs have acorrelation of 0.9 for the N-terminal domain with just a 30%overlap between the data sets and a correlation of 0.6 with anoverlap of 80% for the C-terminal domain (Figure S4). Theensembles are also validated using small-angle X-ray scattering(SAXS) data29 (Figure 3).NMR-Derived Free Energy Landscapes of Calmodulin.
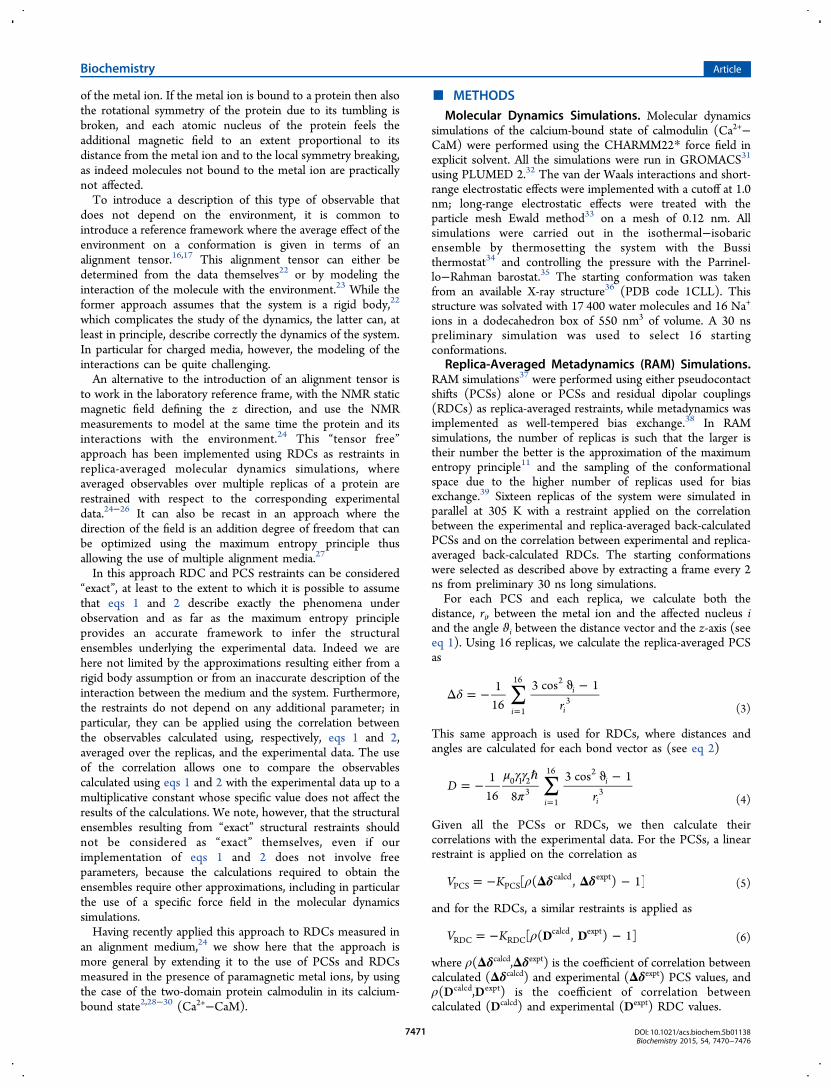
The extent of the conformational space explored by calmodulinis illustrated by the free energy landscape of the PCS+RDCensemble (Figure 1). This free energy landscape is calculated as
a function of the ϑ and ϕ angles,43 which are the sphericalangles measured for the axis of α-helix V defined using as areference the axis α-helix IV. Consistently with previousresults,2,29,30,43 this ensemble is characterized by a relativelyflat distribution of structures for the ϕ angle in the region of ϑbetween 1.5 and 3 rad (i.e., 85° and 170°), indicating that whenthe two domains are relatively open they can move almostindependently from each other. Instead in more compactconformations (i.e., ϑ between 0.5 and a 1.5 rad; 30° to 85°)the two α-helices can only move in a narrower range of valuesfor ϕ. The average orientation is in this case ϑ = 1.9 rad and ϕ= 0.2 rad, that is, with the two α-helices bent at a 110° angle, avalue compatible with that previously found using the data usedin this work together with other restraints.2,29
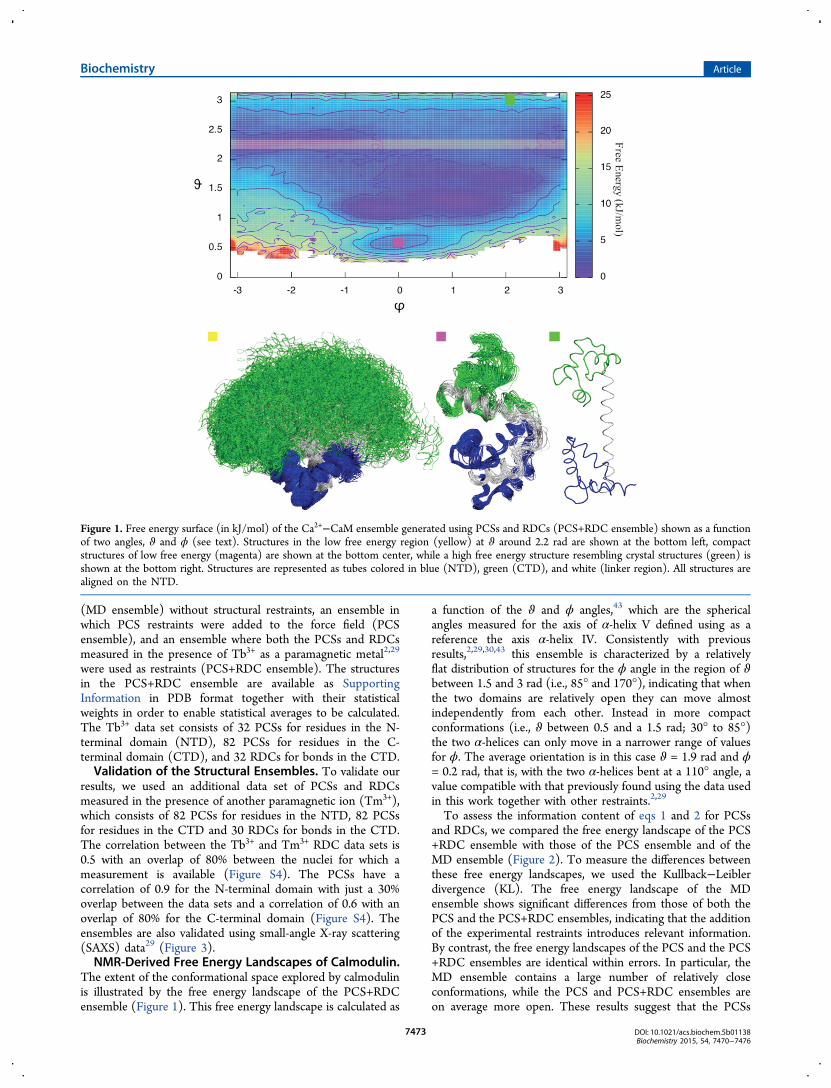
To assess the information content of eqs 1 and 2 for PCSsand RDCs, we compared the free energy landscape of the PCS+RDC ensemble with those of the PCS ensemble and of theMD ensemble (Figure 2). To measure the differences betweenthese free energy landscapes, we used the Kullback−Leiblerdivergence (KL). The free energy landscape of the MDensemble shows significant differences from those of both thePCS and the PCS+RDC ensembles, indicating that the additionof the experimental restraints introduces relevant information.By contrast, the free energy landscapes of the PCS and the PCS+RDC ensembles are identical within errors. In particular, theMD ensemble contains a large number of relatively closeconformations, while the PCS and PCS+RDC ensembles areon average more open. These results suggest that the PCSs
Figure 1. Free energy surface (in kJ/mol) of the Ca2+−CaM ensemble generated using PCSs and RDCs (PCS+RDC ensemble) shown as a functionof two angles, ϑ and ϕ (see text). Structures in the low free energy region (yellow) at ϑ around 2.2 rad are shown at the bottom left, compactstructures of low free energy (magenta) are shown at the bottom center, while a high free energy structure resembling crystal structures (green) isshown at the bottom right. Structures are represented as tubes colored in blue (NTD), green (CTD), and white (linker region). All structures arealigned on the NTD.
Biochemistry Article
DOI: 10.1021/acs.biochem.5b01138Biochemistry 2015, 54, 7470−7476
7473
alone are sufficient to determine the main dynamical features ofCa2+−CaM. We note that these results are consistent withother recent ones where conformationally averaged RDCscaused by steric alignment and of both RDCs andpseudocontact shifts caused by paramagnetic alignment containa similar amount of information.44
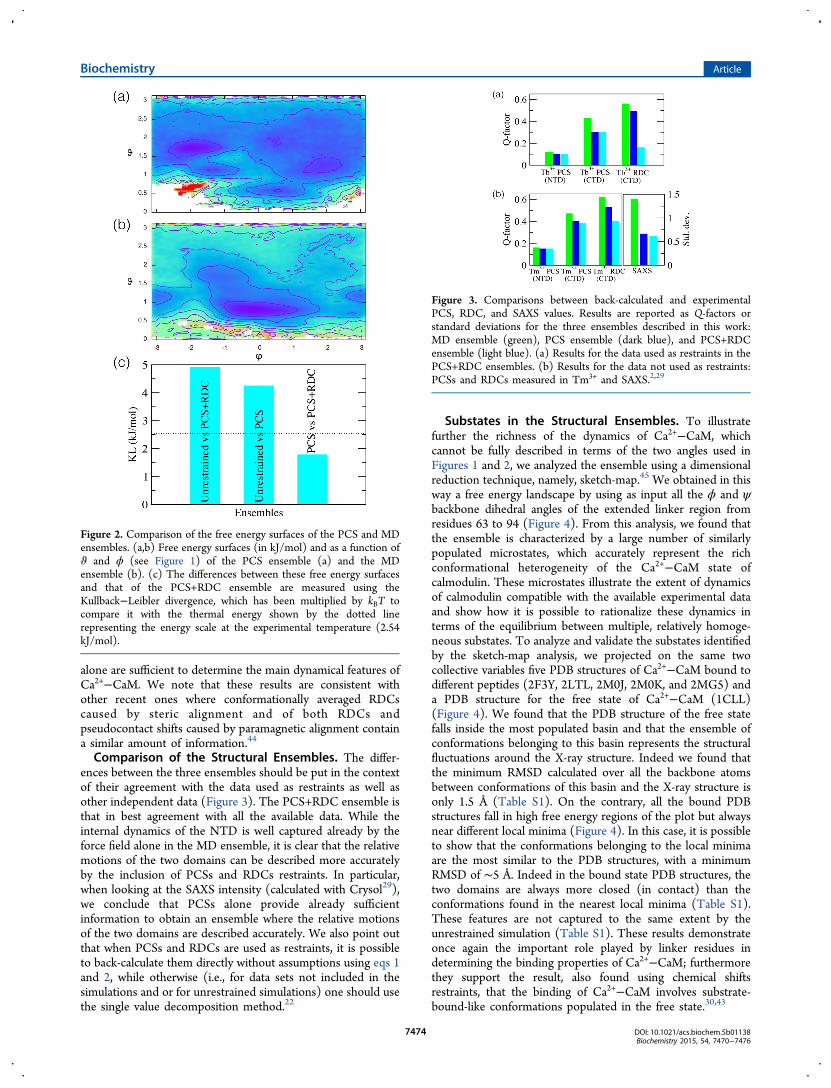
Comparison of the Structural Ensembles. The differ-ences between the three ensembles should be put in the contextof their agreement with the data used as restraints as well asother independent data (Figure 3). The PCS+RDC ensemble isthat in best agreement with all the available data. While theinternal dynamics of the NTD is well captured already by theforce field alone in the MD ensemble, it is clear that the relativemotions of the two domains can be described more accuratelyby the inclusion of PCSs and RDCs restraints. In particular,when looking at the SAXS intensity (calculated with Crysol29),we conclude that PCSs alone provide already sufficientinformation to obtain an ensemble where the relative motionsof the two domains are described accurately. We also point outthat when PCSs and RDCs are used as restraints, it is possibleto back-calculate them directly without assumptions using eqs 1and 2, while otherwise (i.e., for data sets not included in thesimulations and or for unrestrained simulations) one should usethe single value decomposition method.22
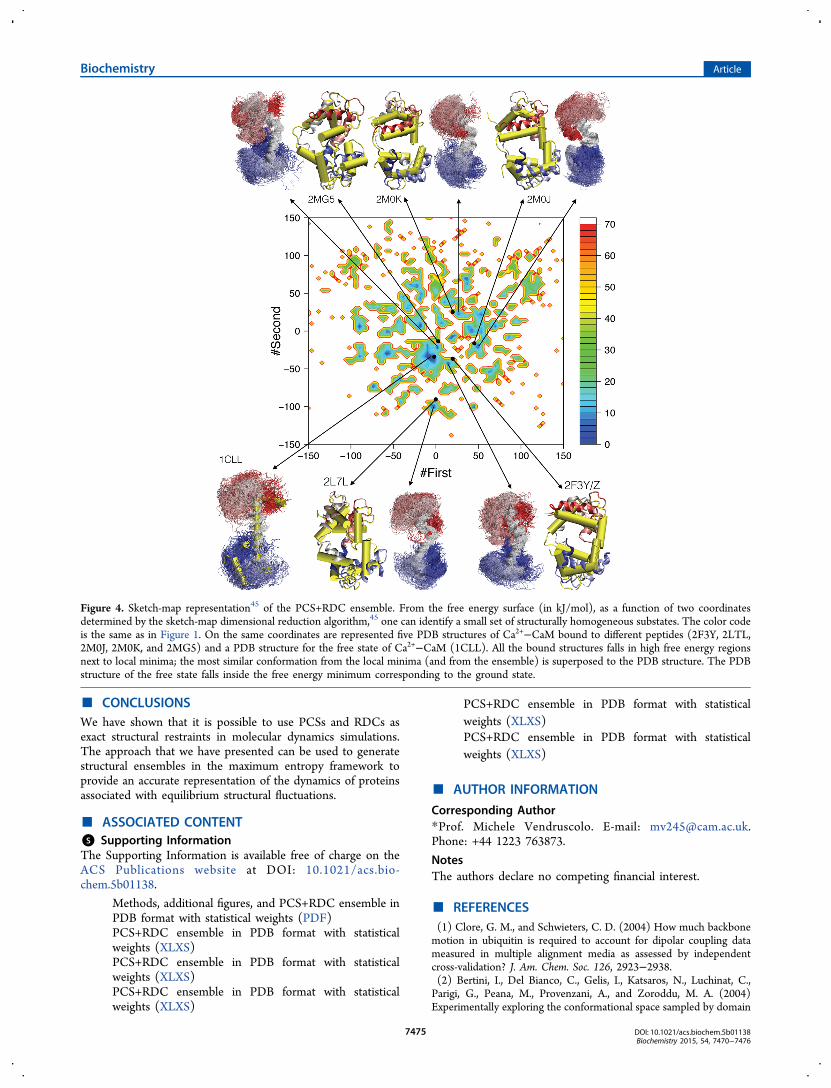
Substates in the Structural Ensembles. To illustratefurther the richness of the dynamics of Ca2+−CaM, whichcannot be fully described in terms of the two angles used inFigures 1 and 2, we analyzed the ensemble using a dimensionalreduction technique, namely, sketch-map.45 We obtained in thisway a free energy landscape by using as input all the ϕ and ψbackbone dihedral angles of the extended linker region fromresidues 63 to 94 (Figure 4). From this analysis, we found thatthe ensemble is characterized by a large number of similarlypopulated microstates, which accurately represent the richconformational heterogeneity of the Ca2+−CaM state ofcalmodulin. These microstates illustrate the extent of dynamicsof calmodulin compatible with the available experimental dataand show how it is possible to rationalize these dynamics interms of the equilibrium between multiple, relatively homoge-neous substates. To analyze and validate the substates identifiedby the sketch-map analysis, we projected on the same twocollective variables five PDB structures of Ca2+−CaM bound todifferent peptides (2F3Y, 2LTL, 2M0J, 2M0K, and 2MG5) anda PDB structure for the free state of Ca2+−CaM (1CLL)(Figure 4). We found that the PDB structure of the free statefalls inside the most populated basin and that the ensemble ofconformations belonging to this basin represents the structuralfluctuations around the X-ray structure. Indeed we found thatthe minimum RMSD calculated over all the backbone atomsbetween conformations of this basin and the X-ray structure isonly 1.5 Å (Table S1). On the contrary, all the bound PDBstructures fall in high free energy regions of the plot but alwaysnear different local minima (Figure 4). In this case, it is possibleto show that the conformations belonging to the local minimaare the most similar to the PDB structures, with a minimumRMSD of ∼5 Å. Indeed in the bound state PDB structures, thetwo domains are always more closed (in contact) than theconformations found in the nearest local minima (Table S1).These features are not captured to the same extent by theunrestrained simulation (Table S1). These results demonstrateonce again the important role played by linker residues indetermining the binding properties of Ca2+−CaM; furthermorethey support the result, also found using chemical shiftsrestraints, that the binding of Ca2+−CaM involves substrate-bound-like conformations populated in the free state.30,43
Figure 2. Comparison of the free energy surfaces of the PCS and MDensembles. (a,b) Free energy surfaces (in kJ/mol) and as a function ofϑ and ϕ (see Figure 1) of the PCS ensemble (a) and the MDensemble (b). (c) The differences between these free energy surfacesand that of the PCS+RDC ensemble are measured using theKullback−Leibler divergence, which has been multiplied by kBT tocompare it with the thermal energy shown by the dotted linerepresenting the energy scale at the experimental temperature (2.54kJ/mol).
Figure 3. Comparisons between back-calculated and experimentalPCS, RDC, and SAXS values. Results are reported as Q-factors orstandard deviations for the three ensembles described in this work:MD ensemble (green), PCS ensemble (dark blue), and PCS+RDCensemble (light blue). (a) Results for the data used as restraints in thePCS+RDC ensembles. (b) Results for the data not used as restraints:PCSs and RDCs measured in Tm3+ and SAXS.2,29
Biochemistry Article
DOI: 10.1021/acs.biochem.5b01138Biochemistry 2015, 54, 7470−7476
7474
■ CONCLUSIONSWe have shown that it is possible to use PCSs and RDCs asexact structural restraints in molecular dynamics simulations.The approach that we have presented can be used to generatestructural ensembles in the maximum entropy framework toprovide an accurate representation of the dynamics of proteinsassociated with equilibrium structural fluctuations.
■ ASSOCIATED CONTENT*S Supporting InformationThe Supporting Information is available free of charge on theACS Publications website at DOI: 10.1021/acs.bio-chem.5b01138.
Methods, additional figures, and PCS+RDC ensemble inPDB format with statistical weights (PDF)PCS+RDC ensemble in PDB format with statisticalweights (XLXS)PCS+RDC ensemble in PDB format with statisticalweights (XLXS)PCS+RDC ensemble in PDB format with statisticalweights (XLXS)
PCS+RDC ensemble in PDB format with statisticalweights (XLXS)PCS+RDC ensemble in PDB format with statisticalweights (XLXS)
■ AUTHOR INFORMATION
Corresponding Author*Prof. Michele Vendruscolo. E-mail: [email protected]: +44 1223 763873.
NotesThe authors declare no competing financial interest.
■ REFERENCES(1) Clore, G. M., and Schwieters, C. D. (2004) How much backbonemotion in ubiquitin is required to account for dipolar coupling datameasured in multiple alignment media as assessed by independentcross-validation? J. Am. Chem. Soc. 126, 2923−2938.(2) Bertini, I., Del Bianco, C., Gelis, I., Katsaros, N., Luchinat, C.,Parigi, G., Peana, M., Provenzani, A., and Zoroddu, M. A. (2004)Experimentally exploring the conformational space sampled by domain
Figure 4. Sketch-map representation45 of the PCS+RDC ensemble. From the free energy surface (in kJ/mol), as a function of two coordinatesdetermined by the sketch-map dimensional reduction algorithm,45 one can identify a small set of structurally homogeneous substates. The color codeis the same as in Figure 1. On the same coordinates are represented five PDB structures of Ca2+−CaM bound to different peptides (2F3Y, 2LTL,2M0J, 2M0K, and 2MG5) and a PDB structure for the free state of Ca2+−CaM (1CLL). All the bound structures falls in high free energy regionsnext to local minima; the most similar conformation from the local minima (and from the ensemble) is superposed to the PDB structure. The PDBstructure of the free state falls inside the free energy minimum corresponding to the ground state.
Biochemistry Article
DOI: 10.1021/acs.biochem.5b01138Biochemistry 2015, 54, 7470−7476
7475
reorientation in calmodulin. Proc. Natl. Acad. Sci. U. S. A. 101, 6841−6846.(3) Lindorff-Larsen, K., Best, R. B., DePristo, M. A., Dobson, C. M.,and Vendruscolo, M. (2005) Simultaneous determination of proteinstructure and dynamics. Nature 433, 128−132.(4) Mittermaier, A., and Kay, L. E. (2006) New tools provide newinsights in NMR studies of protein dynamics. Science 312, 224−228.(5) Vogeli, B., Segawa, T. F., Leitz, D., Sobol, A., Choutko, A.,Trzesniak, D., van Gunsteren, W., and Riek, R. (2009) Exact distancesand internal dynamics of perdeuterated ubiquitin from NOE buildups.J. Am. Chem. Soc. 131, 17215−17225.(6) Boehr, D. D., Nussinov, R., and Wright, P. E. (2009) The role ofdynamic conformational ensembles in biomolecular recognition. Nat.Chem. Biol. 5, 789−796.(7) Tzeng, S.-R., and Kalodimos, C. G. (2011) Protein dynamics andallostery: an NMR view. Curr. Opin. Struct. Biol. 21, 62−67.(8) Lewandowski, J. R., Halse, M. E., Blackledge, M., and Emsley, L.(2015) Direct observation of hierarchical protein dynamics. Science348, 578−581.(9) Jensen, M. R., Zweckstetter, M., Huang, J.-r., and Blackledge, M.(2014) Exploring free-energy landscapes of intrinsically disorderedproteins at atomic resolution using NMR spectroscopy. Chem. Rev.114, 6632−6660.(10) Pitera, J. W., and Chodera, J. D. (2012) On the use ofexperimental observations to bias simulated ensembles. J. Chem.Theory Comput. 8, 3445−3451.(11) Cavalli, A., Camilloni, C., and Vendruscolo, M. (2013)Molecular dynamics simulations with replica-averaged structuralrestraints generate structural ensembles according to the maximumentropy principle. J. Chem. Phys. 138, 094112.(12) Roux, B., and Weare, J. (2013) On the statistical equivalence ofrestrained-ensemble simulations with the maximum entropy method. J.Chem. Phys. 138, 084107.(13) Boomsma, W., Ferkinghoff-Borg, J., and Lindorff-Larsen, K.(2014) Combining experiments and simulations using the maximumentropy principle. PLoS Comput. Biol. 10, e1003406.(14) Cavalli, A., Salvatella, X., Dobson, C. M., and Vendruscolo, M.(2007) Protein structure determination from NMR chemical shifts.Proc. Natl. Acad. Sci. U. S. A. 104, 9615−9620.(15) Shen, Y., Lange, O., Delaglio, F., Rossi, P., Aramini, J. M., Liu,G., Eletsky, A., Wu, Y., Singarapu, K. K., Lemak, A., et al. (2008)Consistent blind protein structure generation from NMR chemicalshift data. Proc. Natl. Acad. Sci. U. S. A. 105, 4685−4690.(16) Tolman, J., Flanagan, J., Kennedy, M. A., and Prestegard, J.(1995) Nuclear magnetic dipole interactions in field-oriented proteins:information for structure determination in solution. Proc. Natl. Acad.Sci. U. S. A. 92, 9279−9283.(17) Tjandra, N., and Bax, A. (1997) Direct measurement ofdistances and angles in biomolecules by NMR in a dilute liquidcrystalline medium. Science 278, 1111−1114.(18) Bleaney, B. (1972) Nuclear magnetic resonance shifts insolution due to lanthanide ions. J. Magn. Reson. 8, 91−100.(19) Mayo, B. (1973) Lanthanide shift reagents in nuclear magneticresonance spectroscopy. Chem. Soc. Rev. 2, 49−74.(20) Bertini, I., Felli, I. C., and Luchinat, C. (1998) High magneticfield consequences on the NMR hyperfine shifts in solution. J. Magn.Reson. 134, 360−364.(21) Bertini, I., Luchinat, C., and Parigi, G. (2002) Magneticsusceptibility in paramagnetic NMR. Prog. Nucl. Magn. Reson. Spectrosc.40, 249−273.(22) Losonczi, J. A., Andrec, M., Fischer, M. W., and Prestegard, J. H.(1999) Order matrix analysis of residual dipolar couplings usingsingular value decomposition. J. Magn. Reson. 138, 334−342.(23) Zweckstetter, M., and Bax, A. (2000) Prediction of stericallyinduced alignment in a dilute liquid crystalline phase: aid to proteinstructure determination by NMR. J. Am. Chem. Soc. 122, 3791−3792.(24) Camilloni, C., and Vendruscolo, M. (2015) A Tensor-FreeMethod for the Structural and Dynamical Refinement of Proteinsusing Residual Dipolar Couplings. J. Phys. Chem. B 119, 653−661.
(25) Wirz, L. N., and Allison, J. R. (2015) Comment on “A tensor-free method for the structural and dynamic refinement of proteinsusing residual dipolar couplings. J. Phys. Chem. B 119, 8223−8224.(26) Camilloni, C., and Vendruscolo, M. (2015) Reply to “Commenton ‘A Tensor-Free Method for the Structural and DynamicRefinement of Proteins using Residual Dipolar Couplings’. J. Phys.Chem. B 119, 8225−8226.(27) Olsson, S., Ekonomiuk, D., Sgrignani, J., and Cavalli, A. (2015)Molecular dynamics of biomolecules through direct analysis of dipolarcouplings. J. Am. Chem. Soc. 137, 6270−6278.(28) Barbato, G., Ikura, M., Kay, L. E., Pastor, R. W., and Bax, A.(1992) Backbone dynamics of calmodulin studied by nitrogen-15relaxation using inverse detected two-dimensional NMR spectroscopy:the central helix is flexible. Biochemistry 31, 5269−5278.(29) Bertini, I., Giachetti, A., Luchinat, C., Parigi, G., Petoukhov, M.V., Pierattelli, R., Ravera, E., and Svergun, D. I. (2010) Conformationalspace of flexible biological macromolecules from average data. J. Am.Chem. Soc. 132, 13553−13558.(30) Anthis, N. J., Doucleff, M., and Clore, G. M. (2011) Transient,sparsely populated compact states of apo and calcium-loadedcalmodulin probed by paramagnetic relaxation enhancement: interplayof conformational selection and induced fit. J. Am. Chem. Soc. 133,18966−18974.(31) Pronk, S., Pall, S., Schulz, R., Larsson, P., Bjelkmar, P.,Apostolov, R., Shirts, M. R., Smith, J. C., Kasson, P. M., van der Spoel,D., et al. (2013) GROMACS 4.5: a high-throughput and highly parallelopen source molecular simulation toolkit. Bioinformatics 29, 845−854.(32) Tribello, G. A., Bonomi, M., Branduardi, D., Camilloni, C., andBussi, G. (2014) PLUMED 2: New feathers for an old bird. Comput.Phys. Commun. 185, 604−613.(33) Darden, T., York, D., and Pedersen, L. (1993) Particle meshEwald: An N⊕ log (N) method for Ewald sums in large systems. J.Chem. Phys. 98, 10089−10092.(34) Bussi, G., Donadio, D., and Parrinello, M. (2007) Canonicalsampling through velocity rescaling. J. Chem. Phys. 126, 014101.(35) Parrinello, M., and Rahman, A. (1981) Polymorphic transitionsin single crystals: A new molecular dynamics method. J. Appl. Phys. 52,7182−7190.(36) Chattopadhyaya, R., Meador, W. E., Means, A. R., and Quiocho,F. A. (1992) Calmodulin structure refined at 1.7 Å resolution. J. Mol.Biol. 228, 1177−1192.(37) Camilloni, C., Cavalli, A., and Vendruscolo, M. (2013) Replica-averaged metadynamics. J. Chem. Theory Comput. 9, 5610−5617.(38) Piana, S., and Laio, A. (2007) A bias-exchange approach toprotein folding. J. Phys. Chem. B 111, 4553−4559.(39) Camilloni, C., and Vendruscolo, M. (2014) Statistical mechanicsof the denatured state of a protein using replica-averagedmetadynamics. J. Am. Chem. Soc. 136, 8982−8991.(40) Baftizadeh, F., Cossio, P., Pietrucci, F., and Laio, A. (2012)Protein folding and ligand-enzyme binding from bias-exchangemetadynamics simulations. Curr. Phys. Chem. 2, 79−91.(41) Kumar, S., Rosenberg, J. M., Bouzida, D., Swendsen, R. H., andKollman, P. A. (1995) Multidimensional free-energy calculations usingthe weighted histogram analysis method. J. Comput. Chem. 16, 1339−1350.(42) Marinelli, F., Pietrucci, F., Laio, A., and Piana, S. (2009) Akinetic model of trp-cage folding from multiple biased moleculardynamics simulations. PLoS Comput. Biol. 5, e1000452.(43) Kukic, P., Camilloni, C., Cavalli, A., and Vendruscolo, M. (2014)Determination of the individual roles of the linker residues in theinterdomain motions of calmodulin using NMR chemical shifts. J. Mol.Biol. 426, 1826−1838.(44) Andralojc, W., Berlin, K., Fushman, D., Luchinat, C., Parigi, G.,Ravera, E., and Sgheri, L. (2015) Information content of long-rangeNMR data for the characterization of conformational heterogeneity. J.Biomol. NMR 62, 353−371.(45) Ceriotti, M., Tribello, G. A., and Parrinello, M. (2011)Simplifying the representation of complex free-energy landscapesusing sketch-map. Proc. Natl. Acad. Sci. U. S. A. 108, 13023−13028.
Biochemistry Article
DOI: 10.1021/acs.biochem.5b01138Biochemistry 2015, 54, 7470−7476
7476