residual dipolar couplings in structure determination of ... · anita i. kishore was born in...
TRANSCRIPT

Residual Dipolar Couplings in Structure Determination of Biomolecules
J. H. Prestegard,*,† C. M. Bougault,‡ and A. I. Kishore†
Complex Carbohydrate Research Center, University of Georgia, Athens, Georgia 30602, and Institut de Biologie Structurale, 41 rue Jules Horowitz,38027 Grenoble Cedex 01, France
Received March 3, 2004
Contents1. Introduction 35192. Origin of Residual Dipolar Couplings and
Complementary Observables3520
2.1. Residual Dipolar Couplings (RDCs) 35202.2. Chemical Shift Anisotropy (CSA) 35212.3. Pseudocontact Shifts in Paramagnetic
Systems3522
2.4. Cross-Correlated Relaxation 35223. Alignment of Samples 3523
3.1. Bicelles 35233.2. Bacteriophage 35233.3. Polyacrylamide Gels 35243.4. Other Media 35243.5. Practical and Theoretical Considerations 3524
4. RDC Data Acquisition 35264.1. One-Bond HN−N and C−H RDCs 35264.2. Other Protein Backbone RDCs 35284.3. One-Bond C−C and C−H RDCs in Protein
Side-Chains3531
4.4. Proton−Proton RDCs 35315. Structural Interpretation of RDCs 3532
5.1. Additional Constraints in StructureDetermination and Refinement
3533
5.2. Direct Structure Determination 35335.3. A Tool for Structure Validation or Homology
Searches3535
5.4. Orientational Relationships betweenComponents
3535
6. Limitations and Future Directions 35377. Abbreviations 35378. Acknowledgments 35389. References 3538
1. IntroductionThe use of residual dipolar couplings (RDCs) in the
analysis of biomolecular structure and dynamics hasexpanded rapidly since its potential as a source ofstructural information on proteins was demonstratedin the mid 1990s.1,2 Of course, this work on proteinsrested on applications to smaller biomolecular sys-
tems that occurred much earlier,3 and even theseearly applications benefited from prior research onorganic molecules in partially ordered liquid crys-tals.4 However, in the 1990s, the existence of efficientmeans of introducing magnetically active isotopiclabels (13C and 15N) and the availability of tripleresonance strategies for selective manipulation andassignment of NMR resonances made widespreadapplication to large biomolecules possible. It wasfortuitous that the 13C and 15N labels introduced hadsmall magnetogyric ratios, allowing simple dipolarinteractions with directly bonded protons to dominateRDC observations. Prior work had focused on sys-tems with couplings coming from the much larger1H-1H dipolar and 2H quadrupolar interactions.While large interactions and the resultant increasedsize of observable couplings may have seemed anadvantage, these large interactions also lead tocomplex spectra and broader lines. In the case of 1H-1H interactions, additional splittings of resonancesfrom protons at long distances arose, and in bothcases broader lines resulted from enhanced spinrelaxation processes.
Since the recognition of the potential of RDCs inprotein structure determination, applications havespread to nucleic acid structure, carbohydrate struc-ture, protein-ligand interactions, protein domainrelationships, high-throughput strategies for struc-tural genomics, and studies of motional amplitudesin flexible assemblies. Related pieces of data comingfrom interactions with paramagnetic sites and chemi-cal shift anisotropy (CSA) offsets have also come ontothe scene. Each new application demands parallelimprovements in sample preparation, data acquisi-tion, and data analysis methods.
The development of RDC applications has beenreviewed periodically since their introduction to thestructural biology field,5-13 and the reader is referredto these reviews for a more complete description ofthe history and the underlying theory. Here, we willprovide a brief introduction to RDCs and related dataas they are used today. Advances that have beenmade in alignment techniques, data acquisitiontechniques, and analysis methods will be reviewed.In the course of this review, we will provide examplesof applications that use these methods. Applications,per se, have become too numerous to attempt acomprehensive review.
* To whom correspondence should be addressed. James H. Prest-egard, Complex Carbohydrate Research Center, University ofGeorgia, 315 Riverbend Road, Athens, GA, 30602. Phone: (706)542-6281. Fax: (706) 542-4412. E-mail: [email protected].† University of Georgia.‡ Institut de Biologie Structurale.
3519Chem. Rev. 2004, 104, 3519−3540
10.1021/cr030419i CCC: $48.50 © 2004 American Chemical SocietyPublished on Web 07/07/2004

2. Origin of Residual Dipolar Couplings andComplementary Observables
2.1. Residual Dipolar Couplings (RDCs)RDCs arise when molecular systems containing
proximate pairs of magnetic nuclei are partiallyordered in magnetic fields. The underlying mecha-nism is the same as the through-space dipole-dipole
coupling that dominates solids NMR spectra. For apair of spin 1/2 nuclei in a magnetic field, the distanceand angle dependence are shown in eq 1 below, wherer is the distance between a specific pair of nuclei, γi,jare the magnetogyric ratios for the nuclei, µ0 is thepermittivity of space, h is Planck’s constant, and θis the angle between the considered internuclearvector and the magnetic field. When all parametersare given in SI units, the resulting Dij is given inHertz. Many measurements of RDCs are madebetween pairs of bonded nuclei, so that r is fixed;RDCs have, thus, been used primarily to provideangular information.
The formula in eq 1 differs from the dipolarcoupling expression commonly used in solids NMRapplications in some important ways. First, thebrackets around the angular term denote averagingover the fast molecular motion that occurs in solutionor liquid crystal media. If motion allows vectors tosample directions uniformly in space, the expressionreduces to zero; hence, the requirement that partialalignment be used to produce measurable values.Rapid averaging also means that, under partialalignment, interactions result in a single uniformsplitting of resonances rather than a solids-likepowder pattern. Second, the expression differs by afactor of 2 from that used in the solids NMR area.This is done so that values correspond directly to theincrement in splitting of the doublets that would beseen in through-bond-coupled spectra of an isolatedpair of spin 1/2 nuclei. And third, the expressionassumes that all couplings are first order (coupledspins are effectively “unlike” spins).
The effects of RDC are illustrated in the energylevel diagram of Figure 1 for a pair of bonded 1H and15N spins. The 15N (first spin) has a negative mag-netogyric ratio, and the 1H (second spin) has apositive magnetogyric ratio. The common spin opera-tor for dipolar and scalar parts (2HzNz) produces theperturbations shown to the right of the initial energy
James H. Prestegard was born and raised in Minnesota, and receivedhis bachelor’s degree from the University of Minnesota in 1966. Afterearning his Ph.D. in chemistry from Caltech in 1971 under the directionof Professor Sunney Chan, he moved directly to a faculty position in theChemistry Department at Yale University where he remained for 27 years.He moved to The University of Georgia in 1998 where he is a Professorin the Department of Biochemistry and Molecular Biology as well as inthe Department of Chemistry. His laboratories are in the ComplexCarbohydrate Research Center where he holds the title of GeorgiaResearch Alliance Eminent Scholar in Nuclear Magnetic ResonanceSpectroscopy. His fundamental studies involving membrane-associatingmolecules dissolved in magnetically oriented phospholipid micelles fueledthe now widespread interest in structural applications of residual dipolarcouplings. Current applications of residual dipolar couplings in his laboratorynow include determining the relative orientation of remote domains ofmacromolecular systems, the backbone structures of protein targets instructural genomics projects, and the geometry of carbohydrate bindingin protein complexes.
Catherine M. Bougault was born in 1967 in Bourges, France. She receiveda national Agregation teaching degree in Chemistry (1990), her B.Sc.degree (1991) from the Ecole Normale Superieure de Lyon, France, andher Ph.D. degree (1994) in inorganic synthetic chemistry from the JosephFourier University in Grenoble, France. As a postdoctoral Lavoisier fellowwith Prof. Gerd La Mar at the University of California, Davis, her interestsmoved to the NMR study of metalloproteins in their paramagnetic states.She became Assistant Professor in Chemistry in Joseph Fourier Universityin 1995 and recently (2001−2003) spent a sabbatical in Athens, Georgia,where she worked, with Prof. James H. Prestegard, on the hyperther-mostability of a small metalloprotein, rubredoxin.
Anita I. Kishore was born in Carbondale, Illinois, earned a B.S. in chemistryfrom Yale University, and received an M.Sc. in chemistry from theUniversity of Melbourne under the direction of Prof. Frances Separovic.She is currently a Ph.D. student in chemistry at the University of Georgiawith Prof. Prestegard. Her dissertation work is on developing NMRtechniques to study membrane-associated biomolecules.
Dij ) -µ0γiγjh
(2πr)3 ⟨3 cos2 θ - 12 ⟩ (1)
3520 Chemical Reviews, 2004, Vol. 104, No. 8 Prestegard et al.

levels as dictated by just a Zeeman interaction withan external magnetic field (energies not to scale).Because of the identical spin operators, RDCs addto scalar couplings (JHNN) to produce splittings ofJHNN + DHNN. As drawn in the diagram, the sum ofJHNN and DHNN would have to be negative. The actualsum could, of course, be either positive or negative,depending on the nature of molecular orientationalaveraging. Two resulting doublets (one at the 15Nfrequency and one at the 1H frequency) are shownat the bottom. Splittings are usually measured underisotropic (JHNN) and aligned (JHNN + DHNN) conditionsto isolate the RDC contribution.
The need for partial alignment actually introducesadditional unknowns into the above expression, mak-ing analysis of RDCs in terms of angular constraintsless straightforward than the simplicity of eq 1 wouldimply; at a minimum, there must be parametersspecifying the level and direction of order. The orderalso need not be axially symmetric, making it neces-sary to specify the orientation of a complete orderingframe relative to a molecule fixed coordinate system,as well as the extent and asymmetry of order.Specifying order results in the appearance of fiveindependent variables as opposed to the single an-gular variable explicitly occurring in eq 1.
Following a practice set in the liquid crystalliterature, these five variables can be introduced aselements of a 3 × 3 order matrix (Skl, eq 2).14 Dmax ijis the coupling for a pair of nuclei at a 1.0 Åseparation with their internuclear vector along themagnetic field, and the cos(θk,l) are the directioncosines relating the internuclear vector to the axes(x,y,z) of the order matrix frame. Because the matrixis traceless and symmetric, only five elements areindependent. These five elements can also be viewedas the three Euler angles needed to transform mo-lecular representations from the initial molecularframe to the principal frame in which the ordermatrix is diagonal, plus a principal order parameter(S′zz) and an asymmetry parameter (η ) (S′xx - S′yy)/S′zz) for this new frame. The elements of ordermatrices are dimensionless and of magnitude 10-3
for systems discussed here, reflecting the fact thatmotional averaging reduces observable dipolar cou-plings by approximately 3 orders of magnitude fromtheir static counterparts (1H-15N RDCs observed are
on the order of (25 Hz as opposed to the maximumcoupling of 24 350 Hz that would be observed for astatic directly bonded pair at 1.02 Å oriented in thedirection of the magnetic field).
Some alternate practices for specifying molecularorder have also arisen. One stems from an assump-tion that the principal alignment frame may beknown. Once in the principal alignment frame, allS′ij for i * j are zero and eq 2 can be simplified. Theremaining S′ii are replaced with new variables suchas an axial alignment parameter, Da, and a rhom-bicity parameter, R. These new parameters aresimply related to order parameters as follows: S′zz )2Da ij/Dmax ij, and η ) 3/2 R.
For procedures that generate structural solutionsby minimizing error functions through rotation of amolecular fragment toward a principal alignmentframe, writing trial RDCs in the form of eq 3 isconvenient. It is also convenient in the case ofmagnetic alignment of a molecule containing a para-magnetic center, where approximate directions foraxes of a susceptibility tensor may be known fromlocal coordination geometry. In this latter case, Da ijand R are related to the magnitude and rhombicityof a susceptibility tensor.15 Here Da ij ) (Dmax ij/2)-(B2∆ø/(15kTµ0)) and R ) δø/∆ø, where ∆ø is the axialanisotropy of magnetic susceptibility and δø/∆ø is therhombicity. Note that a dependence on magnetic fieldsquared enters (B2). This points to the potentialimportance of an alignment mechanism dependenton inherent anisotropic magnetic susceptibilities ofmolecules of interest as higher field magnets becomeavailable.
2.2. Chemical Shift Anisotropy (CSA)There are other partial alignment effects on NMR
spectra that can complement RDC information in thesense that they display similar angular dependencies.Among these effects are resonance offsets that arisefrom anisotropies in chemical shielding tensors.16-19
The chemical shielding of nuclei in most moleculargroups varies with orientation in a magnetic field dueto the anisotropy of the group’s electronic distribu-tion. Normally in solution NMR, only the isotropicaverage of the resonance position is seen, δiso. How-ever, offsets to the isotropic chemical shift underpartial alignment can be significant for nuclei inchemical groups with particularly large CSAs, 13C ina carbonyl group, for example. These offsets can beused to place constraints on geometries of molecularmodels.
The chemical shift offset, δcsa, can be expressed asshown in eq 4, where the δkk are the principalelements of the anisotropic part of the chemical shifttensor, θik and θjk are the angles between the prin-
Figure 1. (A) Energy level diagram for a 1H-15N spinsystem. The dashed arrows are 15N transitions, and thesolid arrows are 1H transitions. The effects of scalar anddipolar couplings, assuming a negative J + D value, aredenoted to the right of the diagram. (B) The expected 15Nand 1H doublets are shown at the bottom.
Dij )Dmax ij
r3∑k,l
Skl cos(θk) cos(θl) (2)
Dij )Da ij
r3 [(3 cos2 θ - 1) + 32
R sin 2 θ cos(2φ)] (3)
Structure Determination of Biomolecules Chemical Reviews, 2004, Vol. 104, No. 8 3521

cipal axes of the shift tensor and an arbitrarymolecular frame, and Sij are the elements of the ordertensor in the molecular frame. The values of δkk areassumed to be well defined in a frame oriented in anindividual molecular group. In practice, the valuesand directions of their principal axes have been takenfrom suitable model compounds examined in the solidstate. As an alternate procedure, accurate ab initiocalculations of chemical shift tensors seem to offerpromising results.20,21
The similarity of eq 4 to the RDC eq 3 can berecognized when eq 4 is re-expressed as the sum oftwo pseudo-dipolar couplings in the principal align-ment frame (eq 5).16 This equation uses the samealignment parameters as eq 3. It presumes that oneknows the angles between the principal alignmentframe and the principal axes of the shift tensor for agroup of interest (or that one can find them througha simulated annealing procedure).
Applications of CSA offsets as structural restraintshave largely been confined to solid-state NMR whereoffsets are large and more easily measured than inweakly ordered solution NMR. The anisotropic con-tribution to the chemical shift in the case of weaklyordered systems requires high resolution and precisechemical shift referencing. Chemical shift offsetshave been measured for carbonyl carbons in bothglycolipids and amphipathic peptides strongly ori-ented by incorporation into phospholipid bicelles22,23
and in both low24 and high molecular weight pro-teins16 weakly oriented by collisional interactionswith alignment media. Phosphorus chemical shiftoffsets in oligonucleotides17 and nitrogen shift offsetsin proteins18,25 have been measured in a variety ofalignment media. One of the primary difficulties inthe use of CSA offsets is that both an isotropicreference spectrum and an aligned spectrum mustbe collected under conditions in which variations inenvironment (such as temperature) introduce noadditional chemical shift perturbations; differencesin peak positions between aligned and referencespectra can then be associated solely with CSAoffsets. An interesting approach to solving this prob-lem is to compare spectra of the same sample takenunder static and spinning conditions, where spinningat the magic angle destroys the ordering of mostliquid crystalline media and allows the dipolar in-teraction to average to zero.26
2.3. Pseudocontact Shifts in ParamagneticSystems
A similar set of equations results for resonanceoffsets seen in systems carrying a magneticallyanisotropic paramagnetic center. These systems ex-hibit not only field-induced alignment, but alsochemical shift offsets that depend on pseudocontact(or dipolar) shifts, δpc.27,28 First-order contributionsto pseudocontact shifts do not actually depend onmolecular alignment but come from a net electronspin moment that depends on a molecule fixedsusceptibility tensor. We include a discussion herebecause of the complementary nature of the data.Pseudocontact shifts are distinct from through-bondcontact shifts that occur over short distances. Contactshifts can also be useful, but they depend on elec-tronic structure theories for interpretation.15,29,30 Theform of the equation for pseudocontact shifts (eq 6)also bears a marked similarity to eq 3 with axial andrhombic susceptibilities being substituted for axialalignment and rhombicity parameters. The electron-to-nucleus distance (r) also appears in place of aninternuclear distance. There is a subtle difference inthat the susceptibilities used here are those for theparamagnetic center and not the total (paramagneticplus diamagnetic) susceptibilities that would be usedin an expression for RDCs resulting from magneticalignment. The expression also lacks a dependenceon nuclear properties and gives resonance offsets indimensionless units appropriate for measurement inparts per million. Measurement of the offset requirescomparison to a diamagnetic analogue having thesame geometry and charge distribution. While prepa-ration of a suitable reference sample can be achallenge, there are illustrations of successfulmeasurement,28,31-33 and when successful, the dataprovide both angular and long-range distance con-straints.
2.4. Cross-Correlated RelaxationMore recently, cross-correlated relaxation interfer-
ence has also provided angular information in a formsimilar to RDCs. In particular, interference betweendipole-dipole interactions and Curie interactions hasbeen used to some extent.32,33 While observation ofthis interference, like observation of pseudocontactshifts, does not require partial alignment, we includea discussion here because of the complementarynature of the data. Cross-correlated relaxation aris-ing from interference between a contribution from aparamagnetic center-nuclear dipole interaction (theCurie contribution dominating paramagnetic at highermagnetic fields) and a contribution from a nucleardipole-nuclear dipole interaction can be expressedas in eq 7. Here i is usually a proton and j is an 15Nor 13C site in a paramagnetic protein, ri is thedistance between the paramagnetic center and the jspin, ωi is the proton resonance frequency, τr is therotational correlation time of the protein, and θ is
δpc ) 112πr3[∆ø(3 cos2 θ - 1) + 3
2δø sin2 θ cos(2φ)]
(6)
δcsa ) δalign - δiso )2
3∑
i)x,y,z∑
j)x,y,z∑
k)x,y,zSij cos(θik) cos(θjk)δkk (4)
δcsa ) 13[Da(2δxx + δyy){(3 cos2 θ1 - 1) +
32
R sin 2 θ1cos(2φ1)} + Da(2δxx + δyy){(3 cos2 θ2 -
1) + 32
R sin2 θ2cos(2φ2)}] (5)
3522 Chemical Reviews, 2004, Vol. 104, No. 8 Prestegard et al.

the angle between the 1H-X vector and the electron-proton vector. The effects are very similar to theeffects of CSA and dipole-dipole cross-correlationexploited in TROSY experiments, and, in fact, cross-correlated relaxation can be measured from differ-ences in line widths of spin coupled multiplets.Analysis of dipole-dipole/CSA interference can givesimilar angular information.34 The angular depen-dence for both effects is again of similar functionalform to RDCs but complementary in that the vectorsinvolved are different in each case.
Recently authors have used RDC, pseudocontactshift, cross-correlated relaxation and paramagneticrelaxation enhancement data together to develop anovel strategy for fast NMR resonance assignmentin 15N HSQC spectra of proteins, whose structuresare known from X-ray. This strategy yields themagnetic susceptibility tensor at the same time.35 Asapplications progress, there are certain to be newsources to exploit for orientational and angularinformation.
3. Alignment of SamplesPartial alignment of samples is the key to the
observation of RDCs, as well as other observablesthat come from anisotropies in spin interactions. Theneed for this alignment is embodied in the depen-dence on order parameters that average to zero anytime molecules sample an isotropic distribution oforientations in a time short compared to the recipro-cal of the interaction. Early applications used highmagnetic fields and inherent anisotropies in magneticsusceptibilities of the molecules of interest to directlyinduce nonisotropic distributions,1 or they used thefield-induced order of liquid crystalline media toindirectly induce nonisotropic distributions throughcollisional interactions of the molecules of interest.22
These early alignment methods are depicted inFigure 2 for the case of field-induced order of myo-globin (Figure 2A) and collision-induced order of atwo-domain fragment of barley lectin in a bicellemedium (Figure 2B). A number of different media foraligning samples exist, and the most commonly usedmedia are described here.
3.1. BicellesBicelles were the first medium used to collect RDCs
in biomolecules. The actual physical nature of thebicelle medium depicted in Figure 2B has come intoquestion recently.36 The original model for bicellescomposed of mixtures of dimyristoylphosphatidyl-choline and dihexanoylphosphatidylcholine (3:1) isone of lipid bilayer disks 30-40 nm in diameter,having the shorter chain lipid concentrated at theedges. The model is actually supported by a varietyof data on closely related systems including low angleX-ray scattering data,37 data on the anisotropicdiffusion of solvent about the disks,38 NMR data onthe orientation and distribution of the two lipids
making up the particles,39,40 as well as electronmicroscopy, fluorescence, and light scattering dataon particle size.39 Nevertheless, these data are oftenon samples prepared at higher concentrations thanthose typically used for high resolution biomolecularstudies, or they are on somewhat different lipidcompositions, or interpretation relies on model-de-pendent theories to relate less direct observations tothe question at hand. Recently, an alternate “Swisscheese” model has been proposed in which bilayersare punctuated by holes lined with the shorter lipid.36
Support for this model depends on relating less directdiffusional data for a lipid-soluble probe to thestructural model. Debate about the actual structuresthat exist may continue for some time,41,42 but bothmodels share a basic bilayer structure oriented withthe normal perpendicular to the magnetic field. Bothare, therefore, capable of imparting order thoughcollisional interactions of soluble, nonspherical mol-ecules with the bilayer surfaces.
3.2. Bacteriophage
The options for aligning soluble molecules for themeasurement of RDCs have increased dramaticallyin the years following initial applications of bicelles.Use of bacteriophage followed quickly and provedparticularly useful for the study of nucleic acidsystems as well as protein systems.43-46 The filamen-tous phage used in these studies are up to 1000 nmin length and of order 10 nm in diameter. They are
ηCCR ) κ(3 cos2 θ - 1)
ri3 (4τr +
3τr
1 + ωi2τr
2) (7)
Figure 2. Partial alignment of biomolecules: (A) myoglo-bin oriented by interaction of its anisotropic susceptibilitytensor (approximate axes shown) with the magnetic field(B0); (B) a two-domain construct from barley lectin orientedby collisions with bicelles. The protein’s long axis tends toalign parallel to the bicelle surfaces.
Structure Determination of Biomolecules Chemical Reviews, 2004, Vol. 104, No. 8 3523

covered by a coat protein and are highly negativelycharged. Recovery of sample by high-speed centrifu-gation of phage particles is possible.
3.3. Polyacrylamide Gels
Another distinctly different alignment medium isbased on anisotropically compressed polyacrylamidegels47,48 in which alignment is independent of themagnetic field direction. Orientation is based oncollisional factors much like the initial bicelle sys-tems, but the collisional barriers are strands ofpolyacrylamide instead of bilayer surfaces. Strandsare given a preferred direction by casting a gel of adiameter larger or smaller than the diameter of anNMR tube and then compressing or stretching thegel inside the tube. Suitable devices for facilitatingthis process have been described.49 The time requiredto diffuse a sample into the gel can be limiting, butdialysis after observation also presents a convenientoption for sample recovery. Adding a charge to the
gel allows somewhat better line shape for signalsobserved and provides more options for varyingalignment properties.50,51
3.4. Other Media
There is a wide variety of other media in use. Manyof them derive from media described above. Thereare, for example, a number of bicelle-like media thatuse different combinations of amphiphilic molecules.Some, such as those based on alkyl-poly(ethyleneglycol)/alcohol mixtures, are proving easy to use andlow in cost. In Table 1 we attempt to summarize thecurrent options for alignment media.
3.5. Practical and Theoretical Considerations
The identification of suitable media for a particularapplication is not necessarily trivial. It is not simplysufficient that media do not perturb molecular struc-tures; they must also induce a proper level of align-
Table 1. Alignment Media Commonly Used to Measure Residual Dipolar Couplings
medium molecular species charge
temprange(°C)
features andlimitations ref
ester-linked DMPC/DHPC neutral 27-45 + easy preparation 2phospholipid bicelles - expensive, susceptible
to hydrolysis183
ether-linked DIODPC/CHAPSO neutral 10-55 low pH 184phospholipid bicelles DIODPC/DIOHPC 185
phospholipid bicelles DMPC/DHPC/ CTAB, positive 27-40 69doped withcharged lipids
CTAB/SDS SDS, negative
poly(ethylene) glycolether bilayers
CnEm/n-alcohol neutral 0-60 + easy preparation,inexpensive
+ highly compatible withbiomolecules
186
- kinetics of alignmentesp. with dissolvedbiomolecules unknown
poly(ethylene) glycolether bilayers dopedwith charged lipids
CnEm/n-alcohol/CTAB/SDS positive, negative 0-60 109
bacteriophage rod-shaped viruses negative 5-60 + easy preparation,sample recovery
43, 44
- only suitable fornegatively chargedbiomolecules
187, 188
purple membranes cooperative anisotropicmembranes
charged <70 189, 190
stretched or strained polyacrylamide gels neutral 5-45 + easy sample recovery 47polyacrylamide gels + can accommodate
larger MW48
(esp. membrane) proteins 89- difficult to align
homogeneously191
- strong steric interactionscause broad lines
charged polyacrylamide acrylamide/acrylate charged 5-45 50gels + decreased line broadening 51
- delicate and easilyruptured
immobilized media gel- or polymer-stabilizedpurple membranes or phage
neutral + fixed director orientation 48, 192, 193
lanthanide ions/ align by anisotropy + no compatibility problems 54Ln-binding tags of susceptibility - very small degree
of alignment56, 57
Helfrich phases CPyBr/n-hexanol/NaBr neutral 0-70 + stable, wide temperaturerange
194
- very sensitive to salt,buffer, pH
195
3524 Chemical Reviews, 2004, Vol. 104, No. 8 Prestegard et al.

ment. Alignment must be sufficient to give measur-able RDCs but not so large as to introduce spectralcomplexity. A principal order parameter of 10-3 will,for example, give a maximum 15N-1H splitting for adirectly bonded amide pair of about 25 Hz. This islarge compared to typical line widths, particularly inthe 15N dimension of a 1H-15N HSQC spectrum, butit is not so large that long-range interactions beginto broaden resonances or cause second-order distor-tions of one bond couplings. Alignment is also weakenough that INEPT transfers optimized for one-bondscalar couplings in TROSY- or HSQC-based experi-ments do not begin to fail due to mismatch of transferdelays to total couplings. Simple adjustment of mediaconcentration is sometimes enough to scale alignmentto a proper level. However, the concentration rangeover which cooperative alignment occurs at all issmall for some media.
Several factors beyond simple concentration of theorienting medium must also be taken into accountwhen attempting to predict the level of order. Forexample, the overall charge and charge distributionof a protein must be considered when attempting toorient it in an electrically charged medium; a posi-tively charged protein will, for example, interactstrongly with negatively charged filamentous phage,leading to broad lines and poor resolution. A highlyasymmetric charge distribution (large quadrupolemoment) will also lead to greatly enhanced RDCs.In some cases, problems with strong charge-inducedassociation or orientation can be alleviated by raisingionic strength. However, this solution can be prob-lematic with less salt-tolerant high-sensitivity cryo-genic probes. In addition to electrostatic consider-ations, hydrophobic patches in biomolecules canassociate with amphiphilic alignment media. It isclear that a number of media are necessary if one isto find media that are compatible with the biomol-ecule, spectroscopically useful, and convenient toprepare.
One solution that may offer promise for the futureis the use of media-free, field-induced orientation ofbiomolecules. Besides the initial application to myo-globin,1 there have been several examples of inducedalignment that take advantage of inherent metalbinding sites in proteins or nucleic acids.35,52-55
Paramagnetic ions in appropriate sites have a largeanisotropic magnetic susceptibility that results in themolecule containing the site having a preferredalignment in a magnetic field. RDC contributions tosplittings of 15N-1H doublets in the original work oncyanometmyoglobin, which has a highly anisotropicFe(III) center, were slightly less than 3 Hz at 750MHz. However, field-induced alignment goes up asfield squared, suggesting that contributions would bemore than 4 Hz at 900 MHz. Paramagnetic ions canalso be substituted for nonparamagnetic native ions.Certain lanthanides have proven useful in thisrespect. Proteins can be engineered to have metal-binding tags that bind lanthanides with very highaffinities.56,57 RDC contributions to splittings for someof these systems have exceeded 10 Hz at 800 MHz.Contributions of this magnitude can easily be mea-sured.
One should also not forget that diamagneticanisotropies can be large if anisotropic entities suchas aromatic rings are arranged to coherently add tototal anisotropic susceptibilities.58 A 16-base pairDNA double helix, for example, has about the sameanisotropic susceptibility as the myoglobin moleculediscussed above. Use of natural orienting propertiesminimizes concern about media-induced anomalies.
In addition to finding a single compatible medium,it is very useful to have the option of using severalalignment media in the course of a study. Dipolarcouplings suffer from the multivalued nature of thedipolar coupling function. Even after transformingto a principal alignment frame, two different θ values(in a 0-180° range) can give the same value for the(3 cos2 θ -1)/2 RDC function. The direction of a singleinteraction vector in a molecular fragment can,therefore, be defined no better than being on thesurface of two opposing cones having these values ofθ as half angles. Similarly, equations for RDCsexpressed in terms of order parameters have fiveindependent parameters that must be determinedbefore the orientation of a molecular fragment in aprincipal alignment frame can be determined. Thislimitation can be partially addressed by collectingdata for several (five or more) different interactionvectors in a molecular fragment of known geometry(15N-1H, 13C-1H, 13C-15N, etc. for a residue in aprotein).
The degeneracy problem does not unfortunatelystop at this point. Principal order parameters (de-pendent on (3 cos2 θx,y,z - 1)) are insensitive toinversion of axis directions. It becomes clear that anorder frame can equally well be described by any oneof four possible combinations of positive and negativex, y, and z axis directions that yield a right-handedCartesian coordinate system. One way to lift thisdegeneracy and determine a unique orientation of amolecular fragment is to use at least two alignmentmedia with different alignment tensors.59
A second reason for using multiple media is relatedto the feasibility of collecting sufficient RDCs in afragment of known geometry. In some cases, it is notpossible to collect the minimum five RDCs requiredto define all independent members of an ordermatrix. Even if there is an adequate number ofinteraction vectors, they can be accidentally collinearand provide redundant information.60 A second align-ing medium can aid in gathering additional RDCs.It is difficult to see how this would work for a singleisolated fragment since new axis directions andprincipal order parameters are introduced. However,the fact that all fragments of a rigid molecule mustshare the same alignment frame and have identicalorder parameters means that new alignment vari-ables are introduced only once. Extreme examples ofthis strategy exist where structures have been de-termined by collecting only 15N-1H data but doingso in many alignment media.61,62 Use of multiplemedia also facilitates the analysis of internal motionproperties of biomolecules. This analysis introducesadditional parameters that must be evaluated in anyRDC-based analysis.9,51,63-67
Structure Determination of Biomolecules Chemical Reviews, 2004, Vol. 104, No. 8 3525

A third reason for using multiple alignment mediais for the elimination of the occasional concern aboutmedia-induced distortion of molecular geometries.Significant distortions as a direct result of an inter-action between the medium and the molecule ofinterest are unlikely because the energy of inter-action required to induce order of one part in 103 isextremely small. However, it is possible to preferen-tially orient populations of minor states that are inrapid equilibrium with major states. An average RDCis observed in these cases, and it can be dominatedby properties of the minor species.68 Collecting RDCsin multiple media can provide some protection againstimproper interpretation of measurements skewed bya minority of conformations. It is unlikely thatpreferential orientation of the same minority specieswill occur in all media, and derived conformationswill be inconsistent if significant problems of this typeoccur.
To achieve most of the above advantages, eachaligning medium must orient the biomolecule in asignificantly different way so that the alignmenttensors are not coincident. Simple solutions such asincreasing the concentration of a liquid crystal froma lower to a higher percentage, for example, will notwork; this will simply scale the dipolar couplings tolarger values and will not, in general, provide neworientational restraints for use in structural deter-mination. Use of media with perpendicularly orienteddirectors also does not yield new information. Inalignment media that orient with their directors 90degrees apart, for example, perpendicular and paral-lel to the magnetic field, elements of the alignmenttensors will simply be scaled by a factor of -1/2.Alignment media that orient the biomolecule throughprimarily similar steric interactions also tend to yieldsimilarly oriented alignment tensors. For example,aligning a protein in either poly(ethylene glycol) etheror phospholipid bicelles may give alignment tensorsdiffering primarily by a scaling factor. However, bychanging the nature of the liquid crystalline inter-actions with the biomolecule, for example, by chang-ing the electrostatics of the environment, uniquealignment tensors can be generated. This is easilyaccomplished by doping the bicelles or poly(ethyleneglycol) ether with a charged lipid69 or by combiningRDC data sets from phage and bicelles.70 In anyevent, effective use of multiple alignment media ina study of biomolecular structure or dynamics ben-efits greatly from the availability of a large numberof alignment media.
4. RDC Data AcquisitionInitial attempts at data acquisition concentrated
on the measurement of one bond 1H-15N and 1H-13C RDCs (1DHN-N and 1DC-H) in proteins and nucleicacids.1,71-73 The choice of these particular couplingswas dictated by practicality. The HN-N and H-Cinternuclear distances are rather short (1.02 and 1.08Å) and reasonably invariant. Thus, they exhibitsubstantial dipolar interactions dominated by directlybonded spins, and interactions could be interpretedin terms of angular constraints without concernabout distance variations. Splittings could be seen
in high sensitivity HSQC spectra with minimalmodifications of pulse sequences. Also, HN-N pairsare well distributed throughout proteins providingglobal structural information.
4.1. One-Bond HN−N and C−H RDCsEarly studies on field-aligned biomolecules, where
one-bond RDCs were expected to be on the order ofonly a couple of Hertz, focused on the design ofexperiments achieving precision of measurement onthe order of a couple of tenths of Hz. These experi-ments, based on modified HSQC schemes, wereessentially divided into two categories: frequency-resolved methods, where the coupling is observed asa difference in positions of the two lines of a doubletin a frequency domain, and intensity-based methods,where the coupling is encoded in the signal inten-sity.74 Most couplings were measured from frequencyor intensity modulation in the indirect heteronucleardimension because less efficient spin relaxation givesnarrower lines, and artifacts from 1H-1H couplings,and cross-correlated relaxation effects could be mini-mized. The introduction of alignment media andtunable degrees of order reduced concern aboutprecision of the measurement but did not fundamen-tally alter these two approaches. As a result, a largenumber of experimental schemes are available for themeasurement of 1DHN-N and 1DH-C. These experi-ments have been extensively discussed in previousreviews for small and medium-size proteins,6-8,11 forRNAs,75 and for oligosaccharides.76,77 In practice, theselection of a particular sequence depends on the fieldat which the data are collected, the degree of inducedalignment, the level of isotopic labeling, and the sizeof the molecular system studied.
The use of higher degrees of alignment (1DHN-N ofup to 40 Hz can be obtained in bicelles) is not withoutnegative consequences. In protonated samples, forexample, where the proton density is quite high, suchconditions cause severe 1H line broadening resultingfrom unresolved 1H-1H dipolar interactions. Reduc-tion of signal intensity as well as line shape distor-tions can also be observed in the indirect dimensiondue to long-range heteronuclear 1H-15N or 1H-13Ccouplings. Some more recent developments have beendirected at reducing these effects. To reduce distor-tions of the 1H line shape, vander Kooi et al.78 suggestthe use of band-selective 1H homonuclear WURSTdecoupling during acquisition. To solve the problemof line splittings or line broadening in the indirectdimension, Feher et al.79 and Pham et al.80 proposethe inclusion of a G-BIRD sequence in the middle ofthe t1 interval, respectively, in modified sensitivity-enhanced HSQC and J-modulated HSQC sequences.
In the case of small-to-medium size biomolecules,intensity-based and frequency-resolved 2D HSQCschemes have both been used. In general, intensity-based methods have the advantage of offering highprecision for the measurement of RDCs, but they maysuffer from considerable loss of accuracy if systematicerrors, such as relaxation-induced errors, pulse im-perfections, or presence of passive couplings, are notcarefully considered.81-83 In frequency-resolved ex-periments, phase distortion can complicate measure-
3526 Chemical Reviews, 2004, Vol. 104, No. 8 Prestegard et al.

ments, and accuracy is highly dependent on digitaland inherent resolution.84 Some efforts at comparisonof methods have been made. For example, values of1DHN-N were extracted, for a galectin-3C (142 aminoacids) sample, from phase-encoded (intensity-based)HSQC and coupling-enhanced (frequency-resolved)HSQC data sets. A root-mean square deviationbetween sets of 1.1 Hz for isotropic and 2.1 Hz foraligned samples suggests that both measurementsare precise and in good agreement with one another;however, it was possible to collect the intensity-baseddata in a somewhat shorter time.85 Agreement ofmeasured couplings with couplings back-calculatedfrom a crystal structure was substantially less thanprecision would indicate. This is very likely due inpart to “structural noise” associated with impropermodeling of local peptide geometry in terms ofuniform bond lengths and bond angles.
As the size of the biomolecule increases, thenumber of cross-peaks in even the simplest 2D-spectra becomes large, and the appearance of pairsof lines for each site in frequency-resolved approachesbecomes undesirable. In the last five years, severaltechniques have been used to achieve spin-stateseparation/selection, in the indirect dimension. Inthis context, IPAP, spin-state (S3E, S3CT), and R/â-selection elements have been included in sensitivity-enhanced pulse schemes. Key features of correspond-ing elements are presented in Figure 3.
In the IPAP sequences,86-90 an antiphase doubletis generated by the inclusion of the element presentedin Figure 3 at the beginning of the t1 evolution.Addition/subtraction of the obtained spectrum to thein-phase doublet generated in the absence of thiselement separates upfield and downfield componentsinto two spectra from which frequency positions canbe measured, each with half the number of peaks.In the S3-type (refs 78, 91, and 92 and referencestherein) and R/â-type experiments,92,93 spin-stateselective excitation is achieved through manipulationof pulse phases during the INEPT transfer, and thereverse INEPT phase, as to avoid spin-state mixing.All these sequences are prone to relaxation-inducedartifacts resulting in spurious peaks at the positionof the canceled resonance and are sensitive to J-mismatch. Elegant modifications have been proposedsuch as the double in-phase single antiphase-(DIPSAP) experiment which corrects for the latterproblem.94 A last alternative to circumvent theproblem of overlap in the J-coupled spectra has beenpresented very recently. In the J-evolved hetero-nuclear transverse relaxation optimized spectroscopy(JE-TROSY),95 J-coupling of the sharpest cross-peakmultiplet component selected in a TROSY experi-ment is allowed to evolve during the INEPT transferin addition to during the heteronuclear chemical shiftevolution time. As a result, the value of the 1H-15Nor 1H-13C coupling can be determined from thefrequency displacement from the zero frequency ina third dimension. A disadvantage results from theadditional dimension; nevertheless, the acquisitiontime is comparable to that of other J-modulatedexperiments.96
For medium-size to large 15N- or 15N,2H-labeledbiomolecules, combining TROSY elements97 with themeasurement of RDCs is very appealing. Differentialcross-correlated relaxation of the downfield and up-field components of a 1H-15N doublet means thatprecision of measurement will be limited by thebroadest component. It would be ideal to measurecoupling simply from the sharpest (TROSY) compo-nents. Because coupling inherently mixes fast andslow relaxing line components, however, it is difficultto retain the full TROSY advantage. Nevertheless,much progress has been made.84,91 RDCs measuredin a TROSY-HSQC pair of experiments clearly sur-pass those measured in the IPAP-HSQC. The preci-sion at which 1DHN-N can be measured with the
Figure 3. Pulse sequence elements used for the separationof doublet components in frequency resolved HSQC/TROSYRDC measurements. (A) Element added to collect theantiphase component of the IPAP at the beginning of thet1 period; ) 1/2JIS.86 (B) DIPSAP element. Three datasetsneed to be recorded with (i) ε ) τ/4, æ ) x; (ii) ε ) 0, æ ) x;(iii) ε ) τ/8, æ ) y; τ ) 1/JIS.94 (C) S3E205 and (D) S3CT224
elements inserted just before the t1 period with ) 1/2JIS.(E) R/â filter element with æ1 ) x, -x and æ3 ) x, x, -x,-x.198
Structure Determination of Biomolecules Chemical Reviews, 2004, Vol. 104, No. 8 3527

TROSY-HSQC has been estimated to be about 1 Hzon a 30 kDa protein, precision that is fully sufficientfor use in structure calculation.84 A very similar 2Dcoupling-enhanced (CE)-TROSY-HSQC has recentlyallowed the measurement of sufficient 1DHN-N in a15N,2H-labeled 53-kDa homomultimeric trimer frommannose-binding protein.98 A representative datasetand the corresponding sequence are shown in Figure4. When resonance overlap in the 2D HSQC spectrumbecomes problematic, 15N,13C,2H-labeled samples arerequired and a 3D TROSY-HNCO pulse scheme maybecome the method of choice, as in the case of a 723-residue enzyme, malate synthase.99 In both of thelatter examples, 1DHN-N couplings are extracted fromthe frequency displacement of the 1H-15N cross-peakin a reference TROSY experiment and the J-scaledTROSY sequence. Despite 15N relaxation rates on theorder of 10-15 ms at 800 MHz for the fast relaxingcomponents, these procedures allow measurement ofcouplings within 2-3 Hz for large proteins in alignedmedia.
4.2. Other Protein Backbone RDCsDespite success with measurement and interpreta-
tion of one-bond couplings, there is a clear need tomeasure a larger variety of couplings. In fact, fiveindependent measurements are required to define
order and orientation of small fragments, and ad-ditional parameters must be defined if dynamics areto be studied. Thus, a variety of experimental schemeshas been designed for the collection of 1DN-C′, 1DN-CR,1DCR-C′,
1DCR-Câ,2DN-CR,
2DHN-C′, 2DHN-CR, and 3DHN-CRRDCs in 15N,13C or 15N,13C,2H-labeled proteins. Theseexperiments take advantage of the methodologydeveloped for the measurement of 1DHN-N and 1DH-Ccouplings, as well as the triple-resonance experi-ments developed for assignment purposes. They haverecently been extensively reviewed by Bax and co-workers.7 Nevertheless, one principal advancementin recent years deserves special attention, namely,the collection of multiple couplings in a single experi-ment. This is motivated not only by the need toreduce spectrometer time requirements but also bythe need to work within limits imposed by instabilityof biomolecules or alignment media.
Multiple couplings were first collected in a 30-kDaperdeuterated protein, MAP 30.100 At 700-800 MHz,the 15N line-narrowing obtained by constructive useof relaxation interference between 1H-15N dipolarcoupling and 15N CSA (TROSY) allows the accuratesimultaneous measurement of 1DHN-N, 1DN-C′, and2DHN-C′. 1DHN-N splittings are further separated intwo different spectra by addition/subtraction of thein-phase and antiphase 15N-1H doublets collected inthe indirect dimension of a 1H,15N HSQC spectrum.In each subspectrum, the absence of 13C′ and 1Hdecoupling during the 15N evolution yields E.COSY-type patterns, from which the 1DN-C′ and 2DHN-C′ canbe extracted, respectively, from the indirect anddirect dimensions. Since that time, several strategiesincluding the IPAP strategy, spin-state selectivestrategies, and J-modulated strategies have beenused for the concomitant measurement of many othercouplings. Adding to the collection of experimentspreviously reported by Griesinger et al.,101 many ofthese experiments, the couplings measured, theirexperimental basis, and their respective referenceshave been collected in Table 2. As the size of thestudied protein increases drastically, some of theseapproaches are hampered by resolution and sensitiv-ity issues and by the severe attenuation of the anti-TROSY component.97 For large 15N,13C,2H-labeledproteins, Yang et al.102 proposed three modifiedTROSY-HNCO pulse schemes for the collection of1DHN-N and 2DHN-C′, 1DN-C′ and 2DHN-C′, as well as1DC′-CR and 3DHN-CR RDCs. These pulse sequencestake advantage of the E.COSY strategy103 as well asaccordion style spectroscopy104 (except in the lastcase). When collected on a 1 mM sample of maltose-binding protein (42 kDa), they yielded a set of fiveRDCs for 275 well-resolved resonances with reason-able agreement between repeated experiments andvalues calculated from the crystal structure. Incor-porated into a structure refinement procedure, thisdataset improved the precision of the family ofstructures from 5.5 to 2.2 Å, while the rmsd withrespect to the X-ray structure reduced from 5.1 to 3.3Å.105
While RDCs have been most frequently used incombination with other types of NMR data to char-acterize biomolecular structures, there have also been
Figure 4. Example of 1HN-15N RDC measurement in alarge protein using a mixed HSQC-TROSY pulse sequence(CE-TROSY):98 (A) pulse sequence in which the period, κ) kτ, introduces variable amounts of coupling evolutioninto a TROSY sequence. (B) Two representative cross-peaksshowing a difference in displacement for isotropic andaligned conditions. The numbers in parentheses are offsetsadjusted by κ to directly reflect the couplings. The sampleis 0.7 mM in the 53-kDa 15N,(50% randomly deuterated)-labeled mannose binding protein trimer in 6% (w/v) bicellesolution.
3528 Chemical Reviews, 2004, Vol. 104, No. 8 Prestegard et al.

Table 2. Pulse Sequences Used for the Collection of Residual Dipolar Coupling Data
biomolecule labelingdipolar
coupling method principle ref
small/medium 15N HN-N J-HSQC J-modulation 71size protein phase-encoded HSQC peak volume in two spectra 81,196
SCE-HSQC line position from two spectra,normalization
98,197
IPAP-HSQC line position from two spectra 84,86,89E.COSY-HSQC E.COSY extraction 87S3E-HSQC line position from two spectra 78S3CT-HSQC line position from two spectra 91R/â-HSQC line position from two spectra 93,198
13C CR-HR CT-J-HSQC J-modulation 8215N,13C HNCO E.COSY type spectra 199
(HACACO)NH J-modulation 96(HACACO)NH J-modulation 96IPAP-(HA)CANH line position from two spectra 107HCCH-COSY line position from two spectra 90
15N,13C N-C′, N-CR TROSY-HNCO J-modulation 200J-correlated HNC peak volume in two spectra 201SE-HSQC line position from two spectra 202
C′-CR HN-(R/â-COCA-J) line position from two spectra 20313C C′-CR CT-HSQC line position 204
HN-CR, HN-HR CT-J-HSQC J-modulation 82S3E-HSQC line position from two spectra 205
15N, (10-15% 13C) HN-CR, HN-HR soft-HNCA-E.COSY E.COSY extraction 7015N,13C N-C′, HN-C′ semi-CT-HSQC line position difference, normalization 206
DIPSAP J-HNCO line position in three spectra 111S3E/IPAP-HNCO E.COSY extraction 100
HN-N, CR-C′HN-N, CR-HR
IPAP-HNCO line position from two spectra forHN-N, from one spectrum CR-X
207
HR-N, CR-HR E.COSY HNCA E.COSY extraction 208side-chain CH2: C-H CT-J-HSQC J-modulation 115
CB(CA)CONH peak volume from three spectra 11715N,13C side-chain CH2: C-H, H-H SPITZE-HSQC line positions from four spectra 118
side-chain CH3: C-H CT-J-HSQC J-modulation 115IPAP-CT-HSQC line positions from two spectra 116
15N,13C,50% 2H-fract lab
side-chain CH3: C-H filtered-CT-HSQC H,H coupling as antiphase splitting 114,209
side-chain CH3: C-C CT-HSQC J-modulation 122,20915N,13C side-chain CH3: H-H DiM H,H coupling as antiphase split 11915N,13C,
50% 2H-fract labside-chain CH3: H-H filtered-CT-HSQC line separation from two spectra 120
no label H,H COSY ACME amplitude-constrainedmultiplet evaluation
132
CT-COSY intensity modulation 133,210signed COSY 138MOCCA-SIAM ACME amplitude-constrained
multiplet evaluation211
N-H, HH-HR JHH-NOESY E.COSY extraction 139HHHR HNHA J-modulation 2
15N,13C HHHR HNCA-E.COSY E.COSY extraction 13415N,13C,2H H-H SS-HMQC peak volume 126
COSY-HMQC peak volume 127
large size protein 15N,2H HN, N JE-TROSY J resolved spectroscopyin the third dimension
95
SCE-HSQC line position from two spectra,normalization
98
15N,13C,2H HN, N TROSY-HNCO line position from two spectra 84,102HN-CR, HN-HR TROSY-HNCO line position from two spectra 102,212N-C′, HN-C′ TROSY-HNCO line position from two spectra 102,212
15N,13C,2H side-chain CH3: C-C 13C-13C-TOCSY H,H coupling as splitting 123
RNA/DNA 15N,13C C-H J-modulated HSQC intensity-modulation 213TROSY-HSQC line position from two spectra
in 1H dimension214
N9-C, H8N-N9 purineN1-C, H6N-N1 pyri
S3E-HC[N] line position from two spectra 112
MQ-HCN E.COSY extraction 215N1-C, H1N-N9 purine S3E-HN[C] line position from two spectra 112N3-C, H3N-C pyrimH2′-H1′, H2′-C1′/2′,
H1′-C1′/2′
CT-HMQC E.COSY extraction from C1′-C2′and H1′-C2′ planes
113
no label H,H CT-COSY intensity modulation 216selective-CT-COSY peak volume 128
H-P CT-NOESY intensity modulation 21719F H-F E.COSY E.COSY extraction 218,21915N,13C through H bond H-N HNN E.COSY extraction 220
polysaccharide no label C-H CT-CE-HSQC C-H splittings 129HMBC line fitting 221
H-H CT-COSY intensity modulation 133E.COSY E.COSY extraction 222
13C H-H, C-C CT-HSQC COSY intensity modulation 223
Structure Determination of Biomolecules Chemical Reviews, 2004, Vol. 104, No. 8 3529

efforts to use RDCs as primary sources of structuralinformation as a more efficient route to backbonestructures for proteins targeted by structural genom-ics projects.106 This provides additional motivation forsimultaneous collection of many types of couplings.Our own application imposed additional restrictionson the types of experiments that could be used bytargeting simultaneous resonance assignment andstructure determination and by emphasizing 15N asopposed to 15N/13C enrichment. 13C connectivitieswere not excluded from the experiments, but onlythose experiments with sufficient sensitivity to workat natural (or low) levels of 13C abundance werechosen. With recent improvements in the sensitivityof NMR instruments and the advent of cryogenic-probe technology, the most sensitive triple resonanceexperiments such as HNCO and HNCA becomefeasible. In this context, a set of three experimentshas been designed for the simultaneous backboneassignment and fold determination of small to me-dium-size proteins. It includes a 2D IPAP or phase-encoded HSQC, a 2D or 3D IPAP-HNCO, and a 3Dsoft-HNCA-E.COSY experiment, in which 1DHN-N,1DN-C′ and 2DHN-C′, and 1DN-CR and 2DHN-CR arerespectively collected.70,107,108
A representative dataset of the 3D HNCA experi-ment, including the isotropic and aligned sample ina mixture of DMPC/DHPC/CTAB bicelles, is pre-sented in Figure 5. The small protein studied con-
tains 77 amino acids and constituted one of the tar-gets of the South East Collaboratory for StructuralGenomics (SECSG).109 Several sections of 1HN-13CRplanes at particular 15N chemical shifts are shown.These establish connections of a given 1HN resonanceto both intra- (i) and inter- (i-1) 13CR resonances. Theintraresidue E.COSY-type multiplets show 1H-13CRsplittings in the vertical dimension and 1HN-1HRsplittings in the horizontal dimension for both alignedand isotropic conditions. The interresidue E.COSY-type multiplets show 1HN-13CR splittings in the ver-tical dimension and 1HN-1HR splittings in the hori-zontal dimension only for the aligned condition asthere is no significant interresidue four-bond 1HN-1HR scalar coupling. In addition to orientational in-formation from RDC values, the HNCA-E.COSY ex-periment provides key information to establish in-terresidue connectivities. As in the normal HNCAexperiment, matching the intraresidue CR shift seenin one segment to the interresidue CR shift seen inanother segment provides connectivity. However, theHNCA-E.COSY as used for RDC measurement hasadditional advantages. The HNi to CR(i-1) pair isreadily identified since the 1HN upfield and downfieldpeaks present no frequency shift in the direct dimen-sion. Also, accidental degeneracy in establishing se-quential connectivities is minimized by insisting onmatching of both doublet components in the alignedspectrum; because RDC values are different for dif-ferent (1HN,13CR) pairs, this adds an additional filter.
Analysis of the data can be automated to a consid-erable extent. In the case illustrated, this startedwith processing and automatic peak-picking, followedby a manual screening within the NMRPipe/NMRDraw suite of programs.110 Peak positions wererefined using Pipp and the nlinLS procedure withinNMRPipe. It was followed by the simultaneousassignment of resonances to a particular (1HN,15N)pair and measurement of couplings, which appearedas a frequency displacement in the direct and/orindirect dimension of the corresponding spectra. Thisstep was automated with the help of Tcl/Tk scriptsin NMRPipe. Matching of CR chemical shift as wellas splitting was also pursued automatically withina Tcl/Tk script.
For many protein samples, the time requirementfor recording a full 3D spectrum with a signal-to-noise ratio sufficient for the precise determinationof RDCs can be prohibitive. In fact, datasets contain-ing three or more RDCs per residue are limited(BMRB and PDB databases). In this context, reduceddimensionality approaches may offer a good compro-mise, at least for small to medium-size proteins. Withthis idea in mind, Bersch et al.111 recently demon-strated the concomitant measurement of 1DHN-N and2DHN-C′ in 15N,13C-labeled MerAa, a 68-amino acidprotein. The pulse sequence, a 2D J-HNCO(H), isbased on a regular HNCO experiment and uses thesame incremented time delay t1 to encode for the timeevolution of the two spins 15N and 13C′. An adaptedquadrature detection scheme, the absence of 1Hdecoupling during the 15N and 13C′ frequency editing,and the use of a J-mismatched compensated DIPSAPfilter (Figure 3) lead to the generation of two sub-
Figure 5. HNCA-E.COSY experiment for the simulta-neous measurement of 1H-13C, and 1HN-1HR couplings in15N-labeled, low percentage 13C-labeled proteins.70 (A) Pulsesequence generating a 3D spectrum with E.COSY multi-plets in the 1H-13C planes. (B) Example segments atdiscrete nitrogen frequencies showing intraresidue andinterresidue multiplets for two residues. The protein, a 77-residue conserved hypothetical protein from Pyrococcusfuriosus labeled to 90% in 15N and 16% in 13C is at 0.5 mMin 30 mM phosphate buffer, 50 mM KCl, 4% (w/v) C12E5/hexanol/CTAB (27:31:1). Data were collected at 600 MHzwith a cryogenic probe. Note that no 1HN-1HR splittingsare observed for interresidue multiplets under isotropicconditions.
3530 Chemical Reviews, 2004, Vol. 104, No. 8 Prestegard et al.

spectra R and â, where the resonance is displaced inthe indirect dimension by the sum and the differenceof the two targeted couplings. In this example, 1DHN-Nand 2DHN-C′ could be measured with a precision of1.0 and 0.5 Hz, respectively, for 52 out of the 68amino acids of the protein in only 45 min.
In DNA and RNA samples, measurements ofmultiple RDCs are sparse, partly due to the stillonerous labeling task and to the lower spectralresolution. A suite of 2D spin-state selective experi-ments, including the S3E excitation scheme, havebeen proposed for the simultaneous measurement ofone- and two-bond RDCs in pyrimidines and pu-rines.112 In addition, there are some 3D experimentsyielding as many as five couplings.113 References tothese experiments have been included in Table 2.
4.3. One-Bond C−C and C−H RDCs in ProteinSide-Chains
One- to three-bond backbone RDCs provide invalu-able orientational information for structure valida-tion, for de novo backbone fold determination, andfor the characterization of protein-protein, protein-DNA, or protein-ligand interactions. However, side-chain conformations are responsible for the criticaldetails at the protein surface and can be responsiblefor the recognition between a protein and its partner.At the active site or the core of a protein, accuratepositioning of methylene or methyl groups oftendefines hydrophobic side-chain contacts. Gainingorientational information on these fragments couldobviously complement the distance restraints ob-tained through NOEs and help in structure refine-ment. In addition, orientational restraints can facili-tate stereospecific assignments and provide an insightinto ø1 torsion angles.114
Three RDCs are commonly used to provide side-chain orientational information: 1DH-C, 2DH-H, and1DC-C. Some of the simplest and most convenientapproaches to measuring 1DC-H couplings are to usea J-modulated constant-time HSQC,115 an IPAP-CT-HSQC,116 or a 3D CB-(CA)CONH.117 For methylenegroups, Carlomagno et al.118 have proposed a se-quence that separates four of the eight normallyunresolved components of a CH2 coupled-HSQC mul-tiplet. The carefully designed sequence, SPIn sTateselective ZEro overlap HSQC (SPITZE-HSQC), yieldedthe measurement of HR1-CR, HR2-CR, and HR1-HR2scalar and RDCs for all six glycines present in a15N,13C ubiquitin sample. One cautionary note is thatvalues measured need to be interpreted carefullybecause of possible second-order effects.
In the case of methyl groups, the alignment intro-duces splittings in the proton spectrum which are theresult of nonaveraged dipolar interactions betweenmethyl protons. If the reorientation of the methylgroup around its C3 symmetry axis is fast, the 1DH-Hcoupling is, except for a scaling factor of -3/4,formally equivalent to the dipolar splitting betweentwo weakly coupled protons. A 2D pulse sequencewas designed by Kaikkonen and Otting119 to measurethe separation of the two outermost lines of thetriplet by creating antiphase magnetization whichsuppresses the central resonance of the triplet. The
observed relationship of 1DH-C and 2DH-H experimen-tal couplings, 2DH-H = 2.3 1DH-C, confirms thatmeasurement of 1DH-C and 2DH-H couplings are infact redundant. As the size of the protein increases,a high level of deuteration, 50% or so, is used to slowthe relaxation of heteronuclei. Methyl groups arethen present as three isotopomers, CH3, CH2D,CHD2, which show slightly different chemical shifts.Filters can be introduced in the pulse sequence ofinterest to select one of the isotopomers, CH2D, forexample, and 2DH-H can be measured quite easily.Using an R/â spin-state selection filter and a CT-HSQC based experiment Sibille et al.120 measured 65methyl DH-H couplings in SiR-FP18, a 18-kDaprotein. More importantly, the authors could pursuea significant number of stereospecific assignments forvaline, threonine, and isoleucine methyl groups byreproducing these measurements in two differentalignment media and fitting the experimental valueswith RDCs calculated using the analysis programMODULE.121
Alternatively, orientation of the methyl C3 sym-metry axis can be determined by the measurementof 1DC-C couplings. In high molecular weight, frac-tionally deuterated proteins, these couplings can bemeasured from a modified J-modulated constant-timeHSQC.122 Very recently, an approach using a 13C-start and 13C-observe experiment in combination withbroadband homonuclear cross-polarization has beenpresented for uniformly deuterated proteins of mo-lecular weight above 40 kDa.123 To date, this ap-proach is still limited by spectral overlap and themultiplicity of many 13C-correlation cross-peaks, butit may offer advantages for uniformly deuteratedproteins up to 100 kDa.
4.4. Proton−Proton RDCsMost of the RDCs presented so far have involved
spins separated by one or two bonds; the distancebetween spins is fixed by bond geometry and theobservables relate primarily to orientation. However,in the case of proton pairs, RDCs over much longerranges can be observed. When Hansen et al.124
executed a TOCSY-type pulse sequence on a 10-merDNA duplex in phage they noted the appearance ofnew cross-peaks. The corresponding long-range in-terproton dipolar interactions could be detected be-tween proton pairs separated by up to 7.5 Å. This isthe result of the 1/r3 dependence of the dipolarcoupling as compared to the 1/r6 dependence of theNuclear Overhauser effect. Constraints based onmeasurement of these couplings now involve bothdistance and angular variables. Their value forstructure determination of proteins was quicklyrecognized; measurement and inclusion of DH-Hcouplings in the structure refinement of ubiquitin,for example, resulted in a backbone atomic rms shiftof 0.43 Å toward the crystal structure.125 Perdeutera-tion of proteins can extend the range over whichcouplings can be measured and also allows themeasurement of DHN-HN couplings between remotebackbone segments in proteins.126,127 A more generalapproach for extending distances over which cou-plings can be observed is to effectively decouple all
Structure Determination of Biomolecules Chemical Reviews, 2004, Vol. 104, No. 8 3531

protons outside the spectral regions of interest duringthe homonuclear coherence transfer. A band-selective1H homonuclear decoupling pulse element has beendesigned and implemented in a COSY pulse se-quence. Couplings on an unlabeled 12-mer DNAduplex have been detected between two protons upto three base pairs (12 Å) apart.128
Another very useful application occurs in oligosac-charides. One-bond H-C dipolar couplings, which arerelatively easy to measure in these molecules, fre-quently do not provide a sufficiently diverse set ofRDCs to determine structure because of the nearlyparallel orientation of many C-H vectors in pyranoserings. The addition of proton-proton RDCs providesthe information needed and allows constraint of theorientation of one ring relative to another, as wellas some assessment of conformational flexibility inthese molecules.129,130
1H-1H couplings are also unique in that many ofthe experiments used to measure them do not requireisotopic labeling of the molecule of interest. SimpleCOSY experiments and their derivatives can provideconvenient means of visualizing couplings.131 Actualmeasurement of couplings is more challenging. Arecent procedure proposes an amplitude-constrainedmultiplet evaluation (ACME) to interactively extractthe coupling constants.132 An alternative is to use aconstant-time COSY. In the absence of significantdifferential relaxation, the cross-peak intensity andthe autopeak intensity are respectively modulated bya sine and cosine function of the homonuclear cou-pling constant. To avoid inaccuracy related to thedifferent phase properties of the cross- and autope-aks, data sets are collected for different constanttimes, and amplitudes of the signals are fit to extractthe necessary couplings. Data collected on a trisac-charide are presented in Figure 6, together withsubsequent analysis of the observed ratio of cross-peak and autopeak amplitudes.133 Other variants ofthese basic procedures are included in the experi-ments listed in Table 2.
In macromolecules that do have a high level of 15Nand/or 13C labeling, the heteronucleus can be advan-tageous in resolving additional proton-proton cou-plings. A variety of triple resonance experiments134-136
have been designed for 15N,13C-labeled proteins thattake advantage of the E.COSY approach proposed bySørensen and co-workers.135-137 This approach canalso be integrated in experiments designed for 15N-only labeled proteins. In the corresponding experi-ments, the transfer of coherence from the 1H nucleusto the 15N nucleus without nitrogen decouplingprovides the necessary E.COSY. After 15N evolutionand transfer to an amide proton, a TOCSY138 orNOESY139 transfer establishes a connection to aremote proton. This strategy provides both the mag-nitude and the sign of the DH-H coupling in contrastto approaches based on the HNHA or HSQC/HMQCexperiments which only provide magnitudes.140
There are of course a number of other types ofRDCs that can and have been measured, includingthose between 31P or 19F and any number of the spinswe have already discussed. The experiments used tomeasure these couplings parallel those discussed
above. We will not discuss these experiments indetail, but again we have included appropriate refer-ences in Table 2.
5. Structural Interpretation of RDCsThe advances in the acquisition of RDC data have
clearly enhanced the potential for extracting struc-tural information on a variety of biomolecular sys-tems. It is tempting to think of use in structuredetermination as a relatively straightforward under-taking. After all, programs for the production ofstructures based on NOE distance constraints arehighly refined and readily available. However, RDCsin most applications offer a fundamentally differenttype of information, information that is orientational,in addition to distance dependent. This fact, in someways, makes RDC information an ideal complementto NOEs; RDCs can provide long-range constraintson structures in situations in which few NOEs canbe observed. However, this fundamental differencein the nature of the information offered has requiredthe development of a number of new procedures and
Figure 6. Constant time COSY for the measurement of1H-1H RDCs. (A) Spectrum of trimannoside in aqueousbicelle media under (a) isotropic, 20 °C and (b) aligned, 36°C conditions. Note the appearance of long-range couplingsbetween the anomeric proton (H1) of ring I and thetransglycosidic protons (H3 and H4) of ring III underaligned conditions. (B) Plots of intensity ratio used toextract couplings (Icross/Iauto ) k tan(π(J + D)∆)) for the (a)isotropic and (b) aligned cases.
3532 Chemical Reviews, 2004, Vol. 104, No. 8 Prestegard et al.

new software programs for interpreting RDCs interms of structural models. We discuss these devel-opments in terms of four classes: (1) a group ofprograms combining RDC information with otherstructural constraints (NOE-based, for example) us-ing target, pseudoenergy, or error functions in MD-like algorithms, (2) a group of programs buildingstructures primarily from RDCs by a direct searchfor fragment geometries compatible with molecularalignment data, (3) a group of programs using RDCdata to search for homologous structures that mayexist in structural databases or to validate structuresproduced by computer modeling strategies, and (4)a group of programs using RDCs in combination withexisting structures of complex systems (ligands,protein domains, nucleic acid segments, or subunitsof macromolecular complexes) to deduce orientationalrelationships of the components. Each class has itsown advantages and special areas of application.
5.1. Additional Constraints in StructureDetermination and Refinement
The first class of RDC implementation has mostcommonly been built on programs initially introducedfor the analysis of NOE data. Programs such asXPLOR/CNS,141,142 DYANA,143,144 and AMBER145,146
are good examples of cases in which error or targetfunctions have been added that minimize when RDCdata are satisfied. These programs work by searchingfor a global minimum in a total energy function bysimulated annealing, Monte Carlo, or other ap-proaches. These approaches work well when sub-stantial amounts of NOE data are included to mini-mize problems with the multiple minima inherent inRDC error functions. In cases in which RDC data aremore numerous, search efficiencies can also be im-proved by reducing weighting functions for RDCsduring early stages of the search to allow NOE datato dominate initial folds. The optimum protocols mayvary with the number and distribution of constraintsas well as the size of the system studied.16 When RDCdata are added to structure determination protocolsin this way, substantial improvements in the qualityof NMR structures can be realized. An interestingobservation is that when a corresponding high reso-lution X-ray structure exists, the NMR structures notonly become better defined (according to rmsds ofbackbone atoms) but also converge toward the X-raystructure.147
One interesting application has been in the com-parison of protein structures in the presence andabsence of bound ligands.85 Galectin-3 is a carbohy-drate binding protein (lectin) with an affinity forlactose or N-acetyl-lactosamine. Crystal structuresexist for the protein with ligand bound but not forthe apoprotein. A set of NOE data existed, and a setof 1H-15N RDC data was acquired for the protein inthe absence of ligand. Starting from the crystalstructure, a ligand-free structure was generatedusing a target function and simulated annealingprotocol. The two structures, as compared in Figure7, present an interesting picture of binding sitedynamics and the possible exposure of peptide seg-ments involved in apoptotic signaling in the presenceof ligand.
RDC constraints can be combined with a varietyof constraints other than NOEs using similar pseu-doenergy/target function approaches. As discussedabove, CSA offsets for resonances from highly aniso-tropic groups such as carbonyl carbons display ge-ometry dependence similar to RDCs; in fact, theseoffsets can be written in terms of a pair of RDC-likeconstraints. A procedure for adding these constraintshas been added to the program CNS.16 A noveladdition to DYANA combines RDC data not only withNOE data but also with data from pseudocontactshifts and electron spin-induced relaxation of nuclearsites in systems substituted with paramagnetic metalions.144 Paramagnetic relaxation provides distanceconstraints between a paramagnetic (metal, spinlabel) center and the nuclear site in much the sameway that NOEs provide distance constraints betweenpairs of nuclear sites, but the distances have a longerrange. Pseudocontact shifts display a distance (1/r3)and an angular dependence similar to RDCs, but nowthe vector that defines that distance is that betweenthe paramagnetic center and the single nuclear siteobserved, rather than a vector connecting a pair ofspin 1/2 nuclei.55 These new additions are particularlyintriguing because of the recent introduction ofparamagnetic tags for alignment purposes and themove to higher fields where measurement of theseadditions will become easier (see section on align-ment media).57
5.2. Direct Structure DeterminationThe second class of programs has usually been
based on a procedure that calculates the best ordertensor solution for a subset of dipolar couplingsbelonging to a small peptide fragment of assumedgeometry. An early program solved a set of equationsanalogous to eq 2 in section 2.1 to obtain a best ordertensor solution using singular value decomposition.148
The resulting order tensor elements were assembledinto a matrix, and the matrix was diagonalized toyield principal order tensor values and a definitionof the principal axis directions in the molecularfragment frame. Various fragment geometries can
Figure 7. Structure of galectin-3 in the absence (green)and presence (magenta) of ligand. The structure in theabsence was refined with 1H-15N RDCs and NOEs85
beginning with the ligand-bound X-ray structure, 1A3K.
Structure Determination of Biomolecules Chemical Reviews, 2004, Vol. 104, No. 8 3533

also be tested by back-calculating RDCs from a bestorder tensor solution and comparing them withexperiment to give a score used in selecting anappropriate model.149 In an early application,70 thephi and psi angles connecting a pair of peptide planeswere systematically varied using a comparison to aset of six couplings per peptide plane (nine uniqueto a pair of planes) to select the best geometry. Thecouplings included HNi-Ni, C′i-1-Ni, C′i-1-HNi, CRi-HRi, HNi-HRi, and HNi-HRi-1 couplings. Additionalpeptides were then added along with additionalcouplings (3-6) to extend the fragments to lengthsof 6-16 residues. In the case of the small proteinrubredoxin (54 residues) geometries for six frag-ments, each separated by a single proline, wereidentified. These fragments were then combinedusing the fact that fragments must be oriented sothat order frames as viewed from each fragment mustcoincide. Several of the fragments with their align-ment frames are shown in Figure 8. In most cases,bonding restrictions imposed by the single connectingproline provided unique translational positioning.RDC data from a second medium helped resolve anyremaining 4-fold orientational degeneracy of theindividual order frames.59 The procedure led to abackbone structure that agreed within 1.8 Å with aclosely homologous X-ray structure.70 A unique aspectof the procedure is that assignment of resonances toa specific point in a protein sequence is not aprerequisite to structure determination. Sets of cou-plings involving particular resonances do need to be
connected, but this can be accomplished withoutmany of the experiments normally required forsequential assignment.
This general procedure has been systematized andimproved to allow a recent application to a largerprotein as a part of a structural genomics project.109
One of the tenants of structural genomics initiativesis that determination of structures for proteins inpoorly populated fold families will allow computa-tional prediction of structures for proteins withhomologous sequences.150 Since sequence identity ofhomologues may be as low as 30%, side-chain geom-etry is of little relevance. This raises interest in directdetermination of backbone structures, somethingthat RDC-based approaches can accomplish whenNOE-based approaches cannot because of the rarityof backbone-to-backbone NOEs in most protein struc-tures.
Similar order tensor-based strategies can be adoptedwhen taking fragments from libraries of existingstructures. Delaglio and Bax151 introduced a proce-dure that uses a reduced set of structures from theProtein Data Bank to provide this library. Fragments5-7 residues in length, having a set of four backbonecouplings per residue (HNi-Ni, HRi-CRi, Ni-C′i-1,HNi-C′i-1), are threaded through members of thereduced set incrementing the alignment one residueat a time. A best alignment tensor is calculated, andan rmsd between experimental and back-calculatedcouplings is used to evaluate the alignment. Theprocedure has been tested on ubiquitin with signifi-cant success. In this case, complete sequential as-signments were done ahead of structural analysisand fragment length was selected simply based onstructural precision and database limitations. Forshorter fragments, this database approach appearsto provide an adequate sampling of conformationalspace but at some compromise in precision. Forlonger fragments precision improves, but there areconcerns about adequate sampling and bias of struc-tures toward conformations that are already wellrepresented in the database.
Levy and Andrec have introduced a similar proto-col.152,153 Their procedure differs in that it employs afilter that requires overlapping segments to select thesame structural form. The data set is again quiteextensive with a set of RDCs similar to that used byDelaglio and Bax. They too find optimum perfor-mance with segments of approximately seven resi-dues. Performance is improved with their procedure;however, there are more stringent requirements forextensive sequential assignment.
A procedure that appears successful with fewerdata is built on methods developed for homology andab initio protein modeling.154 These methods rely notonly on local structural characteristics but alsoemploy pairwise contact potentials to select properfolds. A structural template selected based on se-quence homology is also used. Without RDCs, com-petitions such as the CASP program show that onemight expect a structure accurate to 3.5 Å when atemplate with 30% sequence identity exists. Whenjust HN-N RDCs are added, accuracy improvesdramatically. A related method called ROSETTA
Figure 8. Protein backbone structure determination fromRDCs.70 (A) The local structure and global orientation wasdetermined from RDC data for six fragments of the smallprotein, rubredoxin. (B) Translation and connection of thefragments resulted in a complete structure, 1RWD.
3534 Chemical Reviews, 2004, Vol. 104, No. 8 Prestegard et al.

employs many of the pairwise potentials of threadingalgorithms but works by doing a Monte Carlo searchof a fragment library rather than starting from ahomology template.155 This obviously broadens ap-plicability by eliminating the need for a homologytemplate. Test cases using RDC data on proteinsfrom 52 to 128 residues gave structures with back-bone atom rmsds ranging from 1 to 6 Å fromstructures determined by X-ray or NOE methods. Inmost cases, this represents a very significant im-provement over modeling without experimental con-straints. Again, these methods require extensivesequential assignment.
5.3. A Tool for Structure Validation or HomologySearches
The above categories clearly merge with our thirdclass of programs, those that simply screen forsimilarity to proteins with known structure. Thistype of application was in fact among the earliestapplication of RDCs to protein structure determina-tion.156 Assigned RDCs are sequentially placed alonga trial structure, a search for a proper alignmenttensor is conducted, and an rmsd between back-calculated and experimental couplings is determined.Rmsd values approaching expected experimentalerror provide a positive hit. Griesinger et al. haveexpanded on this protocol by introducing a moreefficient algorithm in a program called DipoCoup.61
They have also incorporated modules that acceptadditional pseudocontact shift information whenparamagnetic proteins are examined.
Recently Valafar et al. have demonstrated that itmay be possible to omit assignment to specific sitesand rely on pattern matching to identify proteinfolds.157 An illustration is given in Figure 9 in whicha comparison of the distribution of predicted dipolarcouplings for a pair of structurally related proteinsand a pair of structurally unrelated proteins isshown. In both cases, the width of the distributionis based on order predicted for a bicelle medium usingthe program PALES.158 The structurally related pair(Figure 9A) are domains from glycosyltransferasesthat have less than a 15% sequence identity over 180residues but have a 2.5 Å backbone rmsd.159 One canclearly see the similarity in distribution of dipolarcoupling values. The structurally unrelated pair(Figure 9B) is one of the glycosyltransferases and asimilarly sized protein, ADP ribosylating factor.There is clearly a dramatic difference in pattern.Similarity in distributions can also be detected whenthe alignment tensor cannot be independently pre-dicted and can be adjusted for a best fit to adistribution. However, recognizing similarity anddissimilarity in these cases depends on small devia-tions of experimental distributions from the powderpattern shapes. These distributions are calculatedfrom a random distribution of vector directions for alarge number of vectors using the best fit alignmenttensor. The procedure in this latter case will breakdown for larger proteins and may not be able todistinguish certain symmetrically related structures.Nevertheless, application to a variety of folds in the100-amino acid range appears to be quite feasible.
The identification of a structural homologue canbe a stepping stone to further structure refinementusing some of the methods described above. However,methods of this type are also advantageous in struc-tural genomics applications. Emphasis here is on thestructure determination of proteins with novel folds.New proteins are typically screened based on theextent of primary sequence identity to eliminatetargets with redundant folds. However, even withvery low levels of sequence identity, a significantfraction of structures determined turn out to belongto well-populated fold families. An efficient experi-mental method for identifying proteins belonging towell-populated fold families will clearly avoid themore time-consuming task of structure determinationof proteins with less novel folds. All of the abovepattern recognition procedures, whether requiringassignments or not, are quite efficient and usuallyneed only HN-N couplings from 15N-labeled proteins.
5.4. Orientational Relationships betweenComponents
The fourth class of programs is designed to takeadvantage of existing structures to extend investiga-tions to the way biomolecular components interactand function. These are important applications andones in which use of RDCs can be particularlyadvantageous. NOEs across the interface of interact-ing pairs of proteins, protein-nucleotide complexes,or protein-ligand complexes can be sparse anddifficult to observe. Components of complex systems
Figure 9. Dipolar coupling distributions calculated for twoproteins (A) of similar structure, glycosyltransferase C-terminal domains of 1F0K and 1IIR, which overlay to 2rmsd, and (B) of dissimilar structure, glycosytransferaseC-terminal domain of 1F0K and HUR1, which are struc-turally unrelated.157 Alignment tensors were predicted withPALES.158
Structure Determination of Biomolecules Chemical Reviews, 2004, Vol. 104, No. 8 3535

may also have dynamic aspects that are difficult tocharacterize by other means. Programs designed toaddress these problems often make direct use of theorder tensors that were used to back-calculate RDCsin previous examples. As in the case of the proteinfragment assembly strategy described above, thedirection of axes of the principal order frame mustcoincide for elements of the same structure, placingrestrictions on relative orientations of components;the magnitude of the principal order elements mustalso be the same if the complex under investigationis rigid. If elements for different components are notthe same, they can, under the right circumstances,be interpreted in terms of the extent of motionbetween components.
Programs useful in analyses of the type describedabove include the ones that directly calculate ordertensors from a structure and RDCs, including theones employing singular value decomposition to finda best least-squares solution to a set of equationsrelating RDCs to order and orientation. A newprogram called REDCAT (REsidual Dipolar CouplingAnalysis Tool) based on this algorithm has recentlybecome available.160 Input is any PDB structure alongwith a list of atom pairs showing an RDC and thecorresponding RDCs. Providing adequate data exist(in principle, more than five independent couplings,in practice more than 15) a set of principal orderparameters and a set of Euler angles for transformingthe PDB file to the principal alignment frame arereturned. There are also a number of tools forassessing the quality of data. When applied to dif-ferent parts of a complex, the transformed structurescan be viewed in a common frame allowing assess-ment of probable modes of interaction. Again, withdata from media giving different molecular orienta-tions, or with the addition of a few distance con-straints, it is possible to eliminate the normal 4-folddegeneracy in relative orientations.
A program called MODULE offers some verysimilar tools.121 The program is based on a differentalgorithm for finding an order tensor solution butallows the same transformation of coordinates forpieces of a complex and provides a more extensivegraphical interface. There are also programs that arebased on rigid body orientational minimization al-gorithms.161,162 The latter may provide a convenientapproach, particularly when a variety of other datamust be integrated with a structure search.
One of the earliest applications to relative domainorientation was in the case of a two-domain fragmentfrom barley lectin.163 This application included anobservation of interdomain motion. Magnitudes oforder parameters were significantly larger for onedomain than the other. This was interpreted as atendency for one domain to preferentially interactwith the bicelle orientating medium, resulting in agreater degree of order for this domain. The otherdomain exhibits reduced order due to internal motionrelative to the first domain. An assumed simplemodel for motion led to an estimate of internalfluctuations of ( 30°. An illustration showing therelative domain orientations for this particular prob-lem is shown in Figure 10.
Some more functionally relevant studies includethose on T4 lysozyme and maltose binding proteinin which closure of domains around ligand bindingpockets has been quantitatively studied and analyzedin terms of hinge motion parameters.164,165 Otherstudies include domain orientations of homomulti-mers166 and mannose binding protein.98 Studyingdomain orientation in homomultimers has been achallenging problem when based on NOEs becauseof the single set of resonances observed and ambi-guities between intra- and intermolecular NOEs.This problem can be avoided to a certain extent inRDC studies because certain symmetry axes mustcoincide with principal frame orientation axes. Thisis the case with mannose binding protein which hasa 3-fold axis98 and in certain dimers.167 One of thelargest protein systems tackled using RDCs to con-strain domain orientations is hemoglobin.168 Here aninteresting observation was that the structure de-termined in solution with the assistance of RDCsproved to be a dynamic average between previouslyexisting crystal structures. There are also somenotable examples of determining relative domainorientations in nucleic acids and nucleic acid-proteincomplexes.45,46,169-171
Determining the bound orientation of a ligandcomplexed with a protein presents challenges thatare much the same as for protein-protein complexes.One must independently determine the preferredorientation of both the protein and the ligand. Eachis treated as a rigid body and the programs discussedabove are well-suited to this type of problem. Thesame issues related to the 4-fold degeneracy oforientation arise, and one must either use multipleorientation media or supplementary distance con-straints to remove this degeneracy. In some cases,the ligand is actually a peptide and sources of dataare identical to those discussed above, namely, avariety of peptide backbone RDCs from a labeledligand.172 For non-peptide ligands, the data sourcefor the ligand may be dominated by 1H-1H and 1H-13C RDCs. While early work employed 13C-labeled
Figure 10. Domain orientations for B and C domains ofbarley lectin. 1HN-15N dipolar couplings were used to solvefor alignment frames of each domain independently. Do-mains were then rotated until directions of frame axescoincided producing the structure depicted.163 The structuremust be viewed as an average structure as substantialinterdomain motion is detected.
3536 Chemical Reviews, 2004, Vol. 104, No. 8 Prestegard et al.

ligands,173,174 recent advances in probe sensitivity(cold probes) have made it possible to work at naturalabundance.98
There can be some added difficulties in workingtoward bound ligand geometries using RDCs. Sen-sitivity limitations in ligand-protein interactions aresometimes overcome by working in the fast exchangelimit and using an excess of ligand (10-20-fold). Inthis case, an average RDC would be observed, withRDCs from both bound and free states contributing.This would be akin to transferred NOE studies exceptthere is no inherent emphasis of bound state RDCs;induced orientation of free ligand can be quitesubstantial. The need to separately measure andremove the free state contributions can significantlyreduce accuracy of results. Work to improve thissituation continues. Particularly promising are ori-entation protocols that preferentially orient the pro-tein. This can occur when the protein is paramag-netic, either inherently or by addition of an appro-priate tag. One interesting application is peptidebinding to fragments of G-protein-containing mem-branes.172 These fragments have sufficient anisotropyin susceptibility to orient in the presence of highfields. Without the dense fragment distributionsfound in liquid crystalline media, there is minimalorientation of free ligand.
Another problem that arises frequently with boundligands is the lack of sufficient information to deter-mine both orientation and bound conformation fromRDCs alone. Determining conformation is critical forflexible ligands, both peptides and oligosaccharides.The oligosaccharide case is challenging because 1H-13C one-bond couplings at natural abundance areoften the primary source of information, and thenumber of independent pieces of information for eachsugar ring can be minimal (all beta-linked glucoseH-C vectors are nearly parallel for example).175 Inthese cases, bound conformations are best deter-mined from other sources. In some cases, conforma-tional flexibility about glycosidic linkages is suffi-ciently restricted to allow assumption of a particularbound conformation.176 In other cases, RDC data forthe determination of orientation can be combinedwith transferred NOE data on the ligand for deter-mination of bound conformation.174
Proper assembly of complexes, whether they areprotein-protein, protein-nucleic acid, or protein-ligand complexes, necessitates translational as wellas orientational constraints. There is a variety ofprocedures for identifying contact surfaces in com-plexes. These range from simple chemical shiftperturbation of resonances from proximate residuesby added components to various protection experi-ments (from paramagnetic induced relaxation, forexample) on adding a second component.177,178 Imple-menting contact constraints in combination withorientational constraints in assembling a complex canalso be challenging. Fortunately, there are softwarepackages emerging that address this issue as well.179
6. Limitations and Future DirectionsThe information available from RDC measure-
ments and anisotropies in other NMR observables is
obviously varied and quite powerful. It does, ofcourse, have limitations. Chief among these is theabsence of translational constraints in most applica-tions. We have mentioned a few contact-sensitiveexperiments in our discussion of complex assemblyabove, but the need for more quantitative sources oflong-range distance constraints is clear. One obvioussource is paramagnetic relaxation enhancement fromnatural or artificially introduced centers. Under theright circumstances, these can provide very long-range restraints (20-30 Å). Several applicationsusing relaxation enhancement from paramagneticsites, either spin labels or metal centers, have alreadybeen used to provide some complementary distanceinformation.28,180,181
Another potential limitation is the effect of internalmotion on RDC values. Most of our structural analy-sis procedures assume a rigid model for the moleculeunder study. When motion exists, without our knowl-edge, errors in structure can in principle be intro-duced. Fortunately, amplitudes of motion have to berather large before this is a major concern.9
RDCs can actually be turned into an advantage inthe study of motion in cases in which adequate dataexist to simultaneously determine structure. We donot plan to review this type of application here butsimply point to the fact that reduction in orderparameters by internal motion relates primarily toamplitudes of motion and is sensitive to motion on awide range of time scales (picoseconds to millisec-onds). Thus, RDC measurement complements spinrelaxation studies which tend to be more sensitiveto faster motions, and for slower motion, returnsinformation on a time scale more readily thanamplitudes of motion. The interested readers arereferred to recent articles by the Griesinger67 andTolman groups and their included references.66,182
7. AbbreviationsACME amplitude-constrained multiplet evalua-
tion132
AMBER force-field and package of molecular simu-lation programs145
ADP adenosine 5′-diphosphateBMRB Biomolecules Magnetic Resonance Data-
bankCASP critical assessment of techniques for pro-
tein structure predictionCHAPSO 3-(chloramidopropyl)dimethylammonio-2-
hydroxyl-1-propane sulfonateCnEm n is the number of carbons in a poly-
(ethylene)glycol headgroup and m refersto the number of repeating ethyleneoxide units
CNS crystallography and NMR system141
CPyBr cetylpyyridinium bromideCSA chemical shift anisotropyCT constant-timeCTAB cetyltrimethylammonium bromideCOSY correlation spectroscopyDNA/RNA deoxyribonucleic acid/ribonucleic acidDIOHPC 1,2-di-O-hexyl-sn-glycero-3-phosphocho-
lineDIODPC 1,2-di-O-dodecyl-sn-glycero-3-phosphocho-
lineDIPSAP double in-phase single antiphase
Structure Determination of Biomolecules Chemical Reviews, 2004, Vol. 104, No. 8 3537
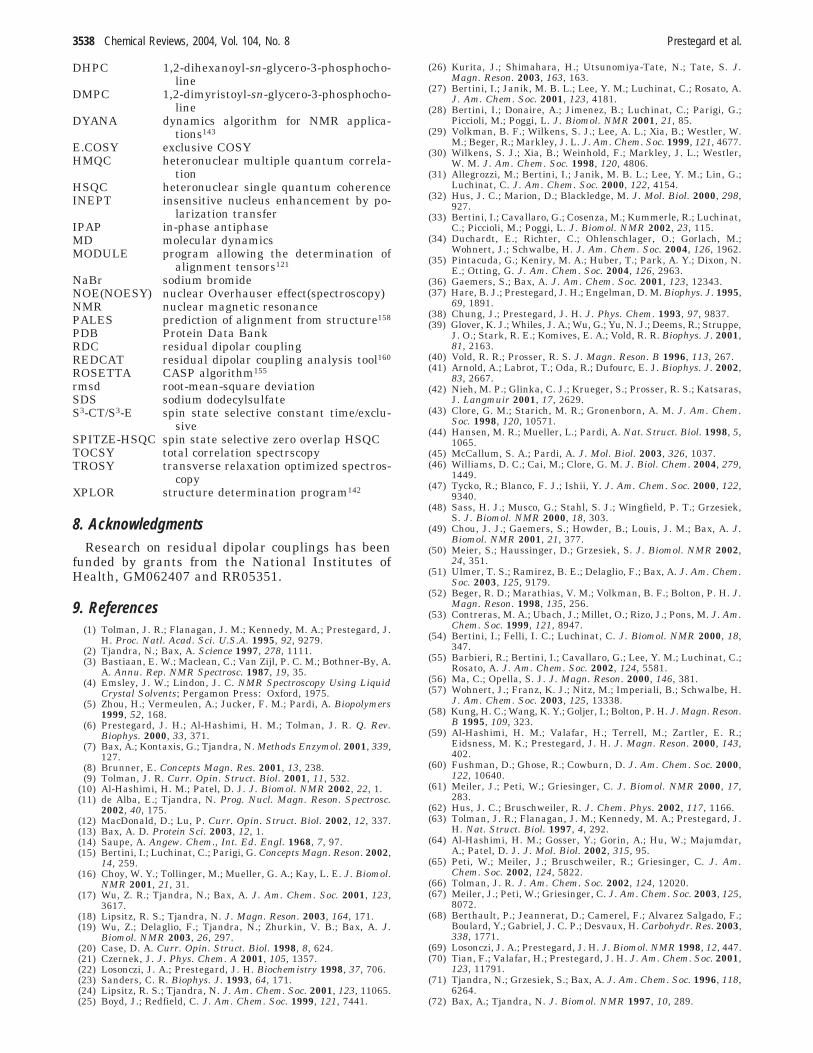
DHPC 1,2-dihexanoyl-sn-glycero-3-phosphocho-line
DMPC 1,2-dimyristoyl-sn-glycero-3-phosphocho-line
DYANA dynamics algorithm for NMR applica-tions143
E.COSY exclusive COSYHMQC heteronuclear multiple quantum correla-
tionHSQC heteronuclear single quantum coherenceINEPT insensitive nucleus enhancement by po-
larization transferIPAP in-phase antiphaseMD molecular dynamicsMODULE program allowing the determination of
alignment tensors121
NaBr sodium bromideNOE(NOESY) nuclear Overhauser effect(spectroscopy)NMR nuclear magnetic resonancePALES prediction of alignment from structure158
PDB Protein Data BankRDC residual dipolar couplingREDCAT residual dipolar coupling analysis tool160
ROSETTA CASP algorithm155
rmsd root-mean-square deviationSDS sodium dodecylsulfateS3-CT/S3-E spin state selective constant time/exclu-
siveSPITZE-HSQC spin state selective zero overlap HSQCTOCSY total correlation spectrscopyTROSY transverse relaxation optimized spectros-
copyXPLOR structure determination program142
8. AcknowledgmentsResearch on residual dipolar couplings has been
funded by grants from the National Institutes ofHealth, GM062407 and RR05351.
9. References(1) Tolman, J. R.; Flanagan, J. M.; Kennedy, M. A.; Prestegard, J.
H. Proc. Natl. Acad. Sci. U.S.A. 1995, 92, 9279.(2) Tjandra, N.; Bax, A. Science 1997, 278, 1111.(3) Bastiaan, E. W.; Maclean, C.; Van Zijl, P. C. M.; Bothner-By, A.
A. Annu. Rep. NMR Spectrosc. 1987, 19, 35.(4) Emsley, J. W.; Lindon, J. C. NMR Spectroscopy Using Liquid
Crystal Solvents; Pergamon Press: Oxford, 1975.(5) Zhou, H.; Vermeulen, A.; Jucker, F. M.; Pardi, A. Biopolymers
1999, 52, 168.(6) Prestegard, J. H.; Al-Hashimi, H. M.; Tolman, J. R. Q. Rev.
Biophys. 2000, 33, 371.(7) Bax, A.; Kontaxis, G.; Tjandra, N. Methods Enzymol. 2001, 339,
127.(8) Brunner, E. Concepts Magn. Res. 2001, 13, 238.(9) Tolman, J. R. Curr. Opin. Struct. Biol. 2001, 11, 532.
(10) Al-Hashimi, H. M.; Patel, D. J. J. Biomol. NMR 2002, 22, 1.(11) de Alba, E.; Tjandra, N. Prog. Nucl. Magn. Reson. Spectrosc.
2002, 40, 175.(12) MacDonald, D.; Lu, P. Curr. Opin. Struct. Biol. 2002, 12, 337.(13) Bax, A. D. Protein Sci. 2003, 12, 1.(14) Saupe, A. Angew. Chem., Int. Ed. Engl. 1968, 7, 97.(15) Bertini, I.; Luchinat, C.; Parigi, G. Concepts Magn. Reson. 2002,
14, 259.(16) Choy, W. Y.; Tollinger, M.; Mueller, G. A.; Kay, L. E. J. Biomol.
NMR 2001, 21, 31.(17) Wu, Z. R.; Tjandra, N.; Bax, A. J. Am. Chem. Soc. 2001, 123,
3617.(18) Lipsitz, R. S.; Tjandra, N. J. Magn. Reson. 2003, 164, 171.(19) Wu, Z.; Delaglio, F.; Tjandra, N.; Zhurkin, V. B.; Bax, A. J.
Biomol. NMR 2003, 26, 297.(20) Case, D. A. Curr. Opin. Struct. Biol. 1998, 8, 624.(21) Czernek, J. J. Phys. Chem. A 2001, 105, 1357.(22) Losonczi, J. A.; Prestegard, J. H. Biochemistry 1998, 37, 706.(23) Sanders, C. R. Biophys. J. 1993, 64, 171.(24) Lipsitz, R. S.; Tjandra, N. J. Am. Chem. Soc. 2001, 123, 11065.(25) Boyd, J.; Redfield, C. J. Am. Chem. Soc. 1999, 121, 7441.
(26) Kurita, J.; Shimahara, H.; Utsunomiya-Tate, N.; Tate, S. J.Magn. Reson. 2003, 163, 163.
(27) Bertini, I.; Janik, M. B. L.; Lee, Y. M.; Luchinat, C.; Rosato, A.J. Am. Chem. Soc. 2001, 123, 4181.
(28) Bertini, I.; Donaire, A.; Jimenez, B.; Luchinat, C.; Parigi, G.;Piccioli, M.; Poggi, L. J. Biomol. NMR 2001, 21, 85.
(29) Volkman, B. F.; Wilkens, S. J.; Lee, A. L.; Xia, B.; Westler, W.M.; Beger, R.; Markley, J. L. J. Am. Chem. Soc. 1999, 121, 4677.
(30) Wilkens, S. J.; Xia, B.; Weinhold, F.; Markley, J. L.; Westler,W. M. J. Am. Chem. Soc. 1998, 120, 4806.
(31) Allegrozzi, M.; Bertini, I.; Janik, M. B. L.; Lee, Y. M.; Lin, G.;Luchinat, C. J. Am. Chem. Soc. 2000, 122, 4154.
(32) Hus, J. C.; Marion, D.; Blackledge, M. J. Mol. Biol. 2000, 298,927.
(33) Bertini, I.; Cavallaro, G.; Cosenza, M.; Kummerle, R.; Luchinat,C.; Piccioli, M.; Poggi, L. J. Biomol. NMR 2002, 23, 115.
(34) Duchardt, E.; Richter, C.; Ohlenschlager, O.; Gorlach, M.;Wohnert, J.; Schwalbe, H. J. Am. Chem. Soc. 2004, 126, 1962.
(35) Pintacuda, G.; Keniry, M. A.; Huber, T.; Park, A. Y.; Dixon, N.E.; Otting, G. J. Am. Chem. Soc. 2004, 126, 2963.
(36) Gaemers, S.; Bax, A. J. Am. Chem. Soc. 2001, 123, 12343.(37) Hare, B. J.; Prestegard, J. H.; Engelman, D. M. Biophys. J. 1995,
69, 1891.(38) Chung, J.; Prestegard, J. H. J. Phys. Chem. 1993, 97, 9837.(39) Glover, K. J.; Whiles, J. A.; Wu, G.; Yu, N. J.; Deems, R.; Struppe,
J. O.; Stark, R. E.; Komives, E. A.; Vold, R. R. Biophys. J. 2001,81, 2163.
(40) Vold, R. R.; Prosser, R. S. J. Magn. Reson. B 1996, 113, 267.(41) Arnold, A.; Labrot, T.; Oda, R.; Dufourc, E. J. Biophys. J. 2002,
83, 2667.(42) Nieh, M. P.; Glinka, C. J.; Krueger, S.; Prosser, R. S.; Katsaras,
J. Langmuir 2001, 17, 2629.(43) Clore, G. M.; Starich, M. R.; Gronenborn, A. M. J. Am. Chem.
Soc. 1998, 120, 10571.(44) Hansen, M. R.; Mueller, L.; Pardi, A. Nat. Struct. Biol. 1998, 5,
1065.(45) McCallum, S. A.; Pardi, A. J. Mol. Biol. 2003, 326, 1037.(46) Williams, D. C.; Cai, M.; Clore, G. M. J. Biol. Chem. 2004, 279,
1449.(47) Tycko, R.; Blanco, F. J.; Ishii, Y. J. Am. Chem. Soc. 2000, 122,
9340.(48) Sass, H. J.; Musco, G.; Stahl, S. J.; Wingfield, P. T.; Grzesiek,
S. J. Biomol. NMR 2000, 18, 303.(49) Chou, J. J.; Gaemers, S.; Howder, B.; Louis, J. M.; Bax, A. J.
Biomol. NMR 2001, 21, 377.(50) Meier, S.; Haussinger, D.; Grzesiek, S. J. Biomol. NMR 2002,
24, 351.(51) Ulmer, T. S.; Ramirez, B. E.; Delaglio, F.; Bax, A. J. Am. Chem.
Soc. 2003, 125, 9179.(52) Beger, R. D.; Marathias, V. M.; Volkman, B. F.; Bolton, P. H. J.
Magn. Reson. 1998, 135, 256.(53) Contreras, M. A.; Ubach, J.; Millet, O.; Rizo, J.; Pons, M. J. Am.
Chem. Soc. 1999, 121, 8947.(54) Bertini, I.; Felli, I. C.; Luchinat, C. J. Biomol. NMR 2000, 18,
347.(55) Barbieri, R.; Bertini, I.; Cavallaro, G.; Lee, Y. M.; Luchinat, C.;
Rosato, A. J. Am. Chem. Soc. 2002, 124, 5581.(56) Ma, C.; Opella, S. J. J. Magn. Reson. 2000, 146, 381.(57) Wohnert, J.; Franz, K. J.; Nitz, M.; Imperiali, B.; Schwalbe, H.
J. Am. Chem. Soc. 2003, 125, 13338.(58) Kung, H. C.; Wang, K. Y.; Goljer, I.; Bolton, P. H. J. Magn. Reson.
B 1995, 109, 323.(59) Al-Hashimi, H. M.; Valafar, H.; Terrell, M.; Zartler, E. R.;
Eidsness, M. K.; Prestegard, J. H. J. Magn. Reson. 2000, 143,402.
(60) Fushman, D.; Ghose, R.; Cowburn, D. J. Am. Chem. Soc. 2000,122, 10640.
(61) Meiler, J.; Peti, W.; Griesinger, C. J. Biomol. NMR 2000, 17,283.
(62) Hus, J. C.; Bruschweiler, R. J. Chem. Phys. 2002, 117, 1166.(63) Tolman, J. R.; Flanagan, J. M.; Kennedy, M. A.; Prestegard, J.
H. Nat. Struct. Biol. 1997, 4, 292.(64) Al-Hashimi, H. M.; Gosser, Y.; Gorin, A.; Hu, W.; Majumdar,
A.; Patel, D. J. J. Mol. Biol. 2002, 315, 95.(65) Peti, W.; Meiler, J.; Bruschweiler, R.; Griesinger, C. J. Am.
Chem. Soc. 2002, 124, 5822.(66) Tolman, J. R. J. Am. Chem. Soc. 2002, 124, 12020.(67) Meiler, J.; Peti, W.; Griesinger, C. J. Am. Chem. Soc. 2003, 125,
8072.(68) Berthault, P.; Jeannerat, D.; Camerel, F.; Alvarez Salgado, F.;
Boulard, Y.; Gabriel, J. C. P.; Desvaux, H. Carbohydr. Res. 2003,338, 1771.
(69) Losonczi, J. A.; Prestegard, J. H. J. Biomol. NMR 1998, 12, 447.(70) Tian, F.; Valafar, H.; Prestegard, J. H. J. Am. Chem. Soc. 2001,
123, 11791.(71) Tjandra, N.; Grzesiek, S.; Bax, A. J. Am. Chem. Soc. 1996, 118,
6264.(72) Bax, A.; Tjandra, N. J. Biomol. NMR 1997, 10, 289.
3538 Chemical Reviews, 2004, Vol. 104, No. 8 Prestegard et al.

(73) Tjandra, N.; Omichinski, J. G.; Gronenborn, A. M.; Clore, G. M.;Bax, A. Nat. Struct. Biol. 1997, 4, 732.
(74) Prestegard, J. H.; Tolman, J. R.; Al-Hashimi, H. M.; Andrec, M.In Biological Magnetic Resonance: Structure Computation andDynamics in Protein NMR; Kluwer Academic/Plenum Publish-ers: New York, 1999; Vol. 17.
(75) Mollova, E. T.; Pardi, A. Curr. Opin. Struct. Biol. 2000, 10, 298.(76) Martin Pastor, M.; Bush, C. A. In NMR Spectroscopy of Glyco-
Conjugates; Jimenez Barbero and Peters, Eds.; Wiley-VCH:Weinheim, 2002.
(77) Prestegard, J. H.; Glushka, J. In NMR Spectroscopy of Glyco-Conjugates; Jimenez-Barbero and Peters, Eds.; Wiley-VCH:Weinheim, 2002.
(78) Vander Kooi, C. W.; Kupce, E.; Zuiderweg, E. R. P.; Pellecchia,M. J. Biomol. NMR 1999, 15, 335.
(79) Feher, K.; Berger, S.; Kover, K. E. J. Magn. Reson. 2003, 163,340.
(80) Pham, T. N.; Liptaj, T.; Barlow, P. N.; Uhrin, D. Magn. Reson.Chem. 2002, 40, 729.
(81) Tolman, J. R.; Prestegard, J. H. J. Magn. Reson. B 1996, 112,245.
(82) Tjandra, N.; Bax, A. J. Magn. Reson. 1997, 124, 512.(83) Pham, T. N.; Liptaj, T.; Bromek, K.; Uhrin, D. J. Magn. Reson.
2002, 157, 200.(84) Kontaxis, G.; Clore, G. M.; Bax, A. J. Magn. Reson. 2000, 143, 184.(85) Umemoto, K.; Leffler, H.; Venot, A.; Valafar, H.; Prestegard, J.
H. Biochemistry 2003, 42, 3688.(86) Ottiger, M.; Delaglio, F.; Bax, A. J. Magn. Reson. 1998, 131, 373.(87) Ding, K.; Gronenborn, A. M. J. Magn. Reson. 2003, 163, 208.(88) Giesen, A. W.; Bae, L. C.; Barrett, C. L.; Chyba, J. A.; Chayk-
ovsky, M. M.; Cheng, M. C.; Murray, J. H.; Oliver, E. J.; Sullivan,S. M.; Brown, J. M.; Dahlquist, F. W.; Homans, S. W. J. Biomol.NMR 2001, 19, 255.
(89) Ishii, Y.; Markus, M. A.; Tycko, R. J. Biomol. NMR 2001, 21,141.
(90) Vallurupalli, P.; Moor, P. B. J. Biomol. NMR 2002, 24, 63.(91) Lerche, M. H.; Meissner, A.; Poulsen, F. M.; Sorensen, O. W. J.
Magn. Reson. 1999, 140, 259.(92) Srensen, M. D.; Meissner, A.; Srensen, O. W. J. Magn. Reson.
1999, 137, 237.(93) Cordier, F.; Dingley, A. J.; Grzesiek, S. J. Biomol. NMR 1999,
13, 175.(94) Brutscher, B. J. Magn. Reson. 2001, 151, 332.(95) Luy, B.; Marino, J. P. J. Magn. Reson. 2003, 163, 92.(96) Hitchens, T. K.; McCallum, S. A.; Rule, G. S. J. Magn. Reson.
1999, 140, 281.(97) Pervushin, K.; Riek, R.; Wider, G.; Wuthrich, K. Proc. Natl. Acad.
Sci. U.S.A. 1997, 94, 12366.(98) Jain, N. U.; Noble, S.; Prestegard, J. H. J. Biomol. NMR 2003,
328, 451.(99) Tugarinov, V.; Kay, L. E. J. Mol. Biol. 2003, 327, 1121.
(100) Wang, Y. X.; Marquardt, J. L.; Wingfield, P.; Stahl, S. J.; Lee-Huang, S.; Torchia, D.; Bax, A. J. Am. Chem. Soc. 1998, 120,7385.
(101) Griesinger, C.; Meiler, J.; Peti, W. In Protein NMR for theMillennium; Rama Krishna, N., Berliner, L. J., Eds.; KluwerAcademic/Plenum Publishers: New York, 2003; Vol. 20.
(102) Yang, D.; Venters, R. A.; Mueller, G. A.; Choy, W. Y.; Kay, L. E.J. Biomol. NMR 1999, 14, 333.
(103) Griesinger, C.; Srensen, O. W.; Ernst, R. R. J. Chem. Phys. 1986,85, 6837.
(104) Bodenhausen, G.; Ernst, R. R. J. Magn. Reson. 1981, 45, 367.(105) Mueller, G. A.; Choy, W. Y.; Yang, D.; Forman-Kay, J. D.;
Venters, R. A.; Kay, L. E. J. Mol. Biol. 2000, 300, 197.(106) Adams, M. W. W.; Dailey, H. A.; Delucas, L. J.; Luo, M.;
Prestegard, J. H.; Rose, J. P.; Wang, B. C. Acc. Chem. Res. 2003,36, 191.
(107) Zweckstetter, M.; Bax, A. J. Am. Chem. Soc. 2001, 123, 9490.(108) The present approach was developed on a 15N-only labeled
rubredoxin, a small 54-amino acid protein. A similar approach,based on the recording of an IPAP-(HA)CANH experiment, wasdeveloped independently by Zweckstetter and Bax.107
(109) Mayer, K. L., Valafar, H, Leblond, P. and Prestegard, J. H. J.Struct. Funct. Genomics 2004, submitted.
(110) Delaglio, F.; Grzesiek, S.; Vuister, G. W.; Zhu, G.; Pfeifer, J.;Bax, A. J. Biomol. NMR 1995, 6, 277.
(111) Bersch, B.; Rossy, E.; Coves, J.; Brutscher, B. J. Biomol. NMR2003, 27, 57.
(112) Zidek, L.; Wu, H.; Feigon, J.; Sklenar, V. J. Biomol. NMR 2001,21, 153.
(113) O’Neil-Cabello, E.; Bryce, D. L.; Nikonowicz, E. P.; Bax, A. J.Am. Chem. Soc. 2004, 126, 66.
(114) Mittermaier, A.; Kay, L. E. J. Am. Chem. Soc. 2001, 123, 6892.(115) Ottiger, M.; Delaglio, F.; Marquardt, J. L.; Tjandra, N.; Bax, A.
J. Magn. Reson. 1998, 134, 365.(116) Kontaxis, G.; Bax, A. J. Biomol. NMR 2001, 20, 77.(117) Chou, J. J.; Bax, A. J. Am. Chem. Soc. 2001, 123, 3844.(118) Carlomagno, T.; Peti, W.; Griesinger, C. J. Biomol. NMR 2000,
17, 99.
(119) Kaikkonen, A.; Otting, G. J. Am. Chem. Soc. 2001, 123, 1770.(120) Sibille, N.; Bersch, B.; Covs, J.; Blackledge, M.; Brutscher, B. J.
Am. Chem. Soc. 2002, 124, 14616.(121) Dosset, P.; Hus, J. C.; Marion, D.; Blackledge, M. J. Biomol.
NMR 2001, 20, 223.(122) Mittermaier, A.; Kay, L. E. J. Am. Chem. Soc. 1999, 121, 10608.(123) Vogeli, B.; Kovacs, H.; Pervushin, K. J. Am. Chem. Soc. 2004,
126, 2414.(124) Hansen, M. R.; Rance, M.; Pardi, A. J. Am. Chem. Soc. 1998,
120, 11210.(125) Tjandra, N.; Marquardt, J.; Clore, G. M. J. Magn. Reson. 2000,
142, 393.(126) Wu, Z.; Bax, A. J. Am. Chem. Soc. 2002, 124, 9672.(127) Meier, S.; Haussinger, D.; Jensen, P.; Rogowski, M.; Grzesiek,
S. J. Am. Chem. Soc. 2003, 125, 44.(128) Boisbouvier, J.; Delaglio, F.; Bax, A. Proc. Natl. Acad. Sci. U.S.A.
2003, 100, 11333.(129) Tian, F.; Al-Hashimi, H. M.; Craighead, J. L.; Prestegard, J. H.
J. Am. Chem. Soc. 2001, 123, 485.(130) Martin Pastor, M.; Bush, C. A. J. Biomol. NMR 2001, 19, 125.(131) Bolon, P. J.; Prestegard, J. H. J. Am. Chem. Soc. 1998, 120, 9366.(132) Delaglio, F.; Wu, Z.; Bax, A. J. Magn. Reson. 2001, 149, 276.(133) Tian, F.; Bolon, P. J.; Prestegard, J. H. J. Am. Chem. Soc. 1999,
121, 7712.(134) Cai, M.; Wang, H.; Olejniczak, E. T.; Meadows, R. P.; Gunasek-
era, A. H.; Xu, N.; Fesik, S. W. J. Magn. Reson. 1999, 139, 451.(135) Permi, P.; Kilpelainen, I.; Heikkinen, S. Magn. Reson. Chem.
1999, 37, 821.(136) Lohr, F.; Schmidt, J. M.; Rterjans, H. J. Am. Chem. Soc. 1999,
121, 11821.(137) References included in ref 136.(138) Otting, G.; Ruckert, M.; Levitt, M. H.; Moshref, A. J. Biomol.
NMR 2000, 16, 343.(139) Peti, W.; Griesinger, C. J. Am. Chem. Soc. 2000, 122, 3975.(140) Pellecchia, M.; Vander Kooi, C. W.; Keliikuli, K.; Zuiderweg, E.
R. P. J. Magn. Reson. 2000, 143, 435.(141) Brunger, A. T.; Adams, P. D.; Clore, G. M.; Delano, W. L.; Gros,
P.; Grosse-Kunstleve, R. W.; Jiang, J.-S.; Kuszewski, J.; Nilges,M.; Pannu, N. S.; Read, R. J.; Rice, L. M.; Simonson, T.; Warren,G. L. Acta Crystallogr. D 1998, 54, 905.
(142) Schwieters, C. D.; Kuszewski, J. J.; Tjandra, N.; Clore, G. M. J.Magn. Reson. 2003, 160, 65.
(143) Guntert, P.; Mumenthaler, C.; Wuthrich, K. J. Mol. Biol. 1997,273, 283.
(144) Banci, L.; Bertini, I.; Cremonini, M. A.; Gori-Savellini, G.;Luchinat, C.; Wuthrich, K.; Guntert, P. J. Biomol. NMR 1998,12, 553.
(145) Pearlman, D. A.; Case, D. A.; Caldwell, J. W.; Ross, W. R.;Cheatham, T. E.; Debolt, S.; Ferguson, D.; Seibel, G.; Kollman,P. Comput. Phys. Commun. 1995, 91, 1.
(146) Tsui, V.; Zhu, L.; Huang, T. H.; Wright, P. E.; Case, D. A. J.Biomol. NMR 2000, 16, 9.
(147) Clore, G. M.; Starich, M. R.; Bewley, C. A.; Cai, M. L.; Kuszewski,J. J. Am. Chem. Soc. 1999, 121, 6513.
(148) Losonczi, J. A.; Andrec, M.; Fischer, M. W. F.; Prestegard, J. H.J. Magn. Reson. 1999, 138, 334.
(149) Hus, J. C.; Marion, D.; Blackledge, M. J. Am. Chem. Soc. 2001,123, 1541.
(150) Prestegard, J. H.; Valafar, H.; Glushka, J.; Tian, F. Biochemistry2001, 40, 8677.
(151) Delaglio, F.; Kontaxis, G.; Bax, A. J. Am. Chem. Soc. 2000, 122,2142.
(152) Andrec, M.; Du, P.; Levy, R. M. J. Biomol. NMR 2001, 21, 335.(153) Andrec, M.; Du, P.; Levy, R. M. J. Am. Chem. Soc. 2001, 123,
1222.(154) Haliloglu, T.; Kolinski, A.; Skolnick, J. Biopolymers 2003, 70,
548.(155) Rohl, C. A.; Baker, D. J. Am. Chem. Soc. 2002, 124, 2723.(156) Annila, A.; Aitio, H.; Thulin, E.; Drakenberg, T. J. Biomol. NMR
1999, 14, 223.(157) Valafar, H.; Prestegard, J. H. Bioinformatics 2003, 19, 1549.(158) Zweckstetter, M.; Bax, A. J. Am. Chem. Soc. 2000, 122, 3791.(159) Unligil, U. M.; Rini, J. M. Curr. Opin. Struct. Biol. 2000, 10,
510.(160) Valafar, H.; Prestegard, J. H. J. Magn. Reson. 2004, 167, 228.(161) Clore, G. M.; Bewley, C. A. J. Magn. Reson. 2002, 154, 329.(162) Clore, G. M.; Schwieters, C. D. J. Am. Chem. Soc. 2003, 125,
2902.(163) Fischer, M. W. F.; Losonczi, J. A.; Weaver, J. L.; Prestegard, J.
H. Biochemistry 1999, 38, 9013.(164) Goto, N. K.; Skrynnikov, N. R.; Dahlquist, F. W.; Kay, L. E. J.
Mol. Biol. 2001, 308, 745.(165) Evenas, J.; Tugarinov, V.; Skrynnikov, N. R.; Goto, N. K.;
Muhandiram, R.; Kay, L. E. J. Mol. Biol. 2001, 309, 961.(166) Bewley, C. A.; Clore, G. M. J. Am. Chem. Soc. 2000, 122, 6009.(167) Al-Hashimi, H. M.; Tolman, J. R.; Majumdar, A.; Gorin, A.; Patel,
D. J. J. Am. Chem. Soc. 2001, 123, 5806.(168) Lukin, J. A.; Kontaxis, G.; Simplaceanu, V.; Yuan, Y.; Bax, A.;
Ho, C. Proc. Natl. Acad. Sci. U.S.A. 2003, 100, 517.
Structure Determination of Biomolecules Chemical Reviews, 2004, Vol. 104, No. 8 3539

(169) Bondensgaard, K.; Mollova, E. T.; Pardi, A. Biochemistry 2002,41, 11532.
(170) Kikuchi, J.; Iwahara, J.; Kigawa, T.; Murakami, Y.; Okazaki,T.; Yokoyama, S. J. Biomol. NMR 2002, 22, 333.
(171) Lukavsky, P. J.; Kim, I.; Otto, G. A.; Puglisi, J. D. Nat. Struct.Biol. 2003, 10, 1033.
(172) Koenig, B. W.; Kontaxis, G.; Mitchell, D. C.; Louis, J. M.; Litman,B. J.; Bax, A. J. Mol. Biol. 2002, 322, 441.
(173) Bolon, P. J.; Al-Hashimi, H. M.; Prestegard, J. H. J. Mol. Biol.1999, 293, 107.
(174) Shimizu, H.; Donohue-Rolfe, A.; Homans, S. W. J. Am. Chem.Soc. 1999, 121, 5815.
(175) Stevensson, B.; Landersjo, C.; Widmalm, G.; Maliniak, A. J. Am.Chem. Soc. 2002, 124, 5946.
(176) Azurmendi, H. F.; Martin Pastor, M.; Bush, C. A. Biopolymers2002, 63, 89.
(177) Nakanishi, T.; Miyazawa, M.; Sakakura, M.; Terasawa, H.;Takahashi, H.; Shimada, I. J. Mol. Biol. 2002, 318, 245.
(178) Niccolai, N.; Ciutti, A.; Spiga, O.; Scarselli, M.; Bernini, A.;Bracci, L.; Di Maro, D.; Dalvit, C.; Molinari, H.; Esposito, G.;Temussi, P. A. J. Biol. Chem. 2001, 276, 42455.
(179) Dominguez, C.; Boelens, R.; Bonvin, A. M. J. J. J. Am. Chem.Soc. 2003, 125, 1731.
(180) Donaldson, L. W.; Skrynnikov, N. R.; Choy, W. Y.; Muhandiram,D. R.; Sarkar, B.; Forman-Kay, J. D.; Kay, L. E. J. Am. Chem.Soc. 2001, 123, 9843.
(181) Mal, T. K.; Ikura, M.; Kay, L. E. J. Am. Chem. Soc. 2002, 124,14002.
(182) Briggman, K. B.; Tolman, J. R. J. Am. Chem. Soc. 2003, 125,10164.
(183) Ottiger, M.; Bax, A. J. Biomol. NMR 1998, 12, 361.(184) Cavagnero, S.; Dyson, H. J.; Wright, P. E. J. Biomol. NMR 1999,
13, 387.(185) Ottiger, M.; Bax, A. J. Biomol. NMR 1999, 13, 187.(186) Ruckert, M.; Otting, G. J. Am. Chem. Soc. 2000, 122, 7793.(187) Hansen, M. R.; Hanson, P.; Pardi, A. Methods Enzymol. 2000,
317, 220.(188) Zweckstetter, M.; Bax, A. J. Biomol. NMR 2001, 20, 365.(189) Koenig, B. W.; Hu, J.-S.; Ottiger, M.; Bose, S.; Hendler, R. W.;
Bax, A. J. Am. Chem. Soc. 1999, 121, 1385.(190) Sass, J.; Cordier, F.; Hoffmann, A.; Cousin, A.; Omichinski, J.
G.; Lowen, H, Grzesiek, S. J. Am. Chem. Soc. 1999, 121, 2047.(191) Chou, J. J.; Kaufman, J. D.; Stahl, S. J.; Wingfield, P. T.; Bax,
A. J. Am. Chem. Soc. 2002, 124, 2450.(192) Riley, S. A.; Giuliani, J. R.; Augustine, M. P. J. Magn. Reson.
2002, 159, 82.(193) Trempe, J. F.; Morin, F. G.; Xia, Z.; Marchessault, R. H.; Gehring,
K. J. Biomol. NMR 2002, 22, 83.(194) Barrientos, L. G.; Dolan, C.; Gronenborn, A. M. J. Biomol. NMR
2000, 16, 329.(195) Barrientos, L. G.; Gawrisch, K.; Cheng, N.; Steven, A. C.;
Gronenborn, A. M. Langmuir 2002, 18, 3773.(196) Cutting, B.; Tolman, J. R.; Nanchen, S.; Bodenhausen, G. J.
Biomol. NMR 2002, 23, 195.
(197) Tolman, J. R.; Prestegard, J. H. J. Magn. Reson. B 1996, 112,269.
(198) Andersson, P.; Nordstrand, K.; Sunnerhagen, M.; Liepinsh, E.;Turovskis, I.; Otting, G. J. Biomol. NMR 1998, 11, 445.
(199) Yang, D. W.; Tolman, J. R.; Goto, N. K.; Kay, L. E. J. Biomol.NMR 1998, 12, 325.
(200) Chou, J. J.; Delaglio, F.; Bax, A. J. Biomol. NMR 2000, 18, 101.(201) Wienk, H. L. J.; Martnez, M. M.; Yalloway, G. N.; Schmidt, J.
M.; Prez, C.; Ruterjans, H.; Lohr, F. J. Biomol. NMR 2003, 25,133.
(202) Heikkinen, S.; Permi, P.; Kilpelainen, I. J. Magn. Reson. 2001,148, 53.
(203) Permi, P.; Sorsa, T.; Kilpelainen, I.; Annila, A. J. Magn. Reson.1999, 141, 44.
(204) Ottiger, M.; Bax, A. J. Am. Chem. Soc. 1999, 121, 4690.(205) Meissner, A.; Duus, J..; Sorensen, O. W. J. Magn. Reson. 1997,
128, 92.(206) Ottiger, M.; Bax, A. J. Am. Chem. Soc. 1998, 120, 12334.(207) de Alba, E.; Suzuki, M.; Tjandra, N. J. Biomol. NMR 2001, 19,
63.(208) Permi, P. J. Biomol. NMR 2003, 27, 341.(209) Mittermaier, A.; Kay, L. E. J. Biomol. NMR 2002, 23, 35.(210) Tian, F.; Fowler, C. A.; Zartler, E. R.; Jenney, F. A.; Adams, M.
W.; Prestegard, J. H. J. Biomol. NMR 2000, 18, 23.(211) Moglich, A.; Wenzler, M.; Kramer, F.; Glaser, S. J.; Brunner, E.
J. Biomol. NMR 2002, 23, 211.(212) Permi, P.; Rosevear, P. R.; Annila, A. J. Biomol. NMR 2000, 17,
43.(213) Tjandra, N.; Tate, S.; Ono, A.; Kainosho, M.; Bax, A. J. Am.
Chem. Soc. 2000, 122, 6190.(214) Brutscher, B.; Boisbouvier, J.; Pardi, A.; Marion, D.; Simorre,
J. P. J. Am. Chem. Soc. 1998, 120, 11845.(215) Yan, J.; Corpora, T.; Pradhan, P.; Bushweller, J. H. J. Biomol.
NMR 2002, 22, 9.(216) Wu, Z.; Bax, A. J. Magn. Reson. 2001, 151, 242.(217) Wu, Z.; Tjandra, N.; Bax, A. J. Biomol. NMR 2001, 19, 367.(218) Luy, B.; Marino, J. P. J. Biomol. NMR 2001, 20, 39.(219) Luy, B.; Barchi, J. J.; Marino, J. P. J. Magn. Reson. 2001, 152,
179.(220) Wu, Z.; Ono, A.; Kainosho, M.; Bax, A. J. Biomol. NMR 2001,
19, 361.(221) Verdier, L.; Sakhaii, P.; Zweckstetter, M.; Griesinger, C. J. Magn.
Reson. 2003, 163, 353.(222) Neubauer, H.; Meiler, J.; Peti, W.; Griesinger, C. Helv. Chim.
Acta 2001, 84, 243.(223) Martin Pastor, M.; Canales-Mayordomo, A.; Jimenez-Barbero,
J. J. Biomol. NMR 2003, 26, 345.(224) Meissner, A.; Duus, J..; Sorensen, O. W. J. Biomol. NMR 1997,
10, 89.
CR030419I
3540 Chemical Reviews, 2004, Vol. 104, No. 8 Prestegard et al.