summer deficit irrigation in a hedgerow olive orchard cv
TRANSCRIPT
Introduction
Although olive (Olea europaea L.) is among themost drought resistant plant species, large productionincreases are commonly obtained when irrigation isapplied in dry climates (Moriana et al., 2003). In thecase of superintensive hedgerow olive orchards, irriga-tion is needed to hasten canopy development and earlyproduction. After that, high oil yields are required tocounteract the high capital cost of orchard establish-ment. In many olive cultivation areas, irrigation water isscarce and expensive and so deficit irrigation strategiesare required that can optimize its use. One such stra-
tegy is regulated deficit irrigation (RDI) that reducesirrigation during known drought-resistant phenolo-gical stages (Chalmers et al., 1986). The approach hasbeen utilized successfully in various fruit trees as des-cribed in reviews by Ruiz-Sánchez et al. (2010) andBehboudian et al. (2011). In olive, previous studieshave shown that controlled water deficit does not redu-ce olive yield when applied during certain summer pe-riods (Goldhamer, 1999; Alegre et al., 2002; Lavee etal., 2007). Water deficit can be applied from aroundthe end of fruit drop until the start of oil synthesis.When applied earlier, deficit irrigation can also reducevegetative growth, but at the expense of greater flower
Summer deficit irrigation in a hedgerow olive orchard cv. Arbequina: relationship between soil and tree water status,
and growth and yield components
M. Gómez-del-CampoDepartamento de Producción Vegetal: Fitotecnia. Universidad Politécnica de Madrid. Ciudad Universitaria, s/n.
28040 Madrid, Spain
Abstract
Stem water potential (Ψstem) is a useful tool for irrigation scheduling in tree crops, provided threshold values forgrowth and production are determined for each physiological period. Four irrigation treatments were evaluated in ahedgerow olive orchard. Control (CON) was irrigated using soil water sensors to maintain the root zone close to fieldcapacity. Severe water deficits were applied by irrigating at 30% CON from end of fruit drop to end of July (DI-J) orfrom end of July until beginning of oil synthesis (DI-A). Less severe water deficit was applied in July and August byirrigating at 50% CON (DI-JA). Continuous measures of soil moisture, Ψstem and shoot length were recorded in alltreatments. Fruit dry weight and oil content were measured at the end of the experimental period and at harvest. Relativeextractable soil water to 0.8 m depth (REW) and Ψstem were highly correlated and influenced by irrigation treatment.Shoot growth, fruit characteristics and oil production were correlated to Ψstem. Shoot growth was reduced by 50%relative to CON by irrigating at Ψstem of –1.3 MPa. Fruit dry matter and oil content (g fruit–1) were linearly reduced asmean summer Ψstem decreased. Oil production was highly related with Ψstem in August but not in July. Water can besaved in July by irrigating at Ψstem of –2.9 MPa but Ψstem should be maintained higher than –2.0 MPa in August toprevent decrease of oil production.
Additional key words: oil production; Olea europaea L.; stem water potential; threshold values for irrigation ma-nagement; vegetative and fruit growth.
* Corresponding author: [email protected]: 26-07-12. Accepted: 23-04-13.
Abbreviations used: CON (control); DI-A (deficit irrigation from the end July until the beginning of oil synthesis at the end ofAugust); DI-J (deficit irrigation from the end of fruit drop to the end July); DI-JA (deficit irrigation in July and August); ETo(reference evapotranspiration); GDD (growing degree days); RDI (regulated deficit irrigation); REW (relative extractable wa-ter);Ψ (water potential); Ψleaf (leaf water potential); Ψpd (pre-dawn water potential); Ψstem (stem water potential); θ (soil watercontent).
Instituto Nacional de Investigación y Tecnología Agraria y Alimentaria (INIA) Spanish Journal of Agricultural Research 2013 11(2), 547-557 Available online at www.inia.es/sjar ISSN: 1695-971-Xhttp://dx.doi.org/10.5424/sjar/2013112-3360 eISSN: 2171-9292
and fruit drop, because both processes occur together.When applied during oil synthesis, oil production willbe reduced (Tognetti et al., 2006).
Successful application of RDI requires maintenanceof plant water status above a stress threshold (Jones,2004). This can be achieved with indicators of soil orplant water status. It is, however, difficult to establishf ixed threshold soil moisture values for irrigationscheduling as many factors are involved-soil charac-teristics (mainly texture, structure and depth), sensorlocation relative to emitters in localized irrigation,measurement method and calibration, root develop-ment, plant hydraulic resistance and evaporativedemand (Sadras & Milroy, 1996). Consequently, uni-versal values cannot be obtained and threshold valuesof soil water content should be established for eachspecific location. By contrast, tree water status thatresponds to the interaction of soil moisture availability,atmospheric evaporative demand and canopy conduc-tance may best provide thresholds for irrigation sche-duling (Naor, 2006).
Plant physiological processes are dependent on cellturgor potential (Hsiao et al., 1976) but since this para-meter is not easily measured, plant water potential (Ψ),readily measured with a pressure chamber (Scholanderet al., 1965), is widely used in research, and increa-singly in commercial practice for measuring plantwater status. Water potential varies diurnally, espe-cially in leaves (Ψleaf) which are at the end of the inter-nal flow path of transpiration, and is usually highestat pre-dawn (Ψpd) when it is most highly correlatedwith soil water content in the root zone. Water potentialof covered (non-transpiring) leaves is less variablediurnally and is taken to be closer to that in the xylemof the stem (Ψstem) (Begg & Turner, 1970). Studies inorchard trees have established that differences in Ψstem
between irrigation treatments were greater than diffe-rences in Ψleaf, and these differences were better corre-lated to soil water availability (Garnier & Berger, 1985;McCutchan & Shackle, 1992; Naor et al., 1995), sto-matal conductance (McCutchan & Shackel, 1992; Naoret al., 1995), shoot growth (Shackel et al., 1997), fruitsize (Naor et al., 1995; Shackel et al., 1997) and yield(Naor et al., 1995; Naor, 2006).
In a previous paper, the crop and oil-yield data aswell as reproductive components of this experimentwere reported (Gómez-del-Campo, 2013). The objec-tives of the present study are to analyze interactions ofsoil- and tree-water status with components of fruityield and shoot growth of trees in a superintensive
hedgerow olive orchards (4 × 2 m) subjected to RDIstrategies during summer and to establish thresholdvalues of Ψstem.
Material and methods
Experimental orchard
The experiment was conducted in a 45 ha commer-cial orchard planted in 1997 with cv. Arbequina inPuebla de Montalbán, Toledo, Spain (39° 48’ N; 04°27’ W; 516 m asl). The area is characterized by lowrainfall (average annual of 395 mm), high evaporativedemand (average annual ETo of 1,180 mm), and a longfrost-prone period (November to March). Soil is clayloam (Haploxeralf typic) with an effective rootingdepth of 0.60 m comprised of three layers of 0.20 meach. The texture of the three horizons in sequence wasclay loam, clay loam and sandy-clay loam with stonesoccupying 9, 9 and 12% of horizon volumes, respecti-vely. Tree spacing was 4 × 2 m (1,250 trees ha–1) withrows oriented 20° N of EW. At the beginning of theexperiment, hedgerows were 2.3 m high and 1.1 m wide.Weeds were controlled using a non-residual herbicide,and fertilizer was applied according to leaf analysescarried out in July each year. Tree shape (3 m high and1 m width) was controlled by pruning.
Irrigation treatments
Four irrigation treatments were maintained duringthe 2007, 2008 and 2009 seasons: control (CON), de-ficit irrigation from the end of fruit drop to the end July(DI-J), deficit irrigation from the end July until thebeginning of oil synthesis at the end of August (DI-A)and deficit irrigation in July and August (DI-JA). De-ficit irrigation treatments were irrigated as the controlexcept during the specified periods when 30% of CONirrigation levels were applied to DI-J and DI-A and50% to DI-JA. Amounts of irrigation water applied diffe-red from year to year according to climatic conditions.Each treatment was replicated four times in a completerandomized block design where each replicate compri-sed 36 trees (12 trees in three adjacent rows). The 10central trees in the centre row of each replication wereused for measurement. Three of these trees were selec-ted for harvest. The irrigation system consisted of asingle line with drip emitters of 3 L h–1 spaced 0.50 m
548 M. Gómez-del-Campo / Span J Agric Res (2013) 11(2), 547-557

apart. Further details of irrigation treatments and climaticconditions were reported by Gomez-del-Campo (2013).
Irrigation scheduling
CON trees were irrigated according to continuousreadings of six Watermark™ sensors and one soil tem-perature sensor connected to a data logger (Irrometer,CA, USA). The standard manufacturer calibration wasused to convert soil electrical conductivity measuredby the sensors into soil matric water potential. Sensorswere placed in pairs at 0.3 m depth and 0.3 m fromemitters adjacent to the trunks of three representativetrees. Irrigations of 6 h duration were applied fromspring until 15 August when sensors indicated a meansoil water potential of –0.03 MPa. Thereafter, thresholdpotential for irrigation was lowered to –0.06 MPa untilthe end of the irrigation season in order to harden thetrees for autumn frost. Detailed measurements at twosites revealed that irrigation of 6 h duration wetted thesoil to 0.6 m depth, and therefore to the potential effec-tive rooting depth without excessive drainage measu-red with a capacitance probe at 0.70 m.
Soil and plant water status
Soil water content (θ, m3 m–3) was measured hourlyfrom 21 March to harvest with four sensors, three atroot depth (0.10, 0.20 and 0.40 m) and one at drainagedepth (0.70 m) using a capacitance probe (Enviroscan,Sentek Pty. Ltd, Australia). Two access tubes of 1.0 mlength were installed in each treatment in the wettedvolume at a distance of 0.30 m from a dripper and anolive trunk. At each measurement, mean soil watercontent to 0.8 cm depth was calculated considering thespacing between sensors. Relative extractable wa-ter (REW) was calculated by the equation REW =(θ – θmin)/(θmax – θmin), where θ is the actual soil watercontent, θmin and θmax were the minimum and maximumsoil water content measured during the experiment ineach tube, respectively.
Stem water potential (Ψstem, MPa) was measured atsolar noon on days prior to irrigation using a pressurechamber (Soil Moisture Equip., Santa Barbara, CA,USA). Four shoot tips per treatment were selected onthe shaded side of the row near the trunk. Shoot tipswere covered with aluminum foil for 1 h prior to mea-surement to allow leaf water potential to equilibratewith stem water potential (Begg & Turner, 1970).
Vegetative growth
Shoot length was measured on two lateral shoots ineach of three trees per replicate. Tagged stems werede-fruited. Measurements were carried out periodicallyfrom May to October. Shoot length and Ψstem were mea-sured on the same day. Shoot growth rate was calcu-lated relative to the accumulation of growing degreedays (GDD) using 7°C as a baseline (Orlandi et al., 2010).
Fruit characteristics
A sample of 100 fruits was collected at the end oftreatment period on 02/09/07, 31/08/08 and 24/08/09from the middle part of the hedgerow on the south side.Three subsamples of 25 g were weighed after oven-drying at 105°C until constant weight. Oil content wasmeasured by nuclear magnetic resonance (MiniSpec,MQ-10, Bruker, Madison, USA) using the method des-cribed by Del Río & Romero (1999).
Final harvests were made on 12/11/2007, 05/11/2008and 30/10/2009 when fruit was removed from the threeselected trees per treatment and repetition. Yield ofeach tree was weighed fresh on collection from whicha sample of 450 g was extracted. Samples were dividedinto subsamples of 25 g that were each reweighed andagain after drying, fruit were counted. Oil content wasdetermined on dry basis as described previously.
Statistical analysis
Data were subjected to analysis of variance usingMSTAT-C (University of Michigan, USA). Significantdifferences (p < 0.05) were used to separate means ofparameters evaluated between irrigation treatmentsusing Duncan’s multiple range test. Regression equa-tions between Ψstem and REW, shoot growth and oilproduction were established with Excel 10 (MS, Red-mond, WA, USA).
Results
Amounts of irrigation water applied differed from yearto year according to the climatic conditions. CON received221, 284 and 402 mm in the 2007, 2008 and 2009 seasons,respectively, while DI-J, DI-A and DI-JA received 16,22 and 27% less water than CON, respectively.
Relationship between tree water status and yield and growth in olive 549
Soil and plant water status
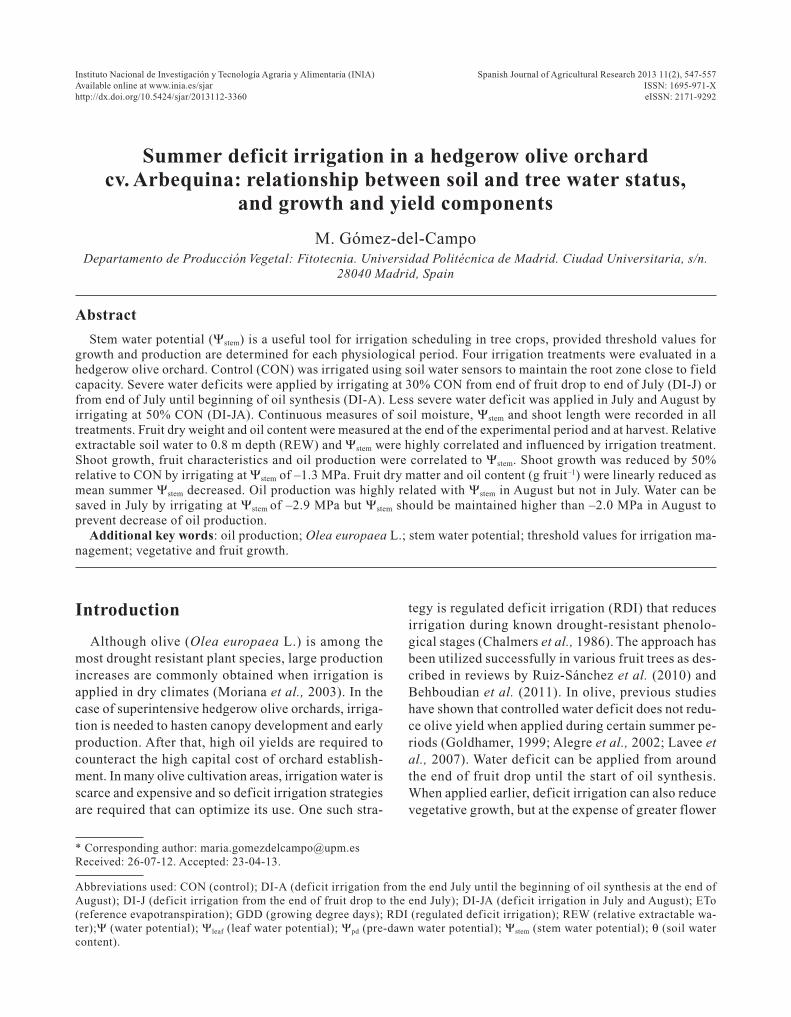
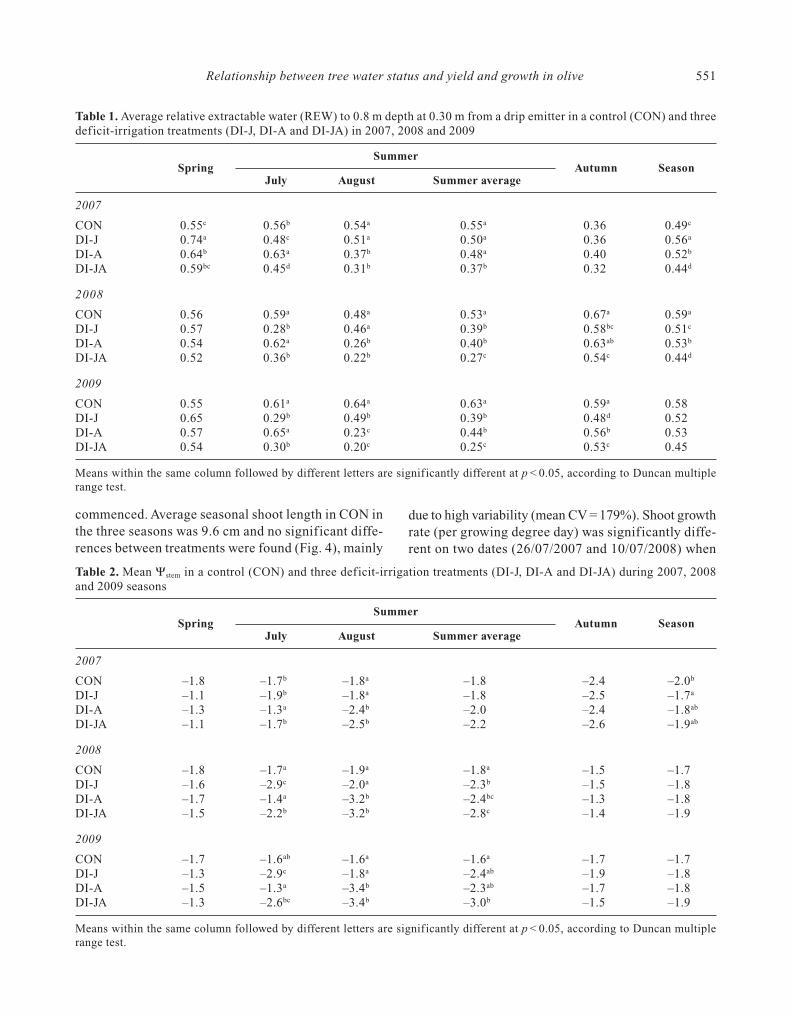
The irrigation treatments modif ied REW duringsummer, in response to the different amounts of waterapplied (Fig. 1). REW values in July were significantlyhigher in CON and DI-A (Table 1) than in DI-J and DI-JA, while in August REW values were higher in CONand DI-J. Mean summer REW was significantly lowerin DI-JA than in the other treatments. Although all irri-
gation treatments received the same amount of waterin autumn, summer irrigation treatments producedsignificant differences in 2008 and 2009 when DI-JAhad the lowest REW values in autumn. Seasonal REWin CON was higher in 2008 and 2009 than in 2007,mainly due to higher values in autumn in those two years.
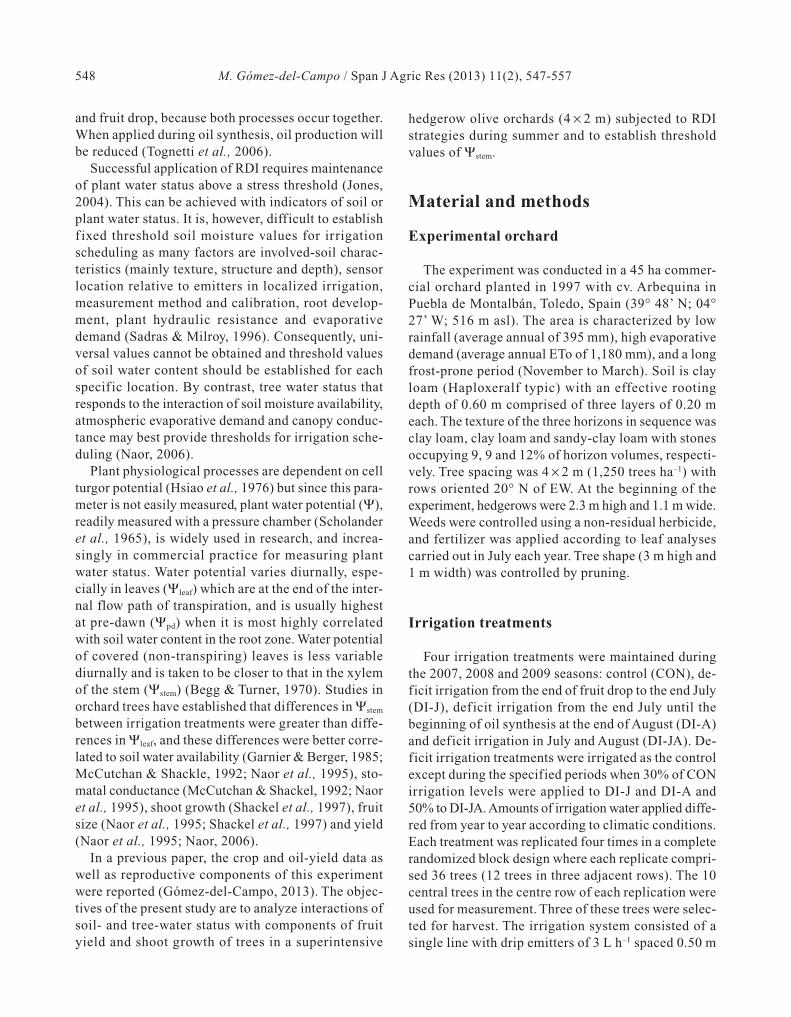
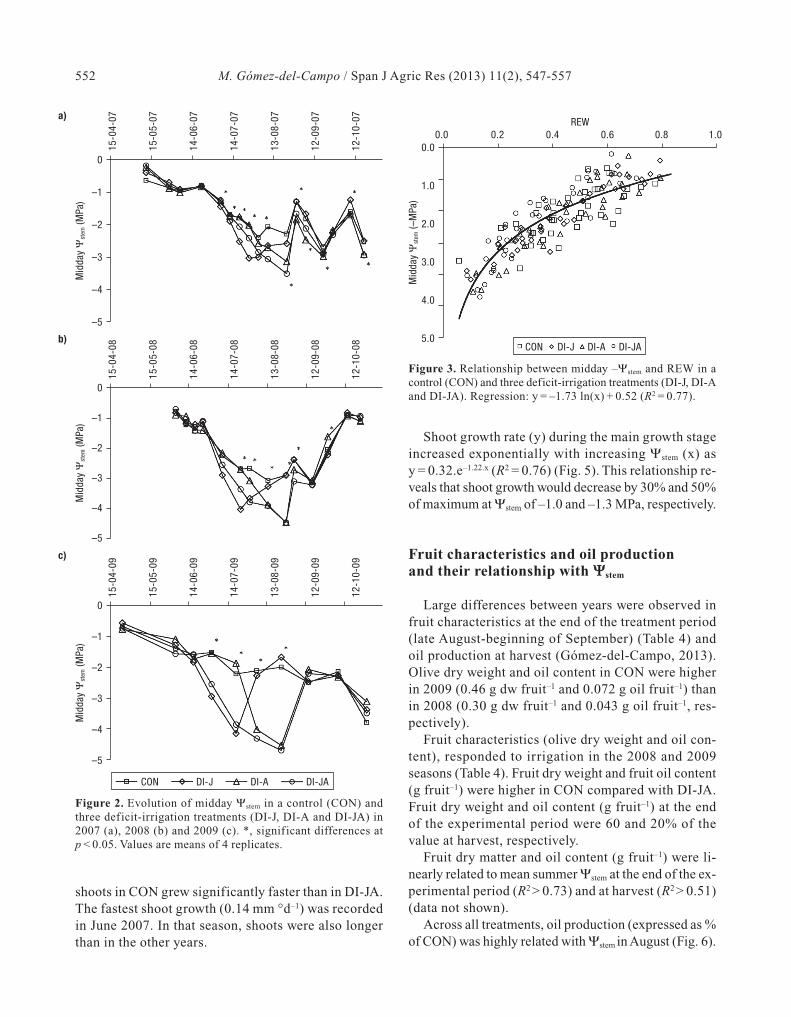
The highest value of Ψstem (–0.2 MPa) was recordedin 2007 before the start of irrigation treatments (Fig. 2),and the lowest value (–4.7 MPa) in DI-JA on 25/08/09.Ψstem was signif icantly different once the irrigationtreatments were applied. The effect of irrigation wasalso observed in Ψstem on some autumn days in 2007and 2008 (Fig. 2).
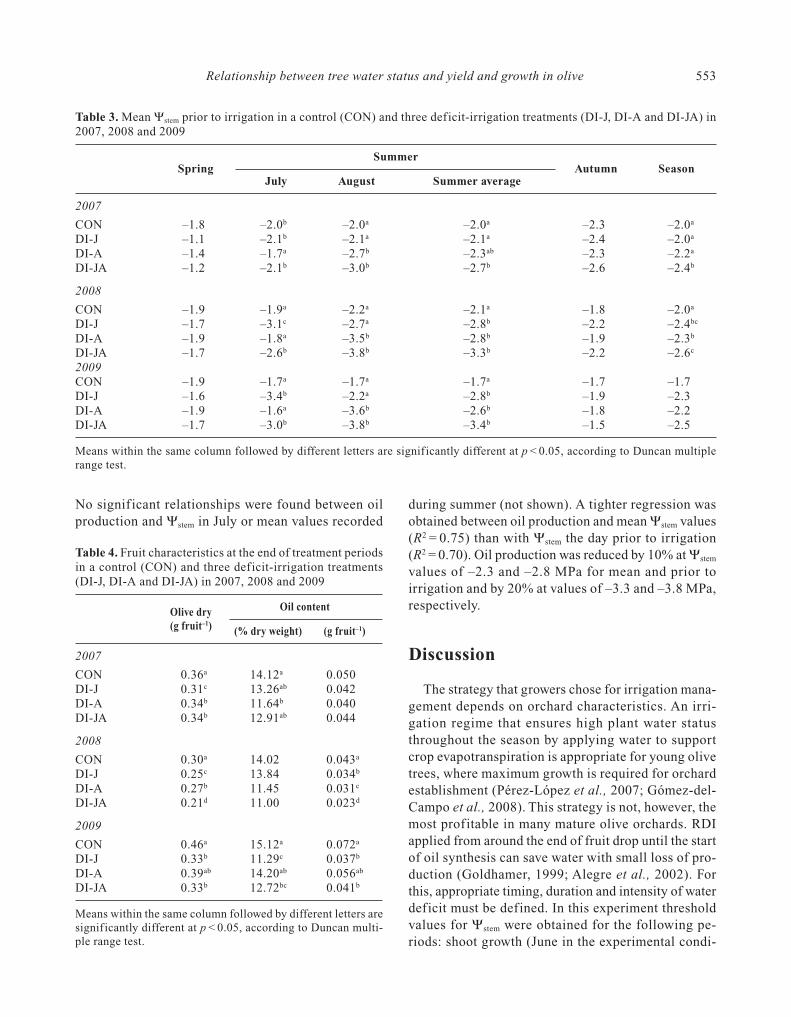
Relationships between Ψstem and REW (0.8 m avera-ge) were analyzed on pooled data of all three seasons(164 data pairs) (Fig. 3). Ψstem (–MPa) was more highlycorrelated to REW (R2 = 0.77) than with actual valuesof soil moisture content (R2 = 0.68). When each treat-ment was analyzed separately better fits were obtained:DI-A (y = –1.99ln(x) + 0.37, R2 = 0.85); DI-J (y =–1.73ln(x) +0.54, R2 = 0.85); DI-JA (y = –2.02ln(x) +0.02, R2 = 0.84), where y = –Ψstem and x = REW. Therelationship for CON was less precise (y = –1.21ln(x) +1.00, R2 = 0.47), due to the smaller range in REW. Therelationships between Ψstem and REW for each treat-ment were used to calculate Ψstem for each day. Meanvalues for each period and mean values on the days priorto each irrigation are presented in Table 2 and Table 3,respectively. Mean seasonal Ψstem revealed that CONwas more stressed in 2007 (–2.0 MPa) than in 2008 and2009 (–1.7 MPa). The highest mean Ψstem was recordedin 2007 spring in DI-J and DI-JA (–1.1 MPa) and thelowest in August 2009 DI-J and DI-JA (–3.4 MPa).Spring and autumn Ψstem were not significantly differentbetween treatments with the exception of spring 2007. Irri-gation treatments had significant effects on Ψstem duringJuly, August and mean summer. While mean summerΨstem in CON was –1.7 ± 0.4 MPa (–1.9 ± 0.4 MPa on dayprior to irrigation), lower values were recorded in Julyin DI-J (–2.6 ± 0.7 MPa and –2.9 ± 0.6 MPa prior toirrigation) and DI-JA (–2.1 ± 0.6 MPa, –2.6 ± 0.5 MPaprior to irrigation), and in August in DI-A (–3.0 ± 0.7MPa, –3.3 ± 0.6 MPa prior to irrigation) and DI-JA(–3.0 ± 0.7 MPa, –3.5 ± 0.4 MPa prior to irrigation).
Shoot growth
Shoot growth ceased on 12/07/07, 10/07/08 and14/06/09, two weeks after irrigation treatments were
550 M. Gómez-del-Campo / Span J Agric Res (2013) 11(2), 547-557
21/0
3/09
20/0
4/09
20/0
5/09
19/0
6/09
19/0
7/09
18/0
8/09
17/0
9/09
17/1
0/09
0,000,100,200,300,400,500,600,700,800,901,00
REW
2nd1st
c)
21/0
3/08
20/0
4/08
20/0
5/08
19/0
6/08
19/0
7/08
18/0
8/08
17/0
9/08
17/1
0/08
0,000,100,200,300,400,500,600,700,800,901,00b)
REW
2nd1st
2nd1st
21/0
3/07
20/0
4/07
20/0
5/07
19/0
6/07
19/0
7/07
18/0
8/07
17/0
9/07
17/1
0/07
21/0
3/07
20/0
4/07
20/0
5/07
19/0
6/07
19/0
7/07
18/0
8/07
17/0
9/07
17/1
0/07
21/0
3/07
20/0
4/07
20/0
5/07
19/0
6/07
19/0
7/07
18/0
8/07
17/0
9/07
17/1
0/07
21/0
3/07
20/0
4/07
20/0
5/07
19/0
6/07
19/0
7/07
18/0
8/07
17/0
9/07
17/1
0/07
21/0
3/07
20/0
4/07
20/0
5/07
19/0
6/07
19/0
7/07
18/0
8/07
17/0
9/07
17/1
0/07
21/0
3/07
20/0
4/07
20/0
5/07
19/0
6/07
19/0
7/07
18/0
8/07
17/0
9/07
17/1
0/07
21/0
3/07
20/0
4/07
20/0
5/07
19/0
6/07
19/0
7/07
18/0
8/07
17/0
9/07
17/1
0/07
0,600,700,800,901,00
0,200,300,400,500,600,700,800,901,00
REW
0,000,100,200,300,400,500,600,700,800,901,00
REW
0,000,100,200,300,400,500,600,700,800,901,00
REW
0,000,100,200,300,400,500,600,700,800,901,00
REW
0,000,100,200,300,400,500,600,700,800,901,00
REW
0,000,100,200,300,400,500,600,700,800,901,00
REW
0,000,100,200,300,400,500,600,700,800,901,00
REW
0,000,100,200,300,400,500,600,700,800,901,00a)
REW
Figure 1. Relative extractable water (REW) to 0.8 m depth at0.30 m from a drip emitter in a control (CON) and three defi-cit-irrigation treatments (DI-J, DI-A and DI-JA) in 2007 (a),2008 (b) and 2009 (c). Arrows indicate first and second sum-mer irrigation periods.
CON DI-A DI-J DI-JA
commenced. Average seasonal shoot length in CON inthe three seasons was 9.6 cm and no significant diffe-rences between treatments were found (Fig. 4), mainly
due to high variability (mean CV = 179%). Shoot growthrate (per growing degree day) was significantly diffe-rent on two dates (26/07/2007 and 10/07/2008) when
Relationship between tree water status and yield and growth in olive 551
Table 1. Average relative extractable water (REW) to 0.8 m depth at 0.30 m from a drip emitter in a control (CON) and threedeficit-irrigation treatments (DI-J, DI-A and DI-JA) in 2007, 2008 and 2009
SpringSummer
Autumn SeasonJuly August Summer average
2007
CON 0.55c 0.56b 0.54a 0.55a 0.36 0.49c
DI-J 0.74a 0.48c 0.51a 0.50a 0.36 0.56a
DI-A 0.64b 0.63a 0.37b 0.48a 0.40 0.52b
DI-JA 0.59bc 0.45d 0.31b 0.37b 0.32 0.44d
2008
CON 0.56 0.59a 0.48a 0.53a 0.67a 0.59a
DI-J 0.57 0.28b 0.46a 0.39b 0.58bc 0.51c
DI-A 0.54 0.62a 0.26b 0.40b 0.63ab 0.53b
DI-JA 0.52 0.36b 0.22b 0.27c 0.54c 0.44d
2009
CON 0.55 0.61a 0.64a 0.63a 0.59a 0.58DI-J 0.65 0.29b 0.49b 0.39b 0.48d 0.52DI-A 0.57 0.65a 0.23c 0.44b 0.56b 0.53DI-JA 0.54 0.30b 0.20c 0.25c 0.53c 0.45
Means within the same column followed by different letters are significantly different at p < 0.05, according to Duncan multiplerange test.
Table 2. Mean Ψstem in a control (CON) and three deficit-irrigation treatments (DI-J, DI-A and DI-JA) during 2007, 2008and 2009 seasons
SpringSummer
Autumn SeasonJuly August Summer average
2007
CON –1.8 –1.7b –1.8a –1.8 –2.4 –2.0b
DI-J –1.1 –1.9b –1.8a –1.8 –2.5 –1.7a
DI-A –1.3 –1.3a –2.4b –2.0 –2.4 –1.8ab
DI-JA –1.1 –1.7b –2.5b –2.2 –2.6 –1.9ab
2008
CON –1.8 –1.7a –1.9a –1.8a –1.5 –1.7DI-J –1.6 –2.9c –2.0a –2.3b –1.5 –1.8DI-A –1.7 –1.4a –3.2b –2.4bc –1.3 –1.8DI-JA –1.5 –2.2b –3.2b –2.8c –1.4 –1.9
2009
CON –1.7 –1.6ab –1.6a –1.6a –1.7 –1.7DI-J –1.3 –2.9c –1.8a –2.4ab –1.9 –1.8DI-A –1.5 –1.3a –3.4b –2.3ab –1.7 –1.8DI-JA –1.3 –2.6bc –3.4b –3.0b –1.5 –1.9
Means within the same column followed by different letters are significantly different at p < 0.05, according to Duncan multiplerange test.
shoots in CON grew significantly faster than in DI-JA.The fastest shoot growth (0.14 mm °d–1) was recordedin June 2007. In that season, shoots were also longerthan in the other years.
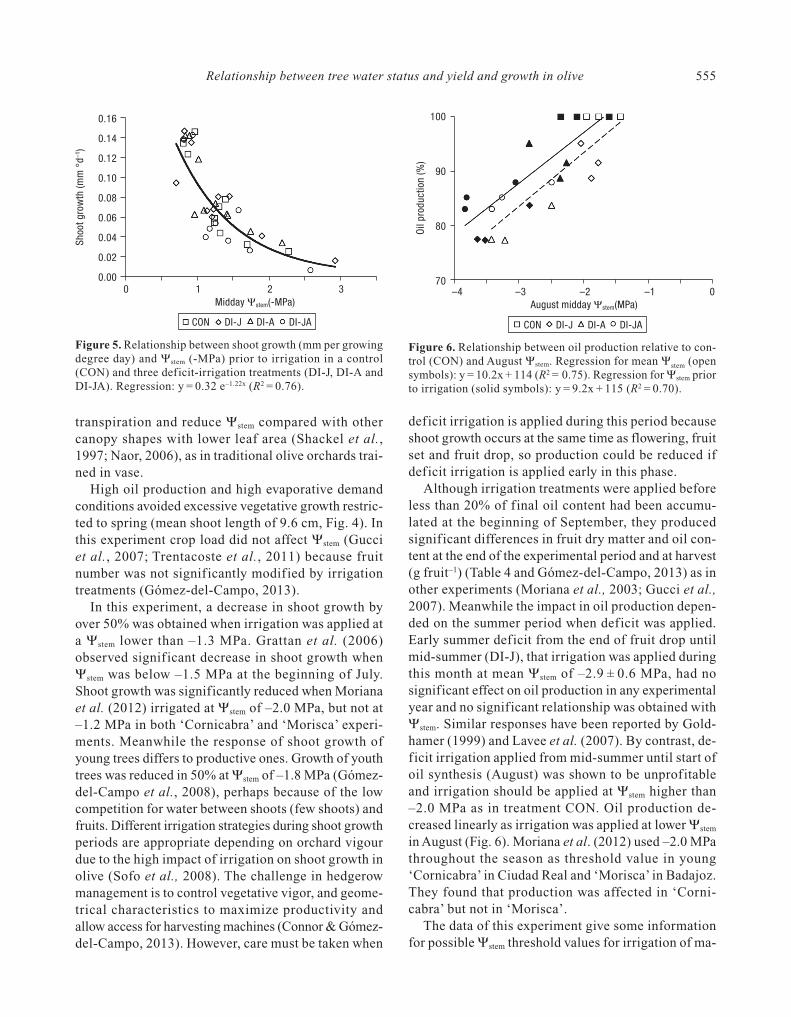
Shoot growth rate (y) during the main growth stageincreased exponentially with increasing Ψstem (x) asy = 0.32.e–1.22.x (R2 = 0.76) (Fig. 5). This relationship re-veals that shoot growth would decrease by 30% and 50%of maximum at Ψstem of –1.0 and –1.3 MPa, respectively.
Fruit characteristics and oil production and their relationship with ΨΨstem
Large differences between years were observed infruit characteristics at the end of the treatment period(late August-beginning of September) (Table 4) andoil production at harvest (Gómez-del-Campo, 2013).Olive dry weight and oil content in CON were higherin 2009 (0.46 g dw fruit–1 and 0.072 g oil fruit–1) thanin 2008 (0.30 g dw fruit–1 and 0.043 g oil fruit–1, res-pectively).
Fruit characteristics (olive dry weight and oil con-tent), responded to irrigation in the 2008 and 2009seasons (Table 4). Fruit dry weight and fruit oil content(g fruit–1) were higher in CON compared with DI-JA.Fruit dry weight and oil content (g fruit–1) at the endof the experimental period were 60 and 20% of thevalue at harvest, respectively.
Fruit dry matter and oil content (g fruit–1) were li-nearly related to mean summer Ψstem at the end of the ex-perimental period (R2 > 0.73) and at harvest (R2 > 0.51)(data not shown).
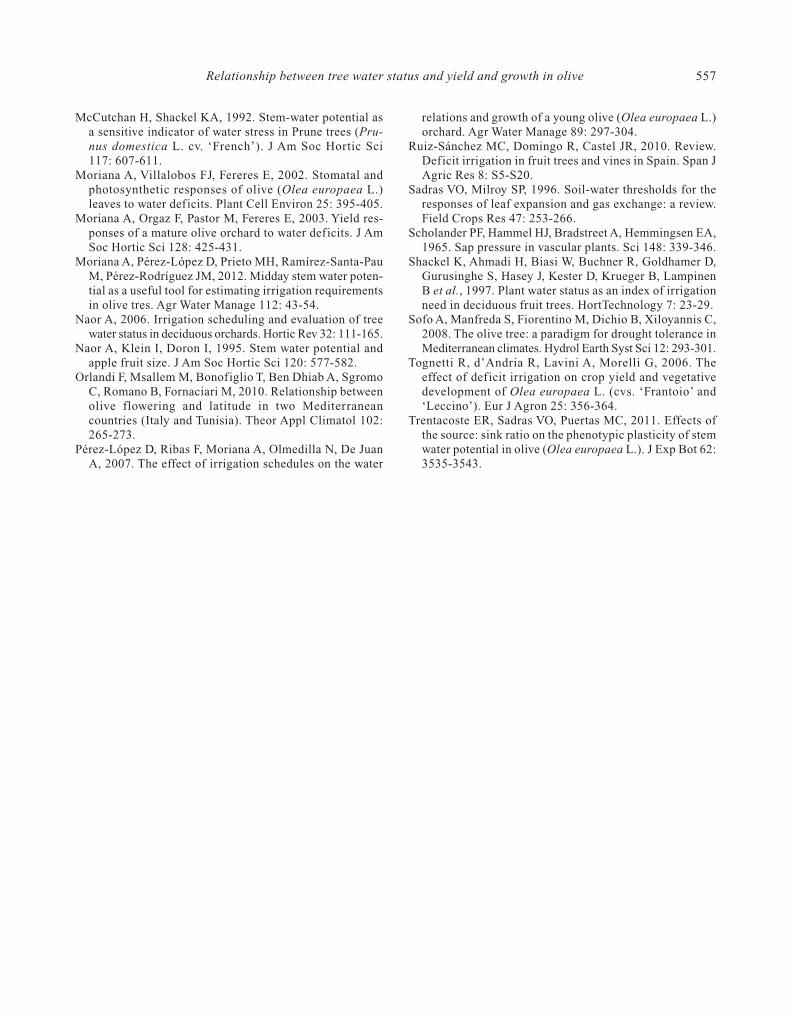
Across all treatments, oil production (expressed as %of CON) was highly related with Ψstem in August (Fig. 6).
552 M. Gómez-del-Campo / Span J Agric Res (2013) 11(2), 547-557
Figure 2. Evolution of midday Ψstem in a control (CON) andthree deficit-irrigation treatments (DI-J, DI-A and DI-JA) in2007 (a), 2008 (b) and 2009 (c). *, significant differences atp < 0.05. Values are means of 4 replicates.
15-0
4-07
15-0
5-07
14-0
6-07
14-0
7-07
13-0
8-07
12-0
9-07
12-1
0-07
15-0
4-08
15-0
5-08
14-0
6-08
14-0
7-08
13-0
8-08
12-0
9-08
12-1
0-08
15-0
4-09
15-0
5-09
14-0
6-09
14-0
7-09
13-0
8-09
12-0
9-09
12-1
0-09
CON DI-J DI-A DI-JA
a)
b)
c)
Mid
day
Ψst
em(M
Pa)
Mid
day
Ψst
em(M
Pa)
Mid
day
Ψst
em(M
Pa)
0
–1
–2
–3
–4
–5
0
–1
–2
–3
–4
–5
0
–1
–2
–3
–4
–5
Figure 3. Relationship between midday –Ψstem and REW in acontrol (CON) and three deficit-irrigation treatments (DI-J, DI-Aand DI-JA). Regression: y = –1.73 ln(x) + 0.52 (R2 = 0.77).
0.0
1.0
2.0
3.0
4.0
5.0
Mid
day
Ψst
em(–
MPa
)
REW0.0 0.2 0.4 0.6 0.8 1.0
CON DI-J DI-A DI-JA
No significant relationships were found between oilproduction and Ψstem in July or mean values recorded
during summer (not shown). A tighter regression wasobtained between oil production and mean Ψstem values(R2 = 0.75) than with Ψstem the day prior to irrigation(R2 = 0.70). Oil production was reduced by 10% at Ψstem
values of –2.3 and –2.8 MPa for mean and prior toirrigation and by 20% at values of –3.3 and –3.8 MPa,respectively.
Discussion
The strategy that growers chose for irrigation mana-gement depends on orchard characteristics. An irri-gation regime that ensures high plant water statusthroughout the season by applying water to supportcrop evapotranspiration is appropriate for young olivetrees, where maximum growth is required for orchardestablishment (Pérez-López et al., 2007; Gómez-del-Campo et al., 2008). This strategy is not, however, themost profitable in many mature olive orchards. RDIapplied from around the end of fruit drop until the startof oil synthesis can save water with small loss of pro-duction (Goldhamer, 1999; Alegre et al., 2002). Forthis, appropriate timing, duration and intensity of waterdeficit must be defined. In this experiment thresholdvalues for Ψstem were obtained for the following pe-riods: shoot growth (June in the experimental condi-
Relationship between tree water status and yield and growth in olive 553
Table 3. Mean Ψstem prior to irrigation in a control (CON) and three deficit-irrigation treatments (DI-J, DI-A and DI-JA) in2007, 2008 and 2009
SpringSummer
Autumn SeasonJuly August Summer average
2007
CON –1.8 –2.0b –2.0a –2.0a –2.3 –2.0a
DI-J –1.1 –2.1b –2.1a –2.1a –2.4 –2.0a
DI-A –1.4 –1.7a –2.7b –2.3ab –2.3 –2.2a
DI-JA –1.2 –2.1b –3.0b –2.7b –2.6 –2.4b
2008
CON –1.9 –1.9a –2.2a –2.1a –1.8 –2.0a
DI-J –1.7 –3.1c –2.7a –2.8b –2.2 –2.4bc
DI-A –1.9 –1.8a –3.5b –2.8b –1.9 –2.3b
DI-JA –1.7 –2.6b –3.8b –3.3b –2.2 –2.6c
2009CON –1.9 –1.7a –1.7a –1.7a –1.7 –1.7DI-J –1.6 –3.4b –2.2a –2.8b –1.9 –2.3DI-A –1.9 –1.6a –3.6b –2.6b –1.8 –2.2DI-JA –1.7 –3.0b –3.8b –3.4b –1.5 –2.5
Means within the same column followed by different letters are significantly different at p < 0.05, according to Duncan multiplerange test.
Table 4. Fruit characteristics at the end of treatment periodsin a control (CON) and three deficit-irrigation treatments(DI-J, DI-A and DI-JA) in 2007, 2008 and 2009
Olive dry Oil content
(g fruit–1) (% dry weight) (g fruit–1)
2007
CON 0.36a 14.12a 0.050DI-J 0.31c 13.26ab 0.042DI-A 0.34b 11.64b 0.040DI-JA 0.34b 12.91ab 0.044
2008
CON 0.30a 14.02 0.043a
DI-J 0.25c 13.84 0.034b
DI-A 0.27b 11.45 0.031c
DI-JA 0.21d 11.00 0.023d
2009
CON 0.46a 15.12a 0.072a
DI-J 0.33b 11.29c 0.037b
DI-A 0.39ab 14.20ab 0.056ab
DI-JA 0.33b 12.72bc 0.041b
Means within the same column followed by different letters aresignificantly different at p < 0.05, according to Duncan multi-ple range test.

tions), f inal fruit drop until mid-summer (July) andmid-summer until start of oil synthesis (August).
Ψstem values depend on the experimental conditions.Hedgerow canopy and soil characteristics (effectiverooting depth of 0.60 m) and hot, dry summer caused
a high water stress with Ψstem falling to –4.7 MPa(Fig. 2), comparable with rainfed olives (Moriana etal., 2003; Tognetti et al., 2006). The hedgerow orchardhad high leaf area intercepting radiation (Connor &Gómez-del-Campo, 2013) this will increase water
554 M. Gómez-del-Campo / Span J Agric Res (2013) 11(2), 547-557
Figure 4. Evolution of shoot length (cm) and growth (mm per growing degree day) in a control (CON) and three deficit-irrigationtreatments (DI-J, DI-A and DI-JA). * Significant differences at p < 0.05. Values are means of 24 replicates.
15
12
9
6
3
0
0.16
0.14
0.12
0.10
0.08
0.06
0.04
0.02
0.00
0.16
0.14
0.12
0.10
0.08
0.06
0.04
0.02
0.00
0.16
0.14
0.12
0.10
0.08
0.06
0.04
0.02
0.00
15
12
9
6
3
0
15
12
9
6
3
0
Shoo
t len
gth
(cm
)
CON DI-J DI-A DI-JA
Shoo
t len
gth
(cm
)Sh
oot l
engt
h (c
m)
Shoo
t gro
wth
(mm
°d–1
)Sh
oot g
row
th (m
m °
d–1)
Shoo
t gro
wth
(mm
°d–1
)
15-0
4-07
15-0
5-07
14-0
6-07
14-0
7-07
13-0
8-07
12-0
9-07
12-1
0-07
15-0
4-07
15-0
5-07
14-0
6-07
14-0
7-07
13-0
8-07
12-0
9-07
12-1
0-07
15-0
4-08
15-0
5-08
14-0
6-08
14-0
7-08
13-0
8-08
12-0
9-08
12-1
0-08
15-0
4-08
15-0
5-08
14-0
6-08
14-0
7-08
13-0
8-08
12-0
9-08
12-1
0-08
15-0
4-09
15-0
5-09
14-0
6-09
14-0
7-09
13-0
8-09
12-0
9-09
12-1
0-09
15-0
4-09
15-0
5-09
14-0
6-09
14-0
7-09
13-0
8-09
12-0
9-09
12-1
0-09
transpiration and reduce Ψstem compared with othercanopy shapes with lower leaf area (Shackel et al.,1997; Naor, 2006), as in traditional olive orchards trai-ned in vase.
High oil production and high evaporative demandconditions avoided excessive vegetative growth restric-ted to spring (mean shoot length of 9.6 cm, Fig. 4). Inthis experiment crop load did not affect Ψstem (Gucciet al., 2007; Trentacoste et al., 2011) because fruitnumber was not significantly modified by irrigationtreatments (Gómez-del-Campo, 2013).
In this experiment, a decrease in shoot growth byover 50% was obtained when irrigation was applied ata Ψstem lower than –1.3 MPa. Grattan et al. (2006)observed significant decrease in shoot growth whenΨstem was below –1.5 MPa at the beginning of July.Shoot growth was significantly reduced when Morianaet al. (2012) irrigated at Ψstem of –2.0 MPa, but not at–1.2 MPa in both ‘Cornicabra’ and ‘Morisca’ experi-ments. Meanwhile the response of shoot growth ofyoung trees differs to productive ones. Growth of youthtrees was reduced in 50% at Ψstem of –1.8 MPa (Gómez-del-Campo et al., 2008), perhaps because of the lowcompetition for water between shoots (few shoots) andfruits. Different irrigation strategies during shoot growthperiods are appropriate depending on orchard vigourdue to the high impact of irrigation on shoot growth inolive (Sofo et al., 2008). The challenge in hedgerowmanagement is to control vegetative vigor, and geome-trical characteristics to maximize productivity andallow access for harvesting machines (Connor & Gómez-del-Campo, 2013). However, care must be taken when
deficit irrigation is applied during this period becauseshoot growth occurs at the same time as flowering, fruitset and fruit drop, so production could be reduced ifdeficit irrigation is applied early in this phase.
Although irrigation treatments were applied beforeless than 20% of final oil content had been accumu-lated at the beginning of September, they producedsignificant differences in fruit dry matter and oil con-tent at the end of the experimental period and at harvest(g fruit–1) (Table 4 and Gómez-del-Campo, 2013) as inother experiments (Moriana et al., 2003; Gucci et al.,2007). Meanwhile the impact in oil production depen-ded on the summer period when deficit was applied.Early summer deficit from the end of fruit drop untilmid-summer (DI-J), that irrigation was applied duringthis month at mean Ψstem of –2.9 ± 0.6 MPa, had nosignificant effect on oil production in any experimentalyear and no significant relationship was obtained withΨstem. Similar responses have been reported by Gold-hamer (1999) and Lavee et al. (2007). By contrast, de-ficit irrigation applied from mid-summer until start ofoil synthesis (August) was shown to be unprofitableand irrigation should be applied at Ψstem higher than–2.0 MPa as in treatment CON. Oil production de-creased linearly as irrigation was applied at lower Ψstem
in August (Fig. 6). Moriana et al. (2012) used –2.0 MPathroughout the season as threshold value in young‘Cornicabra’ in Ciudad Real and ‘Morisca’ in Badajoz.They found that production was affected in ‘Corni-cabra’ but not in ‘Morisca’.
The data of this experiment give some informationfor possible Ψstem threshold values for irrigation of ma-
Relationship between tree water status and yield and growth in olive 555
Figure 5. Relationship between shoot growth (mm per growingdegree day) and Ψstem (-MPa) prior to irrigation in a control(CON) and three deficit-irrigation treatments (DI-J, DI-A andDI-JA). Regression: y = 0.32 e–1.22x (R2 = 0.76).
0.16
0.14
0.12
0.10
0.08
0.06
0.04
0.02
0.00
Shoo
t gro
wth
(mm
°d–1
)
0 1 2 3Midday Ψstem(-MPa)
CON DI-J DI-A DI-JA
Figure 6. Relationship between oil production relative to con-trol (CON) and August Ψstem. Regression for mean Ψstem (opensymbols): y = 10.2x + 114 (R2 = 0.75). Regression for Ψstem priorto irrigation (solid symbols): y = 9.2x + 115 (R2 = 0.70).
100
90
80
70
Oil
prod
uctio
n (%
)
–4 –3 –2 –1 0August midday Ψstem(MPa)
CON DI-J DI-A DI-JA

ture ‘Arbequina’ orchards. During shoot growth period(June in the experimental conditions), Ψstem should bemaintained higher than –1.0 MPa if high shoot growthis desired, but if shoot growth is to be reduced to morethan half of the maximum, irrigation should be appliedbelow –1.3 MPa. From the end of fruit drop until midsummer (July) water can be saved in this experimentby irrigating at Ψstem of –2.9 MPa but Ψstem should bemaintained higher than –2.0 MPa later in August toprevent decrease of oil production. It should be notedthat the response of growth and oil production to waterpotential is genetically controlled (Tognetti et al., 2006),that crop loads and climatic conditions will also deter-mine the threshold values for irrigation (Naor, 2006;Moriana et al., 2012) and that experiments with othercultivars and growing conditions are necessary to de-termine individual threshold values.
The advantage of Ψstem measurements for irrigationmanagement lays in ability to integrate soil, climaticand crop conditions such that threshold values havemore general application, i.e. they are not restricted,as are threshold values of soil water status, to indivi-dual sites. They do, however, have disadvantages. WhileΨstem threshold values indicate when irrigation shouldstart, they do not indicate how long irrigation shouldlast. This can be overcome by placing soil water sen-sors at drainage depth to record when effective root depthis wetted. A more serious disadvantage is that Ψstem cannotbe monitored automatically. Until that is possible, rela-tionships between soil water content and Ψstem, as deter-mined here, must be used. Analysis of data revea-led that Ψstem was highly correlated to REW (R2 = 0.77)(Fig. 3). Similar responses of Ψstem to soil moisturecontent have been reported in olive (Moriana et al.,2002; Gómez-del-Campo et al., 2008). Better correla-tion was obtained for each treatment separately indica-ting that this relationship is site-specific. Tree waterstatus nor only depends on the water measured by thenearby sensors, sensor location in relation to emitter,soil characteristics and root development in thesurrounding soil and water movement inside the treewill determine its hydration capacity.
Acknowledgements
I gratefully acknowledge Agrícola La Veguilla foraccess to the olive orchard and Regaber SA for irriga-tion equipment of the experiment. I express my gratitu-de to Amos Naor, David J. Connor, Eduardo Trenta-
coste and two anonymous reviewers for suggestionson the manuscript; Vicente Gómez for the soil descrip-tion; Diego Barranco for use of oil measurement equip-ment; and Miguel Benito, Ana Centeno and EnriqueVivas for helping in field data collection.
References
Alegre S, Marsal J, Mata M, Arbones A, Girona J, Tovar MJ,2002. Regulated def icit irrigation in olive trees (Oleaeuropaea L. cv. ‘Arbequina’) for oil production. ActaHortic 586: 259-262.
Begg JE, Turner NC, 1970. Water potential gradients in fieldtobacco. Plant Physiol 46: 343-346.
Behboudian MH, Marsal J, Girona J, López G, 2011. Qualityand yield responses of deciduous fruits to reduced irriga-tion. Hortic Rev 38: 149-189.
Chalmers DJ, Burge G, Jerie PH, Mitchell PD, 1986. Themechanism of regulation of Bartlett pear fruit and vege-tative growth by irrigation withholding and regulated defi-cit irrigation. J Am Soc Hortic Sci 111: 904-907.
Connor DJ, Gómez-del-Campo M, 2013. Simulation of oilproductivity and quality of N-S oriented olive hedgeroworchards in response to structure and interception ofradiation. Sci Hortic 150: 92-99.
Del Río C, Romero AM, 1999. Whole, unmilled olives canbe used to determine their oil content by nuclear magneticresonance. HortTechnology 9: 675-680.
Garnier E, Berger A, 1985. Testing water potential in peach-trees as an indicator of water-stress. J Hortic Sci 60: 47-56.
Goldhamer DA, 1999. Regulated deficit irrigation for Cali-fornia canning olives. Acta Hortic 474: 369-372.
Gómez-del-Campo M, 2013. Summer def icit-irriga-tion strategies in a hedgerow olive orchard cv. ‘Arbequi-na’: effect on fruit characteristics and yield. Irrig Sci 31:259-269.
Gómez-del-Campo M, Leal A, Pezuela C, 2008. Relationshipof stem water potential and leaf conductance to vegetativegrowth of young olive trees in a hedgerow orchard. AustJ Agric Res 59: 270-279.
Grattan SR, Berenguer MJ, Connell JH, Polito VS, VossenPM, 2006. Olive oil production as influenced by diffe-rent quantities of applied water. Agr Water Manage 85:133-140.
Gucci R, Lodolini E, Rapoport HF, 2007. Productivity ofolive trees with different water status and crop load. J Hor-tic Sci Biotechnol 82: 648-656.
Hsiao TC, Acevedo E, Fereres E, Henderson DW, 1976.Water stress, growth, and osmotic adjustment. PhilosTrans R Soc London 273(927): 479-500.
Jones HG, 2004. Irrigation scheduling: advantages andpitfalls of plant-based methods. J Exp Bot 55: 2427-2436.
Lavee S, Hanoch E, Wodner M, Abramowitch H, 2007. Theeffect of predetermined deficit irrigation on the perfor-mance of cv. ‘Muhasan’ olives (Olea europaea L.) in theeastern coastal plain of Israel. Sci Hortic 112: 156-163.
556 M. Gómez-del-Campo / Span J Agric Res (2013) 11(2), 547-557
Relationship between tree water status and yield and growth in olive 557
McCutchan H, Shackel KA, 1992. Stem-water potential asa sensitive indicator of water stress in Prune trees (Pru-nus domestica L. cv. ‘French’). J Am Soc Hortic Sci 117: 607-611.
Moriana A, Villalobos FJ, Fereres E, 2002. Stomatal andphotosynthetic responses of olive (Olea europaea L.)leaves to water deficits. Plant Cell Environ 25: 395-405.
Moriana A, Orgaz F, Pastor M, Fereres E, 2003. Yield res-ponses of a mature olive orchard to water deficits. J AmSoc Hortic Sci 128: 425-431.
Moriana A, Pérez-López D, Prieto MH, Ramírez-Santa-PauM, Pérez-Rodríguez JM, 2012. Midday stem water poten-tial as a useful tool for estimating irrigation requirementsin olive tres. Agr Water Manage 112: 43-54.
Naor A, 2006. Irrigation scheduling and evaluation of treewater status in deciduous orchards. Hortic Rev 32: 111-165.
Naor A, Klein I, Doron I, 1995. Stem water potential andapple fruit size. J Am Soc Hortic Sci 120: 577-582.
Orlandi F, Msallem M, Bonofiglio T, Ben Dhiab A, SgromoC, Romano B, Fornaciari M, 2010. Relationship betweenolive flowering and latitude in two Mediterranean countries (Italy and Tunisia). Theor Appl Climatol 102: 265-273.
Pérez-López D, Ribas F, Moriana A, Olmedilla N, De JuanA, 2007. The effect of irrigation schedules on the water
relations and growth of a young olive (Olea europaea L.)orchard. Agr Water Manage 89: 297-304.
Ruiz-Sánchez MC, Domingo R, Castel JR, 2010. Review.Deficit irrigation in fruit trees and vines in Spain. Span JAgric Res 8: S5-S20.
Sadras VO, Milroy SP, 1996. Soil-water thresholds for theresponses of leaf expansion and gas exchange: a review.Field Crops Res 47: 253-266.
Scholander PF, Hammel HJ, Bradstreet A, Hemmingsen EA,1965. Sap pressure in vascular plants. Sci 148: 339-346.
Shackel K, Ahmadi H, Biasi W, Buchner R, Goldhamer D,Gurusinghe S, Hasey J, Kester D, Krueger B, LampinenB et al., 1997. Plant water status as an index of irrigationneed in deciduous fruit trees. HortTechnology 7: 23-29.
Sofo A, Manfreda S, Fiorentino M, Dichio B, Xiloyannis C,2008. The olive tree: a paradigm for drought tolerance inMediterranean climates. Hydrol Earth Syst Sci 12: 293-301.
Tognetti R, d’Andria R, Lavini A, Morelli G, 2006. Theeffect of deficit irrigation on crop yield and vegetativedevelopment of Olea europaea L. (cvs. ‘Frantoio’ and‘Leccino’). Eur J Agron 25: 356-364.
Trentacoste ER, Sadras VO, Puertas MC, 2011. Effects ofthe source: sink ratio on the phenotypic plasticity of stemwater potential in olive (Olea europaea L.). J Exp Bot 62:3535-3543.
