student food access and security study - office of the...
TRANSCRIPT

Student Food Access
and Security Study
2016
07.11.16 UC GLOBAL FOOD INITIATIVE STUDENT FOOD ACCESS AND SECURITY STUDY 2
AUTHORS:
Suzanna M. Martinez1 Katie Maynard2 Lorrene D. Ritchie1
1 Nutrition Policy Institute,
University of California Division of Agriculture and Natural Resources 2 University of California Santa Barbara
This report w as made possible by funding from the University of California (UC) Office of the President Global Food Initiativ e. The University of California Global Food Initiative addresses one of the critical issues of our time: how to sustainably and nutritiously feed a w orld population expected to reach eight billion by 2025. By building on existing efforts and creating new collaborations
among UC’s 10 campuses, aff iliated national laboratories and the Division of Agriculture and Natural Resources, the Global Food Initiative is w orking to develop and export solutions for food security, health and sustainability throughout California, the United States and the w orld. For more information, visit: www.ucop.edu/global-food-initiative.
Contributors to the study and report include the follow ing organizations and individuals: UCOP Institutional Research and Academic Planning (Pamela Brow n, Tongshan Chan, Yang Yang, Xiaohui Zheng), William Armstrong, Lauren Au, Erika Brow n, Ruben E. Cañedo, Maria Frias Cardenas, Christopher Carter, Heidi Carty, Jaqueline Chang, Alisha Coleman-Jensen, Patricia Craw ford, Doug
Everhart, Ed Frongillo, Tim Galarneau, Jerlena Griff in-Desta, Ken Hecht, Mark Hudes, Neil Daniel Huefner, Joanne Lin, Marlene Low e, Greg Martin, Polly Paulson, Matthew Rabbitt, Betsy Reynolds-Malear, Timo Rico, Michelle Ross, Rachel Rouse, Jeff Royal, Anna Sher, Belinda Sirha, Greg Spurgeon, Sheila Stern, Ning Wang, and Karen Webb.
For additional information, please contact: Nutrition Policy Institute 1111 Franklin Street, 10th Floor Oakland, CA 94607
510-642-3589 Online at: NPI.ucanr.edu
07.11.16 UC GLOBAL FOOD INITIATIVE STUDENT FOOD ACCESS AND SECURITY STUDY 3
The U.S. Department of Agriculture estimates that one out of every seven households in the United States is considered to be food insecure, meaning that lack of money or other resources limits their access to adequate food. As awareness about the prevalence of food insecure households has
increased, anecdotal reports from colleges and universities throughout the country have raised concerns about food insecurity among students. Because there is limited data about food security among college students, the University of California is working to better understand the scope of food insecurity on
its campuses.
UC’S GLOBAL FOOD INITIATIVE In 2014, University of California President Janet Napolitano and UC’s 10 chancellors launched the UC
Global Food Initiative. Building on existing efforts and creating new collaborations among the campuses, Lawrence Berkeley National Laboratory, and UC’s Division of Agriculture and Natural Resources, the initiative draws on the University’s leadership and research in the fields of agriculture, medicine, nutrition,
climate science, public policy, social science, biological science, humanities, arts and the law. Understanding and addressing food insecurity is an Initiative priority, given its potential to widen
disparities in students’ academic achievement, overall health, and future success. As a first step, President Napolitano funded the UC Nutrition Policy Institute (NPI) to conduct the Food Access and Security study—the University’s first in-depth food security study of its students to gauge the extent of
food insecurity at UC and develop effective responses. President Napolitano also allocated an initial $75,000 per campus in 2015 to immediately support student
food access and enhance existing food security projects. The president requested that each campus form a Food Security Working Group that included equitable representation of undergraduate and graduate students, faculty, staff, administration, and community experts. In 2016, the president renewed her
commitment to the issue by addressing social and financial barriers that impact access to food, such as emergency assistance, financial literacy and life skills trainings. She has approved additional funding of more than $3.3 million over two years, including $151,000 per campus, per year, to tackle food insecurity
across the system. Campuses have used the initial funding provided in 2015 in different ways based on the specific needs of
their student populations. UC Santa Barbara, for example, put in place the first full -time staff member at a UC food pantry in 2014. Given its experience working on food security, the campus elected to use the $75,000 to support preventative measures such as a food, nutrition and foundational skills pilot program.
UC Merced, the youngest UC campus, used its funding to support its food pantry by hiring undergraduate interns, creating food vouchers, and providing nutrition and cooking demonstration tables.
At UC Santa Cruz, the President’s funding went toward increasing registration for CalFresh, the state’s nutrition assistance program, and providing economic crisis support to students. UC Davis created a program to conduct a needs assessment to identify barriers to food security, UC Irvine built educational
programming to raise awareness about its food pantry, and UCLA worked to provide healthier food options. UC Riverside used its funds to renovate its food pantry, and UCSF purchased grocery store gift cards to use in urgent interventions. UC Berkeley expanded its food assistance programs to graduate
and professional students, while UC San Diego established the Triton Food Pantry. With the support of the Global Food Initiative, campuses were able to provide students increased access to supportive resources.
Executive Summary
07.11.16 UC GLOBAL FOOD INITIATIVE STUDENT FOOD ACCESS AND SECURITY STUDY 4
UC’S FOOD ACCESS AND SECURITY STUDY FINDINGS
Two surveys were administered online in spring 2015 to a random sample of more than 66,000 students across all 10 campuses. Of those asked to participate, 8,932 undergraduate and graduate students— a 14 percent response rate—completed the survey. Students were asked to answer questions about
instances over the prior 12 months when they had to skip or reduce the size of meals or lacked money to purchase food.
The broad term food insecurity can encompass a number of experiences—from a poor quality diet that lacks variety, to a diet with irregular eating patterns and reduced food consumption. UC’s Food Access and Security survey, which used USDA definitions, found that 19 percent of student respondents
indicated they had “very low” food security, which the USDA defines as experiencing reduced food intake at times due to limited resources. An additional 23 percent of survey respondents were characterized as having “low” food security, defined by the USDA as reduced quality, variety or desirability of diet, with little
or no indication of reduced food intake. The findings showed that food insecure students were more likely than food secure students to receive
federal nutrition assistance and need-based financial assistance, like Pell Grants andto have experienced food insecurity as a child. Although previous studies have shown that current and childhood food insecurity are related, it is important to note that the study found that 57 percent of food insecure students
were new to food insecurity, suggesting that students who are on their own for the first time may require financial literacy training and additional information about economic and food access resources, financial aid, and making healthy choices on a limited budget.
UC FOOD ACCESS AND SECURITY PLAN
In collaboration with campus food security working groups, undergraduate and graduate students, and campus leadership, and based on the results of the UC’s Food Access and Security study, the Global
Food Initiative’s Food Access and Security Subcommittee has developed an action plan designed to address food security across the University system.
UC’s Food Access and Security plan focuses on five components: on-campus student services and programming, off-campus partnerships and engagement, campus coordination, systemwide coordination, and research and data collection. UC’s plan includes:
Expanding food pantry storage and access
Integrating food preparation and secure storage space into new housing design and construction
Increasing collaboration with state and county offices to register students for CalFresh, California’s nutrition assistance program
Establishing and expanding campaigns for students on student support services and food access awareness
Providing access to mobile kitchen services
Enhancing financial aid communications about housing and food costs
Expanding existing economic crisis response teams and creating new teams to provide support and guidance to students experiencing immediate and unexpected financial hardship

07.11.16 UC GLOBAL FOOD INITIATIVE STUDENT FOOD ACCESS AND SECURITY STUDY 5
Expanding the existing Swipe Out Hunger programs, which allow university students to donate excess dollars on their meal plan to reduce hunger on campuses
Developing food voucher benefits and financial aid guidelines to support increased resources for students
Student food insecurity is both a national and global issue, and UC is addressing it head-on. The Food Access and Security study, and subsequent Food Access and Security plan, is just the first step to understanding this complex and nuanced issue. UC is dedicated to providing an equitable and
sustainable food system for the University community. To this end, the University will continue to work toward long-term solutions that improve student nutrition and enhance student success at UC.

07.11.16 UC GLOBAL FOOD INITIATIVE STUDENT FOOD ACCESS AND SECURITY STUDY 6
WHY IS FOOD INSECURITY AN EMERGING CONCERN AMONG COLLEGE STUDENTS? Within California, 14% of all households and 19% of households with children report experiencing food
insecurity as defined by the U.S. Department of Agriculture (USDA). These households report having uncertain or limited ability to get adequate food due to lack of financial resources, resulting in reduced quality, variety or desirability of the diet and, over time, reduced food intake and/or disrupted eating
patterns.1 Households reporting food insecurity are more likely than those that are food secure to be near or below the federal poverty line, to be single-parent households, and/or to be Black or Hispanic households.
Recent anecdotal reports in the U.S. suggest that college students are not always able to afford food, skipping meals to pay for books and fees.2-4 Only a few small-scale studies of food insecurity on select
U.S. college campuses have been conducted, and most have limited generalizability due to the use of convenience samples.5-10 These studies found that food insecurity among students ranged from between one-quarter to more than one-half of the students sampled.5,8, 10, 11 Among 354 undergraduate and
graduate students surveyed at a public university in Oregon,10 59% reported food insecurity. Similarly, 39% of 1,086 students surveyed at community colleges and universities in the City of New York,11 and 27% of 410 students surveyed at a public university in Hawaii5 also reported food insecurity.
There are several reasons why college students may be particularly vulnerable to food insecurity. The typical university population consists mostly of young adults, many of whom are away from home and
managing their own food and finances for the first time. These students may lack the experience, knowledge, and skills to effectively manage food resources. Additionally, decreases in state contributions to higher education, increases in tuition and other costs associated with college attendance where not
offset by increases in financial aid, as well as changes in federal financial aid policies, may affect students’ ability to afford nutritious food. Students may rely on inexpensive foods of poor nutritional quality as a result of their limited access to food markets, housing with limited facilities for storing and preparing
foods (e.g., certain residence halls, depending on the design), and limited financial resources for purchasing food. Further, due to the unique schedules and socio-cultural and institutional contexts of students, their dietary patterns, food norms, and priorities may differ from those of other adults.
Food insecurity can negatively impact students’ ability to focus, which in turn can affect academic performance.12, 13 In 2014, a study of 354 university students in rural Oregon found that academic
performance, as measured by grades, was lower among food insecure students. 10 Furthermore, a study of 810 Australian university students found that those who experienced food insecurity were three times more likely to prolong their studies due to financial difficulties than their counterparts who did not
experience food insecurity.7 In addition to reduced food intake, food insecurity can also negatively impact diet quality, leading to an inadequate intake of fruits, vegetables and dairy, as well as an insufficient intake of vitamins and minerals14 which may lead to negative health outcomes and an increase in the risk
of chronic disease over time.15, 16 Lower income students are more likely to be food insecure than their higher income peers. 9, 10 Roughly
42% of UC students receive Pell Grants, federal financial aid for students from low-income families, and more than half of UC students pay no tuition because of financial aid. 17 As a part of UC’s commitment to social mobility and access, UC also enrolls students from all educational backgrounds —44% of UC’s
undergraduate populations are first-generation college students.
Data Analysis

07.11.16 UC GLOBAL FOOD INITIATIVE STUDENT FOOD ACCESS AND SECURITY STUDY 7
Anecdotal reports and UC’s biennial undergraduate student survey have indicated that food insecurity is a serious issue for some UC students, as it is for college students across the country. Recognizing the
existence of food insecurity among college students, UC has given high priority to better understanding and remedying food insecurity among its students, including the barriers that inhibit their access to a robust and nutritious diet. As part of the Global Food Initiative, two online surveys were administered in
spring 2015 to a random sample of students across UC’s 10 campuses as part of the Food Access and Security Study. This report summarizes those survey findings, part of a broad effort to help inform potential policy and program strategies that can be implemented to ensure food security among all
UC students.
HOW WERE STUDENT DATA COLLECTED? In the spring of 2015, more than 66,000 undergraduate and graduate students across all 10 campuses
were invited to participate in the survey. Of those invited, 8,932 students completed surveys. Undergraduate and graduate students were invited to participate in an online survey in one of two ways: through the National College Health Assessment II (NCHA) survey administered by the American College
Health Association, or through an independent campus survey administered by the UC Office of the President‘s Institutional Research and Academic Planning Division. Both surveys utilized the six-item USDA food security module to assess student food insecurity. The number of students invited to
participate in the NCHA survey was determined by each respective campus. The independently administered survey invitations were based on NCHA recommendations to ensure a 95% confidence level, a confidence interval of ±3, and a typical NCHA response rate in the range of 10% to 35%. For both
the NCHA and independently administered survey, randomly selected students were sent an email containing an informed consent letter and an online link to the survey. Participating students were entered into a lottery for the prizes awarded on each campus: 20 $25 Amazon gift cards, two $125 VISA gift
cards, two computer monitors ($175 value), and one iPad mini ($400 value). Student participation was voluntary, and data were de-identified. All research activities were approved by the Institutional Review Board at UC Davis.
NCHA survey:
The NCHA survey is administered by the American College Health Association (ACHA) at the request of a university and is typically conducted every two to three years. The NCHA covers a number of topics including demographics, mental health, body weight, nutrition, physical activity, sleep, access to health
information, and health status. The NCHA survey, which takes about 25 minutes to complete, does not currently include questions related to food security. To avoid the burden an additional survey would create for students, food security questions were integrated into the administered NCHA survey.
The food security module was included as part of the NCHA survey at four UC campuses administering the survey in spring 2015: UC Davis, UC Irvine, UC Merced, and UC Santa Barbara. The online survey was open for a three week period during which weekly email reminders were sent. A total of 4,333
students participated and completed the NCHA survey, resulting in an average response rate of 13% (range: 4-21%).

07.11.16 UC GLOBAL FOOD INITIATIVE STUDENT FOOD ACCESS AND SECURITY STUDY 8
Independent survey:
To compare results with the data collected using the NCHA, the independent survey included the same food insecurity module, as well as items from the NCHA, including:
demographic, mental health, health behaviors, academic performance, and general health questions. The independent survey also included questions that were excluded from the
NCHA survey due to cost concerns. These questions asked about the use of a food bank or pantry, and the use of federal nutrition assistance. The entire survey took
approximately 10 minutes to complete and was notably shorter than the NCHA survey. The independent survey was administered at six campuses that did not participate in the
NCHA survey: UC Berkeley, UCLA, UC Riverside, UC San Diego, UC San Francisco, and UC Santa Cruz. Because the survey was implemented toward the end of the
quarter/semester, students were given a 4-week completion period, during which weekly email reminders were sent. A total of 4,599 students participated, resulting in an average
response rate of 15% (systemwide range: 10-28%). Measuring food insecurity:
The self-administered version of the six-item USDA food security module was used in both the NCHA and
independent surveys to assess student food insecurity.19 The survey includes questions about respondents’ experiences in the past 12 months, including: food running out and not
having money to buy more, affordability of eating balanced meals, cutting the size of/or skipping meals, eating less than they should, and going hungry because of a lack of money
for food. The six-item module is a subset of the U.S. Adult Household Food Security 10-item module. The six-item version has been shown to have reasonably high specificity
and sensitivity and minimal bias compared to the longer 10-item version.19 The six-item version was chosen over the longer version to minimize response burden and errors due
to skip patterns. In the self-administered version of the survey, the question about cutting meals is presented as one item
instead of two items. Respondents answered the following question: “In the last 12 months, did you ever cut the size of your meals or sk ip meals because there wasn’t enough money for food?” When using the self-administered single item about cutting meals, an affirmative response of “yes, almost every month” or
“yes, some months but not every month” is scored as two affirmative responses, and a response of yes, only one or two months is scored as one affirmative response. The sum of affirmative responses is used to generate a raw score (range: 0 to 6). Raw scores of 0-1 indicate high or marginal food security
(referred to as food security); raw scores of 2-4 indicate low food security, which is characterized by reduced quality, variety or desirability of the diet; and raw scores of 5-6 indicate very low food security, which is characterized by disrupted eating patterns and reduced food intake. Low food security and very
low food security are combined to represent food insecurity.
DEFINING FOOD SECURITY
FOOD SECURE: Raw scores of 0-1 indicate high or marginal food security,
referred to generally as “food security.”
LOW FOOD SECURITY: Raw scores of 2-4 indicate low food security, which is
characterized by reduced quality, variety or desirability of the diet.
VERY LOW FOOD SECURITY: Raw scores of 5-6 indicate very
low food security, which is characterized by disrupted eating patterns and reduced
food intake. Low food security and very low
food security are combined to represent food insecurity.

07.11.16 UC GLOBAL FOOD INITIATIVE STUDENT FOOD ACCESS AND SECURITY STUDY 9
After the food insecurity questions about the past 12 months, students were asked two questions about food insecurity in their family as a child. These questions asked about worries over food running out, as
well as worries about food running out and not having money to buy more. An affirmative response (“sometimes” or “often true”) to one or both questions was characterized as childhood food insecurity 17. Based on a conceptual model of potential factors contributing to and resulting from food insecurity in
college students (Appendix), additional questions were asked about current access to food, primary food sources, barriers to food access, use and access to on- and off-campus food resources, and potential consequences of food insecurity. To the extent possible, these additional questions were taken from
existing survey instruments. This series of questions were included in order to explore the relationship between childhood food insecurity and food insecurity as a college student.
An initial draft of the survey was pilot-tested among 30 students from three UC campuses. Students were recruited from classes as well as from campus food pantries in order to include a diverse sample. After completing the questionnaire, students were asked a series of questions using a structured interview
script about the clarity and meaning of the questions. The research team reviewed the interview responses and revised the survey accordingly.
Data presented in this report include UC systemwide data. Internal consistency of the UC sample responses to the food insecurity questions was examined using Cronbach’s alpha; results showed a high level of internal consistency (α = 0.86). The pattern of responses in the UC sample was also compared
with national data collected using the U.S. Current Population Survey Food Security Supplement (CPP -FSS)—the gold standard for assessing food insecurity in the U.S.—by experts at USDA. Findings showed that the items used to collect food insecurity data in the UC population performed reasonably well relative
to the data from CPS-FSS. Sample weights were constructed so that data from each UC campus would collectively represent the
target population: the entire UC student population. Sample weights were a function of the reported fall enrollment for academic year 2014-15 for each campus divided by the sample size obtained for that campus. These weights were then rescaled so that the sum of the rescaled weights was equivalent to the
total sample size. In this report, the UC systemwide weighted results are used to describe food insecurity among students across the 10 campus system.
Additional sample weights were constructed so that each UC campus would collectively represent the race/ethnicity distribution of the entire UC population, and another set of sample weights were constructed based on gender (limited to male and female). Lastly, another set of sample weights were
created to represent undergraduates on each UC campus that had been awarded any need-based financial aid.1 These sample weights were applied to estimate and compare the prevalence of food insecurity with the calculated prevalence of food insecurity when weighted by campus size. The
construction of accurate weights to correct for all factors (campus size, race/ethnicity, sex and 'receipt of financial aid') were not obtained as many of the resulting sample cells would have inadequate sample size (n<10) for the proper construction of these weights.
All descriptive statistics were summarized using IBM SPSS Statistics for Windows, Version 22.0 (Armonk, NY: IBM Corp). A linear regression analysis was performed to examine the relationship between food
insecurity and response rate with and without controlling for other variables. The prevalence of food insecurity was not associated with response rate. Chi-square test statistics, using sampling weights based on enrollment numbers, were used to examine the relationship between food insecurity status and
student characteristics UC systemwide.
1 UC systemwide f inancial aid information w as available for undergraduate but not graduate students.

07.11.16 UC GLOBAL FOOD INITIATIVE STUDENT FOOD ACCESS AND SECURITY STUDY 10
WHO WERE THE UC STUDENTS SURVEYED?
A total of 8,932 students were surveyed across all UC campuses. The majority were undergraduate students (73%), 18-24 years of age (76%), with 66% being female and 33% male. About a third of participants identified as Asian (34%), 31% as white, 21% as Hispanic, 12% as mixed race/other, and 2%
as Non-Hispanic Black.
Although health insurance is required for all UC undergraduate, graduate, and
professional students as a non-academic condition of enrollment, self-reported student health insurance plans varied
among survey respondents. Systemwide, 47% of respondents were under the college plan, 44% enrolled under a parent’s plan,
and 8% under a different plan; 0.6% did not have insurance and 0.7% did not know their insurance status.
All registered students attending UC Davis, UC Irvine, UCLA, UC Merced, UC San
Diego, UC San Francisco, and UC Santa Cruz are automatically enrolled in the UC Student Health Insurance Plan (SHIP) and
costs are charged to their tuition bill. Students who already have medical insurance that meets the University’s criteria
may request a waiver. All students have access to on-campus student health services, whether they have UC SHIP
or not.

07.11.16 UC GLOBAL FOOD INITIATIVE STUDENT FOOD ACCESS AND SECURITY STUDY 11
HOW MANY AND WHICH STUDENTS REPORTED EXPERIENCING FOOD INSECURITY?
Nearly 20% of students reported experiencing very low food security. The UC Food Security and Access Study found that 19% of UC student respondents had very low food
security, which the U.S. Department of Agriculture defines as experiencing reduced food intake at times due to limited resources. Another 23% of survey respondents were considered to have low food security, defined as reports of reduced quality, variety or desirability of diet, with little or no indication of reduced
food intake. Using the USDA’s definition of food insecurity, which combines low and very low food security, a combined 42% of students UC systemwide reported having experienced a reduced quality of diet or reduced food intake in the past 12 months (Figure 2). When weighted for campus size and gender
(female and male), the prevalence of low and very low food security among respondents did not change (42%). When weighted for campus size and race/ethnicity, the prevalence of low and very low food security was slightly lower (39%).
In addition to questions on food insecurity in the past 12 months, students were asked about food security during their childhood. The
survey included two questions about running out of food, or worrying about food running out without having enough money to buy more.
Based on responses to these two questions,20 –which were only included in the independently administered survey—the
estimated prevalence of childhood family food insecurity was 23% UC systemwide.
Based on data collected from the six UC campuses that completed the independent survey, 17% of survey respondents reported
receiving federal nutrition assistance (e.g., from the Supplemental Nutrition Assistance Program, known as SNAP or CalFresh in
California, and formerly referred to as food stamps) in the past but not currently, compared to 2% receiving benefits currently.2
2 Questions on SNAP w ere not included in the NCHA administered survey.

07.11.16 UC GLOBAL FOOD INITIATIVE STUDENT FOOD ACCESS AND SECURITY STUDY 12
Food insecurity higher among undergraduate students when compared to graduate students.
The UC systemwide prevalence of low (25%) and very low (23%) food insecurity experienced in the past 12 months was 48% for undergraduate-level students, compared to 25% for graduate-level students. Among graduate students, 9% had very low food security and 16% had low food security. When the data
was weighted for any financial aid awarded to undergraduate students, the prevalence of undergraduate students systemwide who faced a reduced quality of diet or reduced food intake was 49%.
Food insecurity varied by race and ethnicity, but not by gender.
When examining food insecurity, including experiences of reduced quality, variety or desirability of diet, by race/ethnicity categories UC systemwide, Hispanic and Non-Hispanic Black students experienced a higher prevalence of food insecurity (59% and 60%, respectively) compared to other groups—similar to
trends in food insecurity nationally.1 Food insecurity, including experiences of reduced quality, variety or desirability of diet, was lower among Asians, mixed race/other and whites (41%, 44%, 30%, respectively). Food insecurity, including experiences of reduced quality, variety or desirability of diet, was similar for
female and male students UC systemwide (42% and 41%, respectively3).
3 Post-hoc analysis showed no signif icant differences in the food insecurity prevalence between males and females.

07.11.16 UC GLOBAL FOOD INITIATIVE STUDENT FOOD ACCESS AND SECURITY STUDY 13
Current and childhood food insecurity were related, but most students new to food insecurity.
In the next several sections, the characteristics of students UC systemwide are compared based on food security status (food secure vs. food insecure in the past 12 months) among the 8,705 students with complete socio-demographic data4. In this subsample, 5,267 students (61%) were food secure and 3,438
(39%) reported having low or very low food security. UC systemwide, students who were food insecure, including those including those experiencing reduced quality, variety or desirability of diet, in the past 12 months were more likely to have experienced food insecurity as a child (43%), compared to food secure
students (8%) (Figure 4). However, most food insecure students (57%) did not report experiencing food insecurity as children.
4 Approximately 3% of students UC systemw ide were missing data on one or more socio-demographic variables.

07.11.16 UC GLOBAL FOOD INITIATIVE STUDENT FOOD ACCESS AND SECURITY STUDY 14
Food secure and food insecure students differed on socio-demographic characteristics.
Compared to food secure students, a significantly higher proportion of food insecure students, including those experiencing reduced quality, variety or desirability of diet, were 18 to 24 years old (82% vs. 71%), undergraduates (84% vs. 65%), in their second through fourth year of study, Hispanic (29% vs. 15%),
and Non-Hispanic Black (3% vs. 2%) (Figure 5). About 16% of food insecure students were graduate students.
07.11.16 UC GLOBAL FOOD INITIATIVE STUDENT FOOD ACCESS AND SECURITY STUDY 15
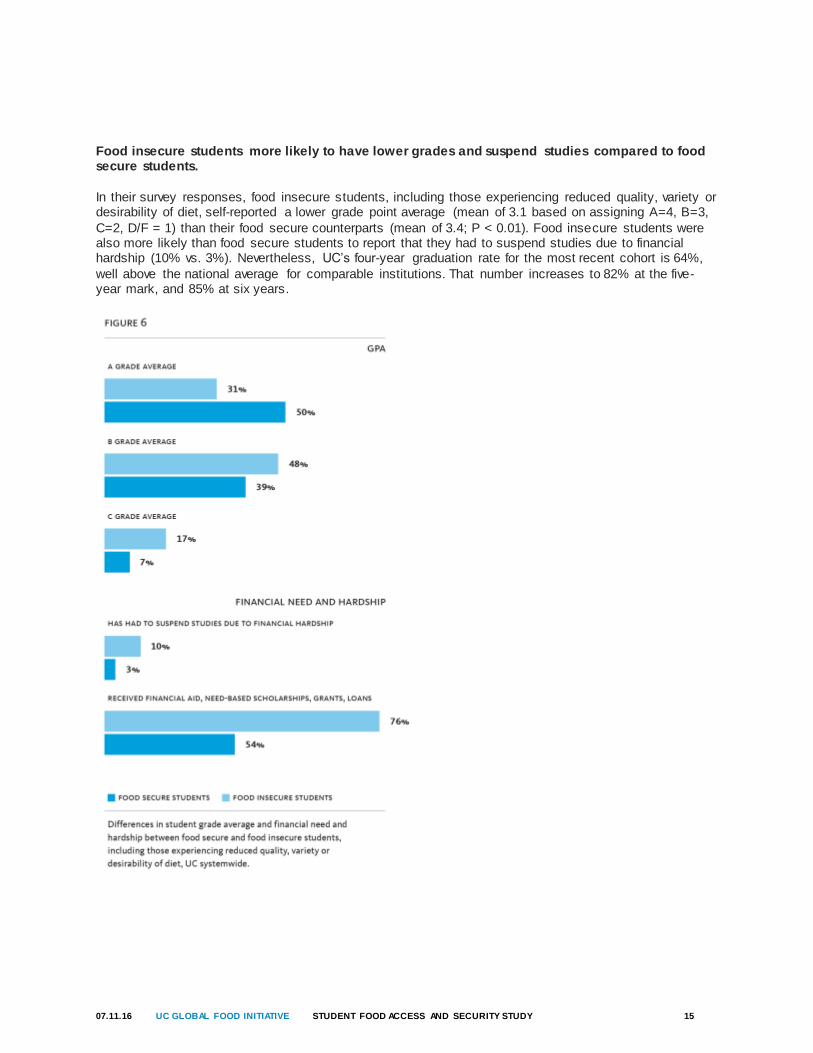
Food insecure students more likely to have lower grades and suspend studies compared to food secure students.
In their survey responses, food insecure students, including those experiencing reduced quality, variety or desirability of diet, self-reported a lower grade point average (mean of 3.1 based on assigning A=4, B=3,
C=2, D/F = 1) than their food secure counterparts (mean of 3.4; P < 0.01). Food insecure students were also more likely than food secure students to report that they had to suspend studies due to financial hardship (10% vs. 3%). Nevertheless, UC’s four-year graduation rate for the most recent cohort is 64%,
well above the national average for comparable institutions. That number increases to 82% at the five-year mark, and 85% at six years.

07.11.16 UC GLOBAL FOOD INITIATIVE STUDENT FOOD ACCESS AND SECURITY STUDY 16
WHAT HAPPENS WHEN STUDENTS DO NOT HAVE ENOUGH MONEY FOR LIVING EXPENSES?
Compared to food secure students, food insecure students more likely to prioritize cost over the healthfulness of food.
Students were asked about the potential consequences of not having enough money and having to choose between food and their living expenses in the past year. Among UC respondents systemwide, the most prevalent consequence of not having enough money was purchasing the cheapest food even
though it was not the healthiest (43%). Students also reported asking family or friends for money to cover their costs (22%) and/or experiencing difficulty studying because of hunger (13%) were also among the most common consequences reported by students (Figure 7). Anecdotal reports also indicate that
students may also need to balance spending money on food for themselves with providing their family with financial support.

07.11.16 UC GLOBAL FOOD INITIATIVE STUDENT FOOD ACCESS AND SECURITY STUDY 17
A smaller number of students reported that they were forced to choose between food and medicine/care, housing/utilities and educational expenses either some or all months in the past year. Food insecure
students, including those experiencing reduced quality, variety or desirability of diet, reported experiencing the potential consequences of not having enough money—such as choosing the cheapest food knowing it wasn’t the healthiest, or asking friends and family to help cover expenses —more
frequently than food secure students (Figure 8).

07.11.16 UC GLOBAL FOOD INITIATIVE STUDENT FOOD ACCESS AND SECURITY STUDY 18
DO STUDENTS HAVE ACCESS TO INFORMATION ABOUT CAMPUS FOOD ASSISTANCE?
Students, particularly those who are food insecure, would like more information about how to improve food resources.
Students were asked if they had received information from the University or student groups about how to apply for food assistance, where to find local food pantries and banks, how to cook simple and healthful meals, and how to manage their budget (Figure 9). Response options for each of these questions were:
received and used, received but didn't need, not received but would like, and not received and didn’t need. UC systemwide, students most commonly reported that they wanted, but had not received, information about the following: how to cook (48%) and live (46%) on a budget, and who to speak to on
campus about not having enough food (31%).

07.11.16 UC GLOBAL FOOD INITIATIVE STUDENT FOOD ACCESS AND SECURITY STUDY 19
Overall, the proportion of both food secure and food insecure students—including those experiencing reduced quality, variety or desirability of diet—who had received and used information was low (Figure
10). More food insecure students were interested in receiving information about all topics included in the survey compared to food secure students.

07.11.16 UC GLOBAL FOOD INITIATIVE STUDENT FOOD ACCESS AND SECURITY STUDY 20
WHERE DO STUDENTS ACCESS FOOD?
Students were asked to think about the spring 2015 semester/quarter and answer questions about how often they obtained groceries or prepared foods from a list of common sources. Responses ranged from very often to never. UC systemwide, two-thirds (65%) of students reported often (very often and often
answers combined) accessing food at grocery stores or supermarkets. Next, students reported often getting food from non-fast food restaurants (29%), a university meal plan outlet (25%), and warehouses/ superstore (23%).
Some students procured food from their parent’s/parents’ home (UC systemwide, 18% from fast food restaurants (UC systemwide, 15%); and from university outlets without a meal plan
(UC systemwide, 13%). Less than 10% of students obtained food from farmers’ markets (UC systemwide, 8%), corner/
convenience stores (UC systemwide, 8%), a friend’s home (UC systemwide, 6%), on-campus food pantry/free food program (UC systemwide, 5%), garden or outdoor venues (UC systemwide, 3%), fraternity/sorority home (UC systemwide, 3%), and/or off-campus food pantry/free food
(UC systemwide, 3%).

07.11.16 UC GLOBAL FOOD INITIATIVE STUDENT FOOD ACCESS AND SECURITY STUDY 21
Food insecure students were more likely to seek free food and purchase fast food than food secure students.
The locations where students purchase or procure food were examined by food security level (Figure 12). Although most students, regardless of food security status, patronized grocery stores, non-fast food
restaurants and warehouse/superstores, significantly more food insecure s tudents, including those experiencing reduced quality, variety or desirability of diet, reported getting food from fast food restaurants (21%), on- or off- campus free food events (17%), and on- or off-campus food pantry (12%)
when compared to students not reporting food insecurity (10%, 8%, and 3%, respectively).

07.11.16 UC GLOBAL FOOD INITIATIVE STUDENT FOOD ACCESS AND SECURITY STUDY 22
WHAT CHALLENGES DO STUDENTS FACE IN ACCESSING FOOD?
Students report cost, preparation, and time as challenges to accessing food. Students were asked about circumstances that made it difficult to obtain the food that they wanted in the
current semester/quarter. UC systemwide, students reported often (often or very often) experiencing the following barriers to accessing food they wanted: cost (39%), lack of time to prepare food (48%), and lack of time to shop for food (46%). Food insecure students, including those experiencing reduced quality,
variety or desirability of diet, reported more often experiencing the following barriers to food access than food secure students: cost (46% vs. 38%), lack of time to prepare foods (52% vs. 46%), and lack of time to shop for food (49% vs. 44%).
07.11.16 UC GLOBAL FOOD INITIATIVE STUDENT FOOD ACCESS AND SECURITY STUDY 23
STUDY LIMITATIONS AND STRENGTHS
The online surveys used in the current study were administered to a randomly selected sample of UC students from each campus in an effort to get a sample that was representative of the systemwide student population. Based on several demographic factors (e.g., age, race/ethnicity), the survey sample
appears comparable to the University’s overall student enrollment, with the exception of gender5. Women were overrepresented in the survey sample population. We used campus size weights to make the findings more representative of the entire UC student population, which resulted in a food insecurity
prevalence of 42%. When we further weighted for gender, the prevalence of food insecurity remained at 42%; when weighted for race/ethnicity food insecurity was 39%. These analyses suggest that the low and very low food insecurity prevalence of 42% is a reasonable estimate for the UC student population. When
weighted for receipt of any financial aid awarded to undergraduate students, the food insecurity prevalence was 49% compared to the 48% when weighted only for campus size.
The overall average online survey response rate of 14% is in the lower end of the range of 10% to 35% 6 reported for most NCHA online surveyors.17 However, this response rate is higher when compared to many public opinion phone polls, which have observed decreasing response rates over time.21 For
example, at Pew Research, a typical response rate to a phone survey in 1997 was 36%, but is now just 9%.19 A recent study of higher education surveys found that response rates as low as 5% and up to 25% with samples sizes of at least 1,000 participants did not result in significant bias. 22 In this 10-campus
sample of UC students, the prevalence of food insecurity was not related to campus response rate, suggesting that within the variation in response rates observed (4% to 26%), response rate did not bias prevalence estimates. While a higher response rate is desirable, the level of response required to provide
reasonably accurate and unbiased information is not well characterized.21, 23 The literature on response rates suggests that survey invitation by phone or regular mail results in higher rates than by email invitation.24, 25 Due to resource constraints and concerns regarding student survey fatigue, particularly
among undergraduate students, the researchers took advantage of an existing online survey administered by the ACHA at several UC campuses in spring 2015.
Even though the prevalence of food insecurity was not associated with response rate, it remains possible that non-respondents were systematically different than respondents in terms of food insecurity. The prevalence of food insecurity would be an overestimate if students for whom food insecurity is an issue
were more likely to respond than students who are not experiencing food insecurity. For example, study incentives may have encouraged food insecure students to participate more than food secure students. We may have experienced response bias in the different administrations of the survey - the prevalence of
food insecurity for the NCHA administration (38%) was significantly lower than the prevalence for the independent survey (45%; chi-square test significant at p<0.001). The independent survey focused solely on food access and may have appealed differently to students based on their food security status. The
NCHA survey focused on student health, asking questions related to food insecurity at the end of the survey. This structure meant that students would not have known that food access was a topic until they had nearly completed the survey.
Due to resource constraints, it was not possible to include questions on all possible factors of interest. For example, in future studies it would be important to examine whether food insecurity is more or less of an
issue among first generation college students, and/or among middle class students. UC’s four-year graduation rate for the most recent cohort is 64%, which is well above the national average for comparable institutions. Future studies may wish to consider longitudinally examining food insecurity in a
cohort of students to examine whether food insecurity among students persists over time, including after graduation, as well as the relationship between student food insecurity and time to graduate or failure to graduate. Housing insecurity and its relationship to food insecurity is another emerging area of concern.
5 More females than males responded to the survey. It should be noted, how ever, that the prevalence of food insecurity, though statistically different, was very similar betw een males (43%) and females (44%). 6 The average response rate for NCHA nationally w as 18% in spring 2015 (Dr. Mary Hoban, Director, ACHA -NCHA Program Office,
personal communication).

07.11.16 UC GLOBAL FOOD INITIATIVE STUDENT FOOD ACCESS AND SECURITY STUDY 24
The survey was unable to account for seasonal variations in food insecurity—students were not asked if they experienced food insecurity over summer/winter breaks or when classes are in session. Likewise, we
were not able to account for differences in responses due to timing within the quarter or semester (e.g., closer or during final exams). Finally, we cannot rule out that students interpreted the food insecurity questions differently than other adults. This concern is mitigated, however, by the fact that the UC data
collected on food insecurity performed reasonably well and similar to nationally representative data on household food insecurity in the U.S.7
The random selection of students and the large sample size are study strengths, and to our knowledge this may be the largest study of food insecurity among undergraduate and graduate university students in the U.S. Additional strengths include representation from all 10 UC campuses and use of a questionnaire
to assess food insecurity that has been developed and validated by the USDA and that is widely used to generate nationally representative estimates of food insecurity, a version of which has also been used in most of the prior studies of college students. Additional survey items were pilot -tested among 30 students
at three UC campuses to increase face validity.
7 Alisha Coleman-Jenson and Matthew Rabbitt w ith the USDA, personal communication regarding data quality and comparability
assessment of UC data w ith data collected in the U.S. Current Population Survey Food Security Supplement.

07.11.16 UC GLOBAL FOOD INITIATIVE STUDENT FOOD ACCESS AND SECURITY STUDY 25
Student food insecurity is a national issue that UC is addressing head-on. The Food Access and Security study is an early step toward addressing this complex and nuanced issue. In collaboration with food security working groups established on each campus, undergraduate and graduate students, and campus
leadership, and based on a survey of UC students, the Food Access and Security Subcommittee has developed an action plan designed to address food insecurity across the University system. Through ongoing collaboration and targeted actions, UC will continue to explore the most effective approaches to
addressing this crucial issue, ultimately serving as a food security model for other public higher education institutions across the nation and beyond.
Each campus working group will develop an implementation plan that targets the specific needs of its student population, building on existing efforts. These plans will outline funding allocations for direct programming, services and materials to accomplish model objectives. They will include campus in-kind
support for food access and security efforts. This collaboration sets in motion a “UC Food Security Model,” a comprehensive set of programs and resources to support student success across our campuses.
On-Campus Student Services and Programming
In order to develop effective strategies that support basic student needs, including increased access to healthy food options, supplemental financial assistance to students in urgent circumstances, and better coordination with campus dining programs, the University will work to:
Increase awareness about resources on campuses and increase the visibility of food pantries.
Create workshops to educate students about strategies to support basic needs, such as cooking
nutritious foods on a limited budget.
Provide dedicated spaces for students to store and prepare food, while also expanding existing
campus food pantries.
Develop and train campus food security crisis response teams.
Off-Campus Partnerships and Engagement Few UC students purchase meal packages beyond their first year as a student, meaning they may need
help identifying locations in surrounding campus communities that will allow them to maximize food budgets and access available support services. To support this effort, the University will work to:
Identify and establish relationships with community partners to maximize and share resources.
Partner with food banks, non-governmental organizations, and county health and human services
offices to expand programming and awareness efforts.
Identify and establish relationships with regional food banks and food-gleaning entities in order to develop viable campus food security partnerships.
UC’s Response

07.11.16 UC GLOBAL FOOD INITIATIVE STUDENT FOOD ACCESS AND SECURITY STUDY 26
Campus Coordination
It is vital that the University establish clear roles for undergraduate and graduate leadership, professional staff, faculty, campus administrators, and external stakeholders to ensure students are food secure. To coordinate these efforts, the University will:
Communicate with students to ensure those in need understand how to access support and services tailored to their individual situations.
Determine how food security campus committee roles are defined and ensure they reflect all campus stakeholders, including undergraduate and graduate students, faculty, staff, administration, and subject matter experts.
Utilize social media platforms, websites, campus newsletters, as well as print outlets to make information about staff, programs, resources, and efforts related to food security easily identifiable
to students. Research and Data Collection
Data is at the center of UC’s work to understand and address food security on its campuses. To identify best practices for capturing data and using it to inform support services, the University will:
Create systemwide tools and guidelines for collecting data and measuring impact.
Establish clear procedures for accessing, managing, and analyzing student food security information across departments and campuses.
Develop graduate and undergraduate student internships to advance academic research and build
student leadership on issues related to food security. Systemwide Coordination
To ensure that the entire UC community—including campuses, the Office of the President, student groups and external stakeholders—is proactively communicating and coordinating the implementation of
the University’s food security model, the University will:
Identify effective practices and reoccurring challenges, providing technical assistance and
implementation support across the system.
Work with Financial Aid and Student Affairs offices to better understand how financial aid packages are created and communicated to student populations to ensure effective messaging.
Develop guidelines that can be used across Financial Aid offices to define emergency relief policies and processes to address student needs within institutional procedures and governing regulations.
UC is dedicated to providing an equitable and sustainable food system for the University community. As a part of this effort, President Napolitano has renewed her commitment to the issue of food security by
addressing barriers that inhibit food access. The proposed Food Security Model was developed as the recommended approach to support the President’s continuing efforts. President Napolitano has approved total funding of more than $3.3 million over two years, including $151,000 per campus, per year, to tackle
food insecurity across the system. To this end, the University will continue to work toward long-term solutions that improve student nutrition and enhance student success at UC.

07.11.16 UC GLOBAL FOOD INITIATIVE STUDENT FOOD ACCESS AND SECURITY STUDY 27
1. Coleman-Jensen A, Rabbitt MP, Gregory C, Singh A. Household Food Security in the United
States in 2014, ERR-194: U.S. Department of Agriculture, Economic Research Service; September, 2015.
2. Bahrampour T. More college students battle hunger education and living costs rise. The Washington Post 2014 April 9, 2014.
3. Schallhorn K. Rising cost of college prompt schools to open food pantries for hungry students. 2014 April 9, 2014 [cited 2014 April 10]; Available from: www.campusreform.org/?ID=5533
4. Eltman F. Food pantries on the rise at college campuses as tuitions increase. Huffington Post 2014 Mar 3, 2013.
5. Chaparro MP, Zaghloul SS, Holck P, Dobbs J. Food insecurity prevalence among college students at the University of Hawai'i at Manoa. Public Health Nutr 2009;12(11):2097-2103.
6. Hughes R, Serebryanikova I, Donaldson K, Leveritt M. Student food insecurity: The skeleton in the university closet. Nutrition & Dietetics 2011;68(1):27-32.
7. Gallegos D, Ramsey R, Ong K. Food insecurity: Is it an issue among tertiary students? Higher Education 2014;67(5):497-510.
8. Maroto M. Food insecurity among community college students: Prevalence and relationship to GPA, energy, and concentration: Morgan State University; 2013.
9. Micevski DA, Thornton LE, Brockington S. Food insecurity among university students in Victoria: A pilot study. Nutrition & Dietetics 2014;71(4):258-264.
10. Patton-Lopez MM, Lopez-Cevallos DF, Cancel-Tirado DI, Vazquez L. Prevalence and Correlates of Food Insecurity Among Students Attending a Midsize Rural University in Oregon. Journal of Nutrition Education and Behavior 2014;46(3):209-214.
11. Freudenberg N, Manzo L, Jones H, Kwan A, Tsui E, Gagnon M. Food insecurity at CUNY:
Results from a survey of CUNY undergraduate students. Campaign for a Healthy CUNY. In. New
York, NY; 2011.
12. Hadley C, Crooks DL. Coping and the biosocial consequences of food insecurity in the 21st
century. American Journal of Physical Anthropology 2012;149:72-94.
13. Jyoti DF, Frongillo EA, Jones SJ. Food insecurity affects school children's academic
performance, weight gain, and social skills. Journal of Nutrition 2005;135(12):2831-2839.
14. Smith C, Richards R. Dietary intake, overweight status, and perceptions of food insecurity among
homeless Minnesotan youth. American Journal of Human Biology 2008;20(5):550-563.
15. Olson CM, Strawderman MS. The relationship between food insecurity and obesity in rural
childbearing women. Journal of Rural Health 2008;24(1):60-66.
16. Townsend MS, Peerson J, Love B, Achterberg C, Murphy SP. Food insecurity is positively related
to overweight in women. Journal of Nutrition 2001;131(6):1738-1745.
References

07.11.16 UC GLOBAL FOOD INITIATIVE STUDENT FOOD ACCESS AND SECURITY STUDY 28
17. University of California. UC enrolls a diverse pool of undergraduates. 2015 [cited 2015 Novmber 12]; Available from: http://universityofcalifornia.edu/infocenter/uc -enrolls-diverse-pool-
undergraduates
18. The Trustees of Columbia University in the City of New York. California demographics of low-
income children. National Center for Children in Poverty 2014; Available from: http://www.nccp.org/profiles/CA_profile_6.html
19. U.S. Department of Agriculture Economic Research Service. Food Security in the U.S.: measurement. 2013 August 2013 [cited 2014 April 10]; Available from: www.ers.usda.gov/topics/food-nutrition-assistance/food-security-in-the-
us/measurement.aspx#measurement
20. Hager ER, Quigg AM, Black MM, Coleman SM, Heeren T, Rose-Jacobs R, et al. Development
and Validity of a 2-Item Screen to Identify Families at Risk for Food Insecurity. Pediatrics 2010;126(1):e26-e32.
21. Holbrook A, Krosnick J, Pfent A, editors. In Advances in Telephone Survey Methodology John Wiley & Sons, Inc.: Hoboken, NJ; 2007.
22. Fosnacht K, Sarraf S, Howe E, Peck L. How important are high response rates for college surveys? In: The annual forum of the Association for Institutional Research. Long Beach, CA; 2013, May.
23. Pew Charitable Trusts. Assessing the Representativeness of Public Opinion Surveys . 2015 [cited
2015 May 15]; Available from: http://www.people-press.org/2012/05/15/assessing-the-
representativeness-of-public-opinion-surveys/
24. Sinclair M, O'Toole J, Malawaraarachchi M, Leder K. Comparison of response rates and cost-
effectiveness for a community-based survey: postal, internet and telephone modes with generic or personalised recruitment approaches. BMC Med Res Methodol 2012;12:132.
25. Pit S, Vo T, Pyakurel S. The effectiveness of recruitment strategies on general practitioner's survey response rates - a systematic review. BMC Med Res Methodol 2014;14:76.
26. Public Policy Institute of California. Higher Education in California: Institutional Costs. Available from: http://www.ppic.org/main/publication_quick.asp?i=1119
27. American Academy of Arts and Sciences. Public Research Universities: Change in State Funding. In: The Lincoln Project: Excellence and Access in Public Higher Education; 2015.
28. University of California. UC Mandatory Student Charge Levels. Available from: http://ucop.edu/operating-budget/_files/fees/documents/history_fees.pdf
29. University of California. Tuition and cost of attendance. Available from: http://admission.universityofcalifornia.edu/paying-for-uc/tuition-and-cost/
30. Kelchen R. Exploring the topic of indirect costs to today’s higher education students; August 2015.
31. Kelchen R, Hosch B, Goldrick-Rab S. The costs of college attendance: trends, variation, and accuracy in institutional living cost allowances; October 2014.
07.11.16 UC GLOBAL FOOD INITIATIVE STUDENT FOOD ACCESS AND SECURITY STUDY 29
32. Kelchen R, Hosch B, Goldrick-Rab S. The costs of college attendance: Trends, variation, and consistency in institutional living cost allowances. Educational Researcher in press.
33. National Association of Student Financial Aid Administrators. Developing the cost of attendance;
June, 2013.
34. Feeding America. Map the Meal Gap 2015. 2015; Available from:
http://www.feedingamerica.org/hunger-in-america/our-research/map-the-meal-gap/2013/map-the-
meal-gap-2013-exec-summ.pdf
35. University of California. UC's commitment to social mobility. 2015; Available from:
http://universityofcalifornia.edu/infocenter/ucs-commitment-social-mobility
36. New York Times. Top Colleges Doing the Most for Low-Income Students. 2015 [cited 2015 Sept.
16]; Available from: http://www.nytimes.com/interactive/2015/09/17/upshot/top-colleges-doing-the-most-for-low-income-students.html?_r=1
37. Rosenberg A. UC focuses on student food security. 2015 [cited 2015 May 15]; Available from: http://universityofcalifornia.edu/news/uc-focuses-student-food-security
38. University of California Global Food Initiative. [cited 2015 Nov. 1]; Available from: http://universityofcalifornia.edu/global-food-initiative
39. UCnet. UC Fair Wage/Fair Work Plan. 2015; Available from: http://ucnet.universityofcalifornia.edu/compensation-and-benefits/fairwage/index.html
40. Carnevale A, Smith N, Strohl J. Recovery: Job growth and education requirements through 2020: Georgetown Public Policy Institute; June, 2013.