strategy realisation in face ofmarket challenges · 2012-02-09 · 2q11 6,8 1q11 6,4 4q10 7,5 fuel...
TRANSCRIPT

1
Strategy realisation in face of market challengesPKN ORLEN consolidated financial results for 4 quarter 2011
Jacek Krawiec, CEO
Sławomir Jędrzejczyk, CFO
9 February 2012

2
Agenda
Achievements in 2011
Macroeconomic environment
Financial and operating results in 4Q 2011
Liquidity
Energy and upstream
�
Summary of 2011

33
Financial parameters
� Tough macro environment:
� increase in crude oil price by 40% (y/y) to 111 USD/bbl.
� strong depreciation of PLN against USD and EUR.
� decrease in model refining margin and URAL/Brent differential in total by
(-) 1,4 USD/bbl (y/y) to 3,8 USD/bbl.
� increase in petrochemical margin by 11 EUR/t (y/y) to 705 EUR/t.
� Over PLN 900m operating profit acc. LIFO
� Significant positive impact of one-offs:
� PLN 2,3 bn non-cash inventory revaluation effect.
� PLN 2,3 bn profit form sales of Polkomtel.
Good liquidity situation
� Debt reduction by PLN 0,2 bn (y/y) to PLN 7,6 bn, financial gearing to the safe
level of 29,6% and covenant: net debt / (EBITDA + dividend from Polkomtel) to
1,29.
� Financing of PKN ORLEN secured for the next 5 years due to signing credit
agreements for the total amount of almost EUR 2,9 bn.
� Fitch maintained stable rating of financial standing at BB+.
PKN ORLEN achievements in 2011

44
PKN ORLEN achievements in 2011
Operational parameters
� 27,8 mt crude oil throughput i.e. (-) 1% (y/y) due to carried out maintenance
shutdowns of key installations.
� Increase in throughput capacity in Plock refinery from 15,1 mt/y to 16,3 mt/y as
a result of launching Europe’s most advanced petrochemical PX/PTA complex in
2Q 2011.
� Sales volumes increase in total by 4% (y/y) to record-high level of 35,5 mt,
achieved in all segments.
� Realisation of National Index Target for 2011 settled at the level of 6,20%.
� Advanced preparation of building power plant up to 500 MWe in Wloclawek
investment.
� Finalisation of first vertical well on shale gas concession.
� Signing strategically important agreements for:
� crude oil supplies to Płock until the end of 2014.
� import of ca. 90 m m3 of natural gas from Germany (ca. 8% of PKN
ORLEN’s yearly needs).
� reloading of petroleum products – long-term contract until the end of
2024 signed between ORLEN Lietuva and Klaipedos Nafta.

5
Agenda
Achievements in 2011
Macroeconomic environment
Financial and operating results in 4Q 2011
Liquidity
Energy and upstream
�
Summary of 2011

6
Decrease in total of refining margin and U/B diff by 35%
Model refining margin and Ural/Brent differential, USD/bbl
Petrochemical margin decrease by 9%
Model petrochemical margin, EUR/t
Crude oil price increase by 26%
Average Brent Crude Oil price, USD/bbl
Unfavourable macro environment in 4Q 2011 (y/y)
PLN depreciation against USD and EUR
EUR/PLN and USD/PLN exchange rate
109113117105
87
+ 22 USD/bbl
4Q113Q112Q111Q114Q10
1,5
2,9 2,9 0,7
- 1,7 USD/bbl
4Q11
3,1
2,8
0,3
3Q11
3,4
2,7
2Q11
4,3
1,4
1Q11
4,4
1,5
4Q10
4,8
3,3
609663795751
667
- 58 EUR/t
4Q113Q112Q111Q114Q10
USD/PLNEUR/PLN
31.12.10 31.03.11 30.06.11
2,96
3,96 4,01
2,82
3,99
2,75
margindifferential
30.09.11
4,41
3,26
31.12.11
4,42
3,42

7
GDP increase1
Change (%) to respective quarter of last yearFuel consumption (diesel, gasoline)
mt
Diesel Gasoline
1 Poland – Statistical Office (GUS) / not unseasonal data; (Germany, the Czech Rep., Lithuania) – Eurostat / unseasonal data, 4Q2011: estimates. 2 Estimates.
Lower GDP growth and high prices influence fuel consumption
Poland
Germany
Czech Rep.
Lithuania
+ 3%
+ 1%
5,054,90
8,498,37
- 1%
+ 5%
1,001,01
3,233,08
0,950,96
- 6%0%
0,420,45
1Q114Q10 4Q10 4Q112
- 12%- 3%
0,060,070,280,28
2Q11 4Q10 4Q112
1,52,22,82,71,2-1,5
2,62,94,63,8
1,5-1,8
4,24,34,54,7 4,1-4,3
7,36,56,8
4,66,0-6,5
3Q11 4Q11

8
Agenda
Achievements in 2011
Macroeconomic environment
Financial and operating results in 4Q 2011
Liquidity
Energy and upstream
�
Summary of 2011

9
Over PLN 100 bn of revenues in 2011
4Q10 4Q11 � Increase of revenues in 2011 by 28%
(y/y): sales growth, crude oil price
increase and weakening of PLN against
foreign currencies.
� Decrease of EBIT acc. to LIFO in 2011
by PLN (-) 0,8 bn (y/y): worsening of
macroeconomic factors in refining,
pressure on retail margin due to high
fuel prices and impairment on assets in
4q11 for PLN (-) 0,6 bn.
� LIFO effect in amount of PLN 2,3 bn:
significant crude oil price increase in
2011 and simultaneous weakening of
PLN against USD.
� PLN (-) 1,5 bn of negative foreign
exchange differences referred to debt
revaluation, other positions and
interests in 2011.
� PLN 2,3 bn of capital gain from
Polkomtel sale booked in financial
revenues.
3Q11
128
778747
- 0,6 bn
-531
216248
- 0,8 bn
1 285
-249
544
+ 0,7 bn
Revenues
Operating profit (EBIT)
PLN m
Net result
+ 31%
29 97628 68222 931
Operating profit (EBIT)
according to LIFO
12M1112M10
+ 0,1 bn
3 2543 123
- 0,8 bn
9051 715
+ 0,6 bn
3 1032 455
+ 28%
106 97383 547

10
4Q10 3Q11 4Q11 change y/y PLN m 12M10 12M11 change y/y
1 343 1 392 763 -43% EBITDA 5 546 5 634 2%
747 778 128 -83% EBIT, of which: 3 123 3 254 4%
248 216 -531 - EBIT acc. to LIFO 1 715 905 -47%
610 335 346 -43% Refining 2 481 2 219 -11%
141 -215 -295 - Refining acc. to LIFO 1 124 -22 -
224 181 40 -82% Retail 825 439 -47%
117 367 -202 - Petrochemicals 486 1 071 120%
87 355 -220 - Petrochemicals acc. to LIFO 435 963 121%
-204 -105 -56 73% Corporate functions -669 -475 29%
Over PLN 900 m of operating profit according to LIFO in 2011
� Refining: negative macro environment, maintenance shutdowns, higher biocomponents costs, partially offset by efficiency
improvement and lower depreciation and amortization.
� Retail: lower fuel margins in Poland due to high fuel prices and impairments of assets limited positive effect of sales volumes increase
achieved mainly in Polish and German market.
� Petrochemicals: lower margins and impairment of assets in Spolana limited by sales volumes increase due to sales of PTA and PVC.
� Corporate functions: received compensation and return of paid fines improve result.
Impairments in 4q11: PLN (-) 284m Spolana (Anwil)– petrochemicals; PLN (-) 132m Paramo (Unipetrol)– refining; PLN (-) 94m ORLEN Lietuva – refining; PLN (-) 73m PKN ORLEN– retail

11
� Total sales volumes in 4q11 increased
by 3% (y/y) to 9,2 mt.
� Refining sales increase by 1% (y/y)
achieved in Polish market and lower
sales in Czech market due to repairs in
Litvinov.
� Retail sales volumes increase by 9%
(y/y) achieved in Polish and German
market. High crude oil quotations and
weak PLN vs USD resulted in high fuel
prices and lower retail margins.
� Petrochemical sales volumes increase
by 3% (y/y) mainly due to start of
terephthalic acid (PTA) sales in May
2011 and higher sales of PVC, while
lower sales of olefins, polyolefins and
fertilizers resulted from maintained
repairs.
Record high annual sales volumes of over 35 mt of products and goods
Refining
Petrochemicals
Retail
Sales volumes
1 9221 9871 759
+ 9%
1 2391 3601 204
+ 3%
5 9926 2795 925
+ 1%
9 1539 6268 888
+ 3%
12M1112M104Q10 4Q113Q11 kt
+ 5%
7 3457 025
+ 3%
23 03322 419
+ 7%
5 0684 733
+ 4%
35 44634 177

12
Crude oil throughput decrease by (-) 5% (y/y) as a result of shutdowns in Unipetrol
and limited production in ORLEN Lietuva due to economic reasons
Crude oil throughput
mtUtilisation ratio
%
- 5%
4Q11
7,2
3Q11
7,4
2Q11
6,8
1Q11
6,4
4Q10
7,5
Fuel yield
%
UnipetrolPKN ORLEN ORLEN Lietuva
� Decrease of utilisation ratio in Plock by (-) 6 pp (y/y) as a result of
maintenance shutdown of CDU III and lower fuel yield by (-) 4 pp (y/y)
due to FCC shutdown.
� Lower by (-) 11 pp (y/y) utilisation ratio in Unipetrol reflects maintenance
shutdowns in refining and petrochemical in Litvinov that started in 3q11
and reduced utilisation in Paramo refinery.
� Limited crude oil throughput by (-) 10% (y/y) in ORLEN Lietuva as a
result of unfavourable macroeconomic situation in December but with
higher by 2 pp (y/y) fuel yield.4Q10 4Q11
69
1Q11
87
4Q10
100
90
100
2Q11
8374
87
85
97
8580
70
9096
90
79
100
4Q11
94
3Q11
Comments
32 33
44
74 77
42
32 31
75
44
73
41
35 30
76
46
80
45
Middle distillates yieldGasoline yield
4Q10 4Q11 4Q10 4Q11

13
Agenda
Achievements in 2011
Macroeconomic environment
Financial and operating results in 4Q 2011
Liquidity
Energy and upstream
�
Summary of 2011

14
Good financial standing
� Stable level of debt and gearing 30,9%.
� Covenant net debt / (EBITDA + dividend from Polkomtel)
1,29.
� PLN 3,7 bn inflow from sales of Polkomtel shares.
� Revaluation of credits increased net debt in 4Q2011 by PLN
(-) 0,3 bn (q/q).
� Negative net foreign exchange differences due to revaluation
of debt amounted to PLN (-) 0,1 bn.
Net debt and financial gearing
in PLN bn, %
Gross debt structure by currency
As of 31.12.2011
Safe level of debt and financial ratios
7,69,3
7,98,57,8
- 0,2 bn
4Q113Q112Q111Q114Q10
36,9%
%Financial
gearing
8%
CZK
4%PLN
EUR 33% USD55%
32,5% 31,1% 32,2% 30,9%
9,3
11,3
-0,4-0,9-0,7
Net
factoring
Net
payment
for crude oil
Working capital
before optimisation
initiatives
Sale of
obligatory
reserves
Working
capital as of
31.12.2011
Effect of operations on change of working capital
as of 31.12.2011, PLN bn
Additional inflows in the amount of PLN 2,0 bn

15
� Higher by PLN 2,5 bn involvement in working capital due to increase of crude oil and products prices.
� Safe liquidity situation allowed for scale reduction of initiatives decreasing working capital by PLN 2,3 bn.
� Inflow from Polkomtel sales PLN 3,7 bn increased in 4Q2011 cash flow from investments as well as free cash flow.
� Decrease of CAPEX by PLN 0,9 bn (y/y) as a result of finishing key projects initiated in the previous years.
Over PLN 5,5 bn of cash flow from operations
4Q10 3Q11 4Q11change
y/yPLN m 12M10 12M11
change
y/y
1 389 734 1 320 -69Cash flow from operations
before working capital change5 235 5 571 336
-663 346 -1 701 -1 038 Working capital change without initiatives -3 425 -2 507 918
2 100 -600 -300 -2 400 Change of initiatives 4 300 -2 300 -6 600
2 826 480 -681 -3 507 Cash flow from operations 6 110 764 -5 346
-625 -406 2 910 3 535 Cash flow from investments -2 920 1 493 4 413
-955 -621 -689 266 Capital expenditures (CAPEX) -3 011 -2 133 878
2 201 74 2 229 28 Free cash flow 3 190 2 257 -933

16
Agenda
Achievements in 2011
Macroeconomic environment
Financial and operating results in 4Q 2011
Liquidity
Energy and upstream�
Summary of 2011

17
ENERGY
New projects and improvement of efficiency of assets held
NEW PROJECTS
1. Building of gas power plant to 500 MWe in Włocławek� Advanced preparation of investment: we have the environmental decision, agreement for
connection to the energy network and the permission to build energy block.
� Agreement for building of pipeline signed with GAZ-SYSTEM
� Process of selection of the contractor of power plant in „turn-key” formula in 1H 2012.
� Power plant will meet the commercial sales as well as Anwil energy needs.
� Block building starting in 2012 and start-up at the turn of 2014/2015.
� Estimated CAPEX in the amount of ca. PLN 1,5 bn.
2. Potential building of next power plant in Płock
IMPROVEMENT OF ASSETS EFFICIENCY
1. Modernization of heat and power plant in Płock
� Investment program in the amount of ca. PLN 1 bn within 2-3 years.
� The aim is to meet the environmental requirements i.e. reduction of emission by 90% and
increase of capacity (increase of energy production by 20% and steam heat by 7% till 2017).
� Decision about the selection of the contractor in 1H 2012.
� Start-up till the end of 2015.
2. Restructuring and modernization of heat and power plant in Unipetrol

18
UPSTREAM
Shale gas – realization of exploratory projects
Status of projects
Lublin Shale project:
� A minimum of 2 exploratory drills are planned in 2012
Wierzbica
� Finishing of vertical drill in December 2011.
� Start-up of horizontal drills fracturing in June 2012 after positive
findings of samples.
Lubartów
� Finishing of vertical drill in January 2012.
Hrubieszów Shale project:
� Obtaining and interpretation of seismic data is planned in 2012.
Mid-Poland Unconventionals project:
� Reinterpretation of archival seismic data is planned in 2012.
Shale gas resources in Poland
� 5.3 bn m3 acc. to estimates of U.S. Energy Information Administration
(EIA).
PKN ORLEN has 8 licenses for shale gas
exploration in Poland
Lublin Shale project:
� 1.Lublin, 2.Garwolin, 3.Lubartów, 4.Wierzbica, 5.Bełżyce
Hrubieszów Shale project:
� 6.Hrubieszów
Mid-Poland Unconventionals project:
� 7.Sieradz, 8.Łódź

19
UPSTREAM
Conventional projects – crude oil and gas
1. Latvian shelf
� Off-shore project on Latvian shelf is realized together with Kuwait Energy Company.
� 2 exploration and upstream licenses.
� A minimum of 1 drill is planned in 2012.
Status of project:
� Analysis of newly acquired 3D seismic data and choice of drills’ locations are in progress.
2. Lublin region
� Exploration project in Poland (Lublin) in 100% realized by ORLEN Upstream.
� 5 exploration licenses at the area of 4 700 km2.
� 3D seismic works and optional 1 exploration drill in the case of positive evaluation are
planned in 2012.
Status of project:
� Data analysis and choice of drills’ locations are in progress.
3. Polish Lowland
� Exploration and upstream project in Poland (Sieraków) is realized together with PGNiG S.A.
(PKN ORLEN owns 49% of shares).
� 1 exploration and upstream license.
� 1 appraisal drill is planned in 2012.
Status of project:
� Appraisal drill finished. Data analysis and choice of next drill location are in progress.

20
Agenda
Achievements in 2011
Macroeconomic environment
Financial and operating results in 4Q 2011
Liquidity
Energy and upstream
� Summary of 2011

21
Summary of 2011
Results under the pressure of tough macro environment
� Over PLN 900 m of operating profit according to LIFO
� Positive influence of non-cash effect of inventories valuation of PLN 2,3 bn and profit from Polkomtel sale
PLN 2,3 bn.
� Over PLN 100 bn of sales revenues.
� Over 35 m tones of sales volumes; grow by 4% (y/y).
Good liquidity situation
� Reduction in debt to PLN 7,6 bn, financial gearing to the level of 29,6%, and covenant level to 1,29.
� Continuation of initiatives reducing working capital.
� Signing of credit agreements refinancing the debt for the total value of EUR 2,9 bn.
Realization of actions increasing PKN ORLEN value
� Start up of petrochemical complex of PX/PTA.
� Sales of 24,39% shares of Polkomtel owned by PKN ORLEN for PLN 3,7 bn.
� Continuation of projects in energy and upstream segments.
Positive notes on PKN ORLEN operating
� Fitch maintained stable rating of financial standing at BB+.
� Again qualified to the prestigious RESPECT Index.
� First place in category „The Best Managed Company – Most Convincing and Coherent strategy by
country: Poland” (Euromoney magazine, 2011).

22
Thank You for Your attention
For more information on PKN ORLEN, please contact
Investor Relations Department:
telephone: + 48 24 256 81 80
fax: + 48 24 367 77 11
e-mail: [email protected]
www.orlen.pl

23
Agenda
Supporting slides�

24
PKN ORLEN
Negative impact of revaluation of assets
PLN m
128
228
160
747
1.000
900
800
700
600
500
400
300
200
100
0
PLN -619 m
EBIT 4Q2011Others
-686
VolumesMacro
-321
Inventories
valuation
EBIT 4Q2010
� Positive impact of inventories valuation (y/y) as a result of growing crude oil prices in PLN.
� Positive volume impact as a result of start of PTA sales in 2011.
� Others mainly include negative impact of impairment of assets, legislation changes in respect of National Index Target
realization and drop in retail margins.
Inventories valuation effect: PKN ORLEN PLN 404 m, ORLEN Lietuva PLN (-) 156 m, Unipetrol PLN (-) 61 m, others PLN (-) 27 m.
Macroeconomic effect: exchange rate PLN (-) 24 m, margins PLN (-) 295 m, differential PLN (-) 2 m.

25
Refining segment
Unfavorable influence of tough market environment and legislation changes
PLN m
346
172
610
0
100
200
300
400
500
600
700
800
PLN - 264 m
EBIT 4Q2011Others
-129
Volumes
-81
Macro
-226
Inventories
valuation
EBIT 4Q2010
� Positive impact of crude oil prices changes on inventories valuation (y/y) and observed worsening of macro factors.
� Negative volume effect connected with increase of share of heavy fractions in sales structure as a result of conducted
maintenance of production units.
� Others mainly include negative effects of legislation changes connected with taxation of biocomponents in fuels partially
offset by efficiency improvement.
Inventories valuation effect: PKN ORLEN PLN 404 m, ORLEN Lietuva PLN (-) 156 m, Unipetrol PLN (-) 49 m, others PLN (-) 27 m.
Macroeconomic effect: exchange rate PLN 8 m, margins PLN (-) 232 m, differential PLN (-) 2 m.
26
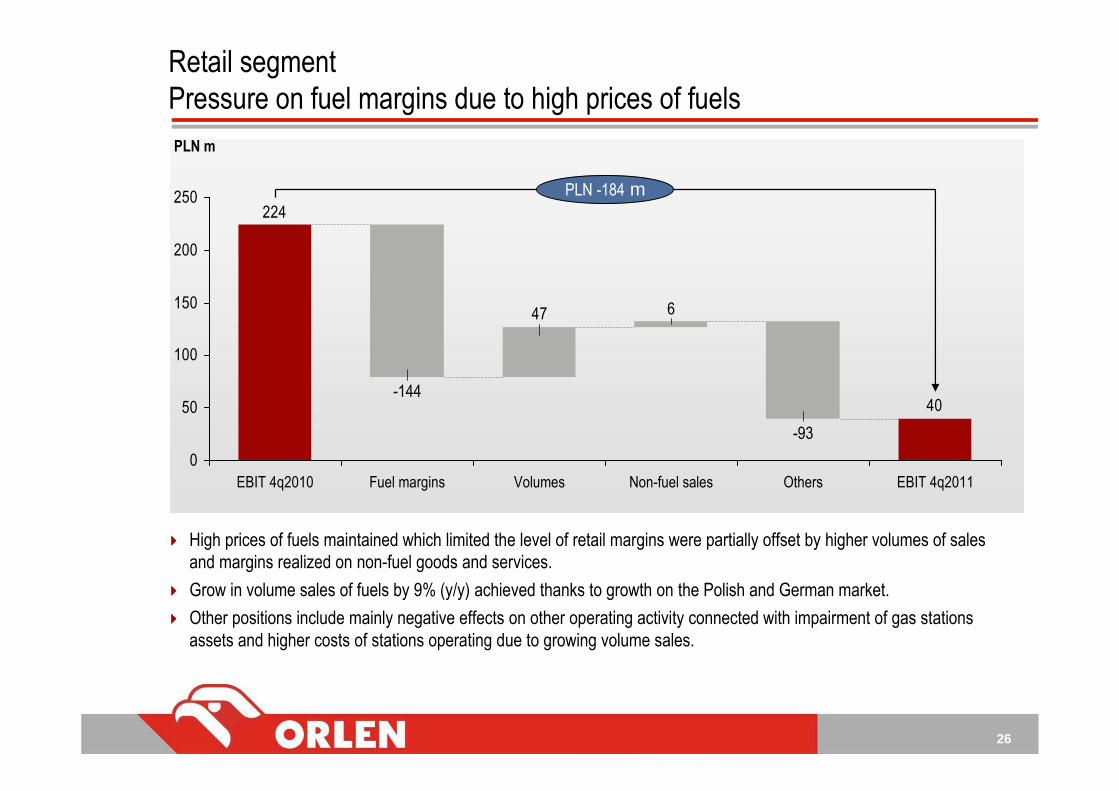
Retail segment
Pressure on fuel margins due to high prices of fuels
PLN m
40
647
224
0
50
100
150
200
250 PLN -184 m
EBIT 4q2011Others
-93
Non-fuel salesVolumesFuel margins
-144
EBIT 4q2010
� High prices of fuels maintained which limited the level of retail margins were partially offset by higher volumes of sales
and margins realized on non-fuel goods and services.
� Grow in volume sales of fuels by 9% (y/y) achieved thanks to growth on the Polish and German market.
� Other positions include mainly negative effects on other operating activity connected with impairment of gas stations
assets and higher costs of stations operating due to growing volume sales.

27
Petrochemical segment
PTA as a lever of growth for increase of petrochemical segment result
PLN m
262
117
-300
-200
-100
0
100
200
300
PLN - 319 m
EBIT 4q2011
-202
Others
-474
VolumesMacro
-95
Inventories
valuation
-12
EBIT 4q2010
� Lower petrochemical margins partially offset by high quotations of paraxylene.
� Increase of sales achieved mainly due to start of sales of PTA and higher sales of plastics.
� Other positions are mainly connected with impairment of tangible assets in Spolana and higher costs of amortization and
depreciation and worsening of margins realized on fertilizers.
Inventories valuation effect: PKN ORLEN PLN 0 m, Unipetrol PLN (-) 12 m.
Macroeconomic effect: exchange rate PLN (-) 32 m, margins PLN (-) 63 m.

28
Main P&L elements breakdown by key companies in 4Q2011
IFRS, PLN mPKN ORLEN
(unconsolidated)Unipetrol
4)ORLEN
Lietuva4)
Others &
consolidation
excludings
ORLEN
Group
3Q11
ORLEN
Group
3Q10
Change
Revenues 21 944 4 257 6 872 -3 097 29 976 22 931 31%
EBITDA 1 131 -218 -83 -67 763 1 343 -43%
Depreciation &
amortisation273 137 109 116 635 596 7%
EBIT 858 -355 -192 -183 128 747 -83%
Financial revenues1) 2 556 -29 121 -226 2 422 114 2025%
Financial costs2) -758 -43 -149 209 -742 -200 271%
Net result 2 158 -398 -206 -269 1 285 544 136%
LIFO adjustment3) -649 -39 26 3 -659 -499 32%
1) Consolidation excludings resulting mainly from the result on the sale of Polkomtel shares at the consolidation level of PLN (-) 233 m.
2) Consolidation excludings resulting mainly from transferring of PLN 196 m of negative exchange rates differences from debts in USD to equity as a result of establishment of
protecting connection with ORLEN Lietuva investment.
3) Calculated as a difference between operational profit based on LIFO and operational profit based on weighted average.
4) Presented data show Unipetrol Group and ORLEN Lietuva results acc. to IFRS after taking into account adjustments made for ORLEN Group consolidation.

29
Operating results breakdown by key segments and companies in 4Q2011
IFRS, PLN mPKN ORLEN
(unconsolidated)Unipetrol
4)ORLEN
Lietuva4)
Others &
consolidation
excludings
ORLEN
Group
4Q11
ORLEN
Group
4Q10
Change
EBIT 858 -355 -192 -183 128 747 -83%
EBIT acc. to LIFO 209 -394 -166 -180 -531 248 -
Refinery1) 767 -247 -233 59 346 610 -43%
Refinery acc. to LIFO 120 -270 -207 62 -295 141 -
Retail 4 18 0 18 40 224 -82%
Petrochemicals2) 191 -124 0 -269 -202 117 -
Petrochemicals acc. to
LIFO189 -140 0 -269 -220 87 -
Corporate Functions3) -104 -2 41 9 -56 -204 73%
1) Refining: refining production, refining wholesale, supportive production and oils (in total – production and sales).
2) Petrochemicals: petrochemical production, petrochemical wholesale and chemicals (in total – production and sales).
3) The corporate functions: corporate functions of ORLEN Group companies and companies not included in above segments.
4) Presented data show Unipetrol Group and ORLEN Lietuva results acc. to IFRS after taking into account adjustments made for ORLEN Group consolidation.

30
ORLEN Lietuva Group
Key elements of the profit and loss account 1
1) Presented data show ORLEN Lietuva Group results acc. to IFRS in accordance with values published on Lithuanian market and does not include correction connected with
fixed assets of ORLEN Lietuva Group on the date of acquisition by PKN ORLEN. Correction increasing depreciation and amortization costs and fixed assets impairment for 12
months 2011 made for the ORLEN Group consolidation amounted to ca. USD 88 m.
4Q10 3Q11 4Q11change
y/yIFRS, USD m 12M10 12M11
change
y/y
1 743 2 218 2 096 20% Revenues 5 786 8 170 41%
39 -7 8 -79% EBITDA 104 110 6%
15 -24 -14 - EBIT 11 31 178%
-24 -6 -6 75% EBIT acc. to LIFO -40 -1 98%
1 -38 -24 - Net result -31 -1 97%
� Further improvement of operational indicators: lower energy intensity ratio, reduction of losses, maintenance index improvement.
� Improved fuel yield in 4q11 by 0,4 pp (q/q).
� Continuation of employment optimisation programme resulting in reduction of 133 persons in 2011.
� Improvement in Inland sales in 2011 by 5 pp (y/y) to 42%.
� Increase in operational result acc. to LIFO in 2011 by USD 39 m (y/y) due to abovementioned activities.

31
UNIPETROL Group
Key elements of the profit and loss account 1
4Q10 3Q11 4Q11change
y/yIFRS, CZK m 12M10 12M11
change
y/y
22 014 24 065 24 327 11% Revenues 85 967 97 428 13%
983 505 -1 778 - EBITDA 5 174 1 118 -78%
122 -230 -2 554 - EBIT 1 678 -1 989 -
-499 -228 -2 778 -457% EBIT acc. to LIFO 670 -2 728 -
-68 -128 -3 141 -4519% Net result 937 -2 806 -
1) Presented data show Unipetrol Group results acc. to IFRS in accordance with values published on Czech market and does not include correction connected with fixed assets
of Unipetrol Group on the date of acquisition by PKN ORLEN. Correction increasing depreciation and amortization costs and fixed assets impairment for 12 months 2011 made
for the ORLEN Group consolidation amounted to ca. CZK 416 m.
� Unfavourable macro environment and maintenance shutdowns at the beginning of 4Q2011 in refinery and petrochemical.
� One-off concerning impairment of assets in Paramo refinery in the amount of CZK 1,2 bn.
� Fixed costs reduction by over CZK 200 m and workforce optimization by over (-) 5% in 2011.
� Average retail margin decreased (y/y) and EBIT acc. to LIFO in 2011 was lower by CZK 3,4 bn mainly due to one-offs, worsening
macro environment and lower sales volumes.

32
1) Nameplate capacity for Plock refinery is 15,1 mt/y in 2010 and in 1q’2011. Since 2q’2011 nameplate capacity is 16,3 mt/y as a result of PX/PTA installation start-up.
2) Nameplate capacity for Unipetrol refineries are 5,1 mt/y in 2011. CKA [51% Litvinov (2.8 mt/y) and 51% Kralupy (1.7mt/y)] and 100% Paramo (0,6 mt/y).
3) Nameplate capacity for ORLEN Lietuva refinery is 10,2 mt/y in 2011.
4) Fuel yield equals middle distillates yield plus light distillates yield. Differences can occur due to rounding.
5) Middle distillates yield is a ratio of diesel, light heating oil (LHO) and JET production excluding BIO and internal transfers to crude oil throughput.
6) Light distillates yield is a ratio of gasoline, naphtha, LPG production excluding BIO and internal transfers to crude oil throughput.
Key production data 4Q10 3Q11 4Q11 12M10 12M11
Refinery in Poland 1
Processed crude (tt) 3 788 3 953 3 814 1% -4% 14 452 14 547 1%
Utilisation 100% 97% 94% -6 pp -3 pp 96% 89% -7 pp
Fuel yield 4 80% 75% 76% -4 pp 1 pp 78% 76% -2 pp
Middle distillates yield 5 45% 44% 46% 1 pp 2 pp 45% 44% -1 pp
Light distillates yield 6 35% 31% 30% -5 pp -1 pp 33% 32% -1 pp
Refineries in the Czech Rep.2
Processed crude (tt) 1 141 941 1 010 -11% 7% 4 353 3 942 -9%
Utilisation 90% 74% 79% -11 pp 5 pp 85% 77% -8 pp
Fuel yield 4 74% 81% 77% 3 pp -4 pp 75% 78% 3 pp
Middle distillates yield 5 42% 46% 44% 2 pp -2 pp 43% 45% 2 pp
Light distillates yield 6 32% 35% 33% 1 pp -2 pp 32% 33% 1 pp
Refinery in Lithuania3
Processed crude (tt) 2 541 2 435 2 283 -10% -6% 8 985 9 007 0%
Utilisation 100% 96% 90% -10 pp -6 pp 88% 88% 0 pp
Fuel yield 4 73% 75% 75% 2 pp 0 pp 74% 75% 1 pp
Middle distillates yield 5 41% 45% 44% 3 pp -1 pp 42% 44% 2 pp
Light distillates yield 6 32% 30% 31% -1 pp 1 pp 32% 31% -1 pp
change
(y/y)
change
(q/q)
change
(y/y)
Key production data

33
PKN ORLEN Group model refining margin
-2
0
2
4
6
8 2010 av erage 2011 2011 av erage 2010
3.8 USD/bbl
2.1 USD/bbl
Ural/Brent differential
-1
0
1
2
3
4
5 2010 av erage 2011 2011 av erage 2010
1.7 USD/bbl
1.4 USD/bbl
� Crude oil price – in the range 94-127 USD/bbl. Average 111 USD/bbl in 2011 vs 80 USD/bbl in 2010.
� Ural/Brent differential – yearly average increased by 0,3 USD/bbl to 1,7 USD/bbl in 2011.
� Model refining margin – yearly average decreased by 1,7 USD/bbl to 2,1 USD/bbl in 2011.
� Model petrochemical margin – yearly average increased by 11 EUR/t to 705 EUR/t in 2011.
Macro environment – comparison 2011 vs 2010
January February March April May June July August September October November December
January February March April May June July August September October November December

34
Increase in total of refining margin and U/B diff
Model refining margin and Ural/Brent differential, USD/bbl
Petrochemical margin decrease
Model petrochemical margin, EUR/t
Crude oil price increase
Average Brent Crude Oil price, USD/bbl
PLN appreciation against USD and EUR
EUR/PLN and USD/PLN exchange rate
Macro environment in 1Q 2012
* Data QTD as of 03.02.2012
111109113117105
+ 2 USD/bbl
1Q12*4Q113Q112Q111Q11
2,9 2,9
0,9
+ 2,5 USD/bbl
1Q12*
5,6
4,7
4Q11
3,1
2,8
0,3
3Q11
3,4
2,7
0,7
2Q11
4,3
1,4
1Q11
4,4
1,5
margindifferential
531609663
795751- 78 EUR/t
1Q12*4Q113Q112Q111Q11
USD/PLNEUR/PLN
31.12.10 31.03.11 30.06.11
2,96
3,96 4,01
2,82
3,99
2,75
30.09.11
4,41
3,26
31.12
4,42
3,42
4,19
3,18
03.02

35
PKN ORLEN Group model refining margin
-2
0
2
4
6
8
102011 av erage 2012 2012 av erage 2011
4.7 USD/bbl
2.1 USD/bbl
Ural/Brent differential
-1
0
1
2
3
4
52011 av erage 2012 2012 av erage 2011
1.7 USD/bbl
0.9 USD/bbl
* Data QTD as of 03.02.2012
� Crude oil price – in the range 108-114 USD/bbl. Average 111 USD/bbl in 2012.
� Ural/Brent differential – yearly average decreased by 0,8 USD/bbl to 0,9 USD/bbl in 2012.
� Model refining margin – yearly average increased by 2,6 USD/bbl to 4,7 USD/bbl in 2012.
Macro environment in 2012
January February March April May June July August September October November December
January February March April May June July August September October November December

36
Maintenance shutdowns of key installations in 2011
1Q 11 2Q 11 3Q 11 4Q 11
Paramo - refinery
Kralupy - HDS
Litvinov - petrochemical
Litvinov - refinery
Refinery
FCC
H-Oil
Hydrocracker
Hydrogen Unit
CDU III
HDS V
HDS – Diesel Hydrodesulphurization Unit
CDU – Crude Distillation Unit
H-Oil – Hydrodesulphurization of Vacuum Residue Unit
FCC – Fluid Catalytic Cracking

37
Maintenance shutdowns schedule of key installations for 2012
Q1’12 Q2’12 Q3’12 Q4’12
PX/PTA
Olefin Unit
HDS VI
CDU III
Litvinov - refinery
Hydrogen Unit
Refinery
H-Oil
Litvinov - petrochemical
Paramo - refinery
Kralupy - HDS
CDU – Crude Distillation Unit
HDS – Diesel Hydrodesulphurization Unit
PX/PTA – petrochemical complex
H-Oil – Hydrodesulphurization of Vacuum Residue Unit

38
Dictionary
PKN ORLEN model refining margin = revenues (93,5% Products = 36% Gasoline + 43% Diesel + 14,5% HHO) - costs (100% input:
crude oil and other raw materials). Total input calculated acc. to Brent Crude quotations. Spot market quotations.
Spread Ural Rdam vs fwd Brent Dtd = Med Strip - Ural Rdam (Ural CIF Rotterdam).
PKN ORLEN model petrochemical margin = revenues (98% Products = 44% HDPE + 7% LDPE + 35% PP Homo + 12% PP Copo) -
costs (100% input = 75% Naphtha + 25% LS VGO). Contract market quotations.
Fuel yield = middle distillates yield + gasoline yield (yields calculated in relation to crude oil).
Working capital (in balance sheet) = inventories + trading receivables and other receivables – trading liabilities and other liabilities.
Working capital change (in cash flow) = changes in receivables + changes in inventories + changes in liabilities
Gearing = net debt / equity calculated acc. to average balance sheet amount in the period

39
This presentation (“Presentation”) has been prepared by PKN ORLEN S.A. (“PKN ORLEN” or “Company”). Neither the Presentation nor any copy hereof may be copied,
distributed or delivered directly or indirectly to any person for any purpose without PKN ORLEN’s knowledge and consent. Copying, mailing, distribution or delivery of this
Presentation to any person in some jurisdictions may be subject to certain legal restrictions, and persons who may or have received this Presentation should familiarize
themselves with any such restrictions and abide by them. Failure to observe such restrictions may be deemed an infringement of applicable laws.
This Presentation contains neither a complete nor a comprehensive financial or commercial analysis of PKN ORLEN and of the ORLEN Group, nor does it present its position or
prospects in a complete or comprehensive manner. PKN ORLEN has prepared the Presentation with due care, however certain inconsistencies or omissions might have
appeared in it. Therefore it is recommended that any person who intends to undertake any investment decision regarding any security issued by PKN ORLEN or its subsidiaries
shall only rely on information released as an official communication by PKN ORLEN in accordance with the legal and regulatory provisions that are binding for PKN ORLEN.
The Presentation, as well as the attached slides and descriptions thereof may and do contain forward-looking statements. However, such statements must not be understood as
PKN ORLEN’s assurances or projections concerning future expected results of PKN ORLEN or companies of the ORLEN Group. The Presentation is not and shall not be
understand as a forecast of future results of PKN ORLEN as well as of the ORLEN Group.
It should be also noted that forward-looking statements, including statements relating to expectations regarding the future financial results give no guarantee or assurance that
such results will be achieved. The Management Board’s expectations are based on present knowledge, awareness and/or views of PKN ORLEN’s Management Board’s
members and are dependent on a number of factors, which may cause that the actual results that will be achieved by PKN ORLEN may differ materially from those discussed in
the document. Many such factors are beyond the present knowledge, awareness and/or control of the Company, or cannot be predicted by it.
No warranties or representations can be made as to the comprehensiveness or reliability of the information contained in this Presentation. Neither PKN ORLEN nor its directors,
managers, advisers or representatives of such persons shall bear any liability that might arise in connection with any use of this Presentation. Furthermore, no information
contained herein constitutes an obligation or representation of PKN ORLEN, its managers or directors, its Shareholders, subsidiary undertakings, advisers or representatives of
such persons.
This Presentation was prepared for information purposes only and is neither a purchase or sale offer, nor a solicitation of an offer to purchase or sell any securities or financial
instruments or an invitation to participate in any commercial venture. This Presentation is neither an offer nor an invitation to purchase or subscribe for any securities in any
jurisdiction and no statements contained herein may serve as a basis for any agreement, commitment or investment decision, or may be relied upon in connection with any
agreement, commitment or investment decision.
Disclaimer

40
For more information on PKN ORLEN, please contact
Investor Relations Department:
telephone: + 48 24 256 81 80
fax + 48 24 367 77 11
e-mail: [email protected]
www.orlen.pl