polski koncern naftowy orlen s.a. - emis · pdf filepolski koncern naftowy orlen s.a. emisid:...
TRANSCRIPT
EMIS6-8 Bouverie Street
London EC4Y 8DD United Kingdomwwwemiscom
Business Report Generated on 02 June 2016
POLSKI KONCERN NAFTOWY ORLEN SA
EMISid 1454737ISIN Code PLPKN0000018PL DUNS 644308413NIP 7740001454KRS 0000028860REGON 610188201
Headquart ersUl Chemikow 7 Plock Mazowieckie PolandMapPost al Code 09-411T el +48 (24) 3650000Fax +48 (24) 3654040Email zarzadorlenplWebsit e httpwwworlenpl
Main Act ivit ies Gasoline Stations Oil and Gas Extraction Petroleum Refineries
Copyright copy 2016 EMIS all rights reserved A Euromoney Institutional Investor company
2
33
3
3
3
3
3
4
4
5
6
7
7
7
99
13
17
20
2222
22
2222
26
2828
28
3131
31
32
33
34
35
37
39
40
43
44
47
Table of Contents
Table of ContentsCompany Tear Sheet
Contact Information
NAICS Industry Classif ication
Business description
Basic Information
EMIS Financial Score
Share Price information
Key Executives
Ownership Details
Subsidiaries and Affiliates
Key Financial Highlights
Financial Performance Charts
Latest MampA and ECM Deals
Top Competitors
Financial StatementsAnnual Statements
Interim Statements
Ratios
Multiples
Company DocumentsFinancial DocumentsAnnual Reports
Corporate Actions
News amp ReportsNews
Reports
MampA and ECM DealsEMIS DealWatch Deals
EMIS DealWatch Intents
EMIS Credit Analyt icsSummary
EMIS Financial Score
EMIS Benchmark Score
EMIS Credit Quota
Conclusions
Company vs Industry Key Stats
Company vs Industry Balance Sheet
Company vs Industry Income Statement
Company vs Industry Cash Flow
EMIS Credit Analytics Assumptions
GlossaryDisclaimer
EMIS Business Report Generated on 2016-06-02
Copyright copy 2015 EMIS all rights reserved A Euromoney Institutional Investor company Page 2 of 48
Full name Polski Koncern Naftowy ORLEN SA
Previous name(s) Polski Koncern Naftowy SA ()
Mazowieckie Zaklady Rafineryjne i Petrochemiczne SA ()
Petrochemia Plock SA ()
St at us Listed
Legal Form Public Limited Company
Operat ional St at us Operational
EMISid 1454737
ISIN Code PLPKN0000018
PL DUNS 644308413
NIP 7740001454
KRS 0000028860
REGON 610188201
Incorporat ion Dat e 2001
Headquart ers
Ul Chemikow 7 Plock Mazowieckie Poland
Map
Post al Code 09-411
T el +48 (24) 3650000
Fax +48 (24) 3654040
Email zarzadorlenpl
Websit e httpwwworlenpl
Main Act ivit ies Gasoline Stations (447) | Oil and Gas Ext ract ion (2111) | Petroleum Refineries (32411)
Company Descript ion
PKN ORLEN is the largest manufacturer and distributor of petroleum products and
chemicals in Poland and one of the largest in the region of Central and Eastern
Europe The company deals with the processing of crude oil to unleaded gasoline
diesel heating oil jet fuel plastics and petrochemical products The Group
manages seven refineries in Poland Czech Republic and Lithuania it also has
the largest gasoline stations network in Central Europe
Main Product s
Petroleum products petrol diesel heating oil
T rade Marks
Verva Bliska Platinum Impact Ekoterm Orbiton TankBank Club Vitay Flota
T ot al Employees 4543 (2015)
Out st anding Shares 427709061 (2011)
Regist ered Capit al PLN 534636326 (2003)
Financial Audit ors KPMG (2015)
Rat ings Moodys Baa3 (20-Jun-14) FITCH BBB- (30-Aug-13)
Company Tear Sheet - Contact Information
Company Tear Sheet - NAICS Industry Classif icat ion
Secondary Act ivit ies Management of Companies and Ent erprises (551) | Petroleum and Petroleum Products Merchant Wholesalers (4227)
Company Tear Sheet - Business descript ion
Company Tear Sheet - Basic Information
Company Tear Sheet - EMIS Financial Score
EMIS Financial ScoreEMIS Financial Score was not affected by Conditions
Company Tear Sheet - Share Price information
EMIS Business Report Generated on 2016-06-02
Copyright copy 2015 EMIS all rights reserved A Euromoney Institutional Investor company Page 3 of 48
Last Price 6905
Volume 475900
Turnover 32711179
Previous 6900
Change 005 (0 07)
1 Year Change -271
Index RESPECT
Market Warsaw Stock Exchange
Ticker PKN
Market Cap 29511925
52 Week High 8525
52 Week Low 5764
PE 913
EPS 756
Dividend Yield 165 (July 08 2015)
Bookvalue 22946000
Enterprise Value 39262925
Quote updated on June 02 2016
Note data in PLN Thousands
St at e T reasury 2752
Nat ionale-Nederlanden OFE 912
OFE Aviva BZ WBK 734
Ot her 5602
Company Tear Sheet - Key Executives
Wojciech Jasinski President
Miroslaw Kochalski Vice President
Slawomir Jedrzejczyk Vice President
Krystian Pater Management Board Member
Piotr Chelminski Management Board Member
Zbigniew Leszczynski Management Board Member
Angelina Sarota Supervisory Board Chairman
Adrian Dworzynski Supervisory Board Member
Agnieszka Krzetowska Supervisory Board Member
Arkadiusz Siwko Supervisory Board Member
Artur Gabor Supervisory Board Member
Mateusz Henryk Bochacik Supervisory Board Member
Radoslaw Leszek Kwasnicki Supervisory Board Member
Remigiusz Nowakowski Supervisory Board Member
Company Tear Sheet - Ownership Details
EMIS Business Report Generated on 2016-06-02
Copyright copy 2015 EMIS all rights reserved A Euromoney Institutional Investor company Page 4 of 48
Orlen Insurance Lt d (Malt a)
Anwil SA 100
Pro Lab Sp z oo 9999
Przedsiebiorst wo Uslug T echnicznych Wircom Sp z oo 9705
Balt ic Power Sp z oo 100
Balt ic Spark Sp z oo 100
Inowroclawskie Kopalnie Soli Solino SA 100
Kopalnia Soli Lubien Sp z oo 100
ORLEN Deut schland AG (Germany) 100
Orlen Administ racja Sp z oo 100
Orlen Asf alt Sp z oo 100
Orlen Budonaf t Sp z oo 100
Orlen Cent rum Uslug Korporacyjnych Sp z oo 100
Orlen Eko Sp z oo 100
Orlen Gaz Sp z oo 100
Orlen Gaz Sp z oo Rozlewnia Gazu Plynnego Hrubieszow 100
Orlen Gaz Sp z oo Rozlewnia Gazu Plynnego Jaworzno 100
Orlen Gaz Sp z oo Rozlewnia Gazu Plynnego Krosno Odrzanskie100
Orlen Gaz Sp z oo Rozlewnia Gazu Plynnego Nowa Brzeznica100
Orlen Gaz Sp z oo Rozlewnia Gazu Plynnego Plock 100
Orlen Gaz Sp z oo Rozlewnia Gazu Plynnego Ugoszcz 100
Orlen Pet rogaz Wroclaw Sp z oo 100
Orlen Liet uva AB (Lit huania) 100
Mazeikii Naf t os prekybos namai UAB (Lit huania) 100
Mazeikii Naf t os sveikat os prieziuros cent ras UAB (Lit huania)100
Naf t e lf UAB (Lit huania) 100
Paslaugos t au UAB (Lit huania) 100
Vent us-Naf t a AB (Lit huania) 100
EMAS UAB (Lit huania) 34
Orlen Ochrona Sp z oo 100
Orlen Ochrona Sp z oo Oddzial W Republice Czeskie j (CzechRepublic)
100
Orlen Oil Sp z oo 100
Pet ro-Oil SEEWAX Sp z oo 25
Plat inum Oil Sp z oo 2198
Pet ro Oil Wielkopolskie Cent rum Sprzedazy Sp z oo Oddzial WBaranowie
100
Pet ro Oil Wielkopolskie Cent rum Sprzedazy Sp z oo WSuchym Lesie Oddzial W T orniu
Konsorcjum Olejow Przepracowanych Organizacja OdzyskuOpakowan I Ole jow SA
81
Konsorcjum Olejow Przepracowanych Organizacja Odzysku SAOddzial W Krakowie
100
Ran Akant Sp z oo 51
Ran Pet romex Sp z oo 51
Ran Wat t Sp z oo 51
Remwil Sp z oo 100
Przedsiebiorst wo Inwest ycyjno Remont owe Remwil Sp z ooOddzial W Nerat ovicach
100
Orlen Kolt rans Sp z oo 9985
Orlen Projekt SA 9963
Orlen Holding Malt a Limit ed (Malt a) 995
Orlen T ransport Krakow Sp z oo 9841
Orlen T ransport Krakow Sp z oo Oddzial Przemysl 100
Orlen T ransport Krakow Sp z oo Oddzial Rzeszow 100
Raf T rans Sp z oo 100
Orlen Cent rum Serwisowe Sp z oo 9637
Orlen Cent rum Serwisowe Sp z oo Oddzial Kat owice 100
Orlen Cent rum Serwisowe Sp z oo Oddzial Kedzierzyn Kozle100
Orlen Cent rum Serwisowe Sp z oo Oddzial Kie lce 100
Orlen Cent rum Serwisowe Sp z oo Oddzial Lodz 100
Orlen Cent rum Serwisowe Sp z oo Oddzial Nowa Wies Wielka100
Orlen Cent rum Serwisowe Sp z oo Oddzial Rzeszow 100
Orlen Cent rum Serwisowe Sp z oo Oddzial Warszawa 100
Serwis Mazowsze Sp z oo 885
Orlen Laborat orium Sp z oo 9494
Orlen Wir Sp z oo 7659
Orlen Wir Sp z oo Oddzial Na Lit wie Z Siedziba W Kownie 100
UNIPET ROL as (Czech Republic) 6299
BENZ INA sro (Czech Republic) 100
PARAMO as (Czech Republic) 100
MOGUL SLOVAKIA sro (Slovakia) 100
Paramo Oil sro (Czech Republic) 100
UNIPET ROL RAFINERIE sro (Czech Republic) 100
UNIPET ROL RPA sro (Czech Republic) 100
CHEMOPET ROL as (Czech Republic) 100
PET ROT RANS sro (Czech Republic) 1
POLYMER INST IT UT E BRNO spol s ro (Czech Republic) 1
Company Tear Sheet - Subsidiaries and Aff iliates
EMIS Business Report Generated on 2016-06-02
Copyright copy 2015 EMIS all rights reserved A Euromoney Institutional Investor company Page 5 of 48
100
Orlen Paliwa Sp z oo 100
Orlen Paliwa Sp z oo (Widelka) 100
Orlen Paliwa Sp z oo Oddzial Biuro Obslugi Klient a W Plocku100
Orlen Paliwa Sp z oo Oddzial Gaz W Plocku 100
Orlen Paliwa Sp z oo Oddzial Sprzedaz Regionalny W Plocku100
Orlen Paliwa Sp z oo Oddzial Sprzedaz Regiony W Plocku 100
Pet ro Mawi Sp z oo 60
Orlen Poludnie SA 100
Ekonaf t Sp z oo 100
Energomedia Sp z oo 100
Euronaf t T rzebinia Sp z oo 100
Pensjonat Vena Sp z oo 67
Konsorcjum Olejow Przepracowanych Organizacja OdzyskuOpakowan I Ole jow SA
8
Konsorcjum Olejow Przepracowanych Organizacja Odzysku SAOddzial W Krakowie
100
Orlen Serwis SA 100
Orlen Upst ream Sp z oo 100
Pet rolot Sp z oo 100
Pet rolot Sp z oo Port Lot niczy Gdansk T rojmiast o 100
Pet rolot Sp z oo Port Lot niczy Kat owice Pyrzowice 100
Pet rolot Sp z oo Port Lot niczy Krakow Balice 100
Pet rolot Sp z oo Port Lot niczy Poznan Lawica 100
Pet rolot Sp z oo Port Lot niczy Szczecin Goleniow 100
Raf ineria Naf t y Jedlicze SA 100
RAF-Energia Sp z oo 100
Raf Kolt rans Sp z oo 100
UNIPET ROL DOPRAVA sro (Czech Republic) 1
UNIPET ROL SERVICES sro (Czech Republic) 100
UNIPET ROL T RADE as v likvidaci (Czech Republic) 100
Chemapol Schweiz AG (PRODundef ) 100
Vyzkumny ust av anorganicke chemie as (Czech Republic) 100
But adien Kralupy as (Czech Republic) 51
ORLEN HOLDING MALT A (Malt a) 05
UNIPET ROL DEUT SCHLAND GmbH (Germany) 01
PET ROT RANS sro (Czech Republic)
POLYMER INST IT UT E BRNO spol s ro (Czech Republic)
UNIPET ROL DOPRAVA sro (Czech Republic)
Ship Service SA 609
Orlen Aut omat yka Sp z oo 5242
Orlen Aut omat yka Sp z oo Oddzial Na T eryt orium RepublikiLit ewskie j
100
Orlen Aut omat yka Sp z oo Oddzial W T rzebinii 100
Basell Orlen Polyolef ins Sp z oo 50
Basell Orlen Polyolef ins Sprzedaz Sp z oo 100
Plocki Park Przemyslowo T echnologiczny SA 50
Cent rum Edukacji Sp z oo (Plock) 6943
Naf t oport Sp z oo 1795
T elewizja Familijna SA 1196
Dom Wydawniczy Kobiet a I Z ycie Sp z oo 100
Amber T v Sp z oo 75
URODA Sp z oo 7163
Grupa Mult imedialna SA 065
Company Tear Sheet - Key Financial Highlights
FISCAL PERIOD Q1-2013 CONSOLID Q1-2014 CONSOLID Q1-2015 CONSOLID Q1-2016 CONSOLID
Net sales revenue 8722732 7894694 5366537 4096271
Total Operating Revenue 8745929 7993873 5388266 4146296
Operating profit (EBIT) 102957 77903 316278 99293
EBITDA NA NA NA NA
Net Profit(Loss) 46076 41243 232849 84892
Total Assets 16481679 17468363 12205902 12827082
Total equity 8764528 9099657 5601049 6507050
Operating Profit Margin 118 099 589 242
Return on Sales (ROS) 053 052 434 207
EMIS Business Report Generated on 2016-06-02
Copyright copy 2015 EMIS all rights reserved A Euromoney Institutional Investor company Page 6 of 48
Return on Equity (ROE) 0 0 0 0
Debt to equity 3491 3563 5255 3958
Quick ratio 0 61 058 076 078
Cash Ratio 008 006 025 030
Provider EMIS - Global EMIS - Global EMIS - Global EMIS - Global
FISCAL PERIOD Q1-2013 CONSOLID Q1-2014 CONSOLID Q1-2015 CONSOLID Q1-2016 CONSOLID
Note data in USD Thousands
Company Tear Sheet - Financial Performance Charts
Company Tear Sheet - Latest MampA and ECM Deals
DAT ECOUNT RY OF
T ARGETT ARGET COMPANY
DEALT YPE
BUYER SELLER DEAL INDUST RIESDEAL VALUE
USD (MN)ST AKE
20-Jan-16CzechRepublic
68 petrol stations of OMV AcquisitionPKNOrlen SA
OMV AG Gasoline Stations NA 10000
16-Nov-15 PolandAssets of EuronaftTrzebinia
AcquisitionPKPCargo SA
PKN Orlen SASupport Activities for RailTransportation Rail Transportation
1502 10000
16-Nov-15 Poland Orlen Transport SA AcquisitionTransPoloniaSA
PKN Orlen SA Truck Transportation 2137 10000
21-Oct-15 Germany13 SUN petrol stations ofGermania Petrol
AcquisitionPKNOrlen SA
GermaniaPetrol GmbH
Gasoline Stations NA 10000
13-Oct-15 Canada Kicking Horse Energy Inc AcquisitionPKNOrlen SA
NA Oil and Gas Extraction 22634 10000
Company Tear Sheet - Top Competitors
Gasoline Stat ions
COMPANYT OT AL
OPERAT INGREVENUE
OPERAT INGPROFIT(EBIT )
NETPROFIT (LOSS)
RET URN ONASSET S (ROA)
()
RET URN ONEQUIT Y (ROE)
()
PRICE PEREARNING
()
EARNINGPER
SHARE
PRICEREFERENCE
DAT E
FISCALYEAR
EMIS Business Report Generated on 2016-06-02
Copyright copy 2015 EMIS all rights reserved A Euromoney Institutional Investor company Page 7 of 48
PKN Orlen SA 23519124 1082999 856701 672 NA 898 194 2016-06-01 2015
Lotos SA 6030487 112195 -69771 -137 NA -1896 -0 37 2016-06-01 2015
Lotos Paliwa Spz oo
5621684 13710 7267 114 511 NA 2013
BP Europa SEOddzial WPolsce
3723751 38592 20434 186 1725 NA 2014
Statoil Sp z oo 1402338 26528 16288 331 568 NA 2015
Anwim SA 779702 2173 1458 211 1213 NA 2014
Shell SelfService Sp zoo
237738 -21189 -21345 -3716 -6211 NA 2013
Apexim Ab 211286 10493 7846 1487 2560 NA 2011
Aris Polska Spz oo (Poznan)
146365 47 -20 -023 -303 NA 2014
Pw Alicja Sp zoo
138096 1150 488 135 627 NA 2014
Falco sp j 136471 1646 1512 913 2134 NA 2014
Oil and Gas Extract ion
COMPANYT OT AL
OPERAT INGREVENUE
OPERAT INGPROFIT (EBIT )
NETPROFIT (LOSS)
RET URN ONASSET S (ROA) ()
PRICE PEREARNING ()
EARNINGPER SHARE
PRICEREFERENCE
DAT E
FISCALYEAR
PKN OrlenSA
23519124 1082999 856701 672 898 194 2016-06-01 2015
Lotos SA 6030487 112195 -69771 -137 -1896 -0 37 2016-06-01 2015
Petroleum Refineries
COMPANYT OT AL
OPERAT INGREVENUE
OPERAT INGPROFIT(EBIT )
NETPROFIT (LOSS)
RET URN ONASSET S
(ROA) ()
RET URN ONEQUIT Y (ROE)
()
PRICE PEREARNING
()
EARNINGPER
SHARE
PRICEREFERENCE
DAT E
FISCALYEAR
PKN Orlen SA 23519124 1082999 856701 672 NA 898 194 2016-06-01 2015
Lotos SA 6030487 112195 -69771 -137 NA -1896 -0 37 2016-06-01 2015
Orlen Poludnie SA 446323 8937 30232 1760 2763 NA 2014
Rafineria NaftyJedlicze SA
129461 3589 1496 158 317 NA 2011
Janusz FijalkowskiBossoil
82218 128 9 006 111 NA 2011
Fabryka ParafinNaftowax Sp z oo
63126 1584 1137 542 825 NA 2013
Pol Naft Ag Sp zoo
28811 284 214 3917 7590 NA 2014
Paragran Sp z oosp k
18911 180 241 417 9226 NA 2013
Bitunova Sp z oo(REGON530941152)
17947 1876 1497 1800 2450 NA 2014
Rafineria W JasleSp z oo
11456 549 439 1903 8636 NA 2014
Hellenic Oil Sp zoo
11294 252 199 3185 4301 NA 2014
Note data in USD Thousands
EMIS Business Report Generated on 2016-06-02
Copyright copy 2015 EMIS all rights reserved A Euromoney Institutional Investor company Page 8 of 48
Financial Statements - Annual Statements - EMIS Global Template
REPORTING DETAILS
NAME Y-2011 - CONSOLID Y-2012 - CONSOLID Y-2013 - CONSOLIDY-2014 -
CONSOLIDY-2015 - CONSOLID
Begin date of reporting period 2011-01-01 2012-01-01 2013-01-01 2014-01-01 2015-01-01
End date of reporting period 2011-12-31 2012-12-31 2013-12-31 2014-12-31 2015-12-31
Original units as reported PLN Thousands PLN Thousands PLN Thousands PLN Thousands PLN Thousands
Displaying units USD Thousands USD Thousands USD Thousands USD Thousands USD Thousands
Comments Notes Notes Notes Notes Notes
Audited Audited Audited Audited Audited Audited
Balance Sheet
NAME Y-2011 - CONSOLID Y-2012 - CONSOLID Y-2013 - CONSOLIDY-2014 -
CONSOLIDY-2015 - CONSOLID
Exchange rat e used f or currencyconversion (IFRS)
342 310 301 351 390
Total Assets 17186012 16979933 17049137 13322594 12339340
Non-current assets 8368684 8649826 8933267 7119925 7013919
Property plant and equipment 7777448 7982966 8268260 6456432 6289508
Intangible assets and goodwill 387149 466834 273240 200445 332727
Long-term financial assets 78116 86463 289177 284843 236087
Investment properties 62419 69364 71713
Investments in subsidiaries 3841 3871 204183 191606 198406
Deferred assets 116909 95819 50133 109774 93563
Non-current deferred tax assets 116909 95819 50133 109774 93563
Other non-current assets 9061 17744 52457 68431 62034
Current Assets 8808981 8309137 8110890 6192974 5300556
Inventories 4768689 4842883 4564741 2802521 2746661
Trade and other receivables 2361740 2605175 2579017 2022126 1702340
Current trade receivables 2361740 2605175 2579017 2022126 1702340
Prepayments accrued income and otherdeferred current assets
9857 29036 19588
Short term Financial assets 85865 118725 54781 245780 249673
Other current financial assets 85865 118725 54781 245780 249673
Cash amp Cash Equivalents 1582831 713318 892762 1122548 601882
Assets of disposal group classified as heldfor sale
8347 20970 4980 9694 24865
Total Equity and liabilities 17186012 16979933 17049137 13322594 12339340
Total equity 7841834 9132469 9147078 5812614 6214657
Equity attributable to owners of the parent 7179076 8542715 8614874 5352133 5683781
Issued capital 309485 341334 351262 301665 271206
Foreign currency translation reserve 116060 4517 -17596 -230953 117146
Retained earnings 6394411 7801007 7873838 4931569 4980903
Other reserves 359119 395858 407371 349852 314527
EMIS Business Report Generated on 2016-06-02
Copyright copy 2015 EMIS all rights reserved A Euromoney Institutional Investor company Page 9 of 48
Minority interest 662758 589754 532205 460481 530876
Total Liabilities 9344178 7847464 7902058 7509979 6124683
Non-current liabilities 3546556 2967157 2604914 3508497 2621568
Non-current loans and borrowings 3083570 2477094 2160359 2757185 2084284
Deferred revenue accrued expenses andother deferred non-current liabilities
221557 221964 181939 21385 172772
Provisions for other liabilities and charges 181828 212931 218459 202156 182000
Other non-current liabilities 59601 55168 44157 527771 182513
Current Liabilities 5797622 4880307 5296813 4001483 3503115
Current loans and borrowings 849215 457156 318725 572251 486273
Trade and other payables 4416376 4083107 4652390 3209683 2773577
Current trade payables 4416376 4083107 4652390 3209683 2773577
Deferred revenue accrued expenses andother deferred current liabilities
39907 54201 41169
Provisions for other liabilities and charges 295002 259066 272576 184763 191997
Other current liabilities 2361740 2605175 2579017 2022126 1702340
Current income tax liabilities 197121 26778 11952
Liabilities of disposal group classified asheld for sale
33201
Income Statement
NAME Y-2011 - CONSOLID Y-2012 - CONSOLID Y-2013 - CONSOLIDY-2014 -
CONSOLIDY-2015 - CONSOLID
Exchange rat e used f or currencyconversion (IFRS)
296 326 316 315 377
Total Operating Revenue 36435448 37084849 36111401 34117696 23519124
Net sales revenue 36095774 36862023 35930793 33874809 23407830
Cost of Goods Sold -33202235 -34404186 -34113963 -32028741 -20613814
Gross profit 2893539 2457837 1816830 1846068 2794016
Selling and distribution expenses -1235075 -1188404 -1228195 -1242973 -1052261
Administrative expenses -495446 -467750 -458952 -479432 -411259
Raw materials and consumables used -25627619 -22381751 -14452883
Employee benefit expense -663915 -652878 -559121
Social security costs -663915 -652878 -559121
Depreciation amortization and impairmentcharges
-667710 -631316 -502149
Tax and contributions -193260 -207056 -305264
Other costs by nature -8969018 -11255878 -6489514
Other operating expenses -805406 -403296 -225839 -1878411 -358791
Other operating income 339674 222826 180608 242887 111294
Operating profit (EBIT) 697287 621211 84452 -1511861 1082999
Financial result 244726 184154 -47445 -486725 -170121
Finance income 1001638 461612 145498 112248 103345
Other financial income 63537 -30692
Finance costs -756911 -277458 -192943 -598973 -273466
EMIS Business Report Generated on 2016-06-02
Copyright copy 2015 EMIS all rights reserved A Euromoney Institutional Investor company Page 10 of 48
Share of profit (loss) of associates -117558 -53711 -27202 -5390 104935
Profit before income tax 942013 805365 37007 -1998586 912878
Income tax -262094 -139343 -21192 132541 -123219
Profit after income tax 679920 666022 15815 -1866044 789659
Net Profit(Loss) 679920 666022 28467 -1847970 856701
Cash Flow Statement
NAME Y-2011 - CONSOLID Y-2012 - CONSOLID Y-2013 - CONSOLIDY-2014 -
CONSOLIDY-2015 - CONSOLID
Exchange rat e used f or currencyconversion (IFRS)
296 326 316 315 377
Net cash flow from (used in) operatingactivities
256819 948084 1752305 1010549 1418737
Net Profit 679920 666022 28467 -1847970 856701
Adjustments for Depreciation andimpairment of property plant and equipment
803063 693645 667710 631316 502149
Adjustments for Finance income 128356 104354 85401 75783 52202
Adjustments for Other adjustments -83777 -97601 -30681 1736991 165616
Changes in Inventories -1540368 312754 308077 1301950 -173566
Changes in Trade and other receivables -445130 -41741 128102 292986 333353
Changes in Trade and other payables 364692 -620598 454208 -1039404 -509569
Income tax paid 149572 -197965 -12652 -185812 69161
Net cash flow from (used in) investingactivities
505138 -882403 -772090 -1274681 -1085384
Proceeds from sale of property plant andequipment
109565 13812 51873 126834 34713
Purchase of property plant and equipment -857894 -750733 -753428 -1173214 -815893
Purchase of financial instruments -37549 -8594
Proceeds from sale of financial instruments 39040 6752
Acquisition of subsidiary 1199415 -52177 -169537 -251131 -316659
Other investing activity cash flows 52560 -91463 99002 22830 12454
Net cash flow from (used in) financingactivities
112153 -1046913 -771141 660488 -759451
Proceeds from borrowings 6374919 1398646 1135203 3056381 502414
Repayment of borrowings -6081090 -2393690 -1718461 -2861057 -999263
Payments of finance lease liabilities -9297 -8901 -8856
Dividends paid -4604 -203065 -195641 -187080
Other financing activity cash flow -172379 -38365 24039 660805 -75521
Net increase (decrease) in cash and cashequivalents
874110 -981232 209075 396356 -426098
Cash at the beginning of the period 951799 1660145 641774 852641 1043251
Exchange gains (losses) on cash and cashequivalents
-70151 -30692 -31630 -63417 5035
Cash at the end of the period 1825207 678606 850532 1248363 622188
Free cash flow -601075 197351 998877 -162665 602844
CAPEX -898840 -802910 -922965 -1424345 -1132551
EMIS Business Report Generated on 2016-06-02
Copyright copy 2015 EMIS all rights reserved A Euromoney Institutional Investor company Page 11 of 48
OTHER INFORMATION
NAME Y-2011 - CONSOLID Y-2012 - CONSOLID Y-2013 - CONSOLIDY-2014 -
CONSOLIDY-2015 - CONSOLID
Audited Audited Audited Audited Audited Audited
Financial statement type Consolid Consolid Consolid Consolid Consolid
Fiscal year end December December December December December
EMIS Business Report Generated on 2016-06-02
Copyright copy 2015 EMIS all rights reserved A Euromoney Institutional Investor company Page 12 of 48
Financial Statements - Interim Statements - EMIS Global Template
REPORTING DETAILS
NAMEQ1-2015 -
CONSOLIDH1-2015 -
CONSOLIDQ3C-2015 -CONSOLID
Y-2015 - CONSOLIDQ1-2016 -
CONSOLID
Begin date of reporting period 2015-01-01 2015-01-01 2015-01-01 2015-01-01 2016-01-01
End date of reporting period 2015-03-31 2015-06-30 2015-09-30 2015-12-31 2016-03-31
Original units as reported PLN Thousands PLN Thousands PLN Thousands PLN Thousands PLN Thousands
Displaying units USD Thousands USD Thousands USD Thousands USD Thousands USD Thousands
Comments Notes Notes Notes Notes Notes
Audited Non-Audited Audited Non-Audited Audited Non-Audited
Balance Sheet
NAMEQ1-2015 -
CONSOLIDH1-2015 -
CONSOLIDQ3C-2015 -CONSOLID
Y-2015 - CONSOLIDQ1-2016 -
CONSOLID
Exchange rat e used f or currencyconversion (IFRS)
381 376 378 390 376
Total Assets 12205902 13022978 13208137 12339340 12827082
Non-current assets 6587279 6531545 6580495 7013919 7478851
Property plant and equipment 5932590 5957763 5956720 6289508 6660548
Intangible assets and goodwill 206689 160978 163426 332727 404629
Long-term financial assets 247869 240935 263813 236087 258047
Investment properties 52984 54456 55358
Investments in subsidiaries 184393 175588 197595 198406 228518
Deferred assets 64000 72254 69132 93563 89918
Non-current deferred tax assets 64000 72254 69132 93563 89918
Other non-current assets 136131 99615 127404 62034 65709
Current Assets 5614164 6489574 6623139 5300556 5333599
Inventories 2666754 2847921 3156222 2746661 2457036
Trade and other receivables 1948590 2414132 2029719 1702340 1756850
Current trade receivables 1948590 2414132 2029719 1702340 1756850
Prepayments accrued income and otherdeferred current assets
11541 6907 9800
Short term Financial assets 176787 120866 137734 249673 197393
Other current financial assets 176787 120866 137734 249673 197393
Cash amp Cash Equivalents 810492 1099748 1289665 601882 922320
Assets of disposal group classified as heldfor sale
4459 1859 4503 24865 14632
Total Equity and liabilities 12205902 13022978 13208137 12339340 12827082
Total equity 5601049 5952185 6383694 6214657 6507050
Equity attributable to owners of the parent 5167213 5449595 5851301 5683781 5966214
Issued capital 277508 281047 280235 271206 281458
Foreign currency translation reserve -167082 -128304 78932 117146 138069
Retained earnings 4734951 4970912 5167135 4980903 5258845
Other reserves 321836 325940 324999 314527 287843
EMIS Business Report Generated on 2016-06-02
Copyright copy 2015 EMIS all rights reserved A Euromoney Institutional Investor company Page 13 of 48
Minority interest 433836 502590 532394 530876 540835
Total Liabilities 6604852 7070793 6824442 6124683 6320032
Non-current liabilities 2722623 2632753 3199926 2621568 2621442
Non-current loans and borrowings 2290623 2137336 2557610 2084284 2099761
Deferred revenue accrued expenses andother deferred non-current liabilities
31738 90317 147534 172772 176643
Provisions for other liabilities and charges 185443 196573 196006 182000 194201
Other non-current liabilities 214820 208527 298776 182513 150838
Current Liabilities 3882230 4438040 3624517 3503115 3689279
Current loans and borrowings 652590 567937 328177 486273 475924
Trade and other payables 2966557 3647762 3033851 2773577 2937217
Current trade payables 2966557 3647762 3033851 2773577 2937217
Deferred revenue accrued expenses andother deferred current liabilities
73967 64816 50591 72094
Provisions for other liabilities and charges 184656 126179 158129 191997 204044
Other current liabilities 1948590 2414132 2029719 1702340 1756850
Current income tax liabilities 4459 31345 53769
Liabilities of disposal group classified asheld for sale
9311
Income Statement
NAMEQ1-2015 -
CONSOLIDH1-2015 -
CONSOLIDQ3C-2015 -CONSOLID
Y-2015 - CONSOLIDQ1-2016 -
CONSOLID
Exchange rat e used f or currencyconversion (IFRS)
373 371 373 377 396
Total Operating Revenue 5388266 12107296 18354052 23519124 4146296
Net sales revenue 5366537 12054267 18281194 23407830 4096271
Cost of Goods Sold -4700716 -10337420 -15904470 -20613814 -3682172
Gross profit 665821 1716847 2376724 2794016 414099
Selling and distribution expenses -250555 -516831 -779473 -1052261 -252906
Administrative expenses -104085 -212654 -300539 -411259 -91461
Raw materials and consumables used -3210265 -7453936 -11418347 -14452883 -2296620
Employee benefit expense -143251 -288025 -421344 -559121 -143255
Wages and salaries -143255
Social security costs -143251 -288025 -421344 -559121
Depreciation amortization and impairmentcharges
-121253 -246571 -370986 -502149 -130117
Tax and contributions -75918 -153972 -230896 -305264 -69227
Other costs by nature -1519960 -3197351 -4793091 -6489514 -1292323
Other operating expenses -16632 -160433 -207056 -358791 -20465
Other operating income 21729 53029 72858 111294 50025
Operating profit (EBIT) 316278 879958 1162513 1082999 99293
Financial result -47214 -104443 -130984 -170121 -11117
Finance income 23875 42800 69644 103345 11369
Finance costs -71089 -147243 -200627 -273466 -22486
EMIS Business Report Generated on 2016-06-02
Copyright copy 2015 EMIS all rights reserved A Euromoney Institutional Investor company Page 14 of 48
Share of profit (loss) of associates 30045 79140 102858 104935 -25265
Profit before income tax 269065 775515 1031530 912878 88176
Income tax -44531 -152896 -197681 -123219 -24760
Profit after income tax 224533 622619 833849 789659 63416
Net Profit(Loss) 232849 650614 884475 856701 84892
Cash Flow Statement
NAMEQ1-2015 -
CONSOLIDH1-2015 -
CONSOLIDQ3C-2015 -CONSOLID
Y-2015 - CONSOLIDQ1-2016 -
CONSOLID
Exchange rat e used f or currencyconversion (IFRS)
373 371 373 377 396
Net cash flow from (used in) operatingactivities
262895 984939 1015458 1418737 739517
Net Profit 232849 650614 884475 856701 109652
Adjustments for Depreciation andimpairment of property plant and equipment
121253 246571 370986 502149 130117
Adjustments for Finance income 14486 27726 39911 52202 12633
Adjustments for Other adjustments -29509 94752 82501 165616 55584
Changes in Inventories -89599 -207540 -512685 -173566 373169
Changes in Trade and other receivables -89062 -416426 -44465 333353 8085
Changes in Trade and other payables 66260 411311 -51429 -509569 64932
Income tax paid 21193 124632 155895 69161 -22234
Net cash flow from (used in) investingactivities
-152372 -354783 -511345 -1085384 -353462
Proceeds from sale of property plant andequipment
11535 14536 18750 34713 15412
Purchase of property plant and equipment -165248 -335132 -495541 -815893 -387318
Acquisition of subsidiary -9152 -9107 -316659 17938
Other investing activity cash flows 1341 -25034 -25447 12454 50531
Net cash flow from (used in) financingactivities
-339349 -576858 -265985 -759451 -78575
Proceeds from borrowings 19046 100943 531970 502414 538152
Repayment of borrowings -342031 -633387 -548310 -999263 -602073
Payments of finance lease liabilities -1878 -3499 -5625 -1769
Dividends paid -189109 -187080
Other financing activity cash flow -14486 -40916 -54911 -75521 -12885
Net increase (decrease) in cash and cashequivalents
-228826 53298 238128 -426098 307479
Cash at the beginning of the period 1056139 1059772 1054566 1043251 593230
Exchange gains (losses) on cash and cashequivalents
1610 1346 11518 5035 -24760
Cash at the end of the period 828923 1114416 1304212 622188 875950
Free cash flow 97647 649807 519917 602844 352199
CAPEX -165248 -344554 -504917 -1132551 -387318
OTHER INFORMATION
EMIS Business Report Generated on 2016-06-02
Copyright copy 2015 EMIS all rights reserved A Euromoney Institutional Investor company Page 15 of 48
NAMEQ1-2015 -
CONSOLIDH1-2015 -
CONSOLIDQ3C-2015 -CONSOLID
Y-2015 - CONSOLIDQ1-2016 -
CONSOLID
Reporting type Non-Cumulative Non-Cumulative Cumulative Non-Cumulative
Audited Non-Audited Audited Non-Audited Audited Non-Audited
Financial statement type Consolid Consolid Consolid Consolid Consolid
Fiscal year end December December December December December
EMIS Business Report Generated on 2016-06-02
Copyright copy 2015 EMIS all rights reserved A Euromoney Institutional Investor company Page 16 of 48
Financial Statements - Ratios
REPORTING DETAILS
NAME Y-2011 - CONSOLID Y-2012 - CONSOLID Y-2013 - CONSOLIDY-2014 -
CONSOLIDY-2015 - CONSOLID
Begin date of reporting period 2011-01-01 2012-01-01 2013-01-01 2014-01-01 2015-01-01
End date of reporting period 2011-12-31 2012-12-31 2013-12-31 2014-12-31 2015-12-31
Original units as reported PLN Thousands PLN Thousands PLN Thousands PLN Thousands PLN Thousands
Displaying units USD Thousands USD Thousands USD Thousands USD Thousands USD Thousands
Comments Notes Notes Notes Notes Notes
Audited Audited Audited Audited Audited Audited
Ratios
NAME Y-2011 - CONSOLID Y-2012 - CONSOLID Y-2013 - CONSOLIDY-2014 -
CONSOLIDY-2015 - CONSOLID
Exchange rat e used f or currencyconversion (IFRS)
100 100 100 100 100
Profitability Ratios
Return on Assets (ROA) 343 412 018 -1247 672
Annualised Return on Assets (ROA) 343 412 018 -1247 672
Return on Equity (ROE) 000 000 000 000 000
Annualised Return on Equity (ROE) 000 000 000 000 000
Return on Capital 501 580 026 -1818 943
Return on Sales (ROS) 188 181 008 -546 366
Gross Profit Margin 802 667 506 545 1194
Operating Profit Margin 193 169 024 -446 463
Operating ROA 352 385 052 -1020 849
Efficiency Ratios
Inventory Turnover -0 22x -0 26x -0 28x -0 40x -0 37x
Accounts Receivable Turnover 1325x 1487x 1462x 1506x 1330x
Current asset turnover 355x 466x 465x 492x 427x
Fixed-asset turnover 374x 448x 422x 428x 323x
Asset Turnover 182x 228x 221x 229x 184x
Payables Turnover 009x -0 41x -0 37x -0 70x -0 29x
Working Capital Turnover 1039x 1130x 1340x 1390x 1260x
Valuation Figures
Bookvalue 7454685 8665634 8874170 5612169 5881931
Enterprise Value 7255510 9641115 7940595 8633248 9938494
Net Cash -7761348 -7134146 -7008964 -6387432 -5522801
Net Debt 2349954 2220932 1586321 2206889 1968676
Working Capital 3011359 3428830 2814077 2191492 1797442
Earning Before Interests and Taxes (EBIT) 697287 621211 84452 -1511861 1082999
EMIS Business Report Generated on 2016-06-02
Copyright copy 2015 EMIS all rights reserved A Euromoney Institutional Investor company Page 17 of 48
Liquidity Ratios
Current Ratio 152 170 153 155 151
Quick ratio 0 70 071 067 085 073
Dooms day ratio 0 27 015 017 028 017
Cash Ratio 029x 017x 018x 034x 024x
Cash Flow from Operation Ratio 004x 020x 035x 023x 039x
Leverage Ratios
Debt to total assets 2288 1728 1454 2499 2083
Debt to equity 5015 3213 2710 5728 4136
Long Term Debt to Capital 2822 2134 1911 3217 2512
Debt Enterprise Value 5420 3043 3122 3857 2586
Cash Flow to Debt 1927 -3515 885 1070 -1604
Leverage ratio 219x 186x 186x 229x 199x
Growth Trend Ratios
Revenue Trend 12804 11227 9458 9404 8269
Total Operating Revenue Trend 12806 11190 9449 9425 8249
Gross Profit Trend 10745 9338 7173 10136 18111
Operating Income Trend 6618 9794 1319 -1786 -8572
Net Income Trend 8206 10769 415 -6476 -5547
Accounts Receivables Trend 12834 10005 9620 9130 9364
Inventory Trend 14428 9211 9159 7149 10901
Net Property Plant and Equipment (PPampE)Trend
9699 9310 10065 9093 10836
Total Assets Trend 11482 8961 9757 9099 10302
Bookvalue Trend 11117 10595 9725 7331 12021
Shareholders Equity Trend 11056 10563 9733 7399 11892
Cash from Operations Trend 1246 40586 17935 5753 16799
Capital Expenditures Trend 6936 9821 11154 15394 9515
Coverage Ratios
Debt Coverage 006x 034x 074x 027x 053x
Performance Ratios
Cash Flow to Revenue 071 257 488 298 606
Cash Return on Assets 130 587 1079 682 1112
Cash Return on Equity 284 1091 2011 1563 2208
Cash to Income 3683 15262 2075 -6684 13100
Common size balance sheet ratios
CashTotal Assets 921 420 524 843 488
ReceivablesTotal assets 1374 1534 1513 1518 1380
InventoriesTotal assets 2775 2852 2677 2104 2226
EMIS Business Report Generated on 2016-06-02
Copyright copy 2015 EMIS all rights reserved A Euromoney Institutional Investor company Page 18 of 48
Fixed assetsTotal assets 4525 4701 4850 4846 5097
Current LiabilitiesTotal Liabilities 6205 6219 6703 5328 5720
Common size income statement ratios
Administrative ExpensesNet Sales -137 -127 -128 -142 -176
Income taxNet sales -0 73 -038 -006 039 -053
Common size cash flow statement ratios
Operating Cash Flow to Total Cash Flow 2938 -9662 83812 25496 -33296
Cash Flow from Investing to Total Cash Flow 5779 8993 -36929 -32160 25473
Cash flow from financing to Total cash flow 1283 10669 -36884 16664 17823
OTHER INFORMATION
NAME Y-2011 - CONSOLID Y-2012 - CONSOLID Y-2013 - CONSOLIDY-2014 -
CONSOLIDY-2015 - CONSOLID
Audited Audited Audited Audited Audited Audited
Financial statement type Consolid Consolid Consolid Consolid Consolid
Fiscal year end December December December December December
EMIS Business Report Generated on 2016-06-02
Copyright copy 2015 EMIS all rights reserved A Euromoney Institutional Investor company Page 19 of 48
Financial Statements - Mult iples
REPORTING DETAILS
NAME Y-2011 - CONSOLID Y-2012 - CONSOLID Y-2013 - CONSOLIDY-2014 -
CONSOLIDY-2015 - CONSOLID
Begin date of reporting period 2011-01-01 2012-01-01 2013-01-01 2014-01-01 2015-01-01
End date of reporting period 2011-12-31 2012-12-31 2013-12-31 2014-12-31 2015-12-31
Original units as reported PLN Thousands PLN Thousands PLN Thousands PLN Thousands PLN Thousands
Displaying units PLN Thousands PLN Thousands PLN Thousands PLN Thousands PLN Thousands
Comments Notes Notes Notes Notes Notes
Audited Audited Audited Audited Audited Audited
Multiples
NAME Y-2011 - CONSOLID Y-2012 - CONSOLID Y-2013 - CONSOLIDY-2014 -
CONSOLIDY-2015 - CONSOLID
Equity Value Multiples
EPS 471 507 021 -1363 756
PE 720 976 19485 -359 898
Market CapitalizationNet Sales 014 018 015 020 033
Market CapitalizationGross income 169 264 305 359 275
Market CapitalizationEBIT 702 1046 6568 -439 710
Market CapitalizationTotal Assets 025 040 034 045 060
Market capShareholder equity 0 54 075 064 103 120
PriceBook Ratio 057 079 066 106 126
Market Cap Net cash -055 -0 96 -0 83 -0 93 -135
Market CapitalizationInvested Capital 0 36 057 050 067 087
Market CapitalizationOperating Cashflow 1905 685 317 657 542
Market Capitalization(EBIT + DevelopmentExpenditures)
702 1046 6568 -439 710
Enterprise Value Multiples
Enterprise valueNet Sales 023 025 021 028 044
Enterprise valueGross income 289 373 416 520 368
Enterprise valueEBIT 1200 1476 8958 -635 949
Enterprise valueTotal Assets 042 057 047 065 081
Enterprise valueInvested Capital 0 62 081 069 097 116
Enterprise valueOperating Cashflow 3258 967 432 950 724
Enterprise value(EBIT + DevelopmentExpenditures)
1200 1476 8958 -635 949
OTHER INFORMATION
NAME Y-2011 - CONSOLID Y-2012 - CONSOLID Y-2013 - CONSOLIDY-2014 -
CONSOLIDY-2015 - CONSOLID
Audited Audited Audited Audited Audited Audited
Financial statement type Consolid Consolid Consolid Consolid Consolid
EMIS Business Report Generated on 2016-06-02
Copyright copy 2015 EMIS all rights reserved A Euromoney Institutional Investor company Page 20 of 48
Fiscal year end December December December December December
EMIS Business Report Generated on 2016-06-02
Copyright copy 2015 EMIS all rights reserved A Euromoney Institutional Investor company Page 21 of 48
more raquo
more raquo
Company Documents - Financial DocumentsAnnual Reports
Company Documents - Corporate Act ions
June 12 2015 Polski Koncern Naftowy Orlen SA - Dividend (Mandatory) EDI - Corporate Act ions
June 04 2015 Polski Koncern Naftowy Orlen SA - Dividend (Mandatory) EDI - Corporate Act ions
June 03 2015 Polski Koncern Naftowy Orlen SA - Company Meet ing (Voluntary) EDI - Corporate Act ions
November 10 2014 Polski Koncern Naftowy Orlen SA - Company Meet ing (Voluntary) EDI - Corporate Act ions
November 10 2014 Polski Koncern Naftowy Orlen SA - Dividend (Mandatory) EDI - Corporate Act ions
June 14 2012 Polski Koncern Naftowy Orlen SA - Dividend (Mandatory) EDI - Corporate Act ions
May 29 2012 Polski Koncern Naftowy Orlen SA - Dividend (Mandatory) EDI - Corporate Act ions
December 16 2011 Polski Koncern Naftowy Orlen SA - Company Meet ing (Voluntary) EDI - Corporate Act ions
May 26 2011 Polski Koncern Naftowy Orlen SA - Company Meet ing (Voluntary) EDI - Corporate Act ions
December 13 1999 KGHM waits to decide on Catholic TV Warsaw Business Journal
By Anna KociNska TV Niepokalanow in January will get another chance to try to persuade copper concern KGHM Polska Miedzssupervisory board to invest in its proposed Catholic television station TV Familijna
November 29 1999 Elektrim picks f inancial health over long-distance license Warsaw Business Journal
By Gregory Keller Elektrims decision last week not to bid f or one of the three long-distance telephone licenses will delay but notnecessarily derail the conglomerates move to become a telecom heavyweight analysts said
November 23 1999 PSE to Enter Long-Distance Tender PNB - Polish News Bullet in
Independent Long-Distance Operator (NOM) a company owned by Tel-Energo in turn 76 percent owned by the PSE power grid company isto enter the tender f or long-distance telephone services sources reported
October 12 1999 PKN Lowers Fuel Prices PNB - Polish News Bullet in
Starting today (October 12) the Polski Koncern Naf towy (PKN) petroleum group will lower the wholesale price of its f uels by zl 50 per tonnewhich translates into a reduction of 5 groszy per litre in the price of diesel f uel and petrol at f illing stations
March 26 1998 CPN-Petrochemia Merger Conf irmed PNB - Polish News Bullet in
The Treasury Ministrys communiqu issued yesterday conf irmed earlier reports about a planned merger between the CPN petroleumdistributing giant and Petrochemia Plock
March 25 1998 CPN Petrochemia To Merge PNB - Polish News Bullet in
Unof f icial sources quoted by Zycie indicate that a merger between the CPN petroleum distributing giant and Petrochemia Plock is now certainwith the terms of the deal said to have been approved by the Treasury Ministry
News amp Reports - News
June 02 2016 PKN Orlen fuels ref ining margin edges down to USD 58bbl in May petchem margin up to EUR 995t PAP
Market InsiderWarszawa June 2 2016 (PAP) - Listed f uel f irm PKN Orlen recorded a slight decline of model ref ining margin in May to USD 58 per barrelf rom USD 62 in April and a spike in the model petchem margin to EUR 995 per ton f rom EUR 973 in the prior month data published on PKNOrlens website showed
June 02 2016 Saudi Aramco enters Balt ic market with oil supply deal with Polish PKN BBJ - Energy Today
EMIS Business Report Generated on 2016-06-02
Copyright copy 2015 EMIS all rights reserved A Euromoney Institutional Investor company Page 22 of 48
Saudi Aramco and Polands biggest ref iner PKN Orlen on Wednesday signed a contract agreed in May f or Aramco to supply PKN with 50000barrels of crude oil per day starting this month the companies said
June 01 2016 Top news from Polish polit ics economy business amp f inancial markets - 1930 PAP Market Insider
Warszawa June 1 2016 (PAP) - Following is a digest of the days top news as compiled by PAP Market Insider
June 01 2016 Top news from Polish polit ics economy business amp f inancial markets - 1630 PAP Market Insider
Warszawa June 1 2016 (PAP) - Following is a digest of the days top news as compiled by PAP Market Insider
June 01 2016 POLSKI KONCERN NAFTOWY ORLEN SA Transact ions in PKN ORLEN f inancial PAP Market Insider
instruments concluded by the person in a close relationship with the President of the PKN ORLEN Management Board Warszawa
June 01 2016 Poland Board of Sygnity appoints Jan Maciejewicz as new CEO M-Brain - News Monitoring
Wirtualny Nowy Przemysl 01 Jun 2016 online- Jan Maciejewicz has been appointed as the new CEO of the Polish IT f irm Signity replacingJanusz R Guy who was dismissed by the supervisory board on 30 May 2016
June 01 2016 Poland in talks with Iran over oil gas cooperat ion -minister Petroleum Bazaar - PetroMag
Poland is in talks with Iran over cooperation in the oil and gas sector which could result in exploration and production contracts f or Polishindustry Deputy Energy Minister Michal Kurtyka said on Monday
May 31 2016 Top news from Polish polit ics economy business amp f inancial markets - 1930 PAP Market Insider
Warszawa May 31 2016 (PAP) - Following is a digest of the days top news as compiled by PAP Market Insider BUSINESS amp EQUITYMARKET NEWS NATURAL GAS PGNIG - Listed natural gas group PGNiG recommends a dividend payment of PLN 106 bln f rom 2015 prof itwhich translates into PLN 018 per share the f irm said in a market f iling
May 31 2016 PKN ORLEN SA PKN ORLENs subsidiary - ORLEN Upstream - has purchased bonds issued by PKN ORLEN
PAP Market InsiderWarszawa May 31 2016 (ESPI) - Current report No 1392016 Polski Koncern Naf towy ORLEN SA (PKN ORLEN) hereby inf orms that inorder to optimise the management of f inancial liquidity within the ORLEN Capital Group on 31 May 2016 PKN ORLEN issued short term bondsto its subsidiary ORLEN Upstream Sp z oo (ORLEN Upstream)
May 31 2016 Top news from Polish polit ics economy business amp f inancial markets - 1630 PAP Market Insider
Warszawa May 31 2016 (PAP) - Following is a digest of the days top news as compiled by PAP Market Insider BUSINESS amp EQUITYMARKET NEWS POWER PGE - Listed power group PGE signed a letter of intent on selling PGEs telco unit Exatel to PGZ arms producerPGE said in a press statement
May 31 2016 POLSKI KONCERN NAFTOWY ORLEN SA Transact ions in PKN ORLEN f inancial PAP Market Insider
instruments concluded by the person in a close relationship with the President of the PKN ORLEN Management Board Warszawa
May 31 2016 Report Poland aims to end long-term gas supplies f rom Russia `22 Prime - Business News in English
Poland does not plan to renew a long-term gas supply contract with Russia when its current deal with Gazprom expires in 2022 Reutersreported late Monday cit ing Peter Naimsky a government of f icial responsible f or gas and power inf rastructure
May 31 2016 Warsaw Hopeful about Working with Post-sanct ions Iran PNB - Polish News Bullet in
Polish energy companies could prove to be usef ul partners f or their Iranian counterparts in sales or extraction of oil and natural gas DeputyEnergy Minister Michal Kurtyka said on Monday while taking part in the Polish-Iranian economic f orum The event was staged as part of theof f icial Warsaw visit of Iranian Minister of Foreign Af f airs dr
May 31 2016 Poland in talks with Iran over oil gas cooperat ion minister says BBJ - Energy Today
Poland is in talks with Iran over cooperation in the oil and gas sector which could result in exploration and production contracts f or Polishindustry Deputy Energy Minister Michal Kurtyka said on Monday Polish state-run gas f irm PGNiG said last year that it was looking at variousoptions in oil and gas exploration and production in Iran
May 31 2016 Treasury Looking for Synergy among Treasury Companies PNB - Polish News Bullet in
Treasury Minister Dawid Jackiewicz plans to f orm a holding of companies of strategic importance f or the state interest These companiesshould according to his plan sign long-term contracts among themselves so that money remained under Treasurys control and could beused to f inance other state needs
May 31 2016 Poland aims to end long-term gas supplies f rom Russia af ter 2022 Petroleum Bazaar - PetroMag
May 30 Poland does not plan to renew a long-term gas supply contract with Russia when its current deal with Gazprom expires in 2022 a
EMIS Business Report Generated on 2016-06-02
Copyright copy 2015 EMIS all rights reserved A Euromoney Institutional Investor company Page 23 of 48
government of f icial responsible f or gas and power inf rastructure told Reuters on Monday
May 31 2016 Polish Gas Companies Eyeing Direct LNG Supplies PNB - Economic Review
In less than 20 days the f irst commercial LNG shipment f rom Qatar will arrive at the Swinoujscie terminal This opens up new developmentpossibilit ies f or Polish gas producers traders and consumers PGNiG in pole posit ion The biggest benef iciary of the looming launch of theterminal is PGNiG
May 30 2016 Top news from Polish polit ics economy business amp f inancial markets - 1930 PAP Market Insider
Warszawa May 30 2016 (PAP) - Following is a digest of the days top news as compiled by PAP Market Insider BUSINESS amp EQUITYMARKET NEWS FOOD KERNEL - Listed edible oil producer Kernel Holding recorded a net attributable prof it of USD 923 mln in f iscal Q3 2016ended on March 31 the f irms consolidated f inancial report showed
May 30 2016 POLSKI KONCERN NAFTOWY ORLEN SA Agreements between ORLEN Capital Group and Glencore group
PAP Market InsiderWarszawa May 30 2016 (ESPI) - Current report No 1372016 Polski Koncern Naf towy ORLEN SA (PKN ORLEN) hereby inf orms that withinORLEN Capital Group there was concluded agreement with company f rom Glencore group
May 30 2016 PKN ORLEN SA Transact ions in PKN ORLEN f inancial instruments PAP Market Insider
concluded by the person in a close relationship with the President of the PKN ORLEN Management Board Warszawa
May 30 2016 Poland Press - Top Business Headlines PAP Market Insider
Warszawa May 30 2016 (PAP) - Following is a summary of the leading stories in the Polish press covering stocks and corporate news PAPdoes not verif y inf ormation contained in the Polish press BANKING CHF MORTGAGES - Polish banks prepared their own proposal f orproviding relief to the stressed CHF-mortgage borrowers
May 27 2016 PKN ORLEN SA Transact ions in PKN ORLEN f inancial instruments PAP Market Insider
concluded by the person in a close relationship with the President of the PKN ORLEN Management Board Warszawa
May 27 2016 Orlens Eurobonds Get Good Rat ings PNB - Polish News Bullet in
Fitch Ratings has conf irmed the BBB- long-term credit rating and stable outlook f or PKN Orlen The agency has also awarded the same ratingto the eurobonds to be issued by the Plock-based oil concern though on an interim basis Meanwhile Moodys gave the bonds an interimBaa3 rating PKN Orlen disclosed on Wednesday
May 24 2016 POLSKI KONCERN NAFTOWY ORLEN SA Ship-Service - has purchased bonds issued by PKN ORLEN
PAP Market InsiderWarszawa May 24 2016 (ESPI) - Current report No 1292016 Polski Koncern Naf towy ORLEN SA (PKN ORLEN) hereby inf orms that inorder to optimise the management of f inancial liquidity within the ORLEN Capital Group on 24 May 2016 PKN ORLEN issued short term bondsto its subsidiary Ship-Service SA (Ship-Service)
May 24 2016 PKN ORLEN SA PKN ORLENs subsidiary - ORLEN Upstream - has purchased bonds issued by PKN ORLEN
PAP Market InsiderWarszawa May 24 2016 (ESPI) - Current report No 1282016 Regulatory announcement no 1282016 dated 24 May 2016Polski KoncernNaf towy ORLEN SA
May 24 2016 PKN ORLEN SA Transact ions in PKN ORLEN f inancial instruments PAP Market Insider
concluded by the person in a close relationship with the President of the PKN ORLEN Management Board Warszawa
May 24 2016 PGNiG Granted Concession on Norwegian Shelf PNB - Economic Review
Piotr Wozniak president of PGNiG announced that the f irms subsidiary PGNiG Upstream International had acquired a stake in anexploratory concession located in Norway on the Barents Sea shelf
May 23 2016 PKN ORLEN SA Transact ions in PKN ORLEN f inancial instruments PAP Market Insider
concluded by the person in a close relationship with the President of the PKN ORLEN Management Board Warszawa
May 23 2016 INBRIEF PNB - Polish News Bullet in
According to Monetary Policy Council (RPP) member Eugeniusz Gatnar the data published in April signals that the economy is developing healso assesses the current level of interest rates as optimal
May 20 2016 Top news from Polish polit ics economy business amp f inancial markets - 1930 PAP Market Insider
Warszawa May 20 2016 (PAP) - Following is a digest of the days top news as compiled by PAP Market Insider BUSINESS amp EQUITY
EMIS Business Report Generated on 2016-06-02
Copyright copy 2015 EMIS all rights reserved A Euromoney Institutional Investor company Page 24 of 48
MARKET NEWS INSURANCE PZU - Listed insurer PZU will recommend shareholders take PLN 208 per share in dividends f rom 2015 prof itsin a total payout of PLN 1796 bln management said in a market f iling
May 20 2016 Top news from Polish polit ics economy business amp f inancial markets - 1630 PAP Market Insider
Warszawa May 20 2016 (PAP) - Following is a digest of the days top news as compiled by PAP Market Insider
May 20 2016 PKN ORLEN SA Transact ions in PKN ORLEN f inancial instruments PAP Market Insider
concluded by the person in a close relationship with the President of the PKN ORLEN Management Board Warszawa
May 20 2016 Thousands of Polish companies operat ing in Germany BBJ - Regional Today
Over 1700 commercial companies with Polish capital operate in Germany according to a new report by the German Chamber of Industry andCommerce (AHK) cited by the Deutsche Welle Polish businessmen perceive Germany as an attractive country in terms of investmentopportunit ies the chamber said
May 20 2016 Treasury Expect ing State-Owned Firms to Pay Dividends PNB - Polish News Bullet in
The Treasury can count on some PLN500m to be paid in dividends by those state-owned companies which have already issuedrecommendations f or shareholders concerning the matter Jastrzebska Spolka Weglowa Lotos and PKP Cargo recommend not to pay adividend due to losses suf f ered in 2015
May 18 2016 Top news from Polish polit ics economy business amp f inancial markets - 1930 PAP Market Insider
Warszawa May 18 2016 (PAP) - Following is a digest of the days top news as compiled by PAP Market Insider
May 18 2016 Update Shareholder seeks PLN 35 DPS from PKN Orlen PAP Market Insider
Warsaw May 18 2016 (PAP) - Listed f uel f irm PKN Orlen saw its shareholder NN OFE seek a PLN 35 DPS f rom 2015 prof it and retainedprof its PKN said in a market f iling The pension f und wants the company to pay PLN 1048 bln f rom 2015 prof its and PLN 4495 mln f romretained prof its giving a total of PLN 1497 bln
May 18 2016 POLSKI KONCERN NAFTOWY ORLEN SA Nat ionale-Nederlanden OFE not if ied PAP Market Insider
draf t resolution of the OGM of PKN ORLEN regarding allocation of the prof it f or the f inancial year 2015 Warszawa May 18 2016 (ESPI) -Current report No 1232016 Polski Koncern Naf towy ORLEN Spolka Akcyjna (PKN ORLEN) hereby inf orms that Nationale-NederlandenOtwarty Fundusz Emerytalny (Nationale-Nederlanden OFE) pursuant to Art
May 18 2016 Shareholder seeks PLN 35 DPS from PKN Orlen PAP Market Insider
Warsaw May 18 2016 (PAP) - Listed f uel f irm PKN Orlen saw its shareholder NN OFE seek a PLN 35 DPS f rom 2015 prof it and retainedprof its PKN said in a market f iling The pension f und wants the company to pay PLN 1048 bln f rom 2015 prof its and PLN 4495 mln f romretained prof its giving a total of PLN 1497 bln
May 18 2016 Poland Press - Top Business Headlines PAP Market Insider
Warszawa May 18 2016 (PAP) - Following is a summary of the leading stories in the Polish press covering stocks and corporate news
May 18 2016 Poland Press - Top Business Headlines PAP Market Insider
Warszawa May 18 2016 (PAP) - Following is a summary of the leading stories in the Polish press covering stocks and corporate news
May 17 2016 Top news from Polish polit ics economy business amp f inancial markets - 1930 PAP Market Insider
Warszawa May 17 2016 (PAP) - Following is a digest of the days top news as compiled by PAP Market Insider
May 16 2016 Top news from Polish polit ics economy business amp f inancial markets - 2100 PAP Market Insider
Warszawa May 16 2016 (PAP) - Following is a digest of the days top news as compiled by PAP Market Insider
May 16 2016 PKN Orlen fuels plans eurobond issue by Orlen Capital unit by end-2016 PAP Market Insider
Warsaw May 16 2016 (PAP) - Listed f uel group PKN Orlen has secured its supervisory boards approval f or a eurobonds issue within theOrlen capital group the f im said in a market f iling
May 16 2016 POLSKI KONCERN NAFTOWY ORLEN SA PKN ORLEN Supervisory Board consent to Eurobonds issue
within the ORLEN Capital Group PAP Market Insider
EMIS Business Report Generated on 2016-06-02
Copyright copy 2015 EMIS all rights reserved A Euromoney Institutional Investor company Page 25 of 48
more raquo
Warszawa May 16 2016 (ESPI) - Current report No 1192016 Polski Koncern Naf towy ORLEN Spolka Akcyjna (PKN ORLEN) hereby inf ormsthat on 16 May 2016 the PKN ORLEN Supervisory Board gave consent to start the process leading to issue of Eurobonds within ORLENCapital Group
May 16 2016 StockWatch Grupa Azoty chemicals on dividend dates Comarch IT on prof it retent ion PAP Market Insider
Warszawa May 16 2016 (PAP) - Warsaw stocks are enjoying a rebound on Monday with the large-cap index WIG20 closing up by 21 Not asinlge blue-chip suf f ered any declines with the advancers led by copper group KGHM up 51 bank PKO BP up 33 and insurer PZU up29
May 16 2016 POLSKI KONCERN NAFTOWY ORLEN SA ORLEN Paliwa - has purchased bonds issued by PKN ORLEN
PAP Market InsiderWarszawa May 16 2016 (ESPI) - Current report No 1182016 Polski Koncern Naf towy ORLEN Spolka Akcyjna (PKN ORLEN) herebyannounces that in order to optimise the management of f inancial liquidity within the ORLEN Capital Group on 16 May 2016 PKN ORLENissued short term bonds to its subsidiary ORLEN Paliwa Sp z oo (ORLEN Paliwa)
May 16 2016 POLSKI KONCERN NAFTOWY ORLEN SA Anwil - has purchased bonds issued PAP Market Insider
by PKN ORLEN Regulatory announcement no 1172016 dated 16 May 2016 Warszawa May 16 2016 (ESPI) - Current report No 1172016Polski Koncern Naf towy ORLEN SA
May 16 2016 POLSKI KONCERN NAFTOWY ORLEN SA Transact ions in PKN ORLEN f inancial PAP Market Insider
instruments concluded by the person in a close relationship with the President of the PKN ORLEN Management Board Warszawa
May 13 2016 EMIS Energy Weekly Newslet ter Issue 87 EMIS Energy - Newslet ter
News amp Reports - Reports
July 28 2015 Erste Bank - Company Reports Updates PKN Orlen Erste Bank - Company Reports
May 18 2015 Erste Bank - Company Reports Updates PKN Orlen Erste Bank - Company Reports
September 13 2012 PKN Orlen mBank Analyt ical Report
April 17 2012 PKN Orlen Erste Bank - Company Analyses
November 17 2011 PKN_Orlen mBank Analyt ical Report
August 22 2011 PKN_Orlen mBank Analyt ical Report
June 17 2011 Company Report - CEE Oil amp Gas Erste Bank - Company Analyses
March 16 2011 PKN_Orlen mBank Analyt ical Report
December 03 2010 PKN_Orlen mBank Analyt ical Report
November 02 2010 PKN Orlen - 02112010 mBank Analyt ical Report
November 18 2009 Analyt ical Report - PKN Orlen - 18112009 mBank Analyt ical Report
September 16 2009 Analyt ical Report - PKN Orlen - 16092009 mBank Analyt ical Report
June 02 2009 Analyt ical Report - PKN Orlen - 02062009 mBank Analyt ical Report
February 27 2009 Analyt ical Report - PKN Orlen - 27022009 mBank Analyt ical Report
November 20 2008 Analyt ical Report - PKN Orlen - 20112008 mBank Analyt ical Report
September 17 2008 Analyt ical Report - PKN Orlen - 17092008 mBank Analyt ical Report
EMIS Business Report Generated on 2016-06-02
Copyright copy 2015 EMIS all rights reserved A Euromoney Institutional Investor company Page 26 of 48
more raquo
August 14 2008 Analyt ical Report - PKN Orlen - 14082008 mBank Analyt ical Report
June 04 2008 Analyt ical Report - PKN Orlen - 30052008 mBank Analyt ical Report
March 10 2008 Analyt ical Report - PKN Orlen - 10032008 mBank Analyt ical Report
February 21 2008 Analyt ical Report - PKN Orlen - 14022008 mBank Analyt ical Report
December 13 2007 Analyt ical Report - PKN Orlen - 04122007 mBank Analyt ical Report
August 21 2007 Analyt ical Report - PKN Orlen - 160807 mBank Analyt ical Report
July 02 2007 Analyt ical Report - PKN Orlen mBank Analyt ical Report
March 05 2007 Analyt ical Report - PKN Orlen mBank Analyt ical Report
August 24 2006 Analyt ical Report - PKN Orlen mBank Analyt ical Report
EMIS Business Report Generated on 2016-06-02
Copyright copy 2015 EMIS all rights reserved A Euromoney Institutional Investor company Page 27 of 48
MampA and ECM Deals - EMIS DealWatch Deals
DAT ECOUNT RY
OFT ARGET
T ARGET COMPANYDEALT YPE
BUYER SELLER DEAL INDUST RIESDEAL
VALUEUSD (MN)
ST AKE
20-Jan-16CzechRepublic
68 petrol stations of OMV Acquisition PKN Orlen SA OMV AG Gasoline Stations NA 100
16-Nov-15 Poland Assets of Euronaft Trzebinia Acquisition PKP Cargo SA PKN Orlen SASupport Activities forTransportation RailTransportation
1502 100
16-Nov-15 Poland Orlen Transport SA Acquisition Trans Polonia SA PKN Orlen SA Truck Transportation 2137 100
21-Oct-15 Germany13 SUN petrol stations ofGermania Petrol
Acquisition PKN Orlen SAGermaniaPetrol GmbH
Gasoline Stations NA 100
13-Oct-15 Canada Kicking Horse Energy Inc Acquisition PKN Orlen SA NA Oil and Gas Extraction 22634 100
13-Oct-15UnitedStates
FX Energy Inc Acquisition PKN Orlen SA NAOil and Gas ExtractionAgriculture Forestry Fishingand Hunting
8310 100
24-Sep-15 PolandTwo concessions in theregions of Lesser Polandand Subcarpathia
Acquisition PKN Orlen SADEADeutscheErdoel AG
Oil and Gas Extraction NA 100
20-Aug-15CzechRepublicPoland
Orlen KolTrans Sp z oo Acquisition PKP Cargo SA PKN Orlen SA Rail Transportation 4860 9985
20-Jul-15 Poland Bieszczady ProjectJointventure
PKN Orlen SA PolskieGornictwo Naftowe iGazownictwo SA
NA Oil and Gas Extraction NA 100
03-Jul-14CzechRepublic
Ceska Rafinerska ASMinoritystakepurchase
PKN Orlen SA Eni SpA Petroleum Refineries 4100 32445
14-May-14 Poland Orlen Medica Acquisition PZU TFI SA PKN Orlen SAHealth Care and SocialAssistance
1380 100
14-May-14 Poland Prof Med Sp z oo Acquisition PZU SA PKN Orlen SAHealth Care and SocialAssistance
119 9645
08-May-14 CanadaBirchill Exploration LimitedPartnership
Acquisition PKN Orlen SA
Bregal -BirchillInvestmentsSarl
Oil and Gas Extraction 23366 100
07-Nov-13CzechRepublic
Ceska Rafinerska ASMinoritystakepurchase
PKN Orlen SARoyal DutchShell Plc
Petroleum Refineries 2720 1633
16-Sep-13 Canada TriOil Resources Ltd Acquisition PKN Orlen SA NA Crude Petroleum Extraction 17753 100
07-Dec-12 Poland Shale gas licenses Acquisition PKN Orlen SAExxonMobilPoland
Natural Gas Extraction NA 100
02-Nov-12 Poland Anwil SAMinoritystakepurchase
PKN Orlen SA NAPesticide Fertilizer andOther Agricultural ChemicalManufacturing
2364 473
20-Aug-12 Poland Petrolot Acquisition PKN Orlen SAPolskie LinieLotnicze LOTSA
Petroleum and PetroleumProducts MerchantWholesalers
9241 49
01-Jun-12 Poland Gas bottle assets Acquisition Gaspol SA PKN Orlen SA Nonstore Retailers NA 100
01-Aug-11 Poland Anwil SAMinoritystakepurchase
PKN Orlen SA Energa SAPesticide Fertilizer andOther Agricultural ChemicalManufacturing
2158 415
MampA and ECM Deals - EMIS DealWatch Intents
EMIS Business Report Generated on 2016-06-02
Copyright copy 2015 EMIS all rights reserved A Euromoney Institutional Investor company Page 28 of 48
DEALSIDE
INT ENTANNOUNCEMENT
T ARGETT ARGET
COUNT RYT ARGET INDUST RY
DEALT YPE
INVEST OR
Sell-side
13-Nov-15Orlen TransportSA
Poland Truck Transportation Acquisition Trans Polonia SA
Sell-side
23-Jul-15Czech railtransport unit ofPKN Orlen
CzechRepublic
Rail Transportation Acquisition NA
Buy-side
06-May-15 Fuel stationsAustriaGermanySwitzerland
Gasoline Stations Acquisition PKN Orlen SA
Sell-side
20-Oct-14Orlen KolTransSp z oo
Poland Rail Transportation Acquisition PKP Cargo SA
Buy-side
10-Jun-14Kicking HorseEnergy Inc
Canada Oil and Gas Extraction Acquisition PKN Orlen SA
Sell-side
29-May-14 ORLEN Lietuva Lithuania Petroleum Refineries Acquisition NA
Buy-side
05-Sep-13
BirchillExplorationLimitedPartnership
Canada Oil and Gas Extraction Acquisition PKN Orlen SA
Sell-side
23-Aug-13Medical centresin Plock andWloclawek
Poland Hospitals amp Health Care Acquisition NA
Buy-side
27-Jun-13 Fuel stationsCzechRepublicGermany
Gasoline Stations Acquisition PKN Orlen SA
Sell-side
25-Jul-12 Neste Polska Poland Other Gasoline Stations Acquisition Lotos SA PKN Orlen SA
Sell-side
01-Mar-12
OsrodekBadawczo-RozwojowyPrzemysluRafineryjnegoSA
PolandPetrochemical ManufacturingPetroleum Refineries
Privatization PKN Orlen SA Warter
Sell-side
20-Dec-11 Lotos SA Poland
Other Gasoline StationsGasoline Stations withConvenience Stores PetroleumRefineries Crude PetroleumExtraction
Privatizationthroughstockexchange
PKN Orlen SA Polskie Gornictwo Naftowe iGazownictwo SA
Buy-side
20-Jun-11Fuel stations inGermany
GermanyOther Gasoline StationsGasoline Stations withConvenience Stores
Acquisition PKN Orlen SA
Sell-side
02-May-11
Anwils fertilizerassets AnwilsPVC productionassets
PolandPoland
Plastics and Rubber ProductsManufacturing PesticideFertilizer and Other AgriculturalChemical Manufacturing
Acquisition ZA Pulawy
Sell-side
14-Mar-11Rafineria NaftyJedlicze
Poland Petroleum Refineries Privatization PKN Orlen SA
Sell-side
30-Nov-10 CeproCzechRepublic
Gasoline Stations BasicChemical ManufacturingPetroleum and Coal ProductsManufacturing
MergerEni SpA PKN Orlen SA Royal Dutch Shell PlcSlovnaft
Sell-side
02-Nov-10 Lotos SA PolandPetroleum and Coal ProductsManufacturing Oil and GasExtraction
Minoritystakepurchase
ExxonMobil Corp Gazprom Neft KulczykInvestments SA Magyar Olaj- Es Gazipari Nyrt(MOL) Mercuria Energy Group Ltd PKN Orlen SAPolskie Gornictwo Naftowe i Gazownictwo SA TNK-BP
Buy-side
16-Sep-10Gasolinestations
CzechRepublic
Gasoline Stations Acquisition PKN Orlen SA Unipetrol
EMIS Business Report Generated on 2016-06-02
Copyright copy 2015 EMIS all rights reserved A Euromoney Institutional Investor company Page 29 of 48
Buy-side
16-Sep-10Petrochemicalrefinery
CzechRepublic
Petroleum Refineries
AcquisitionMinoritystakepurchase
PKN Orlen SA
Sell-side
21-Jul-10Polkomtel Sp zoo
PolandWireless TelecommunicationsCarriers (except Satellite)
Acquisition Zygmunt Solorz-Zak - private investor
EMIS Business Report Generated on 2016-06-02
Copyright copy 2015 EMIS all rights reserved A Euromoney Institutional Investor company Page 30 of 48
Fiscal year 2014Companies in Industries 43
IndustryPetroleum Refineries
This company is scored higher thanonly 5266 of companies in theindustry which equates to B - BelowAverage Risk on the Financial Scale Expected
Participation inCustomers Credit
Fiscal year 2014Companies in Industries 43
IndustryPetroleum Refineries
Criteria Weight Score Final Score
I EMIS Benchmark Score 90 207 B Below Average Risk
SIZ E RANKING SCORE
Sales 1 10000
Assets 1 10000
Profit 41 698
Total Shareholders Equity 1 10000
Average Size 11 7675
GROWT H RANKING SCORE
Net Sales Growth Rate 11 7674
Inc Dec in Assets 20 5581
Inc Decin Net Income 24 4651
Increase (Decrease) in Equity 22 5116
Average Growt h 19 5756
PROFIT ABILIT Y RANKING SCORE
Net Income Net Sales 29 3488
Return On Assets 38 1395
Net Income Net Worth 39 1163
Average Prof it abilit y 35 2015
INDEBT EDNESS RANKING SCORE
Indebtedness 22 5116
Leverage 33 2558
Total Liabilities Sales 17 6279
Average Indebt edness 24 4651
II EMIS Trend Score 10 298 E Very High Risk
Scoring Range 1 - Improves 2 - Maintains (According to the tolerance margin) 3 - Deteriorate
EMIS Credit Analytics - Summary
EMIS Financial ScoreEMIS Financial Score was not affected by Conditions
EMIS Benchmark Score
B Below Average Risk
5266
EMIS Trend Score
E Very High Risk
PampL E
Balance Sheet C
Cash Flow E
EMIS Credit Quota
21112537Thousands (USD)
Average Ranking 21 in 43 companies
RELAT IVEST RENGT HS
RELAT IVEWEAKNESSES
Sales Net Income Sales
Sales Growth
Remarks
EMIS Trend Score is calculated based on the 2latest annual company financial statements
Remarks
Credit Quota Recommended was calculatedbased on the industry average customer type(customized) and Financial Score
EMIS Credit Analyt ics - EMIS Financial Score
EMIS Financial ScoreEMIS Financial Score was not affected by Conditions
EMIS Benchmark Score 5266
11
EMIS Business Report Generated on 2016-06-02
Copyright copy 2015 EMIS all rights reserved A Euromoney Institutional Investor company Page 31 of 48
100
PampL 2014 T OT AL
Sales Growth 3 3
Operating Profit Sales 3 3
Net Income Sales 3 3
T ot al PampL 300 300
BALANCE 2014 T OT AL
Days Receivables 2 2
Days Inventory 1 1
Current Ratio 3 3
Indebtness (Total AssetsTotal Liabilities) 3 3
Total Liabilities Sales 3 3
T ot al Balance 230 230
CASH FLOW 2014 T OT AL
Cash from Sales 3 3
Cash for Production 2 2
Cash for Operation 1 1
Net Operation Cash Generation (NOCG) 3 3
Free Cash Flow 3 3
Cash Flow After Financial Expenses 3 3
Cash Flow After Financial 3 3
Reduction in Debt 2 2
T ot al Cash Flow 267 267
III EMIS Financial Score 100 216 CC Above Average Risk
E D C CC B BB A AA
Business Scale
AA - Very Low RiskA - Low RiskBB - Moderate Low RiskB - Below Average RiskCC - Above Average RiskC - Moderate High RiskD - High RiskE - Very High Risk
E Very High Risk
C Moderate High Risk
E Very High Risk
EMIS Credit Analyt ics - EMIS Benchmark Score
EMIS Business Report Generated on 2016-06-02
Copyright copy 2015 EMIS all rights reserved A Euromoney Institutional Investor company Page 32 of 48
Fiscal year 2014Companies in Industries 43
IndustryPetroleum Refineries
SIZ E RANKING SCORE
Sales 1 10000
Assets 1 10000
Profit 41 698
Total Shareholders Equity 1 10000
Average Size 11 7675
GROWT H RANKING SCORE
Net Sales Growth Rate 11 7674
Inc Dec in Assets 20 5581
Inc Decin Net Income 24 4651
Increase (Decrease) in Equity 22 5116
Average Growt h 19 5756
PROFIT ABILIT Y RANKING SCORE
Net Income Net Sales 29 3488
Return On Assets 38 1395
Net Income Net Worth 39 1163
Average Prof it abilit y 35 2015
INDEBT EDNESS RANKING SCORE
Indebtedness 22 5116
Leverage 33 2558
Total Liabilities Sales 17 6279
Average Indebt edness 24 4651
Average Ranking 21
Fiscal year 2014Companies in Industries 43
IndustryPetroleum Refineries
EMIS Credit Quota(Score adjusted)
21112537Thousands (USD)
Participation in credit Financial Score
CC
EMIS Benchmark Score(Against Industry)
5266
EMIS Credit Analyt ics - EMIS Credit Quota
Key parameters af f ecting quota value
COMPANY INDICAT ORS VALUE INDUST RY MULT IPLIERS MAX CALCULAT ED CREDIT
Assets 1332259352 Suppliers Assets 2801 373173079
Net Worth 581261405 Suppliers Net worth 6383 371042677
Tangible Net Worth 604356752 Suppliers Tangible Net Worth 6383 385785372
Net Sales 3067917427 Suppliers Net Sales 1352 414818151
11
EMIS Business Report Generated on 2016-06-02
Copyright copy 2015 EMIS all rights reserved A Euromoney Institutional Investor company Page 33 of 48
Source EMIS Company Database
AVERAGE CREDIT
(BASED ON INDUSTRY)
319886918THOUSANDS (USD)
XEXPECT ED PART ICIPAT ION
(IN CUSTOMERS CREDIT)
11
FINANCIAL SCORE
CC
=
=
CALCULAT ED CREDIT
(AVERAGE X PARTICIPATION)
35187561THOUSANDS (USD)
X
QUOT A ADJUST MENT S
06
=CREDIT QUOT A
(ADJUSTED BY SCORE)
21112537THOUSANDS (USD)
Fiscal year 2014Companies in Industries 43
IndustryPetroleum Refineries
NIP 7740001454 Headquart ers T el +48 (24) 3650000
Cost of Goods Sold 3048984945 Suppliers Cost of Goods Sold 1363 415427048
Operating Profit -134323677 Suppliers Operating Profit -30832 000
Net Profit -165687728 Suppliers Net Profit -26041 000
SUPPLIERS 378193431 Net Sales 3067917427 Financial Liabilities Net Sales 002 715239
Assets 1332259352 Financial Liablities Assets 005 643434
FINANCIAL LIABILIT IES 000 Operating Cycle 1617 Operating Cycle 592663 501950211
Suppliers Turnover 1273 Suppliers Turnover 490503 415427048
AVERAGE CREDIT BASED ON INDUST RY 1121907398
Credit Quota Calculation
Score Multipliers
QUOT A ADJUST MENT S ACCORDING T O T HE FINAL SCORE FINANCIAL SCALE MULT IPLIERS
Expanded QuotaAA 2
A 15
Normal Quota BB 1
Reduced Quota
B 08
CC 06
C 04
No QuotaD 02
E 0
EMIS Credit Analyt ics - Conclusions
EMIS Business Report Generated on 2016-06-02
Copyright copy 2015 EMIS all rights reserved A Euromoney Institutional Investor company Page 34 of 48
Ul Chemikoacutew 7
09-411
Fax +48 (24) 3654040
Email zarzadorlenpl
RELAT IVE ST RENGT HS RANKING SCORE
Sales 1 100
Sales Growth 11 7674
EMIS Credit Quota(Score adjusted)
21112537Thousands (USD)
Participation in credit Financial Score
CC
Date 2016 June 2
Fiscal year 2014Companies in Industries 43
IndustryPetroleum Refineries
Polski Koncern Naftowy ORLEN SAEMIS Credit Analytics
EMIS Benchmark Score (Business Performance Score) is based on financial statements as of 2014 EMIS Benchmark Score of Polski Koncern Naf t owy ORLEN SA is
the result of comparing its financial results with that of 43 companies classified by EMIS Credit Analytics within Pet roleum Ref ineries industry
EMIS Benchmark Score(Against Industry)
5266Note Companies classified in Pet roleum Ref ineries are not necessarily direct competitors Please refer to Benchmark Ranking for complete details of the companies
classified within this industry
EMIS Benchmark Score is the result of the companys ranking within its industry in different financial ratios of Size Profitability Growth Indebtness Efficiency and Liquidity
Ratios In the result it is important to note
EMIS Benchmark Score contributes 90 to the Financial Score The other 10 is represented by evolution versus previous period of Profit amp Loss Balance Sheet and
Cash Flow Statement
EMIS T REND SCORE
Profit amp Loss E
Balance Sheet C
Cash Flow Statement E
EMIS Financial ScoreEMIS Financial Score was not affected by Conditions
Note The Financial Score is not deteriorated by Financial Conditions (see Parameters)
Based on the average credit quote of 11219074 in the Pet roleum Ref ineries industry an EMIS Financial Score of CC and an expected participation in the companyscredit of 11 the recommended credit quota is 740459Note The Financial Score is not deteriorated by Financial Conditions Based on the average credit quote of 11219074 in the Petroleum Refineries industry an EMISFinancial Score of CC and an expectedparticipation in the companys credit of 11 the recommended credit quota is 740459
Key parameters af f ecting quota value
EMIS Credit Analyt ics - Company vs Industry Key Stats
Company vs Industry - Key Stats
REPORTING DETAILS
11
EMIS Business Report Generated on 2016-06-02
Copyright copy 2015 EMIS all rights reserved A Euromoney Institutional Investor company Page 35 of 48
2014 2013 2012
Statement type Individual Individual Individual
Audited Non-Audited Non-Audited Non-Audited
Provider NotoriaMonitor B Fins NotoriaMonitor B Fins NotoriaMonitor B Fins
Companies in Industry 43 54 52
EMIS Benchmark Score 5266 6892 7170
Reporting Standard 197 197 197
Displaying units USD Thousands USD Thousands USD Thousands
SIZ E
2014 2014 2013 2012
AVERAGEINDUST RY
VALUE RANKING VALUE RANKING VALUE RANKING
Sales 915054 30679174 1 37904382 1 38981804 1
Assets 441712 13322594 1 17049137 1 16979933 1
Profit -47512 -1656877 41 58433 1 756549 1
Total Shareholders Equity 193824 5812614 1 9147078 1 9132469 1
Average Size Posit ion 11 1 1
GROWT H
2014 2014 2013 2012
AVERAGEINDUST RY
VALUE RANKING VALUE RANKING VALUE RANKING
Net Sales Growth Rate 2089 -575 11 -551 16 1190 12
Inc Dec In Assets 1610 -901 20 -243 22 -1039 30
Inc DecIn Net Income -406205 -340170 24 -9249 28 -078 17
Increase (Decrease) In Equity -0 77 -2601 22 -267 21 563 13
Average Growt h Posit ion 19 22 18
PROFIT ABILIT Y
2014 2014 2013 2012
AVERAGEINDUST RY
VALUE RANKING VALUE RANKING VALUE RANKING
Net Income Net Sales -519 -540 29 015 25 194 17
Return On Assets -1076 -1244 38 034 23 446 16
Net Income Net Worth -2451 -2850 39 064 36 828 28
Operational Profit Sales -439 -438 27 027 25 168 18
Average Prof it abilit y Posit ion 33 27 20
INDEBT EDNESS
2014 2014 2013 2012
AVERAGEINDUST RY
VALUE RANKING VALUE RANKING VALUE RANKING
Indebtedness 5612 5637 22 4635 21 4622 22
Leverage 12789 12920 33 8639 36 8593 40
Total Liabilities Sales 2709 2448 17 2085 17 2013 21
EMIS Business Report Generated on 2016-06-02
Copyright copy 2015 EMIS all rights reserved A Euromoney Institutional Investor company Page 36 of 48
Fiscal year 2014Companies in Industries 43
IndustryPetroleum Refineries
Current Liabilities Total Liabilities 6146 6279 7 7210 11 6768 11
Average Indebt edness Posit ion 20 21 24
EFFICIENCY
2014 2014 2013 2012
AVERAGEINDUST RY
VALUE RANKING VALUE RANKING VALUE RANKING
Days Receivables 23 24 8 24 10 24 6
Days Inventory 36 33 16 46 19 48 23
Suppliers Turnover 49 45 10 50 15 45 15
Operational Cycle 59 57 11 70 13 72 14
Average Ef f iciency Posit ion 11 14 15
LIQUIDIT Y
2014 2014 2013 2012
AVERAGEINDUST RY
VALUE RANKING VALUE RANKING VALUE RANKING
Current Ratio 128 132 19 142 21 157 22
Quick Ratio 132 132 19 142 21 157 22
Working Capital 42581 1486941 1 2418659 1 3019099 1
Average Liquidit y Posit ion 13 14 15
OT HERS
2014 2014 2013 2012
AVERAGEINDUST RY
VALUE RANKING VALUE RANKING VALUE RANKING
Gross Profit 0 76 062 31 491 34 614 33
Other Income -1926 -1852 32 64868 3 5153 6
Reduction In Debt 158 0 13 0 17 0 12
Average Ot hers Posit ion 25 18 17
EMIS Credit Analyt ics - Company vs Industry Balance Sheet
Company vs Industry - Balance Sheet
REPORTING DETAILS
2014 2013 2012
Statement type Individual Individual Individual
Audited Non-Audited Non-Audited Non-Audited
Provider NotoriaMonitor B Fins NotoriaMonitor B Fins NotoriaMonitor B Fins
Companies in Industry 43 54 52
EMIS Benchmark Score 5266 6892 7170
Reporting Standard 197 197 197
EMIS Business Report Generated on 2016-06-02
Copyright copy 2015 EMIS all rights reserved A Euromoney Institutional Investor company Page 37 of 48
CURRENT ASSET S 2014INDUST RY
2014COMPANY
2013INDUST RY
2013COMPANY
2012INDUST RY
2012COMPANY
V H V H V H V H V H V H
Cash And Banks 1003 11838 1034 6846 533 410 559 851 482 -4599 502 -5387
Short Term Investments 003 -404 000 NA 004 -7992 000 NA 018 457613 000 NA
Account Receivables (Trade) 1320 1670 1510 -915 1313 -821 1513 -380 1346 -1338 1534 005
Inventory 2075 -1109 2104 -2851 2710 -1100 2677 -841 2866 -1097 2852 -789
Deferred Assets 014 -1494 007 -4068 020 -2569 011 -3444 025 -385 017 16719
Current Assets 4413 1190 4656 -1101 4579 -900 4760 -533 4737 -1703 4906 -1431
FIXED ASSET
2014INDUST RY
2014COMPANY
2013INDUST RY
2013COMPANY
2012INDUST RY
2012COMPANY
V H V H V H V H V H V H
- Land And Properties 4838 1574 4846 -907 4853 -232 4850 065 4677 -1788 4701 -690
- Other Equipments 004 -262 000 NA 004 6983 000 NA 002 -1186 000 NA
Fixed Assets 4872 1626 4846 -907 4865 -275 4850 065 4710 -1737 4701 -690
Intangible Assets (Net) 202 823 150 -1458 217 -2685 160 -4312 279 -652 275 199
Investments 240 4117 265 2041 197 13125 200 21858 080 2964 061 5970
Deferred Assets 281 11870 082 15497 149 -2699 029 -4916 193 5695 056 -2566
Total Long Term Assets 5585 1962 5344 -720 5421 -302 5240 036 5263 -1044 5094 -625
T OT AL ASSET S
2014INDUST RY
2014COMPANY
2013INDUST RY
2013COMPANY
2012INDUST RY
2012COMPANY
V H V H V H V H V H V H
Total Assets 10000 1610 10000 -901 10000 -585 10000 -243 10000 -1368 10000 -1039
CURRENT LIABILIT Y
2014INDUST RY
2014COMPANY
2013INDUST RY
2013COMPANY
2012INDUST RY
2012COMPANY
V H V H V H V H V H V H
Suppliers 2801 1472 2839 -1163 2835 -082 2923 603 2691 -3100 2690 -2855
Other Short Term Liabilities 13741 2571 701 5233 12691 320 419 -676 11578 NA 438 NA
Total Current Liability 3449 2100 3540 -362 3309 -111 3342 424 3151 -1924 3128 -1691
LONG T ERM LIABILIT Y
2014INDUST RY
2014COMPANY
2013INDUST RY
2013COMPANY
2012INDUST RY
2012COMPANY
V H V H V H V H V H V H
Long Term Deferred Liabilities 839 -299 028 -299 1004 -2717 026 -2717 1298 NA 035 NA
Other Long Term Liabilities 2187 6238 2070 4861 1564 -1129 1267 -1525 1659 -3979 1459 -3665
Long Term Liabilities 2163 6134 2097 4757 1556 -1368 1293 -1553 1698 -3494 1494 -3513
T OT AL LIABILIT Y
2014INDUST RY
2014COMPANY
2013INDUST RY
2013COMPANY
2012INDUST RY
2012COMPANY
V H V H V H V H V H V H
Total Liabilities 5612 3390 5637 1066 4866 -551 4635 -215 4848 -2553 4622 -2383
EQUIT Y
2014INDUST RY
2014COMPANY
2013INDUST RY
2013COMPANY
2012INDUST RY
2012COMPANY
V H V H V H V H V H V H
EMIS Business Report Generated on 2016-06-02
Copyright copy 2015 EMIS all rights reserved A Euromoney Institutional Investor company Page 38 of 48
Fiscal year 2014Companies in Industries 43
IndustryPetroleum Refineries
Capital 212 3149 226 000 187 -325 206 000 182 -237 201 003
Other Reserves 11156 3618 263 000 9512 000 239 000 8955 -143 233 -2444
Equity Appreciation -178 -439428 -173 -142830 005 5496 -010 -47857 003 4198565 003 NA
Retained Earnings 3652 -439 3702 -2707 4435 -418 4618 -192 4357 -050 4594 1065
Minority Interest 5213 074 346 075 6008 -1233 312 -1231 6451 -1929 347 -1929
Total Net Worth 4388 -077 4363 -2601 5134 -618 5365 -267 5152 153 5378 563
T OT AL LIABILIT Y AND EQUIT Y
2014INDUST RY
2014COMPANY
2013INDUST RY
2013COMPANY
2012INDUST RY
2012COMPANY
V H V H V H V H V H V H
Total Liabilities And Net Worth 10000 1610 10000 -901 10000 -585 10000 -243 10000 -1368 10000 -1039
EMIS Credit Analyt ics - Company vs Industry Income Statement
Company vs Industry - Income Statement
REPORTING DETAILS
2014 2013 2012
Statement type Individual Individual Individual
Audited Non-Audited Non-Audited Non-Audited
Provider NotoriaMonitor B Fins NotoriaMonitor B Fins NotoriaMonitor B Fins
Companies in Industry 43 54 52
EMIS Benchmark Score 5266 6892 7170
Reporting Standard 197 197 197
OPERAT ING PROFIT
2014INDUST RY
2014COMPANY
2013INDUST RY
2013COMPANY
2012INDUST RY
2012COMPANY
V H V H V H V H V H V H
Sales 10000 2089 10000 -575 10000 -1145 10000 -551 10000 500 10000 1190
Cost Of Goods Sold 9924 2648 9938 -150 9485 -1062 9509 -427 9396 612 9386 1253
Gross Profit 0 76 -8210 062 -8814 515 -2441 491 -2451 604 -978 614 313
Administrative AndGeneral Expenses
149 3309 141 420 135 -905 127 -479 132 -638 126 379
Selling Expenses 2650 5320 364 095 2091 094 340 028 1835 1798 320 578
Operational Profit -439 -165868 -438 -163453 034 -8046 027 -8483 154 -2807 168 -206
NON OPERAT ING INCOME
2014INDUST RY
2014COMPANY
2013INDUST RY
2013COMPANY
2012INDUST RY
2012COMPANY
V H V H V H V H V H V H
Total Non-Operating Revenue 036 465 033 -2304 042 -6818 040 -6944 117 -4630 125 -4930
- Financial Revenue 036 465 033 -2304 042 -6818 040 -6944 117 -4630 125 -4930
Total Non-Operating Expenses 190 24437 176 20967 067 -2118 053 -3252 075 -6320 075 -5970
- Financial Expenses 190 24438 176 20967 067 -2119 053 -3252 075 -6320 075 -5970
Other Extraordinary Result 0 00 10000 000 NA -000 9992 000 NA -000 NA -000 NA
EMIS Business Report Generated on 2016-06-02
Copyright copy 2015 EMIS all rights reserved A Euromoney Institutional Investor company Page 39 of 48
Fiscal year 2014Companies in Industries 43
IndustryPetroleum Refineries
Profit Before Income Taxes -594 -909715 -580 -407834 008 -9639 014 -9402 196 -1306 217 -601
T AXES AND OT HERS
2014INDUST RY
2014COMPANY
2013INDUST RY
2013COMPANY
2012INDUST RY
2012COMPANY
V H V H V H V H V H V H
Extraordinary Income (Charges) 0 02 8819 005 4250 002 NA 004 NA 000 -10000 000 NA
Changes Due To Consolidation 027 -8018 002 -8023 162 -5086 008 -5086 292 -4973 014 -4977
Income Tax -0 74 -468549 -039 -72388 -002 7245 006 -8524 -006 -11275 038 -4155
NET PROFIT
2014INDUST RY
2014COMPANY
2013INDUST RY
2013COMPANY
2012INDUST RY
2012COMPANY
V H V H V H V H V H V H
Net Income -519 -406205 -540 -340170 016 -9342 015 -9249 213 544 194 -078
EMIS Credit Analyt ics - Company vs Industry Cash Flow
Company vs Industry - Cash Flow
REPORTING DETAILS
2014 2013 2012
Statement type Individual Individual Individual
Audited Non-Audited Non-Audited Non-Audited
Provider NotoriaMonitor B Fins NotoriaMonitor B Fins NotoriaMonitor B Fins
Companies in Industry 43 54 52
EMIS Benchmark Score 5266 6892 7170
Reporting Standard 197 197 197
CASH OPENING BALANCE
2014INDUST RY
2014COMPANY
2013INDUST RY
2013COMPANY
2012INDUST RY
2012COMPANY
V H V H V H V H V H V H
Initial Cash 222 410 267 851 257 -4599 232 -5387 422 9240 474 8565
CASH FROM SALES
2014INDUST RY
2014COMPANY
2013INDUST RY
2013COMPANY
2012INDUST RY
2012COMPANY
V H V H V H V H V H V H
Net Sales 10000 2089 10000 -575 10000 -1145 10000 -551 10000 500 10000 1190
+- Trade AccountsReceivable
-0 91 -28672 066 13160 059 -4685 027 779616 098 16969 -000 9978
Cash From Sales 9909 1908 10066 -539 10059 -1179 10027 -525 10098 763 10000 1377
CASH FOR PRODUCT ION
2014INDUST RY
2014COMPANY
2013INDUST RY
2013COMPANY
2012INDUST RY
2012COMPANY
V H V H V H V H V H V H
(-) Sales Cost -9924 -2648 -9938 150 -9485 1062 -9509 427 -9396 -612 -9386 -1253
(-) (Inc) Inventory 125 -1020 364 21062 168 -1077 111 -183 167 13866 106 12570
(+) (Inc) Suppliers 174 188875 -162 -30445 -012 9818 075 11510 -572 -26577 -468 -25767
EMIS Business Report Generated on 2016-06-02
Copyright copy 2015 EMIS all rights reserved A Euromoney Institutional Investor company Page 40 of 48
Cash For Production -9625 -2474 -9736 159 -9328 1572 -9324 962 -9801 -961 -9748 -1525
CASH FOR OPERAT ING
2014INDUST RY
2014COMPANY
2013INDUST RY
2013COMPANY
2012INDUST RY
2012COMPANY
V H V H V H V H V H V H
(-) Administrative Expenses -149 -3309 -141 -420 -135 905 -127 479 -132 638 -126 -379
+- Other Operating Results -0 00 -12524 000 NA 001 NA 000 NA 000 NA 000 NA
(-) Selling Expenses -2650 -5320 -364 -095 -2091 -094 -340 -028 -1835 -1798 -320 -578
(-) Period Income Taxes 074 468549 039 72388 002 -7245 -006 8524 006 11275 -038 4155
(+) (Inc) Taxes Payable 002 69344 000 NA -000 -14351 000 NA 001 17119 000 NA
(-) (Inc) Labor EstimatesAnd Provision
-0 12 9215 -000 9200 -189 -12719 -004 -12717 614 184104751 015 NA
Cash For Operation -2736 -3712 -466 794 -2413 -5873 -477 379 -1346 2282 -469 405
OPERAT IONAL CASHFLOW
2014INDUST RY
2014COMPANY
2013INDUST RY
2013COMPANY
2012INDUST RY
2012COMPANY
V H V H V H V H V H V H
Net Operating Cashflow -2453 -7631 -137 -15709 -1682 -4202 225 19816 -1049 1952 -217 -3750
INVEST MENT S IN ASSET S
2014INDUST RY
2014COMPANY
2013INDUST RY
2013COMPANY
2012INDUST RY
2012COMPANY
V H V H V H V H V H V H
(-) (Inc) Net Fixed Assets -329 -67408 210 151250 069 -8689 -014 -10872 468 25487 152 12255
(ndash) (Inc) Investments -0 34 2746 -020 7025 -056 -47405 -062 -48471 -009 -10215 -010 -10826
FREE CASHFLOW
2014INDUST RY
2014COMPANY
2013INDUST RY
2013COMPANY
2012INDUST RY
2012COMPANY
V H V H V H V H V H V H
Free Cashflow -2816 -10396 054 -6596 -1669 -15077 150 28813 -589 5095 -075 -33837
FINANCIAL
2014INDUST RY
2014COMPANY
2013INDUST RY
2013COMPANY
2012INDUST RY
2012COMPANY
V H V H V H V H V H V H
(-) Financial Expenses -154 -65083 -143 -92333 -025 -15241 -013 -12496 042 20392 050 -1713
Cashflow After Financial Costs -2969 -11196 -089 -16127 -1694 -17395 136 60823 -547 5391 -025 -12770
(+) (Inc) Debt Short Term -000 9949 000 NA -000 -21237 000 NA 000 10091 000 NA
(+) (Inc) Debt Long Term 002 69344 000 NA -000 -14351 000 NA 001 17119 000 NA
Cashflow After FinancialExpenses
-2968 -11175 -089 -16127 -1694 -17455 136 60823 -546 5512 -025 -12770
CASHFLOW
2014INDUST RY
2014COMPANY
2013INDUST RY
2013COMPANY
2012INDUST RY
2012COMPANY
V H V H V H V H V H V H
(-) Dividends 503 42726 -126 -4528 -186 682 -082 -1139 -176 -73580 -069 -52834
(-) Other Expenses 002 8819 005 4250 002 NA 004 NA 000 -10000 000 NA
(-) Other Current Debtors 000 NA 000 NA 000 NA 000 NA 000 NA 000 NA
(-) Other Current Assets 002 -7807 002 -2258 011 361835 003 15505 000 10702 -005 -48602
(-) Long-Term AccountsReceivable
000 NA 000 NA 000 NA 000 NA 000 NA 000 NA
EMIS Business Report Generated on 2016-06-02
Copyright copy 2015 EMIS all rights reserved A Euromoney Institutional Investor company Page 41 of 48
(-)(Inc) Deferred And OtherLong Term Assets
-0 72 -37515 -022 -26027 032 11570 013 4240 -178 -88060 008 14351
(-) (Inc) Other Long TermLiabilities
406 56718 294 37011 -105 8205 -103 7364 -518 -37893 -368 -40951
(+) Inflation Adjustmentst Non Recurring Incomes
000 NA 000 NA 000 NA 000 NA 000 NA 000 NA
(+) (Inc) Other AccountsPayable
115 218744 105 82115 -007 -10274 -014 -10676 216 2710149 191 NA
(+) Extraordinary Income Consolidation
027 -8018 002 -8023 162 -5085 008 -5057 292 -4974 014 -5006
(-) Intangible Goods -007 -12244 011 -8077 040 29906 055 230557 009 12060 -002 8712
Complementary Cash-Flow 976 240248 271 31907 -051 8725 -117 5210 -356 -14616 -230 -28078
Net Cash Generation -1992 -3796 183 77289 -1745 -7131 020 10729 -902 -10194 -255 -21675
Ending Cash -1770 -4381 449 6846 -1488 -17434 251 851 -480 -11112 219 -5387
EMIS Business Report Generated on 2016-06-02
Copyright copy 2015 EMIS all rights reserved A Euromoney Institutional Investor company Page 42 of 48
Score Scale
Financial ScaleFinancial Model has 8 risk categories
A - Very Low RiskAA - Low RiskBB - Moderate Low RiskB - Below Average RiskCC - Above Average RiskC - Moderate High RiskD - High Risk E - Very High Risk
Risk Profile
High RiskHigh Risk - used when the loan amounts are relatively high and have a longrepayment period A loss in the Credit would seriously affect the companyresults Commercial credit with maturity exceeding 36 months
A loss in the Credit would seriously affect the results Bank credited to morethan 36 months
Vertical Weighting
Pampl
Sales Growth 12
Operating Profit 12
Net Profit 12
Sub t ot al 36
Balance
Days Receivables 12
Days Inventory 10
Current Ratio 8
Indebtness 8
Indebtednesssales 8
Balance Sub T ot al 46
Cash Flow
Cash From Sales 2
Cash For Production 2
Cash For Operations 2
Operating Cash Generation 5
Free Cash Flow 3
Cash Flow After Fin Ex 2
Cash Flow After Fin Result 2
Reduction In Debt 0
Cash Flow Sub T ot al 18
Total Vertical Weights 100
Tolerance Margin 5
Financial Conditions
Condit ions Score
Negative Net Worth CC
Final Weighting
EMIS Benchmark Score 90
EMIS Trend Score 10
EMIS Credit Analyt ics - EMIS Credit Analyt ics Assumptions
EMIS Business Report Generated on 2016-06-02
Copyright copy 2015 EMIS all rights reserved A Euromoney Institutional Investor company Page 43 of 48
Ret urn on Asset s (ROA)
An indicator of how profitable a company is relative to its total assets ROA gives an
idea as to how efficient management is at using its assets to generate earnings
Calculated by dividing a companys annual earnings by its total assets
Calculated as Net prof it T ot al Asset
Ret urn on Equit y (ROE)
A measure of a corporations profitability that reveals how much profit a company
generates with the money shareholders have invested
Calculated as Net prof it Shareholders equit y
Ret urn on Sales (ROS)
A ratio widely used to evaluate a companys operational efficiency ROS is also
known as a firms operating profit margin
Calculated as Net Prof it Net Sales Revenue
Bookvalue
A companys common stock equity as it appears on a balance sheet equal to total
assets minus liabilities preferred stock and intangible assets such as goodwill
Current Rat io
A liquidity ratio that measures a companys ability to pay short-term obligations
Calculated as Current Asset sCurrent Liabilit ies
Quick rat io
An indicator of a companys short-term liquidity The quick ratio measures a
companys ability to meet its short-term obligations with its most liquid assets The
higher the quick ratio the better the position of the company
Calculated as (Current Asset s-Invent ories)Current Liabilit ies
Debt t o equit y
A measure of a companys financial leverage calculated by dividing its total
liabilities by stockholders equity It indicates what proportion of equity and debt the
company is using to finance its assets
Calculated as T ot al Liabilit iesShareholders Equit y
Debt t o t ot al asset s
A metric used to measure a companys financial risk by determining how much of
the companys assets have been financed by debt Calculated by adding short-term
and long-term debt and then dividing by the companys total assets
Calculated as Short T erm Debt s+Long T erm Debt sT ot al Asset s
Leverage rat io
Leverage ratio provide an indication of the long term solvency of the firm
Calculated as T ot al Asset sShareholders Equit y
Debt Ent erprise Value
This metric is equivalent to the payback period used by debtholders Calculated as
Debt Ent erprise Value
Market Capit alizat ionEBIT DA
Calculated as Market Capit alizat ionEBIT DA
Earning Bef ore Int erest s and T axes (EBIT )
Earning Before Interests and Taxes (EBIT)
EBIT DA
Earnings before interest taxes depreciation and amortization (EBITDA) is a non-
GAAP metric that can be used to evaluate a companys profitability Calculated as
Ent erprise valueNet Sales
Dividing the enterprise value of a firm by its sales or revenues is a way of
comparing firms in cyclical industries Calculated as Enterprise Value Net Sales
Revenue
Ent erprise valueGross income
Calculated as Enterprise value Gross income
Ent erprise valueT ot al Asset s
Calculated as Enterprise value Total Assets
EBIT DA Margin
A measurement that provides a clear view of the companyrsquos core profitability
Calculated as EBITDA Net Sales Revenue
T ot al Operat ing Revenue T rend
Calculated as Total Operating Revenue current year Total Operating Revenue
previous year
Gross Prof it T rend
Calculated in percentage as (Gross Prof it Current Year Gross Prof it
Previous Year) ndash 1
EBIT DA T rend
Calculated as EBITDA current year EBITDA previous year
Account s Receivables T rend
Calculated in percentage as T rade Account s Receivables current year
T rade Account Receivables previous year
Invent ory T rend
Calculated as Inventories current year Inventories previous year
Net Propert y Plant and Equipment (PPampE) T rend
Calculated as Net PPampE current year Net PPampE previous year
T ot al Asset s T rend
Calculated as Total Assets current year Total Assets previous year
Bookvalue T rend
Calculated as Bookvalue current year Bookvalue previous year
Shareholders Equit y T rend
Calculated as Shareholdersrsquo Equity current year Shareholdersrsquo Equity previous
year
Cash f rom Operat ions T rend
Calculated as Net Cash Flow from Operations current year Net Cash Flow from
Operations previous year
Capit al Expendit ures T rend
Calculated as CAPEX current year CAPEX previous year
Dividend per Share T rend
Calculated as Dividend value per (common) share current year Dividend value
per (common) share previous year
Cost t o Income Rat io
A key financial measure showing a bankrsquos cost in relation to its income Ratio is
calculated as Total Operational Cost Total Operational Income
Glossary
EMIS Business Report Generated on 2016-06-02
Copyright copy 2015 EMIS all rights reserved A Euromoney Institutional Investor company Page 44 of 48
EBIT DA = Operat ing Revenue - Operat ing Expenses (Depriciat ion and
Amort izat ion excluded)
Ent erprise Value EBIT DA
Enterprise Value EBITDA is the metric most used to measure how many years it
would take to pay back the investment
Ent erprise Value
A measure of a companys value often used as an alternative to straightforward
market capitalization EV is calculated as market cap plus debt minority interest
and preferred shares minus total cash and cash equivalents
Dooms day rat io
Calculated as Cash Current Liabilit ies
Long T erm Debt t o Capit al
A ratio showing the financial leverage of a firm calculated by dividing long-term
debt by the amount of capital available Calculated as Long t erm debt Long
t erm debt + Pref f ered St ock + Common St ock
Int erest Coverage Rat io
A ratio used to determine how easily a company can pay interest on outstanding
debt The interest coverage ratio is calculated by dividing a companys earnings
before interest and taxes (EBIT) of one period by the companys interest expenses of
the same period Calculated as EBIT Int erest expense
Cash Flow t o Debt
This coverage ratio compares a companys operating cash flow to its total debt
which for purposes of this ratio is defined as the sum of short-term borrowings the
current portion of long-term debt and long-term debt This ratio provides an
indication of a companys ability to cover total debt with its yearly cash flow from
operations The higher the percentage ratio the better the companys ability to carry
its total debt Calculates as Operat ing Cash Flow T ot al Debt
Ret urn on Capit al
A ratio that indicates the efficiency and profitability of a companys capital
investments Calculated as Net Income (Total Asset - Current Liabilities)
Gross Prof it Margin
A financial metric used to assess a firms financial health by revealing the
proportion of money left over from revenues after accounting for the cost of goods
sold Gross profit margin serves as the source for paying additional expenses and
future savings Calculated as (Net Sales Revenue - Cost of Goods Sold) Net
Sales Revenue
Operat ing Prof it Margin
A ratio used to measure a companys pricing strategy and operating efficiency
Calculated as Operat ing prof it Net sales
Account s Receivable T urnover
An accounting measure used to quantify a firms effectiveness in extending credit
as well as collecting debts The receivables turnover ratio is an activity ratio
measuring how efficiently a firm uses its assets Calculated as Net Sales
Revenue T rade Account s Receivable (Net )
Invent ory T urnover
A ratio showing how many times a companys inventory is sold and replaced over a
period Calculated as Sales Invent ory
Current asset t urnover
Calculated as Net Sales Revenue T ot al Current Asset
Ef f iciency Rat io
Calculated as Total non-interest expenses (Total net interest income + Total non-
interest income)
Loans t o Deposit s Rat io
A commonly used statistic for assessing a banks liquidity Calculated as Total
Loans Total Deposits
Liquid Asset s t o Deposit s Rat io
This ratio indicates extent of liquidity maintained by a bank for meeting the demand
made by the depositors Calculated as (Cash + Financial assets held for trading)
Total Deposits
Loans t o Asset Rat io
Calculated as Total Loans Total Assets
Net Int erest Income T rend
Calculated as Net Interest Income current year Net Interest Income previous year
Net Fee and Commission Income T rend
Calculated as Net Fee and Commission Income current year Net Fee and
Commission Income previous year
Loans and Advances t o Cust omers T rend
Calculated as Loans and Advances to Customers current year Loans and
Advances to Customers previous year
Deposit s f rom Cust omers T rend
Calculated as Deposits from Customers current year Deposits from Customers
previous year
Loss Rat io
This ratio indicates the average cost of insurance protection per each dollar of net
premiums earned during the period Calculated as Total Losses Incurred in Claims
Net Insurance Premium Revenue
Underwrit ing Expenses Rat io
This ratio measures operational efficiency in underwriting Calculated as
Underwriting expenses Net Insurance Premium Revenue
Policyholder Dividend Rat io
Calculated as Dividends Net Insurance Premium Revenue
Combined LossExpense Rat io
Calculated as Loss Ratio + Underwriting Expenses Ratio + Policyholder Dividend
Ratio When the combined ratio is under 100 underwriting results are
considered profitable when the combined ratio is over 100 underwriting results
are considered unprofitable
Ceded Premium Rat io
Calculated as Insurance Premium Ceded to Reinsurers Insurance Premium
Revenue
Net Premiums Earned T rend
Calculated as Net Insurance Premium Revenue current year Net Insurance
Premium Revenue previous year
Fees and Commissions T rend
Calculated as Net Fees and Commissions Income current year Net Fees and
Commissions Income previous year
Net Invest ment Income T rend
EMIS Business Report Generated on 2016-06-02
Copyright copy 2015 EMIS all rights reserved A Euromoney Institutional Investor company Page 45 of 48
Fixed-asset t urnover
This ratio is a rough measure of the productivity of a companys fixed assets
(property plant and equipment or PPampE) with respect to generating sales For most
companies their investment in fixed assets represents the single largest
component of their total assets This annual turnover ratio is designed to reflect a
companys efficiency in managing these significant assets Simply put the higher
the yearly turnover rate the better Calculated as Revenue Propert y Plant and
Equipment
Asset T urnover
The amount of sales generated for every dollars worth of assets It is calculated by
dividing sales in dollars by assets in dollars Calculated as Revenue Asset s
Revenue T rend
Calculated as (Net Sales Current Year Net Sales Previous Year)
Net Income T rend
Calculated as (Net Income Current Year Net Income Previous Year)
Operat ing Income T rend
Calculated as (Operat ing Income Current Year Operat ing Income
Previous year)
PriceBook Rat io
A ratio used to compare a stocks market value to its book value It is calculated by
dividing the current closing price of the stock by the latest years book value per
share Calculated as St ock price (T ot al Asset - Int angible asset s and
Liabilit ies)
PriceEarnings Rat io
A valuation ratio of a companys current share price compared to its per-share
earnings Calculated as Market value per share Earning per share EPS
Market capShareholder equit y
A financial ratio showing the premium which is included in the current market price
compared to the actual value of Shareholder equity of the company Calculated as
Market capit alizat ion Shareholders equit y
PriceEBIT Rat io
The PriceEBIT ratio is a market value indicator similar to the PE ratio which shows
the number of times the market price exceeds the earnings per share before the
effects of gross interest abnormal items and tax The PriceEBIT ratio is calculated
as follows Valuat ion price EBIT
T ot al Capit al Rat io
Calculated as T ot al capit al (T ier 1 and T ier 2) rat io = T ot al capit al (T ier 1
and T ier 2) Risk-adjust ed asset s
T ier 1 Rat io
Tier 1 capital is the core measure of a banks financial strength from a regulators
point of view It consists primarily of shareholders equity but may also include
preferred stock that is irredeemable and non-cumulative and retained earnings
Risk Weight ed Asset s
Risk weights are in five categories from zero to 100 per cent Those carrying a
zero weight include notes and coins gold matched by gold liabilities balances with
the Reserve Bank and commonwealth government securities with less than twelve
months to maturity Commonwealth government securities with more than twelve
months to maturity carry a 10 per cent risk weighting as do state government
securities Claims on other banks Australian local governments and public-sector
organisations other than those with corporate status or which operate
Calculated as Investment Income current year Investment Income previous year
Receivables Arising Out Of Direct Insurance Operat ions T rend
Calculated as Receivables Arising out of Direct Insurance Operations current year
Receivables Arising out of Direct Insurance Operations previous year
Operat ing ROA
An indicator that shows the type of net profit which is actually generated by business
effort Calculated as Operat ing Prof it (EBIT ) T ot al Asset s
Payables T urnover
An indicator that evaluates how fast a company pays off its creditors (suppliers)
Calculated as Purchases T rade Payables
Working Capit al T urnover
A measure that indicates how efficiently the company generates revenue with its
working capital Working capital is defined as current assets minus current liabilities
Calculated as Net Sales (T ot al Current Asset s ndash T ot al Current
Liabilit ies)
Working Capit al
A measure of a companyrsquos short term financial health Calculated as T ot al
Current Asset s ndash T ot al Current Liabilit ies
Cash Rat io
A measure of a companyrsquos liquidity in crisis situation Only highly marketable
securities and cash are included Calculated as (T ot al Cash and Cash
Equivalent s + Market able securit ies) T ot al Current Liabilit ies
Cash Flow f rom Operat ion Rat io
A measure of how well current liabilities are covered by the cash flow generated
from a companyrsquos operations Calculated as Net Cash Flow f rom Operat ing
Act ivit ies T ot al Current Liabilit ies
Debt Coverage
A measure that shows a companyrsquos ability to cover total debt with its yearly cash
flow from operations Calculated as Net Cash Flow f rom Operat ing Act ivit ies
T ot al Debt
Cash Flow t o Revenue
This ratio measures the amount of operating cash flow generated for each dollar of
revenue Calculated as Net Cash Flow f rom Operat ing Act ivit ies Net Sales
Revenue
Cash Ret urn on Asset s
This ratio measures the return of operating cash flow attributed to all providers of
capital Calculated as Net Cash Flow f rom Operat ing Act ivit ies T ot al
Asset s
Cash Ret urn on Equit y
This ratio measures the return of operating cash flow attributed to shareholders
Calculated as Net Cash Flow f rom Operat ing Act ivit ies T ot al
Shareholdersrsquo Equit y
Cash t o Income
This ratio measures the ability to generate cash from companyrsquos operations
Calculated as Net Cash Flow f rom Operat ing Act ivit ies Operat ing Prof it
(EBIT )
CashT ot al Asset s
Calculated as Cash and Cash Equivalent s T ot al Asset s
EMIS Business Report Generated on 2016-06-02
Copyright copy 2015 EMIS all rights reserved A Euromoney Institutional Investor company Page 46 of 48
commercially carry a 20 per cent risk weighting Loans secured by a mortgage
over residential property and with a loan-to-valuation of 80 per cent or less carry a
50 per cent risk weighting and loans to companies or individuals carry a 100 per
cent risk weighting
Market Cap Net cash
A ratio measure the market value of the company to the Net cash position of the
company Calculated as Market capit alizat ion (Cash and cash equivalent s
minus long-t erm debt )
Net Cash
Net cash is commonly used in evaluating a companys cash flow More generally
net cash can refer to the amount of cash remaining after a transaction has been
completed and all charges and deductions related to the transaction have been
subtracted Calculated as T ot al cash minus t ot al short t erm liabilit ies
Annualised Ret urn on Equit y (ROE)
Return on Equity ratio (ROE) converted into an annual basis
Annualised Ret urn on Asset s (ROA)
Return on Assets ratio (ROA) converted into an annual basis
Export Proport ion Rat io
The percentage figure of the proportion of the export revenue from the total sales
revenue of the company Calculated as Export revenue T ot al revenue
Net Debt
A metric that shows companys overall debt situation by netting the value of
financial liabilities with its cash and other similar liquid assets Calculated as
financial liabilities - cash and cash equivalents
EPS
The portion of a companys profit allocated to each outstanding share Calculated
as Net Profit Outstanding Shares
PE
A valuation ratio of a companys current share price compared to its per-share
earnings Calculated as Market value per share Earning per share EPS
Market Capit alizat ionNet Sales
Calculated as Market Capitalization Net Sales Revenue
Market Capit alizat ionGross income
Calculated as Market Capitalization Gross Profit
Market Capit alizat ionEBIT
Calculated as Market Capitalization EBIT
Market Capit alizat ionT ot al Asset s
Calculated as Market Capitalization Total Assets
ReceivablesT ot al asset s
Calculated as T rade Account s Receivable T ot al Asset s
Invent oriesT ot al asset s
Calculated as Invent ories T ot al Asset s
Fixed asset sT ot al asset s
Calculated as Non-current Asset s T ot al Asset s
Current Liabilit iesT ot al Liabilit ies
Calculated as T ot al Current Liabilit ies T ot al Liabilit ies
Salaries and Employee Benef it sNet sales
Calculated as Employee Benef it Expenses Net Sales Revenue
Administ rat ive ExpensesNet Sales
Calculated as Administ rat ive Expenses Net Sales Revenue
Depreciat ion and Amort izat ionNet sales
Calculated as Depreciat ion Amort izat ion and Impairment Charges Net
Sales Revenue
Int erest paidNet sales
Calculated as Int erest -t ype Expenses Net Sales Revenue
Income t axNet sales
Calculated as Income T ax Net Sales Revenue
Operat ing Cash Flow t o T ot al Cash Flow
Calculated as Net Cash Flow f rom Operat ing Act ivit ies Net
IncreaseDecrease in Cash and Cash Equivalent s
Cash Flow f rom Invest ing t o T ot al Cash Flow
Calculated as Net cash f low f rom (used in) invest ing act ivit ies Net
IncreaseDecrease in Cash and Cash Equivalent s
Cash f low f rom f inancing t o T ot al cash f low
Calculated as Net cash flow from (used in) financing activities Net
IncreaseDecrease in Cash and Cash Equivalents
Average Yie ld on Asset s
Calculated as T ot al Int erest Income T ot al Asset s
Disclaimer
Whilst EMIS attempts at all times to ensure the accuracy and reliability of the information it provides due to the vast quantity of processed data and the fact that some of
the third-party data cannot always be verified including information provided directly by the subject of the enquiry EMIS does not guarantee the correctness or the
effective delivery of the information and shall not be held responsible for any errors or omissions therein
The content and recommendations shall only be used as a reference in business decisions of EMIS clients and shall not be used for any other purposes EMIS and its
affiliates shall not be held liable for any loss of the clients arising out of its own business decisions whether or not the making of such decision has been referred to this
contentrecommendation
EMIS Business Report Generated on 2016-06-02
Copyright copy 2015 EMIS all rights reserved A Euromoney Institutional Investor company Page 47 of 48
EMIS Business Report Generated on 2016-06-02
Copyright copy 2015 EMIS all rights reserved A Euromoney Institutional Investor company Page 48 of 48
- Table of Contents
- Company Tear Sheet
-
- Contact Information
- NAICS Industry Classification
- Business description
- Basic Information
- EMIS Financial Score
- Share Price information
- Key Executives
- Ownership Details
- Subsidiaries and Affiliates
- Key Financial Highlights
- Financial Performance Charts
- Latest MampA and ECM Deals
- Top Competitors
-
- Financial Statements
-
- Annual Statements
- Interim Statements
- Ratios
- Multiples
-
- Company Documents
-
- Financial DocumentsAnnual Reports
- Corporate Actions
-
- News amp Reports
-
- News
- Reports
-
- MampA and ECM Deals
-
- EMIS DealWatch Deals
- EMIS DealWatch Intents
-
- EMIS Credit Analytics
-
- Summary
- EMIS Financial Score
- EMIS Benchmark Score
- EMIS Credit Quota
- Conclusions
- Company vs Industry Key Stats
- Company vs Industry Balance Sheet
- Company vs Industry Income Statement
- Company vs Industry Cash Flow
- EMIS Credit Analytics Assumptions
-
- Glossary
- Disclaimer
-
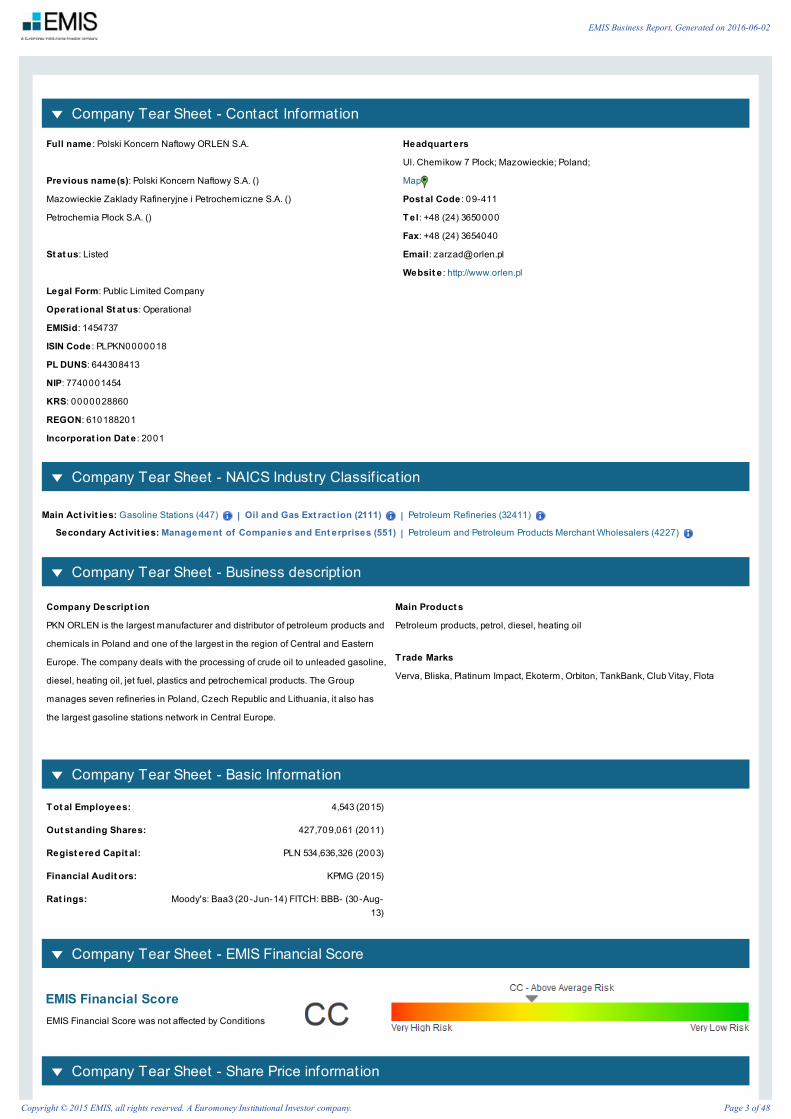
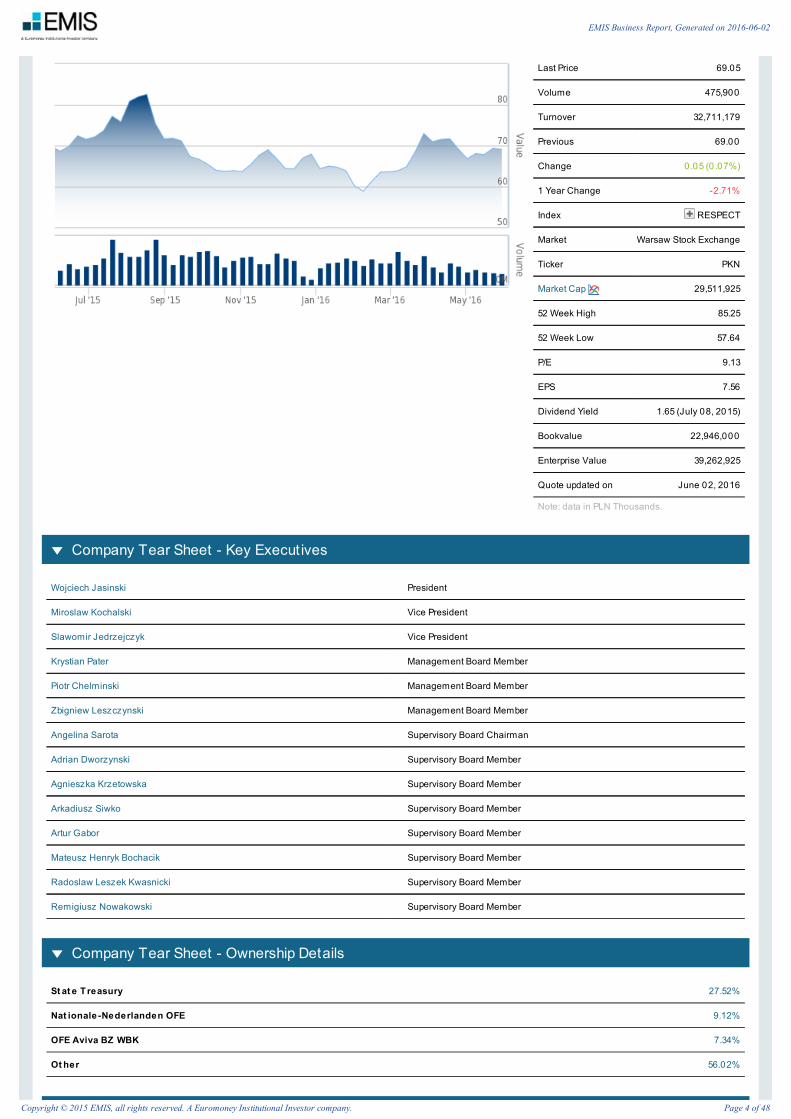
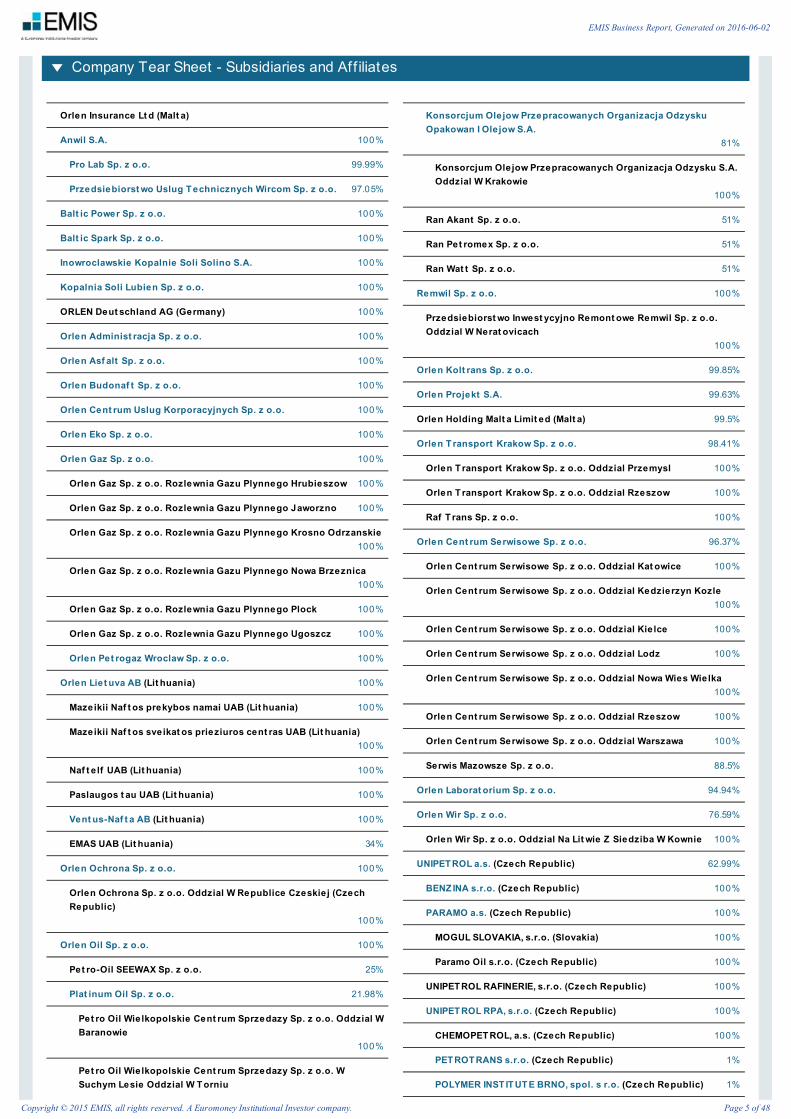
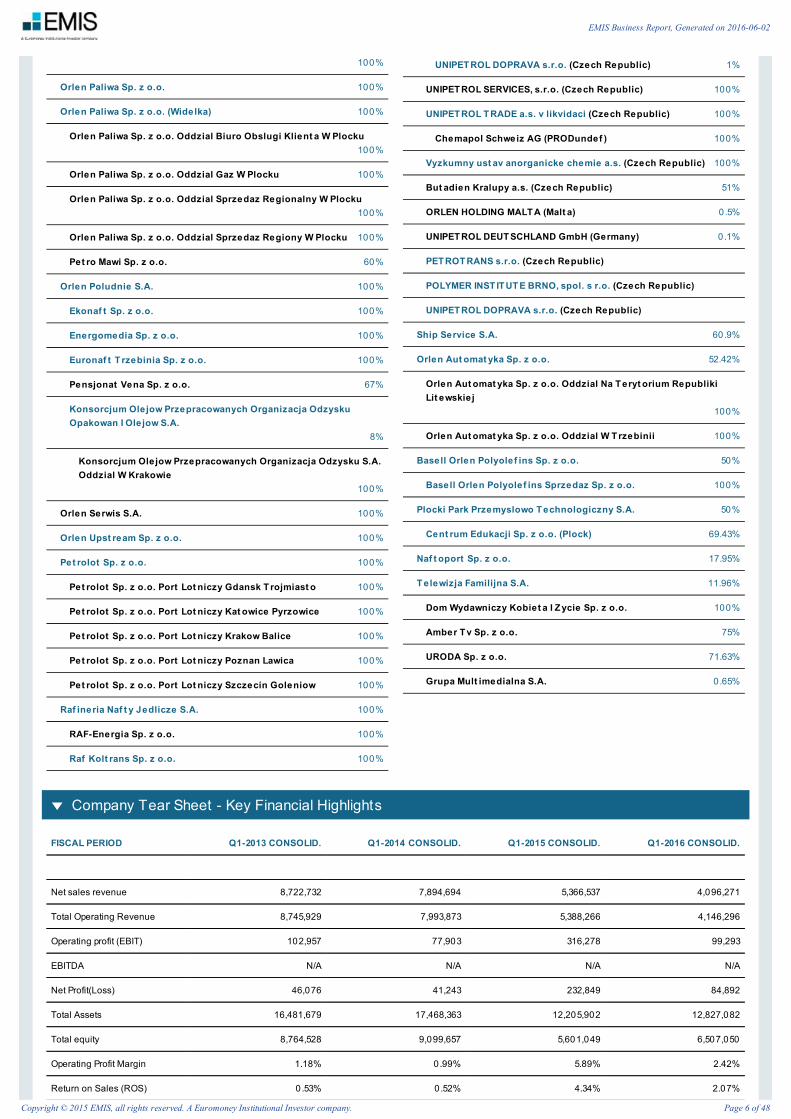
100
Orlen Paliwa Sp z oo 100
Orlen Paliwa Sp z oo (Widelka) 100
Orlen Paliwa Sp z oo Oddzial Biuro Obslugi Klient a W Plocku100
Orlen Paliwa Sp z oo Oddzial Gaz W Plocku 100
Orlen Paliwa Sp z oo Oddzial Sprzedaz Regionalny W Plocku100
Orlen Paliwa Sp z oo Oddzial Sprzedaz Regiony W Plocku 100
Pet ro Mawi Sp z oo 60
Orlen Poludnie SA 100
Ekonaf t Sp z oo 100
Energomedia Sp z oo 100
Euronaf t T rzebinia Sp z oo 100
Pensjonat Vena Sp z oo 67
Konsorcjum Olejow Przepracowanych Organizacja OdzyskuOpakowan I Ole jow SA
8
Konsorcjum Olejow Przepracowanych Organizacja Odzysku SAOddzial W Krakowie
100
Orlen Serwis SA 100
Orlen Upst ream Sp z oo 100
Pet rolot Sp z oo 100
Pet rolot Sp z oo Port Lot niczy Gdansk T rojmiast o 100
Pet rolot Sp z oo Port Lot niczy Kat owice Pyrzowice 100
Pet rolot Sp z oo Port Lot niczy Krakow Balice 100
Pet rolot Sp z oo Port Lot niczy Poznan Lawica 100
Pet rolot Sp z oo Port Lot niczy Szczecin Goleniow 100
Raf ineria Naf t y Jedlicze SA 100
RAF-Energia Sp z oo 100
Raf Kolt rans Sp z oo 100
UNIPET ROL DOPRAVA sro (Czech Republic) 1
UNIPET ROL SERVICES sro (Czech Republic) 100
UNIPET ROL T RADE as v likvidaci (Czech Republic) 100
Chemapol Schweiz AG (PRODundef ) 100
Vyzkumny ust av anorganicke chemie as (Czech Republic) 100
But adien Kralupy as (Czech Republic) 51
ORLEN HOLDING MALT A (Malt a) 05
UNIPET ROL DEUT SCHLAND GmbH (Germany) 01
PET ROT RANS sro (Czech Republic)
POLYMER INST IT UT E BRNO spol s ro (Czech Republic)
UNIPET ROL DOPRAVA sro (Czech Republic)
Ship Service SA 609
Orlen Aut omat yka Sp z oo 5242
Orlen Aut omat yka Sp z oo Oddzial Na T eryt orium RepublikiLit ewskie j
100
Orlen Aut omat yka Sp z oo Oddzial W T rzebinii 100
Basell Orlen Polyolef ins Sp z oo 50
Basell Orlen Polyolef ins Sprzedaz Sp z oo 100
Plocki Park Przemyslowo T echnologiczny SA 50
Cent rum Edukacji Sp z oo (Plock) 6943
Naf t oport Sp z oo 1795
T elewizja Familijna SA 1196
Dom Wydawniczy Kobiet a I Z ycie Sp z oo 100
Amber T v Sp z oo 75
URODA Sp z oo 7163
Grupa Mult imedialna SA 065
Company Tear Sheet - Key Financial Highlights
FISCAL PERIOD Q1-2013 CONSOLID Q1-2014 CONSOLID Q1-2015 CONSOLID Q1-2016 CONSOLID
Net sales revenue 8722732 7894694 5366537 4096271
Total Operating Revenue 8745929 7993873 5388266 4146296
Operating profit (EBIT) 102957 77903 316278 99293
EBITDA NA NA NA NA
Net Profit(Loss) 46076 41243 232849 84892
Total Assets 16481679 17468363 12205902 12827082
Total equity 8764528 9099657 5601049 6507050
Operating Profit Margin 118 099 589 242
Return on Sales (ROS) 053 052 434 207
EMIS Business Report Generated on 2016-06-02
Copyright copy 2015 EMIS all rights reserved A Euromoney Institutional Investor company Page 6 of 48
Return on Equity (ROE) 0 0 0 0
Debt to equity 3491 3563 5255 3958
Quick ratio 0 61 058 076 078
Cash Ratio 008 006 025 030
Provider EMIS - Global EMIS - Global EMIS - Global EMIS - Global
FISCAL PERIOD Q1-2013 CONSOLID Q1-2014 CONSOLID Q1-2015 CONSOLID Q1-2016 CONSOLID
Note data in USD Thousands
Company Tear Sheet - Financial Performance Charts
Company Tear Sheet - Latest MampA and ECM Deals
DAT ECOUNT RY OF
T ARGETT ARGET COMPANY
DEALT YPE
BUYER SELLER DEAL INDUST RIESDEAL VALUE
USD (MN)ST AKE
20-Jan-16CzechRepublic
68 petrol stations of OMV AcquisitionPKNOrlen SA
OMV AG Gasoline Stations NA 10000
16-Nov-15 PolandAssets of EuronaftTrzebinia
AcquisitionPKPCargo SA
PKN Orlen SASupport Activities for RailTransportation Rail Transportation
1502 10000
16-Nov-15 Poland Orlen Transport SA AcquisitionTransPoloniaSA
PKN Orlen SA Truck Transportation 2137 10000
21-Oct-15 Germany13 SUN petrol stations ofGermania Petrol
AcquisitionPKNOrlen SA
GermaniaPetrol GmbH
Gasoline Stations NA 10000
13-Oct-15 Canada Kicking Horse Energy Inc AcquisitionPKNOrlen SA
NA Oil and Gas Extraction 22634 10000
Company Tear Sheet - Top Competitors
Gasoline Stat ions
COMPANYT OT AL
OPERAT INGREVENUE
OPERAT INGPROFIT(EBIT )
NETPROFIT (LOSS)
RET URN ONASSET S (ROA)
()
RET URN ONEQUIT Y (ROE)
()
PRICE PEREARNING
()
EARNINGPER
SHARE
PRICEREFERENCE
DAT E
FISCALYEAR
EMIS Business Report Generated on 2016-06-02
Copyright copy 2015 EMIS all rights reserved A Euromoney Institutional Investor company Page 7 of 48
PKN Orlen SA 23519124 1082999 856701 672 NA 898 194 2016-06-01 2015
Lotos SA 6030487 112195 -69771 -137 NA -1896 -0 37 2016-06-01 2015
Lotos Paliwa Spz oo
5621684 13710 7267 114 511 NA 2013
BP Europa SEOddzial WPolsce
3723751 38592 20434 186 1725 NA 2014
Statoil Sp z oo 1402338 26528 16288 331 568 NA 2015
Anwim SA 779702 2173 1458 211 1213 NA 2014
Shell SelfService Sp zoo
237738 -21189 -21345 -3716 -6211 NA 2013
Apexim Ab 211286 10493 7846 1487 2560 NA 2011
Aris Polska Spz oo (Poznan)
146365 47 -20 -023 -303 NA 2014
Pw Alicja Sp zoo
138096 1150 488 135 627 NA 2014
Falco sp j 136471 1646 1512 913 2134 NA 2014
Oil and Gas Extract ion
COMPANYT OT AL
OPERAT INGREVENUE
OPERAT INGPROFIT (EBIT )
NETPROFIT (LOSS)
RET URN ONASSET S (ROA) ()
PRICE PEREARNING ()
EARNINGPER SHARE
PRICEREFERENCE
DAT E
FISCALYEAR
PKN OrlenSA
23519124 1082999 856701 672 898 194 2016-06-01 2015
Lotos SA 6030487 112195 -69771 -137 -1896 -0 37 2016-06-01 2015
Petroleum Refineries
COMPANYT OT AL
OPERAT INGREVENUE
OPERAT INGPROFIT(EBIT )
NETPROFIT (LOSS)
RET URN ONASSET S
(ROA) ()
RET URN ONEQUIT Y (ROE)
()
PRICE PEREARNING
()
EARNINGPER
SHARE
PRICEREFERENCE
DAT E
FISCALYEAR
PKN Orlen SA 23519124 1082999 856701 672 NA 898 194 2016-06-01 2015
Lotos SA 6030487 112195 -69771 -137 NA -1896 -0 37 2016-06-01 2015
Orlen Poludnie SA 446323 8937 30232 1760 2763 NA 2014
Rafineria NaftyJedlicze SA
129461 3589 1496 158 317 NA 2011
Janusz FijalkowskiBossoil
82218 128 9 006 111 NA 2011
Fabryka ParafinNaftowax Sp z oo
63126 1584 1137 542 825 NA 2013
Pol Naft Ag Sp zoo
28811 284 214 3917 7590 NA 2014
Paragran Sp z oosp k
18911 180 241 417 9226 NA 2013
Bitunova Sp z oo(REGON530941152)
17947 1876 1497 1800 2450 NA 2014
Rafineria W JasleSp z oo
11456 549 439 1903 8636 NA 2014
Hellenic Oil Sp zoo
11294 252 199 3185 4301 NA 2014
Note data in USD Thousands
EMIS Business Report Generated on 2016-06-02
Copyright copy 2015 EMIS all rights reserved A Euromoney Institutional Investor company Page 8 of 48
Financial Statements - Annual Statements - EMIS Global Template
REPORTING DETAILS
NAME Y-2011 - CONSOLID Y-2012 - CONSOLID Y-2013 - CONSOLIDY-2014 -
CONSOLIDY-2015 - CONSOLID
Begin date of reporting period 2011-01-01 2012-01-01 2013-01-01 2014-01-01 2015-01-01
End date of reporting period 2011-12-31 2012-12-31 2013-12-31 2014-12-31 2015-12-31
Original units as reported PLN Thousands PLN Thousands PLN Thousands PLN Thousands PLN Thousands
Displaying units USD Thousands USD Thousands USD Thousands USD Thousands USD Thousands
Comments Notes Notes Notes Notes Notes
Audited Audited Audited Audited Audited Audited
Balance Sheet
NAME Y-2011 - CONSOLID Y-2012 - CONSOLID Y-2013 - CONSOLIDY-2014 -
CONSOLIDY-2015 - CONSOLID
Exchange rat e used f or currencyconversion (IFRS)
342 310 301 351 390
Total Assets 17186012 16979933 17049137 13322594 12339340
Non-current assets 8368684 8649826 8933267 7119925 7013919
Property plant and equipment 7777448 7982966 8268260 6456432 6289508
Intangible assets and goodwill 387149 466834 273240 200445 332727
Long-term financial assets 78116 86463 289177 284843 236087
Investment properties 62419 69364 71713
Investments in subsidiaries 3841 3871 204183 191606 198406
Deferred assets 116909 95819 50133 109774 93563
Non-current deferred tax assets 116909 95819 50133 109774 93563
Other non-current assets 9061 17744 52457 68431 62034
Current Assets 8808981 8309137 8110890 6192974 5300556
Inventories 4768689 4842883 4564741 2802521 2746661
Trade and other receivables 2361740 2605175 2579017 2022126 1702340
Current trade receivables 2361740 2605175 2579017 2022126 1702340
Prepayments accrued income and otherdeferred current assets
9857 29036 19588
Short term Financial assets 85865 118725 54781 245780 249673
Other current financial assets 85865 118725 54781 245780 249673
Cash amp Cash Equivalents 1582831 713318 892762 1122548 601882
Assets of disposal group classified as heldfor sale
8347 20970 4980 9694 24865
Total Equity and liabilities 17186012 16979933 17049137 13322594 12339340
Total equity 7841834 9132469 9147078 5812614 6214657
Equity attributable to owners of the parent 7179076 8542715 8614874 5352133 5683781
Issued capital 309485 341334 351262 301665 271206
Foreign currency translation reserve 116060 4517 -17596 -230953 117146
Retained earnings 6394411 7801007 7873838 4931569 4980903
Other reserves 359119 395858 407371 349852 314527
EMIS Business Report Generated on 2016-06-02
Copyright copy 2015 EMIS all rights reserved A Euromoney Institutional Investor company Page 9 of 48
Minority interest 662758 589754 532205 460481 530876
Total Liabilities 9344178 7847464 7902058 7509979 6124683
Non-current liabilities 3546556 2967157 2604914 3508497 2621568
Non-current loans and borrowings 3083570 2477094 2160359 2757185 2084284
Deferred revenue accrued expenses andother deferred non-current liabilities
221557 221964 181939 21385 172772
Provisions for other liabilities and charges 181828 212931 218459 202156 182000
Other non-current liabilities 59601 55168 44157 527771 182513
Current Liabilities 5797622 4880307 5296813 4001483 3503115
Current loans and borrowings 849215 457156 318725 572251 486273
Trade and other payables 4416376 4083107 4652390 3209683 2773577
Current trade payables 4416376 4083107 4652390 3209683 2773577
Deferred revenue accrued expenses andother deferred current liabilities
39907 54201 41169
Provisions for other liabilities and charges 295002 259066 272576 184763 191997
Other current liabilities 2361740 2605175 2579017 2022126 1702340
Current income tax liabilities 197121 26778 11952
Liabilities of disposal group classified asheld for sale
33201
Income Statement
NAME Y-2011 - CONSOLID Y-2012 - CONSOLID Y-2013 - CONSOLIDY-2014 -
CONSOLIDY-2015 - CONSOLID
Exchange rat e used f or currencyconversion (IFRS)
296 326 316 315 377
Total Operating Revenue 36435448 37084849 36111401 34117696 23519124
Net sales revenue 36095774 36862023 35930793 33874809 23407830
Cost of Goods Sold -33202235 -34404186 -34113963 -32028741 -20613814
Gross profit 2893539 2457837 1816830 1846068 2794016
Selling and distribution expenses -1235075 -1188404 -1228195 -1242973 -1052261
Administrative expenses -495446 -467750 -458952 -479432 -411259
Raw materials and consumables used -25627619 -22381751 -14452883
Employee benefit expense -663915 -652878 -559121
Social security costs -663915 -652878 -559121
Depreciation amortization and impairmentcharges
-667710 -631316 -502149
Tax and contributions -193260 -207056 -305264
Other costs by nature -8969018 -11255878 -6489514
Other operating expenses -805406 -403296 -225839 -1878411 -358791
Other operating income 339674 222826 180608 242887 111294
Operating profit (EBIT) 697287 621211 84452 -1511861 1082999
Financial result 244726 184154 -47445 -486725 -170121
Finance income 1001638 461612 145498 112248 103345
Other financial income 63537 -30692
Finance costs -756911 -277458 -192943 -598973 -273466
EMIS Business Report Generated on 2016-06-02
Copyright copy 2015 EMIS all rights reserved A Euromoney Institutional Investor company Page 10 of 48
Share of profit (loss) of associates -117558 -53711 -27202 -5390 104935
Profit before income tax 942013 805365 37007 -1998586 912878
Income tax -262094 -139343 -21192 132541 -123219
Profit after income tax 679920 666022 15815 -1866044 789659
Net Profit(Loss) 679920 666022 28467 -1847970 856701
Cash Flow Statement
NAME Y-2011 - CONSOLID Y-2012 - CONSOLID Y-2013 - CONSOLIDY-2014 -
CONSOLIDY-2015 - CONSOLID
Exchange rat e used f or currencyconversion (IFRS)
296 326 316 315 377
Net cash flow from (used in) operatingactivities
256819 948084 1752305 1010549 1418737
Net Profit 679920 666022 28467 -1847970 856701
Adjustments for Depreciation andimpairment of property plant and equipment
803063 693645 667710 631316 502149
Adjustments for Finance income 128356 104354 85401 75783 52202
Adjustments for Other adjustments -83777 -97601 -30681 1736991 165616
Changes in Inventories -1540368 312754 308077 1301950 -173566
Changes in Trade and other receivables -445130 -41741 128102 292986 333353
Changes in Trade and other payables 364692 -620598 454208 -1039404 -509569
Income tax paid 149572 -197965 -12652 -185812 69161
Net cash flow from (used in) investingactivities
505138 -882403 -772090 -1274681 -1085384
Proceeds from sale of property plant andequipment
109565 13812 51873 126834 34713
Purchase of property plant and equipment -857894 -750733 -753428 -1173214 -815893
Purchase of financial instruments -37549 -8594
Proceeds from sale of financial instruments 39040 6752
Acquisition of subsidiary 1199415 -52177 -169537 -251131 -316659
Other investing activity cash flows 52560 -91463 99002 22830 12454
Net cash flow from (used in) financingactivities
112153 -1046913 -771141 660488 -759451
Proceeds from borrowings 6374919 1398646 1135203 3056381 502414
Repayment of borrowings -6081090 -2393690 -1718461 -2861057 -999263
Payments of finance lease liabilities -9297 -8901 -8856
Dividends paid -4604 -203065 -195641 -187080
Other financing activity cash flow -172379 -38365 24039 660805 -75521
Net increase (decrease) in cash and cashequivalents
874110 -981232 209075 396356 -426098
Cash at the beginning of the period 951799 1660145 641774 852641 1043251
Exchange gains (losses) on cash and cashequivalents
-70151 -30692 -31630 -63417 5035
Cash at the end of the period 1825207 678606 850532 1248363 622188
Free cash flow -601075 197351 998877 -162665 602844
CAPEX -898840 -802910 -922965 -1424345 -1132551
EMIS Business Report Generated on 2016-06-02
Copyright copy 2015 EMIS all rights reserved A Euromoney Institutional Investor company Page 11 of 48
OTHER INFORMATION
NAME Y-2011 - CONSOLID Y-2012 - CONSOLID Y-2013 - CONSOLIDY-2014 -
CONSOLIDY-2015 - CONSOLID
Audited Audited Audited Audited Audited Audited
Financial statement type Consolid Consolid Consolid Consolid Consolid
Fiscal year end December December December December December
EMIS Business Report Generated on 2016-06-02
Copyright copy 2015 EMIS all rights reserved A Euromoney Institutional Investor company Page 12 of 48
Financial Statements - Interim Statements - EMIS Global Template
REPORTING DETAILS
NAMEQ1-2015 -
CONSOLIDH1-2015 -
CONSOLIDQ3C-2015 -CONSOLID
Y-2015 - CONSOLIDQ1-2016 -
CONSOLID
Begin date of reporting period 2015-01-01 2015-01-01 2015-01-01 2015-01-01 2016-01-01
End date of reporting period 2015-03-31 2015-06-30 2015-09-30 2015-12-31 2016-03-31
Original units as reported PLN Thousands PLN Thousands PLN Thousands PLN Thousands PLN Thousands
Displaying units USD Thousands USD Thousands USD Thousands USD Thousands USD Thousands
Comments Notes Notes Notes Notes Notes
Audited Non-Audited Audited Non-Audited Audited Non-Audited
Balance Sheet
NAMEQ1-2015 -
CONSOLIDH1-2015 -
CONSOLIDQ3C-2015 -CONSOLID
Y-2015 - CONSOLIDQ1-2016 -
CONSOLID
Exchange rat e used f or currencyconversion (IFRS)
381 376 378 390 376
Total Assets 12205902 13022978 13208137 12339340 12827082
Non-current assets 6587279 6531545 6580495 7013919 7478851
Property plant and equipment 5932590 5957763 5956720 6289508 6660548
Intangible assets and goodwill 206689 160978 163426 332727 404629
Long-term financial assets 247869 240935 263813 236087 258047
Investment properties 52984 54456 55358
Investments in subsidiaries 184393 175588 197595 198406 228518
Deferred assets 64000 72254 69132 93563 89918
Non-current deferred tax assets 64000 72254 69132 93563 89918
Other non-current assets 136131 99615 127404 62034 65709
Current Assets 5614164 6489574 6623139 5300556 5333599
Inventories 2666754 2847921 3156222 2746661 2457036
Trade and other receivables 1948590 2414132 2029719 1702340 1756850
Current trade receivables 1948590 2414132 2029719 1702340 1756850
Prepayments accrued income and otherdeferred current assets
11541 6907 9800
Short term Financial assets 176787 120866 137734 249673 197393
Other current financial assets 176787 120866 137734 249673 197393
Cash amp Cash Equivalents 810492 1099748 1289665 601882 922320
Assets of disposal group classified as heldfor sale
4459 1859 4503 24865 14632
Total Equity and liabilities 12205902 13022978 13208137 12339340 12827082
Total equity 5601049 5952185 6383694 6214657 6507050
Equity attributable to owners of the parent 5167213 5449595 5851301 5683781 5966214
Issued capital 277508 281047 280235 271206 281458
Foreign currency translation reserve -167082 -128304 78932 117146 138069
Retained earnings 4734951 4970912 5167135 4980903 5258845
Other reserves 321836 325940 324999 314527 287843
EMIS Business Report Generated on 2016-06-02
Copyright copy 2015 EMIS all rights reserved A Euromoney Institutional Investor company Page 13 of 48
Minority interest 433836 502590 532394 530876 540835
Total Liabilities 6604852 7070793 6824442 6124683 6320032
Non-current liabilities 2722623 2632753 3199926 2621568 2621442
Non-current loans and borrowings 2290623 2137336 2557610 2084284 2099761
Deferred revenue accrued expenses andother deferred non-current liabilities
31738 90317 147534 172772 176643
Provisions for other liabilities and charges 185443 196573 196006 182000 194201
Other non-current liabilities 214820 208527 298776 182513 150838
Current Liabilities 3882230 4438040 3624517 3503115 3689279
Current loans and borrowings 652590 567937 328177 486273 475924
Trade and other payables 2966557 3647762 3033851 2773577 2937217
Current trade payables 2966557 3647762 3033851 2773577 2937217
Deferred revenue accrued expenses andother deferred current liabilities
73967 64816 50591 72094
Provisions for other liabilities and charges 184656 126179 158129 191997 204044
Other current liabilities 1948590 2414132 2029719 1702340 1756850
Current income tax liabilities 4459 31345 53769
Liabilities of disposal group classified asheld for sale
9311
Income Statement
NAMEQ1-2015 -
CONSOLIDH1-2015 -
CONSOLIDQ3C-2015 -CONSOLID
Y-2015 - CONSOLIDQ1-2016 -
CONSOLID
Exchange rat e used f or currencyconversion (IFRS)
373 371 373 377 396
Total Operating Revenue 5388266 12107296 18354052 23519124 4146296
Net sales revenue 5366537 12054267 18281194 23407830 4096271
Cost of Goods Sold -4700716 -10337420 -15904470 -20613814 -3682172
Gross profit 665821 1716847 2376724 2794016 414099
Selling and distribution expenses -250555 -516831 -779473 -1052261 -252906
Administrative expenses -104085 -212654 -300539 -411259 -91461
Raw materials and consumables used -3210265 -7453936 -11418347 -14452883 -2296620
Employee benefit expense -143251 -288025 -421344 -559121 -143255
Wages and salaries -143255
Social security costs -143251 -288025 -421344 -559121
Depreciation amortization and impairmentcharges
-121253 -246571 -370986 -502149 -130117
Tax and contributions -75918 -153972 -230896 -305264 -69227
Other costs by nature -1519960 -3197351 -4793091 -6489514 -1292323
Other operating expenses -16632 -160433 -207056 -358791 -20465
Other operating income 21729 53029 72858 111294 50025
Operating profit (EBIT) 316278 879958 1162513 1082999 99293
Financial result -47214 -104443 -130984 -170121 -11117
Finance income 23875 42800 69644 103345 11369
Finance costs -71089 -147243 -200627 -273466 -22486
EMIS Business Report Generated on 2016-06-02
Copyright copy 2015 EMIS all rights reserved A Euromoney Institutional Investor company Page 14 of 48
Share of profit (loss) of associates 30045 79140 102858 104935 -25265
Profit before income tax 269065 775515 1031530 912878 88176
Income tax -44531 -152896 -197681 -123219 -24760
Profit after income tax 224533 622619 833849 789659 63416
Net Profit(Loss) 232849 650614 884475 856701 84892
Cash Flow Statement
NAMEQ1-2015 -
CONSOLIDH1-2015 -
CONSOLIDQ3C-2015 -CONSOLID
Y-2015 - CONSOLIDQ1-2016 -
CONSOLID
Exchange rat e used f or currencyconversion (IFRS)
373 371 373 377 396
Net cash flow from (used in) operatingactivities
262895 984939 1015458 1418737 739517
Net Profit 232849 650614 884475 856701 109652
Adjustments for Depreciation andimpairment of property plant and equipment
121253 246571 370986 502149 130117
Adjustments for Finance income 14486 27726 39911 52202 12633
Adjustments for Other adjustments -29509 94752 82501 165616 55584
Changes in Inventories -89599 -207540 -512685 -173566 373169
Changes in Trade and other receivables -89062 -416426 -44465 333353 8085
Changes in Trade and other payables 66260 411311 -51429 -509569 64932
Income tax paid 21193 124632 155895 69161 -22234
Net cash flow from (used in) investingactivities
-152372 -354783 -511345 -1085384 -353462
Proceeds from sale of property plant andequipment
11535 14536 18750 34713 15412
Purchase of property plant and equipment -165248 -335132 -495541 -815893 -387318
Acquisition of subsidiary -9152 -9107 -316659 17938
Other investing activity cash flows 1341 -25034 -25447 12454 50531
Net cash flow from (used in) financingactivities
-339349 -576858 -265985 -759451 -78575
Proceeds from borrowings 19046 100943 531970 502414 538152
Repayment of borrowings -342031 -633387 -548310 -999263 -602073
Payments of finance lease liabilities -1878 -3499 -5625 -1769
Dividends paid -189109 -187080
Other financing activity cash flow -14486 -40916 -54911 -75521 -12885
Net increase (decrease) in cash and cashequivalents
-228826 53298 238128 -426098 307479
Cash at the beginning of the period 1056139 1059772 1054566 1043251 593230
Exchange gains (losses) on cash and cashequivalents
1610 1346 11518 5035 -24760
Cash at the end of the period 828923 1114416 1304212 622188 875950
Free cash flow 97647 649807 519917 602844 352199
CAPEX -165248 -344554 -504917 -1132551 -387318
OTHER INFORMATION
EMIS Business Report Generated on 2016-06-02
Copyright copy 2015 EMIS all rights reserved A Euromoney Institutional Investor company Page 15 of 48
NAMEQ1-2015 -
CONSOLIDH1-2015 -
CONSOLIDQ3C-2015 -CONSOLID
Y-2015 - CONSOLIDQ1-2016 -
CONSOLID
Reporting type Non-Cumulative Non-Cumulative Cumulative Non-Cumulative
Audited Non-Audited Audited Non-Audited Audited Non-Audited
Financial statement type Consolid Consolid Consolid Consolid Consolid
Fiscal year end December December December December December
EMIS Business Report Generated on 2016-06-02
Copyright copy 2015 EMIS all rights reserved A Euromoney Institutional Investor company Page 16 of 48
Financial Statements - Ratios
REPORTING DETAILS
NAME Y-2011 - CONSOLID Y-2012 - CONSOLID Y-2013 - CONSOLIDY-2014 -
CONSOLIDY-2015 - CONSOLID
Begin date of reporting period 2011-01-01 2012-01-01 2013-01-01 2014-01-01 2015-01-01
End date of reporting period 2011-12-31 2012-12-31 2013-12-31 2014-12-31 2015-12-31
Original units as reported PLN Thousands PLN Thousands PLN Thousands PLN Thousands PLN Thousands
Displaying units USD Thousands USD Thousands USD Thousands USD Thousands USD Thousands
Comments Notes Notes Notes Notes Notes
Audited Audited Audited Audited Audited Audited
Ratios
NAME Y-2011 - CONSOLID Y-2012 - CONSOLID Y-2013 - CONSOLIDY-2014 -
CONSOLIDY-2015 - CONSOLID
Exchange rat e used f or currencyconversion (IFRS)
100 100 100 100 100
Profitability Ratios
Return on Assets (ROA) 343 412 018 -1247 672
Annualised Return on Assets (ROA) 343 412 018 -1247 672
Return on Equity (ROE) 000 000 000 000 000
Annualised Return on Equity (ROE) 000 000 000 000 000
Return on Capital 501 580 026 -1818 943
Return on Sales (ROS) 188 181 008 -546 366
Gross Profit Margin 802 667 506 545 1194
Operating Profit Margin 193 169 024 -446 463
Operating ROA 352 385 052 -1020 849
Efficiency Ratios
Inventory Turnover -0 22x -0 26x -0 28x -0 40x -0 37x
Accounts Receivable Turnover 1325x 1487x 1462x 1506x 1330x
Current asset turnover 355x 466x 465x 492x 427x
Fixed-asset turnover 374x 448x 422x 428x 323x
Asset Turnover 182x 228x 221x 229x 184x
Payables Turnover 009x -0 41x -0 37x -0 70x -0 29x
Working Capital Turnover 1039x 1130x 1340x 1390x 1260x
Valuation Figures
Bookvalue 7454685 8665634 8874170 5612169 5881931
Enterprise Value 7255510 9641115 7940595 8633248 9938494
Net Cash -7761348 -7134146 -7008964 -6387432 -5522801
Net Debt 2349954 2220932 1586321 2206889 1968676
Working Capital 3011359 3428830 2814077 2191492 1797442
Earning Before Interests and Taxes (EBIT) 697287 621211 84452 -1511861 1082999
EMIS Business Report Generated on 2016-06-02
Copyright copy 2015 EMIS all rights reserved A Euromoney Institutional Investor company Page 17 of 48
Liquidity Ratios
Current Ratio 152 170 153 155 151
Quick ratio 0 70 071 067 085 073
Dooms day ratio 0 27 015 017 028 017
Cash Ratio 029x 017x 018x 034x 024x
Cash Flow from Operation Ratio 004x 020x 035x 023x 039x
Leverage Ratios
Debt to total assets 2288 1728 1454 2499 2083
Debt to equity 5015 3213 2710 5728 4136
Long Term Debt to Capital 2822 2134 1911 3217 2512
Debt Enterprise Value 5420 3043 3122 3857 2586
Cash Flow to Debt 1927 -3515 885 1070 -1604
Leverage ratio 219x 186x 186x 229x 199x
Growth Trend Ratios
Revenue Trend 12804 11227 9458 9404 8269
Total Operating Revenue Trend 12806 11190 9449 9425 8249
Gross Profit Trend 10745 9338 7173 10136 18111
Operating Income Trend 6618 9794 1319 -1786 -8572
Net Income Trend 8206 10769 415 -6476 -5547
Accounts Receivables Trend 12834 10005 9620 9130 9364
Inventory Trend 14428 9211 9159 7149 10901
Net Property Plant and Equipment (PPampE)Trend
9699 9310 10065 9093 10836
Total Assets Trend 11482 8961 9757 9099 10302
Bookvalue Trend 11117 10595 9725 7331 12021
Shareholders Equity Trend 11056 10563 9733 7399 11892
Cash from Operations Trend 1246 40586 17935 5753 16799
Capital Expenditures Trend 6936 9821 11154 15394 9515
Coverage Ratios
Debt Coverage 006x 034x 074x 027x 053x
Performance Ratios
Cash Flow to Revenue 071 257 488 298 606
Cash Return on Assets 130 587 1079 682 1112
Cash Return on Equity 284 1091 2011 1563 2208
Cash to Income 3683 15262 2075 -6684 13100
Common size balance sheet ratios
CashTotal Assets 921 420 524 843 488
ReceivablesTotal assets 1374 1534 1513 1518 1380
InventoriesTotal assets 2775 2852 2677 2104 2226
EMIS Business Report Generated on 2016-06-02
Copyright copy 2015 EMIS all rights reserved A Euromoney Institutional Investor company Page 18 of 48
Fixed assetsTotal assets 4525 4701 4850 4846 5097
Current LiabilitiesTotal Liabilities 6205 6219 6703 5328 5720
Common size income statement ratios
Administrative ExpensesNet Sales -137 -127 -128 -142 -176
Income taxNet sales -0 73 -038 -006 039 -053
Common size cash flow statement ratios
Operating Cash Flow to Total Cash Flow 2938 -9662 83812 25496 -33296
Cash Flow from Investing to Total Cash Flow 5779 8993 -36929 -32160 25473
Cash flow from financing to Total cash flow 1283 10669 -36884 16664 17823
OTHER INFORMATION
NAME Y-2011 - CONSOLID Y-2012 - CONSOLID Y-2013 - CONSOLIDY-2014 -
CONSOLIDY-2015 - CONSOLID
Audited Audited Audited Audited Audited Audited
Financial statement type Consolid Consolid Consolid Consolid Consolid
Fiscal year end December December December December December
EMIS Business Report Generated on 2016-06-02
Copyright copy 2015 EMIS all rights reserved A Euromoney Institutional Investor company Page 19 of 48
Financial Statements - Mult iples
REPORTING DETAILS
NAME Y-2011 - CONSOLID Y-2012 - CONSOLID Y-2013 - CONSOLIDY-2014 -
CONSOLIDY-2015 - CONSOLID
Begin date of reporting period 2011-01-01 2012-01-01 2013-01-01 2014-01-01 2015-01-01
End date of reporting period 2011-12-31 2012-12-31 2013-12-31 2014-12-31 2015-12-31
Original units as reported PLN Thousands PLN Thousands PLN Thousands PLN Thousands PLN Thousands
Displaying units PLN Thousands PLN Thousands PLN Thousands PLN Thousands PLN Thousands
Comments Notes Notes Notes Notes Notes
Audited Audited Audited Audited Audited Audited
Multiples
NAME Y-2011 - CONSOLID Y-2012 - CONSOLID Y-2013 - CONSOLIDY-2014 -
CONSOLIDY-2015 - CONSOLID
Equity Value Multiples
EPS 471 507 021 -1363 756
PE 720 976 19485 -359 898
Market CapitalizationNet Sales 014 018 015 020 033
Market CapitalizationGross income 169 264 305 359 275
Market CapitalizationEBIT 702 1046 6568 -439 710
Market CapitalizationTotal Assets 025 040 034 045 060
Market capShareholder equity 0 54 075 064 103 120
PriceBook Ratio 057 079 066 106 126
Market Cap Net cash -055 -0 96 -0 83 -0 93 -135
Market CapitalizationInvested Capital 0 36 057 050 067 087
Market CapitalizationOperating Cashflow 1905 685 317 657 542
Market Capitalization(EBIT + DevelopmentExpenditures)
702 1046 6568 -439 710
Enterprise Value Multiples
Enterprise valueNet Sales 023 025 021 028 044
Enterprise valueGross income 289 373 416 520 368
Enterprise valueEBIT 1200 1476 8958 -635 949
Enterprise valueTotal Assets 042 057 047 065 081
Enterprise valueInvested Capital 0 62 081 069 097 116
Enterprise valueOperating Cashflow 3258 967 432 950 724
Enterprise value(EBIT + DevelopmentExpenditures)
1200 1476 8958 -635 949
OTHER INFORMATION
NAME Y-2011 - CONSOLID Y-2012 - CONSOLID Y-2013 - CONSOLIDY-2014 -
CONSOLIDY-2015 - CONSOLID
Audited Audited Audited Audited Audited Audited
Financial statement type Consolid Consolid Consolid Consolid Consolid
EMIS Business Report Generated on 2016-06-02
Copyright copy 2015 EMIS all rights reserved A Euromoney Institutional Investor company Page 20 of 48
Fiscal year end December December December December December
EMIS Business Report Generated on 2016-06-02
Copyright copy 2015 EMIS all rights reserved A Euromoney Institutional Investor company Page 21 of 48
more raquo
more raquo
Company Documents - Financial DocumentsAnnual Reports
Company Documents - Corporate Act ions
June 12 2015 Polski Koncern Naftowy Orlen SA - Dividend (Mandatory) EDI - Corporate Act ions
June 04 2015 Polski Koncern Naftowy Orlen SA - Dividend (Mandatory) EDI - Corporate Act ions
June 03 2015 Polski Koncern Naftowy Orlen SA - Company Meet ing (Voluntary) EDI - Corporate Act ions
November 10 2014 Polski Koncern Naftowy Orlen SA - Company Meet ing (Voluntary) EDI - Corporate Act ions
November 10 2014 Polski Koncern Naftowy Orlen SA - Dividend (Mandatory) EDI - Corporate Act ions
June 14 2012 Polski Koncern Naftowy Orlen SA - Dividend (Mandatory) EDI - Corporate Act ions
May 29 2012 Polski Koncern Naftowy Orlen SA - Dividend (Mandatory) EDI - Corporate Act ions
December 16 2011 Polski Koncern Naftowy Orlen SA - Company Meet ing (Voluntary) EDI - Corporate Act ions
May 26 2011 Polski Koncern Naftowy Orlen SA - Company Meet ing (Voluntary) EDI - Corporate Act ions
December 13 1999 KGHM waits to decide on Catholic TV Warsaw Business Journal
By Anna KociNska TV Niepokalanow in January will get another chance to try to persuade copper concern KGHM Polska Miedzssupervisory board to invest in its proposed Catholic television station TV Familijna
November 29 1999 Elektrim picks f inancial health over long-distance license Warsaw Business Journal
By Gregory Keller Elektrims decision last week not to bid f or one of the three long-distance telephone licenses will delay but notnecessarily derail the conglomerates move to become a telecom heavyweight analysts said
November 23 1999 PSE to Enter Long-Distance Tender PNB - Polish News Bullet in
Independent Long-Distance Operator (NOM) a company owned by Tel-Energo in turn 76 percent owned by the PSE power grid company isto enter the tender f or long-distance telephone services sources reported
October 12 1999 PKN Lowers Fuel Prices PNB - Polish News Bullet in
Starting today (October 12) the Polski Koncern Naf towy (PKN) petroleum group will lower the wholesale price of its f uels by zl 50 per tonnewhich translates into a reduction of 5 groszy per litre in the price of diesel f uel and petrol at f illing stations
March 26 1998 CPN-Petrochemia Merger Conf irmed PNB - Polish News Bullet in
The Treasury Ministrys communiqu issued yesterday conf irmed earlier reports about a planned merger between the CPN petroleumdistributing giant and Petrochemia Plock
March 25 1998 CPN Petrochemia To Merge PNB - Polish News Bullet in
Unof f icial sources quoted by Zycie indicate that a merger between the CPN petroleum distributing giant and Petrochemia Plock is now certainwith the terms of the deal said to have been approved by the Treasury Ministry
News amp Reports - News
June 02 2016 PKN Orlen fuels ref ining margin edges down to USD 58bbl in May petchem margin up to EUR 995t PAP
Market InsiderWarszawa June 2 2016 (PAP) - Listed f uel f irm PKN Orlen recorded a slight decline of model ref ining margin in May to USD 58 per barrelf rom USD 62 in April and a spike in the model petchem margin to EUR 995 per ton f rom EUR 973 in the prior month data published on PKNOrlens website showed
June 02 2016 Saudi Aramco enters Balt ic market with oil supply deal with Polish PKN BBJ - Energy Today
EMIS Business Report Generated on 2016-06-02
Copyright copy 2015 EMIS all rights reserved A Euromoney Institutional Investor company Page 22 of 48
Saudi Aramco and Polands biggest ref iner PKN Orlen on Wednesday signed a contract agreed in May f or Aramco to supply PKN with 50000barrels of crude oil per day starting this month the companies said
June 01 2016 Top news from Polish polit ics economy business amp f inancial markets - 1930 PAP Market Insider
Warszawa June 1 2016 (PAP) - Following is a digest of the days top news as compiled by PAP Market Insider
June 01 2016 Top news from Polish polit ics economy business amp f inancial markets - 1630 PAP Market Insider
Warszawa June 1 2016 (PAP) - Following is a digest of the days top news as compiled by PAP Market Insider
June 01 2016 POLSKI KONCERN NAFTOWY ORLEN SA Transact ions in PKN ORLEN f inancial PAP Market Insider
instruments concluded by the person in a close relationship with the President of the PKN ORLEN Management Board Warszawa
June 01 2016 Poland Board of Sygnity appoints Jan Maciejewicz as new CEO M-Brain - News Monitoring
Wirtualny Nowy Przemysl 01 Jun 2016 online- Jan Maciejewicz has been appointed as the new CEO of the Polish IT f irm Signity replacingJanusz R Guy who was dismissed by the supervisory board on 30 May 2016
June 01 2016 Poland in talks with Iran over oil gas cooperat ion -minister Petroleum Bazaar - PetroMag
Poland is in talks with Iran over cooperation in the oil and gas sector which could result in exploration and production contracts f or Polishindustry Deputy Energy Minister Michal Kurtyka said on Monday
May 31 2016 Top news from Polish polit ics economy business amp f inancial markets - 1930 PAP Market Insider
Warszawa May 31 2016 (PAP) - Following is a digest of the days top news as compiled by PAP Market Insider BUSINESS amp EQUITYMARKET NEWS NATURAL GAS PGNIG - Listed natural gas group PGNiG recommends a dividend payment of PLN 106 bln f rom 2015 prof itwhich translates into PLN 018 per share the f irm said in a market f iling
May 31 2016 PKN ORLEN SA PKN ORLENs subsidiary - ORLEN Upstream - has purchased bonds issued by PKN ORLEN
PAP Market InsiderWarszawa May 31 2016 (ESPI) - Current report No 1392016 Polski Koncern Naf towy ORLEN SA (PKN ORLEN) hereby inf orms that inorder to optimise the management of f inancial liquidity within the ORLEN Capital Group on 31 May 2016 PKN ORLEN issued short term bondsto its subsidiary ORLEN Upstream Sp z oo (ORLEN Upstream)
May 31 2016 Top news from Polish polit ics economy business amp f inancial markets - 1630 PAP Market Insider
Warszawa May 31 2016 (PAP) - Following is a digest of the days top news as compiled by PAP Market Insider BUSINESS amp EQUITYMARKET NEWS POWER PGE - Listed power group PGE signed a letter of intent on selling PGEs telco unit Exatel to PGZ arms producerPGE said in a press statement
May 31 2016 POLSKI KONCERN NAFTOWY ORLEN SA Transact ions in PKN ORLEN f inancial PAP Market Insider
instruments concluded by the person in a close relationship with the President of the PKN ORLEN Management Board Warszawa
May 31 2016 Report Poland aims to end long-term gas supplies f rom Russia `22 Prime - Business News in English
Poland does not plan to renew a long-term gas supply contract with Russia when its current deal with Gazprom expires in 2022 Reutersreported late Monday cit ing Peter Naimsky a government of f icial responsible f or gas and power inf rastructure
May 31 2016 Warsaw Hopeful about Working with Post-sanct ions Iran PNB - Polish News Bullet in
Polish energy companies could prove to be usef ul partners f or their Iranian counterparts in sales or extraction of oil and natural gas DeputyEnergy Minister Michal Kurtyka said on Monday while taking part in the Polish-Iranian economic f orum The event was staged as part of theof f icial Warsaw visit of Iranian Minister of Foreign Af f airs dr
May 31 2016 Poland in talks with Iran over oil gas cooperat ion minister says BBJ - Energy Today
Poland is in talks with Iran over cooperation in the oil and gas sector which could result in exploration and production contracts f or Polishindustry Deputy Energy Minister Michal Kurtyka said on Monday Polish state-run gas f irm PGNiG said last year that it was looking at variousoptions in oil and gas exploration and production in Iran
May 31 2016 Treasury Looking for Synergy among Treasury Companies PNB - Polish News Bullet in
Treasury Minister Dawid Jackiewicz plans to f orm a holding of companies of strategic importance f or the state interest These companiesshould according to his plan sign long-term contracts among themselves so that money remained under Treasurys control and could beused to f inance other state needs
May 31 2016 Poland aims to end long-term gas supplies f rom Russia af ter 2022 Petroleum Bazaar - PetroMag
May 30 Poland does not plan to renew a long-term gas supply contract with Russia when its current deal with Gazprom expires in 2022 a
EMIS Business Report Generated on 2016-06-02
Copyright copy 2015 EMIS all rights reserved A Euromoney Institutional Investor company Page 23 of 48
government of f icial responsible f or gas and power inf rastructure told Reuters on Monday
May 31 2016 Polish Gas Companies Eyeing Direct LNG Supplies PNB - Economic Review
In less than 20 days the f irst commercial LNG shipment f rom Qatar will arrive at the Swinoujscie terminal This opens up new developmentpossibilit ies f or Polish gas producers traders and consumers PGNiG in pole posit ion The biggest benef iciary of the looming launch of theterminal is PGNiG
May 30 2016 Top news from Polish polit ics economy business amp f inancial markets - 1930 PAP Market Insider
Warszawa May 30 2016 (PAP) - Following is a digest of the days top news as compiled by PAP Market Insider BUSINESS amp EQUITYMARKET NEWS FOOD KERNEL - Listed edible oil producer Kernel Holding recorded a net attributable prof it of USD 923 mln in f iscal Q3 2016ended on March 31 the f irms consolidated f inancial report showed
May 30 2016 POLSKI KONCERN NAFTOWY ORLEN SA Agreements between ORLEN Capital Group and Glencore group
PAP Market InsiderWarszawa May 30 2016 (ESPI) - Current report No 1372016 Polski Koncern Naf towy ORLEN SA (PKN ORLEN) hereby inf orms that withinORLEN Capital Group there was concluded agreement with company f rom Glencore group
May 30 2016 PKN ORLEN SA Transact ions in PKN ORLEN f inancial instruments PAP Market Insider
concluded by the person in a close relationship with the President of the PKN ORLEN Management Board Warszawa
May 30 2016 Poland Press - Top Business Headlines PAP Market Insider
Warszawa May 30 2016 (PAP) - Following is a summary of the leading stories in the Polish press covering stocks and corporate news PAPdoes not verif y inf ormation contained in the Polish press BANKING CHF MORTGAGES - Polish banks prepared their own proposal f orproviding relief to the stressed CHF-mortgage borrowers
May 27 2016 PKN ORLEN SA Transact ions in PKN ORLEN f inancial instruments PAP Market Insider
concluded by the person in a close relationship with the President of the PKN ORLEN Management Board Warszawa
May 27 2016 Orlens Eurobonds Get Good Rat ings PNB - Polish News Bullet in
Fitch Ratings has conf irmed the BBB- long-term credit rating and stable outlook f or PKN Orlen The agency has also awarded the same ratingto the eurobonds to be issued by the Plock-based oil concern though on an interim basis Meanwhile Moodys gave the bonds an interimBaa3 rating PKN Orlen disclosed on Wednesday
May 24 2016 POLSKI KONCERN NAFTOWY ORLEN SA Ship-Service - has purchased bonds issued by PKN ORLEN
PAP Market InsiderWarszawa May 24 2016 (ESPI) - Current report No 1292016 Polski Koncern Naf towy ORLEN SA (PKN ORLEN) hereby inf orms that inorder to optimise the management of f inancial liquidity within the ORLEN Capital Group on 24 May 2016 PKN ORLEN issued short term bondsto its subsidiary Ship-Service SA (Ship-Service)
May 24 2016 PKN ORLEN SA PKN ORLENs subsidiary - ORLEN Upstream - has purchased bonds issued by PKN ORLEN
PAP Market InsiderWarszawa May 24 2016 (ESPI) - Current report No 1282016 Regulatory announcement no 1282016 dated 24 May 2016Polski KoncernNaf towy ORLEN SA
May 24 2016 PKN ORLEN SA Transact ions in PKN ORLEN f inancial instruments PAP Market Insider
concluded by the person in a close relationship with the President of the PKN ORLEN Management Board Warszawa
May 24 2016 PGNiG Granted Concession on Norwegian Shelf PNB - Economic Review
Piotr Wozniak president of PGNiG announced that the f irms subsidiary PGNiG Upstream International had acquired a stake in anexploratory concession located in Norway on the Barents Sea shelf
May 23 2016 PKN ORLEN SA Transact ions in PKN ORLEN f inancial instruments PAP Market Insider
concluded by the person in a close relationship with the President of the PKN ORLEN Management Board Warszawa
May 23 2016 INBRIEF PNB - Polish News Bullet in
According to Monetary Policy Council (RPP) member Eugeniusz Gatnar the data published in April signals that the economy is developing healso assesses the current level of interest rates as optimal
May 20 2016 Top news from Polish polit ics economy business amp f inancial markets - 1930 PAP Market Insider
Warszawa May 20 2016 (PAP) - Following is a digest of the days top news as compiled by PAP Market Insider BUSINESS amp EQUITY
EMIS Business Report Generated on 2016-06-02
Copyright copy 2015 EMIS all rights reserved A Euromoney Institutional Investor company Page 24 of 48
MARKET NEWS INSURANCE PZU - Listed insurer PZU will recommend shareholders take PLN 208 per share in dividends f rom 2015 prof itsin a total payout of PLN 1796 bln management said in a market f iling
May 20 2016 Top news from Polish polit ics economy business amp f inancial markets - 1630 PAP Market Insider
Warszawa May 20 2016 (PAP) - Following is a digest of the days top news as compiled by PAP Market Insider
May 20 2016 PKN ORLEN SA Transact ions in PKN ORLEN f inancial instruments PAP Market Insider
concluded by the person in a close relationship with the President of the PKN ORLEN Management Board Warszawa
May 20 2016 Thousands of Polish companies operat ing in Germany BBJ - Regional Today
Over 1700 commercial companies with Polish capital operate in Germany according to a new report by the German Chamber of Industry andCommerce (AHK) cited by the Deutsche Welle Polish businessmen perceive Germany as an attractive country in terms of investmentopportunit ies the chamber said
May 20 2016 Thousands of Polish companies operat ing in Germany BBJ - Regional Today
Over 1700 commercial companies with Polish capital operate in Germany according to a new report by the German Chamber of Industry andCommerce (AHK) cited by the Deutsche Welle Polish businessmen perceive Germany as an attractive country in terms of investmentopportunit ies the chamber said
May 20 2016 Treasury Expect ing State-Owned Firms to Pay Dividends PNB - Polish News Bullet in
The Treasury can count on some PLN500m to be paid in dividends by those state-owned companies which have already issuedrecommendations f or shareholders concerning the matter Jastrzebska Spolka Weglowa Lotos and PKP Cargo recommend not to pay adividend due to losses suf f ered in 2015
May 18 2016 Top news from Polish polit ics economy business amp f inancial markets - 1930 PAP Market Insider
Warszawa May 18 2016 (PAP) - Following is a digest of the days top news as compiled by PAP Market Insider
May 18 2016 Update Shareholder seeks PLN 35 DPS from PKN Orlen PAP Market Insider
Warsaw May 18 2016 (PAP) - Listed f uel f irm PKN Orlen saw its shareholder NN OFE seek a PLN 35 DPS f rom 2015 prof it and retainedprof its PKN said in a market f iling The pension f und wants the company to pay PLN 1048 bln f rom 2015 prof its and PLN 4495 mln f romretained prof its giving a total of PLN 1497 bln
May 18 2016 POLSKI KONCERN NAFTOWY ORLEN SA Nat ionale-Nederlanden OFE not if ied PAP Market Insider
draf t resolution of the OGM of PKN ORLEN regarding allocation of the prof it f or the f inancial year 2015 Warszawa May 18 2016 (ESPI) -Current report No 1232016 Polski Koncern Naf towy ORLEN Spolka Akcyjna (PKN ORLEN) hereby inf orms that Nationale-NederlandenOtwarty Fundusz Emerytalny (Nationale-Nederlanden OFE) pursuant to Art
May 18 2016 Shareholder seeks PLN 35 DPS from PKN Orlen PAP Market Insider
Warsaw May 18 2016 (PAP) - Listed f uel f irm PKN Orlen saw its shareholder NN OFE seek a PLN 35 DPS f rom 2015 prof it and retainedprof its PKN said in a market f iling The pension f und wants the company to pay PLN 1048 bln f rom 2015 prof its and PLN 4495 mln f romretained prof its giving a total of PLN 1497 bln
May 18 2016 Poland Press - Top Business Headlines PAP Market Insider
Warszawa May 18 2016 (PAP) - Following is a summary of the leading stories in the Polish press covering stocks and corporate news
May 18 2016 Poland Press - Top Business Headlines PAP Market Insider
Warszawa May 18 2016 (PAP) - Following is a summary of the leading stories in the Polish press covering stocks and corporate news
May 17 2016 Top news from Polish polit ics economy business amp f inancial markets - 1930 PAP Market Insider
Warszawa May 17 2016 (PAP) - Following is a digest of the days top news as compiled by PAP Market Insider
May 16 2016 Top news from Polish polit ics economy business amp f inancial markets - 2100 PAP Market Insider
Warszawa May 16 2016 (PAP) - Following is a digest of the days top news as compiled by PAP Market Insider
May 16 2016 PKN Orlen fuels plans eurobond issue by Orlen Capital unit by end-2016 PAP Market Insider
Warsaw May 16 2016 (PAP) - Listed f uel group PKN Orlen has secured its supervisory boards approval f or a eurobonds issue within theOrlen capital group the f im said in a market f iling
May 16 2016 POLSKI KONCERN NAFTOWY ORLEN SA PKN ORLEN Supervisory Board consent to Eurobonds issue
within the ORLEN Capital Group PAP Market Insider
EMIS Business Report Generated on 2016-06-02
Copyright copy 2015 EMIS all rights reserved A Euromoney Institutional Investor company Page 25 of 48
more raquo
Warszawa May 16 2016 (ESPI) - Current report No 1192016 Polski Koncern Naf towy ORLEN Spolka Akcyjna (PKN ORLEN) hereby inf ormsthat on 16 May 2016 the PKN ORLEN Supervisory Board gave consent to start the process leading to issue of Eurobonds within ORLENCapital Group
May 16 2016 StockWatch Grupa Azoty chemicals on dividend dates Comarch IT on prof it retent ion PAP Market Insider
Warszawa May 16 2016 (PAP) - Warsaw stocks are enjoying a rebound on Monday with the large-cap index WIG20 closing up by 21 Not asinlge blue-chip suf f ered any declines with the advancers led by copper group KGHM up 51 bank PKO BP up 33 and insurer PZU up29
May 16 2016 POLSKI KONCERN NAFTOWY ORLEN SA ORLEN Paliwa - has purchased bonds issued by PKN ORLEN
PAP Market InsiderWarszawa May 16 2016 (ESPI) - Current report No 1182016 Polski Koncern Naf towy ORLEN Spolka Akcyjna (PKN ORLEN) herebyannounces that in order to optimise the management of f inancial liquidity within the ORLEN Capital Group on 16 May 2016 PKN ORLENissued short term bonds to its subsidiary ORLEN Paliwa Sp z oo (ORLEN Paliwa)
May 16 2016 POLSKI KONCERN NAFTOWY ORLEN SA Anwil - has purchased bonds issued PAP Market Insider
by PKN ORLEN Regulatory announcement no 1172016 dated 16 May 2016 Warszawa May 16 2016 (ESPI) - Current report No 1172016Polski Koncern Naf towy ORLEN SA
May 16 2016 POLSKI KONCERN NAFTOWY ORLEN SA Transact ions in PKN ORLEN f inancial PAP Market Insider
instruments concluded by the person in a close relationship with the President of the PKN ORLEN Management Board Warszawa
May 13 2016 EMIS Energy Weekly Newslet ter Issue 87 EMIS Energy - Newslet ter
News amp Reports - Reports
July 28 2015 Erste Bank - Company Reports Updates PKN Orlen Erste Bank - Company Reports
May 18 2015 Erste Bank - Company Reports Updates PKN Orlen Erste Bank - Company Reports
September 13 2012 PKN Orlen mBank Analyt ical Report
April 17 2012 PKN Orlen Erste Bank - Company Analyses
November 17 2011 PKN_Orlen mBank Analyt ical Report
August 22 2011 PKN_Orlen mBank Analyt ical Report
June 17 2011 Company Report - CEE Oil amp Gas Erste Bank - Company Analyses
March 16 2011 PKN_Orlen mBank Analyt ical Report
December 03 2010 PKN_Orlen mBank Analyt ical Report
November 02 2010 PKN Orlen - 02112010 mBank Analyt ical Report
November 18 2009 Analyt ical Report - PKN Orlen - 18112009 mBank Analyt ical Report
September 16 2009 Analyt ical Report - PKN Orlen - 16092009 mBank Analyt ical Report
June 02 2009 Analyt ical Report - PKN Orlen - 02062009 mBank Analyt ical Report
February 27 2009 Analyt ical Report - PKN Orlen - 27022009 mBank Analyt ical Report
November 20 2008 Analyt ical Report - PKN Orlen - 20112008 mBank Analyt ical Report
September 17 2008 Analyt ical Report - PKN Orlen - 17092008 mBank Analyt ical Report
EMIS Business Report Generated on 2016-06-02
Copyright copy 2015 EMIS all rights reserved A Euromoney Institutional Investor company Page 26 of 48
more raquo
August 14 2008 Analyt ical Report - PKN Orlen - 14082008 mBank Analyt ical Report
June 04 2008 Analyt ical Report - PKN Orlen - 30052008 mBank Analyt ical Report
March 10 2008 Analyt ical Report - PKN Orlen - 10032008 mBank Analyt ical Report
February 21 2008 Analyt ical Report - PKN Orlen - 14022008 mBank Analyt ical Report
December 13 2007 Analyt ical Report - PKN Orlen - 04122007 mBank Analyt ical Report
August 21 2007 Analyt ical Report - PKN Orlen - 160807 mBank Analyt ical Report
July 02 2007 Analyt ical Report - PKN Orlen mBank Analyt ical Report
March 05 2007 Analyt ical Report - PKN Orlen mBank Analyt ical Report
August 24 2006 Analyt ical Report - PKN Orlen mBank Analyt ical Report
EMIS Business Report Generated on 2016-06-02
Copyright copy 2015 EMIS all rights reserved A Euromoney Institutional Investor company Page 27 of 48
MampA and ECM Deals - EMIS DealWatch Deals
DAT ECOUNT RY
OFT ARGET
T ARGET COMPANYDEALT YPE
BUYER SELLER DEAL INDUST RIESDEAL
VALUEUSD (MN)
ST AKE
20-Jan-16CzechRepublic
68 petrol stations of OMV Acquisition PKN Orlen SA OMV AG Gasoline Stations NA 100
16-Nov-15 Poland Assets of Euronaft Trzebinia Acquisition PKP Cargo SA PKN Orlen SASupport Activities forTransportation RailTransportation
1502 100
16-Nov-15 Poland Orlen Transport SA Acquisition Trans Polonia SA PKN Orlen SA Truck Transportation 2137 100
21-Oct-15 Germany13 SUN petrol stations ofGermania Petrol
Acquisition PKN Orlen SAGermaniaPetrol GmbH
Gasoline Stations NA 100
13-Oct-15 Canada Kicking Horse Energy Inc Acquisition PKN Orlen SA NA Oil and Gas Extraction 22634 100
13-Oct-15UnitedStates
FX Energy Inc Acquisition PKN Orlen SA NAOil and Gas ExtractionAgriculture Forestry Fishingand Hunting
8310 100
24-Sep-15 PolandTwo concessions in theregions of Lesser Polandand Subcarpathia
Acquisition PKN Orlen SADEADeutscheErdoel AG
Oil and Gas Extraction NA 100
20-Aug-15CzechRepublicPoland
Orlen KolTrans Sp z oo Acquisition PKP Cargo SA PKN Orlen SA Rail Transportation 4860 9985
20-Jul-15 Poland Bieszczady ProjectJointventure
PKN Orlen SA PolskieGornictwo Naftowe iGazownictwo SA
NA Oil and Gas Extraction NA 100
03-Jul-14CzechRepublic
Ceska Rafinerska ASMinoritystakepurchase
PKN Orlen SA Eni SpA Petroleum Refineries 4100 32445
14-May-14 Poland Orlen Medica Acquisition PZU TFI SA PKN Orlen SAHealth Care and SocialAssistance
1380 100
14-May-14 Poland Prof Med Sp z oo Acquisition PZU SA PKN Orlen SAHealth Care and SocialAssistance
119 9645
08-May-14 CanadaBirchill Exploration LimitedPartnership
Acquisition PKN Orlen SA
Bregal -BirchillInvestmentsSarl
Oil and Gas Extraction 23366 100
07-Nov-13CzechRepublic
Ceska Rafinerska ASMinoritystakepurchase
PKN Orlen SARoyal DutchShell Plc
Petroleum Refineries 2720 1633
16-Sep-13 Canada TriOil Resources Ltd Acquisition PKN Orlen SA NA Crude Petroleum Extraction 17753 100
07-Dec-12 Poland Shale gas licenses Acquisition PKN Orlen SAExxonMobilPoland
Natural Gas Extraction NA 100
02-Nov-12 Poland Anwil SAMinoritystakepurchase
PKN Orlen SA NAPesticide Fertilizer andOther Agricultural ChemicalManufacturing
2364 473
20-Aug-12 Poland Petrolot Acquisition PKN Orlen SAPolskie LinieLotnicze LOTSA
Petroleum and PetroleumProducts MerchantWholesalers
9241 49
01-Jun-12 Poland Gas bottle assets Acquisition Gaspol SA PKN Orlen SA Nonstore Retailers NA 100
01-Aug-11 Poland Anwil SAMinoritystakepurchase
PKN Orlen SA Energa SAPesticide Fertilizer andOther Agricultural ChemicalManufacturing
2158 415
MampA and ECM Deals - EMIS DealWatch Intents
EMIS Business Report Generated on 2016-06-02
Copyright copy 2015 EMIS all rights reserved A Euromoney Institutional Investor company Page 28 of 48
DEALSIDE
INT ENTANNOUNCEMENT
T ARGETT ARGET
COUNT RYT ARGET INDUST RY
DEALT YPE
INVEST OR
Sell-side
13-Nov-15Orlen TransportSA
Poland Truck Transportation Acquisition Trans Polonia SA
Sell-side
23-Jul-15Czech railtransport unit ofPKN Orlen
CzechRepublic
Rail Transportation Acquisition NA
Buy-side
06-May-15 Fuel stationsAustriaGermanySwitzerland
Gasoline Stations Acquisition PKN Orlen SA
Sell-side
20-Oct-14Orlen KolTransSp z oo
Poland Rail Transportation Acquisition PKP Cargo SA
Buy-side
10-Jun-14Kicking HorseEnergy Inc
Canada Oil and Gas Extraction Acquisition PKN Orlen SA
Sell-side
29-May-14 ORLEN Lietuva Lithuania Petroleum Refineries Acquisition NA
Buy-side
05-Sep-13
BirchillExplorationLimitedPartnership
Canada Oil and Gas Extraction Acquisition PKN Orlen SA
Sell-side
23-Aug-13Medical centresin Plock andWloclawek
Poland Hospitals amp Health Care Acquisition NA
Buy-side
27-Jun-13 Fuel stationsCzechRepublicGermany
Gasoline Stations Acquisition PKN Orlen SA
Sell-side
25-Jul-12 Neste Polska Poland Other Gasoline Stations Acquisition Lotos SA PKN Orlen SA
Sell-side
01-Mar-12
OsrodekBadawczo-RozwojowyPrzemysluRafineryjnegoSA
PolandPetrochemical ManufacturingPetroleum Refineries
Privatization PKN Orlen SA Warter
Sell-side
20-Dec-11 Lotos SA Poland
Other Gasoline StationsGasoline Stations withConvenience Stores PetroleumRefineries Crude PetroleumExtraction
Privatizationthroughstockexchange
PKN Orlen SA Polskie Gornictwo Naftowe iGazownictwo SA
Buy-side
20-Jun-11Fuel stations inGermany
GermanyOther Gasoline StationsGasoline Stations withConvenience Stores
Acquisition PKN Orlen SA
Sell-side
02-May-11
Anwils fertilizerassets AnwilsPVC productionassets
PolandPoland
Plastics and Rubber ProductsManufacturing PesticideFertilizer and Other AgriculturalChemical Manufacturing
Acquisition ZA Pulawy
Sell-side
14-Mar-11Rafineria NaftyJedlicze
Poland Petroleum Refineries Privatization PKN Orlen SA
Sell-side
30-Nov-10 CeproCzechRepublic
Gasoline Stations BasicChemical ManufacturingPetroleum and Coal ProductsManufacturing
MergerEni SpA PKN Orlen SA Royal Dutch Shell PlcSlovnaft
Sell-side
02-Nov-10 Lotos SA PolandPetroleum and Coal ProductsManufacturing Oil and GasExtraction
Minoritystakepurchase
ExxonMobil Corp Gazprom Neft KulczykInvestments SA Magyar Olaj- Es Gazipari Nyrt(MOL) Mercuria Energy Group Ltd PKN Orlen SAPolskie Gornictwo Naftowe i Gazownictwo SA TNK-BP
Buy-side
16-Sep-10Gasolinestations
CzechRepublic
Gasoline Stations Acquisition PKN Orlen SA Unipetrol
EMIS Business Report Generated on 2016-06-02
Copyright copy 2015 EMIS all rights reserved A Euromoney Institutional Investor company Page 29 of 48
Buy-side
16-Sep-10Petrochemicalrefinery
CzechRepublic
Petroleum Refineries
AcquisitionMinoritystakepurchase
PKN Orlen SA
Sell-side
21-Jul-10Polkomtel Sp zoo
PolandWireless TelecommunicationsCarriers (except Satellite)
Acquisition Zygmunt Solorz-Zak - private investor
EMIS Business Report Generated on 2016-06-02
Copyright copy 2015 EMIS all rights reserved A Euromoney Institutional Investor company Page 30 of 48
Fiscal year 2014Companies in Industries 43
IndustryPetroleum Refineries
This company is scored higher thanonly 5266 of companies in theindustry which equates to B - BelowAverage Risk on the Financial Scale Expected
Participation inCustomers Credit
Fiscal year 2014Companies in Industries 43
IndustryPetroleum Refineries
Criteria Weight Score Final Score
I EMIS Benchmark Score 90 207 B Below Average Risk
SIZ E RANKING SCORE
Sales 1 10000
Assets 1 10000
Profit 41 698
Total Shareholders Equity 1 10000
Average Size 11 7675
GROWT H RANKING SCORE
Net Sales Growth Rate 11 7674
Inc Dec in Assets 20 5581
Inc Decin Net Income 24 4651
Increase (Decrease) in Equity 22 5116
Average Growt h 19 5756
PROFIT ABILIT Y RANKING SCORE
Net Income Net Sales 29 3488
Return On Assets 38 1395
Net Income Net Worth 39 1163
Average Prof it abilit y 35 2015
INDEBT EDNESS RANKING SCORE
Indebtedness 22 5116
Leverage 33 2558
Total Liabilities Sales 17 6279
Average Indebt edness 24 4651
II EMIS Trend Score 10 298 E Very High Risk
Scoring Range 1 - Improves 2 - Maintains (According to the tolerance margin) 3 - Deteriorate
EMIS Credit Analytics - Summary
EMIS Financial ScoreEMIS Financial Score was not affected by Conditions
EMIS Benchmark Score
B Below Average Risk
5266
EMIS Trend Score
E Very High Risk
PampL E
Balance Sheet C
Cash Flow E
EMIS Credit Quota
21112537Thousands (USD)
Average Ranking 21 in 43 companies
RELAT IVEST RENGT HS
RELAT IVEWEAKNESSES
Sales Net Income Sales
Sales Growth
Remarks
EMIS Trend Score is calculated based on the 2latest annual company financial statements
Remarks
Credit Quota Recommended was calculatedbased on the industry average customer type(customized) and Financial Score
EMIS Credit Analyt ics - EMIS Financial Score
EMIS Financial ScoreEMIS Financial Score was not affected by Conditions
EMIS Benchmark Score 5266
11
EMIS Business Report Generated on 2016-06-02
Copyright copy 2015 EMIS all rights reserved A Euromoney Institutional Investor company Page 31 of 48
100
PampL 2014 T OT AL
Sales Growth 3 3
Operating Profit Sales 3 3
Net Income Sales 3 3
T ot al PampL 300 300
BALANCE 2014 T OT AL
Days Receivables 2 2
Days Inventory 1 1
Current Ratio 3 3
Indebtness (Total AssetsTotal Liabilities) 3 3
Total Liabilities Sales 3 3
T ot al Balance 230 230
CASH FLOW 2014 T OT AL
Cash from Sales 3 3
Cash for Production 2 2
Cash for Operation 1 1
Net Operation Cash Generation (NOCG) 3 3
Free Cash Flow 3 3
Cash Flow After Financial Expenses 3 3
Cash Flow After Financial 3 3
Reduction in Debt 2 2
T ot al Cash Flow 267 267
III EMIS Financial Score 100 216 CC Above Average Risk
E D C CC B BB A AA
Business Scale
AA - Very Low RiskA - Low RiskBB - Moderate Low RiskB - Below Average RiskCC - Above Average RiskC - Moderate High RiskD - High RiskE - Very High Risk
E Very High Risk
C Moderate High Risk
E Very High Risk
EMIS Credit Analyt ics - EMIS Benchmark Score
EMIS Business Report Generated on 2016-06-02
Copyright copy 2015 EMIS all rights reserved A Euromoney Institutional Investor company Page 32 of 48
Fiscal year 2014Companies in Industries 43
IndustryPetroleum Refineries
SIZ E RANKING SCORE
Sales 1 10000
Assets 1 10000
Profit 41 698
Total Shareholders Equity 1 10000
Average Size 11 7675
GROWT H RANKING SCORE
Net Sales Growth Rate 11 7674
Inc Dec in Assets 20 5581
Inc Decin Net Income 24 4651
Increase (Decrease) in Equity 22 5116
Average Growt h 19 5756
PROFIT ABILIT Y RANKING SCORE
Net Income Net Sales 29 3488
Return On Assets 38 1395
Net Income Net Worth 39 1163
Average Prof it abilit y 35 2015
INDEBT EDNESS RANKING SCORE
Indebtedness 22 5116
Leverage 33 2558
Total Liabilities Sales 17 6279
Average Indebt edness 24 4651
Average Ranking 21
Fiscal year 2014Companies in Industries 43
IndustryPetroleum Refineries
EMIS Credit Quota(Score adjusted)
21112537Thousands (USD)
Participation in credit Financial Score
CC
EMIS Benchmark Score(Against Industry)
5266
EMIS Credit Analyt ics - EMIS Credit Quota
Key parameters af f ecting quota value
COMPANY INDICAT ORS VALUE INDUST RY MULT IPLIERS MAX CALCULAT ED CREDIT
Assets 1332259352 Suppliers Assets 2801 373173079
Net Worth 581261405 Suppliers Net worth 6383 371042677
Tangible Net Worth 604356752 Suppliers Tangible Net Worth 6383 385785372
Net Sales 3067917427 Suppliers Net Sales 1352 414818151
11
EMIS Business Report Generated on 2016-06-02
Copyright copy 2015 EMIS all rights reserved A Euromoney Institutional Investor company Page 33 of 48
Source EMIS Company Database
AVERAGE CREDIT
(BASED ON INDUSTRY)
319886918THOUSANDS (USD)
XEXPECT ED PART ICIPAT ION
(IN CUSTOMERS CREDIT)
11
FINANCIAL SCORE
CC
=
=
CALCULAT ED CREDIT
(AVERAGE X PARTICIPATION)
35187561THOUSANDS (USD)
X
QUOT A ADJUST MENT S
06
=CREDIT QUOT A
(ADJUSTED BY SCORE)
21112537THOUSANDS (USD)
Fiscal year 2014Companies in Industries 43
IndustryPetroleum Refineries
NIP 7740001454 Headquart ers T el +48 (24) 3650000
Cost of Goods Sold 3048984945 Suppliers Cost of Goods Sold 1363 415427048
Operating Profit -134323677 Suppliers Operating Profit -30832 000
Net Profit -165687728 Suppliers Net Profit -26041 000
SUPPLIERS 378193431 Net Sales 3067917427 Financial Liabilities Net Sales 002 715239
Assets 1332259352 Financial Liablities Assets 005 643434
FINANCIAL LIABILIT IES 000 Operating Cycle 1617 Operating Cycle 592663 501950211
Suppliers Turnover 1273 Suppliers Turnover 490503 415427048
AVERAGE CREDIT BASED ON INDUST RY 1121907398
Credit Quota Calculation
Score Multipliers
QUOT A ADJUST MENT S ACCORDING T O T HE FINAL SCORE FINANCIAL SCALE MULT IPLIERS
Expanded QuotaAA 2
A 15
Normal Quota BB 1
Reduced Quota
B 08
CC 06
C 04
No QuotaD 02
E 0
EMIS Credit Analyt ics - Conclusions
EMIS Business Report Generated on 2016-06-02
Copyright copy 2015 EMIS all rights reserved A Euromoney Institutional Investor company Page 34 of 48
Ul Chemikoacutew 7
09-411
Fax +48 (24) 3654040
Email zarzadorlenpl
RELAT IVE ST RENGT HS RANKING SCORE
Sales 1 100
Sales Growth 11 7674
EMIS Credit Quota(Score adjusted)
21112537Thousands (USD)
Participation in credit Financial Score
CC
Date 2016 June 2
Fiscal year 2014Companies in Industries 43
IndustryPetroleum Refineries
Polski Koncern Naftowy ORLEN SAEMIS Credit Analytics
EMIS Benchmark Score (Business Performance Score) is based on financial statements as of 2014 EMIS Benchmark Score of Polski Koncern Naf t owy ORLEN SA is
the result of comparing its financial results with that of 43 companies classified by EMIS Credit Analytics within Pet roleum Ref ineries industry
EMIS Benchmark Score(Against Industry)
5266Note Companies classified in Pet roleum Ref ineries are not necessarily direct competitors Please refer to Benchmark Ranking for complete details of the companies
classified within this industry
EMIS Benchmark Score is the result of the companys ranking within its industry in different financial ratios of Size Profitability Growth Indebtness Efficiency and Liquidity
Ratios In the result it is important to note
EMIS Benchmark Score contributes 90 to the Financial Score The other 10 is represented by evolution versus previous period of Profit amp Loss Balance Sheet and
Cash Flow Statement
EMIS T REND SCORE
Profit amp Loss E
Balance Sheet C
Cash Flow Statement E
EMIS Financial ScoreEMIS Financial Score was not affected by Conditions
Note The Financial Score is not deteriorated by Financial Conditions (see Parameters)
Based on the average credit quote of 11219074 in the Pet roleum Ref ineries industry an EMIS Financial Score of CC and an expected participation in the companyscredit of 11 the recommended credit quota is 740459Note The Financial Score is not deteriorated by Financial Conditions Based on the average credit quote of 11219074 in the Petroleum Refineries industry an EMISFinancial Score of CC and an expectedparticipation in the companys credit of 11 the recommended credit quota is 740459
Key parameters af f ecting quota value
EMIS Credit Analyt ics - Company vs Industry Key Stats
Company vs Industry - Key Stats
REPORTING DETAILS
11
EMIS Business Report Generated on 2016-06-02
Copyright copy 2015 EMIS all rights reserved A Euromoney Institutional Investor company Page 35 of 48
2014 2013 2012
Statement type Individual Individual Individual
Audited Non-Audited Non-Audited Non-Audited
Provider NotoriaMonitor B Fins NotoriaMonitor B Fins NotoriaMonitor B Fins
Companies in Industry 43 54 52
EMIS Benchmark Score 5266 6892 7170
Reporting Standard 197 197 197
Displaying units USD Thousands USD Thousands USD Thousands
SIZ E
2014 2014 2013 2012
AVERAGEINDUST RY
VALUE RANKING VALUE RANKING VALUE RANKING
Sales 915054 30679174 1 37904382 1 38981804 1
Assets 441712 13322594 1 17049137 1 16979933 1
Profit -47512 -1656877 41 58433 1 756549 1
Total Shareholders Equity 193824 5812614 1 9147078 1 9132469 1
Average Size Posit ion 11 1 1
GROWT H
2014 2014 2013 2012
AVERAGEINDUST RY
VALUE RANKING VALUE RANKING VALUE RANKING
Net Sales Growth Rate 2089 -575 11 -551 16 1190 12
Inc Dec In Assets 1610 -901 20 -243 22 -1039 30
Inc DecIn Net Income -406205 -340170 24 -9249 28 -078 17
Increase (Decrease) In Equity -0 77 -2601 22 -267 21 563 13
Average Growt h Posit ion 19 22 18
PROFIT ABILIT Y
2014 2014 2013 2012
AVERAGEINDUST RY
VALUE RANKING VALUE RANKING VALUE RANKING
Net Income Net Sales -519 -540 29 015 25 194 17
Return On Assets -1076 -1244 38 034 23 446 16
Net Income Net Worth -2451 -2850 39 064 36 828 28
Operational Profit Sales -439 -438 27 027 25 168 18
Average Prof it abilit y Posit ion 33 27 20
INDEBT EDNESS
2014 2014 2013 2012
AVERAGEINDUST RY
VALUE RANKING VALUE RANKING VALUE RANKING
Indebtedness 5612 5637 22 4635 21 4622 22
Leverage 12789 12920 33 8639 36 8593 40
Total Liabilities Sales 2709 2448 17 2085 17 2013 21
EMIS Business Report Generated on 2016-06-02
Copyright copy 2015 EMIS all rights reserved A Euromoney Institutional Investor company Page 36 of 48
Fiscal year 2014Companies in Industries 43
IndustryPetroleum Refineries
Current Liabilities Total Liabilities 6146 6279 7 7210 11 6768 11
Average Indebt edness Posit ion 20 21 24
EFFICIENCY
2014 2014 2013 2012
AVERAGEINDUST RY
VALUE RANKING VALUE RANKING VALUE RANKING
Days Receivables 23 24 8 24 10 24 6
Days Inventory 36 33 16 46 19 48 23
Suppliers Turnover 49 45 10 50 15 45 15
Operational Cycle 59 57 11 70 13 72 14
Average Ef f iciency Posit ion 11 14 15
LIQUIDIT Y
2014 2014 2013 2012
AVERAGEINDUST RY
VALUE RANKING VALUE RANKING VALUE RANKING
Current Ratio 128 132 19 142 21 157 22
Quick Ratio 132 132 19 142 21 157 22
Working Capital 42581 1486941 1 2418659 1 3019099 1
Average Liquidit y Posit ion 13 14 15
OT HERS
2014 2014 2013 2012
AVERAGEINDUST RY
VALUE RANKING VALUE RANKING VALUE RANKING
Gross Profit 0 76 062 31 491 34 614 33
Other Income -1926 -1852 32 64868 3 5153 6
Reduction In Debt 158 0 13 0 17 0 12
Average Ot hers Posit ion 25 18 17
EMIS Credit Analyt ics - Company vs Industry Balance Sheet
Company vs Industry - Balance Sheet
REPORTING DETAILS
2014 2013 2012
Statement type Individual Individual Individual
Audited Non-Audited Non-Audited Non-Audited
Provider NotoriaMonitor B Fins NotoriaMonitor B Fins NotoriaMonitor B Fins
Companies in Industry 43 54 52
EMIS Benchmark Score 5266 6892 7170
Reporting Standard 197 197 197
EMIS Business Report Generated on 2016-06-02
Copyright copy 2015 EMIS all rights reserved A Euromoney Institutional Investor company Page 37 of 48
CURRENT ASSET S 2014INDUST RY
2014COMPANY
2013INDUST RY
2013COMPANY
2012INDUST RY
2012COMPANY
V H V H V H V H V H V H
Cash And Banks 1003 11838 1034 6846 533 410 559 851 482 -4599 502 -5387
Short Term Investments 003 -404 000 NA 004 -7992 000 NA 018 457613 000 NA
Account Receivables (Trade) 1320 1670 1510 -915 1313 -821 1513 -380 1346 -1338 1534 005
Inventory 2075 -1109 2104 -2851 2710 -1100 2677 -841 2866 -1097 2852 -789
Deferred Assets 014 -1494 007 -4068 020 -2569 011 -3444 025 -385 017 16719
Current Assets 4413 1190 4656 -1101 4579 -900 4760 -533 4737 -1703 4906 -1431
FIXED ASSET
2014INDUST RY
2014COMPANY
2013INDUST RY
2013COMPANY
2012INDUST RY
2012COMPANY
V H V H V H V H V H V H
- Land And Properties 4838 1574 4846 -907 4853 -232 4850 065 4677 -1788 4701 -690
- Other Equipments 004 -262 000 NA 004 6983 000 NA 002 -1186 000 NA
Fixed Assets 4872 1626 4846 -907 4865 -275 4850 065 4710 -1737 4701 -690
Intangible Assets (Net) 202 823 150 -1458 217 -2685 160 -4312 279 -652 275 199
Investments 240 4117 265 2041 197 13125 200 21858 080 2964 061 5970
Deferred Assets 281 11870 082 15497 149 -2699 029 -4916 193 5695 056 -2566
Total Long Term Assets 5585 1962 5344 -720 5421 -302 5240 036 5263 -1044 5094 -625
T OT AL ASSET S
2014INDUST RY
2014COMPANY
2013INDUST RY
2013COMPANY
2012INDUST RY
2012COMPANY
V H V H V H V H V H V H
Total Assets 10000 1610 10000 -901 10000 -585 10000 -243 10000 -1368 10000 -1039
CURRENT LIABILIT Y
2014INDUST RY
2014COMPANY
2013INDUST RY
2013COMPANY
2012INDUST RY
2012COMPANY
V H V H V H V H V H V H
Suppliers 2801 1472 2839 -1163 2835 -082 2923 603 2691 -3100 2690 -2855
Other Short Term Liabilities 13741 2571 701 5233 12691 320 419 -676 11578 NA 438 NA
Total Current Liability 3449 2100 3540 -362 3309 -111 3342 424 3151 -1924 3128 -1691
LONG T ERM LIABILIT Y
2014INDUST RY
2014COMPANY
2013INDUST RY
2013COMPANY
2012INDUST RY
2012COMPANY
V H V H V H V H V H V H
Long Term Deferred Liabilities 839 -299 028 -299 1004 -2717 026 -2717 1298 NA 035 NA
Other Long Term Liabilities 2187 6238 2070 4861 1564 -1129 1267 -1525 1659 -3979 1459 -3665
Long Term Liabilities 2163 6134 2097 4757 1556 -1368 1293 -1553 1698 -3494 1494 -3513
T OT AL LIABILIT Y
2014INDUST RY
2014COMPANY
2013INDUST RY
2013COMPANY
2012INDUST RY
2012COMPANY
V H V H V H V H V H V H
Total Liabilities 5612 3390 5637 1066 4866 -551 4635 -215 4848 -2553 4622 -2383
EQUIT Y
2014INDUST RY
2014COMPANY
2013INDUST RY
2013COMPANY
2012INDUST RY
2012COMPANY
V H V H V H V H V H V H
EMIS Business Report Generated on 2016-06-02
Copyright copy 2015 EMIS all rights reserved A Euromoney Institutional Investor company Page 38 of 48
Fiscal year 2014Companies in Industries 43
IndustryPetroleum Refineries
Capital 212 3149 226 000 187 -325 206 000 182 -237 201 003
Other Reserves 11156 3618 263 000 9512 000 239 000 8955 -143 233 -2444
Equity Appreciation -178 -439428 -173 -142830 005 5496 -010 -47857 003 4198565 003 NA
Retained Earnings 3652 -439 3702 -2707 4435 -418 4618 -192 4357 -050 4594 1065
Minority Interest 5213 074 346 075 6008 -1233 312 -1231 6451 -1929 347 -1929
Total Net Worth 4388 -077 4363 -2601 5134 -618 5365 -267 5152 153 5378 563
T OT AL LIABILIT Y AND EQUIT Y
2014INDUST RY
2014COMPANY
2013INDUST RY
2013COMPANY
2012INDUST RY
2012COMPANY
V H V H V H V H V H V H
Total Liabilities And Net Worth 10000 1610 10000 -901 10000 -585 10000 -243 10000 -1368 10000 -1039
EMIS Credit Analyt ics - Company vs Industry Income Statement
Company vs Industry - Income Statement
REPORTING DETAILS
2014 2013 2012
Statement type Individual Individual Individual
Audited Non-Audited Non-Audited Non-Audited
Provider NotoriaMonitor B Fins NotoriaMonitor B Fins NotoriaMonitor B Fins
Companies in Industry 43 54 52
EMIS Benchmark Score 5266 6892 7170
Reporting Standard 197 197 197
OPERAT ING PROFIT
2014INDUST RY
2014COMPANY
2013INDUST RY
2013COMPANY
2012INDUST RY
2012COMPANY
V H V H V H V H V H V H
Sales 10000 2089 10000 -575 10000 -1145 10000 -551 10000 500 10000 1190
Cost Of Goods Sold 9924 2648 9938 -150 9485 -1062 9509 -427 9396 612 9386 1253
Gross Profit 0 76 -8210 062 -8814 515 -2441 491 -2451 604 -978 614 313
Administrative AndGeneral Expenses
149 3309 141 420 135 -905 127 -479 132 -638 126 379
Selling Expenses 2650 5320 364 095 2091 094 340 028 1835 1798 320 578
Operational Profit -439 -165868 -438 -163453 034 -8046 027 -8483 154 -2807 168 -206
NON OPERAT ING INCOME
2014INDUST RY
2014COMPANY
2013INDUST RY
2013COMPANY
2012INDUST RY
2012COMPANY
V H V H V H V H V H V H
Total Non-Operating Revenue 036 465 033 -2304 042 -6818 040 -6944 117 -4630 125 -4930
- Financial Revenue 036 465 033 -2304 042 -6818 040 -6944 117 -4630 125 -4930
Total Non-Operating Expenses 190 24437 176 20967 067 -2118 053 -3252 075 -6320 075 -5970
- Financial Expenses 190 24438 176 20967 067 -2119 053 -3252 075 -6320 075 -5970
Other Extraordinary Result 0 00 10000 000 NA -000 9992 000 NA -000 NA -000 NA
EMIS Business Report Generated on 2016-06-02
Copyright copy 2015 EMIS all rights reserved A Euromoney Institutional Investor company Page 39 of 48
Fiscal year 2014Companies in Industries 43
IndustryPetroleum Refineries
Profit Before Income Taxes -594 -909715 -580 -407834 008 -9639 014 -9402 196 -1306 217 -601
T AXES AND OT HERS
2014INDUST RY
2014COMPANY
2013INDUST RY
2013COMPANY
2012INDUST RY
2012COMPANY
V H V H V H V H V H V H
Extraordinary Income (Charges) 0 02 8819 005 4250 002 NA 004 NA 000 -10000 000 NA
Changes Due To Consolidation 027 -8018 002 -8023 162 -5086 008 -5086 292 -4973 014 -4977
Income Tax -0 74 -468549 -039 -72388 -002 7245 006 -8524 -006 -11275 038 -4155
NET PROFIT
2014INDUST RY
2014COMPANY
2013INDUST RY
2013COMPANY
2012INDUST RY
2012COMPANY
V H V H V H V H V H V H
Net Income -519 -406205 -540 -340170 016 -9342 015 -9249 213 544 194 -078
EMIS Credit Analyt ics - Company vs Industry Cash Flow
Company vs Industry - Cash Flow
REPORTING DETAILS
2014 2013 2012
Statement type Individual Individual Individual
Audited Non-Audited Non-Audited Non-Audited
Provider NotoriaMonitor B Fins NotoriaMonitor B Fins NotoriaMonitor B Fins
Companies in Industry 43 54 52
EMIS Benchmark Score 5266 6892 7170
Reporting Standard 197 197 197
CASH OPENING BALANCE
2014INDUST RY
2014COMPANY
2013INDUST RY
2013COMPANY
2012INDUST RY
2012COMPANY
V H V H V H V H V H V H
Initial Cash 222 410 267 851 257 -4599 232 -5387 422 9240 474 8565
CASH FROM SALES
2014INDUST RY
2014COMPANY
2013INDUST RY
2013COMPANY
2012INDUST RY
2012COMPANY
V H V H V H V H V H V H
Net Sales 10000 2089 10000 -575 10000 -1145 10000 -551 10000 500 10000 1190
+- Trade AccountsReceivable
-0 91 -28672 066 13160 059 -4685 027 779616 098 16969 -000 9978
Cash From Sales 9909 1908 10066 -539 10059 -1179 10027 -525 10098 763 10000 1377
CASH FOR PRODUCT ION
2014INDUST RY
2014COMPANY
2013INDUST RY
2013COMPANY
2012INDUST RY
2012COMPANY
V H V H V H V H V H V H
(-) Sales Cost -9924 -2648 -9938 150 -9485 1062 -9509 427 -9396 -612 -9386 -1253
(-) (Inc) Inventory 125 -1020 364 21062 168 -1077 111 -183 167 13866 106 12570
(+) (Inc) Suppliers 174 188875 -162 -30445 -012 9818 075 11510 -572 -26577 -468 -25767
EMIS Business Report Generated on 2016-06-02
Copyright copy 2015 EMIS all rights reserved A Euromoney Institutional Investor company Page 40 of 48
Cash For Production -9625 -2474 -9736 159 -9328 1572 -9324 962 -9801 -961 -9748 -1525
CASH FOR OPERAT ING
2014INDUST RY
2014COMPANY
2013INDUST RY
2013COMPANY
2012INDUST RY
2012COMPANY
V H V H V H V H V H V H
(-) Administrative Expenses -149 -3309 -141 -420 -135 905 -127 479 -132 638 -126 -379
+- Other Operating Results -0 00 -12524 000 NA 001 NA 000 NA 000 NA 000 NA
(-) Selling Expenses -2650 -5320 -364 -095 -2091 -094 -340 -028 -1835 -1798 -320 -578
(-) Period Income Taxes 074 468549 039 72388 002 -7245 -006 8524 006 11275 -038 4155
(+) (Inc) Taxes Payable 002 69344 000 NA -000 -14351 000 NA 001 17119 000 NA
(-) (Inc) Labor EstimatesAnd Provision
-0 12 9215 -000 9200 -189 -12719 -004 -12717 614 184104751 015 NA
Cash For Operation -2736 -3712 -466 794 -2413 -5873 -477 379 -1346 2282 -469 405
OPERAT IONAL CASHFLOW
2014INDUST RY
2014COMPANY
2013INDUST RY
2013COMPANY
2012INDUST RY
2012COMPANY
V H V H V H V H V H V H
Net Operating Cashflow -2453 -7631 -137 -15709 -1682 -4202 225 19816 -1049 1952 -217 -3750
INVEST MENT S IN ASSET S
2014INDUST RY
2014COMPANY
2013INDUST RY
2013COMPANY
2012INDUST RY
2012COMPANY
V H V H V H V H V H V H
(-) (Inc) Net Fixed Assets -329 -67408 210 151250 069 -8689 -014 -10872 468 25487 152 12255
(ndash) (Inc) Investments -0 34 2746 -020 7025 -056 -47405 -062 -48471 -009 -10215 -010 -10826
FREE CASHFLOW
2014INDUST RY
2014COMPANY
2013INDUST RY
2013COMPANY
2012INDUST RY
2012COMPANY
V H V H V H V H V H V H
Free Cashflow -2816 -10396 054 -6596 -1669 -15077 150 28813 -589 5095 -075 -33837
FINANCIAL
2014INDUST RY
2014COMPANY
2013INDUST RY
2013COMPANY
2012INDUST RY
2012COMPANY
V H V H V H V H V H V H
(-) Financial Expenses -154 -65083 -143 -92333 -025 -15241 -013 -12496 042 20392 050 -1713
Cashflow After Financial Costs -2969 -11196 -089 -16127 -1694 -17395 136 60823 -547 5391 -025 -12770
(+) (Inc) Debt Short Term -000 9949 000 NA -000 -21237 000 NA 000 10091 000 NA
(+) (Inc) Debt Long Term 002 69344 000 NA -000 -14351 000 NA 001 17119 000 NA
Cashflow After FinancialExpenses
-2968 -11175 -089 -16127 -1694 -17455 136 60823 -546 5512 -025 -12770
CASHFLOW
2014INDUST RY
2014COMPANY
2013INDUST RY
2013COMPANY
2012INDUST RY
2012COMPANY
V H V H V H V H V H V H
(-) Dividends 503 42726 -126 -4528 -186 682 -082 -1139 -176 -73580 -069 -52834
(-) Other Expenses 002 8819 005 4250 002 NA 004 NA 000 -10000 000 NA
(-) Other Current Debtors 000 NA 000 NA 000 NA 000 NA 000 NA 000 NA
(-) Other Current Assets 002 -7807 002 -2258 011 361835 003 15505 000 10702 -005 -48602
(-) Long-Term AccountsReceivable
000 NA 000 NA 000 NA 000 NA 000 NA 000 NA
EMIS Business Report Generated on 2016-06-02
Copyright copy 2015 EMIS all rights reserved A Euromoney Institutional Investor company Page 41 of 48
(-)(Inc) Deferred And OtherLong Term Assets
-0 72 -37515 -022 -26027 032 11570 013 4240 -178 -88060 008 14351
(-) (Inc) Other Long TermLiabilities
406 56718 294 37011 -105 8205 -103 7364 -518 -37893 -368 -40951
(+) Inflation Adjustmentst Non Recurring Incomes
000 NA 000 NA 000 NA 000 NA 000 NA 000 NA
(+) (Inc) Other AccountsPayable
115 218744 105 82115 -007 -10274 -014 -10676 216 2710149 191 NA
(+) Extraordinary Income Consolidation
027 -8018 002 -8023 162 -5085 008 -5057 292 -4974 014 -5006
(-) Intangible Goods -007 -12244 011 -8077 040 29906 055 230557 009 12060 -002 8712
Complementary Cash-Flow 976 240248 271 31907 -051 8725 -117 5210 -356 -14616 -230 -28078
Net Cash Generation -1992 -3796 183 77289 -1745 -7131 020 10729 -902 -10194 -255 -21675
Ending Cash -1770 -4381 449 6846 -1488 -17434 251 851 -480 -11112 219 -5387
EMIS Business Report Generated on 2016-06-02
Copyright copy 2015 EMIS all rights reserved A Euromoney Institutional Investor company Page 42 of 48
Score Scale
Financial ScaleFinancial Model has 8 risk categories
A - Very Low RiskAA - Low RiskBB - Moderate Low RiskB - Below Average RiskCC - Above Average RiskC - Moderate High RiskD - High Risk E - Very High Risk
Risk Profile
High RiskHigh Risk - used when the loan amounts are relatively high and have a longrepayment period A loss in the Credit would seriously affect the companyresults Commercial credit with maturity exceeding 36 months
A loss in the Credit would seriously affect the results Bank credited to morethan 36 months
Vertical Weighting
Pampl
Sales Growth 12
Operating Profit 12
Net Profit 12
Sub t ot al 36
Balance
Days Receivables 12
Days Inventory 10
Current Ratio 8
Indebtness 8
Indebtednesssales 8
Balance Sub T ot al 46
Cash Flow
Cash From Sales 2
Cash For Production 2
Cash For Operations 2
Operating Cash Generation 5
Free Cash Flow 3
Cash Flow After Fin Ex 2
Cash Flow After Fin Result 2
Reduction In Debt 0
Cash Flow Sub T ot al 18
Total Vertical Weights 100
Tolerance Margin 5
Financial Conditions
Condit ions Score
Negative Net Worth CC
Final Weighting
EMIS Benchmark Score 90
EMIS Trend Score 10
EMIS Credit Analyt ics - EMIS Credit Analyt ics Assumptions
EMIS Business Report Generated on 2016-06-02
Copyright copy 2015 EMIS all rights reserved A Euromoney Institutional Investor company Page 43 of 48
Ret urn on Asset s (ROA)
An indicator of how profitable a company is relative to its total assets ROA gives an
idea as to how efficient management is at using its assets to generate earnings
Calculated by dividing a companys annual earnings by its total assets
Calculated as Net prof it T ot al Asset
Ret urn on Equit y (ROE)
A measure of a corporations profitability that reveals how much profit a company
generates with the money shareholders have invested
Calculated as Net prof it Shareholders equit y
Ret urn on Sales (ROS)
A ratio widely used to evaluate a companys operational efficiency ROS is also
known as a firms operating profit margin
Calculated as Net Prof it Net Sales Revenue
Bookvalue
A companys common stock equity as it appears on a balance sheet equal to total
assets minus liabilities preferred stock and intangible assets such as goodwill
Current Rat io
A liquidity ratio that measures a companys ability to pay short-term obligations
Calculated as Current Asset sCurrent Liabilit ies
Quick rat io
An indicator of a companys short-term liquidity The quick ratio measures a
companys ability to meet its short-term obligations with its most liquid assets The
higher the quick ratio the better the position of the company
Calculated as (Current Asset s-Invent ories)Current Liabilit ies
Debt t o equit y
A measure of a companys financial leverage calculated by dividing its total
liabilities by stockholders equity It indicates what proportion of equity and debt the
company is using to finance its assets
Calculated as T ot al Liabilit iesShareholders Equit y
Debt t o t ot al asset s
A metric used to measure a companys financial risk by determining how much of
the companys assets have been financed by debt Calculated by adding short-term
and long-term debt and then dividing by the companys total assets
Calculated as Short T erm Debt s+Long T erm Debt sT ot al Asset s
Leverage rat io
Leverage ratio provide an indication of the long term solvency of the firm
Calculated as T ot al Asset sShareholders Equit y
Debt Ent erprise Value
This metric is equivalent to the payback period used by debtholders Calculated as
Debt Ent erprise Value
Market Capit alizat ionEBIT DA
Calculated as Market Capit alizat ionEBIT DA
Earning Bef ore Int erest s and T axes (EBIT )
Earning Before Interests and Taxes (EBIT)
EBIT DA
Earnings before interest taxes depreciation and amortization (EBITDA) is a non-
GAAP metric that can be used to evaluate a companys profitability Calculated as
Ent erprise valueNet Sales
Dividing the enterprise value of a firm by its sales or revenues is a way of
comparing firms in cyclical industries Calculated as Enterprise Value Net Sales
Revenue
Ent erprise valueGross income
Calculated as Enterprise value Gross income
Ent erprise valueT ot al Asset s
Calculated as Enterprise value Total Assets
EBIT DA Margin
A measurement that provides a clear view of the companyrsquos core profitability
Calculated as EBITDA Net Sales Revenue
T ot al Operat ing Revenue T rend
Calculated as Total Operating Revenue current year Total Operating Revenue
previous year
Gross Prof it T rend
Calculated in percentage as (Gross Prof it Current Year Gross Prof it
Previous Year) ndash 1
EBIT DA T rend
Calculated as EBITDA current year EBITDA previous year
Account s Receivables T rend
Calculated in percentage as T rade Account s Receivables current year
T rade Account Receivables previous year
Invent ory T rend
Calculated as Inventories current year Inventories previous year
Net Propert y Plant and Equipment (PPampE) T rend
Calculated as Net PPampE current year Net PPampE previous year
T ot al Asset s T rend
Calculated as Total Assets current year Total Assets previous year
Bookvalue T rend
Calculated as Bookvalue current year Bookvalue previous year
Shareholders Equit y T rend
Calculated as Shareholdersrsquo Equity current year Shareholdersrsquo Equity previous
year
Cash f rom Operat ions T rend
Calculated as Net Cash Flow from Operations current year Net Cash Flow from
Operations previous year
Capit al Expendit ures T rend
Calculated as CAPEX current year CAPEX previous year
Dividend per Share T rend
Calculated as Dividend value per (common) share current year Dividend value
per (common) share previous year
Cost t o Income Rat io
A key financial measure showing a bankrsquos cost in relation to its income Ratio is
calculated as Total Operational Cost Total Operational Income
Glossary
EMIS Business Report Generated on 2016-06-02
Copyright copy 2015 EMIS all rights reserved A Euromoney Institutional Investor company Page 44 of 48
EBIT DA = Operat ing Revenue - Operat ing Expenses (Depriciat ion and
Amort izat ion excluded)
Ent erprise Value EBIT DA
Enterprise Value EBITDA is the metric most used to measure how many years it
would take to pay back the investment
Ent erprise Value
A measure of a companys value often used as an alternative to straightforward
market capitalization EV is calculated as market cap plus debt minority interest
and preferred shares minus total cash and cash equivalents
Dooms day rat io
Calculated as Cash Current Liabilit ies
Long T erm Debt t o Capit al
A ratio showing the financial leverage of a firm calculated by dividing long-term
debt by the amount of capital available Calculated as Long t erm debt Long
t erm debt + Pref f ered St ock + Common St ock
Int erest Coverage Rat io
A ratio used to determine how easily a company can pay interest on outstanding
debt The interest coverage ratio is calculated by dividing a companys earnings
before interest and taxes (EBIT) of one period by the companys interest expenses of
the same period Calculated as EBIT Int erest expense
Cash Flow t o Debt
This coverage ratio compares a companys operating cash flow to its total debt
which for purposes of this ratio is defined as the sum of short-term borrowings the
current portion of long-term debt and long-term debt This ratio provides an
indication of a companys ability to cover total debt with its yearly cash flow from
operations The higher the percentage ratio the better the companys ability to carry
its total debt Calculates as Operat ing Cash Flow T ot al Debt
Ret urn on Capit al
A ratio that indicates the efficiency and profitability of a companys capital
investments Calculated as Net Income (Total Asset - Current Liabilities)
Gross Prof it Margin
A financial metric used to assess a firms financial health by revealing the
proportion of money left over from revenues after accounting for the cost of goods
sold Gross profit margin serves as the source for paying additional expenses and
future savings Calculated as (Net Sales Revenue - Cost of Goods Sold) Net
Sales Revenue
Operat ing Prof it Margin
A ratio used to measure a companys pricing strategy and operating efficiency
Calculated as Operat ing prof it Net sales
Account s Receivable T urnover
An accounting measure used to quantify a firms effectiveness in extending credit
as well as collecting debts The receivables turnover ratio is an activity ratio
measuring how efficiently a firm uses its assets Calculated as Net Sales
Revenue T rade Account s Receivable (Net )
Invent ory T urnover
A ratio showing how many times a companys inventory is sold and replaced over a
period Calculated as Sales Invent ory
Current asset t urnover
Calculated as Net Sales Revenue T ot al Current Asset
Ef f iciency Rat io
Calculated as Total non-interest expenses (Total net interest income + Total non-
interest income)
Loans t o Deposit s Rat io
A commonly used statistic for assessing a banks liquidity Calculated as Total
Loans Total Deposits
Liquid Asset s t o Deposit s Rat io
This ratio indicates extent of liquidity maintained by a bank for meeting the demand
made by the depositors Calculated as (Cash + Financial assets held for trading)
Total Deposits
Loans t o Asset Rat io
Calculated as Total Loans Total Assets
Net Int erest Income T rend
Calculated as Net Interest Income current year Net Interest Income previous year
Net Fee and Commission Income T rend
Calculated as Net Fee and Commission Income current year Net Fee and
Commission Income previous year
Loans and Advances t o Cust omers T rend
Calculated as Loans and Advances to Customers current year Loans and
Advances to Customers previous year
Deposit s f rom Cust omers T rend
Calculated as Deposits from Customers current year Deposits from Customers
previous year
Loss Rat io
This ratio indicates the average cost of insurance protection per each dollar of net
premiums earned during the period Calculated as Total Losses Incurred in Claims
Net Insurance Premium Revenue
Underwrit ing Expenses Rat io
This ratio measures operational efficiency in underwriting Calculated as
Underwriting expenses Net Insurance Premium Revenue
Policyholder Dividend Rat io
Calculated as Dividends Net Insurance Premium Revenue
Combined LossExpense Rat io
Calculated as Loss Ratio + Underwriting Expenses Ratio + Policyholder Dividend
Ratio When the combined ratio is under 100 underwriting results are
considered profitable when the combined ratio is over 100 underwriting results
are considered unprofitable
Ceded Premium Rat io
Calculated as Insurance Premium Ceded to Reinsurers Insurance Premium
Revenue
Net Premiums Earned T rend
Calculated as Net Insurance Premium Revenue current year Net Insurance
Premium Revenue previous year
Fees and Commissions T rend
Calculated as Net Fees and Commissions Income current year Net Fees and
Commissions Income previous year
Net Invest ment Income T rend
EMIS Business Report Generated on 2016-06-02
Copyright copy 2015 EMIS all rights reserved A Euromoney Institutional Investor company Page 45 of 48
Fixed-asset t urnover
This ratio is a rough measure of the productivity of a companys fixed assets
(property plant and equipment or PPampE) with respect to generating sales For most
companies their investment in fixed assets represents the single largest
component of their total assets This annual turnover ratio is designed to reflect a
companys efficiency in managing these significant assets Simply put the higher
the yearly turnover rate the better Calculated as Revenue Propert y Plant and
Equipment
Asset T urnover
The amount of sales generated for every dollars worth of assets It is calculated by
dividing sales in dollars by assets in dollars Calculated as Revenue Asset s
Revenue T rend
Calculated as (Net Sales Current Year Net Sales Previous Year)
Net Income T rend
Calculated as (Net Income Current Year Net Income Previous Year)
Operat ing Income T rend
Calculated as (Operat ing Income Current Year Operat ing Income
Previous year)
PriceBook Rat io
A ratio used to compare a stocks market value to its book value It is calculated by
dividing the current closing price of the stock by the latest years book value per
share Calculated as St ock price (T ot al Asset - Int angible asset s and
Liabilit ies)
PriceEarnings Rat io
A valuation ratio of a companys current share price compared to its per-share
earnings Calculated as Market value per share Earning per share EPS
Market capShareholder equit y
A financial ratio showing the premium which is included in the current market price
compared to the actual value of Shareholder equity of the company Calculated as
Market capit alizat ion Shareholders equit y
PriceEBIT Rat io
The PriceEBIT ratio is a market value indicator similar to the PE ratio which shows
the number of times the market price exceeds the earnings per share before the
effects of gross interest abnormal items and tax The PriceEBIT ratio is calculated
as follows Valuat ion price EBIT
T ot al Capit al Rat io
Calculated as T ot al capit al (T ier 1 and T ier 2) rat io = T ot al capit al (T ier 1
and T ier 2) Risk-adjust ed asset s
T ier 1 Rat io
Tier 1 capital is the core measure of a banks financial strength from a regulators
point of view It consists primarily of shareholders equity but may also include
preferred stock that is irredeemable and non-cumulative and retained earnings
Risk Weight ed Asset s
Risk weights are in five categories from zero to 100 per cent Those carrying a
zero weight include notes and coins gold matched by gold liabilities balances with
the Reserve Bank and commonwealth government securities with less than twelve
months to maturity Commonwealth government securities with more than twelve
months to maturity carry a 10 per cent risk weighting as do state government
securities Claims on other banks Australian local governments and public-sector
organisations other than those with corporate status or which operate
Calculated as Investment Income current year Investment Income previous year
Receivables Arising Out Of Direct Insurance Operat ions T rend
Calculated as Receivables Arising out of Direct Insurance Operations current year
Receivables Arising out of Direct Insurance Operations previous year
Operat ing ROA
An indicator that shows the type of net profit which is actually generated by business
effort Calculated as Operat ing Prof it (EBIT ) T ot al Asset s
Payables T urnover
An indicator that evaluates how fast a company pays off its creditors (suppliers)
Calculated as Purchases T rade Payables
Working Capit al T urnover
A measure that indicates how efficiently the company generates revenue with its
working capital Working capital is defined as current assets minus current liabilities
Calculated as Net Sales (T ot al Current Asset s ndash T ot al Current
Liabilit ies)
Working Capit al
A measure of a companyrsquos short term financial health Calculated as T ot al
Current Asset s ndash T ot al Current Liabilit ies
Cash Rat io
A measure of a companyrsquos liquidity in crisis situation Only highly marketable
securities and cash are included Calculated as (T ot al Cash and Cash
Equivalent s + Market able securit ies) T ot al Current Liabilit ies
Cash Flow f rom Operat ion Rat io
A measure of how well current liabilities are covered by the cash flow generated
from a companyrsquos operations Calculated as Net Cash Flow f rom Operat ing
Act ivit ies T ot al Current Liabilit ies
Debt Coverage
A measure that shows a companyrsquos ability to cover total debt with its yearly cash
flow from operations Calculated as Net Cash Flow f rom Operat ing Act ivit ies
T ot al Debt
Cash Flow t o Revenue
This ratio measures the amount of operating cash flow generated for each dollar of
revenue Calculated as Net Cash Flow f rom Operat ing Act ivit ies Net Sales
Revenue
Cash Ret urn on Asset s
This ratio measures the return of operating cash flow attributed to all providers of
capital Calculated as Net Cash Flow f rom Operat ing Act ivit ies T ot al
Asset s
Cash Ret urn on Equit y
This ratio measures the return of operating cash flow attributed to shareholders
Calculated as Net Cash Flow f rom Operat ing Act ivit ies T ot al
Shareholdersrsquo Equit y
Cash t o Income
This ratio measures the ability to generate cash from companyrsquos operations
Calculated as Net Cash Flow f rom Operat ing Act ivit ies Operat ing Prof it
(EBIT )
CashT ot al Asset s
Calculated as Cash and Cash Equivalent s T ot al Asset s
EMIS Business Report Generated on 2016-06-02
Copyright copy 2015 EMIS all rights reserved A Euromoney Institutional Investor company Page 46 of 48
commercially carry a 20 per cent risk weighting Loans secured by a mortgage
over residential property and with a loan-to-valuation of 80 per cent or less carry a
50 per cent risk weighting and loans to companies or individuals carry a 100 per
cent risk weighting
Market Cap Net cash
A ratio measure the market value of the company to the Net cash position of the
company Calculated as Market capit alizat ion (Cash and cash equivalent s
minus long-t erm debt )
Net Cash
Net cash is commonly used in evaluating a companys cash flow More generally
net cash can refer to the amount of cash remaining after a transaction has been
completed and all charges and deductions related to the transaction have been
subtracted Calculated as T ot al cash minus t ot al short t erm liabilit ies
Annualised Ret urn on Equit y (ROE)
Return on Equity ratio (ROE) converted into an annual basis
Annualised Ret urn on Asset s (ROA)
Return on Assets ratio (ROA) converted into an annual basis
Export Proport ion Rat io
The percentage figure of the proportion of the export revenue from the total sales
revenue of the company Calculated as Export revenue T ot al revenue
Net Debt
A metric that shows companys overall debt situation by netting the value of
financial liabilities with its cash and other similar liquid assets Calculated as
financial liabilities - cash and cash equivalents
EPS
The portion of a companys profit allocated to each outstanding share Calculated
as Net Profit Outstanding Shares
PE
A valuation ratio of a companys current share price compared to its per-share
earnings Calculated as Market value per share Earning per share EPS
Market Capit alizat ionNet Sales
Calculated as Market Capitalization Net Sales Revenue
Market Capit alizat ionGross income
Calculated as Market Capitalization Gross Profit
Market Capit alizat ionEBIT
Calculated as Market Capitalization EBIT
Market Capit alizat ionT ot al Asset s
Calculated as Market Capitalization Total Assets
ReceivablesT ot al asset s
Calculated as T rade Account s Receivable T ot al Asset s
Invent oriesT ot al asset s
Calculated as Invent ories T ot al Asset s
Fixed asset sT ot al asset s
Calculated as Non-current Asset s T ot al Asset s
Current Liabilit iesT ot al Liabilit ies
Calculated as T ot al Current Liabilit ies T ot al Liabilit ies
Salaries and Employee Benef it sNet sales
Calculated as Employee Benef it Expenses Net Sales Revenue
Administ rat ive ExpensesNet Sales
Calculated as Administ rat ive Expenses Net Sales Revenue
Depreciat ion and Amort izat ionNet sales
Calculated as Depreciat ion Amort izat ion and Impairment Charges Net
Sales Revenue
Int erest paidNet sales
Calculated as Int erest -t ype Expenses Net Sales Revenue
Income t axNet sales
Calculated as Income T ax Net Sales Revenue
Operat ing Cash Flow t o T ot al Cash Flow
Calculated as Net Cash Flow f rom Operat ing Act ivit ies Net
IncreaseDecrease in Cash and Cash Equivalent s
Cash Flow f rom Invest ing t o T ot al Cash Flow
Calculated as Net cash f low f rom (used in) invest ing act ivit ies Net
IncreaseDecrease in Cash and Cash Equivalent s
Cash f low f rom f inancing t o T ot al cash f low
Calculated as Net cash flow from (used in) financing activities Net
IncreaseDecrease in Cash and Cash Equivalents
Average Yie ld on Asset s
Calculated as T ot al Int erest Income T ot al Asset s
Disclaimer
Whilst EMIS attempts at all times to ensure the accuracy and reliability of the information it provides due to the vast quantity of processed data and the fact that some of
the third-party data cannot always be verified including information provided directly by the subject of the enquiry EMIS does not guarantee the correctness or the
effective delivery of the information and shall not be held responsible for any errors or omissions therein
The content and recommendations shall only be used as a reference in business decisions of EMIS clients and shall not be used for any other purposes EMIS and its
affiliates shall not be held liable for any loss of the clients arising out of its own business decisions whether or not the making of such decision has been referred to this
contentrecommendation
EMIS Business Report Generated on 2016-06-02
Copyright copy 2015 EMIS all rights reserved A Euromoney Institutional Investor company Page 47 of 48
EMIS Business Report Generated on 2016-06-02
Copyright copy 2015 EMIS all rights reserved A Euromoney Institutional Investor company Page 48 of 48
- Table of Contents
- Company Tear Sheet
-
- Contact Information
- NAICS Industry Classification
- Business description
- Basic Information
- EMIS Financial Score
- Share Price information
- Key Executives
- Ownership Details
- Subsidiaries and Affiliates
- Key Financial Highlights
- Financial Performance Charts
- Latest MampA and ECM Deals
- Top Competitors
-
- Financial Statements
-
- Annual Statements
- Interim Statements
- Ratios
- Multiples
-
- Company Documents
-
- Financial DocumentsAnnual Reports
- Corporate Actions
-
- News amp Reports
-
- News
- Reports
-
- MampA and ECM Deals
-
- EMIS DealWatch Deals
- EMIS DealWatch Intents
-
- EMIS Credit Analytics
-
- Summary
- EMIS Financial Score
- EMIS Benchmark Score
- EMIS Credit Quota
- Conclusions
- Company vs Industry Key Stats
- Company vs Industry Balance Sheet
- Company vs Industry Income Statement
- Company vs Industry Cash Flow
- EMIS Credit Analytics Assumptions
-
- Glossary
- Disclaimer
-
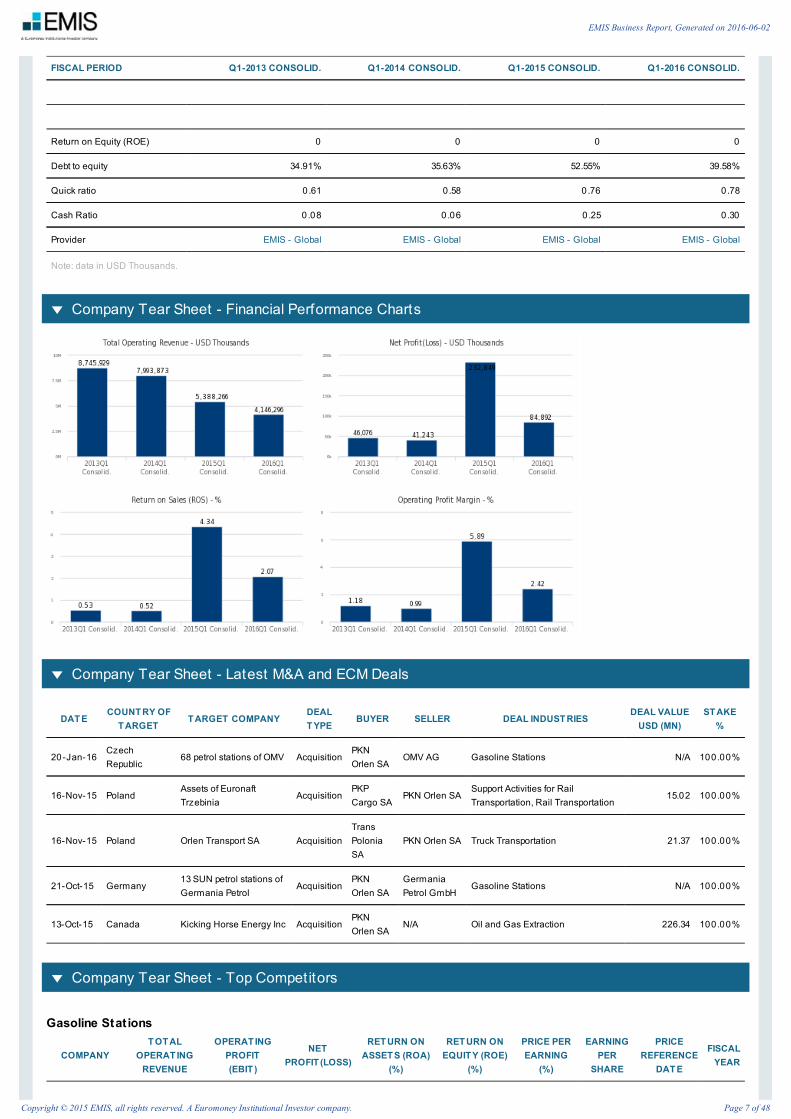
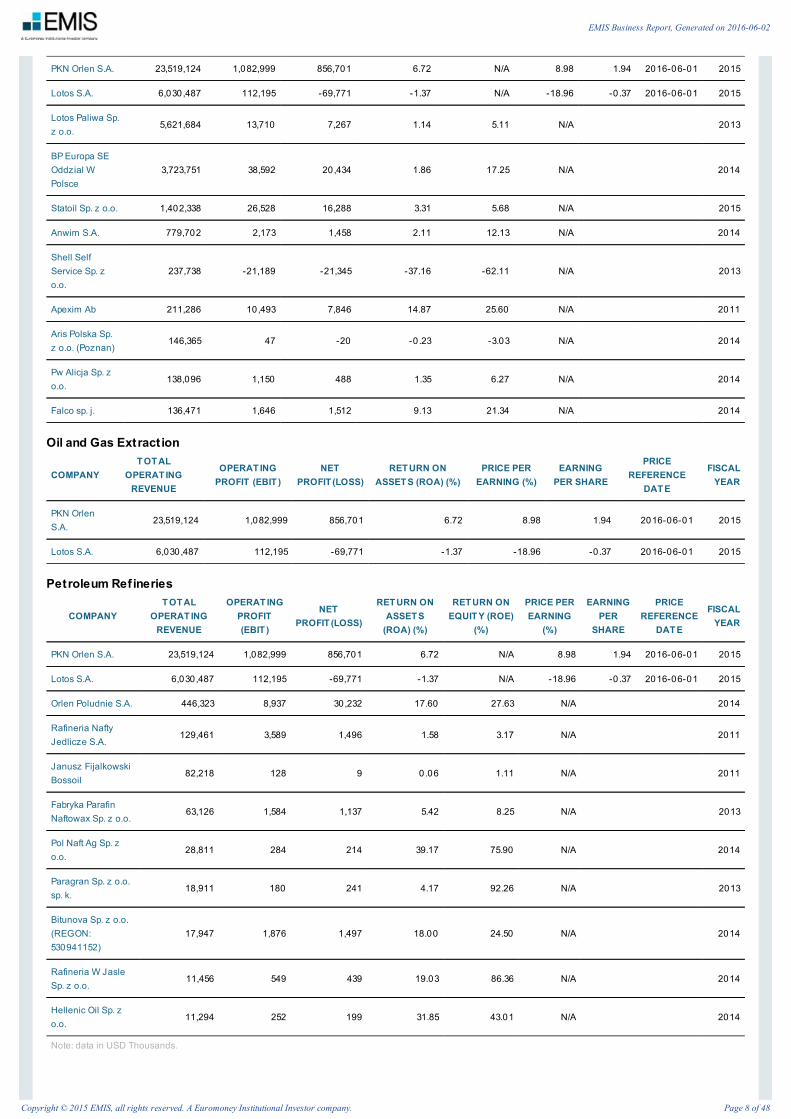
PKN Orlen SA 23519124 1082999 856701 672 NA 898 194 2016-06-01 2015
Lotos SA 6030487 112195 -69771 -137 NA -1896 -0 37 2016-06-01 2015
Lotos Paliwa Spz oo
5621684 13710 7267 114 511 NA 2013
BP Europa SEOddzial WPolsce
3723751 38592 20434 186 1725 NA 2014
Statoil Sp z oo 1402338 26528 16288 331 568 NA 2015
Anwim SA 779702 2173 1458 211 1213 NA 2014
Shell SelfService Sp zoo
237738 -21189 -21345 -3716 -6211 NA 2013
Apexim Ab 211286 10493 7846 1487 2560 NA 2011
Aris Polska Spz oo (Poznan)
146365 47 -20 -023 -303 NA 2014
Pw Alicja Sp zoo
138096 1150 488 135 627 NA 2014
Falco sp j 136471 1646 1512 913 2134 NA 2014
Oil and Gas Extract ion
COMPANYT OT AL
OPERAT INGREVENUE
OPERAT INGPROFIT (EBIT )
NETPROFIT (LOSS)
RET URN ONASSET S (ROA) ()
PRICE PEREARNING ()
EARNINGPER SHARE
PRICEREFERENCE
DAT E
FISCALYEAR
PKN OrlenSA
23519124 1082999 856701 672 898 194 2016-06-01 2015
Lotos SA 6030487 112195 -69771 -137 -1896 -0 37 2016-06-01 2015
Petroleum Refineries
COMPANYT OT AL
OPERAT INGREVENUE
OPERAT INGPROFIT(EBIT )
NETPROFIT (LOSS)
RET URN ONASSET S
(ROA) ()
RET URN ONEQUIT Y (ROE)
()
PRICE PEREARNING
()
EARNINGPER
SHARE
PRICEREFERENCE
DAT E
FISCALYEAR
PKN Orlen SA 23519124 1082999 856701 672 NA 898 194 2016-06-01 2015
Lotos SA 6030487 112195 -69771 -137 NA -1896 -0 37 2016-06-01 2015
Orlen Poludnie SA 446323 8937 30232 1760 2763 NA 2014
Rafineria NaftyJedlicze SA
129461 3589 1496 158 317 NA 2011
Janusz FijalkowskiBossoil
82218 128 9 006 111 NA 2011
Fabryka ParafinNaftowax Sp z oo
63126 1584 1137 542 825 NA 2013
Pol Naft Ag Sp zoo
28811 284 214 3917 7590 NA 2014
Paragran Sp z oosp k
18911 180 241 417 9226 NA 2013
Bitunova Sp z oo(REGON530941152)
17947 1876 1497 1800 2450 NA 2014
Rafineria W JasleSp z oo
11456 549 439 1903 8636 NA 2014
Hellenic Oil Sp zoo
11294 252 199 3185 4301 NA 2014
Note data in USD Thousands
EMIS Business Report Generated on 2016-06-02
Copyright copy 2015 EMIS all rights reserved A Euromoney Institutional Investor company Page 8 of 48
Financial Statements - Annual Statements - EMIS Global Template
REPORTING DETAILS
NAME Y-2011 - CONSOLID Y-2012 - CONSOLID Y-2013 - CONSOLIDY-2014 -
CONSOLIDY-2015 - CONSOLID
Begin date of reporting period 2011-01-01 2012-01-01 2013-01-01 2014-01-01 2015-01-01
End date of reporting period 2011-12-31 2012-12-31 2013-12-31 2014-12-31 2015-12-31
Original units as reported PLN Thousands PLN Thousands PLN Thousands PLN Thousands PLN Thousands
Displaying units USD Thousands USD Thousands USD Thousands USD Thousands USD Thousands
Comments Notes Notes Notes Notes Notes
Audited Audited Audited Audited Audited Audited
Balance Sheet
NAME Y-2011 - CONSOLID Y-2012 - CONSOLID Y-2013 - CONSOLIDY-2014 -
CONSOLIDY-2015 - CONSOLID
Exchange rat e used f or currencyconversion (IFRS)
342 310 301 351 390
Total Assets 17186012 16979933 17049137 13322594 12339340
Non-current assets 8368684 8649826 8933267 7119925 7013919
Property plant and equipment 7777448 7982966 8268260 6456432 6289508
Intangible assets and goodwill 387149 466834 273240 200445 332727
Long-term financial assets 78116 86463 289177 284843 236087
Investment properties 62419 69364 71713
Investments in subsidiaries 3841 3871 204183 191606 198406
Deferred assets 116909 95819 50133 109774 93563
Non-current deferred tax assets 116909 95819 50133 109774 93563
Other non-current assets 9061 17744 52457 68431 62034
Current Assets 8808981 8309137 8110890 6192974 5300556
Inventories 4768689 4842883 4564741 2802521 2746661
Trade and other receivables 2361740 2605175 2579017 2022126 1702340
Current trade receivables 2361740 2605175 2579017 2022126 1702340
Prepayments accrued income and otherdeferred current assets
9857 29036 19588
Short term Financial assets 85865 118725 54781 245780 249673
Other current financial assets 85865 118725 54781 245780 249673
Cash amp Cash Equivalents 1582831 713318 892762 1122548 601882
Assets of disposal group classified as heldfor sale
8347 20970 4980 9694 24865
Total Equity and liabilities 17186012 16979933 17049137 13322594 12339340
Total equity 7841834 9132469 9147078 5812614 6214657
Equity attributable to owners of the parent 7179076 8542715 8614874 5352133 5683781
Issued capital 309485 341334 351262 301665 271206
Foreign currency translation reserve 116060 4517 -17596 -230953 117146
Retained earnings 6394411 7801007 7873838 4931569 4980903
Other reserves 359119 395858 407371 349852 314527
EMIS Business Report Generated on 2016-06-02
Copyright copy 2015 EMIS all rights reserved A Euromoney Institutional Investor company Page 9 of 48
Minority interest 662758 589754 532205 460481 530876
Total Liabilities 9344178 7847464 7902058 7509979 6124683
Non-current liabilities 3546556 2967157 2604914 3508497 2621568
Non-current loans and borrowings 3083570 2477094 2160359 2757185 2084284
Deferred revenue accrued expenses andother deferred non-current liabilities
221557 221964 181939 21385 172772
Provisions for other liabilities and charges 181828 212931 218459 202156 182000
Other non-current liabilities 59601 55168 44157 527771 182513
Current Liabilities 5797622 4880307 5296813 4001483 3503115
Current loans and borrowings 849215 457156 318725 572251 486273
Trade and other payables 4416376 4083107 4652390 3209683 2773577
Current trade payables 4416376 4083107 4652390 3209683 2773577
Deferred revenue accrued expenses andother deferred current liabilities
39907 54201 41169
Provisions for other liabilities and charges 295002 259066 272576 184763 191997
Other current liabilities 2361740 2605175 2579017 2022126 1702340
Current income tax liabilities 197121 26778 11952
Liabilities of disposal group classified asheld for sale
33201
Income Statement
NAME Y-2011 - CONSOLID Y-2012 - CONSOLID Y-2013 - CONSOLIDY-2014 -
CONSOLIDY-2015 - CONSOLID
Exchange rat e used f or currencyconversion (IFRS)
296 326 316 315 377
Total Operating Revenue 36435448 37084849 36111401 34117696 23519124
Net sales revenue 36095774 36862023 35930793 33874809 23407830
Cost of Goods Sold -33202235 -34404186 -34113963 -32028741 -20613814
Gross profit 2893539 2457837 1816830 1846068 2794016
Selling and distribution expenses -1235075 -1188404 -1228195 -1242973 -1052261
Administrative expenses -495446 -467750 -458952 -479432 -411259
Raw materials and consumables used -25627619 -22381751 -14452883
Employee benefit expense -663915 -652878 -559121
Social security costs -663915 -652878 -559121
Depreciation amortization and impairmentcharges
-667710 -631316 -502149
Tax and contributions -193260 -207056 -305264
Other costs by nature -8969018 -11255878 -6489514
Other operating expenses -805406 -403296 -225839 -1878411 -358791
Other operating income 339674 222826 180608 242887 111294
Operating profit (EBIT) 697287 621211 84452 -1511861 1082999
Financial result 244726 184154 -47445 -486725 -170121
Finance income 1001638 461612 145498 112248 103345
Other financial income 63537 -30692
Finance costs -756911 -277458 -192943 -598973 -273466
EMIS Business Report Generated on 2016-06-02
Copyright copy 2015 EMIS all rights reserved A Euromoney Institutional Investor company Page 10 of 48
Share of profit (loss) of associates -117558 -53711 -27202 -5390 104935
Profit before income tax 942013 805365 37007 -1998586 912878
Income tax -262094 -139343 -21192 132541 -123219
Profit after income tax 679920 666022 15815 -1866044 789659
Net Profit(Loss) 679920 666022 28467 -1847970 856701
Cash Flow Statement
NAME Y-2011 - CONSOLID Y-2012 - CONSOLID Y-2013 - CONSOLIDY-2014 -
CONSOLIDY-2015 - CONSOLID
Exchange rat e used f or currencyconversion (IFRS)
296 326 316 315 377
Net cash flow from (used in) operatingactivities
256819 948084 1752305 1010549 1418737
Net Profit 679920 666022 28467 -1847970 856701
Adjustments for Depreciation andimpairment of property plant and equipment
803063 693645 667710 631316 502149
Adjustments for Finance income 128356 104354 85401 75783 52202
Adjustments for Other adjustments -83777 -97601 -30681 1736991 165616
Changes in Inventories -1540368 312754 308077 1301950 -173566
Changes in Trade and other receivables -445130 -41741 128102 292986 333353
Changes in Trade and other payables 364692 -620598 454208 -1039404 -509569
Income tax paid 149572 -197965 -12652 -185812 69161
Net cash flow from (used in) investingactivities
505138 -882403 -772090 -1274681 -1085384
Proceeds from sale of property plant andequipment
109565 13812 51873 126834 34713
Purchase of property plant and equipment -857894 -750733 -753428 -1173214 -815893
Purchase of financial instruments -37549 -8594
Proceeds from sale of financial instruments 39040 6752
Acquisition of subsidiary 1199415 -52177 -169537 -251131 -316659
Other investing activity cash flows 52560 -91463 99002 22830 12454
Net cash flow from (used in) financingactivities
112153 -1046913 -771141 660488 -759451
Proceeds from borrowings 6374919 1398646 1135203 3056381 502414
Repayment of borrowings -6081090 -2393690 -1718461 -2861057 -999263
Payments of finance lease liabilities -9297 -8901 -8856
Dividends paid -4604 -203065 -195641 -187080
Other financing activity cash flow -172379 -38365 24039 660805 -75521
Net increase (decrease) in cash and cashequivalents
874110 -981232 209075 396356 -426098
Cash at the beginning of the period 951799 1660145 641774 852641 1043251
Exchange gains (losses) on cash and cashequivalents
-70151 -30692 -31630 -63417 5035
Cash at the end of the period 1825207 678606 850532 1248363 622188
Free cash flow -601075 197351 998877 -162665 602844
CAPEX -898840 -802910 -922965 -1424345 -1132551
EMIS Business Report Generated on 2016-06-02
Copyright copy 2015 EMIS all rights reserved A Euromoney Institutional Investor company Page 11 of 48
OTHER INFORMATION
NAME Y-2011 - CONSOLID Y-2012 - CONSOLID Y-2013 - CONSOLIDY-2014 -
CONSOLIDY-2015 - CONSOLID
Audited Audited Audited Audited Audited Audited
Financial statement type Consolid Consolid Consolid Consolid Consolid
Fiscal year end December December December December December
EMIS Business Report Generated on 2016-06-02
Copyright copy 2015 EMIS all rights reserved A Euromoney Institutional Investor company Page 12 of 48
Financial Statements - Interim Statements - EMIS Global Template
REPORTING DETAILS
NAMEQ1-2015 -
CONSOLIDH1-2015 -
CONSOLIDQ3C-2015 -CONSOLID
Y-2015 - CONSOLIDQ1-2016 -
CONSOLID
Begin date of reporting period 2015-01-01 2015-01-01 2015-01-01 2015-01-01 2016-01-01
End date of reporting period 2015-03-31 2015-06-30 2015-09-30 2015-12-31 2016-03-31
Original units as reported PLN Thousands PLN Thousands PLN Thousands PLN Thousands PLN Thousands
Displaying units USD Thousands USD Thousands USD Thousands USD Thousands USD Thousands
Comments Notes Notes Notes Notes Notes
Audited Non-Audited Audited Non-Audited Audited Non-Audited
Balance Sheet
NAMEQ1-2015 -
CONSOLIDH1-2015 -
CONSOLIDQ3C-2015 -CONSOLID
Y-2015 - CONSOLIDQ1-2016 -
CONSOLID
Exchange rat e used f or currencyconversion (IFRS)
381 376 378 390 376
Total Assets 12205902 13022978 13208137 12339340 12827082
Non-current assets 6587279 6531545 6580495 7013919 7478851
Property plant and equipment 5932590 5957763 5956720 6289508 6660548
Intangible assets and goodwill 206689 160978 163426 332727 404629
Long-term financial assets 247869 240935 263813 236087 258047
Investment properties 52984 54456 55358
Investments in subsidiaries 184393 175588 197595 198406 228518
Deferred assets 64000 72254 69132 93563 89918
Non-current deferred tax assets 64000 72254 69132 93563 89918
Other non-current assets 136131 99615 127404 62034 65709
Current Assets 5614164 6489574 6623139 5300556 5333599
Inventories 2666754 2847921 3156222 2746661 2457036
Trade and other receivables 1948590 2414132 2029719 1702340 1756850
Current trade receivables 1948590 2414132 2029719 1702340 1756850
Prepayments accrued income and otherdeferred current assets
11541 6907 9800
Short term Financial assets 176787 120866 137734 249673 197393
Other current financial assets 176787 120866 137734 249673 197393
Cash amp Cash Equivalents 810492 1099748 1289665 601882 922320
Assets of disposal group classified as heldfor sale
4459 1859 4503 24865 14632
Total Equity and liabilities 12205902 13022978 13208137 12339340 12827082
Total equity 5601049 5952185 6383694 6214657 6507050
Equity attributable to owners of the parent 5167213 5449595 5851301 5683781 5966214
Issued capital 277508 281047 280235 271206 281458
Foreign currency translation reserve -167082 -128304 78932 117146 138069
Retained earnings 4734951 4970912 5167135 4980903 5258845
Other reserves 321836 325940 324999 314527 287843
EMIS Business Report Generated on 2016-06-02
Copyright copy 2015 EMIS all rights reserved A Euromoney Institutional Investor company Page 13 of 48
Minority interest 433836 502590 532394 530876 540835
Total Liabilities 6604852 7070793 6824442 6124683 6320032
Non-current liabilities 2722623 2632753 3199926 2621568 2621442
Non-current loans and borrowings 2290623 2137336 2557610 2084284 2099761
Deferred revenue accrued expenses andother deferred non-current liabilities
31738 90317 147534 172772 176643
Provisions for other liabilities and charges 185443 196573 196006 182000 194201
Other non-current liabilities 214820 208527 298776 182513 150838
Current Liabilities 3882230 4438040 3624517 3503115 3689279
Current loans and borrowings 652590 567937 328177 486273 475924
Trade and other payables 2966557 3647762 3033851 2773577 2937217
Current trade payables 2966557 3647762 3033851 2773577 2937217
Deferred revenue accrued expenses andother deferred current liabilities
73967 64816 50591 72094
Provisions for other liabilities and charges 184656 126179 158129 191997 204044
Other current liabilities 1948590 2414132 2029719 1702340 1756850
Current income tax liabilities 4459 31345 53769
Liabilities of disposal group classified asheld for sale
9311
Income Statement
NAMEQ1-2015 -
CONSOLIDH1-2015 -
CONSOLIDQ3C-2015 -CONSOLID
Y-2015 - CONSOLIDQ1-2016 -
CONSOLID
Exchange rat e used f or currencyconversion (IFRS)
373 371 373 377 396
Total Operating Revenue 5388266 12107296 18354052 23519124 4146296
Net sales revenue 5366537 12054267 18281194 23407830 4096271
Cost of Goods Sold -4700716 -10337420 -15904470 -20613814 -3682172
Gross profit 665821 1716847 2376724 2794016 414099
Selling and distribution expenses -250555 -516831 -779473 -1052261 -252906
Administrative expenses -104085 -212654 -300539 -411259 -91461
Raw materials and consumables used -3210265 -7453936 -11418347 -14452883 -2296620
Employee benefit expense -143251 -288025 -421344 -559121 -143255
Wages and salaries -143255
Social security costs -143251 -288025 -421344 -559121
Depreciation amortization and impairmentcharges
-121253 -246571 -370986 -502149 -130117
Tax and contributions -75918 -153972 -230896 -305264 -69227
Other costs by nature -1519960 -3197351 -4793091 -6489514 -1292323
Other operating expenses -16632 -160433 -207056 -358791 -20465
Other operating income 21729 53029 72858 111294 50025
Operating profit (EBIT) 316278 879958 1162513 1082999 99293
Financial result -47214 -104443 -130984 -170121 -11117
Finance income 23875 42800 69644 103345 11369
Finance costs -71089 -147243 -200627 -273466 -22486
EMIS Business Report Generated on 2016-06-02
Copyright copy 2015 EMIS all rights reserved A Euromoney Institutional Investor company Page 14 of 48
Share of profit (loss) of associates 30045 79140 102858 104935 -25265
Profit before income tax 269065 775515 1031530 912878 88176
Income tax -44531 -152896 -197681 -123219 -24760
Profit after income tax 224533 622619 833849 789659 63416
Net Profit(Loss) 232849 650614 884475 856701 84892
Cash Flow Statement
NAMEQ1-2015 -
CONSOLIDH1-2015 -
CONSOLIDQ3C-2015 -CONSOLID
Y-2015 - CONSOLIDQ1-2016 -
CONSOLID
Exchange rat e used f or currencyconversion (IFRS)
373 371 373 377 396
Net cash flow from (used in) operatingactivities
262895 984939 1015458 1418737 739517
Net Profit 232849 650614 884475 856701 109652
Adjustments for Depreciation andimpairment of property plant and equipment
121253 246571 370986 502149 130117
Adjustments for Finance income 14486 27726 39911 52202 12633
Adjustments for Other adjustments -29509 94752 82501 165616 55584
Changes in Inventories -89599 -207540 -512685 -173566 373169
Changes in Trade and other receivables -89062 -416426 -44465 333353 8085
Changes in Trade and other payables 66260 411311 -51429 -509569 64932
Income tax paid 21193 124632 155895 69161 -22234
Net cash flow from (used in) investingactivities
-152372 -354783 -511345 -1085384 -353462
Proceeds from sale of property plant andequipment
11535 14536 18750 34713 15412
Purchase of property plant and equipment -165248 -335132 -495541 -815893 -387318
Acquisition of subsidiary -9152 -9107 -316659 17938
Other investing activity cash flows 1341 -25034 -25447 12454 50531
Net cash flow from (used in) financingactivities
-339349 -576858 -265985 -759451 -78575
Proceeds from borrowings 19046 100943 531970 502414 538152
Repayment of borrowings -342031 -633387 -548310 -999263 -602073
Payments of finance lease liabilities -1878 -3499 -5625 -1769
Dividends paid -189109 -187080
Other financing activity cash flow -14486 -40916 -54911 -75521 -12885
Net increase (decrease) in cash and cashequivalents
-228826 53298 238128 -426098 307479
Cash at the beginning of the period 1056139 1059772 1054566 1043251 593230
Exchange gains (losses) on cash and cashequivalents
1610 1346 11518 5035 -24760
Cash at the end of the period 828923 1114416 1304212 622188 875950
Free cash flow 97647 649807 519917 602844 352199
CAPEX -165248 -344554 -504917 -1132551 -387318
OTHER INFORMATION
EMIS Business Report Generated on 2016-06-02
Copyright copy 2015 EMIS all rights reserved A Euromoney Institutional Investor company Page 15 of 48
NAMEQ1-2015 -
CONSOLIDH1-2015 -
CONSOLIDQ3C-2015 -CONSOLID
Y-2015 - CONSOLIDQ1-2016 -
CONSOLID
Reporting type Non-Cumulative Non-Cumulative Cumulative Non-Cumulative
Audited Non-Audited Audited Non-Audited Audited Non-Audited
Financial statement type Consolid Consolid Consolid Consolid Consolid
Fiscal year end December December December December December
EMIS Business Report Generated on 2016-06-02
Copyright copy 2015 EMIS all rights reserved A Euromoney Institutional Investor company Page 16 of 48
Financial Statements - Ratios
REPORTING DETAILS
NAME Y-2011 - CONSOLID Y-2012 - CONSOLID Y-2013 - CONSOLIDY-2014 -
CONSOLIDY-2015 - CONSOLID
Begin date of reporting period 2011-01-01 2012-01-01 2013-01-01 2014-01-01 2015-01-01
End date of reporting period 2011-12-31 2012-12-31 2013-12-31 2014-12-31 2015-12-31
Original units as reported PLN Thousands PLN Thousands PLN Thousands PLN Thousands PLN Thousands
Displaying units USD Thousands USD Thousands USD Thousands USD Thousands USD Thousands
Comments Notes Notes Notes Notes Notes
Audited Audited Audited Audited Audited Audited
Ratios
NAME Y-2011 - CONSOLID Y-2012 - CONSOLID Y-2013 - CONSOLIDY-2014 -
CONSOLIDY-2015 - CONSOLID
Exchange rat e used f or currencyconversion (IFRS)
100 100 100 100 100
Profitability Ratios
Return on Assets (ROA) 343 412 018 -1247 672
Annualised Return on Assets (ROA) 343 412 018 -1247 672
Return on Equity (ROE) 000 000 000 000 000
Annualised Return on Equity (ROE) 000 000 000 000 000
Return on Capital 501 580 026 -1818 943
Return on Sales (ROS) 188 181 008 -546 366
Gross Profit Margin 802 667 506 545 1194
Operating Profit Margin 193 169 024 -446 463
Operating ROA 352 385 052 -1020 849
Efficiency Ratios
Inventory Turnover -0 22x -0 26x -0 28x -0 40x -0 37x
Accounts Receivable Turnover 1325x 1487x 1462x 1506x 1330x
Current asset turnover 355x 466x 465x 492x 427x
Fixed-asset turnover 374x 448x 422x 428x 323x
Asset Turnover 182x 228x 221x 229x 184x
Payables Turnover 009x -0 41x -0 37x -0 70x -0 29x
Working Capital Turnover 1039x 1130x 1340x 1390x 1260x
Valuation Figures
Bookvalue 7454685 8665634 8874170 5612169 5881931
Enterprise Value 7255510 9641115 7940595 8633248 9938494
Net Cash -7761348 -7134146 -7008964 -6387432 -5522801
Net Debt 2349954 2220932 1586321 2206889 1968676
Working Capital 3011359 3428830 2814077 2191492 1797442
Earning Before Interests and Taxes (EBIT) 697287 621211 84452 -1511861 1082999
EMIS Business Report Generated on 2016-06-02
Copyright copy 2015 EMIS all rights reserved A Euromoney Institutional Investor company Page 17 of 48
Liquidity Ratios
Current Ratio 152 170 153 155 151
Quick ratio 0 70 071 067 085 073
Dooms day ratio 0 27 015 017 028 017
Cash Ratio 029x 017x 018x 034x 024x
Cash Flow from Operation Ratio 004x 020x 035x 023x 039x
Leverage Ratios
Debt to total assets 2288 1728 1454 2499 2083
Debt to equity 5015 3213 2710 5728 4136
Long Term Debt to Capital 2822 2134 1911 3217 2512
Debt Enterprise Value 5420 3043 3122 3857 2586
Cash Flow to Debt 1927 -3515 885 1070 -1604
Leverage ratio 219x 186x 186x 229x 199x
Growth Trend Ratios
Revenue Trend 12804 11227 9458 9404 8269
Total Operating Revenue Trend 12806 11190 9449 9425 8249
Gross Profit Trend 10745 9338 7173 10136 18111
Operating Income Trend 6618 9794 1319 -1786 -8572
Net Income Trend 8206 10769 415 -6476 -5547
Accounts Receivables Trend 12834 10005 9620 9130 9364
Inventory Trend 14428 9211 9159 7149 10901
Net Property Plant and Equipment (PPampE)Trend
9699 9310 10065 9093 10836
Total Assets Trend 11482 8961 9757 9099 10302
Bookvalue Trend 11117 10595 9725 7331 12021
Shareholders Equity Trend 11056 10563 9733 7399 11892
Cash from Operations Trend 1246 40586 17935 5753 16799
Capital Expenditures Trend 6936 9821 11154 15394 9515
Coverage Ratios
Debt Coverage 006x 034x 074x 027x 053x
Performance Ratios
Cash Flow to Revenue 071 257 488 298 606
Cash Return on Assets 130 587 1079 682 1112
Cash Return on Equity 284 1091 2011 1563 2208
Cash to Income 3683 15262 2075 -6684 13100
Common size balance sheet ratios
CashTotal Assets 921 420 524 843 488
ReceivablesTotal assets 1374 1534 1513 1518 1380
InventoriesTotal assets 2775 2852 2677 2104 2226
EMIS Business Report Generated on 2016-06-02
Copyright copy 2015 EMIS all rights reserved A Euromoney Institutional Investor company Page 18 of 48
Fixed assetsTotal assets 4525 4701 4850 4846 5097
Current LiabilitiesTotal Liabilities 6205 6219 6703 5328 5720
Common size income statement ratios
Administrative ExpensesNet Sales -137 -127 -128 -142 -176
Income taxNet sales -0 73 -038 -006 039 -053
Common size cash flow statement ratios
Operating Cash Flow to Total Cash Flow 2938 -9662 83812 25496 -33296
Cash Flow from Investing to Total Cash Flow 5779 8993 -36929 -32160 25473
Cash flow from financing to Total cash flow 1283 10669 -36884 16664 17823
OTHER INFORMATION
NAME Y-2011 - CONSOLID Y-2012 - CONSOLID Y-2013 - CONSOLIDY-2014 -
CONSOLIDY-2015 - CONSOLID
Audited Audited Audited Audited Audited Audited
Financial statement type Consolid Consolid Consolid Consolid Consolid
Fiscal year end December December December December December
EMIS Business Report Generated on 2016-06-02
Copyright copy 2015 EMIS all rights reserved A Euromoney Institutional Investor company Page 19 of 48
Financial Statements - Mult iples
REPORTING DETAILS
NAME Y-2011 - CONSOLID Y-2012 - CONSOLID Y-2013 - CONSOLIDY-2014 -
CONSOLIDY-2015 - CONSOLID
Begin date of reporting period 2011-01-01 2012-01-01 2013-01-01 2014-01-01 2015-01-01
End date of reporting period 2011-12-31 2012-12-31 2013-12-31 2014-12-31 2015-12-31
Original units as reported PLN Thousands PLN Thousands PLN Thousands PLN Thousands PLN Thousands
Displaying units PLN Thousands PLN Thousands PLN Thousands PLN Thousands PLN Thousands
Comments Notes Notes Notes Notes Notes
Audited Audited Audited Audited Audited Audited
Multiples
NAME Y-2011 - CONSOLID Y-2012 - CONSOLID Y-2013 - CONSOLIDY-2014 -
CONSOLIDY-2015 - CONSOLID
Equity Value Multiples
EPS 471 507 021 -1363 756
PE 720 976 19485 -359 898
Market CapitalizationNet Sales 014 018 015 020 033
Market CapitalizationGross income 169 264 305 359 275
Market CapitalizationEBIT 702 1046 6568 -439 710
Market CapitalizationTotal Assets 025 040 034 045 060
Market capShareholder equity 0 54 075 064 103 120
PriceBook Ratio 057 079 066 106 126
Market Cap Net cash -055 -0 96 -0 83 -0 93 -135
Market CapitalizationInvested Capital 0 36 057 050 067 087
Market CapitalizationOperating Cashflow 1905 685 317 657 542
Market Capitalization(EBIT + DevelopmentExpenditures)
702 1046 6568 -439 710
Enterprise Value Multiples
Enterprise valueNet Sales 023 025 021 028 044
Enterprise valueGross income 289 373 416 520 368
Enterprise valueEBIT 1200 1476 8958 -635 949
Enterprise valueTotal Assets 042 057 047 065 081
Enterprise valueInvested Capital 0 62 081 069 097 116
Enterprise valueOperating Cashflow 3258 967 432 950 724
Enterprise value(EBIT + DevelopmentExpenditures)
1200 1476 8958 -635 949
OTHER INFORMATION
NAME Y-2011 - CONSOLID Y-2012 - CONSOLID Y-2013 - CONSOLIDY-2014 -
CONSOLIDY-2015 - CONSOLID
Audited Audited Audited Audited Audited Audited
Financial statement type Consolid Consolid Consolid Consolid Consolid
EMIS Business Report Generated on 2016-06-02
Copyright copy 2015 EMIS all rights reserved A Euromoney Institutional Investor company Page 20 of 48
Fiscal year end December December December December December
EMIS Business Report Generated on 2016-06-02
Copyright copy 2015 EMIS all rights reserved A Euromoney Institutional Investor company Page 21 of 48
more raquo
more raquo
Company Documents - Financial DocumentsAnnual Reports
Company Documents - Corporate Act ions
June 12 2015 Polski Koncern Naftowy Orlen SA - Dividend (Mandatory) EDI - Corporate Act ions
June 04 2015 Polski Koncern Naftowy Orlen SA - Dividend (Mandatory) EDI - Corporate Act ions
June 03 2015 Polski Koncern Naftowy Orlen SA - Company Meet ing (Voluntary) EDI - Corporate Act ions
November 10 2014 Polski Koncern Naftowy Orlen SA - Company Meet ing (Voluntary) EDI - Corporate Act ions
November 10 2014 Polski Koncern Naftowy Orlen SA - Dividend (Mandatory) EDI - Corporate Act ions
June 14 2012 Polski Koncern Naftowy Orlen SA - Dividend (Mandatory) EDI - Corporate Act ions
May 29 2012 Polski Koncern Naftowy Orlen SA - Dividend (Mandatory) EDI - Corporate Act ions
December 16 2011 Polski Koncern Naftowy Orlen SA - Company Meet ing (Voluntary) EDI - Corporate Act ions
May 26 2011 Polski Koncern Naftowy Orlen SA - Company Meet ing (Voluntary) EDI - Corporate Act ions
December 13 1999 KGHM waits to decide on Catholic TV Warsaw Business Journal
By Anna KociNska TV Niepokalanow in January will get another chance to try to persuade copper concern KGHM Polska Miedzssupervisory board to invest in its proposed Catholic television station TV Familijna
November 29 1999 Elektrim picks f inancial health over long-distance license Warsaw Business Journal
By Gregory Keller Elektrims decision last week not to bid f or one of the three long-distance telephone licenses will delay but notnecessarily derail the conglomerates move to become a telecom heavyweight analysts said
November 23 1999 PSE to Enter Long-Distance Tender PNB - Polish News Bullet in
Independent Long-Distance Operator (NOM) a company owned by Tel-Energo in turn 76 percent owned by the PSE power grid company isto enter the tender f or long-distance telephone services sources reported
October 12 1999 PKN Lowers Fuel Prices PNB - Polish News Bullet in
Starting today (October 12) the Polski Koncern Naf towy (PKN) petroleum group will lower the wholesale price of its f uels by zl 50 per tonnewhich translates into a reduction of 5 groszy per litre in the price of diesel f uel and petrol at f illing stations
March 26 1998 CPN-Petrochemia Merger Conf irmed PNB - Polish News Bullet in
The Treasury Ministrys communiqu issued yesterday conf irmed earlier reports about a planned merger between the CPN petroleumdistributing giant and Petrochemia Plock
March 25 1998 CPN Petrochemia To Merge PNB - Polish News Bullet in
Unof f icial sources quoted by Zycie indicate that a merger between the CPN petroleum distributing giant and Petrochemia Plock is now certainwith the terms of the deal said to have been approved by the Treasury Ministry
News amp Reports - News
June 02 2016 PKN Orlen fuels ref ining margin edges down to USD 58bbl in May petchem margin up to EUR 995t PAP
Market InsiderWarszawa June 2 2016 (PAP) - Listed f uel f irm PKN Orlen recorded a slight decline of model ref ining margin in May to USD 58 per barrelf rom USD 62 in April and a spike in the model petchem margin to EUR 995 per ton f rom EUR 973 in the prior month data published on PKNOrlens website showed
June 02 2016 Saudi Aramco enters Balt ic market with oil supply deal with Polish PKN BBJ - Energy Today
EMIS Business Report Generated on 2016-06-02
Copyright copy 2015 EMIS all rights reserved A Euromoney Institutional Investor company Page 22 of 48
Saudi Aramco and Polands biggest ref iner PKN Orlen on Wednesday signed a contract agreed in May f or Aramco to supply PKN with 50000barrels of crude oil per day starting this month the companies said
June 01 2016 Top news from Polish polit ics economy business amp f inancial markets - 1930 PAP Market Insider
Warszawa June 1 2016 (PAP) - Following is a digest of the days top news as compiled by PAP Market Insider
June 01 2016 Top news from Polish polit ics economy business amp f inancial markets - 1630 PAP Market Insider
Warszawa June 1 2016 (PAP) - Following is a digest of the days top news as compiled by PAP Market Insider
June 01 2016 POLSKI KONCERN NAFTOWY ORLEN SA Transact ions in PKN ORLEN f inancial PAP Market Insider
instruments concluded by the person in a close relationship with the President of the PKN ORLEN Management Board Warszawa
June 01 2016 Poland Board of Sygnity appoints Jan Maciejewicz as new CEO M-Brain - News Monitoring
Wirtualny Nowy Przemysl 01 Jun 2016 online- Jan Maciejewicz has been appointed as the new CEO of the Polish IT f irm Signity replacingJanusz R Guy who was dismissed by the supervisory board on 30 May 2016
June 01 2016 Poland in talks with Iran over oil gas cooperat ion -minister Petroleum Bazaar - PetroMag
Poland is in talks with Iran over cooperation in the oil and gas sector which could result in exploration and production contracts f or Polishindustry Deputy Energy Minister Michal Kurtyka said on Monday
May 31 2016 Top news from Polish polit ics economy business amp f inancial markets - 1930 PAP Market Insider
Warszawa May 31 2016 (PAP) - Following is a digest of the days top news as compiled by PAP Market Insider BUSINESS amp EQUITYMARKET NEWS NATURAL GAS PGNIG - Listed natural gas group PGNiG recommends a dividend payment of PLN 106 bln f rom 2015 prof itwhich translates into PLN 018 per share the f irm said in a market f iling
May 31 2016 PKN ORLEN SA PKN ORLENs subsidiary - ORLEN Upstream - has purchased bonds issued by PKN ORLEN
PAP Market InsiderWarszawa May 31 2016 (ESPI) - Current report No 1392016 Polski Koncern Naf towy ORLEN SA (PKN ORLEN) hereby inf orms that inorder to optimise the management of f inancial liquidity within the ORLEN Capital Group on 31 May 2016 PKN ORLEN issued short term bondsto its subsidiary ORLEN Upstream Sp z oo (ORLEN Upstream)
May 31 2016 Top news from Polish polit ics economy business amp f inancial markets - 1630 PAP Market Insider
Warszawa May 31 2016 (PAP) - Following is a digest of the days top news as compiled by PAP Market Insider BUSINESS amp EQUITYMARKET NEWS POWER PGE - Listed power group PGE signed a letter of intent on selling PGEs telco unit Exatel to PGZ arms producerPGE said in a press statement
May 31 2016 POLSKI KONCERN NAFTOWY ORLEN SA Transact ions in PKN ORLEN f inancial PAP Market Insider
instruments concluded by the person in a close relationship with the President of the PKN ORLEN Management Board Warszawa
May 31 2016 Report Poland aims to end long-term gas supplies f rom Russia `22 Prime - Business News in English
Poland does not plan to renew a long-term gas supply contract with Russia when its current deal with Gazprom expires in 2022 Reutersreported late Monday cit ing Peter Naimsky a government of f icial responsible f or gas and power inf rastructure
May 31 2016 Warsaw Hopeful about Working with Post-sanct ions Iran PNB - Polish News Bullet in
Polish energy companies could prove to be usef ul partners f or their Iranian counterparts in sales or extraction of oil and natural gas DeputyEnergy Minister Michal Kurtyka said on Monday while taking part in the Polish-Iranian economic f orum The event was staged as part of theof f icial Warsaw visit of Iranian Minister of Foreign Af f airs dr
May 31 2016 Poland in talks with Iran over oil gas cooperat ion minister says BBJ - Energy Today
Poland is in talks with Iran over cooperation in the oil and gas sector which could result in exploration and production contracts f or Polishindustry Deputy Energy Minister Michal Kurtyka said on Monday Polish state-run gas f irm PGNiG said last year that it was looking at variousoptions in oil and gas exploration and production in Iran
May 31 2016 Treasury Looking for Synergy among Treasury Companies PNB - Polish News Bullet in
Treasury Minister Dawid Jackiewicz plans to f orm a holding of companies of strategic importance f or the state interest These companiesshould according to his plan sign long-term contracts among themselves so that money remained under Treasurys control and could beused to f inance other state needs
May 31 2016 Poland aims to end long-term gas supplies f rom Russia af ter 2022 Petroleum Bazaar - PetroMag
May 30 Poland does not plan to renew a long-term gas supply contract with Russia when its current deal with Gazprom expires in 2022 a
EMIS Business Report Generated on 2016-06-02
Copyright copy 2015 EMIS all rights reserved A Euromoney Institutional Investor company Page 23 of 48
government of f icial responsible f or gas and power inf rastructure told Reuters on Monday
May 31 2016 Polish Gas Companies Eyeing Direct LNG Supplies PNB - Economic Review
In less than 20 days the f irst commercial LNG shipment f rom Qatar will arrive at the Swinoujscie terminal This opens up new developmentpossibilit ies f or Polish gas producers traders and consumers PGNiG in pole posit ion The biggest benef iciary of the looming launch of theterminal is PGNiG
May 30 2016 Top news from Polish polit ics economy business amp f inancial markets - 1930 PAP Market Insider
Warszawa May 30 2016 (PAP) - Following is a digest of the days top news as compiled by PAP Market Insider BUSINESS amp EQUITYMARKET NEWS FOOD KERNEL - Listed edible oil producer Kernel Holding recorded a net attributable prof it of USD 923 mln in f iscal Q3 2016ended on March 31 the f irms consolidated f inancial report showed
May 30 2016 POLSKI KONCERN NAFTOWY ORLEN SA Agreements between ORLEN Capital Group and Glencore group
PAP Market InsiderWarszawa May 30 2016 (ESPI) - Current report No 1372016 Polski Koncern Naf towy ORLEN SA (PKN ORLEN) hereby inf orms that withinORLEN Capital Group there was concluded agreement with company f rom Glencore group
May 30 2016 PKN ORLEN SA Transact ions in PKN ORLEN f inancial instruments PAP Market Insider
concluded by the person in a close relationship with the President of the PKN ORLEN Management Board Warszawa
May 30 2016 Poland Press - Top Business Headlines PAP Market Insider
Warszawa May 30 2016 (PAP) - Following is a summary of the leading stories in the Polish press covering stocks and corporate news PAPdoes not verif y inf ormation contained in the Polish press BANKING CHF MORTGAGES - Polish banks prepared their own proposal f orproviding relief to the stressed CHF-mortgage borrowers
May 27 2016 PKN ORLEN SA Transact ions in PKN ORLEN f inancial instruments PAP Market Insider
concluded by the person in a close relationship with the President of the PKN ORLEN Management Board Warszawa
May 27 2016 Orlens Eurobonds Get Good Rat ings PNB - Polish News Bullet in
Fitch Ratings has conf irmed the BBB- long-term credit rating and stable outlook f or PKN Orlen The agency has also awarded the same ratingto the eurobonds to be issued by the Plock-based oil concern though on an interim basis Meanwhile Moodys gave the bonds an interimBaa3 rating PKN Orlen disclosed on Wednesday
May 24 2016 POLSKI KONCERN NAFTOWY ORLEN SA Ship-Service - has purchased bonds issued by PKN ORLEN
PAP Market InsiderWarszawa May 24 2016 (ESPI) - Current report No 1292016 Polski Koncern Naf towy ORLEN SA (PKN ORLEN) hereby inf orms that inorder to optimise the management of f inancial liquidity within the ORLEN Capital Group on 24 May 2016 PKN ORLEN issued short term bondsto its subsidiary Ship-Service SA (Ship-Service)
May 24 2016 PKN ORLEN SA PKN ORLENs subsidiary - ORLEN Upstream - has purchased bonds issued by PKN ORLEN
PAP Market InsiderWarszawa May 24 2016 (ESPI) - Current report No 1282016 Regulatory announcement no 1282016 dated 24 May 2016Polski KoncernNaf towy ORLEN SA
May 24 2016 PKN ORLEN SA Transact ions in PKN ORLEN f inancial instruments PAP Market Insider
concluded by the person in a close relationship with the President of the PKN ORLEN Management Board Warszawa
May 24 2016 PGNiG Granted Concession on Norwegian Shelf PNB - Economic Review
Piotr Wozniak president of PGNiG announced that the f irms subsidiary PGNiG Upstream International had acquired a stake in anexploratory concession located in Norway on the Barents Sea shelf
May 23 2016 PKN ORLEN SA Transact ions in PKN ORLEN f inancial instruments PAP Market Insider
concluded by the person in a close relationship with the President of the PKN ORLEN Management Board Warszawa
May 23 2016 INBRIEF PNB - Polish News Bullet in
According to Monetary Policy Council (RPP) member Eugeniusz Gatnar the data published in April signals that the economy is developing healso assesses the current level of interest rates as optimal
May 20 2016 Top news from Polish polit ics economy business amp f inancial markets - 1930 PAP Market Insider
Warszawa May 20 2016 (PAP) - Following is a digest of the days top news as compiled by PAP Market Insider BUSINESS amp EQUITY
EMIS Business Report Generated on 2016-06-02
Copyright copy 2015 EMIS all rights reserved A Euromoney Institutional Investor company Page 24 of 48
MARKET NEWS INSURANCE PZU - Listed insurer PZU will recommend shareholders take PLN 208 per share in dividends f rom 2015 prof itsin a total payout of PLN 1796 bln management said in a market f iling
May 20 2016 Top news from Polish polit ics economy business amp f inancial markets - 1630 PAP Market Insider
Warszawa May 20 2016 (PAP) - Following is a digest of the days top news as compiled by PAP Market Insider
May 20 2016 PKN ORLEN SA Transact ions in PKN ORLEN f inancial instruments PAP Market Insider
concluded by the person in a close relationship with the President of the PKN ORLEN Management Board Warszawa
May 20 2016 Thousands of Polish companies operat ing in Germany BBJ - Regional Today
Over 1700 commercial companies with Polish capital operate in Germany according to a new report by the German Chamber of Industry andCommerce (AHK) cited by the Deutsche Welle Polish businessmen perceive Germany as an attractive country in terms of investmentopportunit ies the chamber said
May 20 2016 Thousands of Polish companies operat ing in Germany BBJ - Regional Today
Over 1700 commercial companies with Polish capital operate in Germany according to a new report by the German Chamber of Industry andCommerce (AHK) cited by the Deutsche Welle Polish businessmen perceive Germany as an attractive country in terms of investmentopportunit ies the chamber said
May 20 2016 Treasury Expect ing State-Owned Firms to Pay Dividends PNB - Polish News Bullet in
The Treasury can count on some PLN500m to be paid in dividends by those state-owned companies which have already issuedrecommendations f or shareholders concerning the matter Jastrzebska Spolka Weglowa Lotos and PKP Cargo recommend not to pay adividend due to losses suf f ered in 2015
May 18 2016 Top news from Polish polit ics economy business amp f inancial markets - 1930 PAP Market Insider
Warszawa May 18 2016 (PAP) - Following is a digest of the days top news as compiled by PAP Market Insider
May 18 2016 Update Shareholder seeks PLN 35 DPS from PKN Orlen PAP Market Insider
Warsaw May 18 2016 (PAP) - Listed f uel f irm PKN Orlen saw its shareholder NN OFE seek a PLN 35 DPS f rom 2015 prof it and retainedprof its PKN said in a market f iling The pension f und wants the company to pay PLN 1048 bln f rom 2015 prof its and PLN 4495 mln f romretained prof its giving a total of PLN 1497 bln
May 18 2016 POLSKI KONCERN NAFTOWY ORLEN SA Nat ionale-Nederlanden OFE not if ied PAP Market Insider
draf t resolution of the OGM of PKN ORLEN regarding allocation of the prof it f or the f inancial year 2015 Warszawa May 18 2016 (ESPI) -Current report No 1232016 Polski Koncern Naf towy ORLEN Spolka Akcyjna (PKN ORLEN) hereby inf orms that Nationale-NederlandenOtwarty Fundusz Emerytalny (Nationale-Nederlanden OFE) pursuant to Art
May 18 2016 Shareholder seeks PLN 35 DPS from PKN Orlen PAP Market Insider
Warsaw May 18 2016 (PAP) - Listed f uel f irm PKN Orlen saw its shareholder NN OFE seek a PLN 35 DPS f rom 2015 prof it and retainedprof its PKN said in a market f iling The pension f und wants the company to pay PLN 1048 bln f rom 2015 prof its and PLN 4495 mln f romretained prof its giving a total of PLN 1497 bln
May 18 2016 Poland Press - Top Business Headlines PAP Market Insider
Warszawa May 18 2016 (PAP) - Following is a summary of the leading stories in the Polish press covering stocks and corporate news
May 18 2016 Poland Press - Top Business Headlines PAP Market Insider
Warszawa May 18 2016 (PAP) - Following is a summary of the leading stories in the Polish press covering stocks and corporate news
May 17 2016 Top news from Polish polit ics economy business amp f inancial markets - 1930 PAP Market Insider
Warszawa May 17 2016 (PAP) - Following is a digest of the days top news as compiled by PAP Market Insider
May 16 2016 Top news from Polish polit ics economy business amp f inancial markets - 2100 PAP Market Insider
Warszawa May 16 2016 (PAP) - Following is a digest of the days top news as compiled by PAP Market Insider
May 16 2016 PKN Orlen fuels plans eurobond issue by Orlen Capital unit by end-2016 PAP Market Insider
Warsaw May 16 2016 (PAP) - Listed f uel group PKN Orlen has secured its supervisory boards approval f or a eurobonds issue within theOrlen capital group the f im said in a market f iling
May 16 2016 POLSKI KONCERN NAFTOWY ORLEN SA PKN ORLEN Supervisory Board consent to Eurobonds issue
within the ORLEN Capital Group PAP Market Insider
EMIS Business Report Generated on 2016-06-02
Copyright copy 2015 EMIS all rights reserved A Euromoney Institutional Investor company Page 25 of 48
more raquo
Warszawa May 16 2016 (ESPI) - Current report No 1192016 Polski Koncern Naf towy ORLEN Spolka Akcyjna (PKN ORLEN) hereby inf ormsthat on 16 May 2016 the PKN ORLEN Supervisory Board gave consent to start the process leading to issue of Eurobonds within ORLENCapital Group
May 16 2016 StockWatch Grupa Azoty chemicals on dividend dates Comarch IT on prof it retent ion PAP Market Insider
Warszawa May 16 2016 (PAP) - Warsaw stocks are enjoying a rebound on Monday with the large-cap index WIG20 closing up by 21 Not asinlge blue-chip suf f ered any declines with the advancers led by copper group KGHM up 51 bank PKO BP up 33 and insurer PZU up29
May 16 2016 POLSKI KONCERN NAFTOWY ORLEN SA ORLEN Paliwa - has purchased bonds issued by PKN ORLEN
PAP Market InsiderWarszawa May 16 2016 (ESPI) - Current report No 1182016 Polski Koncern Naf towy ORLEN Spolka Akcyjna (PKN ORLEN) herebyannounces that in order to optimise the management of f inancial liquidity within the ORLEN Capital Group on 16 May 2016 PKN ORLENissued short term bonds to its subsidiary ORLEN Paliwa Sp z oo (ORLEN Paliwa)
May 16 2016 POLSKI KONCERN NAFTOWY ORLEN SA Anwil - has purchased bonds issued PAP Market Insider
by PKN ORLEN Regulatory announcement no 1172016 dated 16 May 2016 Warszawa May 16 2016 (ESPI) - Current report No 1172016Polski Koncern Naf towy ORLEN SA
May 16 2016 POLSKI KONCERN NAFTOWY ORLEN SA Transact ions in PKN ORLEN f inancial PAP Market Insider
instruments concluded by the person in a close relationship with the President of the PKN ORLEN Management Board Warszawa
May 13 2016 EMIS Energy Weekly Newslet ter Issue 87 EMIS Energy - Newslet ter
News amp Reports - Reports
July 28 2015 Erste Bank - Company Reports Updates PKN Orlen Erste Bank - Company Reports
May 18 2015 Erste Bank - Company Reports Updates PKN Orlen Erste Bank - Company Reports
September 13 2012 PKN Orlen mBank Analyt ical Report
April 17 2012 PKN Orlen Erste Bank - Company Analyses
November 17 2011 PKN_Orlen mBank Analyt ical Report
August 22 2011 PKN_Orlen mBank Analyt ical Report
June 17 2011 Company Report - CEE Oil amp Gas Erste Bank - Company Analyses
March 16 2011 PKN_Orlen mBank Analyt ical Report
December 03 2010 PKN_Orlen mBank Analyt ical Report
November 02 2010 PKN Orlen - 02112010 mBank Analyt ical Report
November 18 2009 Analyt ical Report - PKN Orlen - 18112009 mBank Analyt ical Report
September 16 2009 Analyt ical Report - PKN Orlen - 16092009 mBank Analyt ical Report
June 02 2009 Analyt ical Report - PKN Orlen - 02062009 mBank Analyt ical Report
February 27 2009 Analyt ical Report - PKN Orlen - 27022009 mBank Analyt ical Report
November 20 2008 Analyt ical Report - PKN Orlen - 20112008 mBank Analyt ical Report
September 17 2008 Analyt ical Report - PKN Orlen - 17092008 mBank Analyt ical Report
EMIS Business Report Generated on 2016-06-02
Copyright copy 2015 EMIS all rights reserved A Euromoney Institutional Investor company Page 26 of 48
more raquo
August 14 2008 Analyt ical Report - PKN Orlen - 14082008 mBank Analyt ical Report
June 04 2008 Analyt ical Report - PKN Orlen - 30052008 mBank Analyt ical Report
March 10 2008 Analyt ical Report - PKN Orlen - 10032008 mBank Analyt ical Report
February 21 2008 Analyt ical Report - PKN Orlen - 14022008 mBank Analyt ical Report
December 13 2007 Analyt ical Report - PKN Orlen - 04122007 mBank Analyt ical Report
August 21 2007 Analyt ical Report - PKN Orlen - 160807 mBank Analyt ical Report
July 02 2007 Analyt ical Report - PKN Orlen mBank Analyt ical Report
March 05 2007 Analyt ical Report - PKN Orlen mBank Analyt ical Report
August 24 2006 Analyt ical Report - PKN Orlen mBank Analyt ical Report
EMIS Business Report Generated on 2016-06-02
Copyright copy 2015 EMIS all rights reserved A Euromoney Institutional Investor company Page 27 of 48
MampA and ECM Deals - EMIS DealWatch Deals
DAT ECOUNT RY
OFT ARGET
T ARGET COMPANYDEALT YPE
BUYER SELLER DEAL INDUST RIESDEAL
VALUEUSD (MN)
ST AKE
20-Jan-16CzechRepublic
68 petrol stations of OMV Acquisition PKN Orlen SA OMV AG Gasoline Stations NA 100
16-Nov-15 Poland Assets of Euronaft Trzebinia Acquisition PKP Cargo SA PKN Orlen SASupport Activities forTransportation RailTransportation
1502 100
16-Nov-15 Poland Orlen Transport SA Acquisition Trans Polonia SA PKN Orlen SA Truck Transportation 2137 100
21-Oct-15 Germany13 SUN petrol stations ofGermania Petrol
Acquisition PKN Orlen SAGermaniaPetrol GmbH
Gasoline Stations NA 100
13-Oct-15 Canada Kicking Horse Energy Inc Acquisition PKN Orlen SA NA Oil and Gas Extraction 22634 100
13-Oct-15UnitedStates
FX Energy Inc Acquisition PKN Orlen SA NAOil and Gas ExtractionAgriculture Forestry Fishingand Hunting
8310 100
24-Sep-15 PolandTwo concessions in theregions of Lesser Polandand Subcarpathia
Acquisition PKN Orlen SADEADeutscheErdoel AG
Oil and Gas Extraction NA 100
20-Aug-15CzechRepublicPoland
Orlen KolTrans Sp z oo Acquisition PKP Cargo SA PKN Orlen SA Rail Transportation 4860 9985
20-Jul-15 Poland Bieszczady ProjectJointventure
PKN Orlen SA PolskieGornictwo Naftowe iGazownictwo SA
NA Oil and Gas Extraction NA 100
03-Jul-14CzechRepublic
Ceska Rafinerska ASMinoritystakepurchase
PKN Orlen SA Eni SpA Petroleum Refineries 4100 32445
14-May-14 Poland Orlen Medica Acquisition PZU TFI SA PKN Orlen SAHealth Care and SocialAssistance
1380 100
14-May-14 Poland Prof Med Sp z oo Acquisition PZU SA PKN Orlen SAHealth Care and SocialAssistance
119 9645
08-May-14 CanadaBirchill Exploration LimitedPartnership
Acquisition PKN Orlen SA
Bregal -BirchillInvestmentsSarl
Oil and Gas Extraction 23366 100
07-Nov-13CzechRepublic
Ceska Rafinerska ASMinoritystakepurchase
PKN Orlen SARoyal DutchShell Plc
Petroleum Refineries 2720 1633
16-Sep-13 Canada TriOil Resources Ltd Acquisition PKN Orlen SA NA Crude Petroleum Extraction 17753 100
07-Dec-12 Poland Shale gas licenses Acquisition PKN Orlen SAExxonMobilPoland
Natural Gas Extraction NA 100
02-Nov-12 Poland Anwil SAMinoritystakepurchase
PKN Orlen SA NAPesticide Fertilizer andOther Agricultural ChemicalManufacturing
2364 473
20-Aug-12 Poland Petrolot Acquisition PKN Orlen SAPolskie LinieLotnicze LOTSA
Petroleum and PetroleumProducts MerchantWholesalers
9241 49
01-Jun-12 Poland Gas bottle assets Acquisition Gaspol SA PKN Orlen SA Nonstore Retailers NA 100
01-Aug-11 Poland Anwil SAMinoritystakepurchase
PKN Orlen SA Energa SAPesticide Fertilizer andOther Agricultural ChemicalManufacturing
2158 415
MampA and ECM Deals - EMIS DealWatch Intents
EMIS Business Report Generated on 2016-06-02
Copyright copy 2015 EMIS all rights reserved A Euromoney Institutional Investor company Page 28 of 48
DEALSIDE
INT ENTANNOUNCEMENT
T ARGETT ARGET
COUNT RYT ARGET INDUST RY
DEALT YPE
INVEST OR
Sell-side
13-Nov-15Orlen TransportSA
Poland Truck Transportation Acquisition Trans Polonia SA
Sell-side
23-Jul-15Czech railtransport unit ofPKN Orlen
CzechRepublic
Rail Transportation Acquisition NA
Buy-side
06-May-15 Fuel stationsAustriaGermanySwitzerland
Gasoline Stations Acquisition PKN Orlen SA
Sell-side
20-Oct-14Orlen KolTransSp z oo
Poland Rail Transportation Acquisition PKP Cargo SA
Buy-side
10-Jun-14Kicking HorseEnergy Inc
Canada Oil and Gas Extraction Acquisition PKN Orlen SA
Sell-side
29-May-14 ORLEN Lietuva Lithuania Petroleum Refineries Acquisition NA
Buy-side
05-Sep-13
BirchillExplorationLimitedPartnership
Canada Oil and Gas Extraction Acquisition PKN Orlen SA
Sell-side
23-Aug-13Medical centresin Plock andWloclawek
Poland Hospitals amp Health Care Acquisition NA
Buy-side
27-Jun-13 Fuel stationsCzechRepublicGermany
Gasoline Stations Acquisition PKN Orlen SA
Sell-side
25-Jul-12 Neste Polska Poland Other Gasoline Stations Acquisition Lotos SA PKN Orlen SA
Sell-side
01-Mar-12
OsrodekBadawczo-RozwojowyPrzemysluRafineryjnegoSA
PolandPetrochemical ManufacturingPetroleum Refineries
Privatization PKN Orlen SA Warter
Sell-side
20-Dec-11 Lotos SA Poland
Other Gasoline StationsGasoline Stations withConvenience Stores PetroleumRefineries Crude PetroleumExtraction
Privatizationthroughstockexchange
PKN Orlen SA Polskie Gornictwo Naftowe iGazownictwo SA
Buy-side
20-Jun-11Fuel stations inGermany
GermanyOther Gasoline StationsGasoline Stations withConvenience Stores
Acquisition PKN Orlen SA
Sell-side
02-May-11
Anwils fertilizerassets AnwilsPVC productionassets
PolandPoland
Plastics and Rubber ProductsManufacturing PesticideFertilizer and Other AgriculturalChemical Manufacturing
Acquisition ZA Pulawy
Sell-side
14-Mar-11Rafineria NaftyJedlicze
Poland Petroleum Refineries Privatization PKN Orlen SA
Sell-side
30-Nov-10 CeproCzechRepublic
Gasoline Stations BasicChemical ManufacturingPetroleum and Coal ProductsManufacturing
MergerEni SpA PKN Orlen SA Royal Dutch Shell PlcSlovnaft
Sell-side
02-Nov-10 Lotos SA PolandPetroleum and Coal ProductsManufacturing Oil and GasExtraction
Minoritystakepurchase
ExxonMobil Corp Gazprom Neft KulczykInvestments SA Magyar Olaj- Es Gazipari Nyrt(MOL) Mercuria Energy Group Ltd PKN Orlen SAPolskie Gornictwo Naftowe i Gazownictwo SA TNK-BP
Buy-side
16-Sep-10Gasolinestations
CzechRepublic
Gasoline Stations Acquisition PKN Orlen SA Unipetrol
EMIS Business Report Generated on 2016-06-02
Copyright copy 2015 EMIS all rights reserved A Euromoney Institutional Investor company Page 29 of 48
Buy-side
16-Sep-10Petrochemicalrefinery
CzechRepublic
Petroleum Refineries
AcquisitionMinoritystakepurchase
PKN Orlen SA
Sell-side
21-Jul-10Polkomtel Sp zoo
PolandWireless TelecommunicationsCarriers (except Satellite)
Acquisition Zygmunt Solorz-Zak - private investor
EMIS Business Report Generated on 2016-06-02
Copyright copy 2015 EMIS all rights reserved A Euromoney Institutional Investor company Page 30 of 48
Fiscal year 2014Companies in Industries 43
IndustryPetroleum Refineries
This company is scored higher thanonly 5266 of companies in theindustry which equates to B - BelowAverage Risk on the Financial Scale Expected
Participation inCustomers Credit
Fiscal year 2014Companies in Industries 43
IndustryPetroleum Refineries
Criteria Weight Score Final Score
I EMIS Benchmark Score 90 207 B Below Average Risk
SIZ E RANKING SCORE
Sales 1 10000
Assets 1 10000
Profit 41 698
Total Shareholders Equity 1 10000
Average Size 11 7675
GROWT H RANKING SCORE
Net Sales Growth Rate 11 7674
Inc Dec in Assets 20 5581
Inc Decin Net Income 24 4651
Increase (Decrease) in Equity 22 5116
Average Growt h 19 5756
PROFIT ABILIT Y RANKING SCORE
Net Income Net Sales 29 3488
Return On Assets 38 1395
Net Income Net Worth 39 1163
Average Prof it abilit y 35 2015
INDEBT EDNESS RANKING SCORE
Indebtedness 22 5116
Leverage 33 2558
Total Liabilities Sales 17 6279
Average Indebt edness 24 4651
II EMIS Trend Score 10 298 E Very High Risk
Scoring Range 1 - Improves 2 - Maintains (According to the tolerance margin) 3 - Deteriorate
EMIS Credit Analytics - Summary
EMIS Financial ScoreEMIS Financial Score was not affected by Conditions
EMIS Benchmark Score
B Below Average Risk
5266
EMIS Trend Score
E Very High Risk
PampL E
Balance Sheet C
Cash Flow E
EMIS Credit Quota
21112537Thousands (USD)
Average Ranking 21 in 43 companies
RELAT IVEST RENGT HS
RELAT IVEWEAKNESSES
Sales Net Income Sales
Sales Growth
Remarks
EMIS Trend Score is calculated based on the 2latest annual company financial statements
Remarks
Credit Quota Recommended was calculatedbased on the industry average customer type(customized) and Financial Score
EMIS Credit Analyt ics - EMIS Financial Score
EMIS Financial ScoreEMIS Financial Score was not affected by Conditions
EMIS Benchmark Score 5266
11
EMIS Business Report Generated on 2016-06-02
Copyright copy 2015 EMIS all rights reserved A Euromoney Institutional Investor company Page 31 of 48
100
PampL 2014 T OT AL
Sales Growth 3 3
Operating Profit Sales 3 3
Net Income Sales 3 3
T ot al PampL 300 300
BALANCE 2014 T OT AL
Days Receivables 2 2
Days Inventory 1 1
Current Ratio 3 3
Indebtness (Total AssetsTotal Liabilities) 3 3
Total Liabilities Sales 3 3
T ot al Balance 230 230
CASH FLOW 2014 T OT AL
Cash from Sales 3 3
Cash for Production 2 2
Cash for Operation 1 1
Net Operation Cash Generation (NOCG) 3 3
Free Cash Flow 3 3
Cash Flow After Financial Expenses 3 3
Cash Flow After Financial 3 3
Reduction in Debt 2 2
T ot al Cash Flow 267 267
III EMIS Financial Score 100 216 CC Above Average Risk
E D C CC B BB A AA
Business Scale
AA - Very Low RiskA - Low RiskBB - Moderate Low RiskB - Below Average RiskCC - Above Average RiskC - Moderate High RiskD - High RiskE - Very High Risk
E Very High Risk
C Moderate High Risk
E Very High Risk
EMIS Credit Analyt ics - EMIS Benchmark Score
EMIS Business Report Generated on 2016-06-02
Copyright copy 2015 EMIS all rights reserved A Euromoney Institutional Investor company Page 32 of 48
Fiscal year 2014Companies in Industries 43
IndustryPetroleum Refineries
SIZ E RANKING SCORE
Sales 1 10000
Assets 1 10000
Profit 41 698
Total Shareholders Equity 1 10000
Average Size 11 7675
GROWT H RANKING SCORE
Net Sales Growth Rate 11 7674
Inc Dec in Assets 20 5581
Inc Decin Net Income 24 4651
Increase (Decrease) in Equity 22 5116
Average Growt h 19 5756
PROFIT ABILIT Y RANKING SCORE
Net Income Net Sales 29 3488
Return On Assets 38 1395
Net Income Net Worth 39 1163
Average Prof it abilit y 35 2015
INDEBT EDNESS RANKING SCORE
Indebtedness 22 5116
Leverage 33 2558
Total Liabilities Sales 17 6279
Average Indebt edness 24 4651
Average Ranking 21
Fiscal year 2014Companies in Industries 43
IndustryPetroleum Refineries
EMIS Credit Quota(Score adjusted)
21112537Thousands (USD)
Participation in credit Financial Score
CC
EMIS Benchmark Score(Against Industry)
5266
EMIS Credit Analyt ics - EMIS Credit Quota
Key parameters af f ecting quota value
COMPANY INDICAT ORS VALUE INDUST RY MULT IPLIERS MAX CALCULAT ED CREDIT
Assets 1332259352 Suppliers Assets 2801 373173079
Net Worth 581261405 Suppliers Net worth 6383 371042677
Tangible Net Worth 604356752 Suppliers Tangible Net Worth 6383 385785372
Net Sales 3067917427 Suppliers Net Sales 1352 414818151
11
EMIS Business Report Generated on 2016-06-02
Copyright copy 2015 EMIS all rights reserved A Euromoney Institutional Investor company Page 33 of 48
Source EMIS Company Database
AVERAGE CREDIT
(BASED ON INDUSTRY)
319886918THOUSANDS (USD)
XEXPECT ED PART ICIPAT ION
(IN CUSTOMERS CREDIT)
11
FINANCIAL SCORE
CC
=
=
CALCULAT ED CREDIT
(AVERAGE X PARTICIPATION)
35187561THOUSANDS (USD)
X
QUOT A ADJUST MENT S
06
=CREDIT QUOT A
(ADJUSTED BY SCORE)
21112537THOUSANDS (USD)
Fiscal year 2014Companies in Industries 43
IndustryPetroleum Refineries
NIP 7740001454 Headquart ers T el +48 (24) 3650000
Cost of Goods Sold 3048984945 Suppliers Cost of Goods Sold 1363 415427048
Operating Profit -134323677 Suppliers Operating Profit -30832 000
Net Profit -165687728 Suppliers Net Profit -26041 000
SUPPLIERS 378193431 Net Sales 3067917427 Financial Liabilities Net Sales 002 715239
Assets 1332259352 Financial Liablities Assets 005 643434
FINANCIAL LIABILIT IES 000 Operating Cycle 1617 Operating Cycle 592663 501950211
Suppliers Turnover 1273 Suppliers Turnover 490503 415427048
AVERAGE CREDIT BASED ON INDUST RY 1121907398
Credit Quota Calculation
Score Multipliers
QUOT A ADJUST MENT S ACCORDING T O T HE FINAL SCORE FINANCIAL SCALE MULT IPLIERS
Expanded QuotaAA 2
A 15
Normal Quota BB 1
Reduced Quota
B 08
CC 06
C 04
No QuotaD 02
E 0
EMIS Credit Analyt ics - Conclusions
EMIS Business Report Generated on 2016-06-02
Copyright copy 2015 EMIS all rights reserved A Euromoney Institutional Investor company Page 34 of 48
Ul Chemikoacutew 7
09-411
Fax +48 (24) 3654040
Email zarzadorlenpl
RELAT IVE ST RENGT HS RANKING SCORE
Sales 1 100
Sales Growth 11 7674
EMIS Credit Quota(Score adjusted)
21112537Thousands (USD)
Participation in credit Financial Score
CC
Date 2016 June 2
Fiscal year 2014Companies in Industries 43
IndustryPetroleum Refineries
Polski Koncern Naftowy ORLEN SAEMIS Credit Analytics
EMIS Benchmark Score (Business Performance Score) is based on financial statements as of 2014 EMIS Benchmark Score of Polski Koncern Naf t owy ORLEN SA is
the result of comparing its financial results with that of 43 companies classified by EMIS Credit Analytics within Pet roleum Ref ineries industry
EMIS Benchmark Score(Against Industry)
5266Note Companies classified in Pet roleum Ref ineries are not necessarily direct competitors Please refer to Benchmark Ranking for complete details of the companies
classified within this industry
EMIS Benchmark Score is the result of the companys ranking within its industry in different financial ratios of Size Profitability Growth Indebtness Efficiency and Liquidity
Ratios In the result it is important to note
EMIS Benchmark Score contributes 90 to the Financial Score The other 10 is represented by evolution versus previous period of Profit amp Loss Balance Sheet and
Cash Flow Statement
EMIS T REND SCORE
Profit amp Loss E
Balance Sheet C
Cash Flow Statement E
EMIS Financial ScoreEMIS Financial Score was not affected by Conditions
Note The Financial Score is not deteriorated by Financial Conditions (see Parameters)
Based on the average credit quote of 11219074 in the Pet roleum Ref ineries industry an EMIS Financial Score of CC and an expected participation in the companyscredit of 11 the recommended credit quota is 740459Note The Financial Score is not deteriorated by Financial Conditions Based on the average credit quote of 11219074 in the Petroleum Refineries industry an EMISFinancial Score of CC and an expectedparticipation in the companys credit of 11 the recommended credit quota is 740459
Key parameters af f ecting quota value
EMIS Credit Analyt ics - Company vs Industry Key Stats
Company vs Industry - Key Stats
REPORTING DETAILS
11
EMIS Business Report Generated on 2016-06-02
Copyright copy 2015 EMIS all rights reserved A Euromoney Institutional Investor company Page 35 of 48
2014 2013 2012
Statement type Individual Individual Individual
Audited Non-Audited Non-Audited Non-Audited
Provider NotoriaMonitor B Fins NotoriaMonitor B Fins NotoriaMonitor B Fins
Companies in Industry 43 54 52
EMIS Benchmark Score 5266 6892 7170
Reporting Standard 197 197 197
Displaying units USD Thousands USD Thousands USD Thousands
SIZ E
2014 2014 2013 2012
AVERAGEINDUST RY
VALUE RANKING VALUE RANKING VALUE RANKING
Sales 915054 30679174 1 37904382 1 38981804 1
Assets 441712 13322594 1 17049137 1 16979933 1
Profit -47512 -1656877 41 58433 1 756549 1
Total Shareholders Equity 193824 5812614 1 9147078 1 9132469 1
Average Size Posit ion 11 1 1
GROWT H
2014 2014 2013 2012
AVERAGEINDUST RY
VALUE RANKING VALUE RANKING VALUE RANKING
Net Sales Growth Rate 2089 -575 11 -551 16 1190 12
Inc Dec In Assets 1610 -901 20 -243 22 -1039 30
Inc DecIn Net Income -406205 -340170 24 -9249 28 -078 17
Increase (Decrease) In Equity -0 77 -2601 22 -267 21 563 13
Average Growt h Posit ion 19 22 18
PROFIT ABILIT Y
2014 2014 2013 2012
AVERAGEINDUST RY
VALUE RANKING VALUE RANKING VALUE RANKING
Net Income Net Sales -519 -540 29 015 25 194 17
Return On Assets -1076 -1244 38 034 23 446 16
Net Income Net Worth -2451 -2850 39 064 36 828 28
Operational Profit Sales -439 -438 27 027 25 168 18
Average Prof it abilit y Posit ion 33 27 20
INDEBT EDNESS
2014 2014 2013 2012
AVERAGEINDUST RY
VALUE RANKING VALUE RANKING VALUE RANKING
Indebtedness 5612 5637 22 4635 21 4622 22
Leverage 12789 12920 33 8639 36 8593 40
Total Liabilities Sales 2709 2448 17 2085 17 2013 21
EMIS Business Report Generated on 2016-06-02
Copyright copy 2015 EMIS all rights reserved A Euromoney Institutional Investor company Page 36 of 48
Fiscal year 2014Companies in Industries 43
IndustryPetroleum Refineries
Current Liabilities Total Liabilities 6146 6279 7 7210 11 6768 11
Average Indebt edness Posit ion 20 21 24
EFFICIENCY
2014 2014 2013 2012
AVERAGEINDUST RY
VALUE RANKING VALUE RANKING VALUE RANKING
Days Receivables 23 24 8 24 10 24 6
Days Inventory 36 33 16 46 19 48 23
Suppliers Turnover 49 45 10 50 15 45 15
Operational Cycle 59 57 11 70 13 72 14
Average Ef f iciency Posit ion 11 14 15
LIQUIDIT Y
2014 2014 2013 2012
AVERAGEINDUST RY
VALUE RANKING VALUE RANKING VALUE RANKING
Current Ratio 128 132 19 142 21 157 22
Quick Ratio 132 132 19 142 21 157 22
Working Capital 42581 1486941 1 2418659 1 3019099 1
Average Liquidit y Posit ion 13 14 15
OT HERS
2014 2014 2013 2012
AVERAGEINDUST RY
VALUE RANKING VALUE RANKING VALUE RANKING
Gross Profit 0 76 062 31 491 34 614 33
Other Income -1926 -1852 32 64868 3 5153 6
Reduction In Debt 158 0 13 0 17 0 12
Average Ot hers Posit ion 25 18 17
EMIS Credit Analyt ics - Company vs Industry Balance Sheet
Company vs Industry - Balance Sheet
REPORTING DETAILS
2014 2013 2012
Statement type Individual Individual Individual
Audited Non-Audited Non-Audited Non-Audited
Provider NotoriaMonitor B Fins NotoriaMonitor B Fins NotoriaMonitor B Fins
Companies in Industry 43 54 52
EMIS Benchmark Score 5266 6892 7170
Reporting Standard 197 197 197
EMIS Business Report Generated on 2016-06-02
Copyright copy 2015 EMIS all rights reserved A Euromoney Institutional Investor company Page 37 of 48
CURRENT ASSET S 2014INDUST RY
2014COMPANY
2013INDUST RY
2013COMPANY
2012INDUST RY
2012COMPANY
V H V H V H V H V H V H
Cash And Banks 1003 11838 1034 6846 533 410 559 851 482 -4599 502 -5387
Short Term Investments 003 -404 000 NA 004 -7992 000 NA 018 457613 000 NA
Account Receivables (Trade) 1320 1670 1510 -915 1313 -821 1513 -380 1346 -1338 1534 005
Inventory 2075 -1109 2104 -2851 2710 -1100 2677 -841 2866 -1097 2852 -789
Deferred Assets 014 -1494 007 -4068 020 -2569 011 -3444 025 -385 017 16719
Current Assets 4413 1190 4656 -1101 4579 -900 4760 -533 4737 -1703 4906 -1431
FIXED ASSET
2014INDUST RY
2014COMPANY
2013INDUST RY
2013COMPANY
2012INDUST RY
2012COMPANY
V H V H V H V H V H V H
- Land And Properties 4838 1574 4846 -907 4853 -232 4850 065 4677 -1788 4701 -690
- Other Equipments 004 -262 000 NA 004 6983 000 NA 002 -1186 000 NA
Fixed Assets 4872 1626 4846 -907 4865 -275 4850 065 4710 -1737 4701 -690
Intangible Assets (Net) 202 823 150 -1458 217 -2685 160 -4312 279 -652 275 199
Investments 240 4117 265 2041 197 13125 200 21858 080 2964 061 5970
Deferred Assets 281 11870 082 15497 149 -2699 029 -4916 193 5695 056 -2566
Total Long Term Assets 5585 1962 5344 -720 5421 -302 5240 036 5263 -1044 5094 -625
T OT AL ASSET S
2014INDUST RY
2014COMPANY
2013INDUST RY
2013COMPANY
2012INDUST RY
2012COMPANY
V H V H V H V H V H V H
Total Assets 10000 1610 10000 -901 10000 -585 10000 -243 10000 -1368 10000 -1039
CURRENT LIABILIT Y
2014INDUST RY
2014COMPANY
2013INDUST RY
2013COMPANY
2012INDUST RY
2012COMPANY
V H V H V H V H V H V H
Suppliers 2801 1472 2839 -1163 2835 -082 2923 603 2691 -3100 2690 -2855
Other Short Term Liabilities 13741 2571 701 5233 12691 320 419 -676 11578 NA 438 NA
Total Current Liability 3449 2100 3540 -362 3309 -111 3342 424 3151 -1924 3128 -1691
LONG T ERM LIABILIT Y
2014INDUST RY
2014COMPANY
2013INDUST RY
2013COMPANY
2012INDUST RY
2012COMPANY
V H V H V H V H V H V H
Long Term Deferred Liabilities 839 -299 028 -299 1004 -2717 026 -2717 1298 NA 035 NA
Other Long Term Liabilities 2187 6238 2070 4861 1564 -1129 1267 -1525 1659 -3979 1459 -3665
Long Term Liabilities 2163 6134 2097 4757 1556 -1368 1293 -1553 1698 -3494 1494 -3513
T OT AL LIABILIT Y
2014INDUST RY
2014COMPANY
2013INDUST RY
2013COMPANY
2012INDUST RY
2012COMPANY
V H V H V H V H V H V H
Total Liabilities 5612 3390 5637 1066 4866 -551 4635 -215 4848 -2553 4622 -2383
EQUIT Y
2014INDUST RY
2014COMPANY
2013INDUST RY
2013COMPANY
2012INDUST RY
2012COMPANY
V H V H V H V H V H V H
EMIS Business Report Generated on 2016-06-02
Copyright copy 2015 EMIS all rights reserved A Euromoney Institutional Investor company Page 38 of 48
Fiscal year 2014Companies in Industries 43
IndustryPetroleum Refineries
Capital 212 3149 226 000 187 -325 206 000 182 -237 201 003
Other Reserves 11156 3618 263 000 9512 000 239 000 8955 -143 233 -2444
Equity Appreciation -178 -439428 -173 -142830 005 5496 -010 -47857 003 4198565 003 NA
Retained Earnings 3652 -439 3702 -2707 4435 -418 4618 -192 4357 -050 4594 1065
Minority Interest 5213 074 346 075 6008 -1233 312 -1231 6451 -1929 347 -1929
Total Net Worth 4388 -077 4363 -2601 5134 -618 5365 -267 5152 153 5378 563
T OT AL LIABILIT Y AND EQUIT Y
2014INDUST RY
2014COMPANY
2013INDUST RY
2013COMPANY
2012INDUST RY
2012COMPANY
V H V H V H V H V H V H
Total Liabilities And Net Worth 10000 1610 10000 -901 10000 -585 10000 -243 10000 -1368 10000 -1039
EMIS Credit Analyt ics - Company vs Industry Income Statement
Company vs Industry - Income Statement
REPORTING DETAILS
2014 2013 2012
Statement type Individual Individual Individual
Audited Non-Audited Non-Audited Non-Audited
Provider NotoriaMonitor B Fins NotoriaMonitor B Fins NotoriaMonitor B Fins
Companies in Industry 43 54 52
EMIS Benchmark Score 5266 6892 7170
Reporting Standard 197 197 197
OPERAT ING PROFIT
2014INDUST RY
2014COMPANY
2013INDUST RY
2013COMPANY
2012INDUST RY
2012COMPANY
V H V H V H V H V H V H
Sales 10000 2089 10000 -575 10000 -1145 10000 -551 10000 500 10000 1190
Cost Of Goods Sold 9924 2648 9938 -150 9485 -1062 9509 -427 9396 612 9386 1253
Gross Profit 0 76 -8210 062 -8814 515 -2441 491 -2451 604 -978 614 313
Administrative AndGeneral Expenses
149 3309 141 420 135 -905 127 -479 132 -638 126 379
Selling Expenses 2650 5320 364 095 2091 094 340 028 1835 1798 320 578
Operational Profit -439 -165868 -438 -163453 034 -8046 027 -8483 154 -2807 168 -206
NON OPERAT ING INCOME
2014INDUST RY
2014COMPANY
2013INDUST RY
2013COMPANY
2012INDUST RY
2012COMPANY
V H V H V H V H V H V H
Total Non-Operating Revenue 036 465 033 -2304 042 -6818 040 -6944 117 -4630 125 -4930
- Financial Revenue 036 465 033 -2304 042 -6818 040 -6944 117 -4630 125 -4930
Total Non-Operating Expenses 190 24437 176 20967 067 -2118 053 -3252 075 -6320 075 -5970
- Financial Expenses 190 24438 176 20967 067 -2119 053 -3252 075 -6320 075 -5970
Other Extraordinary Result 0 00 10000 000 NA -000 9992 000 NA -000 NA -000 NA
EMIS Business Report Generated on 2016-06-02
Copyright copy 2015 EMIS all rights reserved A Euromoney Institutional Investor company Page 39 of 48
Fiscal year 2014Companies in Industries 43
IndustryPetroleum Refineries
Profit Before Income Taxes -594 -909715 -580 -407834 008 -9639 014 -9402 196 -1306 217 -601
T AXES AND OT HERS
2014INDUST RY
2014COMPANY
2013INDUST RY
2013COMPANY
2012INDUST RY
2012COMPANY
V H V H V H V H V H V H
Extraordinary Income (Charges) 0 02 8819 005 4250 002 NA 004 NA 000 -10000 000 NA
Changes Due To Consolidation 027 -8018 002 -8023 162 -5086 008 -5086 292 -4973 014 -4977
Income Tax -0 74 -468549 -039 -72388 -002 7245 006 -8524 -006 -11275 038 -4155
NET PROFIT
2014INDUST RY
2014COMPANY
2013INDUST RY
2013COMPANY
2012INDUST RY
2012COMPANY
V H V H V H V H V H V H
Net Income -519 -406205 -540 -340170 016 -9342 015 -9249 213 544 194 -078
EMIS Credit Analyt ics - Company vs Industry Cash Flow
Company vs Industry - Cash Flow
REPORTING DETAILS
2014 2013 2012
Statement type Individual Individual Individual
Audited Non-Audited Non-Audited Non-Audited
Provider NotoriaMonitor B Fins NotoriaMonitor B Fins NotoriaMonitor B Fins
Companies in Industry 43 54 52
EMIS Benchmark Score 5266 6892 7170
Reporting Standard 197 197 197
CASH OPENING BALANCE
2014INDUST RY
2014COMPANY
2013INDUST RY
2013COMPANY
2012INDUST RY
2012COMPANY
V H V H V H V H V H V H
Initial Cash 222 410 267 851 257 -4599 232 -5387 422 9240 474 8565
CASH FROM SALES
2014INDUST RY
2014COMPANY
2013INDUST RY
2013COMPANY
2012INDUST RY
2012COMPANY
V H V H V H V H V H V H
Net Sales 10000 2089 10000 -575 10000 -1145 10000 -551 10000 500 10000 1190
+- Trade AccountsReceivable
-0 91 -28672 066 13160 059 -4685 027 779616 098 16969 -000 9978
Cash From Sales 9909 1908 10066 -539 10059 -1179 10027 -525 10098 763 10000 1377
CASH FOR PRODUCT ION
2014INDUST RY
2014COMPANY
2013INDUST RY
2013COMPANY
2012INDUST RY
2012COMPANY
V H V H V H V H V H V H
(-) Sales Cost -9924 -2648 -9938 150 -9485 1062 -9509 427 -9396 -612 -9386 -1253
(-) (Inc) Inventory 125 -1020 364 21062 168 -1077 111 -183 167 13866 106 12570
(+) (Inc) Suppliers 174 188875 -162 -30445 -012 9818 075 11510 -572 -26577 -468 -25767
EMIS Business Report Generated on 2016-06-02
Copyright copy 2015 EMIS all rights reserved A Euromoney Institutional Investor company Page 40 of 48
Cash For Production -9625 -2474 -9736 159 -9328 1572 -9324 962 -9801 -961 -9748 -1525
CASH FOR OPERAT ING
2014INDUST RY
2014COMPANY
2013INDUST RY
2013COMPANY
2012INDUST RY
2012COMPANY
V H V H V H V H V H V H
(-) Administrative Expenses -149 -3309 -141 -420 -135 905 -127 479 -132 638 -126 -379
+- Other Operating Results -0 00 -12524 000 NA 001 NA 000 NA 000 NA 000 NA
(-) Selling Expenses -2650 -5320 -364 -095 -2091 -094 -340 -028 -1835 -1798 -320 -578
(-) Period Income Taxes 074 468549 039 72388 002 -7245 -006 8524 006 11275 -038 4155
(+) (Inc) Taxes Payable 002 69344 000 NA -000 -14351 000 NA 001 17119 000 NA
(-) (Inc) Labor EstimatesAnd Provision
-0 12 9215 -000 9200 -189 -12719 -004 -12717 614 184104751 015 NA
Cash For Operation -2736 -3712 -466 794 -2413 -5873 -477 379 -1346 2282 -469 405
OPERAT IONAL CASHFLOW
2014INDUST RY
2014COMPANY
2013INDUST RY
2013COMPANY
2012INDUST RY
2012COMPANY
V H V H V H V H V H V H
Net Operating Cashflow -2453 -7631 -137 -15709 -1682 -4202 225 19816 -1049 1952 -217 -3750
INVEST MENT S IN ASSET S
2014INDUST RY
2014COMPANY
2013INDUST RY
2013COMPANY
2012INDUST RY
2012COMPANY
V H V H V H V H V H V H
(-) (Inc) Net Fixed Assets -329 -67408 210 151250 069 -8689 -014 -10872 468 25487 152 12255
(ndash) (Inc) Investments -0 34 2746 -020 7025 -056 -47405 -062 -48471 -009 -10215 -010 -10826
FREE CASHFLOW
2014INDUST RY
2014COMPANY
2013INDUST RY
2013COMPANY
2012INDUST RY
2012COMPANY
V H V H V H V H V H V H
Free Cashflow -2816 -10396 054 -6596 -1669 -15077 150 28813 -589 5095 -075 -33837
FINANCIAL
2014INDUST RY
2014COMPANY
2013INDUST RY
2013COMPANY
2012INDUST RY
2012COMPANY
V H V H V H V H V H V H
(-) Financial Expenses -154 -65083 -143 -92333 -025 -15241 -013 -12496 042 20392 050 -1713
Cashflow After Financial Costs -2969 -11196 -089 -16127 -1694 -17395 136 60823 -547 5391 -025 -12770
(+) (Inc) Debt Short Term -000 9949 000 NA -000 -21237 000 NA 000 10091 000 NA
(+) (Inc) Debt Long Term 002 69344 000 NA -000 -14351 000 NA 001 17119 000 NA
Cashflow After FinancialExpenses
-2968 -11175 -089 -16127 -1694 -17455 136 60823 -546 5512 -025 -12770
CASHFLOW
2014INDUST RY
2014COMPANY
2013INDUST RY
2013COMPANY
2012INDUST RY
2012COMPANY
V H V H V H V H V H V H
(-) Dividends 503 42726 -126 -4528 -186 682 -082 -1139 -176 -73580 -069 -52834
(-) Other Expenses 002 8819 005 4250 002 NA 004 NA 000 -10000 000 NA
(-) Other Current Debtors 000 NA 000 NA 000 NA 000 NA 000 NA 000 NA
(-) Other Current Assets 002 -7807 002 -2258 011 361835 003 15505 000 10702 -005 -48602
(-) Long-Term AccountsReceivable
000 NA 000 NA 000 NA 000 NA 000 NA 000 NA
EMIS Business Report Generated on 2016-06-02
Copyright copy 2015 EMIS all rights reserved A Euromoney Institutional Investor company Page 41 of 48
(-)(Inc) Deferred And OtherLong Term Assets
-0 72 -37515 -022 -26027 032 11570 013 4240 -178 -88060 008 14351
(-) (Inc) Other Long TermLiabilities
406 56718 294 37011 -105 8205 -103 7364 -518 -37893 -368 -40951
(+) Inflation Adjustmentst Non Recurring Incomes
000 NA 000 NA 000 NA 000 NA 000 NA 000 NA
(+) (Inc) Other AccountsPayable
115 218744 105 82115 -007 -10274 -014 -10676 216 2710149 191 NA
(+) Extraordinary Income Consolidation
027 -8018 002 -8023 162 -5085 008 -5057 292 -4974 014 -5006
(-) Intangible Goods -007 -12244 011 -8077 040 29906 055 230557 009 12060 -002 8712
Complementary Cash-Flow 976 240248 271 31907 -051 8725 -117 5210 -356 -14616 -230 -28078
Net Cash Generation -1992 -3796 183 77289 -1745 -7131 020 10729 -902 -10194 -255 -21675
Ending Cash -1770 -4381 449 6846 -1488 -17434 251 851 -480 -11112 219 -5387
EMIS Business Report Generated on 2016-06-02
Copyright copy 2015 EMIS all rights reserved A Euromoney Institutional Investor company Page 42 of 48
Score Scale
Financial ScaleFinancial Model has 8 risk categories
A - Very Low RiskAA - Low RiskBB - Moderate Low RiskB - Below Average RiskCC - Above Average RiskC - Moderate High RiskD - High Risk E - Very High Risk
Risk Profile
High RiskHigh Risk - used when the loan amounts are relatively high and have a longrepayment period A loss in the Credit would seriously affect the companyresults Commercial credit with maturity exceeding 36 months
A loss in the Credit would seriously affect the results Bank credited to morethan 36 months
Vertical Weighting
Pampl
Sales Growth 12
Operating Profit 12
Net Profit 12
Sub t ot al 36
Balance
Days Receivables 12
Days Inventory 10
Current Ratio 8
Indebtness 8
Indebtednesssales 8
Balance Sub T ot al 46
Cash Flow
Cash From Sales 2
Cash For Production 2
Cash For Operations 2
Operating Cash Generation 5
Free Cash Flow 3
Cash Flow After Fin Ex 2
Cash Flow After Fin Result 2
Reduction In Debt 0
Cash Flow Sub T ot al 18
Total Vertical Weights 100
Tolerance Margin 5
Financial Conditions
Condit ions Score
Negative Net Worth CC
Final Weighting
EMIS Benchmark Score 90
EMIS Trend Score 10
EMIS Credit Analyt ics - EMIS Credit Analyt ics Assumptions
EMIS Business Report Generated on 2016-06-02
Copyright copy 2015 EMIS all rights reserved A Euromoney Institutional Investor company Page 43 of 48
Ret urn on Asset s (ROA)
An indicator of how profitable a company is relative to its total assets ROA gives an
idea as to how efficient management is at using its assets to generate earnings
Calculated by dividing a companys annual earnings by its total assets
Calculated as Net prof it T ot al Asset
Ret urn on Equit y (ROE)
A measure of a corporations profitability that reveals how much profit a company
generates with the money shareholders have invested
Calculated as Net prof it Shareholders equit y
Ret urn on Sales (ROS)
A ratio widely used to evaluate a companys operational efficiency ROS is also
known as a firms operating profit margin
Calculated as Net Prof it Net Sales Revenue
Bookvalue
A companys common stock equity as it appears on a balance sheet equal to total
assets minus liabilities preferred stock and intangible assets such as goodwill
Current Rat io
A liquidity ratio that measures a companys ability to pay short-term obligations
Calculated as Current Asset sCurrent Liabilit ies
Quick rat io
An indicator of a companys short-term liquidity The quick ratio measures a
companys ability to meet its short-term obligations with its most liquid assets The
higher the quick ratio the better the position of the company
Calculated as (Current Asset s-Invent ories)Current Liabilit ies
Debt t o equit y
A measure of a companys financial leverage calculated by dividing its total
liabilities by stockholders equity It indicates what proportion of equity and debt the
company is using to finance its assets
Calculated as T ot al Liabilit iesShareholders Equit y
Debt t o t ot al asset s
A metric used to measure a companys financial risk by determining how much of
the companys assets have been financed by debt Calculated by adding short-term
and long-term debt and then dividing by the companys total assets
Calculated as Short T erm Debt s+Long T erm Debt sT ot al Asset s
Leverage rat io
Leverage ratio provide an indication of the long term solvency of the firm
Calculated as T ot al Asset sShareholders Equit y
Debt Ent erprise Value
This metric is equivalent to the payback period used by debtholders Calculated as
Debt Ent erprise Value
Market Capit alizat ionEBIT DA
Calculated as Market Capit alizat ionEBIT DA
Earning Bef ore Int erest s and T axes (EBIT )
Earning Before Interests and Taxes (EBIT)
EBIT DA
Earnings before interest taxes depreciation and amortization (EBITDA) is a non-
GAAP metric that can be used to evaluate a companys profitability Calculated as
Ent erprise valueNet Sales
Dividing the enterprise value of a firm by its sales or revenues is a way of
comparing firms in cyclical industries Calculated as Enterprise Value Net Sales
Revenue
Ent erprise valueGross income
Calculated as Enterprise value Gross income
Ent erprise valueT ot al Asset s
Calculated as Enterprise value Total Assets
EBIT DA Margin
A measurement that provides a clear view of the companyrsquos core profitability
Calculated as EBITDA Net Sales Revenue
T ot al Operat ing Revenue T rend
Calculated as Total Operating Revenue current year Total Operating Revenue
previous year
Gross Prof it T rend
Calculated in percentage as (Gross Prof it Current Year Gross Prof it
Previous Year) ndash 1
EBIT DA T rend
Calculated as EBITDA current year EBITDA previous year
Account s Receivables T rend
Calculated in percentage as T rade Account s Receivables current year
T rade Account Receivables previous year
Invent ory T rend
Calculated as Inventories current year Inventories previous year
Net Propert y Plant and Equipment (PPampE) T rend
Calculated as Net PPampE current year Net PPampE previous year
T ot al Asset s T rend
Calculated as Total Assets current year Total Assets previous year
Bookvalue T rend
Calculated as Bookvalue current year Bookvalue previous year
Shareholders Equit y T rend
Calculated as Shareholdersrsquo Equity current year Shareholdersrsquo Equity previous
year
Cash f rom Operat ions T rend
Calculated as Net Cash Flow from Operations current year Net Cash Flow from
Operations previous year
Capit al Expendit ures T rend
Calculated as CAPEX current year CAPEX previous year
Dividend per Share T rend
Calculated as Dividend value per (common) share current year Dividend value
per (common) share previous year
Cost t o Income Rat io
A key financial measure showing a bankrsquos cost in relation to its income Ratio is
calculated as Total Operational Cost Total Operational Income
Glossary
EMIS Business Report Generated on 2016-06-02
Copyright copy 2015 EMIS all rights reserved A Euromoney Institutional Investor company Page 44 of 48
EBIT DA = Operat ing Revenue - Operat ing Expenses (Depriciat ion and
Amort izat ion excluded)
Ent erprise Value EBIT DA
Enterprise Value EBITDA is the metric most used to measure how many years it
would take to pay back the investment
Ent erprise Value
A measure of a companys value often used as an alternative to straightforward
market capitalization EV is calculated as market cap plus debt minority interest
and preferred shares minus total cash and cash equivalents
Dooms day rat io
Calculated as Cash Current Liabilit ies
Long T erm Debt t o Capit al
A ratio showing the financial leverage of a firm calculated by dividing long-term
debt by the amount of capital available Calculated as Long t erm debt Long
t erm debt + Pref f ered St ock + Common St ock
Int erest Coverage Rat io
A ratio used to determine how easily a company can pay interest on outstanding
debt The interest coverage ratio is calculated by dividing a companys earnings
before interest and taxes (EBIT) of one period by the companys interest expenses of
the same period Calculated as EBIT Int erest expense
Cash Flow t o Debt
This coverage ratio compares a companys operating cash flow to its total debt
which for purposes of this ratio is defined as the sum of short-term borrowings the
current portion of long-term debt and long-term debt This ratio provides an
indication of a companys ability to cover total debt with its yearly cash flow from
operations The higher the percentage ratio the better the companys ability to carry
its total debt Calculates as Operat ing Cash Flow T ot al Debt
Ret urn on Capit al
A ratio that indicates the efficiency and profitability of a companys capital
investments Calculated as Net Income (Total Asset - Current Liabilities)
Gross Prof it Margin
A financial metric used to assess a firms financial health by revealing the
proportion of money left over from revenues after accounting for the cost of goods
sold Gross profit margin serves as the source for paying additional expenses and
future savings Calculated as (Net Sales Revenue - Cost of Goods Sold) Net
Sales Revenue
Operat ing Prof it Margin
A ratio used to measure a companys pricing strategy and operating efficiency
Calculated as Operat ing prof it Net sales
Account s Receivable T urnover
An accounting measure used to quantify a firms effectiveness in extending credit
as well as collecting debts The receivables turnover ratio is an activity ratio
measuring how efficiently a firm uses its assets Calculated as Net Sales
Revenue T rade Account s Receivable (Net )
Invent ory T urnover
A ratio showing how many times a companys inventory is sold and replaced over a
period Calculated as Sales Invent ory
Current asset t urnover
Calculated as Net Sales Revenue T ot al Current Asset
Ef f iciency Rat io
Calculated as Total non-interest expenses (Total net interest income + Total non-
interest income)
Loans t o Deposit s Rat io
A commonly used statistic for assessing a banks liquidity Calculated as Total
Loans Total Deposits
Liquid Asset s t o Deposit s Rat io
This ratio indicates extent of liquidity maintained by a bank for meeting the demand
made by the depositors Calculated as (Cash + Financial assets held for trading)
Total Deposits
Loans t o Asset Rat io
Calculated as Total Loans Total Assets
Net Int erest Income T rend
Calculated as Net Interest Income current year Net Interest Income previous year
Net Fee and Commission Income T rend
Calculated as Net Fee and Commission Income current year Net Fee and
Commission Income previous year
Loans and Advances t o Cust omers T rend
Calculated as Loans and Advances to Customers current year Loans and
Advances to Customers previous year
Deposit s f rom Cust omers T rend
Calculated as Deposits from Customers current year Deposits from Customers
previous year
Loss Rat io
This ratio indicates the average cost of insurance protection per each dollar of net
premiums earned during the period Calculated as Total Losses Incurred in Claims
Net Insurance Premium Revenue
Underwrit ing Expenses Rat io
This ratio measures operational efficiency in underwriting Calculated as
Underwriting expenses Net Insurance Premium Revenue
Policyholder Dividend Rat io
Calculated as Dividends Net Insurance Premium Revenue
Combined LossExpense Rat io
Calculated as Loss Ratio + Underwriting Expenses Ratio + Policyholder Dividend
Ratio When the combined ratio is under 100 underwriting results are
considered profitable when the combined ratio is over 100 underwriting results
are considered unprofitable
Ceded Premium Rat io
Calculated as Insurance Premium Ceded to Reinsurers Insurance Premium
Revenue
Net Premiums Earned T rend
Calculated as Net Insurance Premium Revenue current year Net Insurance
Premium Revenue previous year
Fees and Commissions T rend
Calculated as Net Fees and Commissions Income current year Net Fees and
Commissions Income previous year
Net Invest ment Income T rend
EMIS Business Report Generated on 2016-06-02
Copyright copy 2015 EMIS all rights reserved A Euromoney Institutional Investor company Page 45 of 48
Fixed-asset t urnover
This ratio is a rough measure of the productivity of a companys fixed assets
(property plant and equipment or PPampE) with respect to generating sales For most
companies their investment in fixed assets represents the single largest
component of their total assets This annual turnover ratio is designed to reflect a
companys efficiency in managing these significant assets Simply put the higher
the yearly turnover rate the better Calculated as Revenue Propert y Plant and
Equipment
Asset T urnover
The amount of sales generated for every dollars worth of assets It is calculated by
dividing sales in dollars by assets in dollars Calculated as Revenue Asset s
Revenue T rend
Calculated as (Net Sales Current Year Net Sales Previous Year)
Net Income T rend
Calculated as (Net Income Current Year Net Income Previous Year)
Operat ing Income T rend
Calculated as (Operat ing Income Current Year Operat ing Income
Previous year)
PriceBook Rat io
A ratio used to compare a stocks market value to its book value It is calculated by
dividing the current closing price of the stock by the latest years book value per
share Calculated as St ock price (T ot al Asset - Int angible asset s and
Liabilit ies)
PriceEarnings Rat io
A valuation ratio of a companys current share price compared to its per-share
earnings Calculated as Market value per share Earning per share EPS
Market capShareholder equit y
A financial ratio showing the premium which is included in the current market price
compared to the actual value of Shareholder equity of the company Calculated as
Market capit alizat ion Shareholders equit y
PriceEBIT Rat io
The PriceEBIT ratio is a market value indicator similar to the PE ratio which shows
the number of times the market price exceeds the earnings per share before the
effects of gross interest abnormal items and tax The PriceEBIT ratio is calculated
as follows Valuat ion price EBIT
T ot al Capit al Rat io
Calculated as T ot al capit al (T ier 1 and T ier 2) rat io = T ot al capit al (T ier 1
and T ier 2) Risk-adjust ed asset s
T ier 1 Rat io
Tier 1 capital is the core measure of a banks financial strength from a regulators
point of view It consists primarily of shareholders equity but may also include
preferred stock that is irredeemable and non-cumulative and retained earnings
Risk Weight ed Asset s
Risk weights are in five categories from zero to 100 per cent Those carrying a
zero weight include notes and coins gold matched by gold liabilities balances with
the Reserve Bank and commonwealth government securities with less than twelve
months to maturity Commonwealth government securities with more than twelve
months to maturity carry a 10 per cent risk weighting as do state government
securities Claims on other banks Australian local governments and public-sector
organisations other than those with corporate status or which operate
Calculated as Investment Income current year Investment Income previous year
Receivables Arising Out Of Direct Insurance Operat ions T rend
Calculated as Receivables Arising out of Direct Insurance Operations current year
Receivables Arising out of Direct Insurance Operations previous year
Operat ing ROA
An indicator that shows the type of net profit which is actually generated by business
effort Calculated as Operat ing Prof it (EBIT ) T ot al Asset s
Payables T urnover
An indicator that evaluates how fast a company pays off its creditors (suppliers)
Calculated as Purchases T rade Payables
Working Capit al T urnover
A measure that indicates how efficiently the company generates revenue with its
working capital Working capital is defined as current assets minus current liabilities
Calculated as Net Sales (T ot al Current Asset s ndash T ot al Current
Liabilit ies)
Working Capit al
A measure of a companyrsquos short term financial health Calculated as T ot al
Current Asset s ndash T ot al Current Liabilit ies
Cash Rat io
A measure of a companyrsquos liquidity in crisis situation Only highly marketable
securities and cash are included Calculated as (T ot al Cash and Cash
Equivalent s + Market able securit ies) T ot al Current Liabilit ies
Cash Flow f rom Operat ion Rat io
A measure of how well current liabilities are covered by the cash flow generated
from a companyrsquos operations Calculated as Net Cash Flow f rom Operat ing
Act ivit ies T ot al Current Liabilit ies
Debt Coverage
A measure that shows a companyrsquos ability to cover total debt with its yearly cash
flow from operations Calculated as Net Cash Flow f rom Operat ing Act ivit ies
T ot al Debt
Cash Flow t o Revenue
This ratio measures the amount of operating cash flow generated for each dollar of
revenue Calculated as Net Cash Flow f rom Operat ing Act ivit ies Net Sales
Revenue
Cash Ret urn on Asset s
This ratio measures the return of operating cash flow attributed to all providers of
capital Calculated as Net Cash Flow f rom Operat ing Act ivit ies T ot al
Asset s
Cash Ret urn on Equit y
This ratio measures the return of operating cash flow attributed to shareholders
Calculated as Net Cash Flow f rom Operat ing Act ivit ies T ot al
Shareholdersrsquo Equit y
Cash t o Income
This ratio measures the ability to generate cash from companyrsquos operations
Calculated as Net Cash Flow f rom Operat ing Act ivit ies Operat ing Prof it
(EBIT )
CashT ot al Asset s
Calculated as Cash and Cash Equivalent s T ot al Asset s
EMIS Business Report Generated on 2016-06-02
Copyright copy 2015 EMIS all rights reserved A Euromoney Institutional Investor company Page 46 of 48
commercially carry a 20 per cent risk weighting Loans secured by a mortgage
over residential property and with a loan-to-valuation of 80 per cent or less carry a
50 per cent risk weighting and loans to companies or individuals carry a 100 per
cent risk weighting
Market Cap Net cash
A ratio measure the market value of the company to the Net cash position of the
company Calculated as Market capit alizat ion (Cash and cash equivalent s
minus long-t erm debt )
Net Cash
Net cash is commonly used in evaluating a companys cash flow More generally
net cash can refer to the amount of cash remaining after a transaction has been
completed and all charges and deductions related to the transaction have been
subtracted Calculated as T ot al cash minus t ot al short t erm liabilit ies
Annualised Ret urn on Equit y (ROE)
Return on Equity ratio (ROE) converted into an annual basis
Annualised Ret urn on Asset s (ROA)
Return on Assets ratio (ROA) converted into an annual basis
Export Proport ion Rat io
The percentage figure of the proportion of the export revenue from the total sales
revenue of the company Calculated as Export revenue T ot al revenue
Net Debt
A metric that shows companys overall debt situation by netting the value of
financial liabilities with its cash and other similar liquid assets Calculated as
financial liabilities - cash and cash equivalents
EPS
The portion of a companys profit allocated to each outstanding share Calculated
as Net Profit Outstanding Shares
PE
A valuation ratio of a companys current share price compared to its per-share
earnings Calculated as Market value per share Earning per share EPS
Market Capit alizat ionNet Sales
Calculated as Market Capitalization Net Sales Revenue
Market Capit alizat ionGross income
Calculated as Market Capitalization Gross Profit
Market Capit alizat ionEBIT
Calculated as Market Capitalization EBIT
Market Capit alizat ionT ot al Asset s
Calculated as Market Capitalization Total Assets
ReceivablesT ot al asset s
Calculated as T rade Account s Receivable T ot al Asset s
Invent oriesT ot al asset s
Calculated as Invent ories T ot al Asset s
Fixed asset sT ot al asset s
Calculated as Non-current Asset s T ot al Asset s
Current Liabilit iesT ot al Liabilit ies
Calculated as T ot al Current Liabilit ies T ot al Liabilit ies
Salaries and Employee Benef it sNet sales
Calculated as Employee Benef it Expenses Net Sales Revenue
Administ rat ive ExpensesNet Sales
Calculated as Administ rat ive Expenses Net Sales Revenue
Depreciat ion and Amort izat ionNet sales
Calculated as Depreciat ion Amort izat ion and Impairment Charges Net
Sales Revenue
Int erest paidNet sales
Calculated as Int erest -t ype Expenses Net Sales Revenue
Income t axNet sales
Calculated as Income T ax Net Sales Revenue
Operat ing Cash Flow t o T ot al Cash Flow
Calculated as Net Cash Flow f rom Operat ing Act ivit ies Net
IncreaseDecrease in Cash and Cash Equivalent s
Cash Flow f rom Invest ing t o T ot al Cash Flow
Calculated as Net cash f low f rom (used in) invest ing act ivit ies Net
IncreaseDecrease in Cash and Cash Equivalent s
Cash f low f rom f inancing t o T ot al cash f low
Calculated as Net cash flow from (used in) financing activities Net
IncreaseDecrease in Cash and Cash Equivalents
Average Yie ld on Asset s
Calculated as T ot al Int erest Income T ot al Asset s
Disclaimer
Whilst EMIS attempts at all times to ensure the accuracy and reliability of the information it provides due to the vast quantity of processed data and the fact that some of
the third-party data cannot always be verified including information provided directly by the subject of the enquiry EMIS does not guarantee the correctness or the
effective delivery of the information and shall not be held responsible for any errors or omissions therein
The content and recommendations shall only be used as a reference in business decisions of EMIS clients and shall not be used for any other purposes EMIS and its
affiliates shall not be held liable for any loss of the clients arising out of its own business decisions whether or not the making of such decision has been referred to this
contentrecommendation
EMIS Business Report Generated on 2016-06-02
Copyright copy 2015 EMIS all rights reserved A Euromoney Institutional Investor company Page 47 of 48
EMIS Business Report Generated on 2016-06-02
Copyright copy 2015 EMIS all rights reserved A Euromoney Institutional Investor company Page 48 of 48
- Table of Contents
- Company Tear Sheet
-
- Contact Information
- NAICS Industry Classification
- Business description
- Basic Information
- EMIS Financial Score
- Share Price information
- Key Executives
- Ownership Details
- Subsidiaries and Affiliates
- Key Financial Highlights
- Financial Performance Charts
- Latest MampA and ECM Deals
- Top Competitors
-
- Financial Statements
-
- Annual Statements
- Interim Statements
- Ratios
- Multiples
-
- Company Documents
-
- Financial DocumentsAnnual Reports
- Corporate Actions
-
- News amp Reports
-
- News
- Reports
-
- MampA and ECM Deals
-
- EMIS DealWatch Deals
- EMIS DealWatch Intents
-
- EMIS Credit Analytics
-
- Summary
- EMIS Financial Score
- EMIS Benchmark Score
- EMIS Credit Quota
- Conclusions
- Company vs Industry Key Stats
- Company vs Industry Balance Sheet
- Company vs Industry Income Statement
- Company vs Industry Cash Flow
- EMIS Credit Analytics Assumptions
-
- Glossary
- Disclaimer
-
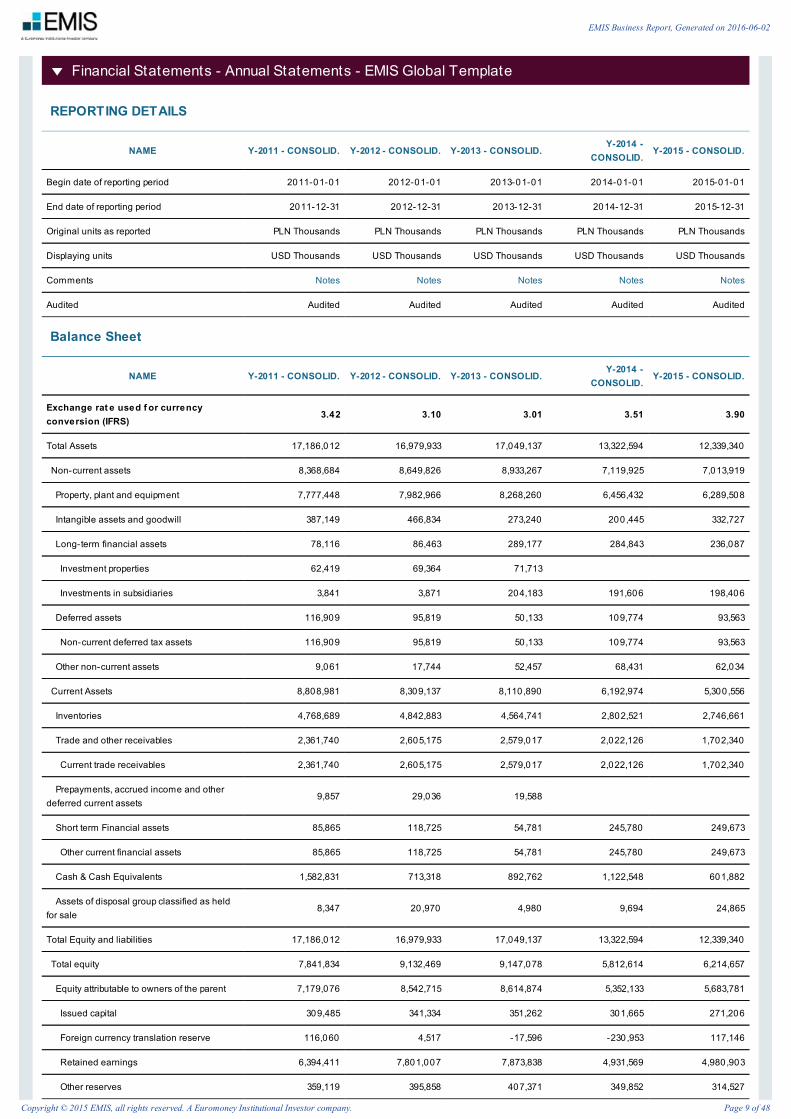
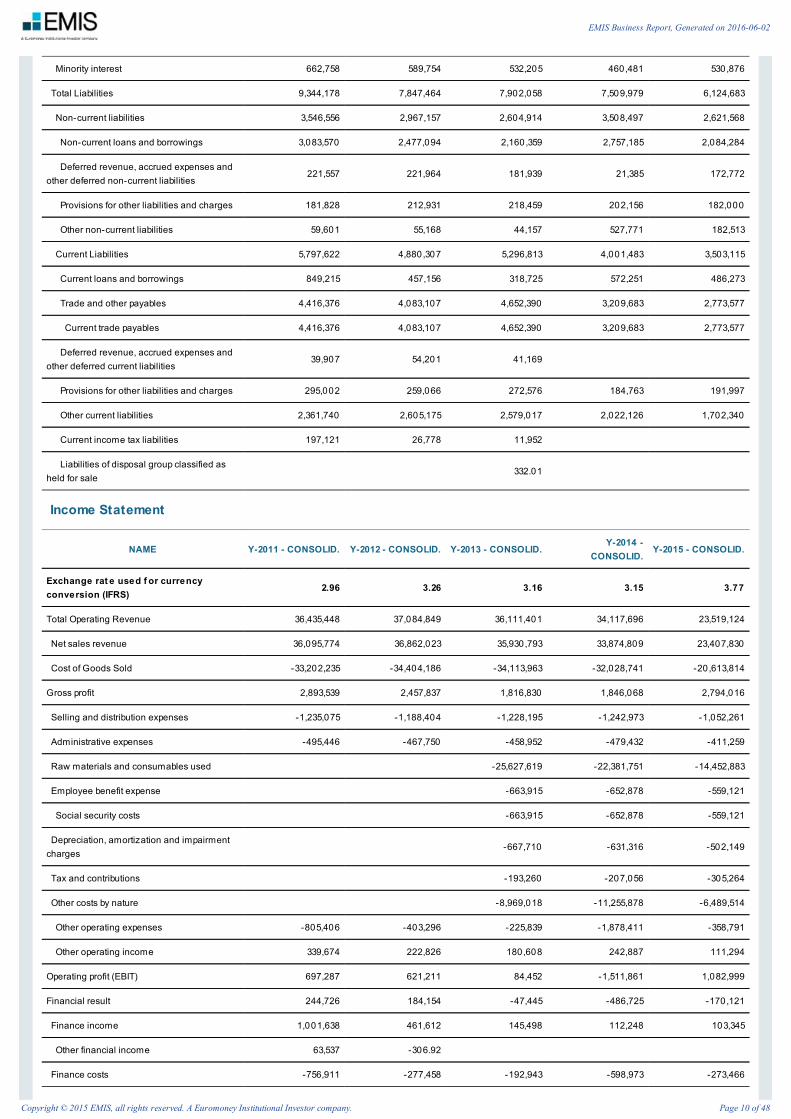
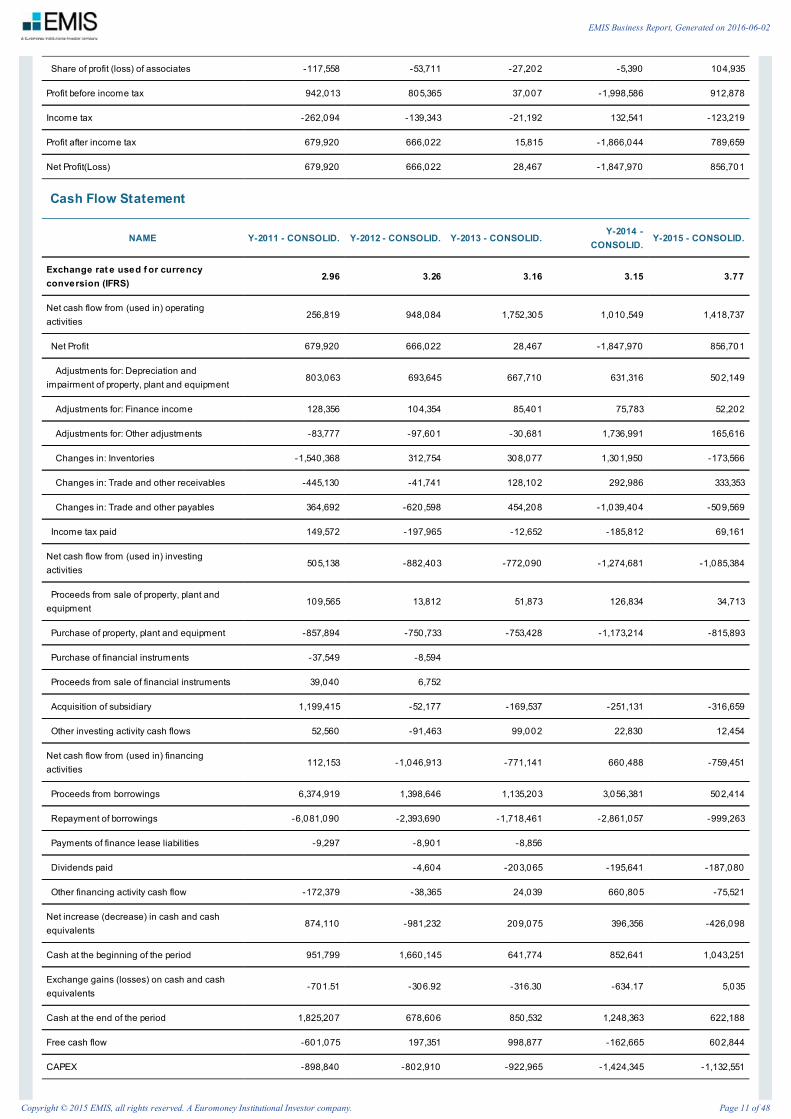

OTHER INFORMATION
NAME Y-2011 - CONSOLID Y-2012 - CONSOLID Y-2013 - CONSOLIDY-2014 -
CONSOLIDY-2015 - CONSOLID
Audited Audited Audited Audited Audited Audited
Financial statement type Consolid Consolid Consolid Consolid Consolid
Fiscal year end December December December December December
EMIS Business Report Generated on 2016-06-02
Copyright copy 2015 EMIS all rights reserved A Euromoney Institutional Investor company Page 12 of 48
Financial Statements - Interim Statements - EMIS Global Template
REPORTING DETAILS
NAMEQ1-2015 -
CONSOLIDH1-2015 -
CONSOLIDQ3C-2015 -CONSOLID
Y-2015 - CONSOLIDQ1-2016 -
CONSOLID
Begin date of reporting period 2015-01-01 2015-01-01 2015-01-01 2015-01-01 2016-01-01
End date of reporting period 2015-03-31 2015-06-30 2015-09-30 2015-12-31 2016-03-31
Original units as reported PLN Thousands PLN Thousands PLN Thousands PLN Thousands PLN Thousands
Displaying units USD Thousands USD Thousands USD Thousands USD Thousands USD Thousands
Comments Notes Notes Notes Notes Notes
Audited Non-Audited Audited Non-Audited Audited Non-Audited
Balance Sheet
NAMEQ1-2015 -
CONSOLIDH1-2015 -
CONSOLIDQ3C-2015 -CONSOLID
Y-2015 - CONSOLIDQ1-2016 -
CONSOLID
Exchange rat e used f or currencyconversion (IFRS)
381 376 378 390 376
Total Assets 12205902 13022978 13208137 12339340 12827082
Non-current assets 6587279 6531545 6580495 7013919 7478851
Property plant and equipment 5932590 5957763 5956720 6289508 6660548
Intangible assets and goodwill 206689 160978 163426 332727 404629
Long-term financial assets 247869 240935 263813 236087 258047
Investment properties 52984 54456 55358
Investments in subsidiaries 184393 175588 197595 198406 228518
Deferred assets 64000 72254 69132 93563 89918
Non-current deferred tax assets 64000 72254 69132 93563 89918
Other non-current assets 136131 99615 127404 62034 65709
Current Assets 5614164 6489574 6623139 5300556 5333599
Inventories 2666754 2847921 3156222 2746661 2457036
Trade and other receivables 1948590 2414132 2029719 1702340 1756850
Current trade receivables 1948590 2414132 2029719 1702340 1756850
Prepayments accrued income and otherdeferred current assets
11541 6907 9800
Short term Financial assets 176787 120866 137734 249673 197393
Other current financial assets 176787 120866 137734 249673 197393
Cash amp Cash Equivalents 810492 1099748 1289665 601882 922320
Assets of disposal group classified as heldfor sale
4459 1859 4503 24865 14632
Total Equity and liabilities 12205902 13022978 13208137 12339340 12827082
Total equity 5601049 5952185 6383694 6214657 6507050
Equity attributable to owners of the parent 5167213 5449595 5851301 5683781 5966214
Issued capital 277508 281047 280235 271206 281458
Foreign currency translation reserve -167082 -128304 78932 117146 138069
Retained earnings 4734951 4970912 5167135 4980903 5258845
Other reserves 321836 325940 324999 314527 287843
EMIS Business Report Generated on 2016-06-02
Copyright copy 2015 EMIS all rights reserved A Euromoney Institutional Investor company Page 13 of 48
Minority interest 433836 502590 532394 530876 540835
Total Liabilities 6604852 7070793 6824442 6124683 6320032
Non-current liabilities 2722623 2632753 3199926 2621568 2621442
Non-current loans and borrowings 2290623 2137336 2557610 2084284 2099761
Deferred revenue accrued expenses andother deferred non-current liabilities
31738 90317 147534 172772 176643
Provisions for other liabilities and charges 185443 196573 196006 182000 194201
Other non-current liabilities 214820 208527 298776 182513 150838
Current Liabilities 3882230 4438040 3624517 3503115 3689279
Current loans and borrowings 652590 567937 328177 486273 475924
Trade and other payables 2966557 3647762 3033851 2773577 2937217
Current trade payables 2966557 3647762 3033851 2773577 2937217
Deferred revenue accrued expenses andother deferred current liabilities
73967 64816 50591 72094
Provisions for other liabilities and charges 184656 126179 158129 191997 204044
Other current liabilities 1948590 2414132 2029719 1702340 1756850
Current income tax liabilities 4459 31345 53769
Liabilities of disposal group classified asheld for sale
9311
Income Statement
NAMEQ1-2015 -
CONSOLIDH1-2015 -
CONSOLIDQ3C-2015 -CONSOLID
Y-2015 - CONSOLIDQ1-2016 -
CONSOLID
Exchange rat e used f or currencyconversion (IFRS)
373 371 373 377 396
Total Operating Revenue 5388266 12107296 18354052 23519124 4146296
Net sales revenue 5366537 12054267 18281194 23407830 4096271
Cost of Goods Sold -4700716 -10337420 -15904470 -20613814 -3682172
Gross profit 665821 1716847 2376724 2794016 414099
Selling and distribution expenses -250555 -516831 -779473 -1052261 -252906
Administrative expenses -104085 -212654 -300539 -411259 -91461
Raw materials and consumables used -3210265 -7453936 -11418347 -14452883 -2296620
Employee benefit expense -143251 -288025 -421344 -559121 -143255
Wages and salaries -143255
Social security costs -143251 -288025 -421344 -559121
Depreciation amortization and impairmentcharges
-121253 -246571 -370986 -502149 -130117
Tax and contributions -75918 -153972 -230896 -305264 -69227
Other costs by nature -1519960 -3197351 -4793091 -6489514 -1292323
Other operating expenses -16632 -160433 -207056 -358791 -20465
Other operating income 21729 53029 72858 111294 50025
Operating profit (EBIT) 316278 879958 1162513 1082999 99293
Financial result -47214 -104443 -130984 -170121 -11117
Finance income 23875 42800 69644 103345 11369
Finance costs -71089 -147243 -200627 -273466 -22486
EMIS Business Report Generated on 2016-06-02
Copyright copy 2015 EMIS all rights reserved A Euromoney Institutional Investor company Page 14 of 48
Share of profit (loss) of associates 30045 79140 102858 104935 -25265
Profit before income tax 269065 775515 1031530 912878 88176
Income tax -44531 -152896 -197681 -123219 -24760
Profit after income tax 224533 622619 833849 789659 63416
Net Profit(Loss) 232849 650614 884475 856701 84892
Cash Flow Statement
NAMEQ1-2015 -
CONSOLIDH1-2015 -
CONSOLIDQ3C-2015 -CONSOLID
Y-2015 - CONSOLIDQ1-2016 -
CONSOLID
Exchange rat e used f or currencyconversion (IFRS)
373 371 373 377 396
Net cash flow from (used in) operatingactivities
262895 984939 1015458 1418737 739517
Net Profit 232849 650614 884475 856701 109652
Adjustments for Depreciation andimpairment of property plant and equipment
121253 246571 370986 502149 130117
Adjustments for Finance income 14486 27726 39911 52202 12633
Adjustments for Other adjustments -29509 94752 82501 165616 55584
Changes in Inventories -89599 -207540 -512685 -173566 373169
Changes in Trade and other receivables -89062 -416426 -44465 333353 8085
Changes in Trade and other payables 66260 411311 -51429 -509569 64932
Income tax paid 21193 124632 155895 69161 -22234
Net cash flow from (used in) investingactivities
-152372 -354783 -511345 -1085384 -353462
Proceeds from sale of property plant andequipment
11535 14536 18750 34713 15412
Purchase of property plant and equipment -165248 -335132 -495541 -815893 -387318
Acquisition of subsidiary -9152 -9107 -316659 17938
Other investing activity cash flows 1341 -25034 -25447 12454 50531
Net cash flow from (used in) financingactivities
-339349 -576858 -265985 -759451 -78575
Proceeds from borrowings 19046 100943 531970 502414 538152
Repayment of borrowings -342031 -633387 -548310 -999263 -602073
Payments of finance lease liabilities -1878 -3499 -5625 -1769
Dividends paid -189109 -187080
Other financing activity cash flow -14486 -40916 -54911 -75521 -12885
Net increase (decrease) in cash and cashequivalents
-228826 53298 238128 -426098 307479
Cash at the beginning of the period 1056139 1059772 1054566 1043251 593230
Exchange gains (losses) on cash and cashequivalents
1610 1346 11518 5035 -24760
Cash at the end of the period 828923 1114416 1304212 622188 875950
Free cash flow 97647 649807 519917 602844 352199
CAPEX -165248 -344554 -504917 -1132551 -387318
OTHER INFORMATION
EMIS Business Report Generated on 2016-06-02
Copyright copy 2015 EMIS all rights reserved A Euromoney Institutional Investor company Page 15 of 48
NAMEQ1-2015 -
CONSOLIDH1-2015 -
CONSOLIDQ3C-2015 -CONSOLID
Y-2015 - CONSOLIDQ1-2016 -
CONSOLID
Reporting type Non-Cumulative Non-Cumulative Cumulative Non-Cumulative
Audited Non-Audited Audited Non-Audited Audited Non-Audited
Financial statement type Consolid Consolid Consolid Consolid Consolid
Fiscal year end December December December December December
EMIS Business Report Generated on 2016-06-02
Copyright copy 2015 EMIS all rights reserved A Euromoney Institutional Investor company Page 16 of 48
Financial Statements - Ratios
REPORTING DETAILS
NAME Y-2011 - CONSOLID Y-2012 - CONSOLID Y-2013 - CONSOLIDY-2014 -
CONSOLIDY-2015 - CONSOLID
Begin date of reporting period 2011-01-01 2012-01-01 2013-01-01 2014-01-01 2015-01-01
End date of reporting period 2011-12-31 2012-12-31 2013-12-31 2014-12-31 2015-12-31
Original units as reported PLN Thousands PLN Thousands PLN Thousands PLN Thousands PLN Thousands
Displaying units USD Thousands USD Thousands USD Thousands USD Thousands USD Thousands
Comments Notes Notes Notes Notes Notes
Audited Audited Audited Audited Audited Audited
Ratios
NAME Y-2011 - CONSOLID Y-2012 - CONSOLID Y-2013 - CONSOLIDY-2014 -
CONSOLIDY-2015 - CONSOLID
Exchange rat e used f or currencyconversion (IFRS)
100 100 100 100 100
Profitability Ratios
Return on Assets (ROA) 343 412 018 -1247 672
Annualised Return on Assets (ROA) 343 412 018 -1247 672
Return on Equity (ROE) 000 000 000 000 000
Annualised Return on Equity (ROE) 000 000 000 000 000
Return on Capital 501 580 026 -1818 943
Return on Sales (ROS) 188 181 008 -546 366
Gross Profit Margin 802 667 506 545 1194
Operating Profit Margin 193 169 024 -446 463
Operating ROA 352 385 052 -1020 849
Efficiency Ratios
Inventory Turnover -0 22x -0 26x -0 28x -0 40x -0 37x
Accounts Receivable Turnover 1325x 1487x 1462x 1506x 1330x
Current asset turnover 355x 466x 465x 492x 427x
Fixed-asset turnover 374x 448x 422x 428x 323x
Asset Turnover 182x 228x 221x 229x 184x
Payables Turnover 009x -0 41x -0 37x -0 70x -0 29x
Working Capital Turnover 1039x 1130x 1340x 1390x 1260x
Valuation Figures
Bookvalue 7454685 8665634 8874170 5612169 5881931
Enterprise Value 7255510 9641115 7940595 8633248 9938494
Net Cash -7761348 -7134146 -7008964 -6387432 -5522801
Net Debt 2349954 2220932 1586321 2206889 1968676
Working Capital 3011359 3428830 2814077 2191492 1797442
Earning Before Interests and Taxes (EBIT) 697287 621211 84452 -1511861 1082999
EMIS Business Report Generated on 2016-06-02
Copyright copy 2015 EMIS all rights reserved A Euromoney Institutional Investor company Page 17 of 48
Liquidity Ratios
Current Ratio 152 170 153 155 151
Quick ratio 0 70 071 067 085 073
Dooms day ratio 0 27 015 017 028 017
Cash Ratio 029x 017x 018x 034x 024x
Cash Flow from Operation Ratio 004x 020x 035x 023x 039x
Leverage Ratios
Debt to total assets 2288 1728 1454 2499 2083
Debt to equity 5015 3213 2710 5728 4136
Long Term Debt to Capital 2822 2134 1911 3217 2512
Debt Enterprise Value 5420 3043 3122 3857 2586
Cash Flow to Debt 1927 -3515 885 1070 -1604
Leverage ratio 219x 186x 186x 229x 199x
Growth Trend Ratios
Revenue Trend 12804 11227 9458 9404 8269
Total Operating Revenue Trend 12806 11190 9449 9425 8249
Gross Profit Trend 10745 9338 7173 10136 18111
Operating Income Trend 6618 9794 1319 -1786 -8572
Net Income Trend 8206 10769 415 -6476 -5547
Accounts Receivables Trend 12834 10005 9620 9130 9364
Inventory Trend 14428 9211 9159 7149 10901
Net Property Plant and Equipment (PPampE)Trend
9699 9310 10065 9093 10836
Total Assets Trend 11482 8961 9757 9099 10302
Bookvalue Trend 11117 10595 9725 7331 12021
Shareholders Equity Trend 11056 10563 9733 7399 11892
Cash from Operations Trend 1246 40586 17935 5753 16799
Capital Expenditures Trend 6936 9821 11154 15394 9515
Coverage Ratios
Debt Coverage 006x 034x 074x 027x 053x
Performance Ratios
Cash Flow to Revenue 071 257 488 298 606
Cash Return on Assets 130 587 1079 682 1112
Cash Return on Equity 284 1091 2011 1563 2208
Cash to Income 3683 15262 2075 -6684 13100
Common size balance sheet ratios
CashTotal Assets 921 420 524 843 488
ReceivablesTotal assets 1374 1534 1513 1518 1380
InventoriesTotal assets 2775 2852 2677 2104 2226
EMIS Business Report Generated on 2016-06-02
Copyright copy 2015 EMIS all rights reserved A Euromoney Institutional Investor company Page 18 of 48
Fixed assetsTotal assets 4525 4701 4850 4846 5097
Current LiabilitiesTotal Liabilities 6205 6219 6703 5328 5720
Common size income statement ratios
Administrative ExpensesNet Sales -137 -127 -128 -142 -176
Income taxNet sales -0 73 -038 -006 039 -053
Common size cash flow statement ratios
Operating Cash Flow to Total Cash Flow 2938 -9662 83812 25496 -33296
Cash Flow from Investing to Total Cash Flow 5779 8993 -36929 -32160 25473
Cash flow from financing to Total cash flow 1283 10669 -36884 16664 17823
OTHER INFORMATION
NAME Y-2011 - CONSOLID Y-2012 - CONSOLID Y-2013 - CONSOLIDY-2014 -
CONSOLIDY-2015 - CONSOLID
Audited Audited Audited Audited Audited Audited
Financial statement type Consolid Consolid Consolid Consolid Consolid
Fiscal year end December December December December December
EMIS Business Report Generated on 2016-06-02
Copyright copy 2015 EMIS all rights reserved A Euromoney Institutional Investor company Page 19 of 48
Financial Statements - Mult iples
REPORTING DETAILS
NAME Y-2011 - CONSOLID Y-2012 - CONSOLID Y-2013 - CONSOLIDY-2014 -
CONSOLIDY-2015 - CONSOLID
Begin date of reporting period 2011-01-01 2012-01-01 2013-01-01 2014-01-01 2015-01-01
End date of reporting period 2011-12-31 2012-12-31 2013-12-31 2014-12-31 2015-12-31
Original units as reported PLN Thousands PLN Thousands PLN Thousands PLN Thousands PLN Thousands
Displaying units PLN Thousands PLN Thousands PLN Thousands PLN Thousands PLN Thousands
Comments Notes Notes Notes Notes Notes
Audited Audited Audited Audited Audited Audited
Multiples
NAME Y-2011 - CONSOLID Y-2012 - CONSOLID Y-2013 - CONSOLIDY-2014 -
CONSOLIDY-2015 - CONSOLID
Equity Value Multiples
EPS 471 507 021 -1363 756
PE 720 976 19485 -359 898
Market CapitalizationNet Sales 014 018 015 020 033
Market CapitalizationGross income 169 264 305 359 275
Market CapitalizationEBIT 702 1046 6568 -439 710
Market CapitalizationTotal Assets 025 040 034 045 060
Market capShareholder equity 0 54 075 064 103 120
PriceBook Ratio 057 079 066 106 126
Market Cap Net cash -055 -0 96 -0 83 -0 93 -135
Market CapitalizationInvested Capital 0 36 057 050 067 087
Market CapitalizationOperating Cashflow 1905 685 317 657 542
Market Capitalization(EBIT + DevelopmentExpenditures)
702 1046 6568 -439 710
Enterprise Value Multiples
Enterprise valueNet Sales 023 025 021 028 044
Enterprise valueGross income 289 373 416 520 368
Enterprise valueEBIT 1200 1476 8958 -635 949
Enterprise valueTotal Assets 042 057 047 065 081
Enterprise valueInvested Capital 0 62 081 069 097 116
Enterprise valueOperating Cashflow 3258 967 432 950 724
Enterprise value(EBIT + DevelopmentExpenditures)
1200 1476 8958 -635 949
OTHER INFORMATION
NAME Y-2011 - CONSOLID Y-2012 - CONSOLID Y-2013 - CONSOLIDY-2014 -
CONSOLIDY-2015 - CONSOLID
Audited Audited Audited Audited Audited Audited
Financial statement type Consolid Consolid Consolid Consolid Consolid
EMIS Business Report Generated on 2016-06-02
Copyright copy 2015 EMIS all rights reserved A Euromoney Institutional Investor company Page 20 of 48
Fiscal year end December December December December December
EMIS Business Report Generated on 2016-06-02
Copyright copy 2015 EMIS all rights reserved A Euromoney Institutional Investor company Page 21 of 48
more raquo
more raquo
Company Documents - Financial DocumentsAnnual Reports
Company Documents - Corporate Act ions
June 12 2015 Polski Koncern Naftowy Orlen SA - Dividend (Mandatory) EDI - Corporate Act ions
June 04 2015 Polski Koncern Naftowy Orlen SA - Dividend (Mandatory) EDI - Corporate Act ions
June 03 2015 Polski Koncern Naftowy Orlen SA - Company Meet ing (Voluntary) EDI - Corporate Act ions
November 10 2014 Polski Koncern Naftowy Orlen SA - Company Meet ing (Voluntary) EDI - Corporate Act ions
November 10 2014 Polski Koncern Naftowy Orlen SA - Dividend (Mandatory) EDI - Corporate Act ions
June 14 2012 Polski Koncern Naftowy Orlen SA - Dividend (Mandatory) EDI - Corporate Act ions
May 29 2012 Polski Koncern Naftowy Orlen SA - Dividend (Mandatory) EDI - Corporate Act ions
December 16 2011 Polski Koncern Naftowy Orlen SA - Company Meet ing (Voluntary) EDI - Corporate Act ions
May 26 2011 Polski Koncern Naftowy Orlen SA - Company Meet ing (Voluntary) EDI - Corporate Act ions
December 13 1999 KGHM waits to decide on Catholic TV Warsaw Business Journal
By Anna KociNska TV Niepokalanow in January will get another chance to try to persuade copper concern KGHM Polska Miedzssupervisory board to invest in its proposed Catholic television station TV Familijna
November 29 1999 Elektrim picks f inancial health over long-distance license Warsaw Business Journal
By Gregory Keller Elektrims decision last week not to bid f or one of the three long-distance telephone licenses will delay but notnecessarily derail the conglomerates move to become a telecom heavyweight analysts said
November 23 1999 PSE to Enter Long-Distance Tender PNB - Polish News Bullet in
Independent Long-Distance Operator (NOM) a company owned by Tel-Energo in turn 76 percent owned by the PSE power grid company isto enter the tender f or long-distance telephone services sources reported
October 12 1999 PKN Lowers Fuel Prices PNB - Polish News Bullet in
Starting today (October 12) the Polski Koncern Naf towy (PKN) petroleum group will lower the wholesale price of its f uels by zl 50 per tonnewhich translates into a reduction of 5 groszy per litre in the price of diesel f uel and petrol at f illing stations
March 26 1998 CPN-Petrochemia Merger Conf irmed PNB - Polish News Bullet in
The Treasury Ministrys communiqu issued yesterday conf irmed earlier reports about a planned merger between the CPN petroleumdistributing giant and Petrochemia Plock
March 25 1998 CPN Petrochemia To Merge PNB - Polish News Bullet in
Unof f icial sources quoted by Zycie indicate that a merger between the CPN petroleum distributing giant and Petrochemia Plock is now certainwith the terms of the deal said to have been approved by the Treasury Ministry
News amp Reports - News
June 02 2016 PKN Orlen fuels ref ining margin edges down to USD 58bbl in May petchem margin up to EUR 995t PAP
Market InsiderWarszawa June 2 2016 (PAP) - Listed f uel f irm PKN Orlen recorded a slight decline of model ref ining margin in May to USD 58 per barrelf rom USD 62 in April and a spike in the model petchem margin to EUR 995 per ton f rom EUR 973 in the prior month data published on PKNOrlens website showed
June 02 2016 Saudi Aramco enters Balt ic market with oil supply deal with Polish PKN BBJ - Energy Today
EMIS Business Report Generated on 2016-06-02
Copyright copy 2015 EMIS all rights reserved A Euromoney Institutional Investor company Page 22 of 48
Saudi Aramco and Polands biggest ref iner PKN Orlen on Wednesday signed a contract agreed in May f or Aramco to supply PKN with 50000barrels of crude oil per day starting this month the companies said
June 01 2016 Top news from Polish polit ics economy business amp f inancial markets - 1930 PAP Market Insider
Warszawa June 1 2016 (PAP) - Following is a digest of the days top news as compiled by PAP Market Insider
June 01 2016 Top news from Polish polit ics economy business amp f inancial markets - 1630 PAP Market Insider
Warszawa June 1 2016 (PAP) - Following is a digest of the days top news as compiled by PAP Market Insider
June 01 2016 POLSKI KONCERN NAFTOWY ORLEN SA Transact ions in PKN ORLEN f inancial PAP Market Insider
instruments concluded by the person in a close relationship with the President of the PKN ORLEN Management Board Warszawa
June 01 2016 Poland Board of Sygnity appoints Jan Maciejewicz as new CEO M-Brain - News Monitoring
Wirtualny Nowy Przemysl 01 Jun 2016 online- Jan Maciejewicz has been appointed as the new CEO of the Polish IT f irm Signity replacingJanusz R Guy who was dismissed by the supervisory board on 30 May 2016
June 01 2016 Poland in talks with Iran over oil gas cooperat ion -minister Petroleum Bazaar - PetroMag
Poland is in talks with Iran over cooperation in the oil and gas sector which could result in exploration and production contracts f or Polishindustry Deputy Energy Minister Michal Kurtyka said on Monday
May 31 2016 Top news from Polish polit ics economy business amp f inancial markets - 1930 PAP Market Insider
Warszawa May 31 2016 (PAP) - Following is a digest of the days top news as compiled by PAP Market Insider BUSINESS amp EQUITYMARKET NEWS NATURAL GAS PGNIG - Listed natural gas group PGNiG recommends a dividend payment of PLN 106 bln f rom 2015 prof itwhich translates into PLN 018 per share the f irm said in a market f iling
May 31 2016 PKN ORLEN SA PKN ORLENs subsidiary - ORLEN Upstream - has purchased bonds issued by PKN ORLEN
PAP Market InsiderWarszawa May 31 2016 (ESPI) - Current report No 1392016 Polski Koncern Naf towy ORLEN SA (PKN ORLEN) hereby inf orms that inorder to optimise the management of f inancial liquidity within the ORLEN Capital Group on 31 May 2016 PKN ORLEN issued short term bondsto its subsidiary ORLEN Upstream Sp z oo (ORLEN Upstream)
May 31 2016 Top news from Polish polit ics economy business amp f inancial markets - 1630 PAP Market Insider
Warszawa May 31 2016 (PAP) - Following is a digest of the days top news as compiled by PAP Market Insider BUSINESS amp EQUITYMARKET NEWS POWER PGE - Listed power group PGE signed a letter of intent on selling PGEs telco unit Exatel to PGZ arms producerPGE said in a press statement
May 31 2016 POLSKI KONCERN NAFTOWY ORLEN SA Transact ions in PKN ORLEN f inancial PAP Market Insider
instruments concluded by the person in a close relationship with the President of the PKN ORLEN Management Board Warszawa
May 31 2016 Report Poland aims to end long-term gas supplies f rom Russia `22 Prime - Business News in English
Poland does not plan to renew a long-term gas supply contract with Russia when its current deal with Gazprom expires in 2022 Reutersreported late Monday cit ing Peter Naimsky a government of f icial responsible f or gas and power inf rastructure
May 31 2016 Warsaw Hopeful about Working with Post-sanct ions Iran PNB - Polish News Bullet in
Polish energy companies could prove to be usef ul partners f or their Iranian counterparts in sales or extraction of oil and natural gas DeputyEnergy Minister Michal Kurtyka said on Monday while taking part in the Polish-Iranian economic f orum The event was staged as part of theof f icial Warsaw visit of Iranian Minister of Foreign Af f airs dr
May 31 2016 Poland in talks with Iran over oil gas cooperat ion minister says BBJ - Energy Today
Poland is in talks with Iran over cooperation in the oil and gas sector which could result in exploration and production contracts f or Polishindustry Deputy Energy Minister Michal Kurtyka said on Monday Polish state-run gas f irm PGNiG said last year that it was looking at variousoptions in oil and gas exploration and production in Iran
May 31 2016 Treasury Looking for Synergy among Treasury Companies PNB - Polish News Bullet in
Treasury Minister Dawid Jackiewicz plans to f orm a holding of companies of strategic importance f or the state interest These companiesshould according to his plan sign long-term contracts among themselves so that money remained under Treasurys control and could beused to f inance other state needs
May 31 2016 Poland aims to end long-term gas supplies f rom Russia af ter 2022 Petroleum Bazaar - PetroMag
May 30 Poland does not plan to renew a long-term gas supply contract with Russia when its current deal with Gazprom expires in 2022 a
EMIS Business Report Generated on 2016-06-02
Copyright copy 2015 EMIS all rights reserved A Euromoney Institutional Investor company Page 23 of 48
government of f icial responsible f or gas and power inf rastructure told Reuters on Monday
May 31 2016 Polish Gas Companies Eyeing Direct LNG Supplies PNB - Economic Review
In less than 20 days the f irst commercial LNG shipment f rom Qatar will arrive at the Swinoujscie terminal This opens up new developmentpossibilit ies f or Polish gas producers traders and consumers PGNiG in pole posit ion The biggest benef iciary of the looming launch of theterminal is PGNiG
May 30 2016 Top news from Polish polit ics economy business amp f inancial markets - 1930 PAP Market Insider
Warszawa May 30 2016 (PAP) - Following is a digest of the days top news as compiled by PAP Market Insider BUSINESS amp EQUITYMARKET NEWS FOOD KERNEL - Listed edible oil producer Kernel Holding recorded a net attributable prof it of USD 923 mln in f iscal Q3 2016ended on March 31 the f irms consolidated f inancial report showed
May 30 2016 POLSKI KONCERN NAFTOWY ORLEN SA Agreements between ORLEN Capital Group and Glencore group
PAP Market InsiderWarszawa May 30 2016 (ESPI) - Current report No 1372016 Polski Koncern Naf towy ORLEN SA (PKN ORLEN) hereby inf orms that withinORLEN Capital Group there was concluded agreement with company f rom Glencore group
May 30 2016 PKN ORLEN SA Transact ions in PKN ORLEN f inancial instruments PAP Market Insider
concluded by the person in a close relationship with the President of the PKN ORLEN Management Board Warszawa
May 30 2016 Poland Press - Top Business Headlines PAP Market Insider
Warszawa May 30 2016 (PAP) - Following is a summary of the leading stories in the Polish press covering stocks and corporate news PAPdoes not verif y inf ormation contained in the Polish press BANKING CHF MORTGAGES - Polish banks prepared their own proposal f orproviding relief to the stressed CHF-mortgage borrowers
May 27 2016 PKN ORLEN SA Transact ions in PKN ORLEN f inancial instruments PAP Market Insider
concluded by the person in a close relationship with the President of the PKN ORLEN Management Board Warszawa
May 27 2016 Orlens Eurobonds Get Good Rat ings PNB - Polish News Bullet in
Fitch Ratings has conf irmed the BBB- long-term credit rating and stable outlook f or PKN Orlen The agency has also awarded the same ratingto the eurobonds to be issued by the Plock-based oil concern though on an interim basis Meanwhile Moodys gave the bonds an interimBaa3 rating PKN Orlen disclosed on Wednesday
May 24 2016 POLSKI KONCERN NAFTOWY ORLEN SA Ship-Service - has purchased bonds issued by PKN ORLEN
PAP Market InsiderWarszawa May 24 2016 (ESPI) - Current report No 1292016 Polski Koncern Naf towy ORLEN SA (PKN ORLEN) hereby inf orms that inorder to optimise the management of f inancial liquidity within the ORLEN Capital Group on 24 May 2016 PKN ORLEN issued short term bondsto its subsidiary Ship-Service SA (Ship-Service)
May 24 2016 PKN ORLEN SA PKN ORLENs subsidiary - ORLEN Upstream - has purchased bonds issued by PKN ORLEN
PAP Market InsiderWarszawa May 24 2016 (ESPI) - Current report No 1282016 Regulatory announcement no 1282016 dated 24 May 2016Polski KoncernNaf towy ORLEN SA
May 24 2016 PKN ORLEN SA Transact ions in PKN ORLEN f inancial instruments PAP Market Insider
concluded by the person in a close relationship with the President of the PKN ORLEN Management Board Warszawa
May 24 2016 PGNiG Granted Concession on Norwegian Shelf PNB - Economic Review
Piotr Wozniak president of PGNiG announced that the f irms subsidiary PGNiG Upstream International had acquired a stake in anexploratory concession located in Norway on the Barents Sea shelf
May 23 2016 PKN ORLEN SA Transact ions in PKN ORLEN f inancial instruments PAP Market Insider
concluded by the person in a close relationship with the President of the PKN ORLEN Management Board Warszawa
May 23 2016 INBRIEF PNB - Polish News Bullet in
According to Monetary Policy Council (RPP) member Eugeniusz Gatnar the data published in April signals that the economy is developing healso assesses the current level of interest rates as optimal
May 20 2016 Top news from Polish polit ics economy business amp f inancial markets - 1930 PAP Market Insider
Warszawa May 20 2016 (PAP) - Following is a digest of the days top news as compiled by PAP Market Insider BUSINESS amp EQUITY
EMIS Business Report Generated on 2016-06-02
Copyright copy 2015 EMIS all rights reserved A Euromoney Institutional Investor company Page 24 of 48
MARKET NEWS INSURANCE PZU - Listed insurer PZU will recommend shareholders take PLN 208 per share in dividends f rom 2015 prof itsin a total payout of PLN 1796 bln management said in a market f iling
May 20 2016 Top news from Polish polit ics economy business amp f inancial markets - 1630 PAP Market Insider
Warszawa May 20 2016 (PAP) - Following is a digest of the days top news as compiled by PAP Market Insider
May 20 2016 PKN ORLEN SA Transact ions in PKN ORLEN f inancial instruments PAP Market Insider
concluded by the person in a close relationship with the President of the PKN ORLEN Management Board Warszawa
May 20 2016 Thousands of Polish companies operat ing in Germany BBJ - Regional Today
Over 1700 commercial companies with Polish capital operate in Germany according to a new report by the German Chamber of Industry andCommerce (AHK) cited by the Deutsche Welle Polish businessmen perceive Germany as an attractive country in terms of investmentopportunit ies the chamber said
May 20 2016 Thousands of Polish companies operat ing in Germany BBJ - Regional Today
Over 1700 commercial companies with Polish capital operate in Germany according to a new report by the German Chamber of Industry andCommerce (AHK) cited by the Deutsche Welle Polish businessmen perceive Germany as an attractive country in terms of investmentopportunit ies the chamber said
May 20 2016 Treasury Expect ing State-Owned Firms to Pay Dividends PNB - Polish News Bullet in
The Treasury can count on some PLN500m to be paid in dividends by those state-owned companies which have already issuedrecommendations f or shareholders concerning the matter Jastrzebska Spolka Weglowa Lotos and PKP Cargo recommend not to pay adividend due to losses suf f ered in 2015
May 18 2016 Top news from Polish polit ics economy business amp f inancial markets - 1930 PAP Market Insider
Warszawa May 18 2016 (PAP) - Following is a digest of the days top news as compiled by PAP Market Insider
May 18 2016 Update Shareholder seeks PLN 35 DPS from PKN Orlen PAP Market Insider
Warsaw May 18 2016 (PAP) - Listed f uel f irm PKN Orlen saw its shareholder NN OFE seek a PLN 35 DPS f rom 2015 prof it and retainedprof its PKN said in a market f iling The pension f und wants the company to pay PLN 1048 bln f rom 2015 prof its and PLN 4495 mln f romretained prof its giving a total of PLN 1497 bln
May 18 2016 POLSKI KONCERN NAFTOWY ORLEN SA Nat ionale-Nederlanden OFE not if ied PAP Market Insider
draf t resolution of the OGM of PKN ORLEN regarding allocation of the prof it f or the f inancial year 2015 Warszawa May 18 2016 (ESPI) -Current report No 1232016 Polski Koncern Naf towy ORLEN Spolka Akcyjna (PKN ORLEN) hereby inf orms that Nationale-NederlandenOtwarty Fundusz Emerytalny (Nationale-Nederlanden OFE) pursuant to Art
May 18 2016 Shareholder seeks PLN 35 DPS from PKN Orlen PAP Market Insider
Warsaw May 18 2016 (PAP) - Listed f uel f irm PKN Orlen saw its shareholder NN OFE seek a PLN 35 DPS f rom 2015 prof it and retainedprof its PKN said in a market f iling The pension f und wants the company to pay PLN 1048 bln f rom 2015 prof its and PLN 4495 mln f romretained prof its giving a total of PLN 1497 bln
May 18 2016 Poland Press - Top Business Headlines PAP Market Insider
Warszawa May 18 2016 (PAP) - Following is a summary of the leading stories in the Polish press covering stocks and corporate news
May 18 2016 Poland Press - Top Business Headlines PAP Market Insider
Warszawa May 18 2016 (PAP) - Following is a summary of the leading stories in the Polish press covering stocks and corporate news
May 17 2016 Top news from Polish polit ics economy business amp f inancial markets - 1930 PAP Market Insider
Warszawa May 17 2016 (PAP) - Following is a digest of the days top news as compiled by PAP Market Insider
May 16 2016 Top news from Polish polit ics economy business amp f inancial markets - 2100 PAP Market Insider
Warszawa May 16 2016 (PAP) - Following is a digest of the days top news as compiled by PAP Market Insider
May 16 2016 PKN Orlen fuels plans eurobond issue by Orlen Capital unit by end-2016 PAP Market Insider
Warsaw May 16 2016 (PAP) - Listed f uel group PKN Orlen has secured its supervisory boards approval f or a eurobonds issue within theOrlen capital group the f im said in a market f iling
May 16 2016 POLSKI KONCERN NAFTOWY ORLEN SA PKN ORLEN Supervisory Board consent to Eurobonds issue
within the ORLEN Capital Group PAP Market Insider
EMIS Business Report Generated on 2016-06-02
Copyright copy 2015 EMIS all rights reserved A Euromoney Institutional Investor company Page 25 of 48
more raquo
Warszawa May 16 2016 (ESPI) - Current report No 1192016 Polski Koncern Naf towy ORLEN Spolka Akcyjna (PKN ORLEN) hereby inf ormsthat on 16 May 2016 the PKN ORLEN Supervisory Board gave consent to start the process leading to issue of Eurobonds within ORLENCapital Group
May 16 2016 StockWatch Grupa Azoty chemicals on dividend dates Comarch IT on prof it retent ion PAP Market Insider
Warszawa May 16 2016 (PAP) - Warsaw stocks are enjoying a rebound on Monday with the large-cap index WIG20 closing up by 21 Not asinlge blue-chip suf f ered any declines with the advancers led by copper group KGHM up 51 bank PKO BP up 33 and insurer PZU up29
May 16 2016 POLSKI KONCERN NAFTOWY ORLEN SA ORLEN Paliwa - has purchased bonds issued by PKN ORLEN
PAP Market InsiderWarszawa May 16 2016 (ESPI) - Current report No 1182016 Polski Koncern Naf towy ORLEN Spolka Akcyjna (PKN ORLEN) herebyannounces that in order to optimise the management of f inancial liquidity within the ORLEN Capital Group on 16 May 2016 PKN ORLENissued short term bonds to its subsidiary ORLEN Paliwa Sp z oo (ORLEN Paliwa)
May 16 2016 POLSKI KONCERN NAFTOWY ORLEN SA Anwil - has purchased bonds issued PAP Market Insider
by PKN ORLEN Regulatory announcement no 1172016 dated 16 May 2016 Warszawa May 16 2016 (ESPI) - Current report No 1172016Polski Koncern Naf towy ORLEN SA
May 16 2016 POLSKI KONCERN NAFTOWY ORLEN SA Transact ions in PKN ORLEN f inancial PAP Market Insider
instruments concluded by the person in a close relationship with the President of the PKN ORLEN Management Board Warszawa
May 13 2016 EMIS Energy Weekly Newslet ter Issue 87 EMIS Energy - Newslet ter
News amp Reports - Reports
July 28 2015 Erste Bank - Company Reports Updates PKN Orlen Erste Bank - Company Reports
May 18 2015 Erste Bank - Company Reports Updates PKN Orlen Erste Bank - Company Reports
September 13 2012 PKN Orlen mBank Analyt ical Report
April 17 2012 PKN Orlen Erste Bank - Company Analyses
November 17 2011 PKN_Orlen mBank Analyt ical Report
August 22 2011 PKN_Orlen mBank Analyt ical Report
June 17 2011 Company Report - CEE Oil amp Gas Erste Bank - Company Analyses
March 16 2011 PKN_Orlen mBank Analyt ical Report
December 03 2010 PKN_Orlen mBank Analyt ical Report
November 02 2010 PKN Orlen - 02112010 mBank Analyt ical Report
November 18 2009 Analyt ical Report - PKN Orlen - 18112009 mBank Analyt ical Report
September 16 2009 Analyt ical Report - PKN Orlen - 16092009 mBank Analyt ical Report
June 02 2009 Analyt ical Report - PKN Orlen - 02062009 mBank Analyt ical Report
February 27 2009 Analyt ical Report - PKN Orlen - 27022009 mBank Analyt ical Report
November 20 2008 Analyt ical Report - PKN Orlen - 20112008 mBank Analyt ical Report
September 17 2008 Analyt ical Report - PKN Orlen - 17092008 mBank Analyt ical Report
EMIS Business Report Generated on 2016-06-02
Copyright copy 2015 EMIS all rights reserved A Euromoney Institutional Investor company Page 26 of 48
more raquo
August 14 2008 Analyt ical Report - PKN Orlen - 14082008 mBank Analyt ical Report
June 04 2008 Analyt ical Report - PKN Orlen - 30052008 mBank Analyt ical Report
March 10 2008 Analyt ical Report - PKN Orlen - 10032008 mBank Analyt ical Report
February 21 2008 Analyt ical Report - PKN Orlen - 14022008 mBank Analyt ical Report
December 13 2007 Analyt ical Report - PKN Orlen - 04122007 mBank Analyt ical Report
August 21 2007 Analyt ical Report - PKN Orlen - 160807 mBank Analyt ical Report
July 02 2007 Analyt ical Report - PKN Orlen mBank Analyt ical Report
March 05 2007 Analyt ical Report - PKN Orlen mBank Analyt ical Report
August 24 2006 Analyt ical Report - PKN Orlen mBank Analyt ical Report
EMIS Business Report Generated on 2016-06-02
Copyright copy 2015 EMIS all rights reserved A Euromoney Institutional Investor company Page 27 of 48
MampA and ECM Deals - EMIS DealWatch Deals
DAT ECOUNT RY
OFT ARGET
T ARGET COMPANYDEALT YPE
BUYER SELLER DEAL INDUST RIESDEAL
VALUEUSD (MN)
ST AKE
20-Jan-16CzechRepublic
68 petrol stations of OMV Acquisition PKN Orlen SA OMV AG Gasoline Stations NA 100
16-Nov-15 Poland Assets of Euronaft Trzebinia Acquisition PKP Cargo SA PKN Orlen SASupport Activities forTransportation RailTransportation
1502 100
16-Nov-15 Poland Orlen Transport SA Acquisition Trans Polonia SA PKN Orlen SA Truck Transportation 2137 100
21-Oct-15 Germany13 SUN petrol stations ofGermania Petrol
Acquisition PKN Orlen SAGermaniaPetrol GmbH
Gasoline Stations NA 100
13-Oct-15 Canada Kicking Horse Energy Inc Acquisition PKN Orlen SA NA Oil and Gas Extraction 22634 100
13-Oct-15UnitedStates
FX Energy Inc Acquisition PKN Orlen SA NAOil and Gas ExtractionAgriculture Forestry Fishingand Hunting
8310 100
24-Sep-15 PolandTwo concessions in theregions of Lesser Polandand Subcarpathia
Acquisition PKN Orlen SADEADeutscheErdoel AG
Oil and Gas Extraction NA 100
20-Aug-15CzechRepublicPoland
Orlen KolTrans Sp z oo Acquisition PKP Cargo SA PKN Orlen SA Rail Transportation 4860 9985
20-Jul-15 Poland Bieszczady ProjectJointventure
PKN Orlen SA PolskieGornictwo Naftowe iGazownictwo SA
NA Oil and Gas Extraction NA 100
03-Jul-14CzechRepublic
Ceska Rafinerska ASMinoritystakepurchase
PKN Orlen SA Eni SpA Petroleum Refineries 4100 32445
14-May-14 Poland Orlen Medica Acquisition PZU TFI SA PKN Orlen SAHealth Care and SocialAssistance
1380 100
14-May-14 Poland Prof Med Sp z oo Acquisition PZU SA PKN Orlen SAHealth Care and SocialAssistance
119 9645
08-May-14 CanadaBirchill Exploration LimitedPartnership
Acquisition PKN Orlen SA
Bregal -BirchillInvestmentsSarl
Oil and Gas Extraction 23366 100
07-Nov-13CzechRepublic
Ceska Rafinerska ASMinoritystakepurchase
PKN Orlen SARoyal DutchShell Plc
Petroleum Refineries 2720 1633
16-Sep-13 Canada TriOil Resources Ltd Acquisition PKN Orlen SA NA Crude Petroleum Extraction 17753 100
07-Dec-12 Poland Shale gas licenses Acquisition PKN Orlen SAExxonMobilPoland
Natural Gas Extraction NA 100
02-Nov-12 Poland Anwil SAMinoritystakepurchase
PKN Orlen SA NAPesticide Fertilizer andOther Agricultural ChemicalManufacturing
2364 473
20-Aug-12 Poland Petrolot Acquisition PKN Orlen SAPolskie LinieLotnicze LOTSA
Petroleum and PetroleumProducts MerchantWholesalers
9241 49
01-Jun-12 Poland Gas bottle assets Acquisition Gaspol SA PKN Orlen SA Nonstore Retailers NA 100
01-Aug-11 Poland Anwil SAMinoritystakepurchase
PKN Orlen SA Energa SAPesticide Fertilizer andOther Agricultural ChemicalManufacturing
2158 415
MampA and ECM Deals - EMIS DealWatch Intents
EMIS Business Report Generated on 2016-06-02
Copyright copy 2015 EMIS all rights reserved A Euromoney Institutional Investor company Page 28 of 48
DEALSIDE
INT ENTANNOUNCEMENT
T ARGETT ARGET
COUNT RYT ARGET INDUST RY
DEALT YPE
INVEST OR
Sell-side
13-Nov-15Orlen TransportSA
Poland Truck Transportation Acquisition Trans Polonia SA
Sell-side
23-Jul-15Czech railtransport unit ofPKN Orlen
CzechRepublic
Rail Transportation Acquisition NA
Buy-side
06-May-15 Fuel stationsAustriaGermanySwitzerland
Gasoline Stations Acquisition PKN Orlen SA
Sell-side
20-Oct-14Orlen KolTransSp z oo
Poland Rail Transportation Acquisition PKP Cargo SA
Buy-side
10-Jun-14Kicking HorseEnergy Inc
Canada Oil and Gas Extraction Acquisition PKN Orlen SA
Sell-side
29-May-14 ORLEN Lietuva Lithuania Petroleum Refineries Acquisition NA
Buy-side
05-Sep-13
BirchillExplorationLimitedPartnership
Canada Oil and Gas Extraction Acquisition PKN Orlen SA
Sell-side
23-Aug-13Medical centresin Plock andWloclawek
Poland Hospitals amp Health Care Acquisition NA
Buy-side
27-Jun-13 Fuel stationsCzechRepublicGermany
Gasoline Stations Acquisition PKN Orlen SA
Sell-side
25-Jul-12 Neste Polska Poland Other Gasoline Stations Acquisition Lotos SA PKN Orlen SA
Sell-side
01-Mar-12
OsrodekBadawczo-RozwojowyPrzemysluRafineryjnegoSA
PolandPetrochemical ManufacturingPetroleum Refineries
Privatization PKN Orlen SA Warter
Sell-side
20-Dec-11 Lotos SA Poland
Other Gasoline StationsGasoline Stations withConvenience Stores PetroleumRefineries Crude PetroleumExtraction
Privatizationthroughstockexchange
PKN Orlen SA Polskie Gornictwo Naftowe iGazownictwo SA
Buy-side
20-Jun-11Fuel stations inGermany
GermanyOther Gasoline StationsGasoline Stations withConvenience Stores
Acquisition PKN Orlen SA
Sell-side
02-May-11
Anwils fertilizerassets AnwilsPVC productionassets
PolandPoland
Plastics and Rubber ProductsManufacturing PesticideFertilizer and Other AgriculturalChemical Manufacturing
Acquisition ZA Pulawy
Sell-side
14-Mar-11Rafineria NaftyJedlicze
Poland Petroleum Refineries Privatization PKN Orlen SA
Sell-side
30-Nov-10 CeproCzechRepublic
Gasoline Stations BasicChemical ManufacturingPetroleum and Coal ProductsManufacturing
MergerEni SpA PKN Orlen SA Royal Dutch Shell PlcSlovnaft
Sell-side
02-Nov-10 Lotos SA PolandPetroleum and Coal ProductsManufacturing Oil and GasExtraction
Minoritystakepurchase
ExxonMobil Corp Gazprom Neft KulczykInvestments SA Magyar Olaj- Es Gazipari Nyrt(MOL) Mercuria Energy Group Ltd PKN Orlen SAPolskie Gornictwo Naftowe i Gazownictwo SA TNK-BP
Buy-side
16-Sep-10Gasolinestations
CzechRepublic
Gasoline Stations Acquisition PKN Orlen SA Unipetrol
EMIS Business Report Generated on 2016-06-02
Copyright copy 2015 EMIS all rights reserved A Euromoney Institutional Investor company Page 29 of 48
Buy-side
16-Sep-10Petrochemicalrefinery
CzechRepublic
Petroleum Refineries
AcquisitionMinoritystakepurchase
PKN Orlen SA
Sell-side
21-Jul-10Polkomtel Sp zoo
PolandWireless TelecommunicationsCarriers (except Satellite)
Acquisition Zygmunt Solorz-Zak - private investor
EMIS Business Report Generated on 2016-06-02
Copyright copy 2015 EMIS all rights reserved A Euromoney Institutional Investor company Page 30 of 48
Fiscal year 2014Companies in Industries 43
IndustryPetroleum Refineries
This company is scored higher thanonly 5266 of companies in theindustry which equates to B - BelowAverage Risk on the Financial Scale Expected
Participation inCustomers Credit
Fiscal year 2014Companies in Industries 43
IndustryPetroleum Refineries
Criteria Weight Score Final Score
I EMIS Benchmark Score 90 207 B Below Average Risk
SIZ E RANKING SCORE
Sales 1 10000
Assets 1 10000
Profit 41 698
Total Shareholders Equity 1 10000
Average Size 11 7675
GROWT H RANKING SCORE
Net Sales Growth Rate 11 7674
Inc Dec in Assets 20 5581
Inc Decin Net Income 24 4651
Increase (Decrease) in Equity 22 5116
Average Growt h 19 5756
PROFIT ABILIT Y RANKING SCORE
Net Income Net Sales 29 3488
Return On Assets 38 1395
Net Income Net Worth 39 1163
Average Prof it abilit y 35 2015
INDEBT EDNESS RANKING SCORE
Indebtedness 22 5116
Leverage 33 2558
Total Liabilities Sales 17 6279
Average Indebt edness 24 4651
II EMIS Trend Score 10 298 E Very High Risk
Scoring Range 1 - Improves 2 - Maintains (According to the tolerance margin) 3 - Deteriorate
EMIS Credit Analytics - Summary
EMIS Financial ScoreEMIS Financial Score was not affected by Conditions
EMIS Benchmark Score
B Below Average Risk
5266
EMIS Trend Score
E Very High Risk
PampL E
Balance Sheet C
Cash Flow E
EMIS Credit Quota
21112537Thousands (USD)
Average Ranking 21 in 43 companies
RELAT IVEST RENGT HS
RELAT IVEWEAKNESSES
Sales Net Income Sales
Sales Growth
Remarks
EMIS Trend Score is calculated based on the 2latest annual company financial statements
Remarks
Credit Quota Recommended was calculatedbased on the industry average customer type(customized) and Financial Score
EMIS Credit Analyt ics - EMIS Financial Score
EMIS Financial ScoreEMIS Financial Score was not affected by Conditions
EMIS Benchmark Score 5266
11
EMIS Business Report Generated on 2016-06-02
Copyright copy 2015 EMIS all rights reserved A Euromoney Institutional Investor company Page 31 of 48
100
PampL 2014 T OT AL
Sales Growth 3 3
Operating Profit Sales 3 3
Net Income Sales 3 3
T ot al PampL 300 300
BALANCE 2014 T OT AL
Days Receivables 2 2
Days Inventory 1 1
Current Ratio 3 3
Indebtness (Total AssetsTotal Liabilities) 3 3
Total Liabilities Sales 3 3
T ot al Balance 230 230
CASH FLOW 2014 T OT AL
Cash from Sales 3 3
Cash for Production 2 2
Cash for Operation 1 1
Net Operation Cash Generation (NOCG) 3 3
Free Cash Flow 3 3
Cash Flow After Financial Expenses 3 3
Cash Flow After Financial 3 3
Reduction in Debt 2 2
T ot al Cash Flow 267 267
III EMIS Financial Score 100 216 CC Above Average Risk
E D C CC B BB A AA
Business Scale
AA - Very Low RiskA - Low RiskBB - Moderate Low RiskB - Below Average RiskCC - Above Average RiskC - Moderate High RiskD - High RiskE - Very High Risk
E Very High Risk
C Moderate High Risk
E Very High Risk
EMIS Credit Analyt ics - EMIS Benchmark Score
EMIS Business Report Generated on 2016-06-02
Copyright copy 2015 EMIS all rights reserved A Euromoney Institutional Investor company Page 32 of 48
Fiscal year 2014Companies in Industries 43
IndustryPetroleum Refineries
SIZ E RANKING SCORE
Sales 1 10000
Assets 1 10000
Profit 41 698
Total Shareholders Equity 1 10000
Average Size 11 7675
GROWT H RANKING SCORE
Net Sales Growth Rate 11 7674
Inc Dec in Assets 20 5581
Inc Decin Net Income 24 4651
Increase (Decrease) in Equity 22 5116
Average Growt h 19 5756
PROFIT ABILIT Y RANKING SCORE
Net Income Net Sales 29 3488
Return On Assets 38 1395
Net Income Net Worth 39 1163
Average Prof it abilit y 35 2015
INDEBT EDNESS RANKING SCORE
Indebtedness 22 5116
Leverage 33 2558
Total Liabilities Sales 17 6279
Average Indebt edness 24 4651
Average Ranking 21
Fiscal year 2014Companies in Industries 43
IndustryPetroleum Refineries
EMIS Credit Quota(Score adjusted)
21112537Thousands (USD)
Participation in credit Financial Score
CC
EMIS Benchmark Score(Against Industry)
5266
EMIS Credit Analyt ics - EMIS Credit Quota
Key parameters af f ecting quota value
COMPANY INDICAT ORS VALUE INDUST RY MULT IPLIERS MAX CALCULAT ED CREDIT
Assets 1332259352 Suppliers Assets 2801 373173079
Net Worth 581261405 Suppliers Net worth 6383 371042677
Tangible Net Worth 604356752 Suppliers Tangible Net Worth 6383 385785372
Net Sales 3067917427 Suppliers Net Sales 1352 414818151
11
EMIS Business Report Generated on 2016-06-02
Copyright copy 2015 EMIS all rights reserved A Euromoney Institutional Investor company Page 33 of 48
Source EMIS Company Database
AVERAGE CREDIT
(BASED ON INDUSTRY)
319886918THOUSANDS (USD)
XEXPECT ED PART ICIPAT ION
(IN CUSTOMERS CREDIT)
11
FINANCIAL SCORE
CC
=
=
CALCULAT ED CREDIT
(AVERAGE X PARTICIPATION)
35187561THOUSANDS (USD)
X
QUOT A ADJUST MENT S
06
=CREDIT QUOT A
(ADJUSTED BY SCORE)
21112537THOUSANDS (USD)
Fiscal year 2014Companies in Industries 43
IndustryPetroleum Refineries
NIP 7740001454 Headquart ers T el +48 (24) 3650000
Cost of Goods Sold 3048984945 Suppliers Cost of Goods Sold 1363 415427048
Operating Profit -134323677 Suppliers Operating Profit -30832 000
Net Profit -165687728 Suppliers Net Profit -26041 000
SUPPLIERS 378193431 Net Sales 3067917427 Financial Liabilities Net Sales 002 715239
Assets 1332259352 Financial Liablities Assets 005 643434
FINANCIAL LIABILIT IES 000 Operating Cycle 1617 Operating Cycle 592663 501950211
Suppliers Turnover 1273 Suppliers Turnover 490503 415427048
AVERAGE CREDIT BASED ON INDUST RY 1121907398
Credit Quota Calculation
Score Multipliers
QUOT A ADJUST MENT S ACCORDING T O T HE FINAL SCORE FINANCIAL SCALE MULT IPLIERS
Expanded QuotaAA 2
A 15
Normal Quota BB 1
Reduced Quota
B 08
CC 06
C 04
No QuotaD 02
E 0
EMIS Credit Analyt ics - Conclusions
EMIS Business Report Generated on 2016-06-02
Copyright copy 2015 EMIS all rights reserved A Euromoney Institutional Investor company Page 34 of 48
Ul Chemikoacutew 7
09-411
Fax +48 (24) 3654040
Email zarzadorlenpl
RELAT IVE ST RENGT HS RANKING SCORE
Sales 1 100
Sales Growth 11 7674
EMIS Credit Quota(Score adjusted)
21112537Thousands (USD)
Participation in credit Financial Score
CC
Date 2016 June 2
Fiscal year 2014Companies in Industries 43
IndustryPetroleum Refineries
Polski Koncern Naftowy ORLEN SAEMIS Credit Analytics
EMIS Benchmark Score (Business Performance Score) is based on financial statements as of 2014 EMIS Benchmark Score of Polski Koncern Naf t owy ORLEN SA is
the result of comparing its financial results with that of 43 companies classified by EMIS Credit Analytics within Pet roleum Ref ineries industry
EMIS Benchmark Score(Against Industry)
5266Note Companies classified in Pet roleum Ref ineries are not necessarily direct competitors Please refer to Benchmark Ranking for complete details of the companies
classified within this industry
EMIS Benchmark Score is the result of the companys ranking within its industry in different financial ratios of Size Profitability Growth Indebtness Efficiency and Liquidity
Ratios In the result it is important to note
EMIS Benchmark Score contributes 90 to the Financial Score The other 10 is represented by evolution versus previous period of Profit amp Loss Balance Sheet and
Cash Flow Statement
EMIS T REND SCORE
Profit amp Loss E
Balance Sheet C
Cash Flow Statement E
EMIS Financial ScoreEMIS Financial Score was not affected by Conditions
Note The Financial Score is not deteriorated by Financial Conditions (see Parameters)
Based on the average credit quote of 11219074 in the Pet roleum Ref ineries industry an EMIS Financial Score of CC and an expected participation in the companyscredit of 11 the recommended credit quota is 740459Note The Financial Score is not deteriorated by Financial Conditions Based on the average credit quote of 11219074 in the Petroleum Refineries industry an EMISFinancial Score of CC and an expectedparticipation in the companys credit of 11 the recommended credit quota is 740459
Key parameters af f ecting quota value
EMIS Credit Analyt ics - Company vs Industry Key Stats
Company vs Industry - Key Stats
REPORTING DETAILS
11
EMIS Business Report Generated on 2016-06-02
Copyright copy 2015 EMIS all rights reserved A Euromoney Institutional Investor company Page 35 of 48
2014 2013 2012
Statement type Individual Individual Individual
Audited Non-Audited Non-Audited Non-Audited
Provider NotoriaMonitor B Fins NotoriaMonitor B Fins NotoriaMonitor B Fins
Companies in Industry 43 54 52
EMIS Benchmark Score 5266 6892 7170
Reporting Standard 197 197 197
Displaying units USD Thousands USD Thousands USD Thousands
SIZ E
2014 2014 2013 2012
AVERAGEINDUST RY
VALUE RANKING VALUE RANKING VALUE RANKING
Sales 915054 30679174 1 37904382 1 38981804 1
Assets 441712 13322594 1 17049137 1 16979933 1
Profit -47512 -1656877 41 58433 1 756549 1
Total Shareholders Equity 193824 5812614 1 9147078 1 9132469 1
Average Size Posit ion 11 1 1
GROWT H
2014 2014 2013 2012
AVERAGEINDUST RY
VALUE RANKING VALUE RANKING VALUE RANKING
Net Sales Growth Rate 2089 -575 11 -551 16 1190 12
Inc Dec In Assets 1610 -901 20 -243 22 -1039 30
Inc DecIn Net Income -406205 -340170 24 -9249 28 -078 17
Increase (Decrease) In Equity -0 77 -2601 22 -267 21 563 13
Average Growt h Posit ion 19 22 18
PROFIT ABILIT Y
2014 2014 2013 2012
AVERAGEINDUST RY
VALUE RANKING VALUE RANKING VALUE RANKING
Net Income Net Sales -519 -540 29 015 25 194 17
Return On Assets -1076 -1244 38 034 23 446 16
Net Income Net Worth -2451 -2850 39 064 36 828 28
Operational Profit Sales -439 -438 27 027 25 168 18
Average Prof it abilit y Posit ion 33 27 20
INDEBT EDNESS
2014 2014 2013 2012
AVERAGEINDUST RY
VALUE RANKING VALUE RANKING VALUE RANKING
Indebtedness 5612 5637 22 4635 21 4622 22
Leverage 12789 12920 33 8639 36 8593 40
Total Liabilities Sales 2709 2448 17 2085 17 2013 21
EMIS Business Report Generated on 2016-06-02
Copyright copy 2015 EMIS all rights reserved A Euromoney Institutional Investor company Page 36 of 48
Fiscal year 2014Companies in Industries 43
IndustryPetroleum Refineries
Current Liabilities Total Liabilities 6146 6279 7 7210 11 6768 11
Average Indebt edness Posit ion 20 21 24
EFFICIENCY
2014 2014 2013 2012
AVERAGEINDUST RY
VALUE RANKING VALUE RANKING VALUE RANKING
Days Receivables 23 24 8 24 10 24 6
Days Inventory 36 33 16 46 19 48 23
Suppliers Turnover 49 45 10 50 15 45 15
Operational Cycle 59 57 11 70 13 72 14
Average Ef f iciency Posit ion 11 14 15
LIQUIDIT Y
2014 2014 2013 2012
AVERAGEINDUST RY
VALUE RANKING VALUE RANKING VALUE RANKING
Current Ratio 128 132 19 142 21 157 22
Quick Ratio 132 132 19 142 21 157 22
Working Capital 42581 1486941 1 2418659 1 3019099 1
Average Liquidit y Posit ion 13 14 15
OT HERS
2014 2014 2013 2012
AVERAGEINDUST RY
VALUE RANKING VALUE RANKING VALUE RANKING
Gross Profit 0 76 062 31 491 34 614 33
Other Income -1926 -1852 32 64868 3 5153 6
Reduction In Debt 158 0 13 0 17 0 12
Average Ot hers Posit ion 25 18 17
EMIS Credit Analyt ics - Company vs Industry Balance Sheet
Company vs Industry - Balance Sheet
REPORTING DETAILS
2014 2013 2012
Statement type Individual Individual Individual
Audited Non-Audited Non-Audited Non-Audited
Provider NotoriaMonitor B Fins NotoriaMonitor B Fins NotoriaMonitor B Fins
Companies in Industry 43 54 52
EMIS Benchmark Score 5266 6892 7170
Reporting Standard 197 197 197
EMIS Business Report Generated on 2016-06-02
Copyright copy 2015 EMIS all rights reserved A Euromoney Institutional Investor company Page 37 of 48
CURRENT ASSET S 2014INDUST RY
2014COMPANY
2013INDUST RY
2013COMPANY
2012INDUST RY
2012COMPANY
V H V H V H V H V H V H
Cash And Banks 1003 11838 1034 6846 533 410 559 851 482 -4599 502 -5387
Short Term Investments 003 -404 000 NA 004 -7992 000 NA 018 457613 000 NA
Account Receivables (Trade) 1320 1670 1510 -915 1313 -821 1513 -380 1346 -1338 1534 005
Inventory 2075 -1109 2104 -2851 2710 -1100 2677 -841 2866 -1097 2852 -789
Deferred Assets 014 -1494 007 -4068 020 -2569 011 -3444 025 -385 017 16719
Current Assets 4413 1190 4656 -1101 4579 -900 4760 -533 4737 -1703 4906 -1431
FIXED ASSET
2014INDUST RY
2014COMPANY
2013INDUST RY
2013COMPANY
2012INDUST RY
2012COMPANY
V H V H V H V H V H V H
- Land And Properties 4838 1574 4846 -907 4853 -232 4850 065 4677 -1788 4701 -690
- Other Equipments 004 -262 000 NA 004 6983 000 NA 002 -1186 000 NA
Fixed Assets 4872 1626 4846 -907 4865 -275 4850 065 4710 -1737 4701 -690
Intangible Assets (Net) 202 823 150 -1458 217 -2685 160 -4312 279 -652 275 199
Investments 240 4117 265 2041 197 13125 200 21858 080 2964 061 5970
Deferred Assets 281 11870 082 15497 149 -2699 029 -4916 193 5695 056 -2566
Total Long Term Assets 5585 1962 5344 -720 5421 -302 5240 036 5263 -1044 5094 -625
T OT AL ASSET S
2014INDUST RY
2014COMPANY
2013INDUST RY
2013COMPANY
2012INDUST RY
2012COMPANY
V H V H V H V H V H V H
Total Assets 10000 1610 10000 -901 10000 -585 10000 -243 10000 -1368 10000 -1039
CURRENT LIABILIT Y
2014INDUST RY
2014COMPANY
2013INDUST RY
2013COMPANY
2012INDUST RY
2012COMPANY
V H V H V H V H V H V H
Suppliers 2801 1472 2839 -1163 2835 -082 2923 603 2691 -3100 2690 -2855
Other Short Term Liabilities 13741 2571 701 5233 12691 320 419 -676 11578 NA 438 NA
Total Current Liability 3449 2100 3540 -362 3309 -111 3342 424 3151 -1924 3128 -1691
LONG T ERM LIABILIT Y
2014INDUST RY
2014COMPANY
2013INDUST RY
2013COMPANY
2012INDUST RY
2012COMPANY
V H V H V H V H V H V H
Long Term Deferred Liabilities 839 -299 028 -299 1004 -2717 026 -2717 1298 NA 035 NA
Other Long Term Liabilities 2187 6238 2070 4861 1564 -1129 1267 -1525 1659 -3979 1459 -3665
Long Term Liabilities 2163 6134 2097 4757 1556 -1368 1293 -1553 1698 -3494 1494 -3513
T OT AL LIABILIT Y
2014INDUST RY
2014COMPANY
2013INDUST RY
2013COMPANY
2012INDUST RY
2012COMPANY
V H V H V H V H V H V H
Total Liabilities 5612 3390 5637 1066 4866 -551 4635 -215 4848 -2553 4622 -2383
EQUIT Y
2014INDUST RY
2014COMPANY
2013INDUST RY
2013COMPANY
2012INDUST RY
2012COMPANY
V H V H V H V H V H V H
EMIS Business Report Generated on 2016-06-02
Copyright copy 2015 EMIS all rights reserved A Euromoney Institutional Investor company Page 38 of 48
Fiscal year 2014Companies in Industries 43
IndustryPetroleum Refineries
Capital 212 3149 226 000 187 -325 206 000 182 -237 201 003
Other Reserves 11156 3618 263 000 9512 000 239 000 8955 -143 233 -2444
Equity Appreciation -178 -439428 -173 -142830 005 5496 -010 -47857 003 4198565 003 NA
Retained Earnings 3652 -439 3702 -2707 4435 -418 4618 -192 4357 -050 4594 1065
Minority Interest 5213 074 346 075 6008 -1233 312 -1231 6451 -1929 347 -1929
Total Net Worth 4388 -077 4363 -2601 5134 -618 5365 -267 5152 153 5378 563
T OT AL LIABILIT Y AND EQUIT Y
2014INDUST RY
2014COMPANY
2013INDUST RY
2013COMPANY
2012INDUST RY
2012COMPANY
V H V H V H V H V H V H
Total Liabilities And Net Worth 10000 1610 10000 -901 10000 -585 10000 -243 10000 -1368 10000 -1039
EMIS Credit Analyt ics - Company vs Industry Income Statement
Company vs Industry - Income Statement
REPORTING DETAILS
2014 2013 2012
Statement type Individual Individual Individual
Audited Non-Audited Non-Audited Non-Audited
Provider NotoriaMonitor B Fins NotoriaMonitor B Fins NotoriaMonitor B Fins
Companies in Industry 43 54 52
EMIS Benchmark Score 5266 6892 7170
Reporting Standard 197 197 197
OPERAT ING PROFIT
2014INDUST RY
2014COMPANY
2013INDUST RY
2013COMPANY
2012INDUST RY
2012COMPANY
V H V H V H V H V H V H
Sales 10000 2089 10000 -575 10000 -1145 10000 -551 10000 500 10000 1190
Cost Of Goods Sold 9924 2648 9938 -150 9485 -1062 9509 -427 9396 612 9386 1253
Gross Profit 0 76 -8210 062 -8814 515 -2441 491 -2451 604 -978 614 313
Administrative AndGeneral Expenses
149 3309 141 420 135 -905 127 -479 132 -638 126 379
Selling Expenses 2650 5320 364 095 2091 094 340 028 1835 1798 320 578
Operational Profit -439 -165868 -438 -163453 034 -8046 027 -8483 154 -2807 168 -206
NON OPERAT ING INCOME
2014INDUST RY
2014COMPANY
2013INDUST RY
2013COMPANY
2012INDUST RY
2012COMPANY
V H V H V H V H V H V H
Total Non-Operating Revenue 036 465 033 -2304 042 -6818 040 -6944 117 -4630 125 -4930
- Financial Revenue 036 465 033 -2304 042 -6818 040 -6944 117 -4630 125 -4930
Total Non-Operating Expenses 190 24437 176 20967 067 -2118 053 -3252 075 -6320 075 -5970
- Financial Expenses 190 24438 176 20967 067 -2119 053 -3252 075 -6320 075 -5970
Other Extraordinary Result 0 00 10000 000 NA -000 9992 000 NA -000 NA -000 NA
EMIS Business Report Generated on 2016-06-02
Copyright copy 2015 EMIS all rights reserved A Euromoney Institutional Investor company Page 39 of 48
Fiscal year 2014Companies in Industries 43
IndustryPetroleum Refineries
Profit Before Income Taxes -594 -909715 -580 -407834 008 -9639 014 -9402 196 -1306 217 -601
T AXES AND OT HERS
2014INDUST RY
2014COMPANY
2013INDUST RY
2013COMPANY
2012INDUST RY
2012COMPANY
V H V H V H V H V H V H
Extraordinary Income (Charges) 0 02 8819 005 4250 002 NA 004 NA 000 -10000 000 NA
Changes Due To Consolidation 027 -8018 002 -8023 162 -5086 008 -5086 292 -4973 014 -4977
Income Tax -0 74 -468549 -039 -72388 -002 7245 006 -8524 -006 -11275 038 -4155
NET PROFIT
2014INDUST RY
2014COMPANY
2013INDUST RY
2013COMPANY
2012INDUST RY
2012COMPANY
V H V H V H V H V H V H
Net Income -519 -406205 -540 -340170 016 -9342 015 -9249 213 544 194 -078
EMIS Credit Analyt ics - Company vs Industry Cash Flow
Company vs Industry - Cash Flow
REPORTING DETAILS
2014 2013 2012
Statement type Individual Individual Individual
Audited Non-Audited Non-Audited Non-Audited
Provider NotoriaMonitor B Fins NotoriaMonitor B Fins NotoriaMonitor B Fins
Companies in Industry 43 54 52
EMIS Benchmark Score 5266 6892 7170
Reporting Standard 197 197 197
CASH OPENING BALANCE
2014INDUST RY
2014COMPANY
2013INDUST RY
2013COMPANY
2012INDUST RY
2012COMPANY
V H V H V H V H V H V H
Initial Cash 222 410 267 851 257 -4599 232 -5387 422 9240 474 8565
CASH FROM SALES
2014INDUST RY
2014COMPANY
2013INDUST RY
2013COMPANY
2012INDUST RY
2012COMPANY
V H V H V H V H V H V H
Net Sales 10000 2089 10000 -575 10000 -1145 10000 -551 10000 500 10000 1190
+- Trade AccountsReceivable
-0 91 -28672 066 13160 059 -4685 027 779616 098 16969 -000 9978
Cash From Sales 9909 1908 10066 -539 10059 -1179 10027 -525 10098 763 10000 1377
CASH FOR PRODUCT ION
2014INDUST RY
2014COMPANY
2013INDUST RY
2013COMPANY
2012INDUST RY
2012COMPANY
V H V H V H V H V H V H
(-) Sales Cost -9924 -2648 -9938 150 -9485 1062 -9509 427 -9396 -612 -9386 -1253
(-) (Inc) Inventory 125 -1020 364 21062 168 -1077 111 -183 167 13866 106 12570
(+) (Inc) Suppliers 174 188875 -162 -30445 -012 9818 075 11510 -572 -26577 -468 -25767
EMIS Business Report Generated on 2016-06-02
Copyright copy 2015 EMIS all rights reserved A Euromoney Institutional Investor company Page 40 of 48
Cash For Production -9625 -2474 -9736 159 -9328 1572 -9324 962 -9801 -961 -9748 -1525
CASH FOR OPERAT ING
2014INDUST RY
2014COMPANY
2013INDUST RY
2013COMPANY
2012INDUST RY
2012COMPANY
V H V H V H V H V H V H
(-) Administrative Expenses -149 -3309 -141 -420 -135 905 -127 479 -132 638 -126 -379
+- Other Operating Results -0 00 -12524 000 NA 001 NA 000 NA 000 NA 000 NA
(-) Selling Expenses -2650 -5320 -364 -095 -2091 -094 -340 -028 -1835 -1798 -320 -578
(-) Period Income Taxes 074 468549 039 72388 002 -7245 -006 8524 006 11275 -038 4155
(+) (Inc) Taxes Payable 002 69344 000 NA -000 -14351 000 NA 001 17119 000 NA
(-) (Inc) Labor EstimatesAnd Provision
-0 12 9215 -000 9200 -189 -12719 -004 -12717 614 184104751 015 NA
Cash For Operation -2736 -3712 -466 794 -2413 -5873 -477 379 -1346 2282 -469 405
OPERAT IONAL CASHFLOW
2014INDUST RY
2014COMPANY
2013INDUST RY
2013COMPANY
2012INDUST RY
2012COMPANY
V H V H V H V H V H V H
Net Operating Cashflow -2453 -7631 -137 -15709 -1682 -4202 225 19816 -1049 1952 -217 -3750
INVEST MENT S IN ASSET S
2014INDUST RY
2014COMPANY
2013INDUST RY
2013COMPANY
2012INDUST RY
2012COMPANY
V H V H V H V H V H V H
(-) (Inc) Net Fixed Assets -329 -67408 210 151250 069 -8689 -014 -10872 468 25487 152 12255
(ndash) (Inc) Investments -0 34 2746 -020 7025 -056 -47405 -062 -48471 -009 -10215 -010 -10826
FREE CASHFLOW
2014INDUST RY
2014COMPANY
2013INDUST RY
2013COMPANY
2012INDUST RY
2012COMPANY
V H V H V H V H V H V H
Free Cashflow -2816 -10396 054 -6596 -1669 -15077 150 28813 -589 5095 -075 -33837
FINANCIAL
2014INDUST RY
2014COMPANY
2013INDUST RY
2013COMPANY
2012INDUST RY
2012COMPANY
V H V H V H V H V H V H
(-) Financial Expenses -154 -65083 -143 -92333 -025 -15241 -013 -12496 042 20392 050 -1713
Cashflow After Financial Costs -2969 -11196 -089 -16127 -1694 -17395 136 60823 -547 5391 -025 -12770
(+) (Inc) Debt Short Term -000 9949 000 NA -000 -21237 000 NA 000 10091 000 NA
(+) (Inc) Debt Long Term 002 69344 000 NA -000 -14351 000 NA 001 17119 000 NA
Cashflow After FinancialExpenses
-2968 -11175 -089 -16127 -1694 -17455 136 60823 -546 5512 -025 -12770
CASHFLOW
2014INDUST RY
2014COMPANY
2013INDUST RY
2013COMPANY
2012INDUST RY
2012COMPANY
V H V H V H V H V H V H
(-) Dividends 503 42726 -126 -4528 -186 682 -082 -1139 -176 -73580 -069 -52834
(-) Other Expenses 002 8819 005 4250 002 NA 004 NA 000 -10000 000 NA
(-) Other Current Debtors 000 NA 000 NA 000 NA 000 NA 000 NA 000 NA
(-) Other Current Assets 002 -7807 002 -2258 011 361835 003 15505 000 10702 -005 -48602
(-) Long-Term AccountsReceivable
000 NA 000 NA 000 NA 000 NA 000 NA 000 NA
EMIS Business Report Generated on 2016-06-02
Copyright copy 2015 EMIS all rights reserved A Euromoney Institutional Investor company Page 41 of 48
(-)(Inc) Deferred And OtherLong Term Assets
-0 72 -37515 -022 -26027 032 11570 013 4240 -178 -88060 008 14351
(-) (Inc) Other Long TermLiabilities
406 56718 294 37011 -105 8205 -103 7364 -518 -37893 -368 -40951
(+) Inflation Adjustmentst Non Recurring Incomes
000 NA 000 NA 000 NA 000 NA 000 NA 000 NA
(+) (Inc) Other AccountsPayable
115 218744 105 82115 -007 -10274 -014 -10676 216 2710149 191 NA
(+) Extraordinary Income Consolidation
027 -8018 002 -8023 162 -5085 008 -5057 292 -4974 014 -5006
(-) Intangible Goods -007 -12244 011 -8077 040 29906 055 230557 009 12060 -002 8712
Complementary Cash-Flow 976 240248 271 31907 -051 8725 -117 5210 -356 -14616 -230 -28078
Net Cash Generation -1992 -3796 183 77289 -1745 -7131 020 10729 -902 -10194 -255 -21675
Ending Cash -1770 -4381 449 6846 -1488 -17434 251 851 -480 -11112 219 -5387
EMIS Business Report Generated on 2016-06-02
Copyright copy 2015 EMIS all rights reserved A Euromoney Institutional Investor company Page 42 of 48
Score Scale
Financial ScaleFinancial Model has 8 risk categories
A - Very Low RiskAA - Low RiskBB - Moderate Low RiskB - Below Average RiskCC - Above Average RiskC - Moderate High RiskD - High Risk E - Very High Risk
Risk Profile
High RiskHigh Risk - used when the loan amounts are relatively high and have a longrepayment period A loss in the Credit would seriously affect the companyresults Commercial credit with maturity exceeding 36 months
A loss in the Credit would seriously affect the results Bank credited to morethan 36 months
Vertical Weighting
Pampl
Sales Growth 12
Operating Profit 12
Net Profit 12
Sub t ot al 36
Balance
Days Receivables 12
Days Inventory 10
Current Ratio 8
Indebtness 8
Indebtednesssales 8
Balance Sub T ot al 46
Cash Flow
Cash From Sales 2
Cash For Production 2
Cash For Operations 2
Operating Cash Generation 5
Free Cash Flow 3
Cash Flow After Fin Ex 2
Cash Flow After Fin Result 2
Reduction In Debt 0
Cash Flow Sub T ot al 18
Total Vertical Weights 100
Tolerance Margin 5
Financial Conditions
Condit ions Score
Negative Net Worth CC
Final Weighting
EMIS Benchmark Score 90
EMIS Trend Score 10
EMIS Credit Analyt ics - EMIS Credit Analyt ics Assumptions
EMIS Business Report Generated on 2016-06-02
Copyright copy 2015 EMIS all rights reserved A Euromoney Institutional Investor company Page 43 of 48
Ret urn on Asset s (ROA)
An indicator of how profitable a company is relative to its total assets ROA gives an
idea as to how efficient management is at using its assets to generate earnings
Calculated by dividing a companys annual earnings by its total assets
Calculated as Net prof it T ot al Asset
Ret urn on Equit y (ROE)
A measure of a corporations profitability that reveals how much profit a company
generates with the money shareholders have invested
Calculated as Net prof it Shareholders equit y
Ret urn on Sales (ROS)
A ratio widely used to evaluate a companys operational efficiency ROS is also
known as a firms operating profit margin
Calculated as Net Prof it Net Sales Revenue
Bookvalue
A companys common stock equity as it appears on a balance sheet equal to total
assets minus liabilities preferred stock and intangible assets such as goodwill
Current Rat io
A liquidity ratio that measures a companys ability to pay short-term obligations
Calculated as Current Asset sCurrent Liabilit ies
Quick rat io
An indicator of a companys short-term liquidity The quick ratio measures a
companys ability to meet its short-term obligations with its most liquid assets The
higher the quick ratio the better the position of the company
Calculated as (Current Asset s-Invent ories)Current Liabilit ies
Debt t o equit y
A measure of a companys financial leverage calculated by dividing its total
liabilities by stockholders equity It indicates what proportion of equity and debt the
company is using to finance its assets
Calculated as T ot al Liabilit iesShareholders Equit y
Debt t o t ot al asset s
A metric used to measure a companys financial risk by determining how much of
the companys assets have been financed by debt Calculated by adding short-term
and long-term debt and then dividing by the companys total assets
Calculated as Short T erm Debt s+Long T erm Debt sT ot al Asset s
Leverage rat io
Leverage ratio provide an indication of the long term solvency of the firm
Calculated as T ot al Asset sShareholders Equit y
Debt Ent erprise Value
This metric is equivalent to the payback period used by debtholders Calculated as
Debt Ent erprise Value
Market Capit alizat ionEBIT DA
Calculated as Market Capit alizat ionEBIT DA
Earning Bef ore Int erest s and T axes (EBIT )
Earning Before Interests and Taxes (EBIT)
EBIT DA
Earnings before interest taxes depreciation and amortization (EBITDA) is a non-
GAAP metric that can be used to evaluate a companys profitability Calculated as
Ent erprise valueNet Sales
Dividing the enterprise value of a firm by its sales or revenues is a way of
comparing firms in cyclical industries Calculated as Enterprise Value Net Sales
Revenue
Ent erprise valueGross income
Calculated as Enterprise value Gross income
Ent erprise valueT ot al Asset s
Calculated as Enterprise value Total Assets
EBIT DA Margin
A measurement that provides a clear view of the companyrsquos core profitability
Calculated as EBITDA Net Sales Revenue
T ot al Operat ing Revenue T rend
Calculated as Total Operating Revenue current year Total Operating Revenue
previous year
Gross Prof it T rend
Calculated in percentage as (Gross Prof it Current Year Gross Prof it
Previous Year) ndash 1
EBIT DA T rend
Calculated as EBITDA current year EBITDA previous year
Account s Receivables T rend
Calculated in percentage as T rade Account s Receivables current year
T rade Account Receivables previous year
Invent ory T rend
Calculated as Inventories current year Inventories previous year
Net Propert y Plant and Equipment (PPampE) T rend
Calculated as Net PPampE current year Net PPampE previous year
T ot al Asset s T rend
Calculated as Total Assets current year Total Assets previous year
Bookvalue T rend
Calculated as Bookvalue current year Bookvalue previous year
Shareholders Equit y T rend
Calculated as Shareholdersrsquo Equity current year Shareholdersrsquo Equity previous
year
Cash f rom Operat ions T rend
Calculated as Net Cash Flow from Operations current year Net Cash Flow from
Operations previous year
Capit al Expendit ures T rend
Calculated as CAPEX current year CAPEX previous year
Dividend per Share T rend
Calculated as Dividend value per (common) share current year Dividend value
per (common) share previous year
Cost t o Income Rat io
A key financial measure showing a bankrsquos cost in relation to its income Ratio is
calculated as Total Operational Cost Total Operational Income
Glossary
EMIS Business Report Generated on 2016-06-02
Copyright copy 2015 EMIS all rights reserved A Euromoney Institutional Investor company Page 44 of 48
EBIT DA = Operat ing Revenue - Operat ing Expenses (Depriciat ion and
Amort izat ion excluded)
Ent erprise Value EBIT DA
Enterprise Value EBITDA is the metric most used to measure how many years it
would take to pay back the investment
Ent erprise Value
A measure of a companys value often used as an alternative to straightforward
market capitalization EV is calculated as market cap plus debt minority interest
and preferred shares minus total cash and cash equivalents
Dooms day rat io
Calculated as Cash Current Liabilit ies
Long T erm Debt t o Capit al
A ratio showing the financial leverage of a firm calculated by dividing long-term
debt by the amount of capital available Calculated as Long t erm debt Long
t erm debt + Pref f ered St ock + Common St ock
Int erest Coverage Rat io
A ratio used to determine how easily a company can pay interest on outstanding
debt The interest coverage ratio is calculated by dividing a companys earnings
before interest and taxes (EBIT) of one period by the companys interest expenses of
the same period Calculated as EBIT Int erest expense
Cash Flow t o Debt
This coverage ratio compares a companys operating cash flow to its total debt
which for purposes of this ratio is defined as the sum of short-term borrowings the
current portion of long-term debt and long-term debt This ratio provides an
indication of a companys ability to cover total debt with its yearly cash flow from
operations The higher the percentage ratio the better the companys ability to carry
its total debt Calculates as Operat ing Cash Flow T ot al Debt
Ret urn on Capit al
A ratio that indicates the efficiency and profitability of a companys capital
investments Calculated as Net Income (Total Asset - Current Liabilities)
Gross Prof it Margin
A financial metric used to assess a firms financial health by revealing the
proportion of money left over from revenues after accounting for the cost of goods
sold Gross profit margin serves as the source for paying additional expenses and
future savings Calculated as (Net Sales Revenue - Cost of Goods Sold) Net
Sales Revenue
Operat ing Prof it Margin
A ratio used to measure a companys pricing strategy and operating efficiency
Calculated as Operat ing prof it Net sales
Account s Receivable T urnover
An accounting measure used to quantify a firms effectiveness in extending credit
as well as collecting debts The receivables turnover ratio is an activity ratio
measuring how efficiently a firm uses its assets Calculated as Net Sales
Revenue T rade Account s Receivable (Net )
Invent ory T urnover
A ratio showing how many times a companys inventory is sold and replaced over a
period Calculated as Sales Invent ory
Current asset t urnover
Calculated as Net Sales Revenue T ot al Current Asset
Ef f iciency Rat io
Calculated as Total non-interest expenses (Total net interest income + Total non-
interest income)
Loans t o Deposit s Rat io
A commonly used statistic for assessing a banks liquidity Calculated as Total
Loans Total Deposits
Liquid Asset s t o Deposit s Rat io
This ratio indicates extent of liquidity maintained by a bank for meeting the demand
made by the depositors Calculated as (Cash + Financial assets held for trading)
Total Deposits
Loans t o Asset Rat io
Calculated as Total Loans Total Assets
Net Int erest Income T rend
Calculated as Net Interest Income current year Net Interest Income previous year
Net Fee and Commission Income T rend
Calculated as Net Fee and Commission Income current year Net Fee and
Commission Income previous year
Loans and Advances t o Cust omers T rend
Calculated as Loans and Advances to Customers current year Loans and
Advances to Customers previous year
Deposit s f rom Cust omers T rend
Calculated as Deposits from Customers current year Deposits from Customers
previous year
Loss Rat io
This ratio indicates the average cost of insurance protection per each dollar of net
premiums earned during the period Calculated as Total Losses Incurred in Claims
Net Insurance Premium Revenue
Underwrit ing Expenses Rat io
This ratio measures operational efficiency in underwriting Calculated as
Underwriting expenses Net Insurance Premium Revenue
Policyholder Dividend Rat io
Calculated as Dividends Net Insurance Premium Revenue
Combined LossExpense Rat io
Calculated as Loss Ratio + Underwriting Expenses Ratio + Policyholder Dividend
Ratio When the combined ratio is under 100 underwriting results are
considered profitable when the combined ratio is over 100 underwriting results
are considered unprofitable
Ceded Premium Rat io
Calculated as Insurance Premium Ceded to Reinsurers Insurance Premium
Revenue
Net Premiums Earned T rend
Calculated as Net Insurance Premium Revenue current year Net Insurance
Premium Revenue previous year
Fees and Commissions T rend
Calculated as Net Fees and Commissions Income current year Net Fees and
Commissions Income previous year
Net Invest ment Income T rend
EMIS Business Report Generated on 2016-06-02
Copyright copy 2015 EMIS all rights reserved A Euromoney Institutional Investor company Page 45 of 48
Fixed-asset t urnover
This ratio is a rough measure of the productivity of a companys fixed assets
(property plant and equipment or PPampE) with respect to generating sales For most
companies their investment in fixed assets represents the single largest
component of their total assets This annual turnover ratio is designed to reflect a
companys efficiency in managing these significant assets Simply put the higher
the yearly turnover rate the better Calculated as Revenue Propert y Plant and
Equipment
Asset T urnover
The amount of sales generated for every dollars worth of assets It is calculated by
dividing sales in dollars by assets in dollars Calculated as Revenue Asset s
Revenue T rend
Calculated as (Net Sales Current Year Net Sales Previous Year)
Net Income T rend
Calculated as (Net Income Current Year Net Income Previous Year)
Operat ing Income T rend
Calculated as (Operat ing Income Current Year Operat ing Income
Previous year)
PriceBook Rat io
A ratio used to compare a stocks market value to its book value It is calculated by
dividing the current closing price of the stock by the latest years book value per
share Calculated as St ock price (T ot al Asset - Int angible asset s and
Liabilit ies)
PriceEarnings Rat io
A valuation ratio of a companys current share price compared to its per-share
earnings Calculated as Market value per share Earning per share EPS
Market capShareholder equit y
A financial ratio showing the premium which is included in the current market price
compared to the actual value of Shareholder equity of the company Calculated as
Market capit alizat ion Shareholders equit y
PriceEBIT Rat io
The PriceEBIT ratio is a market value indicator similar to the PE ratio which shows
the number of times the market price exceeds the earnings per share before the
effects of gross interest abnormal items and tax The PriceEBIT ratio is calculated
as follows Valuat ion price EBIT
T ot al Capit al Rat io
Calculated as T ot al capit al (T ier 1 and T ier 2) rat io = T ot al capit al (T ier 1
and T ier 2) Risk-adjust ed asset s
T ier 1 Rat io
Tier 1 capital is the core measure of a banks financial strength from a regulators
point of view It consists primarily of shareholders equity but may also include
preferred stock that is irredeemable and non-cumulative and retained earnings
Risk Weight ed Asset s
Risk weights are in five categories from zero to 100 per cent Those carrying a
zero weight include notes and coins gold matched by gold liabilities balances with
the Reserve Bank and commonwealth government securities with less than twelve
months to maturity Commonwealth government securities with more than twelve
months to maturity carry a 10 per cent risk weighting as do state government
securities Claims on other banks Australian local governments and public-sector
organisations other than those with corporate status or which operate
Calculated as Investment Income current year Investment Income previous year
Receivables Arising Out Of Direct Insurance Operat ions T rend
Calculated as Receivables Arising out of Direct Insurance Operations current year
Receivables Arising out of Direct Insurance Operations previous year
Operat ing ROA
An indicator that shows the type of net profit which is actually generated by business
effort Calculated as Operat ing Prof it (EBIT ) T ot al Asset s
Payables T urnover
An indicator that evaluates how fast a company pays off its creditors (suppliers)
Calculated as Purchases T rade Payables
Working Capit al T urnover
A measure that indicates how efficiently the company generates revenue with its
working capital Working capital is defined as current assets minus current liabilities
Calculated as Net Sales (T ot al Current Asset s ndash T ot al Current
Liabilit ies)
Working Capit al
A measure of a companyrsquos short term financial health Calculated as T ot al
Current Asset s ndash T ot al Current Liabilit ies
Cash Rat io
A measure of a companyrsquos liquidity in crisis situation Only highly marketable
securities and cash are included Calculated as (T ot al Cash and Cash
Equivalent s + Market able securit ies) T ot al Current Liabilit ies
Cash Flow f rom Operat ion Rat io
A measure of how well current liabilities are covered by the cash flow generated
from a companyrsquos operations Calculated as Net Cash Flow f rom Operat ing
Act ivit ies T ot al Current Liabilit ies
Debt Coverage
A measure that shows a companyrsquos ability to cover total debt with its yearly cash
flow from operations Calculated as Net Cash Flow f rom Operat ing Act ivit ies
T ot al Debt
Cash Flow t o Revenue
This ratio measures the amount of operating cash flow generated for each dollar of
revenue Calculated as Net Cash Flow f rom Operat ing Act ivit ies Net Sales
Revenue
Cash Ret urn on Asset s
This ratio measures the return of operating cash flow attributed to all providers of
capital Calculated as Net Cash Flow f rom Operat ing Act ivit ies T ot al
Asset s
Cash Ret urn on Equit y
This ratio measures the return of operating cash flow attributed to shareholders
Calculated as Net Cash Flow f rom Operat ing Act ivit ies T ot al
Shareholdersrsquo Equit y
Cash t o Income
This ratio measures the ability to generate cash from companyrsquos operations
Calculated as Net Cash Flow f rom Operat ing Act ivit ies Operat ing Prof it
(EBIT )
CashT ot al Asset s
Calculated as Cash and Cash Equivalent s T ot al Asset s
EMIS Business Report Generated on 2016-06-02
Copyright copy 2015 EMIS all rights reserved A Euromoney Institutional Investor company Page 46 of 48
commercially carry a 20 per cent risk weighting Loans secured by a mortgage
over residential property and with a loan-to-valuation of 80 per cent or less carry a
50 per cent risk weighting and loans to companies or individuals carry a 100 per
cent risk weighting
Market Cap Net cash
A ratio measure the market value of the company to the Net cash position of the
company Calculated as Market capit alizat ion (Cash and cash equivalent s
minus long-t erm debt )
Net Cash
Net cash is commonly used in evaluating a companys cash flow More generally
net cash can refer to the amount of cash remaining after a transaction has been
completed and all charges and deductions related to the transaction have been
subtracted Calculated as T ot al cash minus t ot al short t erm liabilit ies
Annualised Ret urn on Equit y (ROE)
Return on Equity ratio (ROE) converted into an annual basis
Annualised Ret urn on Asset s (ROA)
Return on Assets ratio (ROA) converted into an annual basis
Export Proport ion Rat io
The percentage figure of the proportion of the export revenue from the total sales
revenue of the company Calculated as Export revenue T ot al revenue
Net Debt
A metric that shows companys overall debt situation by netting the value of
financial liabilities with its cash and other similar liquid assets Calculated as
financial liabilities - cash and cash equivalents
EPS
The portion of a companys profit allocated to each outstanding share Calculated
as Net Profit Outstanding Shares
PE
A valuation ratio of a companys current share price compared to its per-share
earnings Calculated as Market value per share Earning per share EPS
Market Capit alizat ionNet Sales
Calculated as Market Capitalization Net Sales Revenue
Market Capit alizat ionGross income
Calculated as Market Capitalization Gross Profit
Market Capit alizat ionEBIT
Calculated as Market Capitalization EBIT
Market Capit alizat ionT ot al Asset s
Calculated as Market Capitalization Total Assets
ReceivablesT ot al asset s
Calculated as T rade Account s Receivable T ot al Asset s
Invent oriesT ot al asset s
Calculated as Invent ories T ot al Asset s
Fixed asset sT ot al asset s
Calculated as Non-current Asset s T ot al Asset s
Current Liabilit iesT ot al Liabilit ies
Calculated as T ot al Current Liabilit ies T ot al Liabilit ies
Salaries and Employee Benef it sNet sales
Calculated as Employee Benef it Expenses Net Sales Revenue
Administ rat ive ExpensesNet Sales
Calculated as Administ rat ive Expenses Net Sales Revenue
Depreciat ion and Amort izat ionNet sales
Calculated as Depreciat ion Amort izat ion and Impairment Charges Net
Sales Revenue
Int erest paidNet sales
Calculated as Int erest -t ype Expenses Net Sales Revenue
Income t axNet sales
Calculated as Income T ax Net Sales Revenue
Operat ing Cash Flow t o T ot al Cash Flow
Calculated as Net Cash Flow f rom Operat ing Act ivit ies Net
IncreaseDecrease in Cash and Cash Equivalent s
Cash Flow f rom Invest ing t o T ot al Cash Flow
Calculated as Net cash f low f rom (used in) invest ing act ivit ies Net
IncreaseDecrease in Cash and Cash Equivalent s
Cash f low f rom f inancing t o T ot al cash f low
Calculated as Net cash flow from (used in) financing activities Net
IncreaseDecrease in Cash and Cash Equivalents
Average Yie ld on Asset s
Calculated as T ot al Int erest Income T ot al Asset s
Disclaimer
Whilst EMIS attempts at all times to ensure the accuracy and reliability of the information it provides due to the vast quantity of processed data and the fact that some of
the third-party data cannot always be verified including information provided directly by the subject of the enquiry EMIS does not guarantee the correctness or the
effective delivery of the information and shall not be held responsible for any errors or omissions therein
The content and recommendations shall only be used as a reference in business decisions of EMIS clients and shall not be used for any other purposes EMIS and its
affiliates shall not be held liable for any loss of the clients arising out of its own business decisions whether or not the making of such decision has been referred to this
contentrecommendation
EMIS Business Report Generated on 2016-06-02
Copyright copy 2015 EMIS all rights reserved A Euromoney Institutional Investor company Page 47 of 48
EMIS Business Report Generated on 2016-06-02
Copyright copy 2015 EMIS all rights reserved A Euromoney Institutional Investor company Page 48 of 48
- Table of Contents
- Company Tear Sheet
-
- Contact Information
- NAICS Industry Classification
- Business description
- Basic Information
- EMIS Financial Score
- Share Price information
- Key Executives
- Ownership Details
- Subsidiaries and Affiliates
- Key Financial Highlights
- Financial Performance Charts
- Latest MampA and ECM Deals
- Top Competitors
-
- Financial Statements
-
- Annual Statements
- Interim Statements
- Ratios
- Multiples
-
- Company Documents
-
- Financial DocumentsAnnual Reports
- Corporate Actions
-
- News amp Reports
-
- News
- Reports
-
- MampA and ECM Deals
-
- EMIS DealWatch Deals
- EMIS DealWatch Intents
-
- EMIS Credit Analytics
-
- Summary
- EMIS Financial Score
- EMIS Benchmark Score
- EMIS Credit Quota
- Conclusions
- Company vs Industry Key Stats
- Company vs Industry Balance Sheet
- Company vs Industry Income Statement
- Company vs Industry Cash Flow
- EMIS Credit Analytics Assumptions
-
- Glossary
- Disclaimer
-
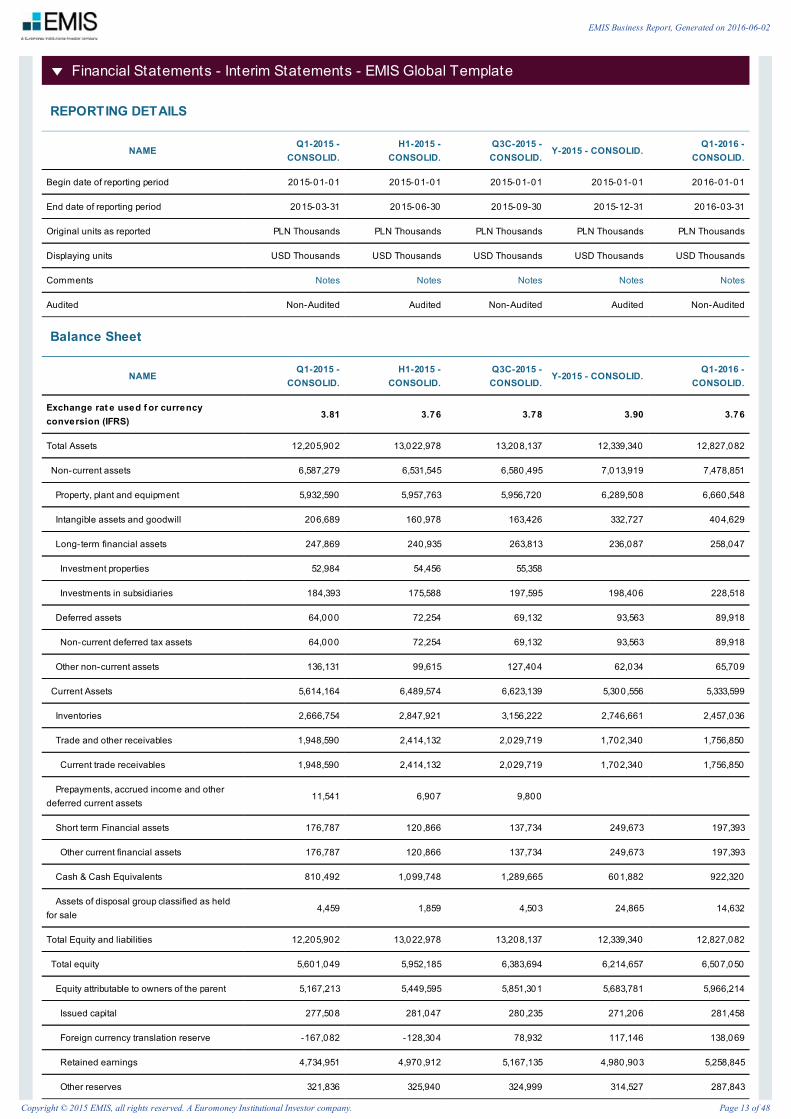
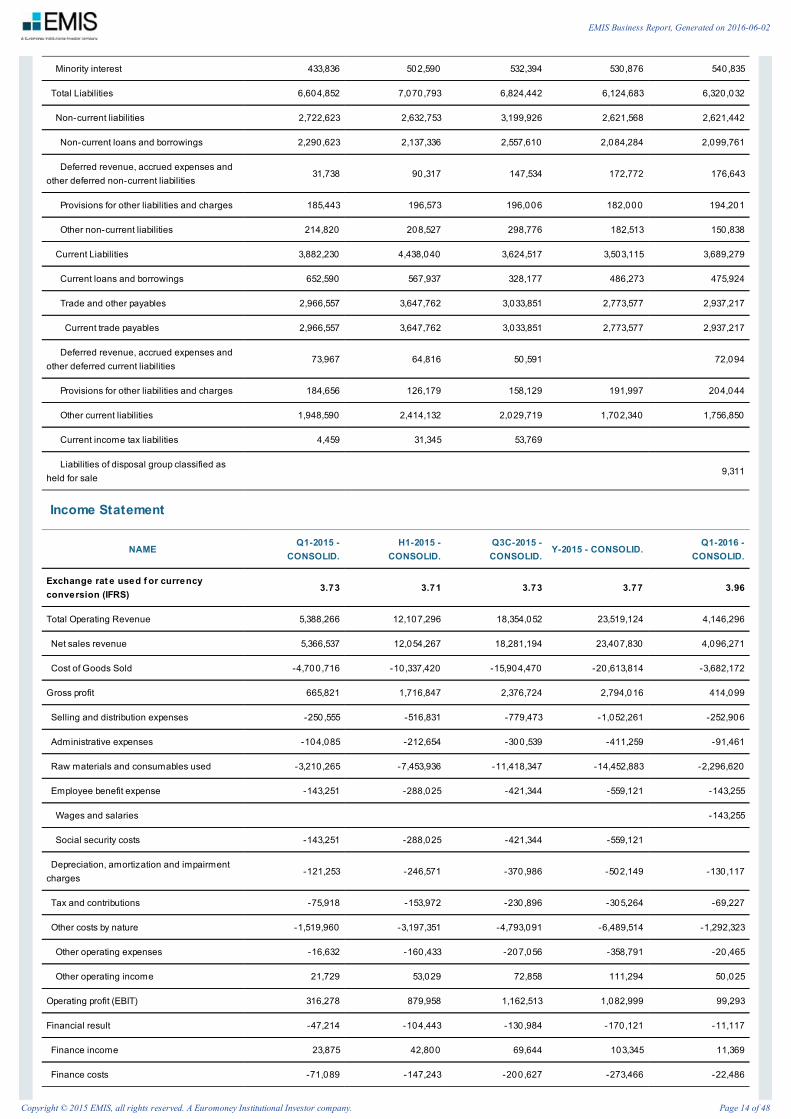
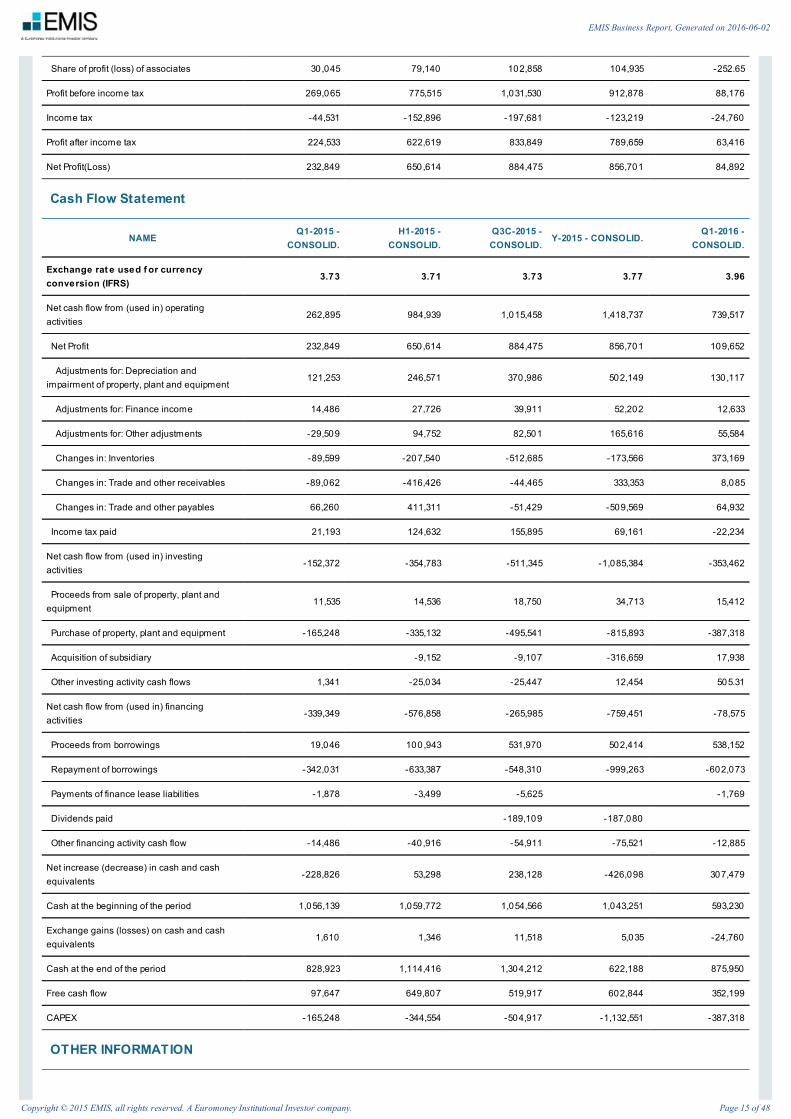
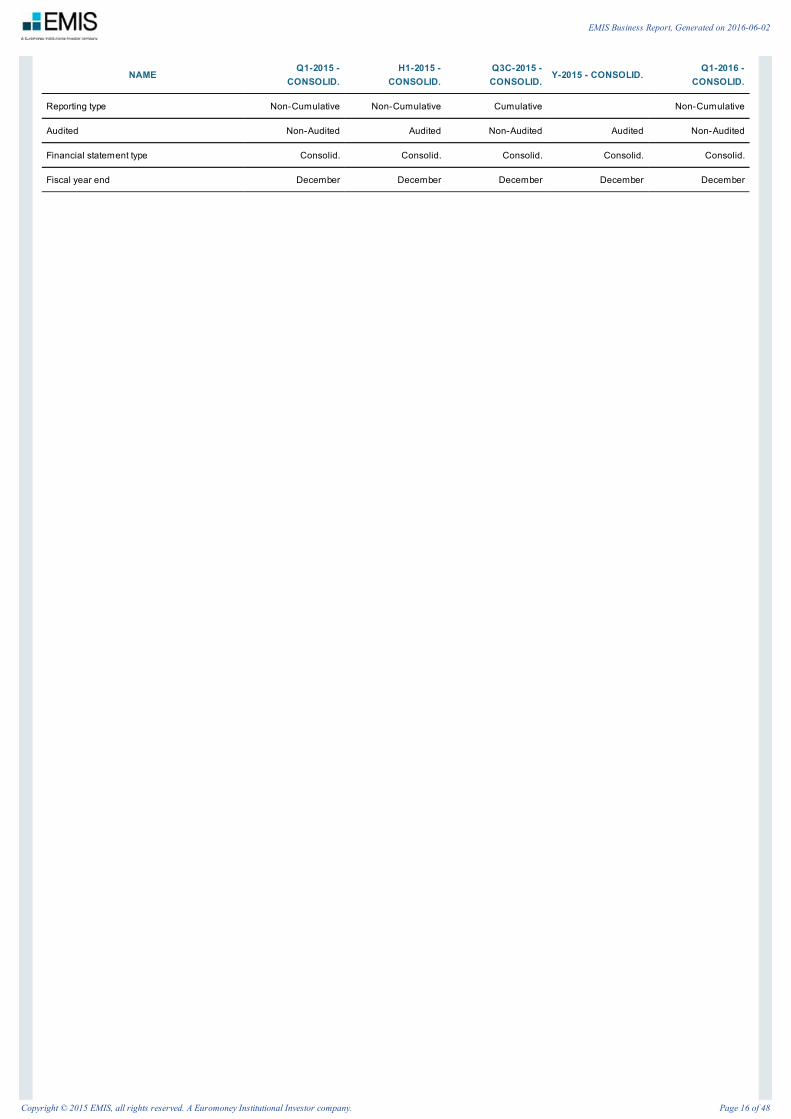
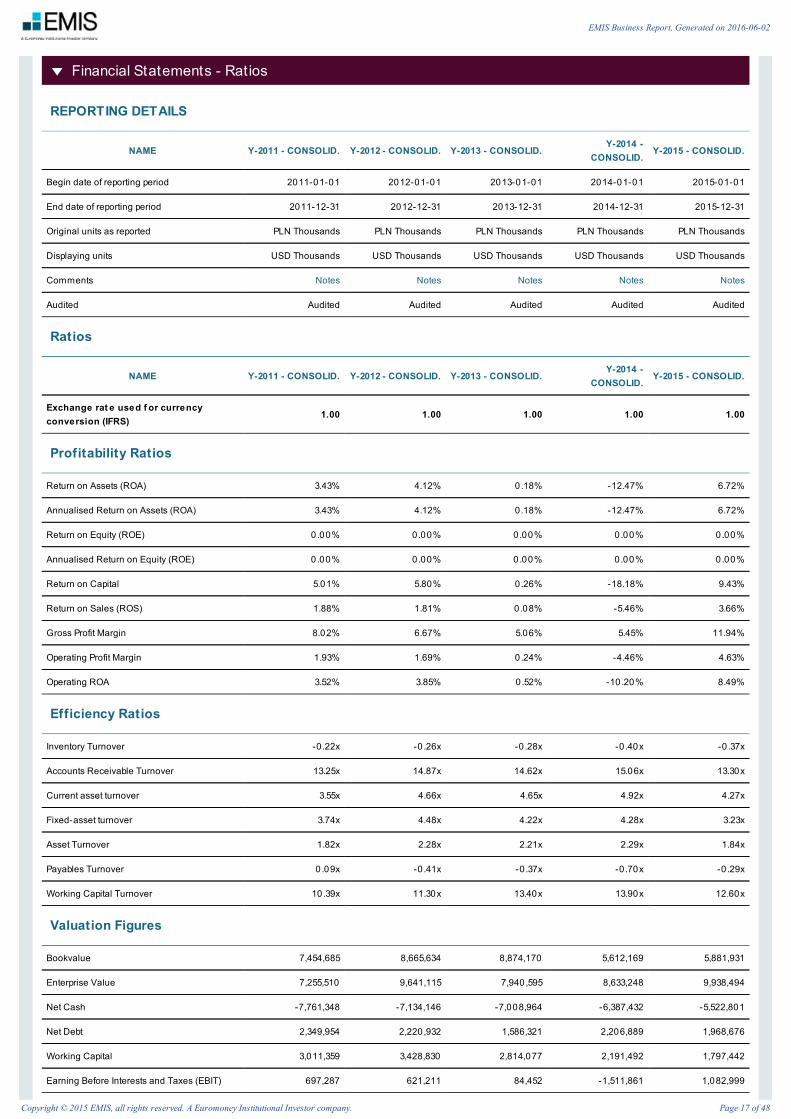
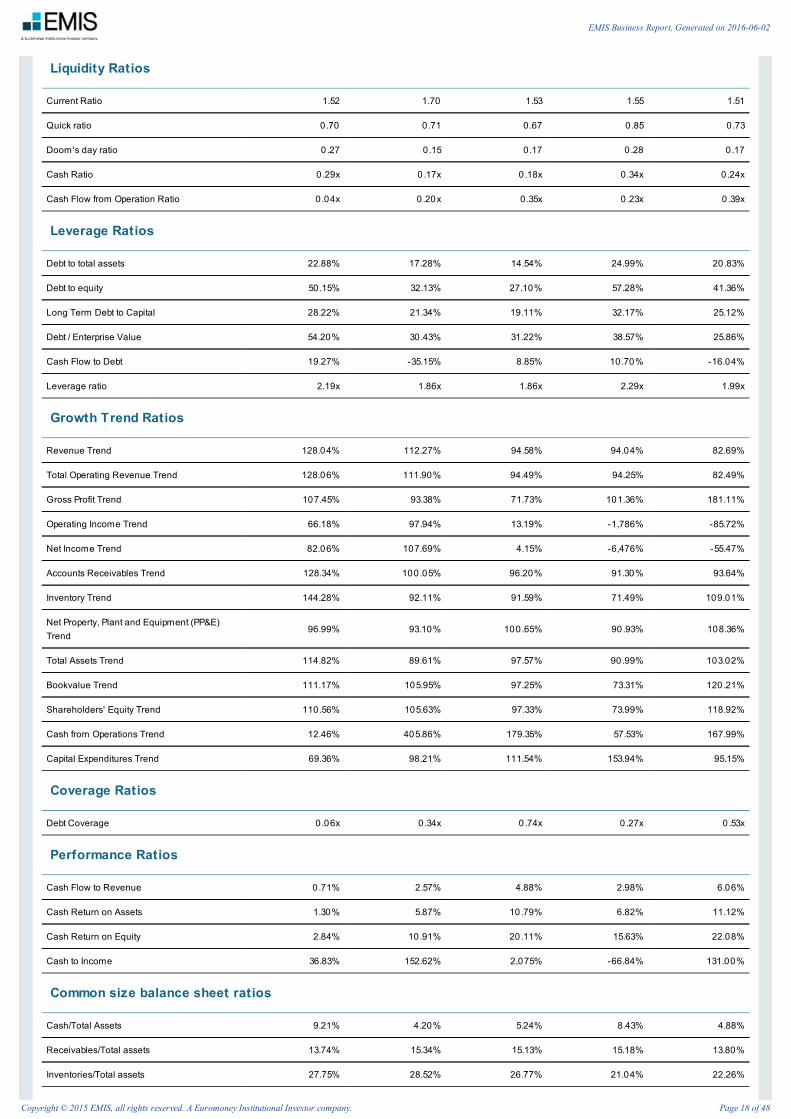
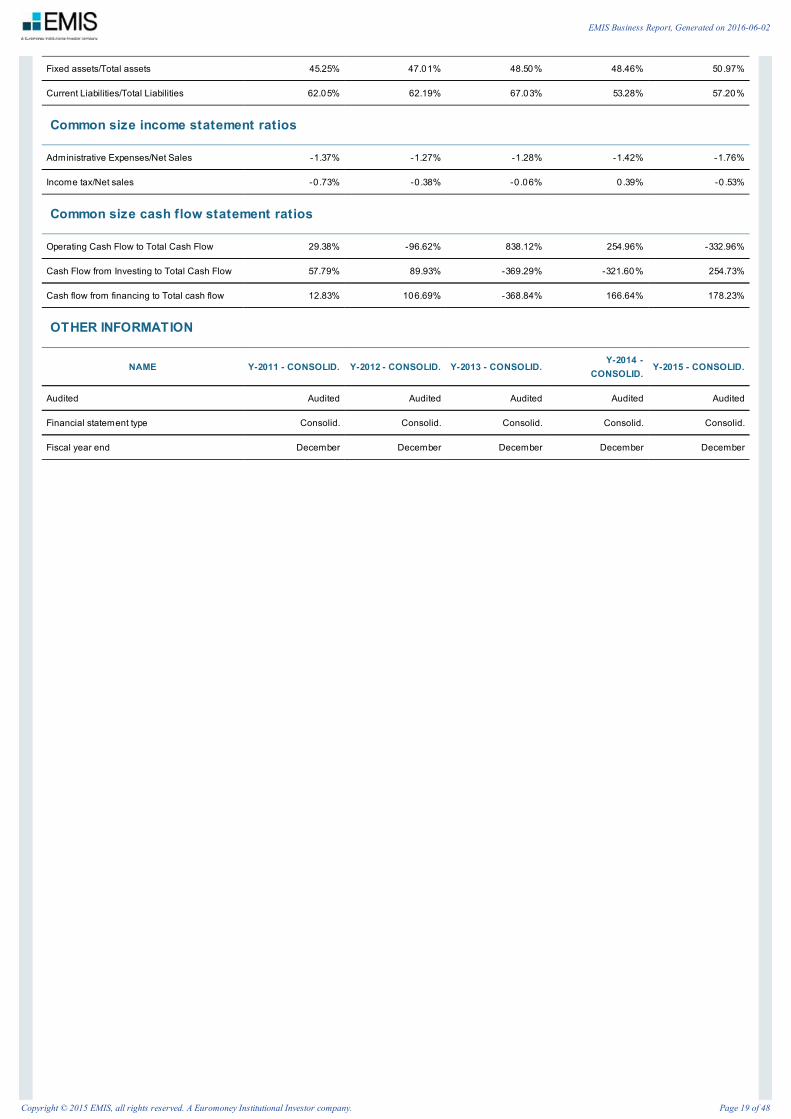
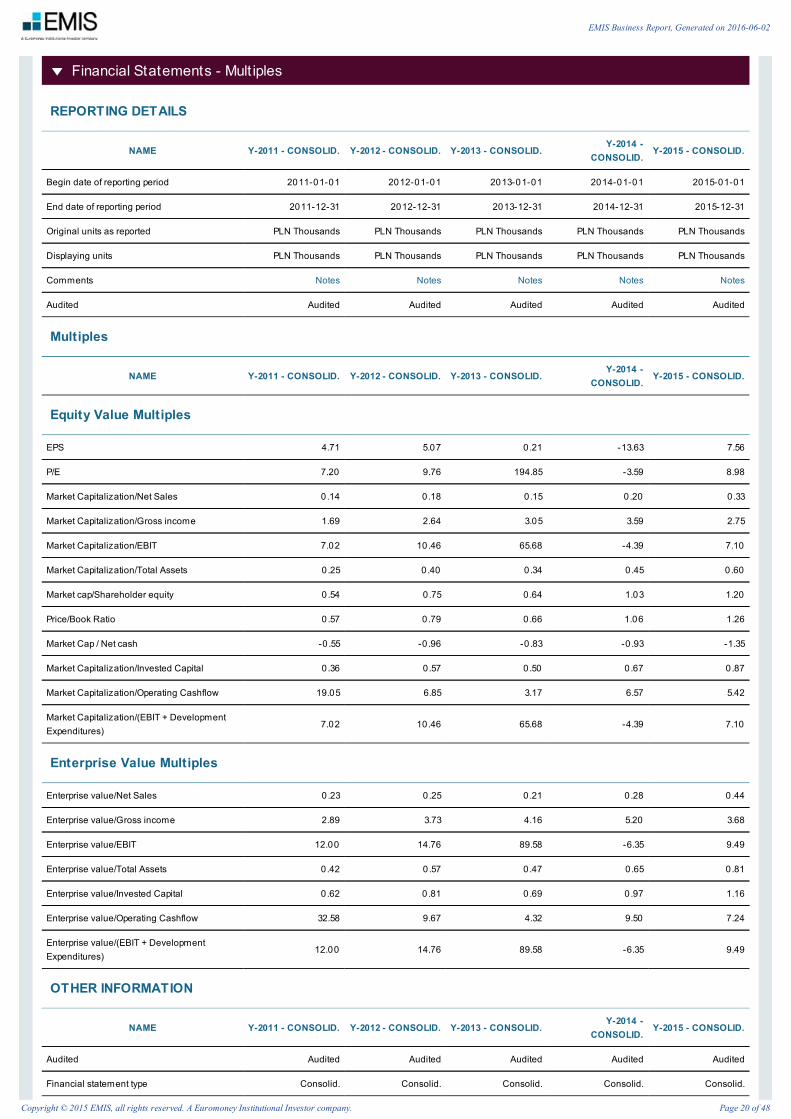
more raquo
more raquo
Company Documents - Financial DocumentsAnnual Reports
Company Documents - Corporate Act ions
June 12 2015 Polski Koncern Naftowy Orlen SA - Dividend (Mandatory) EDI - Corporate Act ions
June 04 2015 Polski Koncern Naftowy Orlen SA - Dividend (Mandatory) EDI - Corporate Act ions
June 03 2015 Polski Koncern Naftowy Orlen SA - Company Meet ing (Voluntary) EDI - Corporate Act ions
November 10 2014 Polski Koncern Naftowy Orlen SA - Company Meet ing (Voluntary) EDI - Corporate Act ions
November 10 2014 Polski Koncern Naftowy Orlen SA - Dividend (Mandatory) EDI - Corporate Act ions
June 14 2012 Polski Koncern Naftowy Orlen SA - Dividend (Mandatory) EDI - Corporate Act ions
May 29 2012 Polski Koncern Naftowy Orlen SA - Dividend (Mandatory) EDI - Corporate Act ions
December 16 2011 Polski Koncern Naftowy Orlen SA - Company Meet ing (Voluntary) EDI - Corporate Act ions
May 26 2011 Polski Koncern Naftowy Orlen SA - Company Meet ing (Voluntary) EDI - Corporate Act ions
December 13 1999 KGHM waits to decide on Catholic TV Warsaw Business Journal
By Anna KociNska TV Niepokalanow in January will get another chance to try to persuade copper concern KGHM Polska Miedzssupervisory board to invest in its proposed Catholic television station TV Familijna
November 29 1999 Elektrim picks f inancial health over long-distance license Warsaw Business Journal
By Gregory Keller Elektrims decision last week not to bid f or one of the three long-distance telephone licenses will delay but notnecessarily derail the conglomerates move to become a telecom heavyweight analysts said
November 23 1999 PSE to Enter Long-Distance Tender PNB - Polish News Bullet in
Independent Long-Distance Operator (NOM) a company owned by Tel-Energo in turn 76 percent owned by the PSE power grid company isto enter the tender f or long-distance telephone services sources reported
October 12 1999 PKN Lowers Fuel Prices PNB - Polish News Bullet in
Starting today (October 12) the Polski Koncern Naf towy (PKN) petroleum group will lower the wholesale price of its f uels by zl 50 per tonnewhich translates into a reduction of 5 groszy per litre in the price of diesel f uel and petrol at f illing stations
March 26 1998 CPN-Petrochemia Merger Conf irmed PNB - Polish News Bullet in
The Treasury Ministrys communiqu issued yesterday conf irmed earlier reports about a planned merger between the CPN petroleumdistributing giant and Petrochemia Plock
March 25 1998 CPN Petrochemia To Merge PNB - Polish News Bullet in
Unof f icial sources quoted by Zycie indicate that a merger between the CPN petroleum distributing giant and Petrochemia Plock is now certainwith the terms of the deal said to have been approved by the Treasury Ministry
News amp Reports - News
June 02 2016 PKN Orlen fuels ref ining margin edges down to USD 58bbl in May petchem margin up to EUR 995t PAP
Market InsiderWarszawa June 2 2016 (PAP) - Listed f uel f irm PKN Orlen recorded a slight decline of model ref ining margin in May to USD 58 per barrelf rom USD 62 in April and a spike in the model petchem margin to EUR 995 per ton f rom EUR 973 in the prior month data published on PKNOrlens website showed
June 02 2016 Saudi Aramco enters Balt ic market with oil supply deal with Polish PKN BBJ - Energy Today
EMIS Business Report Generated on 2016-06-02
Copyright copy 2015 EMIS all rights reserved A Euromoney Institutional Investor company Page 22 of 48
Saudi Aramco and Polands biggest ref iner PKN Orlen on Wednesday signed a contract agreed in May f or Aramco to supply PKN with 50000barrels of crude oil per day starting this month the companies said
June 01 2016 Top news from Polish polit ics economy business amp f inancial markets - 1930 PAP Market Insider
Warszawa June 1 2016 (PAP) - Following is a digest of the days top news as compiled by PAP Market Insider
June 01 2016 Top news from Polish polit ics economy business amp f inancial markets - 1630 PAP Market Insider
Warszawa June 1 2016 (PAP) - Following is a digest of the days top news as compiled by PAP Market Insider
June 01 2016 POLSKI KONCERN NAFTOWY ORLEN SA Transact ions in PKN ORLEN f inancial PAP Market Insider
instruments concluded by the person in a close relationship with the President of the PKN ORLEN Management Board Warszawa
June 01 2016 Poland Board of Sygnity appoints Jan Maciejewicz as new CEO M-Brain - News Monitoring
Wirtualny Nowy Przemysl 01 Jun 2016 online- Jan Maciejewicz has been appointed as the new CEO of the Polish IT f irm Signity replacingJanusz R Guy who was dismissed by the supervisory board on 30 May 2016
June 01 2016 Poland in talks with Iran over oil gas cooperat ion -minister Petroleum Bazaar - PetroMag
Poland is in talks with Iran over cooperation in the oil and gas sector which could result in exploration and production contracts f or Polishindustry Deputy Energy Minister Michal Kurtyka said on Monday
May 31 2016 Top news from Polish polit ics economy business amp f inancial markets - 1930 PAP Market Insider
Warszawa May 31 2016 (PAP) - Following is a digest of the days top news as compiled by PAP Market Insider BUSINESS amp EQUITYMARKET NEWS NATURAL GAS PGNIG - Listed natural gas group PGNiG recommends a dividend payment of PLN 106 bln f rom 2015 prof itwhich translates into PLN 018 per share the f irm said in a market f iling
May 31 2016 PKN ORLEN SA PKN ORLENs subsidiary - ORLEN Upstream - has purchased bonds issued by PKN ORLEN
PAP Market InsiderWarszawa May 31 2016 (ESPI) - Current report No 1392016 Polski Koncern Naf towy ORLEN SA (PKN ORLEN) hereby inf orms that inorder to optimise the management of f inancial liquidity within the ORLEN Capital Group on 31 May 2016 PKN ORLEN issued short term bondsto its subsidiary ORLEN Upstream Sp z oo (ORLEN Upstream)
May 31 2016 Top news from Polish polit ics economy business amp f inancial markets - 1630 PAP Market Insider
Warszawa May 31 2016 (PAP) - Following is a digest of the days top news as compiled by PAP Market Insider BUSINESS amp EQUITYMARKET NEWS POWER PGE - Listed power group PGE signed a letter of intent on selling PGEs telco unit Exatel to PGZ arms producerPGE said in a press statement
May 31 2016 POLSKI KONCERN NAFTOWY ORLEN SA Transact ions in PKN ORLEN f inancial PAP Market Insider
instruments concluded by the person in a close relationship with the President of the PKN ORLEN Management Board Warszawa
May 31 2016 Report Poland aims to end long-term gas supplies f rom Russia `22 Prime - Business News in English
Poland does not plan to renew a long-term gas supply contract with Russia when its current deal with Gazprom expires in 2022 Reutersreported late Monday cit ing Peter Naimsky a government of f icial responsible f or gas and power inf rastructure
May 31 2016 Warsaw Hopeful about Working with Post-sanct ions Iran PNB - Polish News Bullet in
Polish energy companies could prove to be usef ul partners f or their Iranian counterparts in sales or extraction of oil and natural gas DeputyEnergy Minister Michal Kurtyka said on Monday while taking part in the Polish-Iranian economic f orum The event was staged as part of theof f icial Warsaw visit of Iranian Minister of Foreign Af f airs dr
May 31 2016 Poland in talks with Iran over oil gas cooperat ion minister says BBJ - Energy Today
Poland is in talks with Iran over cooperation in the oil and gas sector which could result in exploration and production contracts f or Polishindustry Deputy Energy Minister Michal Kurtyka said on Monday Polish state-run gas f irm PGNiG said last year that it was looking at variousoptions in oil and gas exploration and production in Iran
May 31 2016 Treasury Looking for Synergy among Treasury Companies PNB - Polish News Bullet in
Treasury Minister Dawid Jackiewicz plans to f orm a holding of companies of strategic importance f or the state interest These companiesshould according to his plan sign long-term contracts among themselves so that money remained under Treasurys control and could beused to f inance other state needs
May 31 2016 Poland aims to end long-term gas supplies f rom Russia af ter 2022 Petroleum Bazaar - PetroMag
May 30 Poland does not plan to renew a long-term gas supply contract with Russia when its current deal with Gazprom expires in 2022 a
EMIS Business Report Generated on 2016-06-02
Copyright copy 2015 EMIS all rights reserved A Euromoney Institutional Investor company Page 23 of 48
government of f icial responsible f or gas and power inf rastructure told Reuters on Monday
May 31 2016 Polish Gas Companies Eyeing Direct LNG Supplies PNB - Economic Review
In less than 20 days the f irst commercial LNG shipment f rom Qatar will arrive at the Swinoujscie terminal This opens up new developmentpossibilit ies f or Polish gas producers traders and consumers PGNiG in pole posit ion The biggest benef iciary of the looming launch of theterminal is PGNiG
May 30 2016 Top news from Polish polit ics economy business amp f inancial markets - 1930 PAP Market Insider
Warszawa May 30 2016 (PAP) - Following is a digest of the days top news as compiled by PAP Market Insider BUSINESS amp EQUITYMARKET NEWS FOOD KERNEL - Listed edible oil producer Kernel Holding recorded a net attributable prof it of USD 923 mln in f iscal Q3 2016ended on March 31 the f irms consolidated f inancial report showed
May 30 2016 POLSKI KONCERN NAFTOWY ORLEN SA Agreements between ORLEN Capital Group and Glencore group
PAP Market InsiderWarszawa May 30 2016 (ESPI) - Current report No 1372016 Polski Koncern Naf towy ORLEN SA (PKN ORLEN) hereby inf orms that withinORLEN Capital Group there was concluded agreement with company f rom Glencore group
May 30 2016 PKN ORLEN SA Transact ions in PKN ORLEN f inancial instruments PAP Market Insider
concluded by the person in a close relationship with the President of the PKN ORLEN Management Board Warszawa
May 30 2016 Poland Press - Top Business Headlines PAP Market Insider
Warszawa May 30 2016 (PAP) - Following is a summary of the leading stories in the Polish press covering stocks and corporate news PAPdoes not verif y inf ormation contained in the Polish press BANKING CHF MORTGAGES - Polish banks prepared their own proposal f orproviding relief to the stressed CHF-mortgage borrowers
May 27 2016 PKN ORLEN SA Transact ions in PKN ORLEN f inancial instruments PAP Market Insider
concluded by the person in a close relationship with the President of the PKN ORLEN Management Board Warszawa
May 27 2016 Orlens Eurobonds Get Good Rat ings PNB - Polish News Bullet in
Fitch Ratings has conf irmed the BBB- long-term credit rating and stable outlook f or PKN Orlen The agency has also awarded the same ratingto the eurobonds to be issued by the Plock-based oil concern though on an interim basis Meanwhile Moodys gave the bonds an interimBaa3 rating PKN Orlen disclosed on Wednesday
May 24 2016 POLSKI KONCERN NAFTOWY ORLEN SA Ship-Service - has purchased bonds issued by PKN ORLEN
PAP Market InsiderWarszawa May 24 2016 (ESPI) - Current report No 1292016 Polski Koncern Naf towy ORLEN SA (PKN ORLEN) hereby inf orms that inorder to optimise the management of f inancial liquidity within the ORLEN Capital Group on 24 May 2016 PKN ORLEN issued short term bondsto its subsidiary Ship-Service SA (Ship-Service)
May 24 2016 PKN ORLEN SA PKN ORLENs subsidiary - ORLEN Upstream - has purchased bonds issued by PKN ORLEN
PAP Market InsiderWarszawa May 24 2016 (ESPI) - Current report No 1282016 Regulatory announcement no 1282016 dated 24 May 2016Polski KoncernNaf towy ORLEN SA
May 24 2016 PKN ORLEN SA Transact ions in PKN ORLEN f inancial instruments PAP Market Insider
concluded by the person in a close relationship with the President of the PKN ORLEN Management Board Warszawa
May 24 2016 PGNiG Granted Concession on Norwegian Shelf PNB - Economic Review
Piotr Wozniak president of PGNiG announced that the f irms subsidiary PGNiG Upstream International had acquired a stake in anexploratory concession located in Norway on the Barents Sea shelf
May 23 2016 PKN ORLEN SA Transact ions in PKN ORLEN f inancial instruments PAP Market Insider
concluded by the person in a close relationship with the President of the PKN ORLEN Management Board Warszawa
May 23 2016 INBRIEF PNB - Polish News Bullet in
According to Monetary Policy Council (RPP) member Eugeniusz Gatnar the data published in April signals that the economy is developing healso assesses the current level of interest rates as optimal
May 20 2016 Top news from Polish polit ics economy business amp f inancial markets - 1930 PAP Market Insider
Warszawa May 20 2016 (PAP) - Following is a digest of the days top news as compiled by PAP Market Insider BUSINESS amp EQUITY
EMIS Business Report Generated on 2016-06-02
Copyright copy 2015 EMIS all rights reserved A Euromoney Institutional Investor company Page 24 of 48
MARKET NEWS INSURANCE PZU - Listed insurer PZU will recommend shareholders take PLN 208 per share in dividends f rom 2015 prof itsin a total payout of PLN 1796 bln management said in a market f iling
May 20 2016 Top news from Polish polit ics economy business amp f inancial markets - 1630 PAP Market Insider
Warszawa May 20 2016 (PAP) - Following is a digest of the days top news as compiled by PAP Market Insider
May 20 2016 PKN ORLEN SA Transact ions in PKN ORLEN f inancial instruments PAP Market Insider
concluded by the person in a close relationship with the President of the PKN ORLEN Management Board Warszawa
May 20 2016 Thousands of Polish companies operat ing in Germany BBJ - Regional Today
Over 1700 commercial companies with Polish capital operate in Germany according to a new report by the German Chamber of Industry andCommerce (AHK) cited by the Deutsche Welle Polish businessmen perceive Germany as an attractive country in terms of investmentopportunit ies the chamber said
May 20 2016 Thousands of Polish companies operat ing in Germany BBJ - Regional Today
Over 1700 commercial companies with Polish capital operate in Germany according to a new report by the German Chamber of Industry andCommerce (AHK) cited by the Deutsche Welle Polish businessmen perceive Germany as an attractive country in terms of investmentopportunit ies the chamber said
May 20 2016 Treasury Expect ing State-Owned Firms to Pay Dividends PNB - Polish News Bullet in
The Treasury can count on some PLN500m to be paid in dividends by those state-owned companies which have already issuedrecommendations f or shareholders concerning the matter Jastrzebska Spolka Weglowa Lotos and PKP Cargo recommend not to pay adividend due to losses suf f ered in 2015
May 18 2016 Top news from Polish polit ics economy business amp f inancial markets - 1930 PAP Market Insider
Warszawa May 18 2016 (PAP) - Following is a digest of the days top news as compiled by PAP Market Insider
May 18 2016 Update Shareholder seeks PLN 35 DPS from PKN Orlen PAP Market Insider
Warsaw May 18 2016 (PAP) - Listed f uel f irm PKN Orlen saw its shareholder NN OFE seek a PLN 35 DPS f rom 2015 prof it and retainedprof its PKN said in a market f iling The pension f und wants the company to pay PLN 1048 bln f rom 2015 prof its and PLN 4495 mln f romretained prof its giving a total of PLN 1497 bln
May 18 2016 POLSKI KONCERN NAFTOWY ORLEN SA Nat ionale-Nederlanden OFE not if ied PAP Market Insider
draf t resolution of the OGM of PKN ORLEN regarding allocation of the prof it f or the f inancial year 2015 Warszawa May 18 2016 (ESPI) -Current report No 1232016 Polski Koncern Naf towy ORLEN Spolka Akcyjna (PKN ORLEN) hereby inf orms that Nationale-NederlandenOtwarty Fundusz Emerytalny (Nationale-Nederlanden OFE) pursuant to Art
May 18 2016 Shareholder seeks PLN 35 DPS from PKN Orlen PAP Market Insider
Warsaw May 18 2016 (PAP) - Listed f uel f irm PKN Orlen saw its shareholder NN OFE seek a PLN 35 DPS f rom 2015 prof it and retainedprof its PKN said in a market f iling The pension f und wants the company to pay PLN 1048 bln f rom 2015 prof its and PLN 4495 mln f romretained prof its giving a total of PLN 1497 bln
May 18 2016 Poland Press - Top Business Headlines PAP Market Insider
Warszawa May 18 2016 (PAP) - Following is a summary of the leading stories in the Polish press covering stocks and corporate news
May 18 2016 Poland Press - Top Business Headlines PAP Market Insider
Warszawa May 18 2016 (PAP) - Following is a summary of the leading stories in the Polish press covering stocks and corporate news
May 17 2016 Top news from Polish polit ics economy business amp f inancial markets - 1930 PAP Market Insider
Warszawa May 17 2016 (PAP) - Following is a digest of the days top news as compiled by PAP Market Insider
May 16 2016 Top news from Polish polit ics economy business amp f inancial markets - 2100 PAP Market Insider
Warszawa May 16 2016 (PAP) - Following is a digest of the days top news as compiled by PAP Market Insider
May 16 2016 PKN Orlen fuels plans eurobond issue by Orlen Capital unit by end-2016 PAP Market Insider
Warsaw May 16 2016 (PAP) - Listed f uel group PKN Orlen has secured its supervisory boards approval f or a eurobonds issue within theOrlen capital group the f im said in a market f iling
May 16 2016 POLSKI KONCERN NAFTOWY ORLEN SA PKN ORLEN Supervisory Board consent to Eurobonds issue
within the ORLEN Capital Group PAP Market Insider
EMIS Business Report Generated on 2016-06-02
Copyright copy 2015 EMIS all rights reserved A Euromoney Institutional Investor company Page 25 of 48
more raquo
Warszawa May 16 2016 (ESPI) - Current report No 1192016 Polski Koncern Naf towy ORLEN Spolka Akcyjna (PKN ORLEN) hereby inf ormsthat on 16 May 2016 the PKN ORLEN Supervisory Board gave consent to start the process leading to issue of Eurobonds within ORLENCapital Group
May 16 2016 StockWatch Grupa Azoty chemicals on dividend dates Comarch IT on prof it retent ion PAP Market Insider
Warszawa May 16 2016 (PAP) - Warsaw stocks are enjoying a rebound on Monday with the large-cap index WIG20 closing up by 21 Not asinlge blue-chip suf f ered any declines with the advancers led by copper group KGHM up 51 bank PKO BP up 33 and insurer PZU up29
May 16 2016 POLSKI KONCERN NAFTOWY ORLEN SA ORLEN Paliwa - has purchased bonds issued by PKN ORLEN
PAP Market InsiderWarszawa May 16 2016 (ESPI) - Current report No 1182016 Polski Koncern Naf towy ORLEN Spolka Akcyjna (PKN ORLEN) herebyannounces that in order to optimise the management of f inancial liquidity within the ORLEN Capital Group on 16 May 2016 PKN ORLENissued short term bonds to its subsidiary ORLEN Paliwa Sp z oo (ORLEN Paliwa)
May 16 2016 POLSKI KONCERN NAFTOWY ORLEN SA Anwil - has purchased bonds issued PAP Market Insider
by PKN ORLEN Regulatory announcement no 1172016 dated 16 May 2016 Warszawa May 16 2016 (ESPI) - Current report No 1172016Polski Koncern Naf towy ORLEN SA
May 16 2016 POLSKI KONCERN NAFTOWY ORLEN SA Transact ions in PKN ORLEN f inancial PAP Market Insider
instruments concluded by the person in a close relationship with the President of the PKN ORLEN Management Board Warszawa
May 13 2016 EMIS Energy Weekly Newslet ter Issue 87 EMIS Energy - Newslet ter
News amp Reports - Reports
July 28 2015 Erste Bank - Company Reports Updates PKN Orlen Erste Bank - Company Reports
May 18 2015 Erste Bank - Company Reports Updates PKN Orlen Erste Bank - Company Reports
September 13 2012 PKN Orlen mBank Analyt ical Report
April 17 2012 PKN Orlen Erste Bank - Company Analyses
November 17 2011 PKN_Orlen mBank Analyt ical Report
August 22 2011 PKN_Orlen mBank Analyt ical Report
June 17 2011 Company Report - CEE Oil amp Gas Erste Bank - Company Analyses
March 16 2011 PKN_Orlen mBank Analyt ical Report
December 03 2010 PKN_Orlen mBank Analyt ical Report
November 02 2010 PKN Orlen - 02112010 mBank Analyt ical Report
November 18 2009 Analyt ical Report - PKN Orlen - 18112009 mBank Analyt ical Report
September 16 2009 Analyt ical Report - PKN Orlen - 16092009 mBank Analyt ical Report
June 02 2009 Analyt ical Report - PKN Orlen - 02062009 mBank Analyt ical Report
February 27 2009 Analyt ical Report - PKN Orlen - 27022009 mBank Analyt ical Report
November 20 2008 Analyt ical Report - PKN Orlen - 20112008 mBank Analyt ical Report
September 17 2008 Analyt ical Report - PKN Orlen - 17092008 mBank Analyt ical Report
EMIS Business Report Generated on 2016-06-02
Copyright copy 2015 EMIS all rights reserved A Euromoney Institutional Investor company Page 26 of 48
more raquo
August 14 2008 Analyt ical Report - PKN Orlen - 14082008 mBank Analyt ical Report
June 04 2008 Analyt ical Report - PKN Orlen - 30052008 mBank Analyt ical Report
March 10 2008 Analyt ical Report - PKN Orlen - 10032008 mBank Analyt ical Report
February 21 2008 Analyt ical Report - PKN Orlen - 14022008 mBank Analyt ical Report
December 13 2007 Analyt ical Report - PKN Orlen - 04122007 mBank Analyt ical Report
August 21 2007 Analyt ical Report - PKN Orlen - 160807 mBank Analyt ical Report
July 02 2007 Analyt ical Report - PKN Orlen mBank Analyt ical Report
March 05 2007 Analyt ical Report - PKN Orlen mBank Analyt ical Report
August 24 2006 Analyt ical Report - PKN Orlen mBank Analyt ical Report
EMIS Business Report Generated on 2016-06-02
Copyright copy 2015 EMIS all rights reserved A Euromoney Institutional Investor company Page 27 of 48
MampA and ECM Deals - EMIS DealWatch Deals
DAT ECOUNT RY
OFT ARGET
T ARGET COMPANYDEALT YPE
BUYER SELLER DEAL INDUST RIESDEAL
VALUEUSD (MN)
ST AKE
20-Jan-16CzechRepublic
68 petrol stations of OMV Acquisition PKN Orlen SA OMV AG Gasoline Stations NA 100
16-Nov-15 Poland Assets of Euronaft Trzebinia Acquisition PKP Cargo SA PKN Orlen SASupport Activities forTransportation RailTransportation
1502 100
16-Nov-15 Poland Orlen Transport SA Acquisition Trans Polonia SA PKN Orlen SA Truck Transportation 2137 100
21-Oct-15 Germany13 SUN petrol stations ofGermania Petrol
Acquisition PKN Orlen SAGermaniaPetrol GmbH
Gasoline Stations NA 100
13-Oct-15 Canada Kicking Horse Energy Inc Acquisition PKN Orlen SA NA Oil and Gas Extraction 22634 100
13-Oct-15UnitedStates
FX Energy Inc Acquisition PKN Orlen SA NAOil and Gas ExtractionAgriculture Forestry Fishingand Hunting
8310 100
24-Sep-15 PolandTwo concessions in theregions of Lesser Polandand Subcarpathia
Acquisition PKN Orlen SADEADeutscheErdoel AG
Oil and Gas Extraction NA 100
20-Aug-15CzechRepublicPoland
Orlen KolTrans Sp z oo Acquisition PKP Cargo SA PKN Orlen SA Rail Transportation 4860 9985
20-Jul-15 Poland Bieszczady ProjectJointventure
PKN Orlen SA PolskieGornictwo Naftowe iGazownictwo SA
NA Oil and Gas Extraction NA 100
03-Jul-14CzechRepublic
Ceska Rafinerska ASMinoritystakepurchase
PKN Orlen SA Eni SpA Petroleum Refineries 4100 32445
14-May-14 Poland Orlen Medica Acquisition PZU TFI SA PKN Orlen SAHealth Care and SocialAssistance
1380 100
14-May-14 Poland Prof Med Sp z oo Acquisition PZU SA PKN Orlen SAHealth Care and SocialAssistance
119 9645
08-May-14 CanadaBirchill Exploration LimitedPartnership
Acquisition PKN Orlen SA
Bregal -BirchillInvestmentsSarl
Oil and Gas Extraction 23366 100
07-Nov-13CzechRepublic
Ceska Rafinerska ASMinoritystakepurchase
PKN Orlen SARoyal DutchShell Plc
Petroleum Refineries 2720 1633
16-Sep-13 Canada TriOil Resources Ltd Acquisition PKN Orlen SA NA Crude Petroleum Extraction 17753 100
07-Dec-12 Poland Shale gas licenses Acquisition PKN Orlen SAExxonMobilPoland
Natural Gas Extraction NA 100
02-Nov-12 Poland Anwil SAMinoritystakepurchase
PKN Orlen SA NAPesticide Fertilizer andOther Agricultural ChemicalManufacturing
2364 473
20-Aug-12 Poland Petrolot Acquisition PKN Orlen SAPolskie LinieLotnicze LOTSA
Petroleum and PetroleumProducts MerchantWholesalers
9241 49
01-Jun-12 Poland Gas bottle assets Acquisition Gaspol SA PKN Orlen SA Nonstore Retailers NA 100
01-Aug-11 Poland Anwil SAMinoritystakepurchase
PKN Orlen SA Energa SAPesticide Fertilizer andOther Agricultural ChemicalManufacturing
2158 415
MampA and ECM Deals - EMIS DealWatch Intents
EMIS Business Report Generated on 2016-06-02
Copyright copy 2015 EMIS all rights reserved A Euromoney Institutional Investor company Page 28 of 48
DEALSIDE
INT ENTANNOUNCEMENT
T ARGETT ARGET
COUNT RYT ARGET INDUST RY
DEALT YPE
INVEST OR
Sell-side
13-Nov-15Orlen TransportSA
Poland Truck Transportation Acquisition Trans Polonia SA
Sell-side
23-Jul-15Czech railtransport unit ofPKN Orlen
CzechRepublic
Rail Transportation Acquisition NA
Buy-side
06-May-15 Fuel stationsAustriaGermanySwitzerland
Gasoline Stations Acquisition PKN Orlen SA
Sell-side
20-Oct-14Orlen KolTransSp z oo
Poland Rail Transportation Acquisition PKP Cargo SA
Buy-side
10-Jun-14Kicking HorseEnergy Inc
Canada Oil and Gas Extraction Acquisition PKN Orlen SA
Sell-side
29-May-14 ORLEN Lietuva Lithuania Petroleum Refineries Acquisition NA
Buy-side
05-Sep-13
BirchillExplorationLimitedPartnership
Canada Oil and Gas Extraction Acquisition PKN Orlen SA
Sell-side
23-Aug-13Medical centresin Plock andWloclawek
Poland Hospitals amp Health Care Acquisition NA
Buy-side
27-Jun-13 Fuel stationsCzechRepublicGermany
Gasoline Stations Acquisition PKN Orlen SA
Sell-side
25-Jul-12 Neste Polska Poland Other Gasoline Stations Acquisition Lotos SA PKN Orlen SA
Sell-side
01-Mar-12
OsrodekBadawczo-RozwojowyPrzemysluRafineryjnegoSA
PolandPetrochemical ManufacturingPetroleum Refineries
Privatization PKN Orlen SA Warter
Sell-side
20-Dec-11 Lotos SA Poland
Other Gasoline StationsGasoline Stations withConvenience Stores PetroleumRefineries Crude PetroleumExtraction
Privatizationthroughstockexchange
PKN Orlen SA Polskie Gornictwo Naftowe iGazownictwo SA
Buy-side
20-Jun-11Fuel stations inGermany
GermanyOther Gasoline StationsGasoline Stations withConvenience Stores
Acquisition PKN Orlen SA
Sell-side
02-May-11
Anwils fertilizerassets AnwilsPVC productionassets
PolandPoland
Plastics and Rubber ProductsManufacturing PesticideFertilizer and Other AgriculturalChemical Manufacturing
Acquisition ZA Pulawy
Sell-side
14-Mar-11Rafineria NaftyJedlicze
Poland Petroleum Refineries Privatization PKN Orlen SA
Sell-side
30-Nov-10 CeproCzechRepublic
Gasoline Stations BasicChemical ManufacturingPetroleum and Coal ProductsManufacturing
MergerEni SpA PKN Orlen SA Royal Dutch Shell PlcSlovnaft
Sell-side
02-Nov-10 Lotos SA PolandPetroleum and Coal ProductsManufacturing Oil and GasExtraction
Minoritystakepurchase
ExxonMobil Corp Gazprom Neft KulczykInvestments SA Magyar Olaj- Es Gazipari Nyrt(MOL) Mercuria Energy Group Ltd PKN Orlen SAPolskie Gornictwo Naftowe i Gazownictwo SA TNK-BP
Buy-side
16-Sep-10Gasolinestations
CzechRepublic
Gasoline Stations Acquisition PKN Orlen SA Unipetrol
EMIS Business Report Generated on 2016-06-02
Copyright copy 2015 EMIS all rights reserved A Euromoney Institutional Investor company Page 29 of 48
Buy-side
16-Sep-10Petrochemicalrefinery
CzechRepublic
Petroleum Refineries
AcquisitionMinoritystakepurchase
PKN Orlen SA
Sell-side
21-Jul-10Polkomtel Sp zoo
PolandWireless TelecommunicationsCarriers (except Satellite)
Acquisition Zygmunt Solorz-Zak - private investor
EMIS Business Report Generated on 2016-06-02
Copyright copy 2015 EMIS all rights reserved A Euromoney Institutional Investor company Page 30 of 48
Fiscal year 2014Companies in Industries 43
IndustryPetroleum Refineries
This company is scored higher thanonly 5266 of companies in theindustry which equates to B - BelowAverage Risk on the Financial Scale Expected
Participation inCustomers Credit
Fiscal year 2014Companies in Industries 43
IndustryPetroleum Refineries
Criteria Weight Score Final Score
I EMIS Benchmark Score 90 207 B Below Average Risk
SIZ E RANKING SCORE
Sales 1 10000
Assets 1 10000
Profit 41 698
Total Shareholders Equity 1 10000
Average Size 11 7675
GROWT H RANKING SCORE
Net Sales Growth Rate 11 7674
Inc Dec in Assets 20 5581
Inc Decin Net Income 24 4651
Increase (Decrease) in Equity 22 5116
Average Growt h 19 5756
PROFIT ABILIT Y RANKING SCORE
Net Income Net Sales 29 3488
Return On Assets 38 1395
Net Income Net Worth 39 1163
Average Prof it abilit y 35 2015
INDEBT EDNESS RANKING SCORE
Indebtedness 22 5116
Leverage 33 2558
Total Liabilities Sales 17 6279
Average Indebt edness 24 4651
II EMIS Trend Score 10 298 E Very High Risk
Scoring Range 1 - Improves 2 - Maintains (According to the tolerance margin) 3 - Deteriorate
EMIS Credit Analytics - Summary
EMIS Financial ScoreEMIS Financial Score was not affected by Conditions
EMIS Benchmark Score
B Below Average Risk
5266
EMIS Trend Score
E Very High Risk
PampL E
Balance Sheet C
Cash Flow E
EMIS Credit Quota
21112537Thousands (USD)
Average Ranking 21 in 43 companies
RELAT IVEST RENGT HS
RELAT IVEWEAKNESSES
Sales Net Income Sales
Sales Growth
Remarks
EMIS Trend Score is calculated based on the 2latest annual company financial statements
Remarks
Credit Quota Recommended was calculatedbased on the industry average customer type(customized) and Financial Score
EMIS Credit Analyt ics - EMIS Financial Score
EMIS Financial ScoreEMIS Financial Score was not affected by Conditions
EMIS Benchmark Score 5266
11
EMIS Business Report Generated on 2016-06-02
Copyright copy 2015 EMIS all rights reserved A Euromoney Institutional Investor company Page 31 of 48
100
PampL 2014 T OT AL
Sales Growth 3 3
Operating Profit Sales 3 3
Net Income Sales 3 3
T ot al PampL 300 300
BALANCE 2014 T OT AL
Days Receivables 2 2
Days Inventory 1 1
Current Ratio 3 3
Indebtness (Total AssetsTotal Liabilities) 3 3
Total Liabilities Sales 3 3
T ot al Balance 230 230
CASH FLOW 2014 T OT AL
Cash from Sales 3 3
Cash for Production 2 2
Cash for Operation 1 1
Net Operation Cash Generation (NOCG) 3 3
Free Cash Flow 3 3
Cash Flow After Financial Expenses 3 3
Cash Flow After Financial 3 3
Reduction in Debt 2 2
T ot al Cash Flow 267 267
III EMIS Financial Score 100 216 CC Above Average Risk
E D C CC B BB A AA
Business Scale
AA - Very Low RiskA - Low RiskBB - Moderate Low RiskB - Below Average RiskCC - Above Average RiskC - Moderate High RiskD - High RiskE - Very High Risk
E Very High Risk
C Moderate High Risk
E Very High Risk
EMIS Credit Analyt ics - EMIS Benchmark Score
EMIS Business Report Generated on 2016-06-02
Copyright copy 2015 EMIS all rights reserved A Euromoney Institutional Investor company Page 32 of 48
Fiscal year 2014Companies in Industries 43
IndustryPetroleum Refineries
SIZ E RANKING SCORE
Sales 1 10000
Assets 1 10000
Profit 41 698
Total Shareholders Equity 1 10000
Average Size 11 7675
GROWT H RANKING SCORE
Net Sales Growth Rate 11 7674
Inc Dec in Assets 20 5581
Inc Decin Net Income 24 4651
Increase (Decrease) in Equity 22 5116
Average Growt h 19 5756
PROFIT ABILIT Y RANKING SCORE
Net Income Net Sales 29 3488
Return On Assets 38 1395
Net Income Net Worth 39 1163
Average Prof it abilit y 35 2015
INDEBT EDNESS RANKING SCORE
Indebtedness 22 5116
Leverage 33 2558
Total Liabilities Sales 17 6279
Average Indebt edness 24 4651
Average Ranking 21
Fiscal year 2014Companies in Industries 43
IndustryPetroleum Refineries
EMIS Credit Quota(Score adjusted)
21112537Thousands (USD)
Participation in credit Financial Score
CC
EMIS Benchmark Score(Against Industry)
5266
EMIS Credit Analyt ics - EMIS Credit Quota
Key parameters af f ecting quota value
COMPANY INDICAT ORS VALUE INDUST RY MULT IPLIERS MAX CALCULAT ED CREDIT
Assets 1332259352 Suppliers Assets 2801 373173079
Net Worth 581261405 Suppliers Net worth 6383 371042677
Tangible Net Worth 604356752 Suppliers Tangible Net Worth 6383 385785372
Net Sales 3067917427 Suppliers Net Sales 1352 414818151
11
EMIS Business Report Generated on 2016-06-02
Copyright copy 2015 EMIS all rights reserved A Euromoney Institutional Investor company Page 33 of 48
Source EMIS Company Database
AVERAGE CREDIT
(BASED ON INDUSTRY)
319886918THOUSANDS (USD)
XEXPECT ED PART ICIPAT ION
(IN CUSTOMERS CREDIT)
11
FINANCIAL SCORE
CC
=
=
CALCULAT ED CREDIT
(AVERAGE X PARTICIPATION)
35187561THOUSANDS (USD)
X
QUOT A ADJUST MENT S
06
=CREDIT QUOT A
(ADJUSTED BY SCORE)
21112537THOUSANDS (USD)
Fiscal year 2014Companies in Industries 43
IndustryPetroleum Refineries
NIP 7740001454 Headquart ers T el +48 (24) 3650000
Cost of Goods Sold 3048984945 Suppliers Cost of Goods Sold 1363 415427048
Operating Profit -134323677 Suppliers Operating Profit -30832 000
Net Profit -165687728 Suppliers Net Profit -26041 000
SUPPLIERS 378193431 Net Sales 3067917427 Financial Liabilities Net Sales 002 715239
Assets 1332259352 Financial Liablities Assets 005 643434
FINANCIAL LIABILIT IES 000 Operating Cycle 1617 Operating Cycle 592663 501950211
Suppliers Turnover 1273 Suppliers Turnover 490503 415427048
AVERAGE CREDIT BASED ON INDUST RY 1121907398
Credit Quota Calculation
Score Multipliers
QUOT A ADJUST MENT S ACCORDING T O T HE FINAL SCORE FINANCIAL SCALE MULT IPLIERS
Expanded QuotaAA 2
A 15
Normal Quota BB 1
Reduced Quota
B 08
CC 06
C 04
No QuotaD 02
E 0
EMIS Credit Analyt ics - Conclusions
EMIS Business Report Generated on 2016-06-02
Copyright copy 2015 EMIS all rights reserved A Euromoney Institutional Investor company Page 34 of 48
Ul Chemikoacutew 7
09-411
Fax +48 (24) 3654040
Email zarzadorlenpl
RELAT IVE ST RENGT HS RANKING SCORE
Sales 1 100
Sales Growth 11 7674
EMIS Credit Quota(Score adjusted)
21112537Thousands (USD)
Participation in credit Financial Score
CC
Date 2016 June 2
Fiscal year 2014Companies in Industries 43
IndustryPetroleum Refineries
Polski Koncern Naftowy ORLEN SAEMIS Credit Analytics
EMIS Benchmark Score (Business Performance Score) is based on financial statements as of 2014 EMIS Benchmark Score of Polski Koncern Naf t owy ORLEN SA is
the result of comparing its financial results with that of 43 companies classified by EMIS Credit Analytics within Pet roleum Ref ineries industry
EMIS Benchmark Score(Against Industry)
5266Note Companies classified in Pet roleum Ref ineries are not necessarily direct competitors Please refer to Benchmark Ranking for complete details of the companies
classified within this industry
EMIS Benchmark Score is the result of the companys ranking within its industry in different financial ratios of Size Profitability Growth Indebtness Efficiency and Liquidity
Ratios In the result it is important to note
EMIS Benchmark Score contributes 90 to the Financial Score The other 10 is represented by evolution versus previous period of Profit amp Loss Balance Sheet and
Cash Flow Statement
EMIS T REND SCORE
Profit amp Loss E
Balance Sheet C
Cash Flow Statement E
EMIS Financial ScoreEMIS Financial Score was not affected by Conditions
Note The Financial Score is not deteriorated by Financial Conditions (see Parameters)
Based on the average credit quote of 11219074 in the Pet roleum Ref ineries industry an EMIS Financial Score of CC and an expected participation in the companyscredit of 11 the recommended credit quota is 740459Note The Financial Score is not deteriorated by Financial Conditions Based on the average credit quote of 11219074 in the Petroleum Refineries industry an EMISFinancial Score of CC and an expectedparticipation in the companys credit of 11 the recommended credit quota is 740459
Key parameters af f ecting quota value
EMIS Credit Analyt ics - Company vs Industry Key Stats
Company vs Industry - Key Stats
REPORTING DETAILS
11
EMIS Business Report Generated on 2016-06-02
Copyright copy 2015 EMIS all rights reserved A Euromoney Institutional Investor company Page 35 of 48
2014 2013 2012
Statement type Individual Individual Individual
Audited Non-Audited Non-Audited Non-Audited
Provider NotoriaMonitor B Fins NotoriaMonitor B Fins NotoriaMonitor B Fins
Companies in Industry 43 54 52
EMIS Benchmark Score 5266 6892 7170
Reporting Standard 197 197 197
Displaying units USD Thousands USD Thousands USD Thousands
SIZ E
2014 2014 2013 2012
AVERAGEINDUST RY
VALUE RANKING VALUE RANKING VALUE RANKING
Sales 915054 30679174 1 37904382 1 38981804 1
Assets 441712 13322594 1 17049137 1 16979933 1
Profit -47512 -1656877 41 58433 1 756549 1
Total Shareholders Equity 193824 5812614 1 9147078 1 9132469 1
Average Size Posit ion 11 1 1
GROWT H
2014 2014 2013 2012
AVERAGEINDUST RY
VALUE RANKING VALUE RANKING VALUE RANKING
Net Sales Growth Rate 2089 -575 11 -551 16 1190 12
Inc Dec In Assets 1610 -901 20 -243 22 -1039 30
Inc DecIn Net Income -406205 -340170 24 -9249 28 -078 17
Increase (Decrease) In Equity -0 77 -2601 22 -267 21 563 13
Average Growt h Posit ion 19 22 18
PROFIT ABILIT Y
2014 2014 2013 2012
AVERAGEINDUST RY
VALUE RANKING VALUE RANKING VALUE RANKING
Net Income Net Sales -519 -540 29 015 25 194 17
Return On Assets -1076 -1244 38 034 23 446 16
Net Income Net Worth -2451 -2850 39 064 36 828 28
Operational Profit Sales -439 -438 27 027 25 168 18
Average Prof it abilit y Posit ion 33 27 20
INDEBT EDNESS
2014 2014 2013 2012
AVERAGEINDUST RY
VALUE RANKING VALUE RANKING VALUE RANKING
Indebtedness 5612 5637 22 4635 21 4622 22
Leverage 12789 12920 33 8639 36 8593 40
Total Liabilities Sales 2709 2448 17 2085 17 2013 21
EMIS Business Report Generated on 2016-06-02
Copyright copy 2015 EMIS all rights reserved A Euromoney Institutional Investor company Page 36 of 48
Fiscal year 2014Companies in Industries 43
IndustryPetroleum Refineries
Current Liabilities Total Liabilities 6146 6279 7 7210 11 6768 11
Average Indebt edness Posit ion 20 21 24
EFFICIENCY
2014 2014 2013 2012
AVERAGEINDUST RY
VALUE RANKING VALUE RANKING VALUE RANKING
Days Receivables 23 24 8 24 10 24 6
Days Inventory 36 33 16 46 19 48 23
Suppliers Turnover 49 45 10 50 15 45 15
Operational Cycle 59 57 11 70 13 72 14
Average Ef f iciency Posit ion 11 14 15
LIQUIDIT Y
2014 2014 2013 2012
AVERAGEINDUST RY
VALUE RANKING VALUE RANKING VALUE RANKING
Current Ratio 128 132 19 142 21 157 22
Quick Ratio 132 132 19 142 21 157 22
Working Capital 42581 1486941 1 2418659 1 3019099 1
Average Liquidit y Posit ion 13 14 15
OT HERS
2014 2014 2013 2012
AVERAGEINDUST RY
VALUE RANKING VALUE RANKING VALUE RANKING
Gross Profit 0 76 062 31 491 34 614 33
Other Income -1926 -1852 32 64868 3 5153 6
Reduction In Debt 158 0 13 0 17 0 12
Average Ot hers Posit ion 25 18 17
EMIS Credit Analyt ics - Company vs Industry Balance Sheet
Company vs Industry - Balance Sheet
REPORTING DETAILS
2014 2013 2012
Statement type Individual Individual Individual
Audited Non-Audited Non-Audited Non-Audited
Provider NotoriaMonitor B Fins NotoriaMonitor B Fins NotoriaMonitor B Fins
Companies in Industry 43 54 52
EMIS Benchmark Score 5266 6892 7170
Reporting Standard 197 197 197
EMIS Business Report Generated on 2016-06-02
Copyright copy 2015 EMIS all rights reserved A Euromoney Institutional Investor company Page 37 of 48
CURRENT ASSET S 2014INDUST RY
2014COMPANY
2013INDUST RY
2013COMPANY
2012INDUST RY
2012COMPANY
V H V H V H V H V H V H
Cash And Banks 1003 11838 1034 6846 533 410 559 851 482 -4599 502 -5387
Short Term Investments 003 -404 000 NA 004 -7992 000 NA 018 457613 000 NA
Account Receivables (Trade) 1320 1670 1510 -915 1313 -821 1513 -380 1346 -1338 1534 005
Inventory 2075 -1109 2104 -2851 2710 -1100 2677 -841 2866 -1097 2852 -789
Deferred Assets 014 -1494 007 -4068 020 -2569 011 -3444 025 -385 017 16719
Current Assets 4413 1190 4656 -1101 4579 -900 4760 -533 4737 -1703 4906 -1431
FIXED ASSET
2014INDUST RY
2014COMPANY
2013INDUST RY
2013COMPANY
2012INDUST RY
2012COMPANY
V H V H V H V H V H V H
- Land And Properties 4838 1574 4846 -907 4853 -232 4850 065 4677 -1788 4701 -690
- Other Equipments 004 -262 000 NA 004 6983 000 NA 002 -1186 000 NA
Fixed Assets 4872 1626 4846 -907 4865 -275 4850 065 4710 -1737 4701 -690
Intangible Assets (Net) 202 823 150 -1458 217 -2685 160 -4312 279 -652 275 199
Investments 240 4117 265 2041 197 13125 200 21858 080 2964 061 5970
Deferred Assets 281 11870 082 15497 149 -2699 029 -4916 193 5695 056 -2566
Total Long Term Assets 5585 1962 5344 -720 5421 -302 5240 036 5263 -1044 5094 -625
T OT AL ASSET S
2014INDUST RY
2014COMPANY
2013INDUST RY
2013COMPANY
2012INDUST RY
2012COMPANY
V H V H V H V H V H V H
Total Assets 10000 1610 10000 -901 10000 -585 10000 -243 10000 -1368 10000 -1039
CURRENT LIABILIT Y
2014INDUST RY
2014COMPANY
2013INDUST RY
2013COMPANY
2012INDUST RY
2012COMPANY
V H V H V H V H V H V H
Suppliers 2801 1472 2839 -1163 2835 -082 2923 603 2691 -3100 2690 -2855
Other Short Term Liabilities 13741 2571 701 5233 12691 320 419 -676 11578 NA 438 NA
Total Current Liability 3449 2100 3540 -362 3309 -111 3342 424 3151 -1924 3128 -1691
LONG T ERM LIABILIT Y
2014INDUST RY
2014COMPANY
2013INDUST RY
2013COMPANY
2012INDUST RY
2012COMPANY
V H V H V H V H V H V H
Long Term Deferred Liabilities 839 -299 028 -299 1004 -2717 026 -2717 1298 NA 035 NA
Other Long Term Liabilities 2187 6238 2070 4861 1564 -1129 1267 -1525 1659 -3979 1459 -3665
Long Term Liabilities 2163 6134 2097 4757 1556 -1368 1293 -1553 1698 -3494 1494 -3513
T OT AL LIABILIT Y
2014INDUST RY
2014COMPANY
2013INDUST RY
2013COMPANY
2012INDUST RY
2012COMPANY
V H V H V H V H V H V H
Total Liabilities 5612 3390 5637 1066 4866 -551 4635 -215 4848 -2553 4622 -2383
EQUIT Y
2014INDUST RY
2014COMPANY
2013INDUST RY
2013COMPANY
2012INDUST RY
2012COMPANY
V H V H V H V H V H V H
EMIS Business Report Generated on 2016-06-02
Copyright copy 2015 EMIS all rights reserved A Euromoney Institutional Investor company Page 38 of 48
Fiscal year 2014Companies in Industries 43
IndustryPetroleum Refineries
Capital 212 3149 226 000 187 -325 206 000 182 -237 201 003
Other Reserves 11156 3618 263 000 9512 000 239 000 8955 -143 233 -2444
Equity Appreciation -178 -439428 -173 -142830 005 5496 -010 -47857 003 4198565 003 NA
Retained Earnings 3652 -439 3702 -2707 4435 -418 4618 -192 4357 -050 4594 1065
Minority Interest 5213 074 346 075 6008 -1233 312 -1231 6451 -1929 347 -1929
Total Net Worth 4388 -077 4363 -2601 5134 -618 5365 -267 5152 153 5378 563
T OT AL LIABILIT Y AND EQUIT Y
2014INDUST RY
2014COMPANY
2013INDUST RY
2013COMPANY
2012INDUST RY
2012COMPANY
V H V H V H V H V H V H
Total Liabilities And Net Worth 10000 1610 10000 -901 10000 -585 10000 -243 10000 -1368 10000 -1039
EMIS Credit Analyt ics - Company vs Industry Income Statement
Company vs Industry - Income Statement
REPORTING DETAILS
2014 2013 2012
Statement type Individual Individual Individual
Audited Non-Audited Non-Audited Non-Audited
Provider NotoriaMonitor B Fins NotoriaMonitor B Fins NotoriaMonitor B Fins
Companies in Industry 43 54 52
EMIS Benchmark Score 5266 6892 7170
Reporting Standard 197 197 197
OPERAT ING PROFIT
2014INDUST RY
2014COMPANY
2013INDUST RY
2013COMPANY
2012INDUST RY
2012COMPANY
V H V H V H V H V H V H
Sales 10000 2089 10000 -575 10000 -1145 10000 -551 10000 500 10000 1190
Cost Of Goods Sold 9924 2648 9938 -150 9485 -1062 9509 -427 9396 612 9386 1253
Gross Profit 0 76 -8210 062 -8814 515 -2441 491 -2451 604 -978 614 313
Administrative AndGeneral Expenses
149 3309 141 420 135 -905 127 -479 132 -638 126 379
Selling Expenses 2650 5320 364 095 2091 094 340 028 1835 1798 320 578
Operational Profit -439 -165868 -438 -163453 034 -8046 027 -8483 154 -2807 168 -206
NON OPERAT ING INCOME
2014INDUST RY
2014COMPANY
2013INDUST RY
2013COMPANY
2012INDUST RY
2012COMPANY
V H V H V H V H V H V H
Total Non-Operating Revenue 036 465 033 -2304 042 -6818 040 -6944 117 -4630 125 -4930
- Financial Revenue 036 465 033 -2304 042 -6818 040 -6944 117 -4630 125 -4930
Total Non-Operating Expenses 190 24437 176 20967 067 -2118 053 -3252 075 -6320 075 -5970
- Financial Expenses 190 24438 176 20967 067 -2119 053 -3252 075 -6320 075 -5970
Other Extraordinary Result 0 00 10000 000 NA -000 9992 000 NA -000 NA -000 NA
EMIS Business Report Generated on 2016-06-02
Copyright copy 2015 EMIS all rights reserved A Euromoney Institutional Investor company Page 39 of 48
Fiscal year 2014Companies in Industries 43
IndustryPetroleum Refineries
Profit Before Income Taxes -594 -909715 -580 -407834 008 -9639 014 -9402 196 -1306 217 -601
T AXES AND OT HERS
2014INDUST RY
2014COMPANY
2013INDUST RY
2013COMPANY
2012INDUST RY
2012COMPANY
V H V H V H V H V H V H
Extraordinary Income (Charges) 0 02 8819 005 4250 002 NA 004 NA 000 -10000 000 NA
Changes Due To Consolidation 027 -8018 002 -8023 162 -5086 008 -5086 292 -4973 014 -4977
Income Tax -0 74 -468549 -039 -72388 -002 7245 006 -8524 -006 -11275 038 -4155
NET PROFIT
2014INDUST RY
2014COMPANY
2013INDUST RY
2013COMPANY
2012INDUST RY
2012COMPANY
V H V H V H V H V H V H
Net Income -519 -406205 -540 -340170 016 -9342 015 -9249 213 544 194 -078
EMIS Credit Analyt ics - Company vs Industry Cash Flow
Company vs Industry - Cash Flow
REPORTING DETAILS
2014 2013 2012
Statement type Individual Individual Individual
Audited Non-Audited Non-Audited Non-Audited
Provider NotoriaMonitor B Fins NotoriaMonitor B Fins NotoriaMonitor B Fins
Companies in Industry 43 54 52
EMIS Benchmark Score 5266 6892 7170
Reporting Standard 197 197 197
CASH OPENING BALANCE
2014INDUST RY
2014COMPANY
2013INDUST RY
2013COMPANY
2012INDUST RY
2012COMPANY
V H V H V H V H V H V H
Initial Cash 222 410 267 851 257 -4599 232 -5387 422 9240 474 8565
CASH FROM SALES
2014INDUST RY
2014COMPANY
2013INDUST RY
2013COMPANY
2012INDUST RY
2012COMPANY
V H V H V H V H V H V H
Net Sales 10000 2089 10000 -575 10000 -1145 10000 -551 10000 500 10000 1190
+- Trade AccountsReceivable
-0 91 -28672 066 13160 059 -4685 027 779616 098 16969 -000 9978
Cash From Sales 9909 1908 10066 -539 10059 -1179 10027 -525 10098 763 10000 1377
CASH FOR PRODUCT ION
2014INDUST RY
2014COMPANY
2013INDUST RY
2013COMPANY
2012INDUST RY
2012COMPANY
V H V H V H V H V H V H
(-) Sales Cost -9924 -2648 -9938 150 -9485 1062 -9509 427 -9396 -612 -9386 -1253
(-) (Inc) Inventory 125 -1020 364 21062 168 -1077 111 -183 167 13866 106 12570
(+) (Inc) Suppliers 174 188875 -162 -30445 -012 9818 075 11510 -572 -26577 -468 -25767
EMIS Business Report Generated on 2016-06-02
Copyright copy 2015 EMIS all rights reserved A Euromoney Institutional Investor company Page 40 of 48
Cash For Production -9625 -2474 -9736 159 -9328 1572 -9324 962 -9801 -961 -9748 -1525
CASH FOR OPERAT ING
2014INDUST RY
2014COMPANY
2013INDUST RY
2013COMPANY
2012INDUST RY
2012COMPANY
V H V H V H V H V H V H
(-) Administrative Expenses -149 -3309 -141 -420 -135 905 -127 479 -132 638 -126 -379
+- Other Operating Results -0 00 -12524 000 NA 001 NA 000 NA 000 NA 000 NA
(-) Selling Expenses -2650 -5320 -364 -095 -2091 -094 -340 -028 -1835 -1798 -320 -578
(-) Period Income Taxes 074 468549 039 72388 002 -7245 -006 8524 006 11275 -038 4155
(+) (Inc) Taxes Payable 002 69344 000 NA -000 -14351 000 NA 001 17119 000 NA
(-) (Inc) Labor EstimatesAnd Provision
-0 12 9215 -000 9200 -189 -12719 -004 -12717 614 184104751 015 NA
Cash For Operation -2736 -3712 -466 794 -2413 -5873 -477 379 -1346 2282 -469 405
OPERAT IONAL CASHFLOW
2014INDUST RY
2014COMPANY
2013INDUST RY
2013COMPANY
2012INDUST RY
2012COMPANY
V H V H V H V H V H V H
Net Operating Cashflow -2453 -7631 -137 -15709 -1682 -4202 225 19816 -1049 1952 -217 -3750
INVEST MENT S IN ASSET S
2014INDUST RY
2014COMPANY
2013INDUST RY
2013COMPANY
2012INDUST RY
2012COMPANY
V H V H V H V H V H V H
(-) (Inc) Net Fixed Assets -329 -67408 210 151250 069 -8689 -014 -10872 468 25487 152 12255
(ndash) (Inc) Investments -0 34 2746 -020 7025 -056 -47405 -062 -48471 -009 -10215 -010 -10826
FREE CASHFLOW
2014INDUST RY
2014COMPANY
2013INDUST RY
2013COMPANY
2012INDUST RY
2012COMPANY
V H V H V H V H V H V H
Free Cashflow -2816 -10396 054 -6596 -1669 -15077 150 28813 -589 5095 -075 -33837
FINANCIAL
2014INDUST RY
2014COMPANY
2013INDUST RY
2013COMPANY
2012INDUST RY
2012COMPANY
V H V H V H V H V H V H
(-) Financial Expenses -154 -65083 -143 -92333 -025 -15241 -013 -12496 042 20392 050 -1713
Cashflow After Financial Costs -2969 -11196 -089 -16127 -1694 -17395 136 60823 -547 5391 -025 -12770
(+) (Inc) Debt Short Term -000 9949 000 NA -000 -21237 000 NA 000 10091 000 NA
(+) (Inc) Debt Long Term 002 69344 000 NA -000 -14351 000 NA 001 17119 000 NA
Cashflow After FinancialExpenses
-2968 -11175 -089 -16127 -1694 -17455 136 60823 -546 5512 -025 -12770
CASHFLOW
2014INDUST RY
2014COMPANY
2013INDUST RY
2013COMPANY
2012INDUST RY
2012COMPANY
V H V H V H V H V H V H
(-) Dividends 503 42726 -126 -4528 -186 682 -082 -1139 -176 -73580 -069 -52834
(-) Other Expenses 002 8819 005 4250 002 NA 004 NA 000 -10000 000 NA
(-) Other Current Debtors 000 NA 000 NA 000 NA 000 NA 000 NA 000 NA
(-) Other Current Assets 002 -7807 002 -2258 011 361835 003 15505 000 10702 -005 -48602
(-) Long-Term AccountsReceivable
000 NA 000 NA 000 NA 000 NA 000 NA 000 NA
EMIS Business Report Generated on 2016-06-02
Copyright copy 2015 EMIS all rights reserved A Euromoney Institutional Investor company Page 41 of 48
(-)(Inc) Deferred And OtherLong Term Assets
-0 72 -37515 -022 -26027 032 11570 013 4240 -178 -88060 008 14351
(-) (Inc) Other Long TermLiabilities
406 56718 294 37011 -105 8205 -103 7364 -518 -37893 -368 -40951
(+) Inflation Adjustmentst Non Recurring Incomes
000 NA 000 NA 000 NA 000 NA 000 NA 000 NA
(+) (Inc) Other AccountsPayable
115 218744 105 82115 -007 -10274 -014 -10676 216 2710149 191 NA
(+) Extraordinary Income Consolidation
027 -8018 002 -8023 162 -5085 008 -5057 292 -4974 014 -5006
(-) Intangible Goods -007 -12244 011 -8077 040 29906 055 230557 009 12060 -002 8712
Complementary Cash-Flow 976 240248 271 31907 -051 8725 -117 5210 -356 -14616 -230 -28078
Net Cash Generation -1992 -3796 183 77289 -1745 -7131 020 10729 -902 -10194 -255 -21675
Ending Cash -1770 -4381 449 6846 -1488 -17434 251 851 -480 -11112 219 -5387
EMIS Business Report Generated on 2016-06-02
Copyright copy 2015 EMIS all rights reserved A Euromoney Institutional Investor company Page 42 of 48
Score Scale
Financial ScaleFinancial Model has 8 risk categories
A - Very Low RiskAA - Low RiskBB - Moderate Low RiskB - Below Average RiskCC - Above Average RiskC - Moderate High RiskD - High Risk E - Very High Risk
Risk Profile
High RiskHigh Risk - used when the loan amounts are relatively high and have a longrepayment period A loss in the Credit would seriously affect the companyresults Commercial credit with maturity exceeding 36 months
A loss in the Credit would seriously affect the results Bank credited to morethan 36 months
Vertical Weighting
Pampl
Sales Growth 12
Operating Profit 12
Net Profit 12
Sub t ot al 36
Balance
Days Receivables 12
Days Inventory 10
Current Ratio 8
Indebtness 8
Indebtednesssales 8
Balance Sub T ot al 46
Cash Flow
Cash From Sales 2
Cash For Production 2
Cash For Operations 2
Operating Cash Generation 5
Free Cash Flow 3
Cash Flow After Fin Ex 2
Cash Flow After Fin Result 2
Reduction In Debt 0
Cash Flow Sub T ot al 18
Total Vertical Weights 100
Tolerance Margin 5
Financial Conditions
Condit ions Score
Negative Net Worth CC
Final Weighting
EMIS Benchmark Score 90
EMIS Trend Score 10
EMIS Credit Analyt ics - EMIS Credit Analyt ics Assumptions
EMIS Business Report Generated on 2016-06-02
Copyright copy 2015 EMIS all rights reserved A Euromoney Institutional Investor company Page 43 of 48
Ret urn on Asset s (ROA)
An indicator of how profitable a company is relative to its total assets ROA gives an
idea as to how efficient management is at using its assets to generate earnings
Calculated by dividing a companys annual earnings by its total assets
Calculated as Net prof it T ot al Asset
Ret urn on Equit y (ROE)
A measure of a corporations profitability that reveals how much profit a company
generates with the money shareholders have invested
Calculated as Net prof it Shareholders equit y
Ret urn on Sales (ROS)
A ratio widely used to evaluate a companys operational efficiency ROS is also
known as a firms operating profit margin
Calculated as Net Prof it Net Sales Revenue
Bookvalue
A companys common stock equity as it appears on a balance sheet equal to total
assets minus liabilities preferred stock and intangible assets such as goodwill
Current Rat io
A liquidity ratio that measures a companys ability to pay short-term obligations
Calculated as Current Asset sCurrent Liabilit ies
Quick rat io
An indicator of a companys short-term liquidity The quick ratio measures a
companys ability to meet its short-term obligations with its most liquid assets The
higher the quick ratio the better the position of the company
Calculated as (Current Asset s-Invent ories)Current Liabilit ies
Debt t o equit y
A measure of a companys financial leverage calculated by dividing its total
liabilities by stockholders equity It indicates what proportion of equity and debt the
company is using to finance its assets
Calculated as T ot al Liabilit iesShareholders Equit y
Debt t o t ot al asset s
A metric used to measure a companys financial risk by determining how much of
the companys assets have been financed by debt Calculated by adding short-term
and long-term debt and then dividing by the companys total assets
Calculated as Short T erm Debt s+Long T erm Debt sT ot al Asset s
Leverage rat io
Leverage ratio provide an indication of the long term solvency of the firm
Calculated as T ot al Asset sShareholders Equit y
Debt Ent erprise Value
This metric is equivalent to the payback period used by debtholders Calculated as
Debt Ent erprise Value
Market Capit alizat ionEBIT DA
Calculated as Market Capit alizat ionEBIT DA
Earning Bef ore Int erest s and T axes (EBIT )
Earning Before Interests and Taxes (EBIT)
EBIT DA
Earnings before interest taxes depreciation and amortization (EBITDA) is a non-
GAAP metric that can be used to evaluate a companys profitability Calculated as
Ent erprise valueNet Sales
Dividing the enterprise value of a firm by its sales or revenues is a way of
comparing firms in cyclical industries Calculated as Enterprise Value Net Sales
Revenue
Ent erprise valueGross income
Calculated as Enterprise value Gross income
Ent erprise valueT ot al Asset s
Calculated as Enterprise value Total Assets
EBIT DA Margin
A measurement that provides a clear view of the companyrsquos core profitability
Calculated as EBITDA Net Sales Revenue
T ot al Operat ing Revenue T rend
Calculated as Total Operating Revenue current year Total Operating Revenue
previous year
Gross Prof it T rend
Calculated in percentage as (Gross Prof it Current Year Gross Prof it
Previous Year) ndash 1
EBIT DA T rend
Calculated as EBITDA current year EBITDA previous year
Account s Receivables T rend
Calculated in percentage as T rade Account s Receivables current year
T rade Account Receivables previous year
Invent ory T rend
Calculated as Inventories current year Inventories previous year
Net Propert y Plant and Equipment (PPampE) T rend
Calculated as Net PPampE current year Net PPampE previous year
T ot al Asset s T rend
Calculated as Total Assets current year Total Assets previous year
Bookvalue T rend
Calculated as Bookvalue current year Bookvalue previous year
Shareholders Equit y T rend
Calculated as Shareholdersrsquo Equity current year Shareholdersrsquo Equity previous
year
Cash f rom Operat ions T rend
Calculated as Net Cash Flow from Operations current year Net Cash Flow from
Operations previous year
Capit al Expendit ures T rend
Calculated as CAPEX current year CAPEX previous year
Dividend per Share T rend
Calculated as Dividend value per (common) share current year Dividend value
per (common) share previous year
Cost t o Income Rat io
A key financial measure showing a bankrsquos cost in relation to its income Ratio is
calculated as Total Operational Cost Total Operational Income
Glossary
EMIS Business Report Generated on 2016-06-02
Copyright copy 2015 EMIS all rights reserved A Euromoney Institutional Investor company Page 44 of 48
EBIT DA = Operat ing Revenue - Operat ing Expenses (Depriciat ion and
Amort izat ion excluded)
Ent erprise Value EBIT DA
Enterprise Value EBITDA is the metric most used to measure how many years it
would take to pay back the investment
Ent erprise Value
A measure of a companys value often used as an alternative to straightforward
market capitalization EV is calculated as market cap plus debt minority interest
and preferred shares minus total cash and cash equivalents
Dooms day rat io
Calculated as Cash Current Liabilit ies
Long T erm Debt t o Capit al
A ratio showing the financial leverage of a firm calculated by dividing long-term
debt by the amount of capital available Calculated as Long t erm debt Long
t erm debt + Pref f ered St ock + Common St ock
Int erest Coverage Rat io
A ratio used to determine how easily a company can pay interest on outstanding
debt The interest coverage ratio is calculated by dividing a companys earnings
before interest and taxes (EBIT) of one period by the companys interest expenses of
the same period Calculated as EBIT Int erest expense
Cash Flow t o Debt
This coverage ratio compares a companys operating cash flow to its total debt
which for purposes of this ratio is defined as the sum of short-term borrowings the
current portion of long-term debt and long-term debt This ratio provides an
indication of a companys ability to cover total debt with its yearly cash flow from
operations The higher the percentage ratio the better the companys ability to carry
its total debt Calculates as Operat ing Cash Flow T ot al Debt
Ret urn on Capit al
A ratio that indicates the efficiency and profitability of a companys capital
investments Calculated as Net Income (Total Asset - Current Liabilities)
Gross Prof it Margin
A financial metric used to assess a firms financial health by revealing the
proportion of money left over from revenues after accounting for the cost of goods
sold Gross profit margin serves as the source for paying additional expenses and
future savings Calculated as (Net Sales Revenue - Cost of Goods Sold) Net
Sales Revenue
Operat ing Prof it Margin
A ratio used to measure a companys pricing strategy and operating efficiency
Calculated as Operat ing prof it Net sales
Account s Receivable T urnover
An accounting measure used to quantify a firms effectiveness in extending credit
as well as collecting debts The receivables turnover ratio is an activity ratio
measuring how efficiently a firm uses its assets Calculated as Net Sales
Revenue T rade Account s Receivable (Net )
Invent ory T urnover
A ratio showing how many times a companys inventory is sold and replaced over a
period Calculated as Sales Invent ory
Current asset t urnover
Calculated as Net Sales Revenue T ot al Current Asset
Ef f iciency Rat io
Calculated as Total non-interest expenses (Total net interest income + Total non-
interest income)
Loans t o Deposit s Rat io
A commonly used statistic for assessing a banks liquidity Calculated as Total
Loans Total Deposits
Liquid Asset s t o Deposit s Rat io
This ratio indicates extent of liquidity maintained by a bank for meeting the demand
made by the depositors Calculated as (Cash + Financial assets held for trading)
Total Deposits
Loans t o Asset Rat io
Calculated as Total Loans Total Assets
Net Int erest Income T rend
Calculated as Net Interest Income current year Net Interest Income previous year
Net Fee and Commission Income T rend
Calculated as Net Fee and Commission Income current year Net Fee and
Commission Income previous year
Loans and Advances t o Cust omers T rend
Calculated as Loans and Advances to Customers current year Loans and
Advances to Customers previous year
Deposit s f rom Cust omers T rend
Calculated as Deposits from Customers current year Deposits from Customers
previous year
Loss Rat io
This ratio indicates the average cost of insurance protection per each dollar of net
premiums earned during the period Calculated as Total Losses Incurred in Claims
Net Insurance Premium Revenue
Underwrit ing Expenses Rat io
This ratio measures operational efficiency in underwriting Calculated as
Underwriting expenses Net Insurance Premium Revenue
Policyholder Dividend Rat io
Calculated as Dividends Net Insurance Premium Revenue
Combined LossExpense Rat io
Calculated as Loss Ratio + Underwriting Expenses Ratio + Policyholder Dividend
Ratio When the combined ratio is under 100 underwriting results are
considered profitable when the combined ratio is over 100 underwriting results
are considered unprofitable
Ceded Premium Rat io
Calculated as Insurance Premium Ceded to Reinsurers Insurance Premium
Revenue
Net Premiums Earned T rend
Calculated as Net Insurance Premium Revenue current year Net Insurance
Premium Revenue previous year
Fees and Commissions T rend
Calculated as Net Fees and Commissions Income current year Net Fees and
Commissions Income previous year
Net Invest ment Income T rend
EMIS Business Report Generated on 2016-06-02
Copyright copy 2015 EMIS all rights reserved A Euromoney Institutional Investor company Page 45 of 48
Fixed-asset t urnover
This ratio is a rough measure of the productivity of a companys fixed assets
(property plant and equipment or PPampE) with respect to generating sales For most
companies their investment in fixed assets represents the single largest
component of their total assets This annual turnover ratio is designed to reflect a
companys efficiency in managing these significant assets Simply put the higher
the yearly turnover rate the better Calculated as Revenue Propert y Plant and
Equipment
Asset T urnover
The amount of sales generated for every dollars worth of assets It is calculated by
dividing sales in dollars by assets in dollars Calculated as Revenue Asset s
Revenue T rend
Calculated as (Net Sales Current Year Net Sales Previous Year)
Net Income T rend
Calculated as (Net Income Current Year Net Income Previous Year)
Operat ing Income T rend
Calculated as (Operat ing Income Current Year Operat ing Income
Previous year)
PriceBook Rat io
A ratio used to compare a stocks market value to its book value It is calculated by
dividing the current closing price of the stock by the latest years book value per
share Calculated as St ock price (T ot al Asset - Int angible asset s and
Liabilit ies)
PriceEarnings Rat io
A valuation ratio of a companys current share price compared to its per-share
earnings Calculated as Market value per share Earning per share EPS
Market capShareholder equit y
A financial ratio showing the premium which is included in the current market price
compared to the actual value of Shareholder equity of the company Calculated as
Market capit alizat ion Shareholders equit y
PriceEBIT Rat io
The PriceEBIT ratio is a market value indicator similar to the PE ratio which shows
the number of times the market price exceeds the earnings per share before the
effects of gross interest abnormal items and tax The PriceEBIT ratio is calculated
as follows Valuat ion price EBIT
T ot al Capit al Rat io
Calculated as T ot al capit al (T ier 1 and T ier 2) rat io = T ot al capit al (T ier 1
and T ier 2) Risk-adjust ed asset s
T ier 1 Rat io
Tier 1 capital is the core measure of a banks financial strength from a regulators
point of view It consists primarily of shareholders equity but may also include
preferred stock that is irredeemable and non-cumulative and retained earnings
Risk Weight ed Asset s
Risk weights are in five categories from zero to 100 per cent Those carrying a
zero weight include notes and coins gold matched by gold liabilities balances with
the Reserve Bank and commonwealth government securities with less than twelve
months to maturity Commonwealth government securities with more than twelve
months to maturity carry a 10 per cent risk weighting as do state government
securities Claims on other banks Australian local governments and public-sector
organisations other than those with corporate status or which operate
Calculated as Investment Income current year Investment Income previous year
Receivables Arising Out Of Direct Insurance Operat ions T rend
Calculated as Receivables Arising out of Direct Insurance Operations current year
Receivables Arising out of Direct Insurance Operations previous year
Operat ing ROA
An indicator that shows the type of net profit which is actually generated by business
effort Calculated as Operat ing Prof it (EBIT ) T ot al Asset s
Payables T urnover
An indicator that evaluates how fast a company pays off its creditors (suppliers)
Calculated as Purchases T rade Payables
Working Capit al T urnover
A measure that indicates how efficiently the company generates revenue with its
working capital Working capital is defined as current assets minus current liabilities
Calculated as Net Sales (T ot al Current Asset s ndash T ot al Current
Liabilit ies)
Working Capit al
A measure of a companyrsquos short term financial health Calculated as T ot al
Current Asset s ndash T ot al Current Liabilit ies
Cash Rat io
A measure of a companyrsquos liquidity in crisis situation Only highly marketable
securities and cash are included Calculated as (T ot al Cash and Cash
Equivalent s + Market able securit ies) T ot al Current Liabilit ies
Cash Flow f rom Operat ion Rat io
A measure of how well current liabilities are covered by the cash flow generated
from a companyrsquos operations Calculated as Net Cash Flow f rom Operat ing
Act ivit ies T ot al Current Liabilit ies
Debt Coverage
A measure that shows a companyrsquos ability to cover total debt with its yearly cash
flow from operations Calculated as Net Cash Flow f rom Operat ing Act ivit ies
T ot al Debt
Cash Flow t o Revenue
This ratio measures the amount of operating cash flow generated for each dollar of
revenue Calculated as Net Cash Flow f rom Operat ing Act ivit ies Net Sales
Revenue
Cash Ret urn on Asset s
This ratio measures the return of operating cash flow attributed to all providers of
capital Calculated as Net Cash Flow f rom Operat ing Act ivit ies T ot al
Asset s
Cash Ret urn on Equit y
This ratio measures the return of operating cash flow attributed to shareholders
Calculated as Net Cash Flow f rom Operat ing Act ivit ies T ot al
Shareholdersrsquo Equit y
Cash t o Income
This ratio measures the ability to generate cash from companyrsquos operations
Calculated as Net Cash Flow f rom Operat ing Act ivit ies Operat ing Prof it
(EBIT )
CashT ot al Asset s
Calculated as Cash and Cash Equivalent s T ot al Asset s
EMIS Business Report Generated on 2016-06-02
Copyright copy 2015 EMIS all rights reserved A Euromoney Institutional Investor company Page 46 of 48
commercially carry a 20 per cent risk weighting Loans secured by a mortgage
over residential property and with a loan-to-valuation of 80 per cent or less carry a
50 per cent risk weighting and loans to companies or individuals carry a 100 per
cent risk weighting
Market Cap Net cash
A ratio measure the market value of the company to the Net cash position of the
company Calculated as Market capit alizat ion (Cash and cash equivalent s
minus long-t erm debt )
Net Cash
Net cash is commonly used in evaluating a companys cash flow More generally
net cash can refer to the amount of cash remaining after a transaction has been
completed and all charges and deductions related to the transaction have been
subtracted Calculated as T ot al cash minus t ot al short t erm liabilit ies
Annualised Ret urn on Equit y (ROE)
Return on Equity ratio (ROE) converted into an annual basis
Annualised Ret urn on Asset s (ROA)
Return on Assets ratio (ROA) converted into an annual basis
Export Proport ion Rat io
The percentage figure of the proportion of the export revenue from the total sales
revenue of the company Calculated as Export revenue T ot al revenue
Net Debt
A metric that shows companys overall debt situation by netting the value of
financial liabilities with its cash and other similar liquid assets Calculated as
financial liabilities - cash and cash equivalents
EPS
The portion of a companys profit allocated to each outstanding share Calculated
as Net Profit Outstanding Shares
PE
A valuation ratio of a companys current share price compared to its per-share
earnings Calculated as Market value per share Earning per share EPS
Market Capit alizat ionNet Sales
Calculated as Market Capitalization Net Sales Revenue
Market Capit alizat ionGross income
Calculated as Market Capitalization Gross Profit
Market Capit alizat ionEBIT
Calculated as Market Capitalization EBIT
Market Capit alizat ionT ot al Asset s
Calculated as Market Capitalization Total Assets
ReceivablesT ot al asset s
Calculated as T rade Account s Receivable T ot al Asset s
Invent oriesT ot al asset s
Calculated as Invent ories T ot al Asset s
Fixed asset sT ot al asset s
Calculated as Non-current Asset s T ot al Asset s
Current Liabilit iesT ot al Liabilit ies
Calculated as T ot al Current Liabilit ies T ot al Liabilit ies
Salaries and Employee Benef it sNet sales
Calculated as Employee Benef it Expenses Net Sales Revenue
Administ rat ive ExpensesNet Sales
Calculated as Administ rat ive Expenses Net Sales Revenue
Depreciat ion and Amort izat ionNet sales
Calculated as Depreciat ion Amort izat ion and Impairment Charges Net
Sales Revenue
Int erest paidNet sales
Calculated as Int erest -t ype Expenses Net Sales Revenue
Income t axNet sales
Calculated as Income T ax Net Sales Revenue
Operat ing Cash Flow t o T ot al Cash Flow
Calculated as Net Cash Flow f rom Operat ing Act ivit ies Net
IncreaseDecrease in Cash and Cash Equivalent s
Cash Flow f rom Invest ing t o T ot al Cash Flow
Calculated as Net cash f low f rom (used in) invest ing act ivit ies Net
IncreaseDecrease in Cash and Cash Equivalent s
Cash f low f rom f inancing t o T ot al cash f low
Calculated as Net cash flow from (used in) financing activities Net
IncreaseDecrease in Cash and Cash Equivalents
Average Yie ld on Asset s
Calculated as T ot al Int erest Income T ot al Asset s
Disclaimer
Whilst EMIS attempts at all times to ensure the accuracy and reliability of the information it provides due to the vast quantity of processed data and the fact that some of
the third-party data cannot always be verified including information provided directly by the subject of the enquiry EMIS does not guarantee the correctness or the
effective delivery of the information and shall not be held responsible for any errors or omissions therein
The content and recommendations shall only be used as a reference in business decisions of EMIS clients and shall not be used for any other purposes EMIS and its
affiliates shall not be held liable for any loss of the clients arising out of its own business decisions whether or not the making of such decision has been referred to this
contentrecommendation
EMIS Business Report Generated on 2016-06-02
Copyright copy 2015 EMIS all rights reserved A Euromoney Institutional Investor company Page 47 of 48
EMIS Business Report Generated on 2016-06-02
Copyright copy 2015 EMIS all rights reserved A Euromoney Institutional Investor company Page 48 of 48
- Table of Contents
- Company Tear Sheet
-
- Contact Information
- NAICS Industry Classification
- Business description
- Basic Information
- EMIS Financial Score
- Share Price information
- Key Executives
- Ownership Details
- Subsidiaries and Affiliates
- Key Financial Highlights
- Financial Performance Charts
- Latest MampA and ECM Deals
- Top Competitors
-
- Financial Statements
-
- Annual Statements
- Interim Statements
- Ratios
- Multiples
-
- Company Documents
-
- Financial DocumentsAnnual Reports
- Corporate Actions
-
- News amp Reports
-
- News
- Reports
-
- MampA and ECM Deals
-
- EMIS DealWatch Deals
- EMIS DealWatch Intents
-
- EMIS Credit Analytics
-
- Summary
- EMIS Financial Score
- EMIS Benchmark Score
- EMIS Credit Quota
- Conclusions
- Company vs Industry Key Stats
- Company vs Industry Balance Sheet
- Company vs Industry Income Statement
- Company vs Industry Cash Flow
- EMIS Credit Analytics Assumptions
-
- Glossary
- Disclaimer
-
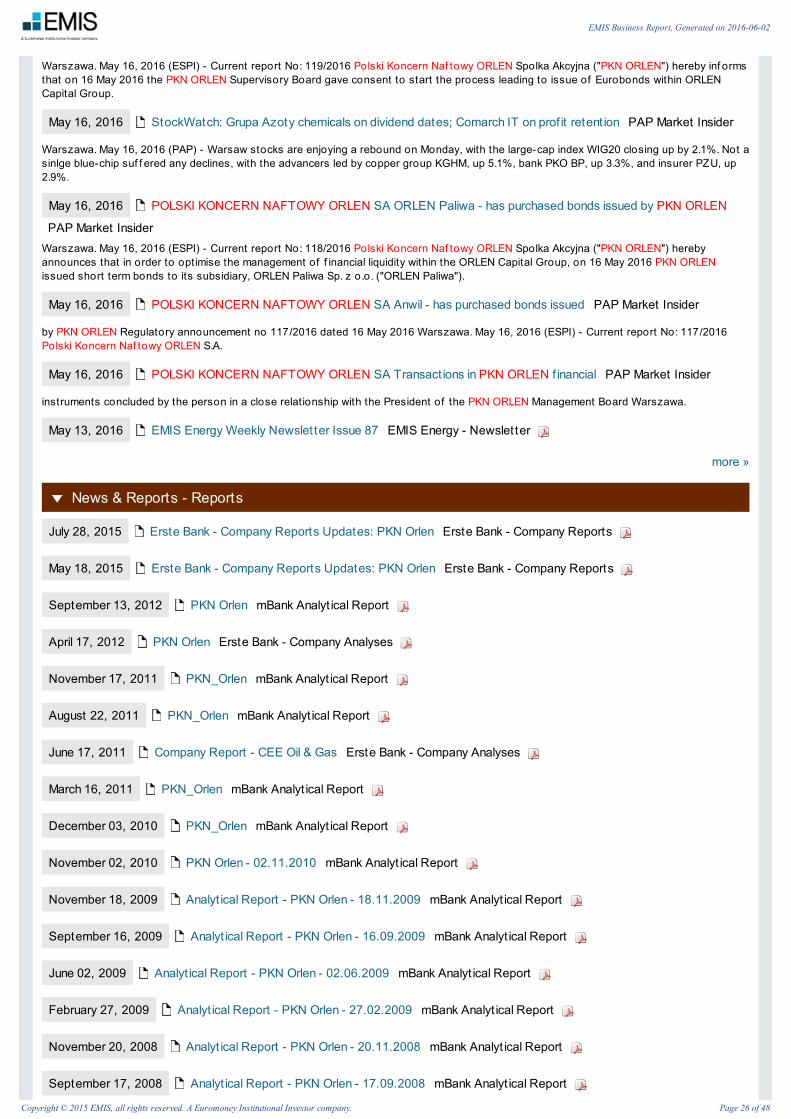
more raquo
Warszawa May 16 2016 (ESPI) - Current report No 1192016 Polski Koncern Naf towy ORLEN Spolka Akcyjna (PKN ORLEN) hereby inf ormsthat on 16 May 2016 the PKN ORLEN Supervisory Board gave consent to start the process leading to issue of Eurobonds within ORLENCapital Group
May 16 2016 StockWatch Grupa Azoty chemicals on dividend dates Comarch IT on prof it retent ion PAP Market Insider
Warszawa May 16 2016 (PAP) - Warsaw stocks are enjoying a rebound on Monday with the large-cap index WIG20 closing up by 21 Not asinlge blue-chip suf f ered any declines with the advancers led by copper group KGHM up 51 bank PKO BP up 33 and insurer PZU up29
May 16 2016 POLSKI KONCERN NAFTOWY ORLEN SA ORLEN Paliwa - has purchased bonds issued by PKN ORLEN
PAP Market InsiderWarszawa May 16 2016 (ESPI) - Current report No 1182016 Polski Koncern Naf towy ORLEN Spolka Akcyjna (PKN ORLEN) herebyannounces that in order to optimise the management of f inancial liquidity within the ORLEN Capital Group on 16 May 2016 PKN ORLENissued short term bonds to its subsidiary ORLEN Paliwa Sp z oo (ORLEN Paliwa)
May 16 2016 POLSKI KONCERN NAFTOWY ORLEN SA Anwil - has purchased bonds issued PAP Market Insider
by PKN ORLEN Regulatory announcement no 1172016 dated 16 May 2016 Warszawa May 16 2016 (ESPI) - Current report No 1172016Polski Koncern Naf towy ORLEN SA
May 16 2016 POLSKI KONCERN NAFTOWY ORLEN SA Transact ions in PKN ORLEN f inancial PAP Market Insider
instruments concluded by the person in a close relationship with the President of the PKN ORLEN Management Board Warszawa
May 13 2016 EMIS Energy Weekly Newslet ter Issue 87 EMIS Energy - Newslet ter
News amp Reports - Reports
July 28 2015 Erste Bank - Company Reports Updates PKN Orlen Erste Bank - Company Reports
May 18 2015 Erste Bank - Company Reports Updates PKN Orlen Erste Bank - Company Reports
September 13 2012 PKN Orlen mBank Analyt ical Report
April 17 2012 PKN Orlen Erste Bank - Company Analyses
November 17 2011 PKN_Orlen mBank Analyt ical Report
August 22 2011 PKN_Orlen mBank Analyt ical Report
June 17 2011 Company Report - CEE Oil amp Gas Erste Bank - Company Analyses
March 16 2011 PKN_Orlen mBank Analyt ical Report
December 03 2010 PKN_Orlen mBank Analyt ical Report
November 02 2010 PKN Orlen - 02112010 mBank Analyt ical Report
November 18 2009 Analyt ical Report - PKN Orlen - 18112009 mBank Analyt ical Report
September 16 2009 Analyt ical Report - PKN Orlen - 16092009 mBank Analyt ical Report
June 02 2009 Analyt ical Report - PKN Orlen - 02062009 mBank Analyt ical Report
February 27 2009 Analyt ical Report - PKN Orlen - 27022009 mBank Analyt ical Report
November 20 2008 Analyt ical Report - PKN Orlen - 20112008 mBank Analyt ical Report
September 17 2008 Analyt ical Report - PKN Orlen - 17092008 mBank Analyt ical Report
EMIS Business Report Generated on 2016-06-02
Copyright copy 2015 EMIS all rights reserved A Euromoney Institutional Investor company Page 26 of 48
more raquo
August 14 2008 Analyt ical Report - PKN Orlen - 14082008 mBank Analyt ical Report
June 04 2008 Analyt ical Report - PKN Orlen - 30052008 mBank Analyt ical Report
March 10 2008 Analyt ical Report - PKN Orlen - 10032008 mBank Analyt ical Report
February 21 2008 Analyt ical Report - PKN Orlen - 14022008 mBank Analyt ical Report
December 13 2007 Analyt ical Report - PKN Orlen - 04122007 mBank Analyt ical Report
August 21 2007 Analyt ical Report - PKN Orlen - 160807 mBank Analyt ical Report
July 02 2007 Analyt ical Report - PKN Orlen mBank Analyt ical Report
March 05 2007 Analyt ical Report - PKN Orlen mBank Analyt ical Report
August 24 2006 Analyt ical Report - PKN Orlen mBank Analyt ical Report
EMIS Business Report Generated on 2016-06-02
Copyright copy 2015 EMIS all rights reserved A Euromoney Institutional Investor company Page 27 of 48
MampA and ECM Deals - EMIS DealWatch Deals
DAT ECOUNT RY
OFT ARGET
T ARGET COMPANYDEALT YPE
BUYER SELLER DEAL INDUST RIESDEAL
VALUEUSD (MN)
ST AKE
20-Jan-16CzechRepublic
68 petrol stations of OMV Acquisition PKN Orlen SA OMV AG Gasoline Stations NA 100
16-Nov-15 Poland Assets of Euronaft Trzebinia Acquisition PKP Cargo SA PKN Orlen SASupport Activities forTransportation RailTransportation
1502 100
16-Nov-15 Poland Orlen Transport SA Acquisition Trans Polonia SA PKN Orlen SA Truck Transportation 2137 100
21-Oct-15 Germany13 SUN petrol stations ofGermania Petrol
Acquisition PKN Orlen SAGermaniaPetrol GmbH
Gasoline Stations NA 100
13-Oct-15 Canada Kicking Horse Energy Inc Acquisition PKN Orlen SA NA Oil and Gas Extraction 22634 100
13-Oct-15UnitedStates
FX Energy Inc Acquisition PKN Orlen SA NAOil and Gas ExtractionAgriculture Forestry Fishingand Hunting
8310 100
24-Sep-15 PolandTwo concessions in theregions of Lesser Polandand Subcarpathia
Acquisition PKN Orlen SADEADeutscheErdoel AG
Oil and Gas Extraction NA 100
20-Aug-15CzechRepublicPoland
Orlen KolTrans Sp z oo Acquisition PKP Cargo SA PKN Orlen SA Rail Transportation 4860 9985
20-Jul-15 Poland Bieszczady ProjectJointventure
PKN Orlen SA PolskieGornictwo Naftowe iGazownictwo SA
NA Oil and Gas Extraction NA 100
03-Jul-14CzechRepublic
Ceska Rafinerska ASMinoritystakepurchase
PKN Orlen SA Eni SpA Petroleum Refineries 4100 32445
14-May-14 Poland Orlen Medica Acquisition PZU TFI SA PKN Orlen SAHealth Care and SocialAssistance
1380 100
14-May-14 Poland Prof Med Sp z oo Acquisition PZU SA PKN Orlen SAHealth Care and SocialAssistance
119 9645
08-May-14 CanadaBirchill Exploration LimitedPartnership
Acquisition PKN Orlen SA
Bregal -BirchillInvestmentsSarl
Oil and Gas Extraction 23366 100
07-Nov-13CzechRepublic
Ceska Rafinerska ASMinoritystakepurchase
PKN Orlen SARoyal DutchShell Plc
Petroleum Refineries 2720 1633
16-Sep-13 Canada TriOil Resources Ltd Acquisition PKN Orlen SA NA Crude Petroleum Extraction 17753 100
07-Dec-12 Poland Shale gas licenses Acquisition PKN Orlen SAExxonMobilPoland
Natural Gas Extraction NA 100
02-Nov-12 Poland Anwil SAMinoritystakepurchase
PKN Orlen SA NAPesticide Fertilizer andOther Agricultural ChemicalManufacturing
2364 473
20-Aug-12 Poland Petrolot Acquisition PKN Orlen SAPolskie LinieLotnicze LOTSA
Petroleum and PetroleumProducts MerchantWholesalers
9241 49
01-Jun-12 Poland Gas bottle assets Acquisition Gaspol SA PKN Orlen SA Nonstore Retailers NA 100
01-Aug-11 Poland Anwil SAMinoritystakepurchase
PKN Orlen SA Energa SAPesticide Fertilizer andOther Agricultural ChemicalManufacturing
2158 415
MampA and ECM Deals - EMIS DealWatch Intents
EMIS Business Report Generated on 2016-06-02
Copyright copy 2015 EMIS all rights reserved A Euromoney Institutional Investor company Page 28 of 48
DEALSIDE
INT ENTANNOUNCEMENT
T ARGETT ARGET
COUNT RYT ARGET INDUST RY
DEALT YPE
INVEST OR
Sell-side
13-Nov-15Orlen TransportSA
Poland Truck Transportation Acquisition Trans Polonia SA
Sell-side
23-Jul-15Czech railtransport unit ofPKN Orlen
CzechRepublic
Rail Transportation Acquisition NA
Buy-side
06-May-15 Fuel stationsAustriaGermanySwitzerland
Gasoline Stations Acquisition PKN Orlen SA
Sell-side
20-Oct-14Orlen KolTransSp z oo
Poland Rail Transportation Acquisition PKP Cargo SA
Buy-side
10-Jun-14Kicking HorseEnergy Inc
Canada Oil and Gas Extraction Acquisition PKN Orlen SA
Sell-side
29-May-14 ORLEN Lietuva Lithuania Petroleum Refineries Acquisition NA
Buy-side
05-Sep-13
BirchillExplorationLimitedPartnership
Canada Oil and Gas Extraction Acquisition PKN Orlen SA
Sell-side
23-Aug-13Medical centresin Plock andWloclawek
Poland Hospitals amp Health Care Acquisition NA
Buy-side
27-Jun-13 Fuel stationsCzechRepublicGermany
Gasoline Stations Acquisition PKN Orlen SA
Sell-side
25-Jul-12 Neste Polska Poland Other Gasoline Stations Acquisition Lotos SA PKN Orlen SA
Sell-side
01-Mar-12
OsrodekBadawczo-RozwojowyPrzemysluRafineryjnegoSA
PolandPetrochemical ManufacturingPetroleum Refineries
Privatization PKN Orlen SA Warter
Sell-side
20-Dec-11 Lotos SA Poland
Other Gasoline StationsGasoline Stations withConvenience Stores PetroleumRefineries Crude PetroleumExtraction
Privatizationthroughstockexchange
PKN Orlen SA Polskie Gornictwo Naftowe iGazownictwo SA
Buy-side
20-Jun-11Fuel stations inGermany
GermanyOther Gasoline StationsGasoline Stations withConvenience Stores
Acquisition PKN Orlen SA
Sell-side
02-May-11
Anwils fertilizerassets AnwilsPVC productionassets
PolandPoland
Plastics and Rubber ProductsManufacturing PesticideFertilizer and Other AgriculturalChemical Manufacturing
Acquisition ZA Pulawy
Sell-side
14-Mar-11Rafineria NaftyJedlicze
Poland Petroleum Refineries Privatization PKN Orlen SA
Sell-side
30-Nov-10 CeproCzechRepublic
Gasoline Stations BasicChemical ManufacturingPetroleum and Coal ProductsManufacturing
MergerEni SpA PKN Orlen SA Royal Dutch Shell PlcSlovnaft
Sell-side
02-Nov-10 Lotos SA PolandPetroleum and Coal ProductsManufacturing Oil and GasExtraction
Minoritystakepurchase
ExxonMobil Corp Gazprom Neft KulczykInvestments SA Magyar Olaj- Es Gazipari Nyrt(MOL) Mercuria Energy Group Ltd PKN Orlen SAPolskie Gornictwo Naftowe i Gazownictwo SA TNK-BP
Buy-side
16-Sep-10Gasolinestations
CzechRepublic
Gasoline Stations Acquisition PKN Orlen SA Unipetrol
EMIS Business Report Generated on 2016-06-02
Copyright copy 2015 EMIS all rights reserved A Euromoney Institutional Investor company Page 29 of 48
Buy-side
16-Sep-10Petrochemicalrefinery
CzechRepublic
Petroleum Refineries
AcquisitionMinoritystakepurchase
PKN Orlen SA
Sell-side
21-Jul-10Polkomtel Sp zoo
PolandWireless TelecommunicationsCarriers (except Satellite)
Acquisition Zygmunt Solorz-Zak - private investor
EMIS Business Report Generated on 2016-06-02
Copyright copy 2015 EMIS all rights reserved A Euromoney Institutional Investor company Page 30 of 48
Fiscal year 2014Companies in Industries 43
IndustryPetroleum Refineries
This company is scored higher thanonly 5266 of companies in theindustry which equates to B - BelowAverage Risk on the Financial Scale Expected
Participation inCustomers Credit
Fiscal year 2014Companies in Industries 43
IndustryPetroleum Refineries
Criteria Weight Score Final Score
I EMIS Benchmark Score 90 207 B Below Average Risk
SIZ E RANKING SCORE
Sales 1 10000
Assets 1 10000
Profit 41 698
Total Shareholders Equity 1 10000
Average Size 11 7675
GROWT H RANKING SCORE
Net Sales Growth Rate 11 7674
Inc Dec in Assets 20 5581
Inc Decin Net Income 24 4651
Increase (Decrease) in Equity 22 5116
Average Growt h 19 5756
PROFIT ABILIT Y RANKING SCORE
Net Income Net Sales 29 3488
Return On Assets 38 1395
Net Income Net Worth 39 1163
Average Prof it abilit y 35 2015
INDEBT EDNESS RANKING SCORE
Indebtedness 22 5116
Leverage 33 2558
Total Liabilities Sales 17 6279
Average Indebt edness 24 4651
II EMIS Trend Score 10 298 E Very High Risk
Scoring Range 1 - Improves 2 - Maintains (According to the tolerance margin) 3 - Deteriorate
EMIS Credit Analytics - Summary
EMIS Financial ScoreEMIS Financial Score was not affected by Conditions
EMIS Benchmark Score
B Below Average Risk
5266
EMIS Trend Score
E Very High Risk
PampL E
Balance Sheet C
Cash Flow E
EMIS Credit Quota
21112537Thousands (USD)
Average Ranking 21 in 43 companies
RELAT IVEST RENGT HS
RELAT IVEWEAKNESSES
Sales Net Income Sales
Sales Growth
Remarks
EMIS Trend Score is calculated based on the 2latest annual company financial statements
Remarks
Credit Quota Recommended was calculatedbased on the industry average customer type(customized) and Financial Score
EMIS Credit Analyt ics - EMIS Financial Score
EMIS Financial ScoreEMIS Financial Score was not affected by Conditions
EMIS Benchmark Score 5266
11
EMIS Business Report Generated on 2016-06-02
Copyright copy 2015 EMIS all rights reserved A Euromoney Institutional Investor company Page 31 of 48
100
PampL 2014 T OT AL
Sales Growth 3 3
Operating Profit Sales 3 3
Net Income Sales 3 3
T ot al PampL 300 300
BALANCE 2014 T OT AL
Days Receivables 2 2
Days Inventory 1 1
Current Ratio 3 3
Indebtness (Total AssetsTotal Liabilities) 3 3
Total Liabilities Sales 3 3
T ot al Balance 230 230
CASH FLOW 2014 T OT AL
Cash from Sales 3 3
Cash for Production 2 2
Cash for Operation 1 1
Net Operation Cash Generation (NOCG) 3 3
Free Cash Flow 3 3
Cash Flow After Financial Expenses 3 3
Cash Flow After Financial 3 3
Reduction in Debt 2 2
T ot al Cash Flow 267 267
III EMIS Financial Score 100 216 CC Above Average Risk
E D C CC B BB A AA
Business Scale
AA - Very Low RiskA - Low RiskBB - Moderate Low RiskB - Below Average RiskCC - Above Average RiskC - Moderate High RiskD - High RiskE - Very High Risk
E Very High Risk
C Moderate High Risk
E Very High Risk
EMIS Credit Analyt ics - EMIS Benchmark Score
EMIS Business Report Generated on 2016-06-02
Copyright copy 2015 EMIS all rights reserved A Euromoney Institutional Investor company Page 32 of 48
Fiscal year 2014Companies in Industries 43
IndustryPetroleum Refineries
SIZ E RANKING SCORE
Sales 1 10000
Assets 1 10000
Profit 41 698
Total Shareholders Equity 1 10000
Average Size 11 7675
GROWT H RANKING SCORE
Net Sales Growth Rate 11 7674
Inc Dec in Assets 20 5581
Inc Decin Net Income 24 4651
Increase (Decrease) in Equity 22 5116
Average Growt h 19 5756
PROFIT ABILIT Y RANKING SCORE
Net Income Net Sales 29 3488
Return On Assets 38 1395
Net Income Net Worth 39 1163
Average Prof it abilit y 35 2015
INDEBT EDNESS RANKING SCORE
Indebtedness 22 5116
Leverage 33 2558
Total Liabilities Sales 17 6279
Average Indebt edness 24 4651
Average Ranking 21
Fiscal year 2014Companies in Industries 43
IndustryPetroleum Refineries
EMIS Credit Quota(Score adjusted)
21112537Thousands (USD)
Participation in credit Financial Score
CC
EMIS Benchmark Score(Against Industry)
5266
EMIS Credit Analyt ics - EMIS Credit Quota
Key parameters af f ecting quota value
COMPANY INDICAT ORS VALUE INDUST RY MULT IPLIERS MAX CALCULAT ED CREDIT
Assets 1332259352 Suppliers Assets 2801 373173079
Net Worth 581261405 Suppliers Net worth 6383 371042677
Tangible Net Worth 604356752 Suppliers Tangible Net Worth 6383 385785372
Net Sales 3067917427 Suppliers Net Sales 1352 414818151
11
EMIS Business Report Generated on 2016-06-02
Copyright copy 2015 EMIS all rights reserved A Euromoney Institutional Investor company Page 33 of 48
Source EMIS Company Database
AVERAGE CREDIT
(BASED ON INDUSTRY)
319886918THOUSANDS (USD)
XEXPECT ED PART ICIPAT ION
(IN CUSTOMERS CREDIT)
11
FINANCIAL SCORE
CC
=
=
CALCULAT ED CREDIT
(AVERAGE X PARTICIPATION)
35187561THOUSANDS (USD)
X
QUOT A ADJUST MENT S
06
=CREDIT QUOT A
(ADJUSTED BY SCORE)
21112537THOUSANDS (USD)
Fiscal year 2014Companies in Industries 43
IndustryPetroleum Refineries
NIP 7740001454 Headquart ers T el +48 (24) 3650000
Cost of Goods Sold 3048984945 Suppliers Cost of Goods Sold 1363 415427048
Operating Profit -134323677 Suppliers Operating Profit -30832 000
Net Profit -165687728 Suppliers Net Profit -26041 000
SUPPLIERS 378193431 Net Sales 3067917427 Financial Liabilities Net Sales 002 715239
Assets 1332259352 Financial Liablities Assets 005 643434
FINANCIAL LIABILIT IES 000 Operating Cycle 1617 Operating Cycle 592663 501950211
Suppliers Turnover 1273 Suppliers Turnover 490503 415427048
AVERAGE CREDIT BASED ON INDUST RY 1121907398
Credit Quota Calculation
Score Multipliers
QUOT A ADJUST MENT S ACCORDING T O T HE FINAL SCORE FINANCIAL SCALE MULT IPLIERS
Expanded QuotaAA 2
A 15
Normal Quota BB 1
Reduced Quota
B 08
CC 06
C 04
No QuotaD 02
E 0
EMIS Credit Analyt ics - Conclusions
EMIS Business Report Generated on 2016-06-02
Copyright copy 2015 EMIS all rights reserved A Euromoney Institutional Investor company Page 34 of 48
Ul Chemikoacutew 7
09-411
Fax +48 (24) 3654040
Email zarzadorlenpl
RELAT IVE ST RENGT HS RANKING SCORE
Sales 1 100
Sales Growth 11 7674
EMIS Credit Quota(Score adjusted)
21112537Thousands (USD)
Participation in credit Financial Score
CC
Date 2016 June 2
Fiscal year 2014Companies in Industries 43
IndustryPetroleum Refineries
Polski Koncern Naftowy ORLEN SAEMIS Credit Analytics
EMIS Benchmark Score (Business Performance Score) is based on financial statements as of 2014 EMIS Benchmark Score of Polski Koncern Naf t owy ORLEN SA is
the result of comparing its financial results with that of 43 companies classified by EMIS Credit Analytics within Pet roleum Ref ineries industry
EMIS Benchmark Score(Against Industry)
5266Note Companies classified in Pet roleum Ref ineries are not necessarily direct competitors Please refer to Benchmark Ranking for complete details of the companies
classified within this industry
EMIS Benchmark Score is the result of the companys ranking within its industry in different financial ratios of Size Profitability Growth Indebtness Efficiency and Liquidity
Ratios In the result it is important to note
EMIS Benchmark Score contributes 90 to the Financial Score The other 10 is represented by evolution versus previous period of Profit amp Loss Balance Sheet and
Cash Flow Statement
EMIS T REND SCORE
Profit amp Loss E
Balance Sheet C
Cash Flow Statement E
EMIS Financial ScoreEMIS Financial Score was not affected by Conditions
Note The Financial Score is not deteriorated by Financial Conditions (see Parameters)
Based on the average credit quote of 11219074 in the Pet roleum Ref ineries industry an EMIS Financial Score of CC and an expected participation in the companyscredit of 11 the recommended credit quota is 740459Note The Financial Score is not deteriorated by Financial Conditions Based on the average credit quote of 11219074 in the Petroleum Refineries industry an EMISFinancial Score of CC and an expectedparticipation in the companys credit of 11 the recommended credit quota is 740459
Key parameters af f ecting quota value
EMIS Credit Analyt ics - Company vs Industry Key Stats
Company vs Industry - Key Stats
REPORTING DETAILS
11
EMIS Business Report Generated on 2016-06-02
Copyright copy 2015 EMIS all rights reserved A Euromoney Institutional Investor company Page 35 of 48
2014 2013 2012
Statement type Individual Individual Individual
Audited Non-Audited Non-Audited Non-Audited
Provider NotoriaMonitor B Fins NotoriaMonitor B Fins NotoriaMonitor B Fins
Companies in Industry 43 54 52
EMIS Benchmark Score 5266 6892 7170
Reporting Standard 197 197 197
Displaying units USD Thousands USD Thousands USD Thousands
SIZ E
2014 2014 2013 2012
AVERAGEINDUST RY
VALUE RANKING VALUE RANKING VALUE RANKING
Sales 915054 30679174 1 37904382 1 38981804 1
Assets 441712 13322594 1 17049137 1 16979933 1
Profit -47512 -1656877 41 58433 1 756549 1
Total Shareholders Equity 193824 5812614 1 9147078 1 9132469 1
Average Size Posit ion 11 1 1
GROWT H
2014 2014 2013 2012
AVERAGEINDUST RY
VALUE RANKING VALUE RANKING VALUE RANKING
Net Sales Growth Rate 2089 -575 11 -551 16 1190 12
Inc Dec In Assets 1610 -901 20 -243 22 -1039 30
Inc DecIn Net Income -406205 -340170 24 -9249 28 -078 17
Increase (Decrease) In Equity -0 77 -2601 22 -267 21 563 13
Average Growt h Posit ion 19 22 18
PROFIT ABILIT Y
2014 2014 2013 2012
AVERAGEINDUST RY
VALUE RANKING VALUE RANKING VALUE RANKING
Net Income Net Sales -519 -540 29 015 25 194 17
Return On Assets -1076 -1244 38 034 23 446 16
Net Income Net Worth -2451 -2850 39 064 36 828 28
Operational Profit Sales -439 -438 27 027 25 168 18
Average Prof it abilit y Posit ion 33 27 20
INDEBT EDNESS
2014 2014 2013 2012
AVERAGEINDUST RY
VALUE RANKING VALUE RANKING VALUE RANKING
Indebtedness 5612 5637 22 4635 21 4622 22
Leverage 12789 12920 33 8639 36 8593 40
Total Liabilities Sales 2709 2448 17 2085 17 2013 21
EMIS Business Report Generated on 2016-06-02
Copyright copy 2015 EMIS all rights reserved A Euromoney Institutional Investor company Page 36 of 48
Fiscal year 2014Companies in Industries 43
IndustryPetroleum Refineries
Current Liabilities Total Liabilities 6146 6279 7 7210 11 6768 11
Average Indebt edness Posit ion 20 21 24
EFFICIENCY
2014 2014 2013 2012
AVERAGEINDUST RY
VALUE RANKING VALUE RANKING VALUE RANKING
Days Receivables 23 24 8 24 10 24 6
Days Inventory 36 33 16 46 19 48 23
Suppliers Turnover 49 45 10 50 15 45 15
Operational Cycle 59 57 11 70 13 72 14
Average Ef f iciency Posit ion 11 14 15
LIQUIDIT Y
2014 2014 2013 2012
AVERAGEINDUST RY
VALUE RANKING VALUE RANKING VALUE RANKING
Current Ratio 128 132 19 142 21 157 22
Quick Ratio 132 132 19 142 21 157 22
Working Capital 42581 1486941 1 2418659 1 3019099 1
Average Liquidit y Posit ion 13 14 15
OT HERS
2014 2014 2013 2012
AVERAGEINDUST RY
VALUE RANKING VALUE RANKING VALUE RANKING
Gross Profit 0 76 062 31 491 34 614 33
Other Income -1926 -1852 32 64868 3 5153 6
Reduction In Debt 158 0 13 0 17 0 12
Average Ot hers Posit ion 25 18 17
EMIS Credit Analyt ics - Company vs Industry Balance Sheet
Company vs Industry - Balance Sheet
REPORTING DETAILS
2014 2013 2012
Statement type Individual Individual Individual
Audited Non-Audited Non-Audited Non-Audited
Provider NotoriaMonitor B Fins NotoriaMonitor B Fins NotoriaMonitor B Fins
Companies in Industry 43 54 52
EMIS Benchmark Score 5266 6892 7170
Reporting Standard 197 197 197
EMIS Business Report Generated on 2016-06-02
Copyright copy 2015 EMIS all rights reserved A Euromoney Institutional Investor company Page 37 of 48
CURRENT ASSET S 2014INDUST RY
2014COMPANY
2013INDUST RY
2013COMPANY
2012INDUST RY
2012COMPANY
V H V H V H V H V H V H
Cash And Banks 1003 11838 1034 6846 533 410 559 851 482 -4599 502 -5387
Short Term Investments 003 -404 000 NA 004 -7992 000 NA 018 457613 000 NA
Account Receivables (Trade) 1320 1670 1510 -915 1313 -821 1513 -380 1346 -1338 1534 005
Inventory 2075 -1109 2104 -2851 2710 -1100 2677 -841 2866 -1097 2852 -789
Deferred Assets 014 -1494 007 -4068 020 -2569 011 -3444 025 -385 017 16719
Current Assets 4413 1190 4656 -1101 4579 -900 4760 -533 4737 -1703 4906 -1431
FIXED ASSET
2014INDUST RY
2014COMPANY
2013INDUST RY
2013COMPANY
2012INDUST RY
2012COMPANY
V H V H V H V H V H V H
- Land And Properties 4838 1574 4846 -907 4853 -232 4850 065 4677 -1788 4701 -690
- Other Equipments 004 -262 000 NA 004 6983 000 NA 002 -1186 000 NA
Fixed Assets 4872 1626 4846 -907 4865 -275 4850 065 4710 -1737 4701 -690
Intangible Assets (Net) 202 823 150 -1458 217 -2685 160 -4312 279 -652 275 199
Investments 240 4117 265 2041 197 13125 200 21858 080 2964 061 5970
Deferred Assets 281 11870 082 15497 149 -2699 029 -4916 193 5695 056 -2566
Total Long Term Assets 5585 1962 5344 -720 5421 -302 5240 036 5263 -1044 5094 -625
T OT AL ASSET S
2014INDUST RY
2014COMPANY
2013INDUST RY
2013COMPANY
2012INDUST RY
2012COMPANY
V H V H V H V H V H V H
Total Assets 10000 1610 10000 -901 10000 -585 10000 -243 10000 -1368 10000 -1039
CURRENT LIABILIT Y
2014INDUST RY
2014COMPANY
2013INDUST RY
2013COMPANY
2012INDUST RY
2012COMPANY
V H V H V H V H V H V H
Suppliers 2801 1472 2839 -1163 2835 -082 2923 603 2691 -3100 2690 -2855
Other Short Term Liabilities 13741 2571 701 5233 12691 320 419 -676 11578 NA 438 NA
Total Current Liability 3449 2100 3540 -362 3309 -111 3342 424 3151 -1924 3128 -1691
LONG T ERM LIABILIT Y
2014INDUST RY
2014COMPANY
2013INDUST RY
2013COMPANY
2012INDUST RY
2012COMPANY
V H V H V H V H V H V H
Long Term Deferred Liabilities 839 -299 028 -299 1004 -2717 026 -2717 1298 NA 035 NA
Other Long Term Liabilities 2187 6238 2070 4861 1564 -1129 1267 -1525 1659 -3979 1459 -3665
Long Term Liabilities 2163 6134 2097 4757 1556 -1368 1293 -1553 1698 -3494 1494 -3513
T OT AL LIABILIT Y
2014INDUST RY
2014COMPANY
2013INDUST RY
2013COMPANY
2012INDUST RY
2012COMPANY
V H V H V H V H V H V H
Total Liabilities 5612 3390 5637 1066 4866 -551 4635 -215 4848 -2553 4622 -2383
EQUIT Y
2014INDUST RY
2014COMPANY
2013INDUST RY
2013COMPANY
2012INDUST RY
2012COMPANY
V H V H V H V H V H V H
EMIS Business Report Generated on 2016-06-02
Copyright copy 2015 EMIS all rights reserved A Euromoney Institutional Investor company Page 38 of 48
Fiscal year 2014Companies in Industries 43
IndustryPetroleum Refineries
Capital 212 3149 226 000 187 -325 206 000 182 -237 201 003
Other Reserves 11156 3618 263 000 9512 000 239 000 8955 -143 233 -2444
Equity Appreciation -178 -439428 -173 -142830 005 5496 -010 -47857 003 4198565 003 NA
Retained Earnings 3652 -439 3702 -2707 4435 -418 4618 -192 4357 -050 4594 1065
Minority Interest 5213 074 346 075 6008 -1233 312 -1231 6451 -1929 347 -1929
Total Net Worth 4388 -077 4363 -2601 5134 -618 5365 -267 5152 153 5378 563
T OT AL LIABILIT Y AND EQUIT Y
2014INDUST RY
2014COMPANY
2013INDUST RY
2013COMPANY
2012INDUST RY
2012COMPANY
V H V H V H V H V H V H
Total Liabilities And Net Worth 10000 1610 10000 -901 10000 -585 10000 -243 10000 -1368 10000 -1039
EMIS Credit Analyt ics - Company vs Industry Income Statement
Company vs Industry - Income Statement
REPORTING DETAILS
2014 2013 2012
Statement type Individual Individual Individual
Audited Non-Audited Non-Audited Non-Audited
Provider NotoriaMonitor B Fins NotoriaMonitor B Fins NotoriaMonitor B Fins
Companies in Industry 43 54 52
EMIS Benchmark Score 5266 6892 7170
Reporting Standard 197 197 197
OPERAT ING PROFIT
2014INDUST RY
2014COMPANY
2013INDUST RY
2013COMPANY
2012INDUST RY
2012COMPANY
V H V H V H V H V H V H
Sales 10000 2089 10000 -575 10000 -1145 10000 -551 10000 500 10000 1190
Cost Of Goods Sold 9924 2648 9938 -150 9485 -1062 9509 -427 9396 612 9386 1253
Gross Profit 0 76 -8210 062 -8814 515 -2441 491 -2451 604 -978 614 313
Administrative AndGeneral Expenses
149 3309 141 420 135 -905 127 -479 132 -638 126 379
Selling Expenses 2650 5320 364 095 2091 094 340 028 1835 1798 320 578
Operational Profit -439 -165868 -438 -163453 034 -8046 027 -8483 154 -2807 168 -206
NON OPERAT ING INCOME
2014INDUST RY
2014COMPANY
2013INDUST RY
2013COMPANY
2012INDUST RY
2012COMPANY
V H V H V H V H V H V H
Total Non-Operating Revenue 036 465 033 -2304 042 -6818 040 -6944 117 -4630 125 -4930
- Financial Revenue 036 465 033 -2304 042 -6818 040 -6944 117 -4630 125 -4930
Total Non-Operating Expenses 190 24437 176 20967 067 -2118 053 -3252 075 -6320 075 -5970
- Financial Expenses 190 24438 176 20967 067 -2119 053 -3252 075 -6320 075 -5970
Other Extraordinary Result 0 00 10000 000 NA -000 9992 000 NA -000 NA -000 NA
EMIS Business Report Generated on 2016-06-02
Copyright copy 2015 EMIS all rights reserved A Euromoney Institutional Investor company Page 39 of 48
Fiscal year 2014Companies in Industries 43
IndustryPetroleum Refineries
Profit Before Income Taxes -594 -909715 -580 -407834 008 -9639 014 -9402 196 -1306 217 -601
T AXES AND OT HERS
2014INDUST RY
2014COMPANY
2013INDUST RY
2013COMPANY
2012INDUST RY
2012COMPANY
V H V H V H V H V H V H
Extraordinary Income (Charges) 0 02 8819 005 4250 002 NA 004 NA 000 -10000 000 NA
Changes Due To Consolidation 027 -8018 002 -8023 162 -5086 008 -5086 292 -4973 014 -4977
Income Tax -0 74 -468549 -039 -72388 -002 7245 006 -8524 -006 -11275 038 -4155
NET PROFIT
2014INDUST RY
2014COMPANY
2013INDUST RY
2013COMPANY
2012INDUST RY
2012COMPANY
V H V H V H V H V H V H
Net Income -519 -406205 -540 -340170 016 -9342 015 -9249 213 544 194 -078
EMIS Credit Analyt ics - Company vs Industry Cash Flow
Company vs Industry - Cash Flow
REPORTING DETAILS
2014 2013 2012
Statement type Individual Individual Individual
Audited Non-Audited Non-Audited Non-Audited
Provider NotoriaMonitor B Fins NotoriaMonitor B Fins NotoriaMonitor B Fins
Companies in Industry 43 54 52
EMIS Benchmark Score 5266 6892 7170
Reporting Standard 197 197 197
CASH OPENING BALANCE
2014INDUST RY
2014COMPANY
2013INDUST RY
2013COMPANY
2012INDUST RY
2012COMPANY
V H V H V H V H V H V H
Initial Cash 222 410 267 851 257 -4599 232 -5387 422 9240 474 8565
CASH FROM SALES
2014INDUST RY
2014COMPANY
2013INDUST RY
2013COMPANY
2012INDUST RY
2012COMPANY
V H V H V H V H V H V H
Net Sales 10000 2089 10000 -575 10000 -1145 10000 -551 10000 500 10000 1190
+- Trade AccountsReceivable
-0 91 -28672 066 13160 059 -4685 027 779616 098 16969 -000 9978
Cash From Sales 9909 1908 10066 -539 10059 -1179 10027 -525 10098 763 10000 1377
CASH FOR PRODUCT ION
2014INDUST RY
2014COMPANY
2013INDUST RY
2013COMPANY
2012INDUST RY
2012COMPANY
V H V H V H V H V H V H
(-) Sales Cost -9924 -2648 -9938 150 -9485 1062 -9509 427 -9396 -612 -9386 -1253
(-) (Inc) Inventory 125 -1020 364 21062 168 -1077 111 -183 167 13866 106 12570
(+) (Inc) Suppliers 174 188875 -162 -30445 -012 9818 075 11510 -572 -26577 -468 -25767
EMIS Business Report Generated on 2016-06-02
Copyright copy 2015 EMIS all rights reserved A Euromoney Institutional Investor company Page 40 of 48
Cash For Production -9625 -2474 -9736 159 -9328 1572 -9324 962 -9801 -961 -9748 -1525
CASH FOR OPERAT ING
2014INDUST RY
2014COMPANY
2013INDUST RY
2013COMPANY
2012INDUST RY
2012COMPANY
V H V H V H V H V H V H
(-) Administrative Expenses -149 -3309 -141 -420 -135 905 -127 479 -132 638 -126 -379
+- Other Operating Results -0 00 -12524 000 NA 001 NA 000 NA 000 NA 000 NA
(-) Selling Expenses -2650 -5320 -364 -095 -2091 -094 -340 -028 -1835 -1798 -320 -578
(-) Period Income Taxes 074 468549 039 72388 002 -7245 -006 8524 006 11275 -038 4155
(+) (Inc) Taxes Payable 002 69344 000 NA -000 -14351 000 NA 001 17119 000 NA
(-) (Inc) Labor EstimatesAnd Provision
-0 12 9215 -000 9200 -189 -12719 -004 -12717 614 184104751 015 NA
Cash For Operation -2736 -3712 -466 794 -2413 -5873 -477 379 -1346 2282 -469 405
OPERAT IONAL CASHFLOW
2014INDUST RY
2014COMPANY
2013INDUST RY
2013COMPANY
2012INDUST RY
2012COMPANY
V H V H V H V H V H V H
Net Operating Cashflow -2453 -7631 -137 -15709 -1682 -4202 225 19816 -1049 1952 -217 -3750
INVEST MENT S IN ASSET S
2014INDUST RY
2014COMPANY
2013INDUST RY
2013COMPANY
2012INDUST RY
2012COMPANY
V H V H V H V H V H V H
(-) (Inc) Net Fixed Assets -329 -67408 210 151250 069 -8689 -014 -10872 468 25487 152 12255
(ndash) (Inc) Investments -0 34 2746 -020 7025 -056 -47405 -062 -48471 -009 -10215 -010 -10826
FREE CASHFLOW
2014INDUST RY
2014COMPANY
2013INDUST RY
2013COMPANY
2012INDUST RY
2012COMPANY
V H V H V H V H V H V H
Free Cashflow -2816 -10396 054 -6596 -1669 -15077 150 28813 -589 5095 -075 -33837
FINANCIAL
2014INDUST RY
2014COMPANY
2013INDUST RY
2013COMPANY
2012INDUST RY
2012COMPANY
V H V H V H V H V H V H
(-) Financial Expenses -154 -65083 -143 -92333 -025 -15241 -013 -12496 042 20392 050 -1713
Cashflow After Financial Costs -2969 -11196 -089 -16127 -1694 -17395 136 60823 -547 5391 -025 -12770
(+) (Inc) Debt Short Term -000 9949 000 NA -000 -21237 000 NA 000 10091 000 NA
(+) (Inc) Debt Long Term 002 69344 000 NA -000 -14351 000 NA 001 17119 000 NA
Cashflow After FinancialExpenses
-2968 -11175 -089 -16127 -1694 -17455 136 60823 -546 5512 -025 -12770
CASHFLOW
2014INDUST RY
2014COMPANY
2013INDUST RY
2013COMPANY
2012INDUST RY
2012COMPANY
V H V H V H V H V H V H
(-) Dividends 503 42726 -126 -4528 -186 682 -082 -1139 -176 -73580 -069 -52834
(-) Other Expenses 002 8819 005 4250 002 NA 004 NA 000 -10000 000 NA
(-) Other Current Debtors 000 NA 000 NA 000 NA 000 NA 000 NA 000 NA
(-) Other Current Assets 002 -7807 002 -2258 011 361835 003 15505 000 10702 -005 -48602
(-) Long-Term AccountsReceivable
000 NA 000 NA 000 NA 000 NA 000 NA 000 NA
EMIS Business Report Generated on 2016-06-02
Copyright copy 2015 EMIS all rights reserved A Euromoney Institutional Investor company Page 41 of 48
(-)(Inc) Deferred And OtherLong Term Assets
-0 72 -37515 -022 -26027 032 11570 013 4240 -178 -88060 008 14351
(-) (Inc) Other Long TermLiabilities
406 56718 294 37011 -105 8205 -103 7364 -518 -37893 -368 -40951
(+) Inflation Adjustmentst Non Recurring Incomes
000 NA 000 NA 000 NA 000 NA 000 NA 000 NA
(+) (Inc) Other AccountsPayable
115 218744 105 82115 -007 -10274 -014 -10676 216 2710149 191 NA
(+) Extraordinary Income Consolidation
027 -8018 002 -8023 162 -5085 008 -5057 292 -4974 014 -5006
(-) Intangible Goods -007 -12244 011 -8077 040 29906 055 230557 009 12060 -002 8712
Complementary Cash-Flow 976 240248 271 31907 -051 8725 -117 5210 -356 -14616 -230 -28078
Net Cash Generation -1992 -3796 183 77289 -1745 -7131 020 10729 -902 -10194 -255 -21675
Ending Cash -1770 -4381 449 6846 -1488 -17434 251 851 -480 -11112 219 -5387
EMIS Business Report Generated on 2016-06-02
Copyright copy 2015 EMIS all rights reserved A Euromoney Institutional Investor company Page 42 of 48
Score Scale
Financial ScaleFinancial Model has 8 risk categories
A - Very Low RiskAA - Low RiskBB - Moderate Low RiskB - Below Average RiskCC - Above Average RiskC - Moderate High RiskD - High Risk E - Very High Risk
Risk Profile
High RiskHigh Risk - used when the loan amounts are relatively high and have a longrepayment period A loss in the Credit would seriously affect the companyresults Commercial credit with maturity exceeding 36 months
A loss in the Credit would seriously affect the results Bank credited to morethan 36 months
Vertical Weighting
Pampl
Sales Growth 12
Operating Profit 12
Net Profit 12
Sub t ot al 36
Balance
Days Receivables 12
Days Inventory 10
Current Ratio 8
Indebtness 8
Indebtednesssales 8
Balance Sub T ot al 46
Cash Flow
Cash From Sales 2
Cash For Production 2
Cash For Operations 2
Operating Cash Generation 5
Free Cash Flow 3
Cash Flow After Fin Ex 2
Cash Flow After Fin Result 2
Reduction In Debt 0
Cash Flow Sub T ot al 18
Total Vertical Weights 100
Tolerance Margin 5
Financial Conditions
Condit ions Score
Negative Net Worth CC
Final Weighting
EMIS Benchmark Score 90
EMIS Trend Score 10
EMIS Credit Analyt ics - EMIS Credit Analyt ics Assumptions
EMIS Business Report Generated on 2016-06-02
Copyright copy 2015 EMIS all rights reserved A Euromoney Institutional Investor company Page 43 of 48
Ret urn on Asset s (ROA)
An indicator of how profitable a company is relative to its total assets ROA gives an
idea as to how efficient management is at using its assets to generate earnings
Calculated by dividing a companys annual earnings by its total assets
Calculated as Net prof it T ot al Asset
Ret urn on Equit y (ROE)
A measure of a corporations profitability that reveals how much profit a company
generates with the money shareholders have invested
Calculated as Net prof it Shareholders equit y
Ret urn on Sales (ROS)
A ratio widely used to evaluate a companys operational efficiency ROS is also
known as a firms operating profit margin
Calculated as Net Prof it Net Sales Revenue
Bookvalue
A companys common stock equity as it appears on a balance sheet equal to total
assets minus liabilities preferred stock and intangible assets such as goodwill
Current Rat io
A liquidity ratio that measures a companys ability to pay short-term obligations
Calculated as Current Asset sCurrent Liabilit ies
Quick rat io
An indicator of a companys short-term liquidity The quick ratio measures a
companys ability to meet its short-term obligations with its most liquid assets The
higher the quick ratio the better the position of the company
Calculated as (Current Asset s-Invent ories)Current Liabilit ies
Debt t o equit y
A measure of a companys financial leverage calculated by dividing its total
liabilities by stockholders equity It indicates what proportion of equity and debt the
company is using to finance its assets
Calculated as T ot al Liabilit iesShareholders Equit y
Debt t o t ot al asset s
A metric used to measure a companys financial risk by determining how much of
the companys assets have been financed by debt Calculated by adding short-term
and long-term debt and then dividing by the companys total assets
Calculated as Short T erm Debt s+Long T erm Debt sT ot al Asset s
Leverage rat io
Leverage ratio provide an indication of the long term solvency of the firm
Calculated as T ot al Asset sShareholders Equit y
Debt Ent erprise Value
This metric is equivalent to the payback period used by debtholders Calculated as
Debt Ent erprise Value
Market Capit alizat ionEBIT DA
Calculated as Market Capit alizat ionEBIT DA
Earning Bef ore Int erest s and T axes (EBIT )
Earning Before Interests and Taxes (EBIT)
EBIT DA
Earnings before interest taxes depreciation and amortization (EBITDA) is a non-
GAAP metric that can be used to evaluate a companys profitability Calculated as
Ent erprise valueNet Sales
Dividing the enterprise value of a firm by its sales or revenues is a way of
comparing firms in cyclical industries Calculated as Enterprise Value Net Sales
Revenue
Ent erprise valueGross income
Calculated as Enterprise value Gross income
Ent erprise valueT ot al Asset s
Calculated as Enterprise value Total Assets
EBIT DA Margin
A measurement that provides a clear view of the companyrsquos core profitability
Calculated as EBITDA Net Sales Revenue
T ot al Operat ing Revenue T rend
Calculated as Total Operating Revenue current year Total Operating Revenue
previous year
Gross Prof it T rend
Calculated in percentage as (Gross Prof it Current Year Gross Prof it
Previous Year) ndash 1
EBIT DA T rend
Calculated as EBITDA current year EBITDA previous year
Account s Receivables T rend
Calculated in percentage as T rade Account s Receivables current year
T rade Account Receivables previous year
Invent ory T rend
Calculated as Inventories current year Inventories previous year
Net Propert y Plant and Equipment (PPampE) T rend
Calculated as Net PPampE current year Net PPampE previous year
T ot al Asset s T rend
Calculated as Total Assets current year Total Assets previous year
Bookvalue T rend
Calculated as Bookvalue current year Bookvalue previous year
Shareholders Equit y T rend
Calculated as Shareholdersrsquo Equity current year Shareholdersrsquo Equity previous
year
Cash f rom Operat ions T rend
Calculated as Net Cash Flow from Operations current year Net Cash Flow from
Operations previous year
Capit al Expendit ures T rend
Calculated as CAPEX current year CAPEX previous year
Dividend per Share T rend
Calculated as Dividend value per (common) share current year Dividend value
per (common) share previous year
Cost t o Income Rat io
A key financial measure showing a bankrsquos cost in relation to its income Ratio is
calculated as Total Operational Cost Total Operational Income
Glossary
EMIS Business Report Generated on 2016-06-02
Copyright copy 2015 EMIS all rights reserved A Euromoney Institutional Investor company Page 44 of 48
EBIT DA = Operat ing Revenue - Operat ing Expenses (Depriciat ion and
Amort izat ion excluded)
Ent erprise Value EBIT DA
Enterprise Value EBITDA is the metric most used to measure how many years it
would take to pay back the investment
Ent erprise Value
A measure of a companys value often used as an alternative to straightforward
market capitalization EV is calculated as market cap plus debt minority interest
and preferred shares minus total cash and cash equivalents
Dooms day rat io
Calculated as Cash Current Liabilit ies
Long T erm Debt t o Capit al
A ratio showing the financial leverage of a firm calculated by dividing long-term
debt by the amount of capital available Calculated as Long t erm debt Long
t erm debt + Pref f ered St ock + Common St ock
Int erest Coverage Rat io
A ratio used to determine how easily a company can pay interest on outstanding
debt The interest coverage ratio is calculated by dividing a companys earnings
before interest and taxes (EBIT) of one period by the companys interest expenses of
the same period Calculated as EBIT Int erest expense
Cash Flow t o Debt
This coverage ratio compares a companys operating cash flow to its total debt
which for purposes of this ratio is defined as the sum of short-term borrowings the
current portion of long-term debt and long-term debt This ratio provides an
indication of a companys ability to cover total debt with its yearly cash flow from
operations The higher the percentage ratio the better the companys ability to carry
its total debt Calculates as Operat ing Cash Flow T ot al Debt
Ret urn on Capit al
A ratio that indicates the efficiency and profitability of a companys capital
investments Calculated as Net Income (Total Asset - Current Liabilities)
Gross Prof it Margin
A financial metric used to assess a firms financial health by revealing the
proportion of money left over from revenues after accounting for the cost of goods
sold Gross profit margin serves as the source for paying additional expenses and
future savings Calculated as (Net Sales Revenue - Cost of Goods Sold) Net
Sales Revenue
Operat ing Prof it Margin
A ratio used to measure a companys pricing strategy and operating efficiency
Calculated as Operat ing prof it Net sales
Account s Receivable T urnover
An accounting measure used to quantify a firms effectiveness in extending credit
as well as collecting debts The receivables turnover ratio is an activity ratio
measuring how efficiently a firm uses its assets Calculated as Net Sales
Revenue T rade Account s Receivable (Net )
Invent ory T urnover
A ratio showing how many times a companys inventory is sold and replaced over a
period Calculated as Sales Invent ory
Current asset t urnover
Calculated as Net Sales Revenue T ot al Current Asset
Ef f iciency Rat io
Calculated as Total non-interest expenses (Total net interest income + Total non-
interest income)
Loans t o Deposit s Rat io
A commonly used statistic for assessing a banks liquidity Calculated as Total
Loans Total Deposits
Liquid Asset s t o Deposit s Rat io
This ratio indicates extent of liquidity maintained by a bank for meeting the demand
made by the depositors Calculated as (Cash + Financial assets held for trading)
Total Deposits
Loans t o Asset Rat io
Calculated as Total Loans Total Assets
Net Int erest Income T rend
Calculated as Net Interest Income current year Net Interest Income previous year
Net Fee and Commission Income T rend
Calculated as Net Fee and Commission Income current year Net Fee and
Commission Income previous year
Loans and Advances t o Cust omers T rend
Calculated as Loans and Advances to Customers current year Loans and
Advances to Customers previous year
Deposit s f rom Cust omers T rend
Calculated as Deposits from Customers current year Deposits from Customers
previous year
Loss Rat io
This ratio indicates the average cost of insurance protection per each dollar of net
premiums earned during the period Calculated as Total Losses Incurred in Claims
Net Insurance Premium Revenue
Underwrit ing Expenses Rat io
This ratio measures operational efficiency in underwriting Calculated as
Underwriting expenses Net Insurance Premium Revenue
Policyholder Dividend Rat io
Calculated as Dividends Net Insurance Premium Revenue
Combined LossExpense Rat io
Calculated as Loss Ratio + Underwriting Expenses Ratio + Policyholder Dividend
Ratio When the combined ratio is under 100 underwriting results are
considered profitable when the combined ratio is over 100 underwriting results
are considered unprofitable
Ceded Premium Rat io
Calculated as Insurance Premium Ceded to Reinsurers Insurance Premium
Revenue
Net Premiums Earned T rend
Calculated as Net Insurance Premium Revenue current year Net Insurance
Premium Revenue previous year
Fees and Commissions T rend
Calculated as Net Fees and Commissions Income current year Net Fees and
Commissions Income previous year
Net Invest ment Income T rend
EMIS Business Report Generated on 2016-06-02
Copyright copy 2015 EMIS all rights reserved A Euromoney Institutional Investor company Page 45 of 48
Fixed-asset t urnover
This ratio is a rough measure of the productivity of a companys fixed assets
(property plant and equipment or PPampE) with respect to generating sales For most
companies their investment in fixed assets represents the single largest
component of their total assets This annual turnover ratio is designed to reflect a
companys efficiency in managing these significant assets Simply put the higher
the yearly turnover rate the better Calculated as Revenue Propert y Plant and
Equipment
Asset T urnover
The amount of sales generated for every dollars worth of assets It is calculated by
dividing sales in dollars by assets in dollars Calculated as Revenue Asset s
Revenue T rend
Calculated as (Net Sales Current Year Net Sales Previous Year)
Net Income T rend
Calculated as (Net Income Current Year Net Income Previous Year)
Operat ing Income T rend
Calculated as (Operat ing Income Current Year Operat ing Income
Previous year)
PriceBook Rat io
A ratio used to compare a stocks market value to its book value It is calculated by
dividing the current closing price of the stock by the latest years book value per
share Calculated as St ock price (T ot al Asset - Int angible asset s and
Liabilit ies)
PriceEarnings Rat io
A valuation ratio of a companys current share price compared to its per-share
earnings Calculated as Market value per share Earning per share EPS
Market capShareholder equit y
A financial ratio showing the premium which is included in the current market price
compared to the actual value of Shareholder equity of the company Calculated as
Market capit alizat ion Shareholders equit y
PriceEBIT Rat io
The PriceEBIT ratio is a market value indicator similar to the PE ratio which shows
the number of times the market price exceeds the earnings per share before the
effects of gross interest abnormal items and tax The PriceEBIT ratio is calculated
as follows Valuat ion price EBIT
T ot al Capit al Rat io
Calculated as T ot al capit al (T ier 1 and T ier 2) rat io = T ot al capit al (T ier 1
and T ier 2) Risk-adjust ed asset s
T ier 1 Rat io
Tier 1 capital is the core measure of a banks financial strength from a regulators
point of view It consists primarily of shareholders equity but may also include
preferred stock that is irredeemable and non-cumulative and retained earnings
Risk Weight ed Asset s
Risk weights are in five categories from zero to 100 per cent Those carrying a
zero weight include notes and coins gold matched by gold liabilities balances with
the Reserve Bank and commonwealth government securities with less than twelve
months to maturity Commonwealth government securities with more than twelve
months to maturity carry a 10 per cent risk weighting as do state government
securities Claims on other banks Australian local governments and public-sector
organisations other than those with corporate status or which operate
Calculated as Investment Income current year Investment Income previous year
Receivables Arising Out Of Direct Insurance Operat ions T rend
Calculated as Receivables Arising out of Direct Insurance Operations current year
Receivables Arising out of Direct Insurance Operations previous year
Operat ing ROA
An indicator that shows the type of net profit which is actually generated by business
effort Calculated as Operat ing Prof it (EBIT ) T ot al Asset s
Payables T urnover
An indicator that evaluates how fast a company pays off its creditors (suppliers)
Calculated as Purchases T rade Payables
Working Capit al T urnover
A measure that indicates how efficiently the company generates revenue with its
working capital Working capital is defined as current assets minus current liabilities
Calculated as Net Sales (T ot al Current Asset s ndash T ot al Current
Liabilit ies)
Working Capit al
A measure of a companyrsquos short term financial health Calculated as T ot al
Current Asset s ndash T ot al Current Liabilit ies
Cash Rat io
A measure of a companyrsquos liquidity in crisis situation Only highly marketable
securities and cash are included Calculated as (T ot al Cash and Cash
Equivalent s + Market able securit ies) T ot al Current Liabilit ies
Cash Flow f rom Operat ion Rat io
A measure of how well current liabilities are covered by the cash flow generated
from a companyrsquos operations Calculated as Net Cash Flow f rom Operat ing
Act ivit ies T ot al Current Liabilit ies
Debt Coverage
A measure that shows a companyrsquos ability to cover total debt with its yearly cash
flow from operations Calculated as Net Cash Flow f rom Operat ing Act ivit ies
T ot al Debt
Cash Flow t o Revenue
This ratio measures the amount of operating cash flow generated for each dollar of
revenue Calculated as Net Cash Flow f rom Operat ing Act ivit ies Net Sales
Revenue
Cash Ret urn on Asset s
This ratio measures the return of operating cash flow attributed to all providers of
capital Calculated as Net Cash Flow f rom Operat ing Act ivit ies T ot al
Asset s
Cash Ret urn on Equit y
This ratio measures the return of operating cash flow attributed to shareholders
Calculated as Net Cash Flow f rom Operat ing Act ivit ies T ot al
Shareholdersrsquo Equit y
Cash t o Income
This ratio measures the ability to generate cash from companyrsquos operations
Calculated as Net Cash Flow f rom Operat ing Act ivit ies Operat ing Prof it
(EBIT )
CashT ot al Asset s
Calculated as Cash and Cash Equivalent s T ot al Asset s
EMIS Business Report Generated on 2016-06-02
Copyright copy 2015 EMIS all rights reserved A Euromoney Institutional Investor company Page 46 of 48
commercially carry a 20 per cent risk weighting Loans secured by a mortgage
over residential property and with a loan-to-valuation of 80 per cent or less carry a
50 per cent risk weighting and loans to companies or individuals carry a 100 per
cent risk weighting
Market Cap Net cash
A ratio measure the market value of the company to the Net cash position of the
company Calculated as Market capit alizat ion (Cash and cash equivalent s
minus long-t erm debt )
Net Cash
Net cash is commonly used in evaluating a companys cash flow More generally
net cash can refer to the amount of cash remaining after a transaction has been
completed and all charges and deductions related to the transaction have been
subtracted Calculated as T ot al cash minus t ot al short t erm liabilit ies
Annualised Ret urn on Equit y (ROE)
Return on Equity ratio (ROE) converted into an annual basis
Annualised Ret urn on Asset s (ROA)
Return on Assets ratio (ROA) converted into an annual basis
Export Proport ion Rat io
The percentage figure of the proportion of the export revenue from the total sales
revenue of the company Calculated as Export revenue T ot al revenue
Net Debt
A metric that shows companys overall debt situation by netting the value of
financial liabilities with its cash and other similar liquid assets Calculated as
financial liabilities - cash and cash equivalents
EPS
The portion of a companys profit allocated to each outstanding share Calculated
as Net Profit Outstanding Shares
PE
A valuation ratio of a companys current share price compared to its per-share
earnings Calculated as Market value per share Earning per share EPS
Market Capit alizat ionNet Sales
Calculated as Market Capitalization Net Sales Revenue
Market Capit alizat ionGross income
Calculated as Market Capitalization Gross Profit
Market Capit alizat ionEBIT
Calculated as Market Capitalization EBIT
Market Capit alizat ionT ot al Asset s
Calculated as Market Capitalization Total Assets
ReceivablesT ot al asset s
Calculated as T rade Account s Receivable T ot al Asset s
Invent oriesT ot al asset s
Calculated as Invent ories T ot al Asset s
Fixed asset sT ot al asset s
Calculated as Non-current Asset s T ot al Asset s
Current Liabilit iesT ot al Liabilit ies
Calculated as T ot al Current Liabilit ies T ot al Liabilit ies
Salaries and Employee Benef it sNet sales
Calculated as Employee Benef it Expenses Net Sales Revenue
Administ rat ive ExpensesNet Sales
Calculated as Administ rat ive Expenses Net Sales Revenue
Depreciat ion and Amort izat ionNet sales
Calculated as Depreciat ion Amort izat ion and Impairment Charges Net
Sales Revenue
Int erest paidNet sales
Calculated as Int erest -t ype Expenses Net Sales Revenue
Income t axNet sales
Calculated as Income T ax Net Sales Revenue
Operat ing Cash Flow t o T ot al Cash Flow
Calculated as Net Cash Flow f rom Operat ing Act ivit ies Net
IncreaseDecrease in Cash and Cash Equivalent s
Cash Flow f rom Invest ing t o T ot al Cash Flow
Calculated as Net cash f low f rom (used in) invest ing act ivit ies Net
IncreaseDecrease in Cash and Cash Equivalent s
Cash f low f rom f inancing t o T ot al cash f low
Calculated as Net cash flow from (used in) financing activities Net
IncreaseDecrease in Cash and Cash Equivalents
Average Yie ld on Asset s
Calculated as T ot al Int erest Income T ot al Asset s
Disclaimer
Whilst EMIS attempts at all times to ensure the accuracy and reliability of the information it provides due to the vast quantity of processed data and the fact that some of
the third-party data cannot always be verified including information provided directly by the subject of the enquiry EMIS does not guarantee the correctness or the
effective delivery of the information and shall not be held responsible for any errors or omissions therein
The content and recommendations shall only be used as a reference in business decisions of EMIS clients and shall not be used for any other purposes EMIS and its
affiliates shall not be held liable for any loss of the clients arising out of its own business decisions whether or not the making of such decision has been referred to this
contentrecommendation
EMIS Business Report Generated on 2016-06-02
Copyright copy 2015 EMIS all rights reserved A Euromoney Institutional Investor company Page 47 of 48
EMIS Business Report Generated on 2016-06-02
Copyright copy 2015 EMIS all rights reserved A Euromoney Institutional Investor company Page 48 of 48
- Table of Contents
- Company Tear Sheet
-
- Contact Information
- NAICS Industry Classification
- Business description
- Basic Information
- EMIS Financial Score
- Share Price information
- Key Executives
- Ownership Details
- Subsidiaries and Affiliates
- Key Financial Highlights
- Financial Performance Charts
- Latest MampA and ECM Deals
- Top Competitors
-
- Financial Statements
-
- Annual Statements
- Interim Statements
- Ratios
- Multiples
-
- Company Documents
-
- Financial DocumentsAnnual Reports
- Corporate Actions
-
- News amp Reports
-
- News
- Reports
-
- MampA and ECM Deals
-
- EMIS DealWatch Deals
- EMIS DealWatch Intents
-
- EMIS Credit Analytics
-
- Summary
- EMIS Financial Score
- EMIS Benchmark Score
- EMIS Credit Quota
- Conclusions
- Company vs Industry Key Stats
- Company vs Industry Balance Sheet
- Company vs Industry Income Statement
- Company vs Industry Cash Flow
- EMIS Credit Analytics Assumptions
-
- Glossary
- Disclaimer
-
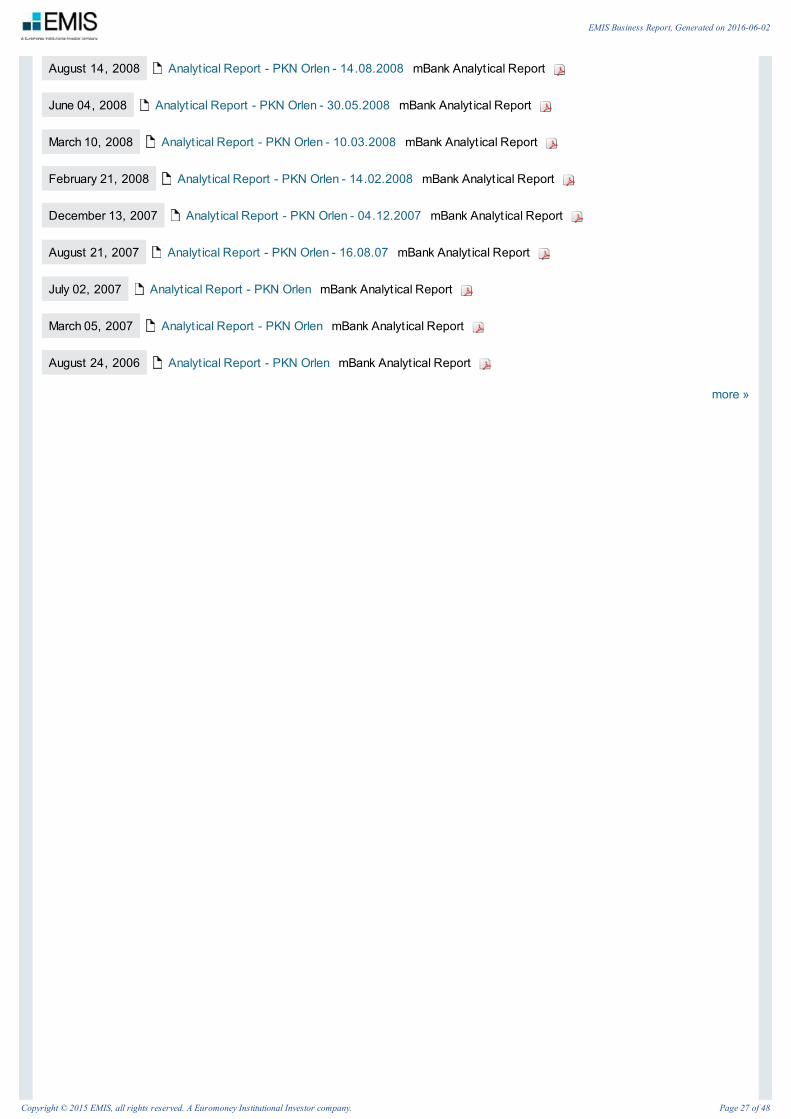
more raquo
August 14 2008 Analyt ical Report - PKN Orlen - 14082008 mBank Analyt ical Report
June 04 2008 Analyt ical Report - PKN Orlen - 30052008 mBank Analyt ical Report
March 10 2008 Analyt ical Report - PKN Orlen - 10032008 mBank Analyt ical Report
February 21 2008 Analyt ical Report - PKN Orlen - 14022008 mBank Analyt ical Report
December 13 2007 Analyt ical Report - PKN Orlen - 04122007 mBank Analyt ical Report
August 21 2007 Analyt ical Report - PKN Orlen - 160807 mBank Analyt ical Report
July 02 2007 Analyt ical Report - PKN Orlen mBank Analyt ical Report
March 05 2007 Analyt ical Report - PKN Orlen mBank Analyt ical Report
August 24 2006 Analyt ical Report - PKN Orlen mBank Analyt ical Report
EMIS Business Report Generated on 2016-06-02
Copyright copy 2015 EMIS all rights reserved A Euromoney Institutional Investor company Page 27 of 48
MampA and ECM Deals - EMIS DealWatch Deals
DAT ECOUNT RY
OFT ARGET
T ARGET COMPANYDEALT YPE
BUYER SELLER DEAL INDUST RIESDEAL
VALUEUSD (MN)
ST AKE
20-Jan-16CzechRepublic
68 petrol stations of OMV Acquisition PKN Orlen SA OMV AG Gasoline Stations NA 100
16-Nov-15 Poland Assets of Euronaft Trzebinia Acquisition PKP Cargo SA PKN Orlen SASupport Activities forTransportation RailTransportation
1502 100
16-Nov-15 Poland Orlen Transport SA Acquisition Trans Polonia SA PKN Orlen SA Truck Transportation 2137 100
21-Oct-15 Germany13 SUN petrol stations ofGermania Petrol
Acquisition PKN Orlen SAGermaniaPetrol GmbH
Gasoline Stations NA 100
13-Oct-15 Canada Kicking Horse Energy Inc Acquisition PKN Orlen SA NA Oil and Gas Extraction 22634 100
13-Oct-15UnitedStates
FX Energy Inc Acquisition PKN Orlen SA NAOil and Gas ExtractionAgriculture Forestry Fishingand Hunting
8310 100
24-Sep-15 PolandTwo concessions in theregions of Lesser Polandand Subcarpathia
Acquisition PKN Orlen SADEADeutscheErdoel AG
Oil and Gas Extraction NA 100
20-Aug-15CzechRepublicPoland
Orlen KolTrans Sp z oo Acquisition PKP Cargo SA PKN Orlen SA Rail Transportation 4860 9985
20-Jul-15 Poland Bieszczady ProjectJointventure
PKN Orlen SA PolskieGornictwo Naftowe iGazownictwo SA
NA Oil and Gas Extraction NA 100
03-Jul-14CzechRepublic
Ceska Rafinerska ASMinoritystakepurchase
PKN Orlen SA Eni SpA Petroleum Refineries 4100 32445
14-May-14 Poland Orlen Medica Acquisition PZU TFI SA PKN Orlen SAHealth Care and SocialAssistance
1380 100
14-May-14 Poland Prof Med Sp z oo Acquisition PZU SA PKN Orlen SAHealth Care and SocialAssistance
119 9645
08-May-14 CanadaBirchill Exploration LimitedPartnership
Acquisition PKN Orlen SA
Bregal -BirchillInvestmentsSarl
Oil and Gas Extraction 23366 100
07-Nov-13CzechRepublic
Ceska Rafinerska ASMinoritystakepurchase
PKN Orlen SARoyal DutchShell Plc
Petroleum Refineries 2720 1633
16-Sep-13 Canada TriOil Resources Ltd Acquisition PKN Orlen SA NA Crude Petroleum Extraction 17753 100
07-Dec-12 Poland Shale gas licenses Acquisition PKN Orlen SAExxonMobilPoland
Natural Gas Extraction NA 100
02-Nov-12 Poland Anwil SAMinoritystakepurchase
PKN Orlen SA NAPesticide Fertilizer andOther Agricultural ChemicalManufacturing
2364 473
20-Aug-12 Poland Petrolot Acquisition PKN Orlen SAPolskie LinieLotnicze LOTSA
Petroleum and PetroleumProducts MerchantWholesalers
9241 49
01-Jun-12 Poland Gas bottle assets Acquisition Gaspol SA PKN Orlen SA Nonstore Retailers NA 100
01-Aug-11 Poland Anwil SAMinoritystakepurchase
PKN Orlen SA Energa SAPesticide Fertilizer andOther Agricultural ChemicalManufacturing
2158 415
MampA and ECM Deals - EMIS DealWatch Intents
EMIS Business Report Generated on 2016-06-02
Copyright copy 2015 EMIS all rights reserved A Euromoney Institutional Investor company Page 28 of 48
DEALSIDE
INT ENTANNOUNCEMENT
T ARGETT ARGET
COUNT RYT ARGET INDUST RY
DEALT YPE
INVEST OR
Sell-side
13-Nov-15Orlen TransportSA
Poland Truck Transportation Acquisition Trans Polonia SA
Sell-side
23-Jul-15Czech railtransport unit ofPKN Orlen
CzechRepublic
Rail Transportation Acquisition NA
Buy-side
06-May-15 Fuel stationsAustriaGermanySwitzerland
Gasoline Stations Acquisition PKN Orlen SA
Sell-side
20-Oct-14Orlen KolTransSp z oo
Poland Rail Transportation Acquisition PKP Cargo SA
Buy-side
10-Jun-14Kicking HorseEnergy Inc
Canada Oil and Gas Extraction Acquisition PKN Orlen SA
Sell-side
29-May-14 ORLEN Lietuva Lithuania Petroleum Refineries Acquisition NA
Buy-side
05-Sep-13
BirchillExplorationLimitedPartnership
Canada Oil and Gas Extraction Acquisition PKN Orlen SA
Sell-side
23-Aug-13Medical centresin Plock andWloclawek
Poland Hospitals amp Health Care Acquisition NA
Buy-side
27-Jun-13 Fuel stationsCzechRepublicGermany
Gasoline Stations Acquisition PKN Orlen SA
Sell-side
25-Jul-12 Neste Polska Poland Other Gasoline Stations Acquisition Lotos SA PKN Orlen SA
Sell-side
01-Mar-12
OsrodekBadawczo-RozwojowyPrzemysluRafineryjnegoSA
PolandPetrochemical ManufacturingPetroleum Refineries
Privatization PKN Orlen SA Warter
Sell-side
20-Dec-11 Lotos SA Poland
Other Gasoline StationsGasoline Stations withConvenience Stores PetroleumRefineries Crude PetroleumExtraction
Privatizationthroughstockexchange
PKN Orlen SA Polskie Gornictwo Naftowe iGazownictwo SA
Buy-side
20-Jun-11Fuel stations inGermany
GermanyOther Gasoline StationsGasoline Stations withConvenience Stores
Acquisition PKN Orlen SA
Sell-side
02-May-11
Anwils fertilizerassets AnwilsPVC productionassets
PolandPoland
Plastics and Rubber ProductsManufacturing PesticideFertilizer and Other AgriculturalChemical Manufacturing
Acquisition ZA Pulawy
Sell-side
14-Mar-11Rafineria NaftyJedlicze
Poland Petroleum Refineries Privatization PKN Orlen SA
Sell-side
30-Nov-10 CeproCzechRepublic
Gasoline Stations BasicChemical ManufacturingPetroleum and Coal ProductsManufacturing
MergerEni SpA PKN Orlen SA Royal Dutch Shell PlcSlovnaft
Sell-side
02-Nov-10 Lotos SA PolandPetroleum and Coal ProductsManufacturing Oil and GasExtraction
Minoritystakepurchase
ExxonMobil Corp Gazprom Neft KulczykInvestments SA Magyar Olaj- Es Gazipari Nyrt(MOL) Mercuria Energy Group Ltd PKN Orlen SAPolskie Gornictwo Naftowe i Gazownictwo SA TNK-BP
Buy-side
16-Sep-10Gasolinestations
CzechRepublic
Gasoline Stations Acquisition PKN Orlen SA Unipetrol
EMIS Business Report Generated on 2016-06-02
Copyright copy 2015 EMIS all rights reserved A Euromoney Institutional Investor company Page 29 of 48
Buy-side
16-Sep-10Petrochemicalrefinery
CzechRepublic
Petroleum Refineries
AcquisitionMinoritystakepurchase
PKN Orlen SA
Sell-side
21-Jul-10Polkomtel Sp zoo
PolandWireless TelecommunicationsCarriers (except Satellite)
Acquisition Zygmunt Solorz-Zak - private investor
EMIS Business Report Generated on 2016-06-02
Copyright copy 2015 EMIS all rights reserved A Euromoney Institutional Investor company Page 30 of 48
Fiscal year 2014Companies in Industries 43
IndustryPetroleum Refineries
This company is scored higher thanonly 5266 of companies in theindustry which equates to B - BelowAverage Risk on the Financial Scale Expected
Participation inCustomers Credit
Fiscal year 2014Companies in Industries 43
IndustryPetroleum Refineries
Criteria Weight Score Final Score
I EMIS Benchmark Score 90 207 B Below Average Risk
SIZ E RANKING SCORE
Sales 1 10000
Assets 1 10000
Profit 41 698
Total Shareholders Equity 1 10000
Average Size 11 7675
GROWT H RANKING SCORE
Net Sales Growth Rate 11 7674
Inc Dec in Assets 20 5581
Inc Decin Net Income 24 4651
Increase (Decrease) in Equity 22 5116
Average Growt h 19 5756
PROFIT ABILIT Y RANKING SCORE
Net Income Net Sales 29 3488
Return On Assets 38 1395
Net Income Net Worth 39 1163
Average Prof it abilit y 35 2015
INDEBT EDNESS RANKING SCORE
Indebtedness 22 5116
Leverage 33 2558
Total Liabilities Sales 17 6279
Average Indebt edness 24 4651
II EMIS Trend Score 10 298 E Very High Risk
Scoring Range 1 - Improves 2 - Maintains (According to the tolerance margin) 3 - Deteriorate
EMIS Credit Analytics - Summary
EMIS Financial ScoreEMIS Financial Score was not affected by Conditions
EMIS Benchmark Score
B Below Average Risk
5266
EMIS Trend Score
E Very High Risk
PampL E
Balance Sheet C
Cash Flow E
EMIS Credit Quota
21112537Thousands (USD)
Average Ranking 21 in 43 companies
RELAT IVEST RENGT HS
RELAT IVEWEAKNESSES
Sales Net Income Sales
Sales Growth
Remarks
EMIS Trend Score is calculated based on the 2latest annual company financial statements
Remarks
Credit Quota Recommended was calculatedbased on the industry average customer type(customized) and Financial Score
EMIS Credit Analyt ics - EMIS Financial Score
EMIS Financial ScoreEMIS Financial Score was not affected by Conditions
EMIS Benchmark Score 5266
11
EMIS Business Report Generated on 2016-06-02
Copyright copy 2015 EMIS all rights reserved A Euromoney Institutional Investor company Page 31 of 48
100
PampL 2014 T OT AL
Sales Growth 3 3
Operating Profit Sales 3 3
Net Income Sales 3 3
T ot al PampL 300 300
BALANCE 2014 T OT AL
Days Receivables 2 2
Days Inventory 1 1
Current Ratio 3 3
Indebtness (Total AssetsTotal Liabilities) 3 3
Total Liabilities Sales 3 3
T ot al Balance 230 230
CASH FLOW 2014 T OT AL
Cash from Sales 3 3
Cash for Production 2 2
Cash for Operation 1 1
Net Operation Cash Generation (NOCG) 3 3
Free Cash Flow 3 3
Cash Flow After Financial Expenses 3 3
Cash Flow After Financial 3 3
Reduction in Debt 2 2
T ot al Cash Flow 267 267
III EMIS Financial Score 100 216 CC Above Average Risk
E D C CC B BB A AA
Business Scale
AA - Very Low RiskA - Low RiskBB - Moderate Low RiskB - Below Average RiskCC - Above Average RiskC - Moderate High RiskD - High RiskE - Very High Risk
E Very High Risk
C Moderate High Risk
E Very High Risk
EMIS Credit Analyt ics - EMIS Benchmark Score
EMIS Business Report Generated on 2016-06-02
Copyright copy 2015 EMIS all rights reserved A Euromoney Institutional Investor company Page 32 of 48
Fiscal year 2014Companies in Industries 43
IndustryPetroleum Refineries
SIZ E RANKING SCORE
Sales 1 10000
Assets 1 10000
Profit 41 698
Total Shareholders Equity 1 10000
Average Size 11 7675
GROWT H RANKING SCORE
Net Sales Growth Rate 11 7674
Inc Dec in Assets 20 5581
Inc Decin Net Income 24 4651
Increase (Decrease) in Equity 22 5116
Average Growt h 19 5756
PROFIT ABILIT Y RANKING SCORE
Net Income Net Sales 29 3488
Return On Assets 38 1395
Net Income Net Worth 39 1163
Average Prof it abilit y 35 2015
INDEBT EDNESS RANKING SCORE
Indebtedness 22 5116
Leverage 33 2558
Total Liabilities Sales 17 6279
Average Indebt edness 24 4651
Average Ranking 21
Fiscal year 2014Companies in Industries 43
IndustryPetroleum Refineries
EMIS Credit Quota(Score adjusted)
21112537Thousands (USD)
Participation in credit Financial Score
CC
EMIS Benchmark Score(Against Industry)
5266
EMIS Credit Analyt ics - EMIS Credit Quota
Key parameters af f ecting quota value
COMPANY INDICAT ORS VALUE INDUST RY MULT IPLIERS MAX CALCULAT ED CREDIT
Assets 1332259352 Suppliers Assets 2801 373173079
Net Worth 581261405 Suppliers Net worth 6383 371042677
Tangible Net Worth 604356752 Suppliers Tangible Net Worth 6383 385785372
Net Sales 3067917427 Suppliers Net Sales 1352 414818151
11
EMIS Business Report Generated on 2016-06-02
Copyright copy 2015 EMIS all rights reserved A Euromoney Institutional Investor company Page 33 of 48
Source EMIS Company Database
AVERAGE CREDIT
(BASED ON INDUSTRY)
319886918THOUSANDS (USD)
XEXPECT ED PART ICIPAT ION
(IN CUSTOMERS CREDIT)
11
FINANCIAL SCORE
CC
=
=
CALCULAT ED CREDIT
(AVERAGE X PARTICIPATION)
35187561THOUSANDS (USD)
X
QUOT A ADJUST MENT S
06
=CREDIT QUOT A
(ADJUSTED BY SCORE)
21112537THOUSANDS (USD)
Fiscal year 2014Companies in Industries 43
IndustryPetroleum Refineries
NIP 7740001454 Headquart ers T el +48 (24) 3650000
Cost of Goods Sold 3048984945 Suppliers Cost of Goods Sold 1363 415427048
Operating Profit -134323677 Suppliers Operating Profit -30832 000
Net Profit -165687728 Suppliers Net Profit -26041 000
SUPPLIERS 378193431 Net Sales 3067917427 Financial Liabilities Net Sales 002 715239
Assets 1332259352 Financial Liablities Assets 005 643434
FINANCIAL LIABILIT IES 000 Operating Cycle 1617 Operating Cycle 592663 501950211
Suppliers Turnover 1273 Suppliers Turnover 490503 415427048
AVERAGE CREDIT BASED ON INDUST RY 1121907398
Credit Quota Calculation
Score Multipliers
QUOT A ADJUST MENT S ACCORDING T O T HE FINAL SCORE FINANCIAL SCALE MULT IPLIERS
Expanded QuotaAA 2
A 15
Normal Quota BB 1
Reduced Quota
B 08
CC 06
C 04
No QuotaD 02
E 0
EMIS Credit Analyt ics - Conclusions
EMIS Business Report Generated on 2016-06-02
Copyright copy 2015 EMIS all rights reserved A Euromoney Institutional Investor company Page 34 of 48
Ul Chemikoacutew 7
09-411
Fax +48 (24) 3654040
Email zarzadorlenpl
RELAT IVE ST RENGT HS RANKING SCORE
Sales 1 100
Sales Growth 11 7674
EMIS Credit Quota(Score adjusted)
21112537Thousands (USD)
Participation in credit Financial Score
CC
Date 2016 June 2
Fiscal year 2014Companies in Industries 43
IndustryPetroleum Refineries
Polski Koncern Naftowy ORLEN SAEMIS Credit Analytics
EMIS Benchmark Score (Business Performance Score) is based on financial statements as of 2014 EMIS Benchmark Score of Polski Koncern Naf t owy ORLEN SA is
the result of comparing its financial results with that of 43 companies classified by EMIS Credit Analytics within Pet roleum Ref ineries industry
EMIS Benchmark Score(Against Industry)
5266Note Companies classified in Pet roleum Ref ineries are not necessarily direct competitors Please refer to Benchmark Ranking for complete details of the companies
classified within this industry
EMIS Benchmark Score is the result of the companys ranking within its industry in different financial ratios of Size Profitability Growth Indebtness Efficiency and Liquidity
Ratios In the result it is important to note
EMIS Benchmark Score contributes 90 to the Financial Score The other 10 is represented by evolution versus previous period of Profit amp Loss Balance Sheet and
Cash Flow Statement
EMIS T REND SCORE
Profit amp Loss E
Balance Sheet C
Cash Flow Statement E
EMIS Financial ScoreEMIS Financial Score was not affected by Conditions
Note The Financial Score is not deteriorated by Financial Conditions (see Parameters)
Based on the average credit quote of 11219074 in the Pet roleum Ref ineries industry an EMIS Financial Score of CC and an expected participation in the companyscredit of 11 the recommended credit quota is 740459Note The Financial Score is not deteriorated by Financial Conditions Based on the average credit quote of 11219074 in the Petroleum Refineries industry an EMISFinancial Score of CC and an expectedparticipation in the companys credit of 11 the recommended credit quota is 740459
Key parameters af f ecting quota value
EMIS Credit Analyt ics - Company vs Industry Key Stats
Company vs Industry - Key Stats
REPORTING DETAILS
11
EMIS Business Report Generated on 2016-06-02
Copyright copy 2015 EMIS all rights reserved A Euromoney Institutional Investor company Page 35 of 48
2014 2013 2012
Statement type Individual Individual Individual
Audited Non-Audited Non-Audited Non-Audited
Provider NotoriaMonitor B Fins NotoriaMonitor B Fins NotoriaMonitor B Fins
Companies in Industry 43 54 52
EMIS Benchmark Score 5266 6892 7170
Reporting Standard 197 197 197
Displaying units USD Thousands USD Thousands USD Thousands
SIZ E
2014 2014 2013 2012
AVERAGEINDUST RY
VALUE RANKING VALUE RANKING VALUE RANKING
Sales 915054 30679174 1 37904382 1 38981804 1
Assets 441712 13322594 1 17049137 1 16979933 1
Profit -47512 -1656877 41 58433 1 756549 1
Total Shareholders Equity 193824 5812614 1 9147078 1 9132469 1
Average Size Posit ion 11 1 1
GROWT H
2014 2014 2013 2012
AVERAGEINDUST RY
VALUE RANKING VALUE RANKING VALUE RANKING
Net Sales Growth Rate 2089 -575 11 -551 16 1190 12
Inc Dec In Assets 1610 -901 20 -243 22 -1039 30
Inc DecIn Net Income -406205 -340170 24 -9249 28 -078 17
Increase (Decrease) In Equity -0 77 -2601 22 -267 21 563 13
Average Growt h Posit ion 19 22 18
PROFIT ABILIT Y
2014 2014 2013 2012
AVERAGEINDUST RY
VALUE RANKING VALUE RANKING VALUE RANKING
Net Income Net Sales -519 -540 29 015 25 194 17
Return On Assets -1076 -1244 38 034 23 446 16
Net Income Net Worth -2451 -2850 39 064 36 828 28
Operational Profit Sales -439 -438 27 027 25 168 18
Average Prof it abilit y Posit ion 33 27 20
INDEBT EDNESS
2014 2014 2013 2012
AVERAGEINDUST RY
VALUE RANKING VALUE RANKING VALUE RANKING
Indebtedness 5612 5637 22 4635 21 4622 22
Leverage 12789 12920 33 8639 36 8593 40
Total Liabilities Sales 2709 2448 17 2085 17 2013 21
EMIS Business Report Generated on 2016-06-02
Copyright copy 2015 EMIS all rights reserved A Euromoney Institutional Investor company Page 36 of 48
Fiscal year 2014Companies in Industries 43
IndustryPetroleum Refineries
Current Liabilities Total Liabilities 6146 6279 7 7210 11 6768 11
Average Indebt edness Posit ion 20 21 24
EFFICIENCY
2014 2014 2013 2012
AVERAGEINDUST RY
VALUE RANKING VALUE RANKING VALUE RANKING
Days Receivables 23 24 8 24 10 24 6
Days Inventory 36 33 16 46 19 48 23
Suppliers Turnover 49 45 10 50 15 45 15
Operational Cycle 59 57 11 70 13 72 14
Average Ef f iciency Posit ion 11 14 15
LIQUIDIT Y
2014 2014 2013 2012
AVERAGEINDUST RY
VALUE RANKING VALUE RANKING VALUE RANKING
Current Ratio 128 132 19 142 21 157 22
Quick Ratio 132 132 19 142 21 157 22
Working Capital 42581 1486941 1 2418659 1 3019099 1
Average Liquidit y Posit ion 13 14 15
OT HERS
2014 2014 2013 2012
AVERAGEINDUST RY
VALUE RANKING VALUE RANKING VALUE RANKING
Gross Profit 0 76 062 31 491 34 614 33
Other Income -1926 -1852 32 64868 3 5153 6
Reduction In Debt 158 0 13 0 17 0 12
Average Ot hers Posit ion 25 18 17
EMIS Credit Analyt ics - Company vs Industry Balance Sheet
Company vs Industry - Balance Sheet
REPORTING DETAILS
2014 2013 2012
Statement type Individual Individual Individual
Audited Non-Audited Non-Audited Non-Audited
Provider NotoriaMonitor B Fins NotoriaMonitor B Fins NotoriaMonitor B Fins
Companies in Industry 43 54 52
EMIS Benchmark Score 5266 6892 7170
Reporting Standard 197 197 197
EMIS Business Report Generated on 2016-06-02
Copyright copy 2015 EMIS all rights reserved A Euromoney Institutional Investor company Page 37 of 48
CURRENT ASSET S 2014INDUST RY
2014COMPANY
2013INDUST RY
2013COMPANY
2012INDUST RY
2012COMPANY
V H V H V H V H V H V H
Cash And Banks 1003 11838 1034 6846 533 410 559 851 482 -4599 502 -5387
Short Term Investments 003 -404 000 NA 004 -7992 000 NA 018 457613 000 NA
Account Receivables (Trade) 1320 1670 1510 -915 1313 -821 1513 -380 1346 -1338 1534 005
Inventory 2075 -1109 2104 -2851 2710 -1100 2677 -841 2866 -1097 2852 -789
Deferred Assets 014 -1494 007 -4068 020 -2569 011 -3444 025 -385 017 16719
Current Assets 4413 1190 4656 -1101 4579 -900 4760 -533 4737 -1703 4906 -1431
FIXED ASSET
2014INDUST RY
2014COMPANY
2013INDUST RY
2013COMPANY
2012INDUST RY
2012COMPANY
V H V H V H V H V H V H
- Land And Properties 4838 1574 4846 -907 4853 -232 4850 065 4677 -1788 4701 -690
- Other Equipments 004 -262 000 NA 004 6983 000 NA 002 -1186 000 NA
Fixed Assets 4872 1626 4846 -907 4865 -275 4850 065 4710 -1737 4701 -690
Intangible Assets (Net) 202 823 150 -1458 217 -2685 160 -4312 279 -652 275 199
Investments 240 4117 265 2041 197 13125 200 21858 080 2964 061 5970
Deferred Assets 281 11870 082 15497 149 -2699 029 -4916 193 5695 056 -2566
Total Long Term Assets 5585 1962 5344 -720 5421 -302 5240 036 5263 -1044 5094 -625
T OT AL ASSET S
2014INDUST RY
2014COMPANY
2013INDUST RY
2013COMPANY
2012INDUST RY
2012COMPANY
V H V H V H V H V H V H
Total Assets 10000 1610 10000 -901 10000 -585 10000 -243 10000 -1368 10000 -1039
CURRENT LIABILIT Y
2014INDUST RY
2014COMPANY
2013INDUST RY
2013COMPANY
2012INDUST RY
2012COMPANY
V H V H V H V H V H V H
Suppliers 2801 1472 2839 -1163 2835 -082 2923 603 2691 -3100 2690 -2855
Other Short Term Liabilities 13741 2571 701 5233 12691 320 419 -676 11578 NA 438 NA
Total Current Liability 3449 2100 3540 -362 3309 -111 3342 424 3151 -1924 3128 -1691
LONG T ERM LIABILIT Y
2014INDUST RY
2014COMPANY
2013INDUST RY
2013COMPANY
2012INDUST RY
2012COMPANY
V H V H V H V H V H V H
Long Term Deferred Liabilities 839 -299 028 -299 1004 -2717 026 -2717 1298 NA 035 NA
Other Long Term Liabilities 2187 6238 2070 4861 1564 -1129 1267 -1525 1659 -3979 1459 -3665
Long Term Liabilities 2163 6134 2097 4757 1556 -1368 1293 -1553 1698 -3494 1494 -3513
T OT AL LIABILIT Y
2014INDUST RY
2014COMPANY
2013INDUST RY
2013COMPANY
2012INDUST RY
2012COMPANY
V H V H V H V H V H V H
Total Liabilities 5612 3390 5637 1066 4866 -551 4635 -215 4848 -2553 4622 -2383
EQUIT Y
2014INDUST RY
2014COMPANY
2013INDUST RY
2013COMPANY
2012INDUST RY
2012COMPANY
V H V H V H V H V H V H
EMIS Business Report Generated on 2016-06-02
Copyright copy 2015 EMIS all rights reserved A Euromoney Institutional Investor company Page 38 of 48
Fiscal year 2014Companies in Industries 43
IndustryPetroleum Refineries
Capital 212 3149 226 000 187 -325 206 000 182 -237 201 003
Other Reserves 11156 3618 263 000 9512 000 239 000 8955 -143 233 -2444
Equity Appreciation -178 -439428 -173 -142830 005 5496 -010 -47857 003 4198565 003 NA
Retained Earnings 3652 -439 3702 -2707 4435 -418 4618 -192 4357 -050 4594 1065
Minority Interest 5213 074 346 075 6008 -1233 312 -1231 6451 -1929 347 -1929
Total Net Worth 4388 -077 4363 -2601 5134 -618 5365 -267 5152 153 5378 563
T OT AL LIABILIT Y AND EQUIT Y
2014INDUST RY
2014COMPANY
2013INDUST RY
2013COMPANY
2012INDUST RY
2012COMPANY
V H V H V H V H V H V H
Total Liabilities And Net Worth 10000 1610 10000 -901 10000 -585 10000 -243 10000 -1368 10000 -1039
EMIS Credit Analyt ics - Company vs Industry Income Statement
Company vs Industry - Income Statement
REPORTING DETAILS
2014 2013 2012
Statement type Individual Individual Individual
Audited Non-Audited Non-Audited Non-Audited
Provider NotoriaMonitor B Fins NotoriaMonitor B Fins NotoriaMonitor B Fins
Companies in Industry 43 54 52
EMIS Benchmark Score 5266 6892 7170
Reporting Standard 197 197 197
OPERAT ING PROFIT
2014INDUST RY
2014COMPANY
2013INDUST RY
2013COMPANY
2012INDUST RY
2012COMPANY
V H V H V H V H V H V H
Sales 10000 2089 10000 -575 10000 -1145 10000 -551 10000 500 10000 1190
Cost Of Goods Sold 9924 2648 9938 -150 9485 -1062 9509 -427 9396 612 9386 1253
Gross Profit 0 76 -8210 062 -8814 515 -2441 491 -2451 604 -978 614 313
Administrative AndGeneral Expenses
149 3309 141 420 135 -905 127 -479 132 -638 126 379
Selling Expenses 2650 5320 364 095 2091 094 340 028 1835 1798 320 578
Operational Profit -439 -165868 -438 -163453 034 -8046 027 -8483 154 -2807 168 -206
NON OPERAT ING INCOME
2014INDUST RY
2014COMPANY
2013INDUST RY
2013COMPANY
2012INDUST RY
2012COMPANY
V H V H V H V H V H V H
Total Non-Operating Revenue 036 465 033 -2304 042 -6818 040 -6944 117 -4630 125 -4930
- Financial Revenue 036 465 033 -2304 042 -6818 040 -6944 117 -4630 125 -4930
Total Non-Operating Expenses 190 24437 176 20967 067 -2118 053 -3252 075 -6320 075 -5970
- Financial Expenses 190 24438 176 20967 067 -2119 053 -3252 075 -6320 075 -5970
Other Extraordinary Result 0 00 10000 000 NA -000 9992 000 NA -000 NA -000 NA
EMIS Business Report Generated on 2016-06-02
Copyright copy 2015 EMIS all rights reserved A Euromoney Institutional Investor company Page 39 of 48
Fiscal year 2014Companies in Industries 43
IndustryPetroleum Refineries
Profit Before Income Taxes -594 -909715 -580 -407834 008 -9639 014 -9402 196 -1306 217 -601
T AXES AND OT HERS
2014INDUST RY
2014COMPANY
2013INDUST RY
2013COMPANY
2012INDUST RY
2012COMPANY
V H V H V H V H V H V H
Extraordinary Income (Charges) 0 02 8819 005 4250 002 NA 004 NA 000 -10000 000 NA
Changes Due To Consolidation 027 -8018 002 -8023 162 -5086 008 -5086 292 -4973 014 -4977
Income Tax -0 74 -468549 -039 -72388 -002 7245 006 -8524 -006 -11275 038 -4155
NET PROFIT
2014INDUST RY
2014COMPANY
2013INDUST RY
2013COMPANY
2012INDUST RY
2012COMPANY
V H V H V H V H V H V H
Net Income -519 -406205 -540 -340170 016 -9342 015 -9249 213 544 194 -078
EMIS Credit Analyt ics - Company vs Industry Cash Flow
Company vs Industry - Cash Flow
REPORTING DETAILS
2014 2013 2012
Statement type Individual Individual Individual
Audited Non-Audited Non-Audited Non-Audited
Provider NotoriaMonitor B Fins NotoriaMonitor B Fins NotoriaMonitor B Fins
Companies in Industry 43 54 52
EMIS Benchmark Score 5266 6892 7170
Reporting Standard 197 197 197
CASH OPENING BALANCE
2014INDUST RY
2014COMPANY
2013INDUST RY
2013COMPANY
2012INDUST RY
2012COMPANY
V H V H V H V H V H V H
Initial Cash 222 410 267 851 257 -4599 232 -5387 422 9240 474 8565
CASH FROM SALES
2014INDUST RY
2014COMPANY
2013INDUST RY
2013COMPANY
2012INDUST RY
2012COMPANY
V H V H V H V H V H V H
Net Sales 10000 2089 10000 -575 10000 -1145 10000 -551 10000 500 10000 1190
+- Trade AccountsReceivable
-0 91 -28672 066 13160 059 -4685 027 779616 098 16969 -000 9978
Cash From Sales 9909 1908 10066 -539 10059 -1179 10027 -525 10098 763 10000 1377
CASH FOR PRODUCT ION
2014INDUST RY
2014COMPANY
2013INDUST RY
2013COMPANY
2012INDUST RY
2012COMPANY
V H V H V H V H V H V H
(-) Sales Cost -9924 -2648 -9938 150 -9485 1062 -9509 427 -9396 -612 -9386 -1253
(-) (Inc) Inventory 125 -1020 364 21062 168 -1077 111 -183 167 13866 106 12570
(+) (Inc) Suppliers 174 188875 -162 -30445 -012 9818 075 11510 -572 -26577 -468 -25767
EMIS Business Report Generated on 2016-06-02
Copyright copy 2015 EMIS all rights reserved A Euromoney Institutional Investor company Page 40 of 48
Cash For Production -9625 -2474 -9736 159 -9328 1572 -9324 962 -9801 -961 -9748 -1525
CASH FOR OPERAT ING
2014INDUST RY
2014COMPANY
2013INDUST RY
2013COMPANY
2012INDUST RY
2012COMPANY
V H V H V H V H V H V H
(-) Administrative Expenses -149 -3309 -141 -420 -135 905 -127 479 -132 638 -126 -379
+- Other Operating Results -0 00 -12524 000 NA 001 NA 000 NA 000 NA 000 NA
(-) Selling Expenses -2650 -5320 -364 -095 -2091 -094 -340 -028 -1835 -1798 -320 -578
(-) Period Income Taxes 074 468549 039 72388 002 -7245 -006 8524 006 11275 -038 4155
(+) (Inc) Taxes Payable 002 69344 000 NA -000 -14351 000 NA 001 17119 000 NA
(-) (Inc) Labor EstimatesAnd Provision
-0 12 9215 -000 9200 -189 -12719 -004 -12717 614 184104751 015 NA
Cash For Operation -2736 -3712 -466 794 -2413 -5873 -477 379 -1346 2282 -469 405
OPERAT IONAL CASHFLOW
2014INDUST RY
2014COMPANY
2013INDUST RY
2013COMPANY
2012INDUST RY
2012COMPANY
V H V H V H V H V H V H
Net Operating Cashflow -2453 -7631 -137 -15709 -1682 -4202 225 19816 -1049 1952 -217 -3750
INVEST MENT S IN ASSET S
2014INDUST RY
2014COMPANY
2013INDUST RY
2013COMPANY
2012INDUST RY
2012COMPANY
V H V H V H V H V H V H
(-) (Inc) Net Fixed Assets -329 -67408 210 151250 069 -8689 -014 -10872 468 25487 152 12255
(ndash) (Inc) Investments -0 34 2746 -020 7025 -056 -47405 -062 -48471 -009 -10215 -010 -10826
FREE CASHFLOW
2014INDUST RY
2014COMPANY
2013INDUST RY
2013COMPANY
2012INDUST RY
2012COMPANY
V H V H V H V H V H V H
Free Cashflow -2816 -10396 054 -6596 -1669 -15077 150 28813 -589 5095 -075 -33837
FINANCIAL
2014INDUST RY
2014COMPANY
2013INDUST RY
2013COMPANY
2012INDUST RY
2012COMPANY
V H V H V H V H V H V H
(-) Financial Expenses -154 -65083 -143 -92333 -025 -15241 -013 -12496 042 20392 050 -1713
Cashflow After Financial Costs -2969 -11196 -089 -16127 -1694 -17395 136 60823 -547 5391 -025 -12770
(+) (Inc) Debt Short Term -000 9949 000 NA -000 -21237 000 NA 000 10091 000 NA
(+) (Inc) Debt Long Term 002 69344 000 NA -000 -14351 000 NA 001 17119 000 NA
Cashflow After FinancialExpenses
-2968 -11175 -089 -16127 -1694 -17455 136 60823 -546 5512 -025 -12770
CASHFLOW
2014INDUST RY
2014COMPANY
2013INDUST RY
2013COMPANY
2012INDUST RY
2012COMPANY
V H V H V H V H V H V H
(-) Dividends 503 42726 -126 -4528 -186 682 -082 -1139 -176 -73580 -069 -52834
(-) Other Expenses 002 8819 005 4250 002 NA 004 NA 000 -10000 000 NA
(-) Other Current Debtors 000 NA 000 NA 000 NA 000 NA 000 NA 000 NA
(-) Other Current Assets 002 -7807 002 -2258 011 361835 003 15505 000 10702 -005 -48602
(-) Long-Term AccountsReceivable
000 NA 000 NA 000 NA 000 NA 000 NA 000 NA
EMIS Business Report Generated on 2016-06-02
Copyright copy 2015 EMIS all rights reserved A Euromoney Institutional Investor company Page 41 of 48
(-)(Inc) Deferred And OtherLong Term Assets
-0 72 -37515 -022 -26027 032 11570 013 4240 -178 -88060 008 14351
(-) (Inc) Other Long TermLiabilities
406 56718 294 37011 -105 8205 -103 7364 -518 -37893 -368 -40951
(+) Inflation Adjustmentst Non Recurring Incomes
000 NA 000 NA 000 NA 000 NA 000 NA 000 NA
(+) (Inc) Other AccountsPayable
115 218744 105 82115 -007 -10274 -014 -10676 216 2710149 191 NA
(+) Extraordinary Income Consolidation
027 -8018 002 -8023 162 -5085 008 -5057 292 -4974 014 -5006
(-) Intangible Goods -007 -12244 011 -8077 040 29906 055 230557 009 12060 -002 8712
Complementary Cash-Flow 976 240248 271 31907 -051 8725 -117 5210 -356 -14616 -230 -28078
Net Cash Generation -1992 -3796 183 77289 -1745 -7131 020 10729 -902 -10194 -255 -21675
Ending Cash -1770 -4381 449 6846 -1488 -17434 251 851 -480 -11112 219 -5387
EMIS Business Report Generated on 2016-06-02
Copyright copy 2015 EMIS all rights reserved A Euromoney Institutional Investor company Page 42 of 48
Score Scale
Financial ScaleFinancial Model has 8 risk categories
A - Very Low RiskAA - Low RiskBB - Moderate Low RiskB - Below Average RiskCC - Above Average RiskC - Moderate High RiskD - High Risk E - Very High Risk
Risk Profile
High RiskHigh Risk - used when the loan amounts are relatively high and have a longrepayment period A loss in the Credit would seriously affect the companyresults Commercial credit with maturity exceeding 36 months
A loss in the Credit would seriously affect the results Bank credited to morethan 36 months
Vertical Weighting
Pampl
Sales Growth 12
Operating Profit 12
Net Profit 12
Sub t ot al 36
Balance
Days Receivables 12
Days Inventory 10
Current Ratio 8
Indebtness 8
Indebtednesssales 8
Balance Sub T ot al 46
Cash Flow
Cash From Sales 2
Cash For Production 2
Cash For Operations 2
Operating Cash Generation 5
Free Cash Flow 3
Cash Flow After Fin Ex 2
Cash Flow After Fin Result 2
Reduction In Debt 0
Cash Flow Sub T ot al 18
Total Vertical Weights 100
Tolerance Margin 5
Financial Conditions
Condit ions Score
Negative Net Worth CC
Final Weighting
EMIS Benchmark Score 90
EMIS Trend Score 10
EMIS Credit Analyt ics - EMIS Credit Analyt ics Assumptions
EMIS Business Report Generated on 2016-06-02
Copyright copy 2015 EMIS all rights reserved A Euromoney Institutional Investor company Page 43 of 48
Ret urn on Asset s (ROA)
An indicator of how profitable a company is relative to its total assets ROA gives an
idea as to how efficient management is at using its assets to generate earnings
Calculated by dividing a companys annual earnings by its total assets
Calculated as Net prof it T ot al Asset
Ret urn on Equit y (ROE)
A measure of a corporations profitability that reveals how much profit a company
generates with the money shareholders have invested
Calculated as Net prof it Shareholders equit y
Ret urn on Sales (ROS)
A ratio widely used to evaluate a companys operational efficiency ROS is also
known as a firms operating profit margin
Calculated as Net Prof it Net Sales Revenue
Bookvalue
A companys common stock equity as it appears on a balance sheet equal to total
assets minus liabilities preferred stock and intangible assets such as goodwill
Current Rat io
A liquidity ratio that measures a companys ability to pay short-term obligations
Calculated as Current Asset sCurrent Liabilit ies
Quick rat io
An indicator of a companys short-term liquidity The quick ratio measures a
companys ability to meet its short-term obligations with its most liquid assets The
higher the quick ratio the better the position of the company
Calculated as (Current Asset s-Invent ories)Current Liabilit ies
Debt t o equit y
A measure of a companys financial leverage calculated by dividing its total
liabilities by stockholders equity It indicates what proportion of equity and debt the
company is using to finance its assets
Calculated as T ot al Liabilit iesShareholders Equit y
Debt t o t ot al asset s
A metric used to measure a companys financial risk by determining how much of
the companys assets have been financed by debt Calculated by adding short-term
and long-term debt and then dividing by the companys total assets
Calculated as Short T erm Debt s+Long T erm Debt sT ot al Asset s
Leverage rat io
Leverage ratio provide an indication of the long term solvency of the firm
Calculated as T ot al Asset sShareholders Equit y
Debt Ent erprise Value
This metric is equivalent to the payback period used by debtholders Calculated as
Debt Ent erprise Value
Market Capit alizat ionEBIT DA
Calculated as Market Capit alizat ionEBIT DA
Earning Bef ore Int erest s and T axes (EBIT )
Earning Before Interests and Taxes (EBIT)
EBIT DA
Earnings before interest taxes depreciation and amortization (EBITDA) is a non-
GAAP metric that can be used to evaluate a companys profitability Calculated as
Ent erprise valueNet Sales
Dividing the enterprise value of a firm by its sales or revenues is a way of
comparing firms in cyclical industries Calculated as Enterprise Value Net Sales
Revenue
Ent erprise valueGross income
Calculated as Enterprise value Gross income
Ent erprise valueT ot al Asset s
Calculated as Enterprise value Total Assets
EBIT DA Margin
A measurement that provides a clear view of the companyrsquos core profitability
Calculated as EBITDA Net Sales Revenue
T ot al Operat ing Revenue T rend
Calculated as Total Operating Revenue current year Total Operating Revenue
previous year
Gross Prof it T rend
Calculated in percentage as (Gross Prof it Current Year Gross Prof it
Previous Year) ndash 1
EBIT DA T rend
Calculated as EBITDA current year EBITDA previous year
Account s Receivables T rend
Calculated in percentage as T rade Account s Receivables current year
T rade Account Receivables previous year
Invent ory T rend
Calculated as Inventories current year Inventories previous year
Net Propert y Plant and Equipment (PPampE) T rend
Calculated as Net PPampE current year Net PPampE previous year
T ot al Asset s T rend
Calculated as Total Assets current year Total Assets previous year
Bookvalue T rend
Calculated as Bookvalue current year Bookvalue previous year
Shareholders Equit y T rend
Calculated as Shareholdersrsquo Equity current year Shareholdersrsquo Equity previous
year
Cash f rom Operat ions T rend
Calculated as Net Cash Flow from Operations current year Net Cash Flow from
Operations previous year
Capit al Expendit ures T rend
Calculated as CAPEX current year CAPEX previous year
Dividend per Share T rend
Calculated as Dividend value per (common) share current year Dividend value
per (common) share previous year
Cost t o Income Rat io
A key financial measure showing a bankrsquos cost in relation to its income Ratio is
calculated as Total Operational Cost Total Operational Income
Glossary
EMIS Business Report Generated on 2016-06-02
Copyright copy 2015 EMIS all rights reserved A Euromoney Institutional Investor company Page 44 of 48
EBIT DA = Operat ing Revenue - Operat ing Expenses (Depriciat ion and
Amort izat ion excluded)
Ent erprise Value EBIT DA
Enterprise Value EBITDA is the metric most used to measure how many years it
would take to pay back the investment
Ent erprise Value
A measure of a companys value often used as an alternative to straightforward
market capitalization EV is calculated as market cap plus debt minority interest
and preferred shares minus total cash and cash equivalents
Dooms day rat io
Calculated as Cash Current Liabilit ies
Long T erm Debt t o Capit al
A ratio showing the financial leverage of a firm calculated by dividing long-term
debt by the amount of capital available Calculated as Long t erm debt Long
t erm debt + Pref f ered St ock + Common St ock
Int erest Coverage Rat io
A ratio used to determine how easily a company can pay interest on outstanding
debt The interest coverage ratio is calculated by dividing a companys earnings
before interest and taxes (EBIT) of one period by the companys interest expenses of
the same period Calculated as EBIT Int erest expense
Cash Flow t o Debt
This coverage ratio compares a companys operating cash flow to its total debt
which for purposes of this ratio is defined as the sum of short-term borrowings the
current portion of long-term debt and long-term debt This ratio provides an
indication of a companys ability to cover total debt with its yearly cash flow from
operations The higher the percentage ratio the better the companys ability to carry
its total debt Calculates as Operat ing Cash Flow T ot al Debt
Ret urn on Capit al
A ratio that indicates the efficiency and profitability of a companys capital
investments Calculated as Net Income (Total Asset - Current Liabilities)
Gross Prof it Margin
A financial metric used to assess a firms financial health by revealing the
proportion of money left over from revenues after accounting for the cost of goods
sold Gross profit margin serves as the source for paying additional expenses and
future savings Calculated as (Net Sales Revenue - Cost of Goods Sold) Net
Sales Revenue
Operat ing Prof it Margin
A ratio used to measure a companys pricing strategy and operating efficiency
Calculated as Operat ing prof it Net sales
Account s Receivable T urnover
An accounting measure used to quantify a firms effectiveness in extending credit
as well as collecting debts The receivables turnover ratio is an activity ratio
measuring how efficiently a firm uses its assets Calculated as Net Sales
Revenue T rade Account s Receivable (Net )
Invent ory T urnover
A ratio showing how many times a companys inventory is sold and replaced over a
period Calculated as Sales Invent ory
Current asset t urnover
Calculated as Net Sales Revenue T ot al Current Asset
Ef f iciency Rat io
Calculated as Total non-interest expenses (Total net interest income + Total non-
interest income)
Loans t o Deposit s Rat io
A commonly used statistic for assessing a banks liquidity Calculated as Total
Loans Total Deposits
Liquid Asset s t o Deposit s Rat io
This ratio indicates extent of liquidity maintained by a bank for meeting the demand
made by the depositors Calculated as (Cash + Financial assets held for trading)
Total Deposits
Loans t o Asset Rat io
Calculated as Total Loans Total Assets
Net Int erest Income T rend
Calculated as Net Interest Income current year Net Interest Income previous year
Net Fee and Commission Income T rend
Calculated as Net Fee and Commission Income current year Net Fee and
Commission Income previous year
Loans and Advances t o Cust omers T rend
Calculated as Loans and Advances to Customers current year Loans and
Advances to Customers previous year
Deposit s f rom Cust omers T rend
Calculated as Deposits from Customers current year Deposits from Customers
previous year
Loss Rat io
This ratio indicates the average cost of insurance protection per each dollar of net
premiums earned during the period Calculated as Total Losses Incurred in Claims
Net Insurance Premium Revenue
Underwrit ing Expenses Rat io
This ratio measures operational efficiency in underwriting Calculated as
Underwriting expenses Net Insurance Premium Revenue
Policyholder Dividend Rat io
Calculated as Dividends Net Insurance Premium Revenue
Combined LossExpense Rat io
Calculated as Loss Ratio + Underwriting Expenses Ratio + Policyholder Dividend
Ratio When the combined ratio is under 100 underwriting results are
considered profitable when the combined ratio is over 100 underwriting results
are considered unprofitable
Ceded Premium Rat io
Calculated as Insurance Premium Ceded to Reinsurers Insurance Premium
Revenue
Net Premiums Earned T rend
Calculated as Net Insurance Premium Revenue current year Net Insurance
Premium Revenue previous year
Fees and Commissions T rend
Calculated as Net Fees and Commissions Income current year Net Fees and
Commissions Income previous year
Net Invest ment Income T rend
EMIS Business Report Generated on 2016-06-02
Copyright copy 2015 EMIS all rights reserved A Euromoney Institutional Investor company Page 45 of 48
Fixed-asset t urnover
This ratio is a rough measure of the productivity of a companys fixed assets
(property plant and equipment or PPampE) with respect to generating sales For most
companies their investment in fixed assets represents the single largest
component of their total assets This annual turnover ratio is designed to reflect a
companys efficiency in managing these significant assets Simply put the higher
the yearly turnover rate the better Calculated as Revenue Propert y Plant and
Equipment
Asset T urnover
The amount of sales generated for every dollars worth of assets It is calculated by
dividing sales in dollars by assets in dollars Calculated as Revenue Asset s
Revenue T rend
Calculated as (Net Sales Current Year Net Sales Previous Year)
Net Income T rend
Calculated as (Net Income Current Year Net Income Previous Year)
Operat ing Income T rend
Calculated as (Operat ing Income Current Year Operat ing Income
Previous year)
PriceBook Rat io
A ratio used to compare a stocks market value to its book value It is calculated by
dividing the current closing price of the stock by the latest years book value per
share Calculated as St ock price (T ot al Asset - Int angible asset s and
Liabilit ies)
PriceEarnings Rat io
A valuation ratio of a companys current share price compared to its per-share
earnings Calculated as Market value per share Earning per share EPS
Market capShareholder equit y
A financial ratio showing the premium which is included in the current market price
compared to the actual value of Shareholder equity of the company Calculated as
Market capit alizat ion Shareholders equit y
PriceEBIT Rat io
The PriceEBIT ratio is a market value indicator similar to the PE ratio which shows
the number of times the market price exceeds the earnings per share before the
effects of gross interest abnormal items and tax The PriceEBIT ratio is calculated
as follows Valuat ion price EBIT
T ot al Capit al Rat io
Calculated as T ot al capit al (T ier 1 and T ier 2) rat io = T ot al capit al (T ier 1
and T ier 2) Risk-adjust ed asset s
T ier 1 Rat io
Tier 1 capital is the core measure of a banks financial strength from a regulators
point of view It consists primarily of shareholders equity but may also include
preferred stock that is irredeemable and non-cumulative and retained earnings
Risk Weight ed Asset s
Risk weights are in five categories from zero to 100 per cent Those carrying a
zero weight include notes and coins gold matched by gold liabilities balances with
the Reserve Bank and commonwealth government securities with less than twelve
months to maturity Commonwealth government securities with more than twelve
months to maturity carry a 10 per cent risk weighting as do state government
securities Claims on other banks Australian local governments and public-sector
organisations other than those with corporate status or which operate
Calculated as Investment Income current year Investment Income previous year
Receivables Arising Out Of Direct Insurance Operat ions T rend
Calculated as Receivables Arising out of Direct Insurance Operations current year
Receivables Arising out of Direct Insurance Operations previous year
Operat ing ROA
An indicator that shows the type of net profit which is actually generated by business
effort Calculated as Operat ing Prof it (EBIT ) T ot al Asset s
Payables T urnover
An indicator that evaluates how fast a company pays off its creditors (suppliers)
Calculated as Purchases T rade Payables
Working Capit al T urnover
A measure that indicates how efficiently the company generates revenue with its
working capital Working capital is defined as current assets minus current liabilities
Calculated as Net Sales (T ot al Current Asset s ndash T ot al Current
Liabilit ies)
Working Capit al
A measure of a companyrsquos short term financial health Calculated as T ot al
Current Asset s ndash T ot al Current Liabilit ies
Cash Rat io
A measure of a companyrsquos liquidity in crisis situation Only highly marketable
securities and cash are included Calculated as (T ot al Cash and Cash
Equivalent s + Market able securit ies) T ot al Current Liabilit ies
Cash Flow f rom Operat ion Rat io
A measure of how well current liabilities are covered by the cash flow generated
from a companyrsquos operations Calculated as Net Cash Flow f rom Operat ing
Act ivit ies T ot al Current Liabilit ies
Debt Coverage
A measure that shows a companyrsquos ability to cover total debt with its yearly cash
flow from operations Calculated as Net Cash Flow f rom Operat ing Act ivit ies
T ot al Debt
Cash Flow t o Revenue
This ratio measures the amount of operating cash flow generated for each dollar of
revenue Calculated as Net Cash Flow f rom Operat ing Act ivit ies Net Sales
Revenue
Cash Ret urn on Asset s
This ratio measures the return of operating cash flow attributed to all providers of
capital Calculated as Net Cash Flow f rom Operat ing Act ivit ies T ot al
Asset s
Cash Ret urn on Equit y
This ratio measures the return of operating cash flow attributed to shareholders
Calculated as Net Cash Flow f rom Operat ing Act ivit ies T ot al
Shareholdersrsquo Equit y
Cash t o Income
This ratio measures the ability to generate cash from companyrsquos operations
Calculated as Net Cash Flow f rom Operat ing Act ivit ies Operat ing Prof it
(EBIT )
CashT ot al Asset s
Calculated as Cash and Cash Equivalent s T ot al Asset s
EMIS Business Report Generated on 2016-06-02
Copyright copy 2015 EMIS all rights reserved A Euromoney Institutional Investor company Page 46 of 48
commercially carry a 20 per cent risk weighting Loans secured by a mortgage
over residential property and with a loan-to-valuation of 80 per cent or less carry a
50 per cent risk weighting and loans to companies or individuals carry a 100 per
cent risk weighting
Market Cap Net cash
A ratio measure the market value of the company to the Net cash position of the
company Calculated as Market capit alizat ion (Cash and cash equivalent s
minus long-t erm debt )
Net Cash
Net cash is commonly used in evaluating a companys cash flow More generally
net cash can refer to the amount of cash remaining after a transaction has been
completed and all charges and deductions related to the transaction have been
subtracted Calculated as T ot al cash minus t ot al short t erm liabilit ies
Annualised Ret urn on Equit y (ROE)
Return on Equity ratio (ROE) converted into an annual basis
Annualised Ret urn on Asset s (ROA)
Return on Assets ratio (ROA) converted into an annual basis
Export Proport ion Rat io
The percentage figure of the proportion of the export revenue from the total sales
revenue of the company Calculated as Export revenue T ot al revenue
Net Debt
A metric that shows companys overall debt situation by netting the value of
financial liabilities with its cash and other similar liquid assets Calculated as
financial liabilities - cash and cash equivalents
EPS
The portion of a companys profit allocated to each outstanding share Calculated
as Net Profit Outstanding Shares
PE
A valuation ratio of a companys current share price compared to its per-share
earnings Calculated as Market value per share Earning per share EPS
Market Capit alizat ionNet Sales
Calculated as Market Capitalization Net Sales Revenue
Market Capit alizat ionGross income
Calculated as Market Capitalization Gross Profit
Market Capit alizat ionEBIT
Calculated as Market Capitalization EBIT
Market Capit alizat ionT ot al Asset s
Calculated as Market Capitalization Total Assets
ReceivablesT ot al asset s
Calculated as T rade Account s Receivable T ot al Asset s
Invent oriesT ot al asset s
Calculated as Invent ories T ot al Asset s
Fixed asset sT ot al asset s
Calculated as Non-current Asset s T ot al Asset s
Current Liabilit iesT ot al Liabilit ies
Calculated as T ot al Current Liabilit ies T ot al Liabilit ies
Salaries and Employee Benef it sNet sales
Calculated as Employee Benef it Expenses Net Sales Revenue
Administ rat ive ExpensesNet Sales
Calculated as Administ rat ive Expenses Net Sales Revenue
Depreciat ion and Amort izat ionNet sales
Calculated as Depreciat ion Amort izat ion and Impairment Charges Net
Sales Revenue
Int erest paidNet sales
Calculated as Int erest -t ype Expenses Net Sales Revenue
Income t axNet sales
Calculated as Income T ax Net Sales Revenue
Operat ing Cash Flow t o T ot al Cash Flow
Calculated as Net Cash Flow f rom Operat ing Act ivit ies Net
IncreaseDecrease in Cash and Cash Equivalent s
Cash Flow f rom Invest ing t o T ot al Cash Flow
Calculated as Net cash f low f rom (used in) invest ing act ivit ies Net
IncreaseDecrease in Cash and Cash Equivalent s
Cash f low f rom f inancing t o T ot al cash f low
Calculated as Net cash flow from (used in) financing activities Net
IncreaseDecrease in Cash and Cash Equivalents
Average Yie ld on Asset s
Calculated as T ot al Int erest Income T ot al Asset s
Disclaimer
Whilst EMIS attempts at all times to ensure the accuracy and reliability of the information it provides due to the vast quantity of processed data and the fact that some of
the third-party data cannot always be verified including information provided directly by the subject of the enquiry EMIS does not guarantee the correctness or the
effective delivery of the information and shall not be held responsible for any errors or omissions therein
The content and recommendations shall only be used as a reference in business decisions of EMIS clients and shall not be used for any other purposes EMIS and its
affiliates shall not be held liable for any loss of the clients arising out of its own business decisions whether or not the making of such decision has been referred to this
contentrecommendation
EMIS Business Report Generated on 2016-06-02
Copyright copy 2015 EMIS all rights reserved A Euromoney Institutional Investor company Page 47 of 48
EMIS Business Report Generated on 2016-06-02
Copyright copy 2015 EMIS all rights reserved A Euromoney Institutional Investor company Page 48 of 48
- Table of Contents
- Company Tear Sheet
-
- Contact Information
- NAICS Industry Classification
- Business description
- Basic Information
- EMIS Financial Score
- Share Price information
- Key Executives
- Ownership Details
- Subsidiaries and Affiliates
- Key Financial Highlights
- Financial Performance Charts
- Latest MampA and ECM Deals
- Top Competitors
-
- Financial Statements
-
- Annual Statements
- Interim Statements
- Ratios
- Multiples
-
- Company Documents
-
- Financial DocumentsAnnual Reports
- Corporate Actions
-
- News amp Reports
-
- News
- Reports
-
- MampA and ECM Deals
-
- EMIS DealWatch Deals
- EMIS DealWatch Intents
-
- EMIS Credit Analytics
-
- Summary
- EMIS Financial Score
- EMIS Benchmark Score
- EMIS Credit Quota
- Conclusions
- Company vs Industry Key Stats
- Company vs Industry Balance Sheet
- Company vs Industry Income Statement
- Company vs Industry Cash Flow
- EMIS Credit Analytics Assumptions
-
- Glossary
- Disclaimer
-
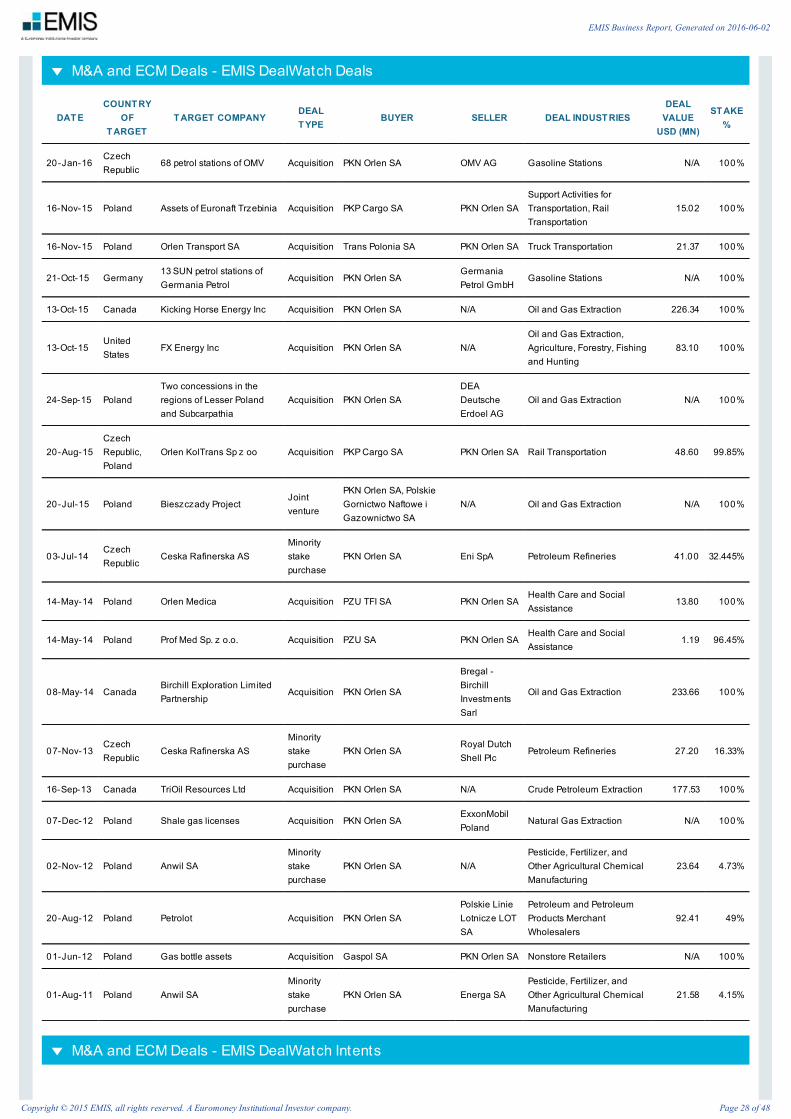
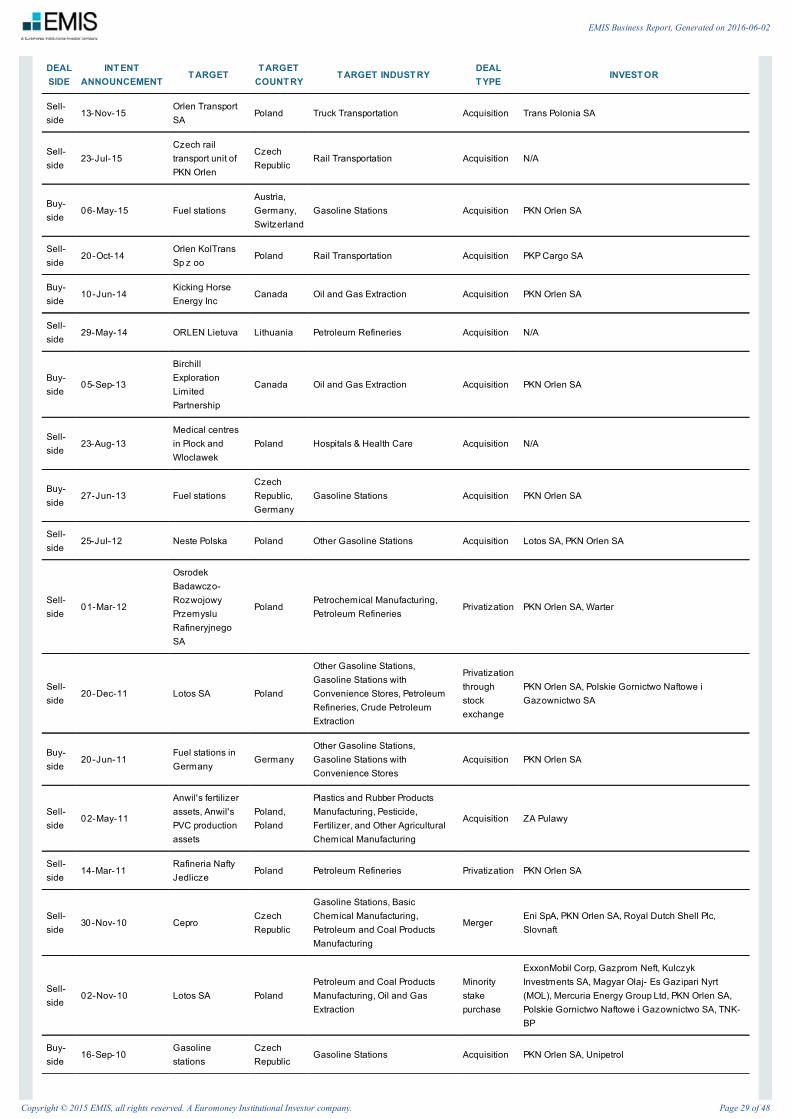
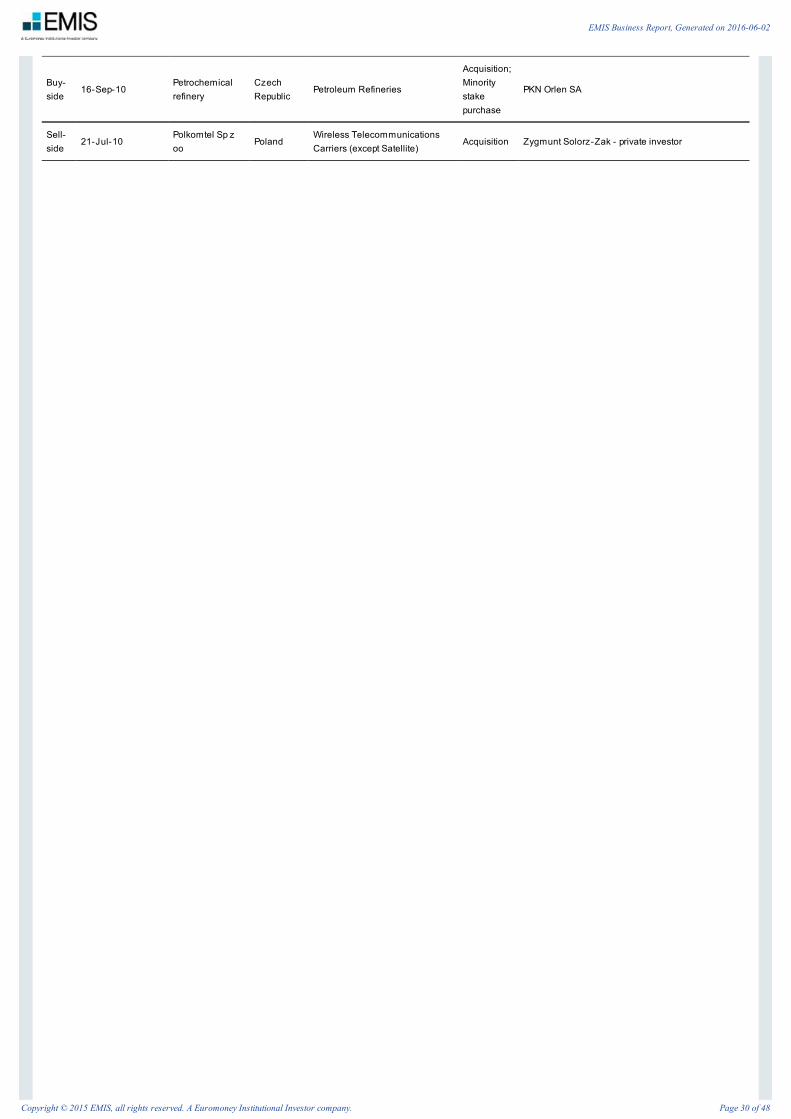
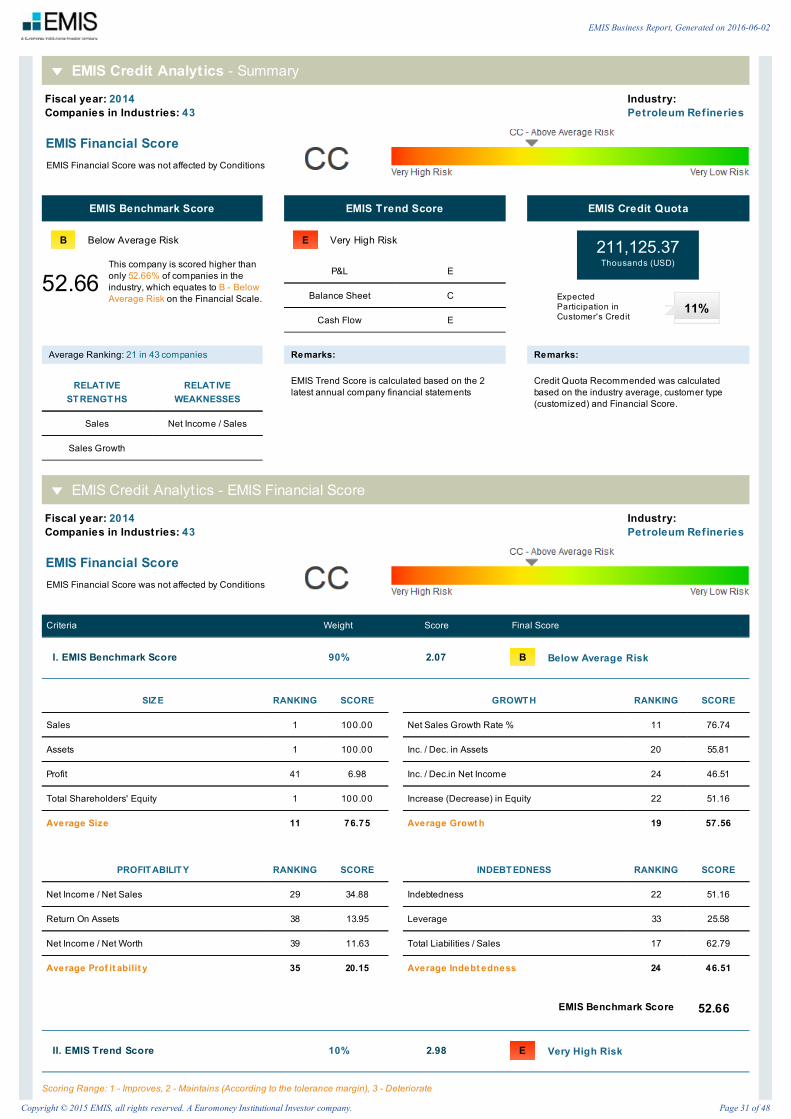
Fiscal year 2014Companies in Industries 43
IndustryPetroleum Refineries
This company is scored higher thanonly 5266 of companies in theindustry which equates to B - BelowAverage Risk on the Financial Scale Expected
Participation inCustomers Credit
Fiscal year 2014Companies in Industries 43
IndustryPetroleum Refineries
Criteria Weight Score Final Score
I EMIS Benchmark Score 90 207 B Below Average Risk
SIZ E RANKING SCORE
Sales 1 10000
Assets 1 10000
Profit 41 698
Total Shareholders Equity 1 10000
Average Size 11 7675
GROWT H RANKING SCORE
Net Sales Growth Rate 11 7674
Inc Dec in Assets 20 5581
Inc Decin Net Income 24 4651
Increase (Decrease) in Equity 22 5116
Average Growt h 19 5756
PROFIT ABILIT Y RANKING SCORE
Net Income Net Sales 29 3488
Return On Assets 38 1395
Net Income Net Worth 39 1163
Average Prof it abilit y 35 2015
INDEBT EDNESS RANKING SCORE
Indebtedness 22 5116
Leverage 33 2558
Total Liabilities Sales 17 6279
Average Indebt edness 24 4651
II EMIS Trend Score 10 298 E Very High Risk
Scoring Range 1 - Improves 2 - Maintains (According to the tolerance margin) 3 - Deteriorate
EMIS Credit Analytics - Summary
EMIS Financial ScoreEMIS Financial Score was not affected by Conditions
EMIS Benchmark Score
B Below Average Risk
5266
EMIS Trend Score
E Very High Risk
PampL E
Balance Sheet C
Cash Flow E
EMIS Credit Quota
21112537Thousands (USD)
Average Ranking 21 in 43 companies
RELAT IVEST RENGT HS
RELAT IVEWEAKNESSES
Sales Net Income Sales
Sales Growth
Remarks
EMIS Trend Score is calculated based on the 2latest annual company financial statements
Remarks
Credit Quota Recommended was calculatedbased on the industry average customer type(customized) and Financial Score
EMIS Credit Analyt ics - EMIS Financial Score
EMIS Financial ScoreEMIS Financial Score was not affected by Conditions
EMIS Benchmark Score 5266
11
EMIS Business Report Generated on 2016-06-02
Copyright copy 2015 EMIS all rights reserved A Euromoney Institutional Investor company Page 31 of 48
100
PampL 2014 T OT AL
Sales Growth 3 3
Operating Profit Sales 3 3
Net Income Sales 3 3
T ot al PampL 300 300
BALANCE 2014 T OT AL
Days Receivables 2 2
Days Inventory 1 1
Current Ratio 3 3
Indebtness (Total AssetsTotal Liabilities) 3 3
Total Liabilities Sales 3 3
T ot al Balance 230 230
CASH FLOW 2014 T OT AL
Cash from Sales 3 3
Cash for Production 2 2
Cash for Operation 1 1
Net Operation Cash Generation (NOCG) 3 3
Free Cash Flow 3 3
Cash Flow After Financial Expenses 3 3
Cash Flow After Financial 3 3
Reduction in Debt 2 2
T ot al Cash Flow 267 267
III EMIS Financial Score 100 216 CC Above Average Risk
E D C CC B BB A AA
Business Scale
AA - Very Low RiskA - Low RiskBB - Moderate Low RiskB - Below Average RiskCC - Above Average RiskC - Moderate High RiskD - High RiskE - Very High Risk
E Very High Risk
C Moderate High Risk
E Very High Risk
EMIS Credit Analyt ics - EMIS Benchmark Score
EMIS Business Report Generated on 2016-06-02
Copyright copy 2015 EMIS all rights reserved A Euromoney Institutional Investor company Page 32 of 48
Fiscal year 2014Companies in Industries 43
IndustryPetroleum Refineries
SIZ E RANKING SCORE
Sales 1 10000
Assets 1 10000
Profit 41 698
Total Shareholders Equity 1 10000
Average Size 11 7675
GROWT H RANKING SCORE
Net Sales Growth Rate 11 7674
Inc Dec in Assets 20 5581
Inc Decin Net Income 24 4651
Increase (Decrease) in Equity 22 5116
Average Growt h 19 5756
PROFIT ABILIT Y RANKING SCORE
Net Income Net Sales 29 3488
Return On Assets 38 1395
Net Income Net Worth 39 1163
Average Prof it abilit y 35 2015
INDEBT EDNESS RANKING SCORE
Indebtedness 22 5116
Leverage 33 2558
Total Liabilities Sales 17 6279
Average Indebt edness 24 4651
Average Ranking 21
Fiscal year 2014Companies in Industries 43
IndustryPetroleum Refineries
EMIS Credit Quota(Score adjusted)
21112537Thousands (USD)
Participation in credit Financial Score
CC
EMIS Benchmark Score(Against Industry)
5266
EMIS Credit Analyt ics - EMIS Credit Quota
Key parameters af f ecting quota value
COMPANY INDICAT ORS VALUE INDUST RY MULT IPLIERS MAX CALCULAT ED CREDIT
Assets 1332259352 Suppliers Assets 2801 373173079
Net Worth 581261405 Suppliers Net worth 6383 371042677
Tangible Net Worth 604356752 Suppliers Tangible Net Worth 6383 385785372
Net Sales 3067917427 Suppliers Net Sales 1352 414818151
11
EMIS Business Report Generated on 2016-06-02
Copyright copy 2015 EMIS all rights reserved A Euromoney Institutional Investor company Page 33 of 48
Source EMIS Company Database
AVERAGE CREDIT
(BASED ON INDUSTRY)
319886918THOUSANDS (USD)
XEXPECT ED PART ICIPAT ION
(IN CUSTOMERS CREDIT)
11
FINANCIAL SCORE
CC
=
=
CALCULAT ED CREDIT
(AVERAGE X PARTICIPATION)
35187561THOUSANDS (USD)
X
QUOT A ADJUST MENT S
06
=CREDIT QUOT A
(ADJUSTED BY SCORE)
21112537THOUSANDS (USD)
Fiscal year 2014Companies in Industries 43
IndustryPetroleum Refineries
NIP 7740001454 Headquart ers T el +48 (24) 3650000
Cost of Goods Sold 3048984945 Suppliers Cost of Goods Sold 1363 415427048
Operating Profit -134323677 Suppliers Operating Profit -30832 000
Net Profit -165687728 Suppliers Net Profit -26041 000
SUPPLIERS 378193431 Net Sales 3067917427 Financial Liabilities Net Sales 002 715239
Assets 1332259352 Financial Liablities Assets 005 643434
FINANCIAL LIABILIT IES 000 Operating Cycle 1617 Operating Cycle 592663 501950211
Suppliers Turnover 1273 Suppliers Turnover 490503 415427048
AVERAGE CREDIT BASED ON INDUST RY 1121907398
Credit Quota Calculation
Score Multipliers
QUOT A ADJUST MENT S ACCORDING T O T HE FINAL SCORE FINANCIAL SCALE MULT IPLIERS
Expanded QuotaAA 2
A 15
Normal Quota BB 1
Reduced Quota
B 08
CC 06
C 04
No QuotaD 02
E 0
EMIS Credit Analyt ics - Conclusions
EMIS Business Report Generated on 2016-06-02
Copyright copy 2015 EMIS all rights reserved A Euromoney Institutional Investor company Page 34 of 48
Ul Chemikoacutew 7
09-411
Fax +48 (24) 3654040
Email zarzadorlenpl
RELAT IVE ST RENGT HS RANKING SCORE
Sales 1 100
Sales Growth 11 7674
EMIS Credit Quota(Score adjusted)
21112537Thousands (USD)
Participation in credit Financial Score
CC
Date 2016 June 2
Fiscal year 2014Companies in Industries 43
IndustryPetroleum Refineries
Polski Koncern Naftowy ORLEN SAEMIS Credit Analytics
EMIS Benchmark Score (Business Performance Score) is based on financial statements as of 2014 EMIS Benchmark Score of Polski Koncern Naf t owy ORLEN SA is
the result of comparing its financial results with that of 43 companies classified by EMIS Credit Analytics within Pet roleum Ref ineries industry
EMIS Benchmark Score(Against Industry)
5266Note Companies classified in Pet roleum Ref ineries are not necessarily direct competitors Please refer to Benchmark Ranking for complete details of the companies
classified within this industry
EMIS Benchmark Score is the result of the companys ranking within its industry in different financial ratios of Size Profitability Growth Indebtness Efficiency and Liquidity
Ratios In the result it is important to note
EMIS Benchmark Score contributes 90 to the Financial Score The other 10 is represented by evolution versus previous period of Profit amp Loss Balance Sheet and
Cash Flow Statement
EMIS T REND SCORE
Profit amp Loss E
Balance Sheet C
Cash Flow Statement E
EMIS Financial ScoreEMIS Financial Score was not affected by Conditions
Note The Financial Score is not deteriorated by Financial Conditions (see Parameters)
Based on the average credit quote of 11219074 in the Pet roleum Ref ineries industry an EMIS Financial Score of CC and an expected participation in the companyscredit of 11 the recommended credit quota is 740459Note The Financial Score is not deteriorated by Financial Conditions Based on the average credit quote of 11219074 in the Petroleum Refineries industry an EMISFinancial Score of CC and an expectedparticipation in the companys credit of 11 the recommended credit quota is 740459
Key parameters af f ecting quota value
EMIS Credit Analyt ics - Company vs Industry Key Stats
Company vs Industry - Key Stats
REPORTING DETAILS
11
EMIS Business Report Generated on 2016-06-02
Copyright copy 2015 EMIS all rights reserved A Euromoney Institutional Investor company Page 35 of 48
2014 2013 2012
Statement type Individual Individual Individual
Audited Non-Audited Non-Audited Non-Audited
Provider NotoriaMonitor B Fins NotoriaMonitor B Fins NotoriaMonitor B Fins
Companies in Industry 43 54 52
EMIS Benchmark Score 5266 6892 7170
Reporting Standard 197 197 197
Displaying units USD Thousands USD Thousands USD Thousands
SIZ E
2014 2014 2013 2012
AVERAGEINDUST RY
VALUE RANKING VALUE RANKING VALUE RANKING
Sales 915054 30679174 1 37904382 1 38981804 1
Assets 441712 13322594 1 17049137 1 16979933 1
Profit -47512 -1656877 41 58433 1 756549 1
Total Shareholders Equity 193824 5812614 1 9147078 1 9132469 1
Average Size Posit ion 11 1 1
GROWT H
2014 2014 2013 2012
AVERAGEINDUST RY
VALUE RANKING VALUE RANKING VALUE RANKING
Net Sales Growth Rate 2089 -575 11 -551 16 1190 12
Inc Dec In Assets 1610 -901 20 -243 22 -1039 30
Inc DecIn Net Income -406205 -340170 24 -9249 28 -078 17
Increase (Decrease) In Equity -0 77 -2601 22 -267 21 563 13
Average Growt h Posit ion 19 22 18
PROFIT ABILIT Y
2014 2014 2013 2012
AVERAGEINDUST RY
VALUE RANKING VALUE RANKING VALUE RANKING
Net Income Net Sales -519 -540 29 015 25 194 17
Return On Assets -1076 -1244 38 034 23 446 16
Net Income Net Worth -2451 -2850 39 064 36 828 28
Operational Profit Sales -439 -438 27 027 25 168 18
Average Prof it abilit y Posit ion 33 27 20
INDEBT EDNESS
2014 2014 2013 2012
AVERAGEINDUST RY
VALUE RANKING VALUE RANKING VALUE RANKING
Indebtedness 5612 5637 22 4635 21 4622 22
Leverage 12789 12920 33 8639 36 8593 40
Total Liabilities Sales 2709 2448 17 2085 17 2013 21
EMIS Business Report Generated on 2016-06-02
Copyright copy 2015 EMIS all rights reserved A Euromoney Institutional Investor company Page 36 of 48
Fiscal year 2014Companies in Industries 43
IndustryPetroleum Refineries
Current Liabilities Total Liabilities 6146 6279 7 7210 11 6768 11
Average Indebt edness Posit ion 20 21 24
EFFICIENCY
2014 2014 2013 2012
AVERAGEINDUST RY
VALUE RANKING VALUE RANKING VALUE RANKING
Days Receivables 23 24 8 24 10 24 6
Days Inventory 36 33 16 46 19 48 23
Suppliers Turnover 49 45 10 50 15 45 15
Operational Cycle 59 57 11 70 13 72 14
Average Ef f iciency Posit ion 11 14 15
LIQUIDIT Y
2014 2014 2013 2012
AVERAGEINDUST RY
VALUE RANKING VALUE RANKING VALUE RANKING
Current Ratio 128 132 19 142 21 157 22
Quick Ratio 132 132 19 142 21 157 22
Working Capital 42581 1486941 1 2418659 1 3019099 1
Average Liquidit y Posit ion 13 14 15
OT HERS
2014 2014 2013 2012
AVERAGEINDUST RY
VALUE RANKING VALUE RANKING VALUE RANKING
Gross Profit 0 76 062 31 491 34 614 33
Other Income -1926 -1852 32 64868 3 5153 6
Reduction In Debt 158 0 13 0 17 0 12
Average Ot hers Posit ion 25 18 17
EMIS Credit Analyt ics - Company vs Industry Balance Sheet
Company vs Industry - Balance Sheet
REPORTING DETAILS
2014 2013 2012
Statement type Individual Individual Individual
Audited Non-Audited Non-Audited Non-Audited
Provider NotoriaMonitor B Fins NotoriaMonitor B Fins NotoriaMonitor B Fins
Companies in Industry 43 54 52
EMIS Benchmark Score 5266 6892 7170
Reporting Standard 197 197 197
EMIS Business Report Generated on 2016-06-02
Copyright copy 2015 EMIS all rights reserved A Euromoney Institutional Investor company Page 37 of 48
CURRENT ASSET S 2014INDUST RY
2014COMPANY
2013INDUST RY
2013COMPANY
2012INDUST RY
2012COMPANY
V H V H V H V H V H V H
Cash And Banks 1003 11838 1034 6846 533 410 559 851 482 -4599 502 -5387
Short Term Investments 003 -404 000 NA 004 -7992 000 NA 018 457613 000 NA
Account Receivables (Trade) 1320 1670 1510 -915 1313 -821 1513 -380 1346 -1338 1534 005
Inventory 2075 -1109 2104 -2851 2710 -1100 2677 -841 2866 -1097 2852 -789
Deferred Assets 014 -1494 007 -4068 020 -2569 011 -3444 025 -385 017 16719
Current Assets 4413 1190 4656 -1101 4579 -900 4760 -533 4737 -1703 4906 -1431
FIXED ASSET
2014INDUST RY
2014COMPANY
2013INDUST RY
2013COMPANY
2012INDUST RY
2012COMPANY
V H V H V H V H V H V H
- Land And Properties 4838 1574 4846 -907 4853 -232 4850 065 4677 -1788 4701 -690
- Other Equipments 004 -262 000 NA 004 6983 000 NA 002 -1186 000 NA
Fixed Assets 4872 1626 4846 -907 4865 -275 4850 065 4710 -1737 4701 -690
Intangible Assets (Net) 202 823 150 -1458 217 -2685 160 -4312 279 -652 275 199
Investments 240 4117 265 2041 197 13125 200 21858 080 2964 061 5970
Deferred Assets 281 11870 082 15497 149 -2699 029 -4916 193 5695 056 -2566
Total Long Term Assets 5585 1962 5344 -720 5421 -302 5240 036 5263 -1044 5094 -625
T OT AL ASSET S
2014INDUST RY
2014COMPANY
2013INDUST RY
2013COMPANY
2012INDUST RY
2012COMPANY
V H V H V H V H V H V H
Total Assets 10000 1610 10000 -901 10000 -585 10000 -243 10000 -1368 10000 -1039
CURRENT LIABILIT Y
2014INDUST RY
2014COMPANY
2013INDUST RY
2013COMPANY
2012INDUST RY
2012COMPANY
V H V H V H V H V H V H
Suppliers 2801 1472 2839 -1163 2835 -082 2923 603 2691 -3100 2690 -2855
Other Short Term Liabilities 13741 2571 701 5233 12691 320 419 -676 11578 NA 438 NA
Total Current Liability 3449 2100 3540 -362 3309 -111 3342 424 3151 -1924 3128 -1691
LONG T ERM LIABILIT Y
2014INDUST RY
2014COMPANY
2013INDUST RY
2013COMPANY
2012INDUST RY
2012COMPANY
V H V H V H V H V H V H
Long Term Deferred Liabilities 839 -299 028 -299 1004 -2717 026 -2717 1298 NA 035 NA
Other Long Term Liabilities 2187 6238 2070 4861 1564 -1129 1267 -1525 1659 -3979 1459 -3665
Long Term Liabilities 2163 6134 2097 4757 1556 -1368 1293 -1553 1698 -3494 1494 -3513
T OT AL LIABILIT Y
2014INDUST RY
2014COMPANY
2013INDUST RY
2013COMPANY
2012INDUST RY
2012COMPANY
V H V H V H V H V H V H
Total Liabilities 5612 3390 5637 1066 4866 -551 4635 -215 4848 -2553 4622 -2383
EQUIT Y
2014INDUST RY
2014COMPANY
2013INDUST RY
2013COMPANY
2012INDUST RY
2012COMPANY
V H V H V H V H V H V H
EMIS Business Report Generated on 2016-06-02
Copyright copy 2015 EMIS all rights reserved A Euromoney Institutional Investor company Page 38 of 48
Fiscal year 2014Companies in Industries 43
IndustryPetroleum Refineries
Capital 212 3149 226 000 187 -325 206 000 182 -237 201 003
Other Reserves 11156 3618 263 000 9512 000 239 000 8955 -143 233 -2444
Equity Appreciation -178 -439428 -173 -142830 005 5496 -010 -47857 003 4198565 003 NA
Retained Earnings 3652 -439 3702 -2707 4435 -418 4618 -192 4357 -050 4594 1065
Minority Interest 5213 074 346 075 6008 -1233 312 -1231 6451 -1929 347 -1929
Total Net Worth 4388 -077 4363 -2601 5134 -618 5365 -267 5152 153 5378 563
T OT AL LIABILIT Y AND EQUIT Y
2014INDUST RY
2014COMPANY
2013INDUST RY
2013COMPANY
2012INDUST RY
2012COMPANY
V H V H V H V H V H V H
Total Liabilities And Net Worth 10000 1610 10000 -901 10000 -585 10000 -243 10000 -1368 10000 -1039
EMIS Credit Analyt ics - Company vs Industry Income Statement
Company vs Industry - Income Statement
REPORTING DETAILS
2014 2013 2012
Statement type Individual Individual Individual
Audited Non-Audited Non-Audited Non-Audited
Provider NotoriaMonitor B Fins NotoriaMonitor B Fins NotoriaMonitor B Fins
Companies in Industry 43 54 52
EMIS Benchmark Score 5266 6892 7170
Reporting Standard 197 197 197
OPERAT ING PROFIT
2014INDUST RY
2014COMPANY
2013INDUST RY
2013COMPANY
2012INDUST RY
2012COMPANY
V H V H V H V H V H V H
Sales 10000 2089 10000 -575 10000 -1145 10000 -551 10000 500 10000 1190
Cost Of Goods Sold 9924 2648 9938 -150 9485 -1062 9509 -427 9396 612 9386 1253
Gross Profit 0 76 -8210 062 -8814 515 -2441 491 -2451 604 -978 614 313
Administrative AndGeneral Expenses
149 3309 141 420 135 -905 127 -479 132 -638 126 379
Selling Expenses 2650 5320 364 095 2091 094 340 028 1835 1798 320 578
Operational Profit -439 -165868 -438 -163453 034 -8046 027 -8483 154 -2807 168 -206
NON OPERAT ING INCOME
2014INDUST RY
2014COMPANY
2013INDUST RY
2013COMPANY
2012INDUST RY
2012COMPANY
V H V H V H V H V H V H
Total Non-Operating Revenue 036 465 033 -2304 042 -6818 040 -6944 117 -4630 125 -4930
- Financial Revenue 036 465 033 -2304 042 -6818 040 -6944 117 -4630 125 -4930
Total Non-Operating Expenses 190 24437 176 20967 067 -2118 053 -3252 075 -6320 075 -5970
- Financial Expenses 190 24438 176 20967 067 -2119 053 -3252 075 -6320 075 -5970
Other Extraordinary Result 0 00 10000 000 NA -000 9992 000 NA -000 NA -000 NA
EMIS Business Report Generated on 2016-06-02
Copyright copy 2015 EMIS all rights reserved A Euromoney Institutional Investor company Page 39 of 48
Fiscal year 2014Companies in Industries 43
IndustryPetroleum Refineries
Profit Before Income Taxes -594 -909715 -580 -407834 008 -9639 014 -9402 196 -1306 217 -601
T AXES AND OT HERS
2014INDUST RY
2014COMPANY
2013INDUST RY
2013COMPANY
2012INDUST RY
2012COMPANY
V H V H V H V H V H V H
Extraordinary Income (Charges) 0 02 8819 005 4250 002 NA 004 NA 000 -10000 000 NA
Changes Due To Consolidation 027 -8018 002 -8023 162 -5086 008 -5086 292 -4973 014 -4977
Income Tax -0 74 -468549 -039 -72388 -002 7245 006 -8524 -006 -11275 038 -4155
NET PROFIT
2014INDUST RY
2014COMPANY
2013INDUST RY
2013COMPANY
2012INDUST RY
2012COMPANY
V H V H V H V H V H V H
Net Income -519 -406205 -540 -340170 016 -9342 015 -9249 213 544 194 -078
EMIS Credit Analyt ics - Company vs Industry Cash Flow
Company vs Industry - Cash Flow
REPORTING DETAILS
2014 2013 2012
Statement type Individual Individual Individual
Audited Non-Audited Non-Audited Non-Audited
Provider NotoriaMonitor B Fins NotoriaMonitor B Fins NotoriaMonitor B Fins
Companies in Industry 43 54 52
EMIS Benchmark Score 5266 6892 7170
Reporting Standard 197 197 197
CASH OPENING BALANCE
2014INDUST RY
2014COMPANY
2013INDUST RY
2013COMPANY
2012INDUST RY
2012COMPANY
V H V H V H V H V H V H
Initial Cash 222 410 267 851 257 -4599 232 -5387 422 9240 474 8565
CASH FROM SALES
2014INDUST RY
2014COMPANY
2013INDUST RY
2013COMPANY
2012INDUST RY
2012COMPANY
V H V H V H V H V H V H
Net Sales 10000 2089 10000 -575 10000 -1145 10000 -551 10000 500 10000 1190
+- Trade AccountsReceivable
-0 91 -28672 066 13160 059 -4685 027 779616 098 16969 -000 9978
Cash From Sales 9909 1908 10066 -539 10059 -1179 10027 -525 10098 763 10000 1377
CASH FOR PRODUCT ION
2014INDUST RY
2014COMPANY
2013INDUST RY
2013COMPANY
2012INDUST RY
2012COMPANY
V H V H V H V H V H V H
(-) Sales Cost -9924 -2648 -9938 150 -9485 1062 -9509 427 -9396 -612 -9386 -1253
(-) (Inc) Inventory 125 -1020 364 21062 168 -1077 111 -183 167 13866 106 12570
(+) (Inc) Suppliers 174 188875 -162 -30445 -012 9818 075 11510 -572 -26577 -468 -25767
EMIS Business Report Generated on 2016-06-02
Copyright copy 2015 EMIS all rights reserved A Euromoney Institutional Investor company Page 40 of 48
Cash For Production -9625 -2474 -9736 159 -9328 1572 -9324 962 -9801 -961 -9748 -1525
CASH FOR OPERAT ING
2014INDUST RY
2014COMPANY
2013INDUST RY
2013COMPANY
2012INDUST RY
2012COMPANY
V H V H V H V H V H V H
(-) Administrative Expenses -149 -3309 -141 -420 -135 905 -127 479 -132 638 -126 -379
+- Other Operating Results -0 00 -12524 000 NA 001 NA 000 NA 000 NA 000 NA
(-) Selling Expenses -2650 -5320 -364 -095 -2091 -094 -340 -028 -1835 -1798 -320 -578
(-) Period Income Taxes 074 468549 039 72388 002 -7245 -006 8524 006 11275 -038 4155
(+) (Inc) Taxes Payable 002 69344 000 NA -000 -14351 000 NA 001 17119 000 NA
(-) (Inc) Labor EstimatesAnd Provision
-0 12 9215 -000 9200 -189 -12719 -004 -12717 614 184104751 015 NA
Cash For Operation -2736 -3712 -466 794 -2413 -5873 -477 379 -1346 2282 -469 405
OPERAT IONAL CASHFLOW
2014INDUST RY
2014COMPANY
2013INDUST RY
2013COMPANY
2012INDUST RY
2012COMPANY
V H V H V H V H V H V H
Net Operating Cashflow -2453 -7631 -137 -15709 -1682 -4202 225 19816 -1049 1952 -217 -3750
INVEST MENT S IN ASSET S
2014INDUST RY
2014COMPANY
2013INDUST RY
2013COMPANY
2012INDUST RY
2012COMPANY
V H V H V H V H V H V H
(-) (Inc) Net Fixed Assets -329 -67408 210 151250 069 -8689 -014 -10872 468 25487 152 12255
(ndash) (Inc) Investments -0 34 2746 -020 7025 -056 -47405 -062 -48471 -009 -10215 -010 -10826
FREE CASHFLOW
2014INDUST RY
2014COMPANY
2013INDUST RY
2013COMPANY
2012INDUST RY
2012COMPANY
V H V H V H V H V H V H
Free Cashflow -2816 -10396 054 -6596 -1669 -15077 150 28813 -589 5095 -075 -33837
FINANCIAL
2014INDUST RY
2014COMPANY
2013INDUST RY
2013COMPANY
2012INDUST RY
2012COMPANY
V H V H V H V H V H V H
(-) Financial Expenses -154 -65083 -143 -92333 -025 -15241 -013 -12496 042 20392 050 -1713
Cashflow After Financial Costs -2969 -11196 -089 -16127 -1694 -17395 136 60823 -547 5391 -025 -12770
(+) (Inc) Debt Short Term -000 9949 000 NA -000 -21237 000 NA 000 10091 000 NA
(+) (Inc) Debt Long Term 002 69344 000 NA -000 -14351 000 NA 001 17119 000 NA
Cashflow After FinancialExpenses
-2968 -11175 -089 -16127 -1694 -17455 136 60823 -546 5512 -025 -12770
CASHFLOW
2014INDUST RY
2014COMPANY
2013INDUST RY
2013COMPANY
2012INDUST RY
2012COMPANY
V H V H V H V H V H V H
(-) Dividends 503 42726 -126 -4528 -186 682 -082 -1139 -176 -73580 -069 -52834
(-) Other Expenses 002 8819 005 4250 002 NA 004 NA 000 -10000 000 NA
(-) Other Current Debtors 000 NA 000 NA 000 NA 000 NA 000 NA 000 NA
(-) Other Current Assets 002 -7807 002 -2258 011 361835 003 15505 000 10702 -005 -48602
(-) Long-Term AccountsReceivable
000 NA 000 NA 000 NA 000 NA 000 NA 000 NA
EMIS Business Report Generated on 2016-06-02
Copyright copy 2015 EMIS all rights reserved A Euromoney Institutional Investor company Page 41 of 48
(-)(Inc) Deferred And OtherLong Term Assets
-0 72 -37515 -022 -26027 032 11570 013 4240 -178 -88060 008 14351
(-) (Inc) Other Long TermLiabilities
406 56718 294 37011 -105 8205 -103 7364 -518 -37893 -368 -40951
(+) Inflation Adjustmentst Non Recurring Incomes
000 NA 000 NA 000 NA 000 NA 000 NA 000 NA
(+) (Inc) Other AccountsPayable
115 218744 105 82115 -007 -10274 -014 -10676 216 2710149 191 NA
(+) Extraordinary Income Consolidation
027 -8018 002 -8023 162 -5085 008 -5057 292 -4974 014 -5006
(-) Intangible Goods -007 -12244 011 -8077 040 29906 055 230557 009 12060 -002 8712
Complementary Cash-Flow 976 240248 271 31907 -051 8725 -117 5210 -356 -14616 -230 -28078
Net Cash Generation -1992 -3796 183 77289 -1745 -7131 020 10729 -902 -10194 -255 -21675
Ending Cash -1770 -4381 449 6846 -1488 -17434 251 851 -480 -11112 219 -5387
EMIS Business Report Generated on 2016-06-02
Copyright copy 2015 EMIS all rights reserved A Euromoney Institutional Investor company Page 42 of 48
Score Scale
Financial ScaleFinancial Model has 8 risk categories
A - Very Low RiskAA - Low RiskBB - Moderate Low RiskB - Below Average RiskCC - Above Average RiskC - Moderate High RiskD - High Risk E - Very High Risk
Risk Profile
High RiskHigh Risk - used when the loan amounts are relatively high and have a longrepayment period A loss in the Credit would seriously affect the companyresults Commercial credit with maturity exceeding 36 months
A loss in the Credit would seriously affect the results Bank credited to morethan 36 months
Vertical Weighting
Pampl
Sales Growth 12
Operating Profit 12
Net Profit 12
Sub t ot al 36
Balance
Days Receivables 12
Days Inventory 10
Current Ratio 8
Indebtness 8
Indebtednesssales 8
Balance Sub T ot al 46
Cash Flow
Cash From Sales 2
Cash For Production 2
Cash For Operations 2
Operating Cash Generation 5
Free Cash Flow 3
Cash Flow After Fin Ex 2
Cash Flow After Fin Result 2
Reduction In Debt 0
Cash Flow Sub T ot al 18
Total Vertical Weights 100
Tolerance Margin 5
Financial Conditions
Condit ions Score
Negative Net Worth CC
Final Weighting
EMIS Benchmark Score 90
EMIS Trend Score 10
EMIS Credit Analyt ics - EMIS Credit Analyt ics Assumptions
EMIS Business Report Generated on 2016-06-02
Copyright copy 2015 EMIS all rights reserved A Euromoney Institutional Investor company Page 43 of 48
Ret urn on Asset s (ROA)
An indicator of how profitable a company is relative to its total assets ROA gives an
idea as to how efficient management is at using its assets to generate earnings
Calculated by dividing a companys annual earnings by its total assets
Calculated as Net prof it T ot al Asset
Ret urn on Equit y (ROE)
A measure of a corporations profitability that reveals how much profit a company
generates with the money shareholders have invested
Calculated as Net prof it Shareholders equit y
Ret urn on Sales (ROS)
A ratio widely used to evaluate a companys operational efficiency ROS is also
known as a firms operating profit margin
Calculated as Net Prof it Net Sales Revenue
Bookvalue
A companys common stock equity as it appears on a balance sheet equal to total
assets minus liabilities preferred stock and intangible assets such as goodwill
Current Rat io
A liquidity ratio that measures a companys ability to pay short-term obligations
Calculated as Current Asset sCurrent Liabilit ies
Quick rat io
An indicator of a companys short-term liquidity The quick ratio measures a
companys ability to meet its short-term obligations with its most liquid assets The
higher the quick ratio the better the position of the company
Calculated as (Current Asset s-Invent ories)Current Liabilit ies
Debt t o equit y
A measure of a companys financial leverage calculated by dividing its total
liabilities by stockholders equity It indicates what proportion of equity and debt the
company is using to finance its assets
Calculated as T ot al Liabilit iesShareholders Equit y
Debt t o t ot al asset s
A metric used to measure a companys financial risk by determining how much of
the companys assets have been financed by debt Calculated by adding short-term
and long-term debt and then dividing by the companys total assets
Calculated as Short T erm Debt s+Long T erm Debt sT ot al Asset s
Leverage rat io
Leverage ratio provide an indication of the long term solvency of the firm
Calculated as T ot al Asset sShareholders Equit y
Debt Ent erprise Value
This metric is equivalent to the payback period used by debtholders Calculated as
Debt Ent erprise Value
Market Capit alizat ionEBIT DA
Calculated as Market Capit alizat ionEBIT DA
Earning Bef ore Int erest s and T axes (EBIT )
Earning Before Interests and Taxes (EBIT)
EBIT DA
Earnings before interest taxes depreciation and amortization (EBITDA) is a non-
GAAP metric that can be used to evaluate a companys profitability Calculated as
Ent erprise valueNet Sales
Dividing the enterprise value of a firm by its sales or revenues is a way of
comparing firms in cyclical industries Calculated as Enterprise Value Net Sales
Revenue
Ent erprise valueGross income
Calculated as Enterprise value Gross income
Ent erprise valueT ot al Asset s
Calculated as Enterprise value Total Assets
EBIT DA Margin
A measurement that provides a clear view of the companyrsquos core profitability
Calculated as EBITDA Net Sales Revenue
T ot al Operat ing Revenue T rend
Calculated as Total Operating Revenue current year Total Operating Revenue
previous year
Gross Prof it T rend
Calculated in percentage as (Gross Prof it Current Year Gross Prof it
Previous Year) ndash 1
EBIT DA T rend
Calculated as EBITDA current year EBITDA previous year
Account s Receivables T rend
Calculated in percentage as T rade Account s Receivables current year
T rade Account Receivables previous year
Invent ory T rend
Calculated as Inventories current year Inventories previous year
Net Propert y Plant and Equipment (PPampE) T rend
Calculated as Net PPampE current year Net PPampE previous year
T ot al Asset s T rend
Calculated as Total Assets current year Total Assets previous year
Bookvalue T rend
Calculated as Bookvalue current year Bookvalue previous year
Shareholders Equit y T rend
Calculated as Shareholdersrsquo Equity current year Shareholdersrsquo Equity previous
year
Cash f rom Operat ions T rend
Calculated as Net Cash Flow from Operations current year Net Cash Flow from
Operations previous year
Capit al Expendit ures T rend
Calculated as CAPEX current year CAPEX previous year
Dividend per Share T rend
Calculated as Dividend value per (common) share current year Dividend value
per (common) share previous year
Cost t o Income Rat io
A key financial measure showing a bankrsquos cost in relation to its income Ratio is
calculated as Total Operational Cost Total Operational Income
Glossary
EMIS Business Report Generated on 2016-06-02
Copyright copy 2015 EMIS all rights reserved A Euromoney Institutional Investor company Page 44 of 48
EBIT DA = Operat ing Revenue - Operat ing Expenses (Depriciat ion and
Amort izat ion excluded)
Ent erprise Value EBIT DA
Enterprise Value EBITDA is the metric most used to measure how many years it
would take to pay back the investment
Ent erprise Value
A measure of a companys value often used as an alternative to straightforward
market capitalization EV is calculated as market cap plus debt minority interest
and preferred shares minus total cash and cash equivalents
Dooms day rat io
Calculated as Cash Current Liabilit ies
Long T erm Debt t o Capit al
A ratio showing the financial leverage of a firm calculated by dividing long-term
debt by the amount of capital available Calculated as Long t erm debt Long
t erm debt + Pref f ered St ock + Common St ock
Int erest Coverage Rat io
A ratio used to determine how easily a company can pay interest on outstanding
debt The interest coverage ratio is calculated by dividing a companys earnings
before interest and taxes (EBIT) of one period by the companys interest expenses of
the same period Calculated as EBIT Int erest expense
Cash Flow t o Debt
This coverage ratio compares a companys operating cash flow to its total debt
which for purposes of this ratio is defined as the sum of short-term borrowings the
current portion of long-term debt and long-term debt This ratio provides an
indication of a companys ability to cover total debt with its yearly cash flow from
operations The higher the percentage ratio the better the companys ability to carry
its total debt Calculates as Operat ing Cash Flow T ot al Debt
Ret urn on Capit al
A ratio that indicates the efficiency and profitability of a companys capital
investments Calculated as Net Income (Total Asset - Current Liabilities)
Gross Prof it Margin
A financial metric used to assess a firms financial health by revealing the
proportion of money left over from revenues after accounting for the cost of goods
sold Gross profit margin serves as the source for paying additional expenses and
future savings Calculated as (Net Sales Revenue - Cost of Goods Sold) Net
Sales Revenue
Operat ing Prof it Margin
A ratio used to measure a companys pricing strategy and operating efficiency
Calculated as Operat ing prof it Net sales
Account s Receivable T urnover
An accounting measure used to quantify a firms effectiveness in extending credit
as well as collecting debts The receivables turnover ratio is an activity ratio
measuring how efficiently a firm uses its assets Calculated as Net Sales
Revenue T rade Account s Receivable (Net )
Invent ory T urnover
A ratio showing how many times a companys inventory is sold and replaced over a
period Calculated as Sales Invent ory
Current asset t urnover
Calculated as Net Sales Revenue T ot al Current Asset
Ef f iciency Rat io
Calculated as Total non-interest expenses (Total net interest income + Total non-
interest income)
Loans t o Deposit s Rat io
A commonly used statistic for assessing a banks liquidity Calculated as Total
Loans Total Deposits
Liquid Asset s t o Deposit s Rat io
This ratio indicates extent of liquidity maintained by a bank for meeting the demand
made by the depositors Calculated as (Cash + Financial assets held for trading)
Total Deposits
Loans t o Asset Rat io
Calculated as Total Loans Total Assets
Net Int erest Income T rend
Calculated as Net Interest Income current year Net Interest Income previous year
Net Fee and Commission Income T rend
Calculated as Net Fee and Commission Income current year Net Fee and
Commission Income previous year
Loans and Advances t o Cust omers T rend
Calculated as Loans and Advances to Customers current year Loans and
Advances to Customers previous year
Deposit s f rom Cust omers T rend
Calculated as Deposits from Customers current year Deposits from Customers
previous year
Loss Rat io
This ratio indicates the average cost of insurance protection per each dollar of net
premiums earned during the period Calculated as Total Losses Incurred in Claims
Net Insurance Premium Revenue
Underwrit ing Expenses Rat io
This ratio measures operational efficiency in underwriting Calculated as
Underwriting expenses Net Insurance Premium Revenue
Policyholder Dividend Rat io
Calculated as Dividends Net Insurance Premium Revenue
Combined LossExpense Rat io
Calculated as Loss Ratio + Underwriting Expenses Ratio + Policyholder Dividend
Ratio When the combined ratio is under 100 underwriting results are
considered profitable when the combined ratio is over 100 underwriting results
are considered unprofitable
Ceded Premium Rat io
Calculated as Insurance Premium Ceded to Reinsurers Insurance Premium
Revenue
Net Premiums Earned T rend
Calculated as Net Insurance Premium Revenue current year Net Insurance
Premium Revenue previous year
Fees and Commissions T rend
Calculated as Net Fees and Commissions Income current year Net Fees and
Commissions Income previous year
Net Invest ment Income T rend
EMIS Business Report Generated on 2016-06-02
Copyright copy 2015 EMIS all rights reserved A Euromoney Institutional Investor company Page 45 of 48
Fixed-asset t urnover
This ratio is a rough measure of the productivity of a companys fixed assets
(property plant and equipment or PPampE) with respect to generating sales For most
companies their investment in fixed assets represents the single largest
component of their total assets This annual turnover ratio is designed to reflect a
companys efficiency in managing these significant assets Simply put the higher
the yearly turnover rate the better Calculated as Revenue Propert y Plant and
Equipment
Asset T urnover
The amount of sales generated for every dollars worth of assets It is calculated by
dividing sales in dollars by assets in dollars Calculated as Revenue Asset s
Revenue T rend
Calculated as (Net Sales Current Year Net Sales Previous Year)
Net Income T rend
Calculated as (Net Income Current Year Net Income Previous Year)
Operat ing Income T rend
Calculated as (Operat ing Income Current Year Operat ing Income
Previous year)
PriceBook Rat io
A ratio used to compare a stocks market value to its book value It is calculated by
dividing the current closing price of the stock by the latest years book value per
share Calculated as St ock price (T ot al Asset - Int angible asset s and
Liabilit ies)
PriceEarnings Rat io
A valuation ratio of a companys current share price compared to its per-share
earnings Calculated as Market value per share Earning per share EPS
Market capShareholder equit y
A financial ratio showing the premium which is included in the current market price
compared to the actual value of Shareholder equity of the company Calculated as
Market capit alizat ion Shareholders equit y
PriceEBIT Rat io
The PriceEBIT ratio is a market value indicator similar to the PE ratio which shows
the number of times the market price exceeds the earnings per share before the
effects of gross interest abnormal items and tax The PriceEBIT ratio is calculated
as follows Valuat ion price EBIT
T ot al Capit al Rat io
Calculated as T ot al capit al (T ier 1 and T ier 2) rat io = T ot al capit al (T ier 1
and T ier 2) Risk-adjust ed asset s
T ier 1 Rat io
Tier 1 capital is the core measure of a banks financial strength from a regulators
point of view It consists primarily of shareholders equity but may also include
preferred stock that is irredeemable and non-cumulative and retained earnings
Risk Weight ed Asset s
Risk weights are in five categories from zero to 100 per cent Those carrying a
zero weight include notes and coins gold matched by gold liabilities balances with
the Reserve Bank and commonwealth government securities with less than twelve
months to maturity Commonwealth government securities with more than twelve
months to maturity carry a 10 per cent risk weighting as do state government
securities Claims on other banks Australian local governments and public-sector
organisations other than those with corporate status or which operate
Calculated as Investment Income current year Investment Income previous year
Receivables Arising Out Of Direct Insurance Operat ions T rend
Calculated as Receivables Arising out of Direct Insurance Operations current year
Receivables Arising out of Direct Insurance Operations previous year
Operat ing ROA
An indicator that shows the type of net profit which is actually generated by business
effort Calculated as Operat ing Prof it (EBIT ) T ot al Asset s
Payables T urnover
An indicator that evaluates how fast a company pays off its creditors (suppliers)
Calculated as Purchases T rade Payables
Working Capit al T urnover
A measure that indicates how efficiently the company generates revenue with its
working capital Working capital is defined as current assets minus current liabilities
Calculated as Net Sales (T ot al Current Asset s ndash T ot al Current
Liabilit ies)
Working Capit al
A measure of a companyrsquos short term financial health Calculated as T ot al
Current Asset s ndash T ot al Current Liabilit ies
Cash Rat io
A measure of a companyrsquos liquidity in crisis situation Only highly marketable
securities and cash are included Calculated as (T ot al Cash and Cash
Equivalent s + Market able securit ies) T ot al Current Liabilit ies
Cash Flow f rom Operat ion Rat io
A measure of how well current liabilities are covered by the cash flow generated
from a companyrsquos operations Calculated as Net Cash Flow f rom Operat ing
Act ivit ies T ot al Current Liabilit ies
Debt Coverage
A measure that shows a companyrsquos ability to cover total debt with its yearly cash
flow from operations Calculated as Net Cash Flow f rom Operat ing Act ivit ies
T ot al Debt
Cash Flow t o Revenue
This ratio measures the amount of operating cash flow generated for each dollar of
revenue Calculated as Net Cash Flow f rom Operat ing Act ivit ies Net Sales
Revenue
Cash Ret urn on Asset s
This ratio measures the return of operating cash flow attributed to all providers of
capital Calculated as Net Cash Flow f rom Operat ing Act ivit ies T ot al
Asset s
Cash Ret urn on Equit y
This ratio measures the return of operating cash flow attributed to shareholders
Calculated as Net Cash Flow f rom Operat ing Act ivit ies T ot al
Shareholdersrsquo Equit y
Cash t o Income
This ratio measures the ability to generate cash from companyrsquos operations
Calculated as Net Cash Flow f rom Operat ing Act ivit ies Operat ing Prof it
(EBIT )
CashT ot al Asset s
Calculated as Cash and Cash Equivalent s T ot al Asset s
EMIS Business Report Generated on 2016-06-02
Copyright copy 2015 EMIS all rights reserved A Euromoney Institutional Investor company Page 46 of 48
commercially carry a 20 per cent risk weighting Loans secured by a mortgage
over residential property and with a loan-to-valuation of 80 per cent or less carry a
50 per cent risk weighting and loans to companies or individuals carry a 100 per
cent risk weighting
Market Cap Net cash
A ratio measure the market value of the company to the Net cash position of the
company Calculated as Market capit alizat ion (Cash and cash equivalent s
minus long-t erm debt )
Net Cash
Net cash is commonly used in evaluating a companys cash flow More generally
net cash can refer to the amount of cash remaining after a transaction has been
completed and all charges and deductions related to the transaction have been
subtracted Calculated as T ot al cash minus t ot al short t erm liabilit ies
Annualised Ret urn on Equit y (ROE)
Return on Equity ratio (ROE) converted into an annual basis
Annualised Ret urn on Asset s (ROA)
Return on Assets ratio (ROA) converted into an annual basis
Export Proport ion Rat io
The percentage figure of the proportion of the export revenue from the total sales
revenue of the company Calculated as Export revenue T ot al revenue
Net Debt
A metric that shows companys overall debt situation by netting the value of
financial liabilities with its cash and other similar liquid assets Calculated as
financial liabilities - cash and cash equivalents
EPS
The portion of a companys profit allocated to each outstanding share Calculated
as Net Profit Outstanding Shares
PE
A valuation ratio of a companys current share price compared to its per-share
earnings Calculated as Market value per share Earning per share EPS
Market Capit alizat ionNet Sales
Calculated as Market Capitalization Net Sales Revenue
Market Capit alizat ionGross income
Calculated as Market Capitalization Gross Profit
Market Capit alizat ionEBIT
Calculated as Market Capitalization EBIT
Market Capit alizat ionT ot al Asset s
Calculated as Market Capitalization Total Assets
ReceivablesT ot al asset s
Calculated as T rade Account s Receivable T ot al Asset s
Invent oriesT ot al asset s
Calculated as Invent ories T ot al Asset s
Fixed asset sT ot al asset s
Calculated as Non-current Asset s T ot al Asset s
Current Liabilit iesT ot al Liabilit ies
Calculated as T ot al Current Liabilit ies T ot al Liabilit ies
Salaries and Employee Benef it sNet sales
Calculated as Employee Benef it Expenses Net Sales Revenue
Administ rat ive ExpensesNet Sales
Calculated as Administ rat ive Expenses Net Sales Revenue
Depreciat ion and Amort izat ionNet sales
Calculated as Depreciat ion Amort izat ion and Impairment Charges Net
Sales Revenue
Int erest paidNet sales
Calculated as Int erest -t ype Expenses Net Sales Revenue
Income t axNet sales
Calculated as Income T ax Net Sales Revenue
Operat ing Cash Flow t o T ot al Cash Flow
Calculated as Net Cash Flow f rom Operat ing Act ivit ies Net
IncreaseDecrease in Cash and Cash Equivalent s
Cash Flow f rom Invest ing t o T ot al Cash Flow
Calculated as Net cash f low f rom (used in) invest ing act ivit ies Net
IncreaseDecrease in Cash and Cash Equivalent s
Cash f low f rom f inancing t o T ot al cash f low
Calculated as Net cash flow from (used in) financing activities Net
IncreaseDecrease in Cash and Cash Equivalents
Average Yie ld on Asset s
Calculated as T ot al Int erest Income T ot al Asset s
Disclaimer
Whilst EMIS attempts at all times to ensure the accuracy and reliability of the information it provides due to the vast quantity of processed data and the fact that some of
the third-party data cannot always be verified including information provided directly by the subject of the enquiry EMIS does not guarantee the correctness or the
effective delivery of the information and shall not be held responsible for any errors or omissions therein
The content and recommendations shall only be used as a reference in business decisions of EMIS clients and shall not be used for any other purposes EMIS and its
affiliates shall not be held liable for any loss of the clients arising out of its own business decisions whether or not the making of such decision has been referred to this
contentrecommendation
EMIS Business Report Generated on 2016-06-02
Copyright copy 2015 EMIS all rights reserved A Euromoney Institutional Investor company Page 47 of 48
EMIS Business Report Generated on 2016-06-02
Copyright copy 2015 EMIS all rights reserved A Euromoney Institutional Investor company Page 48 of 48
- Table of Contents
- Company Tear Sheet
-
- Contact Information
- NAICS Industry Classification
- Business description
- Basic Information
- EMIS Financial Score
- Share Price information
- Key Executives
- Ownership Details
- Subsidiaries and Affiliates
- Key Financial Highlights
- Financial Performance Charts
- Latest MampA and ECM Deals
- Top Competitors
-
- Financial Statements
-
- Annual Statements
- Interim Statements
- Ratios
- Multiples
-
- Company Documents
-
- Financial DocumentsAnnual Reports
- Corporate Actions
-
- News amp Reports
-
- News
- Reports
-
- MampA and ECM Deals
-
- EMIS DealWatch Deals
- EMIS DealWatch Intents
-
- EMIS Credit Analytics
-
- Summary
- EMIS Financial Score
- EMIS Benchmark Score
- EMIS Credit Quota
- Conclusions
- Company vs Industry Key Stats
- Company vs Industry Balance Sheet
- Company vs Industry Income Statement
- Company vs Industry Cash Flow
- EMIS Credit Analytics Assumptions
-
- Glossary
- Disclaimer
-
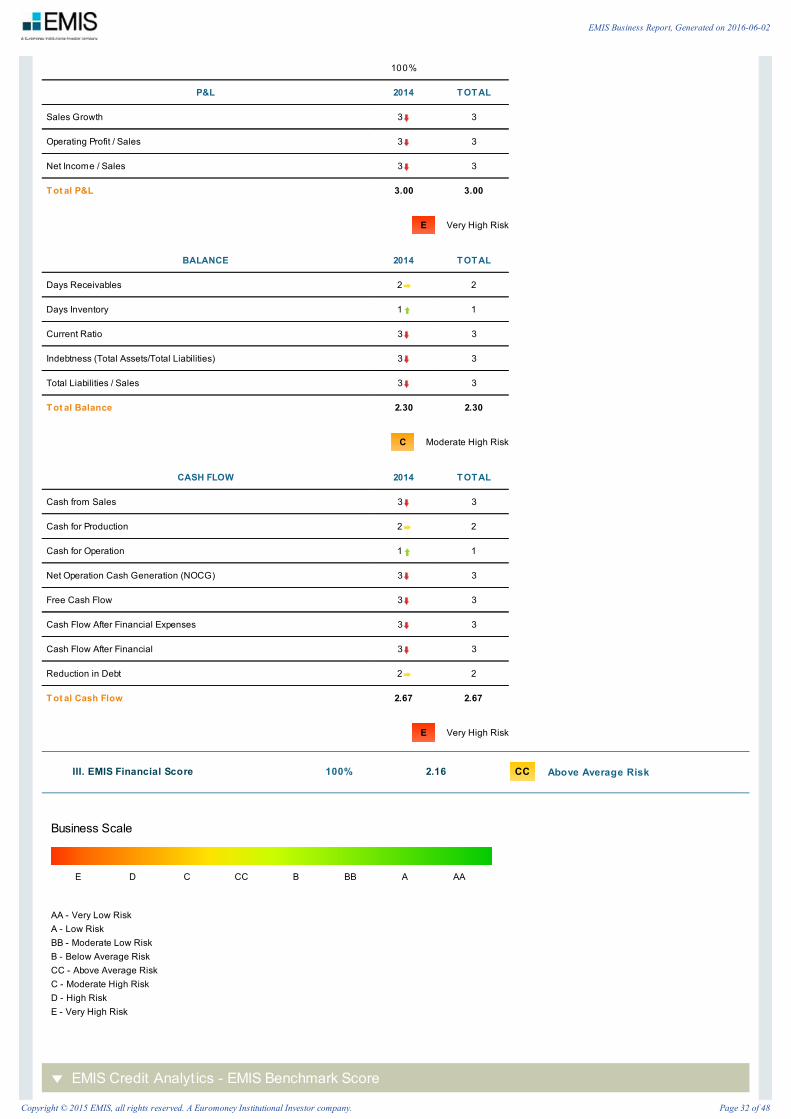

Fiscal year 2014Companies in Industries 43
IndustryPetroleum Refineries
SIZ E RANKING SCORE
Sales 1 10000
Assets 1 10000
Profit 41 698
Total Shareholders Equity 1 10000
Average Size 11 7675
GROWT H RANKING SCORE
Net Sales Growth Rate 11 7674
Inc Dec in Assets 20 5581
Inc Decin Net Income 24 4651
Increase (Decrease) in Equity 22 5116
Average Growt h 19 5756
PROFIT ABILIT Y RANKING SCORE
Net Income Net Sales 29 3488
Return On Assets 38 1395
Net Income Net Worth 39 1163
Average Prof it abilit y 35 2015
INDEBT EDNESS RANKING SCORE
Indebtedness 22 5116
Leverage 33 2558
Total Liabilities Sales 17 6279
Average Indebt edness 24 4651
Average Ranking 21
Fiscal year 2014Companies in Industries 43
IndustryPetroleum Refineries
EMIS Credit Quota(Score adjusted)
21112537Thousands (USD)
Participation in credit Financial Score
CC
EMIS Benchmark Score(Against Industry)
5266
EMIS Credit Analyt ics - EMIS Credit Quota
Key parameters af f ecting quota value
COMPANY INDICAT ORS VALUE INDUST RY MULT IPLIERS MAX CALCULAT ED CREDIT
Assets 1332259352 Suppliers Assets 2801 373173079
Net Worth 581261405 Suppliers Net worth 6383 371042677
Tangible Net Worth 604356752 Suppliers Tangible Net Worth 6383 385785372
Net Sales 3067917427 Suppliers Net Sales 1352 414818151
11
EMIS Business Report Generated on 2016-06-02
Copyright copy 2015 EMIS all rights reserved A Euromoney Institutional Investor company Page 33 of 48
Source EMIS Company Database
AVERAGE CREDIT
(BASED ON INDUSTRY)
319886918THOUSANDS (USD)
XEXPECT ED PART ICIPAT ION
(IN CUSTOMERS CREDIT)
11
FINANCIAL SCORE
CC
=
=
CALCULAT ED CREDIT
(AVERAGE X PARTICIPATION)
35187561THOUSANDS (USD)
X
QUOT A ADJUST MENT S
06
=CREDIT QUOT A
(ADJUSTED BY SCORE)
21112537THOUSANDS (USD)
Fiscal year 2014Companies in Industries 43
IndustryPetroleum Refineries
NIP 7740001454 Headquart ers T el +48 (24) 3650000
Cost of Goods Sold 3048984945 Suppliers Cost of Goods Sold 1363 415427048
Operating Profit -134323677 Suppliers Operating Profit -30832 000
Net Profit -165687728 Suppliers Net Profit -26041 000
SUPPLIERS 378193431 Net Sales 3067917427 Financial Liabilities Net Sales 002 715239
Assets 1332259352 Financial Liablities Assets 005 643434
FINANCIAL LIABILIT IES 000 Operating Cycle 1617 Operating Cycle 592663 501950211
Suppliers Turnover 1273 Suppliers Turnover 490503 415427048
AVERAGE CREDIT BASED ON INDUST RY 1121907398
Credit Quota Calculation
Score Multipliers
QUOT A ADJUST MENT S ACCORDING T O T HE FINAL SCORE FINANCIAL SCALE MULT IPLIERS
Expanded QuotaAA 2
A 15
Normal Quota BB 1
Reduced Quota
B 08
CC 06
C 04
No QuotaD 02
E 0
EMIS Credit Analyt ics - Conclusions
EMIS Business Report Generated on 2016-06-02
Copyright copy 2015 EMIS all rights reserved A Euromoney Institutional Investor company Page 34 of 48
Ul Chemikoacutew 7
09-411
Fax +48 (24) 3654040
Email zarzadorlenpl
RELAT IVE ST RENGT HS RANKING SCORE
Sales 1 100
Sales Growth 11 7674
EMIS Credit Quota(Score adjusted)
21112537Thousands (USD)
Participation in credit Financial Score
CC
Date 2016 June 2
Fiscal year 2014Companies in Industries 43
IndustryPetroleum Refineries
Polski Koncern Naftowy ORLEN SAEMIS Credit Analytics
EMIS Benchmark Score (Business Performance Score) is based on financial statements as of 2014 EMIS Benchmark Score of Polski Koncern Naf t owy ORLEN SA is
the result of comparing its financial results with that of 43 companies classified by EMIS Credit Analytics within Pet roleum Ref ineries industry
EMIS Benchmark Score(Against Industry)
5266Note Companies classified in Pet roleum Ref ineries are not necessarily direct competitors Please refer to Benchmark Ranking for complete details of the companies
classified within this industry
EMIS Benchmark Score is the result of the companys ranking within its industry in different financial ratios of Size Profitability Growth Indebtness Efficiency and Liquidity
Ratios In the result it is important to note
EMIS Benchmark Score contributes 90 to the Financial Score The other 10 is represented by evolution versus previous period of Profit amp Loss Balance Sheet and
Cash Flow Statement
EMIS T REND SCORE
Profit amp Loss E
Balance Sheet C
Cash Flow Statement E
EMIS Financial ScoreEMIS Financial Score was not affected by Conditions
Note The Financial Score is not deteriorated by Financial Conditions (see Parameters)
Based on the average credit quote of 11219074 in the Pet roleum Ref ineries industry an EMIS Financial Score of CC and an expected participation in the companyscredit of 11 the recommended credit quota is 740459Note The Financial Score is not deteriorated by Financial Conditions Based on the average credit quote of 11219074 in the Petroleum Refineries industry an EMISFinancial Score of CC and an expectedparticipation in the companys credit of 11 the recommended credit quota is 740459
Key parameters af f ecting quota value
EMIS Credit Analyt ics - Company vs Industry Key Stats
Company vs Industry - Key Stats
REPORTING DETAILS
11
EMIS Business Report Generated on 2016-06-02
Copyright copy 2015 EMIS all rights reserved A Euromoney Institutional Investor company Page 35 of 48
2014 2013 2012
Statement type Individual Individual Individual
Audited Non-Audited Non-Audited Non-Audited
Provider NotoriaMonitor B Fins NotoriaMonitor B Fins NotoriaMonitor B Fins
Companies in Industry 43 54 52
EMIS Benchmark Score 5266 6892 7170
Reporting Standard 197 197 197
Displaying units USD Thousands USD Thousands USD Thousands
SIZ E
2014 2014 2013 2012
AVERAGEINDUST RY
VALUE RANKING VALUE RANKING VALUE RANKING
Sales 915054 30679174 1 37904382 1 38981804 1
Assets 441712 13322594 1 17049137 1 16979933 1
Profit -47512 -1656877 41 58433 1 756549 1
Total Shareholders Equity 193824 5812614 1 9147078 1 9132469 1
Average Size Posit ion 11 1 1
GROWT H
2014 2014 2013 2012
AVERAGEINDUST RY
VALUE RANKING VALUE RANKING VALUE RANKING
Net Sales Growth Rate 2089 -575 11 -551 16 1190 12
Inc Dec In Assets 1610 -901 20 -243 22 -1039 30
Inc DecIn Net Income -406205 -340170 24 -9249 28 -078 17
Increase (Decrease) In Equity -0 77 -2601 22 -267 21 563 13
Average Growt h Posit ion 19 22 18
PROFIT ABILIT Y
2014 2014 2013 2012
AVERAGEINDUST RY
VALUE RANKING VALUE RANKING VALUE RANKING
Net Income Net Sales -519 -540 29 015 25 194 17
Return On Assets -1076 -1244 38 034 23 446 16
Net Income Net Worth -2451 -2850 39 064 36 828 28
Operational Profit Sales -439 -438 27 027 25 168 18
Average Prof it abilit y Posit ion 33 27 20
INDEBT EDNESS
2014 2014 2013 2012
AVERAGEINDUST RY
VALUE RANKING VALUE RANKING VALUE RANKING
Indebtedness 5612 5637 22 4635 21 4622 22
Leverage 12789 12920 33 8639 36 8593 40
Total Liabilities Sales 2709 2448 17 2085 17 2013 21
EMIS Business Report Generated on 2016-06-02
Copyright copy 2015 EMIS all rights reserved A Euromoney Institutional Investor company Page 36 of 48
Fiscal year 2014Companies in Industries 43
IndustryPetroleum Refineries
Current Liabilities Total Liabilities 6146 6279 7 7210 11 6768 11
Average Indebt edness Posit ion 20 21 24
EFFICIENCY
2014 2014 2013 2012
AVERAGEINDUST RY
VALUE RANKING VALUE RANKING VALUE RANKING
Days Receivables 23 24 8 24 10 24 6
Days Inventory 36 33 16 46 19 48 23
Suppliers Turnover 49 45 10 50 15 45 15
Operational Cycle 59 57 11 70 13 72 14
Average Ef f iciency Posit ion 11 14 15
LIQUIDIT Y
2014 2014 2013 2012
AVERAGEINDUST RY
VALUE RANKING VALUE RANKING VALUE RANKING
Current Ratio 128 132 19 142 21 157 22
Quick Ratio 132 132 19 142 21 157 22
Working Capital 42581 1486941 1 2418659 1 3019099 1
Average Liquidit y Posit ion 13 14 15
OT HERS
2014 2014 2013 2012
AVERAGEINDUST RY
VALUE RANKING VALUE RANKING VALUE RANKING
Gross Profit 0 76 062 31 491 34 614 33
Other Income -1926 -1852 32 64868 3 5153 6
Reduction In Debt 158 0 13 0 17 0 12
Average Ot hers Posit ion 25 18 17
EMIS Credit Analyt ics - Company vs Industry Balance Sheet
Company vs Industry - Balance Sheet
REPORTING DETAILS
2014 2013 2012
Statement type Individual Individual Individual
Audited Non-Audited Non-Audited Non-Audited
Provider NotoriaMonitor B Fins NotoriaMonitor B Fins NotoriaMonitor B Fins
Companies in Industry 43 54 52
EMIS Benchmark Score 5266 6892 7170
Reporting Standard 197 197 197
EMIS Business Report Generated on 2016-06-02
Copyright copy 2015 EMIS all rights reserved A Euromoney Institutional Investor company Page 37 of 48
CURRENT ASSET S 2014INDUST RY
2014COMPANY
2013INDUST RY
2013COMPANY
2012INDUST RY
2012COMPANY
V H V H V H V H V H V H
Cash And Banks 1003 11838 1034 6846 533 410 559 851 482 -4599 502 -5387
Short Term Investments 003 -404 000 NA 004 -7992 000 NA 018 457613 000 NA
Account Receivables (Trade) 1320 1670 1510 -915 1313 -821 1513 -380 1346 -1338 1534 005
Inventory 2075 -1109 2104 -2851 2710 -1100 2677 -841 2866 -1097 2852 -789
Deferred Assets 014 -1494 007 -4068 020 -2569 011 -3444 025 -385 017 16719
Current Assets 4413 1190 4656 -1101 4579 -900 4760 -533 4737 -1703 4906 -1431
FIXED ASSET
2014INDUST RY
2014COMPANY
2013INDUST RY
2013COMPANY
2012INDUST RY
2012COMPANY
V H V H V H V H V H V H
- Land And Properties 4838 1574 4846 -907 4853 -232 4850 065 4677 -1788 4701 -690
- Other Equipments 004 -262 000 NA 004 6983 000 NA 002 -1186 000 NA
Fixed Assets 4872 1626 4846 -907 4865 -275 4850 065 4710 -1737 4701 -690
Intangible Assets (Net) 202 823 150 -1458 217 -2685 160 -4312 279 -652 275 199
Investments 240 4117 265 2041 197 13125 200 21858 080 2964 061 5970
Deferred Assets 281 11870 082 15497 149 -2699 029 -4916 193 5695 056 -2566
Total Long Term Assets 5585 1962 5344 -720 5421 -302 5240 036 5263 -1044 5094 -625
T OT AL ASSET S
2014INDUST RY
2014COMPANY
2013INDUST RY
2013COMPANY
2012INDUST RY
2012COMPANY
V H V H V H V H V H V H
Total Assets 10000 1610 10000 -901 10000 -585 10000 -243 10000 -1368 10000 -1039
CURRENT LIABILIT Y
2014INDUST RY
2014COMPANY
2013INDUST RY
2013COMPANY
2012INDUST RY
2012COMPANY
V H V H V H V H V H V H
Suppliers 2801 1472 2839 -1163 2835 -082 2923 603 2691 -3100 2690 -2855
Other Short Term Liabilities 13741 2571 701 5233 12691 320 419 -676 11578 NA 438 NA
Total Current Liability 3449 2100 3540 -362 3309 -111 3342 424 3151 -1924 3128 -1691
LONG T ERM LIABILIT Y
2014INDUST RY
2014COMPANY
2013INDUST RY
2013COMPANY
2012INDUST RY
2012COMPANY
V H V H V H V H V H V H
Long Term Deferred Liabilities 839 -299 028 -299 1004 -2717 026 -2717 1298 NA 035 NA
Other Long Term Liabilities 2187 6238 2070 4861 1564 -1129 1267 -1525 1659 -3979 1459 -3665
Long Term Liabilities 2163 6134 2097 4757 1556 -1368 1293 -1553 1698 -3494 1494 -3513
T OT AL LIABILIT Y
2014INDUST RY
2014COMPANY
2013INDUST RY
2013COMPANY
2012INDUST RY
2012COMPANY
V H V H V H V H V H V H
Total Liabilities 5612 3390 5637 1066 4866 -551 4635 -215 4848 -2553 4622 -2383
EQUIT Y
2014INDUST RY
2014COMPANY
2013INDUST RY
2013COMPANY
2012INDUST RY
2012COMPANY
V H V H V H V H V H V H
EMIS Business Report Generated on 2016-06-02
Copyright copy 2015 EMIS all rights reserved A Euromoney Institutional Investor company Page 38 of 48
Fiscal year 2014Companies in Industries 43
IndustryPetroleum Refineries
Capital 212 3149 226 000 187 -325 206 000 182 -237 201 003
Other Reserves 11156 3618 263 000 9512 000 239 000 8955 -143 233 -2444
Equity Appreciation -178 -439428 -173 -142830 005 5496 -010 -47857 003 4198565 003 NA
Retained Earnings 3652 -439 3702 -2707 4435 -418 4618 -192 4357 -050 4594 1065
Minority Interest 5213 074 346 075 6008 -1233 312 -1231 6451 -1929 347 -1929
Total Net Worth 4388 -077 4363 -2601 5134 -618 5365 -267 5152 153 5378 563
T OT AL LIABILIT Y AND EQUIT Y
2014INDUST RY
2014COMPANY
2013INDUST RY
2013COMPANY
2012INDUST RY
2012COMPANY
V H V H V H V H V H V H
Total Liabilities And Net Worth 10000 1610 10000 -901 10000 -585 10000 -243 10000 -1368 10000 -1039
EMIS Credit Analyt ics - Company vs Industry Income Statement
Company vs Industry - Income Statement
REPORTING DETAILS
2014 2013 2012
Statement type Individual Individual Individual
Audited Non-Audited Non-Audited Non-Audited
Provider NotoriaMonitor B Fins NotoriaMonitor B Fins NotoriaMonitor B Fins
Companies in Industry 43 54 52
EMIS Benchmark Score 5266 6892 7170
Reporting Standard 197 197 197
OPERAT ING PROFIT
2014INDUST RY
2014COMPANY
2013INDUST RY
2013COMPANY
2012INDUST RY
2012COMPANY
V H V H V H V H V H V H
Sales 10000 2089 10000 -575 10000 -1145 10000 -551 10000 500 10000 1190
Cost Of Goods Sold 9924 2648 9938 -150 9485 -1062 9509 -427 9396 612 9386 1253
Gross Profit 0 76 -8210 062 -8814 515 -2441 491 -2451 604 -978 614 313
Administrative AndGeneral Expenses
149 3309 141 420 135 -905 127 -479 132 -638 126 379
Selling Expenses 2650 5320 364 095 2091 094 340 028 1835 1798 320 578
Operational Profit -439 -165868 -438 -163453 034 -8046 027 -8483 154 -2807 168 -206
NON OPERAT ING INCOME
2014INDUST RY
2014COMPANY
2013INDUST RY
2013COMPANY
2012INDUST RY
2012COMPANY
V H V H V H V H V H V H
Total Non-Operating Revenue 036 465 033 -2304 042 -6818 040 -6944 117 -4630 125 -4930
- Financial Revenue 036 465 033 -2304 042 -6818 040 -6944 117 -4630 125 -4930
Total Non-Operating Expenses 190 24437 176 20967 067 -2118 053 -3252 075 -6320 075 -5970
- Financial Expenses 190 24438 176 20967 067 -2119 053 -3252 075 -6320 075 -5970
Other Extraordinary Result 0 00 10000 000 NA -000 9992 000 NA -000 NA -000 NA
EMIS Business Report Generated on 2016-06-02
Copyright copy 2015 EMIS all rights reserved A Euromoney Institutional Investor company Page 39 of 48
Fiscal year 2014Companies in Industries 43
IndustryPetroleum Refineries
Profit Before Income Taxes -594 -909715 -580 -407834 008 -9639 014 -9402 196 -1306 217 -601
T AXES AND OT HERS
2014INDUST RY
2014COMPANY
2013INDUST RY
2013COMPANY
2012INDUST RY
2012COMPANY
V H V H V H V H V H V H
Extraordinary Income (Charges) 0 02 8819 005 4250 002 NA 004 NA 000 -10000 000 NA
Changes Due To Consolidation 027 -8018 002 -8023 162 -5086 008 -5086 292 -4973 014 -4977
Income Tax -0 74 -468549 -039 -72388 -002 7245 006 -8524 -006 -11275 038 -4155
NET PROFIT
2014INDUST RY
2014COMPANY
2013INDUST RY
2013COMPANY
2012INDUST RY
2012COMPANY
V H V H V H V H V H V H
Net Income -519 -406205 -540 -340170 016 -9342 015 -9249 213 544 194 -078
EMIS Credit Analyt ics - Company vs Industry Cash Flow
Company vs Industry - Cash Flow
REPORTING DETAILS
2014 2013 2012
Statement type Individual Individual Individual
Audited Non-Audited Non-Audited Non-Audited
Provider NotoriaMonitor B Fins NotoriaMonitor B Fins NotoriaMonitor B Fins
Companies in Industry 43 54 52
EMIS Benchmark Score 5266 6892 7170
Reporting Standard 197 197 197
CASH OPENING BALANCE
2014INDUST RY
2014COMPANY
2013INDUST RY
2013COMPANY
2012INDUST RY
2012COMPANY
V H V H V H V H V H V H
Initial Cash 222 410 267 851 257 -4599 232 -5387 422 9240 474 8565
CASH FROM SALES
2014INDUST RY
2014COMPANY
2013INDUST RY
2013COMPANY
2012INDUST RY
2012COMPANY
V H V H V H V H V H V H
Net Sales 10000 2089 10000 -575 10000 -1145 10000 -551 10000 500 10000 1190
+- Trade AccountsReceivable
-0 91 -28672 066 13160 059 -4685 027 779616 098 16969 -000 9978
Cash From Sales 9909 1908 10066 -539 10059 -1179 10027 -525 10098 763 10000 1377
CASH FOR PRODUCT ION
2014INDUST RY
2014COMPANY
2013INDUST RY
2013COMPANY
2012INDUST RY
2012COMPANY
V H V H V H V H V H V H
(-) Sales Cost -9924 -2648 -9938 150 -9485 1062 -9509 427 -9396 -612 -9386 -1253
(-) (Inc) Inventory 125 -1020 364 21062 168 -1077 111 -183 167 13866 106 12570
(+) (Inc) Suppliers 174 188875 -162 -30445 -012 9818 075 11510 -572 -26577 -468 -25767
EMIS Business Report Generated on 2016-06-02
Copyright copy 2015 EMIS all rights reserved A Euromoney Institutional Investor company Page 40 of 48
Cash For Production -9625 -2474 -9736 159 -9328 1572 -9324 962 -9801 -961 -9748 -1525
CASH FOR OPERAT ING
2014INDUST RY
2014COMPANY
2013INDUST RY
2013COMPANY
2012INDUST RY
2012COMPANY
V H V H V H V H V H V H
(-) Administrative Expenses -149 -3309 -141 -420 -135 905 -127 479 -132 638 -126 -379
+- Other Operating Results -0 00 -12524 000 NA 001 NA 000 NA 000 NA 000 NA
(-) Selling Expenses -2650 -5320 -364 -095 -2091 -094 -340 -028 -1835 -1798 -320 -578
(-) Period Income Taxes 074 468549 039 72388 002 -7245 -006 8524 006 11275 -038 4155
(+) (Inc) Taxes Payable 002 69344 000 NA -000 -14351 000 NA 001 17119 000 NA
(-) (Inc) Labor EstimatesAnd Provision
-0 12 9215 -000 9200 -189 -12719 -004 -12717 614 184104751 015 NA
Cash For Operation -2736 -3712 -466 794 -2413 -5873 -477 379 -1346 2282 -469 405
OPERAT IONAL CASHFLOW
2014INDUST RY
2014COMPANY
2013INDUST RY
2013COMPANY
2012INDUST RY
2012COMPANY
V H V H V H V H V H V H
Net Operating Cashflow -2453 -7631 -137 -15709 -1682 -4202 225 19816 -1049 1952 -217 -3750
INVEST MENT S IN ASSET S
2014INDUST RY
2014COMPANY
2013INDUST RY
2013COMPANY
2012INDUST RY
2012COMPANY
V H V H V H V H V H V H
(-) (Inc) Net Fixed Assets -329 -67408 210 151250 069 -8689 -014 -10872 468 25487 152 12255
(ndash) (Inc) Investments -0 34 2746 -020 7025 -056 -47405 -062 -48471 -009 -10215 -010 -10826
FREE CASHFLOW
2014INDUST RY
2014COMPANY
2013INDUST RY
2013COMPANY
2012INDUST RY
2012COMPANY
V H V H V H V H V H V H
Free Cashflow -2816 -10396 054 -6596 -1669 -15077 150 28813 -589 5095 -075 -33837
FINANCIAL
2014INDUST RY
2014COMPANY
2013INDUST RY
2013COMPANY
2012INDUST RY
2012COMPANY
V H V H V H V H V H V H
(-) Financial Expenses -154 -65083 -143 -92333 -025 -15241 -013 -12496 042 20392 050 -1713
Cashflow After Financial Costs -2969 -11196 -089 -16127 -1694 -17395 136 60823 -547 5391 -025 -12770
(+) (Inc) Debt Short Term -000 9949 000 NA -000 -21237 000 NA 000 10091 000 NA
(+) (Inc) Debt Long Term 002 69344 000 NA -000 -14351 000 NA 001 17119 000 NA
Cashflow After FinancialExpenses
-2968 -11175 -089 -16127 -1694 -17455 136 60823 -546 5512 -025 -12770
CASHFLOW
2014INDUST RY
2014COMPANY
2013INDUST RY
2013COMPANY
2012INDUST RY
2012COMPANY
V H V H V H V H V H V H
(-) Dividends 503 42726 -126 -4528 -186 682 -082 -1139 -176 -73580 -069 -52834
(-) Other Expenses 002 8819 005 4250 002 NA 004 NA 000 -10000 000 NA
(-) Other Current Debtors 000 NA 000 NA 000 NA 000 NA 000 NA 000 NA
(-) Other Current Assets 002 -7807 002 -2258 011 361835 003 15505 000 10702 -005 -48602
(-) Long-Term AccountsReceivable
000 NA 000 NA 000 NA 000 NA 000 NA 000 NA
EMIS Business Report Generated on 2016-06-02
Copyright copy 2015 EMIS all rights reserved A Euromoney Institutional Investor company Page 41 of 48
(-)(Inc) Deferred And OtherLong Term Assets
-0 72 -37515 -022 -26027 032 11570 013 4240 -178 -88060 008 14351
(-) (Inc) Other Long TermLiabilities
406 56718 294 37011 -105 8205 -103 7364 -518 -37893 -368 -40951
(+) Inflation Adjustmentst Non Recurring Incomes
000 NA 000 NA 000 NA 000 NA 000 NA 000 NA
(+) (Inc) Other AccountsPayable
115 218744 105 82115 -007 -10274 -014 -10676 216 2710149 191 NA
(+) Extraordinary Income Consolidation
027 -8018 002 -8023 162 -5085 008 -5057 292 -4974 014 -5006
(-) Intangible Goods -007 -12244 011 -8077 040 29906 055 230557 009 12060 -002 8712
Complementary Cash-Flow 976 240248 271 31907 -051 8725 -117 5210 -356 -14616 -230 -28078
Net Cash Generation -1992 -3796 183 77289 -1745 -7131 020 10729 -902 -10194 -255 -21675
Ending Cash -1770 -4381 449 6846 -1488 -17434 251 851 -480 -11112 219 -5387
EMIS Business Report Generated on 2016-06-02
Copyright copy 2015 EMIS all rights reserved A Euromoney Institutional Investor company Page 42 of 48
Score Scale
Financial ScaleFinancial Model has 8 risk categories
A - Very Low RiskAA - Low RiskBB - Moderate Low RiskB - Below Average RiskCC - Above Average RiskC - Moderate High RiskD - High Risk E - Very High Risk
Risk Profile
High RiskHigh Risk - used when the loan amounts are relatively high and have a longrepayment period A loss in the Credit would seriously affect the companyresults Commercial credit with maturity exceeding 36 months
A loss in the Credit would seriously affect the results Bank credited to morethan 36 months
Vertical Weighting
Pampl
Sales Growth 12
Operating Profit 12
Net Profit 12
Sub t ot al 36
Balance
Days Receivables 12
Days Inventory 10
Current Ratio 8
Indebtness 8
Indebtednesssales 8
Balance Sub T ot al 46
Cash Flow
Cash From Sales 2
Cash For Production 2
Cash For Operations 2
Operating Cash Generation 5
Free Cash Flow 3
Cash Flow After Fin Ex 2
Cash Flow After Fin Result 2
Reduction In Debt 0
Cash Flow Sub T ot al 18
Total Vertical Weights 100
Tolerance Margin 5
Financial Conditions
Condit ions Score
Negative Net Worth CC
Final Weighting
EMIS Benchmark Score 90
EMIS Trend Score 10
EMIS Credit Analyt ics - EMIS Credit Analyt ics Assumptions
EMIS Business Report Generated on 2016-06-02
Copyright copy 2015 EMIS all rights reserved A Euromoney Institutional Investor company Page 43 of 48
Ret urn on Asset s (ROA)
An indicator of how profitable a company is relative to its total assets ROA gives an
idea as to how efficient management is at using its assets to generate earnings
Calculated by dividing a companys annual earnings by its total assets
Calculated as Net prof it T ot al Asset
Ret urn on Equit y (ROE)
A measure of a corporations profitability that reveals how much profit a company
generates with the money shareholders have invested
Calculated as Net prof it Shareholders equit y
Ret urn on Sales (ROS)
A ratio widely used to evaluate a companys operational efficiency ROS is also
known as a firms operating profit margin
Calculated as Net Prof it Net Sales Revenue
Bookvalue
A companys common stock equity as it appears on a balance sheet equal to total
assets minus liabilities preferred stock and intangible assets such as goodwill
Current Rat io
A liquidity ratio that measures a companys ability to pay short-term obligations
Calculated as Current Asset sCurrent Liabilit ies
Quick rat io
An indicator of a companys short-term liquidity The quick ratio measures a
companys ability to meet its short-term obligations with its most liquid assets The
higher the quick ratio the better the position of the company
Calculated as (Current Asset s-Invent ories)Current Liabilit ies
Debt t o equit y
A measure of a companys financial leverage calculated by dividing its total
liabilities by stockholders equity It indicates what proportion of equity and debt the
company is using to finance its assets
Calculated as T ot al Liabilit iesShareholders Equit y
Debt t o t ot al asset s
A metric used to measure a companys financial risk by determining how much of
the companys assets have been financed by debt Calculated by adding short-term
and long-term debt and then dividing by the companys total assets
Calculated as Short T erm Debt s+Long T erm Debt sT ot al Asset s
Leverage rat io
Leverage ratio provide an indication of the long term solvency of the firm
Calculated as T ot al Asset sShareholders Equit y
Debt Ent erprise Value
This metric is equivalent to the payback period used by debtholders Calculated as
Debt Ent erprise Value
Market Capit alizat ionEBIT DA
Calculated as Market Capit alizat ionEBIT DA
Earning Bef ore Int erest s and T axes (EBIT )
Earning Before Interests and Taxes (EBIT)
EBIT DA
Earnings before interest taxes depreciation and amortization (EBITDA) is a non-
GAAP metric that can be used to evaluate a companys profitability Calculated as
Ent erprise valueNet Sales
Dividing the enterprise value of a firm by its sales or revenues is a way of
comparing firms in cyclical industries Calculated as Enterprise Value Net Sales
Revenue
Ent erprise valueGross income
Calculated as Enterprise value Gross income
Ent erprise valueT ot al Asset s
Calculated as Enterprise value Total Assets
EBIT DA Margin
A measurement that provides a clear view of the companyrsquos core profitability
Calculated as EBITDA Net Sales Revenue
T ot al Operat ing Revenue T rend
Calculated as Total Operating Revenue current year Total Operating Revenue
previous year
Gross Prof it T rend
Calculated in percentage as (Gross Prof it Current Year Gross Prof it
Previous Year) ndash 1
EBIT DA T rend
Calculated as EBITDA current year EBITDA previous year
Account s Receivables T rend
Calculated in percentage as T rade Account s Receivables current year
T rade Account Receivables previous year
Invent ory T rend
Calculated as Inventories current year Inventories previous year
Net Propert y Plant and Equipment (PPampE) T rend
Calculated as Net PPampE current year Net PPampE previous year
T ot al Asset s T rend
Calculated as Total Assets current year Total Assets previous year
Bookvalue T rend
Calculated as Bookvalue current year Bookvalue previous year
Shareholders Equit y T rend
Calculated as Shareholdersrsquo Equity current year Shareholdersrsquo Equity previous
year
Cash f rom Operat ions T rend
Calculated as Net Cash Flow from Operations current year Net Cash Flow from
Operations previous year
Capit al Expendit ures T rend
Calculated as CAPEX current year CAPEX previous year
Dividend per Share T rend
Calculated as Dividend value per (common) share current year Dividend value
per (common) share previous year
Cost t o Income Rat io
A key financial measure showing a bankrsquos cost in relation to its income Ratio is
calculated as Total Operational Cost Total Operational Income
Glossary
EMIS Business Report Generated on 2016-06-02
Copyright copy 2015 EMIS all rights reserved A Euromoney Institutional Investor company Page 44 of 48
EBIT DA = Operat ing Revenue - Operat ing Expenses (Depriciat ion and
Amort izat ion excluded)
Ent erprise Value EBIT DA
Enterprise Value EBITDA is the metric most used to measure how many years it
would take to pay back the investment
Ent erprise Value
A measure of a companys value often used as an alternative to straightforward
market capitalization EV is calculated as market cap plus debt minority interest
and preferred shares minus total cash and cash equivalents
Dooms day rat io
Calculated as Cash Current Liabilit ies
Long T erm Debt t o Capit al
A ratio showing the financial leverage of a firm calculated by dividing long-term
debt by the amount of capital available Calculated as Long t erm debt Long
t erm debt + Pref f ered St ock + Common St ock
Int erest Coverage Rat io
A ratio used to determine how easily a company can pay interest on outstanding
debt The interest coverage ratio is calculated by dividing a companys earnings
before interest and taxes (EBIT) of one period by the companys interest expenses of
the same period Calculated as EBIT Int erest expense
Cash Flow t o Debt
This coverage ratio compares a companys operating cash flow to its total debt
which for purposes of this ratio is defined as the sum of short-term borrowings the
current portion of long-term debt and long-term debt This ratio provides an
indication of a companys ability to cover total debt with its yearly cash flow from
operations The higher the percentage ratio the better the companys ability to carry
its total debt Calculates as Operat ing Cash Flow T ot al Debt
Ret urn on Capit al
A ratio that indicates the efficiency and profitability of a companys capital
investments Calculated as Net Income (Total Asset - Current Liabilities)
Gross Prof it Margin
A financial metric used to assess a firms financial health by revealing the
proportion of money left over from revenues after accounting for the cost of goods
sold Gross profit margin serves as the source for paying additional expenses and
future savings Calculated as (Net Sales Revenue - Cost of Goods Sold) Net
Sales Revenue
Operat ing Prof it Margin
A ratio used to measure a companys pricing strategy and operating efficiency
Calculated as Operat ing prof it Net sales
Account s Receivable T urnover
An accounting measure used to quantify a firms effectiveness in extending credit
as well as collecting debts The receivables turnover ratio is an activity ratio
measuring how efficiently a firm uses its assets Calculated as Net Sales
Revenue T rade Account s Receivable (Net )
Invent ory T urnover
A ratio showing how many times a companys inventory is sold and replaced over a
period Calculated as Sales Invent ory
Current asset t urnover
Calculated as Net Sales Revenue T ot al Current Asset
Ef f iciency Rat io
Calculated as Total non-interest expenses (Total net interest income + Total non-
interest income)
Loans t o Deposit s Rat io
A commonly used statistic for assessing a banks liquidity Calculated as Total
Loans Total Deposits
Liquid Asset s t o Deposit s Rat io
This ratio indicates extent of liquidity maintained by a bank for meeting the demand
made by the depositors Calculated as (Cash + Financial assets held for trading)
Total Deposits
Loans t o Asset Rat io
Calculated as Total Loans Total Assets
Net Int erest Income T rend
Calculated as Net Interest Income current year Net Interest Income previous year
Net Fee and Commission Income T rend
Calculated as Net Fee and Commission Income current year Net Fee and
Commission Income previous year
Loans and Advances t o Cust omers T rend
Calculated as Loans and Advances to Customers current year Loans and
Advances to Customers previous year
Deposit s f rom Cust omers T rend
Calculated as Deposits from Customers current year Deposits from Customers
previous year
Loss Rat io
This ratio indicates the average cost of insurance protection per each dollar of net
premiums earned during the period Calculated as Total Losses Incurred in Claims
Net Insurance Premium Revenue
Underwrit ing Expenses Rat io
This ratio measures operational efficiency in underwriting Calculated as
Underwriting expenses Net Insurance Premium Revenue
Policyholder Dividend Rat io
Calculated as Dividends Net Insurance Premium Revenue
Combined LossExpense Rat io
Calculated as Loss Ratio + Underwriting Expenses Ratio + Policyholder Dividend
Ratio When the combined ratio is under 100 underwriting results are
considered profitable when the combined ratio is over 100 underwriting results
are considered unprofitable
Ceded Premium Rat io
Calculated as Insurance Premium Ceded to Reinsurers Insurance Premium
Revenue
Net Premiums Earned T rend
Calculated as Net Insurance Premium Revenue current year Net Insurance
Premium Revenue previous year
Fees and Commissions T rend
Calculated as Net Fees and Commissions Income current year Net Fees and
Commissions Income previous year
Net Invest ment Income T rend
EMIS Business Report Generated on 2016-06-02
Copyright copy 2015 EMIS all rights reserved A Euromoney Institutional Investor company Page 45 of 48
Fixed-asset t urnover
This ratio is a rough measure of the productivity of a companys fixed assets
(property plant and equipment or PPampE) with respect to generating sales For most
companies their investment in fixed assets represents the single largest
component of their total assets This annual turnover ratio is designed to reflect a
companys efficiency in managing these significant assets Simply put the higher
the yearly turnover rate the better Calculated as Revenue Propert y Plant and
Equipment
Asset T urnover
The amount of sales generated for every dollars worth of assets It is calculated by
dividing sales in dollars by assets in dollars Calculated as Revenue Asset s
Revenue T rend
Calculated as (Net Sales Current Year Net Sales Previous Year)
Net Income T rend
Calculated as (Net Income Current Year Net Income Previous Year)
Operat ing Income T rend
Calculated as (Operat ing Income Current Year Operat ing Income
Previous year)
PriceBook Rat io
A ratio used to compare a stocks market value to its book value It is calculated by
dividing the current closing price of the stock by the latest years book value per
share Calculated as St ock price (T ot al Asset - Int angible asset s and
Liabilit ies)
PriceEarnings Rat io
A valuation ratio of a companys current share price compared to its per-share
earnings Calculated as Market value per share Earning per share EPS
Market capShareholder equit y
A financial ratio showing the premium which is included in the current market price
compared to the actual value of Shareholder equity of the company Calculated as
Market capit alizat ion Shareholders equit y
PriceEBIT Rat io
The PriceEBIT ratio is a market value indicator similar to the PE ratio which shows
the number of times the market price exceeds the earnings per share before the
effects of gross interest abnormal items and tax The PriceEBIT ratio is calculated
as follows Valuat ion price EBIT
T ot al Capit al Rat io
Calculated as T ot al capit al (T ier 1 and T ier 2) rat io = T ot al capit al (T ier 1
and T ier 2) Risk-adjust ed asset s
T ier 1 Rat io
Tier 1 capital is the core measure of a banks financial strength from a regulators
point of view It consists primarily of shareholders equity but may also include
preferred stock that is irredeemable and non-cumulative and retained earnings
Risk Weight ed Asset s
Risk weights are in five categories from zero to 100 per cent Those carrying a
zero weight include notes and coins gold matched by gold liabilities balances with
the Reserve Bank and commonwealth government securities with less than twelve
months to maturity Commonwealth government securities with more than twelve
months to maturity carry a 10 per cent risk weighting as do state government
securities Claims on other banks Australian local governments and public-sector
organisations other than those with corporate status or which operate
Calculated as Investment Income current year Investment Income previous year
Receivables Arising Out Of Direct Insurance Operat ions T rend
Calculated as Receivables Arising out of Direct Insurance Operations current year
Receivables Arising out of Direct Insurance Operations previous year
Operat ing ROA
An indicator that shows the type of net profit which is actually generated by business
effort Calculated as Operat ing Prof it (EBIT ) T ot al Asset s
Payables T urnover
An indicator that evaluates how fast a company pays off its creditors (suppliers)
Calculated as Purchases T rade Payables
Working Capit al T urnover
A measure that indicates how efficiently the company generates revenue with its
working capital Working capital is defined as current assets minus current liabilities
Calculated as Net Sales (T ot al Current Asset s ndash T ot al Current
Liabilit ies)
Working Capit al
A measure of a companyrsquos short term financial health Calculated as T ot al
Current Asset s ndash T ot al Current Liabilit ies
Cash Rat io
A measure of a companyrsquos liquidity in crisis situation Only highly marketable
securities and cash are included Calculated as (T ot al Cash and Cash
Equivalent s + Market able securit ies) T ot al Current Liabilit ies
Cash Flow f rom Operat ion Rat io
A measure of how well current liabilities are covered by the cash flow generated
from a companyrsquos operations Calculated as Net Cash Flow f rom Operat ing
Act ivit ies T ot al Current Liabilit ies
Debt Coverage
A measure that shows a companyrsquos ability to cover total debt with its yearly cash
flow from operations Calculated as Net Cash Flow f rom Operat ing Act ivit ies
T ot al Debt
Cash Flow t o Revenue
This ratio measures the amount of operating cash flow generated for each dollar of
revenue Calculated as Net Cash Flow f rom Operat ing Act ivit ies Net Sales
Revenue
Cash Ret urn on Asset s
This ratio measures the return of operating cash flow attributed to all providers of
capital Calculated as Net Cash Flow f rom Operat ing Act ivit ies T ot al
Asset s
Cash Ret urn on Equit y
This ratio measures the return of operating cash flow attributed to shareholders
Calculated as Net Cash Flow f rom Operat ing Act ivit ies T ot al
Shareholdersrsquo Equit y
Cash t o Income
This ratio measures the ability to generate cash from companyrsquos operations
Calculated as Net Cash Flow f rom Operat ing Act ivit ies Operat ing Prof it
(EBIT )
CashT ot al Asset s
Calculated as Cash and Cash Equivalent s T ot al Asset s
EMIS Business Report Generated on 2016-06-02
Copyright copy 2015 EMIS all rights reserved A Euromoney Institutional Investor company Page 46 of 48
commercially carry a 20 per cent risk weighting Loans secured by a mortgage
over residential property and with a loan-to-valuation of 80 per cent or less carry a
50 per cent risk weighting and loans to companies or individuals carry a 100 per
cent risk weighting
Market Cap Net cash
A ratio measure the market value of the company to the Net cash position of the
company Calculated as Market capit alizat ion (Cash and cash equivalent s
minus long-t erm debt )
Net Cash
Net cash is commonly used in evaluating a companys cash flow More generally
net cash can refer to the amount of cash remaining after a transaction has been
completed and all charges and deductions related to the transaction have been
subtracted Calculated as T ot al cash minus t ot al short t erm liabilit ies
Annualised Ret urn on Equit y (ROE)
Return on Equity ratio (ROE) converted into an annual basis
Annualised Ret urn on Asset s (ROA)
Return on Assets ratio (ROA) converted into an annual basis
Export Proport ion Rat io
The percentage figure of the proportion of the export revenue from the total sales
revenue of the company Calculated as Export revenue T ot al revenue
Net Debt
A metric that shows companys overall debt situation by netting the value of
financial liabilities with its cash and other similar liquid assets Calculated as
financial liabilities - cash and cash equivalents
EPS
The portion of a companys profit allocated to each outstanding share Calculated
as Net Profit Outstanding Shares
PE
A valuation ratio of a companys current share price compared to its per-share
earnings Calculated as Market value per share Earning per share EPS
Market Capit alizat ionNet Sales
Calculated as Market Capitalization Net Sales Revenue
Market Capit alizat ionGross income
Calculated as Market Capitalization Gross Profit
Market Capit alizat ionEBIT
Calculated as Market Capitalization EBIT
Market Capit alizat ionT ot al Asset s
Calculated as Market Capitalization Total Assets
ReceivablesT ot al asset s
Calculated as T rade Account s Receivable T ot al Asset s
Invent oriesT ot al asset s
Calculated as Invent ories T ot al Asset s
Fixed asset sT ot al asset s
Calculated as Non-current Asset s T ot al Asset s
Current Liabilit iesT ot al Liabilit ies
Calculated as T ot al Current Liabilit ies T ot al Liabilit ies
Salaries and Employee Benef it sNet sales
Calculated as Employee Benef it Expenses Net Sales Revenue
Administ rat ive ExpensesNet Sales
Calculated as Administ rat ive Expenses Net Sales Revenue
Depreciat ion and Amort izat ionNet sales
Calculated as Depreciat ion Amort izat ion and Impairment Charges Net
Sales Revenue
Int erest paidNet sales
Calculated as Int erest -t ype Expenses Net Sales Revenue
Income t axNet sales
Calculated as Income T ax Net Sales Revenue
Operat ing Cash Flow t o T ot al Cash Flow
Calculated as Net Cash Flow f rom Operat ing Act ivit ies Net
IncreaseDecrease in Cash and Cash Equivalent s
Cash Flow f rom Invest ing t o T ot al Cash Flow
Calculated as Net cash f low f rom (used in) invest ing act ivit ies Net
IncreaseDecrease in Cash and Cash Equivalent s
Cash f low f rom f inancing t o T ot al cash f low
Calculated as Net cash flow from (used in) financing activities Net
IncreaseDecrease in Cash and Cash Equivalents
Average Yie ld on Asset s
Calculated as T ot al Int erest Income T ot al Asset s
Disclaimer
Whilst EMIS attempts at all times to ensure the accuracy and reliability of the information it provides due to the vast quantity of processed data and the fact that some of
the third-party data cannot always be verified including information provided directly by the subject of the enquiry EMIS does not guarantee the correctness or the
effective delivery of the information and shall not be held responsible for any errors or omissions therein
The content and recommendations shall only be used as a reference in business decisions of EMIS clients and shall not be used for any other purposes EMIS and its
affiliates shall not be held liable for any loss of the clients arising out of its own business decisions whether or not the making of such decision has been referred to this
contentrecommendation
EMIS Business Report Generated on 2016-06-02
Copyright copy 2015 EMIS all rights reserved A Euromoney Institutional Investor company Page 47 of 48
EMIS Business Report Generated on 2016-06-02
Copyright copy 2015 EMIS all rights reserved A Euromoney Institutional Investor company Page 48 of 48
- Table of Contents
- Company Tear Sheet
-
- Contact Information
- NAICS Industry Classification
- Business description
- Basic Information
- EMIS Financial Score
- Share Price information
- Key Executives
- Ownership Details
- Subsidiaries and Affiliates
- Key Financial Highlights
- Financial Performance Charts
- Latest MampA and ECM Deals
- Top Competitors
-
- Financial Statements
-
- Annual Statements
- Interim Statements
- Ratios
- Multiples
-
- Company Documents
-
- Financial DocumentsAnnual Reports
- Corporate Actions
-
- News amp Reports
-
- News
- Reports
-
- MampA and ECM Deals
-
- EMIS DealWatch Deals
- EMIS DealWatch Intents
-
- EMIS Credit Analytics
-
- Summary
- EMIS Financial Score
- EMIS Benchmark Score
- EMIS Credit Quota
- Conclusions
- Company vs Industry Key Stats
- Company vs Industry Balance Sheet
- Company vs Industry Income Statement
- Company vs Industry Cash Flow
- EMIS Credit Analytics Assumptions
-
- Glossary
- Disclaimer
-
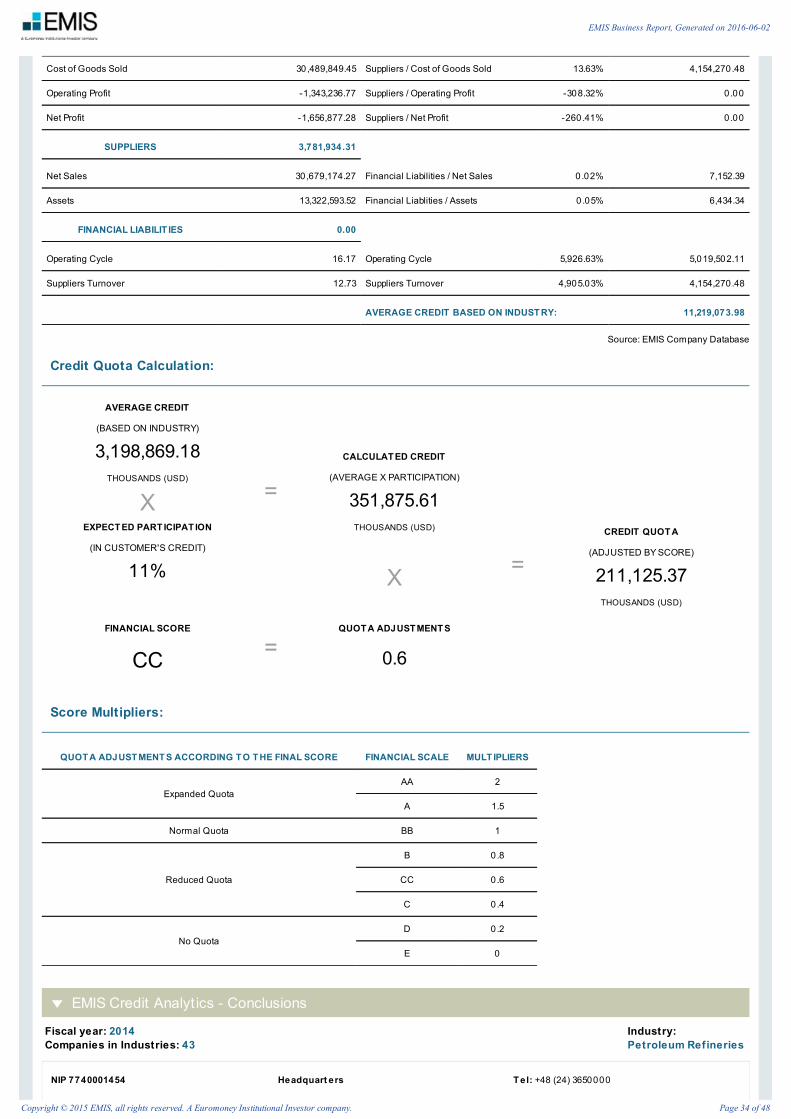
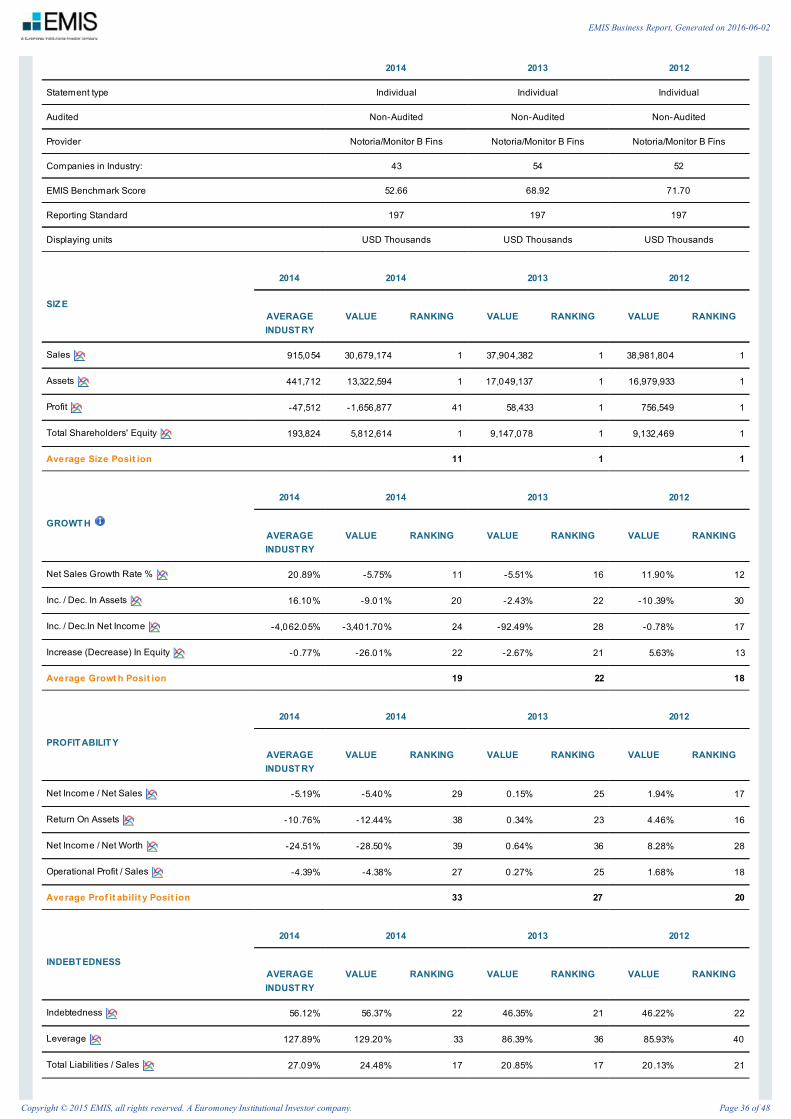
2014 2013 2012
Statement type Individual Individual Individual
Audited Non-Audited Non-Audited Non-Audited
Provider NotoriaMonitor B Fins NotoriaMonitor B Fins NotoriaMonitor B Fins
Companies in Industry 43 54 52
EMIS Benchmark Score 5266 6892 7170
Reporting Standard 197 197 197
Displaying units USD Thousands USD Thousands USD Thousands
SIZ E
2014 2014 2013 2012
AVERAGEINDUST RY
VALUE RANKING VALUE RANKING VALUE RANKING
Sales 915054 30679174 1 37904382 1 38981804 1
Assets 441712 13322594 1 17049137 1 16979933 1
Profit -47512 -1656877 41 58433 1 756549 1
Total Shareholders Equity 193824 5812614 1 9147078 1 9132469 1
Average Size Posit ion 11 1 1
GROWT H
2014 2014 2013 2012
AVERAGEINDUST RY
VALUE RANKING VALUE RANKING VALUE RANKING
Net Sales Growth Rate 2089 -575 11 -551 16 1190 12
Inc Dec In Assets 1610 -901 20 -243 22 -1039 30
Inc DecIn Net Income -406205 -340170 24 -9249 28 -078 17
Increase (Decrease) In Equity -0 77 -2601 22 -267 21 563 13
Average Growt h Posit ion 19 22 18
PROFIT ABILIT Y
2014 2014 2013 2012
AVERAGEINDUST RY
VALUE RANKING VALUE RANKING VALUE RANKING
Net Income Net Sales -519 -540 29 015 25 194 17
Return On Assets -1076 -1244 38 034 23 446 16
Net Income Net Worth -2451 -2850 39 064 36 828 28
Operational Profit Sales -439 -438 27 027 25 168 18
Average Prof it abilit y Posit ion 33 27 20
INDEBT EDNESS
2014 2014 2013 2012
AVERAGEINDUST RY
VALUE RANKING VALUE RANKING VALUE RANKING
Indebtedness 5612 5637 22 4635 21 4622 22
Leverage 12789 12920 33 8639 36 8593 40
Total Liabilities Sales 2709 2448 17 2085 17 2013 21
EMIS Business Report Generated on 2016-06-02
Copyright copy 2015 EMIS all rights reserved A Euromoney Institutional Investor company Page 36 of 48
Fiscal year 2014Companies in Industries 43
IndustryPetroleum Refineries
Current Liabilities Total Liabilities 6146 6279 7 7210 11 6768 11
Average Indebt edness Posit ion 20 21 24
EFFICIENCY
2014 2014 2013 2012
AVERAGEINDUST RY
VALUE RANKING VALUE RANKING VALUE RANKING
Days Receivables 23 24 8 24 10 24 6
Days Inventory 36 33 16 46 19 48 23
Suppliers Turnover 49 45 10 50 15 45 15
Operational Cycle 59 57 11 70 13 72 14
Average Ef f iciency Posit ion 11 14 15
LIQUIDIT Y
2014 2014 2013 2012
AVERAGEINDUST RY
VALUE RANKING VALUE RANKING VALUE RANKING
Current Ratio 128 132 19 142 21 157 22
Quick Ratio 132 132 19 142 21 157 22
Working Capital 42581 1486941 1 2418659 1 3019099 1
Average Liquidit y Posit ion 13 14 15
OT HERS
2014 2014 2013 2012
AVERAGEINDUST RY
VALUE RANKING VALUE RANKING VALUE RANKING
Gross Profit 0 76 062 31 491 34 614 33
Other Income -1926 -1852 32 64868 3 5153 6
Reduction In Debt 158 0 13 0 17 0 12
Average Ot hers Posit ion 25 18 17
EMIS Credit Analyt ics - Company vs Industry Balance Sheet
Company vs Industry - Balance Sheet
REPORTING DETAILS
2014 2013 2012
Statement type Individual Individual Individual
Audited Non-Audited Non-Audited Non-Audited
Provider NotoriaMonitor B Fins NotoriaMonitor B Fins NotoriaMonitor B Fins
Companies in Industry 43 54 52
EMIS Benchmark Score 5266 6892 7170
Reporting Standard 197 197 197
EMIS Business Report Generated on 2016-06-02
Copyright copy 2015 EMIS all rights reserved A Euromoney Institutional Investor company Page 37 of 48
CURRENT ASSET S 2014INDUST RY
2014COMPANY
2013INDUST RY
2013COMPANY
2012INDUST RY
2012COMPANY
V H V H V H V H V H V H
Cash And Banks 1003 11838 1034 6846 533 410 559 851 482 -4599 502 -5387
Short Term Investments 003 -404 000 NA 004 -7992 000 NA 018 457613 000 NA
Account Receivables (Trade) 1320 1670 1510 -915 1313 -821 1513 -380 1346 -1338 1534 005
Inventory 2075 -1109 2104 -2851 2710 -1100 2677 -841 2866 -1097 2852 -789
Deferred Assets 014 -1494 007 -4068 020 -2569 011 -3444 025 -385 017 16719
Current Assets 4413 1190 4656 -1101 4579 -900 4760 -533 4737 -1703 4906 -1431
FIXED ASSET
2014INDUST RY
2014COMPANY
2013INDUST RY
2013COMPANY
2012INDUST RY
2012COMPANY
V H V H V H V H V H V H
- Land And Properties 4838 1574 4846 -907 4853 -232 4850 065 4677 -1788 4701 -690
- Other Equipments 004 -262 000 NA 004 6983 000 NA 002 -1186 000 NA
Fixed Assets 4872 1626 4846 -907 4865 -275 4850 065 4710 -1737 4701 -690
Intangible Assets (Net) 202 823 150 -1458 217 -2685 160 -4312 279 -652 275 199
Investments 240 4117 265 2041 197 13125 200 21858 080 2964 061 5970
Deferred Assets 281 11870 082 15497 149 -2699 029 -4916 193 5695 056 -2566
Total Long Term Assets 5585 1962 5344 -720 5421 -302 5240 036 5263 -1044 5094 -625
T OT AL ASSET S
2014INDUST RY
2014COMPANY
2013INDUST RY
2013COMPANY
2012INDUST RY
2012COMPANY
V H V H V H V H V H V H
Total Assets 10000 1610 10000 -901 10000 -585 10000 -243 10000 -1368 10000 -1039
CURRENT LIABILIT Y
2014INDUST RY
2014COMPANY
2013INDUST RY
2013COMPANY
2012INDUST RY
2012COMPANY
V H V H V H V H V H V H
Suppliers 2801 1472 2839 -1163 2835 -082 2923 603 2691 -3100 2690 -2855
Other Short Term Liabilities 13741 2571 701 5233 12691 320 419 -676 11578 NA 438 NA
Total Current Liability 3449 2100 3540 -362 3309 -111 3342 424 3151 -1924 3128 -1691
LONG T ERM LIABILIT Y
2014INDUST RY
2014COMPANY
2013INDUST RY
2013COMPANY
2012INDUST RY
2012COMPANY
V H V H V H V H V H V H
Long Term Deferred Liabilities 839 -299 028 -299 1004 -2717 026 -2717 1298 NA 035 NA
Other Long Term Liabilities 2187 6238 2070 4861 1564 -1129 1267 -1525 1659 -3979 1459 -3665
Long Term Liabilities 2163 6134 2097 4757 1556 -1368 1293 -1553 1698 -3494 1494 -3513
T OT AL LIABILIT Y
2014INDUST RY
2014COMPANY
2013INDUST RY
2013COMPANY
2012INDUST RY
2012COMPANY
V H V H V H V H V H V H
Total Liabilities 5612 3390 5637 1066 4866 -551 4635 -215 4848 -2553 4622 -2383
EQUIT Y
2014INDUST RY
2014COMPANY
2013INDUST RY
2013COMPANY
2012INDUST RY
2012COMPANY
V H V H V H V H V H V H
EMIS Business Report Generated on 2016-06-02
Copyright copy 2015 EMIS all rights reserved A Euromoney Institutional Investor company Page 38 of 48
Fiscal year 2014Companies in Industries 43
IndustryPetroleum Refineries
Capital 212 3149 226 000 187 -325 206 000 182 -237 201 003
Other Reserves 11156 3618 263 000 9512 000 239 000 8955 -143 233 -2444
Equity Appreciation -178 -439428 -173 -142830 005 5496 -010 -47857 003 4198565 003 NA
Retained Earnings 3652 -439 3702 -2707 4435 -418 4618 -192 4357 -050 4594 1065
Minority Interest 5213 074 346 075 6008 -1233 312 -1231 6451 -1929 347 -1929
Total Net Worth 4388 -077 4363 -2601 5134 -618 5365 -267 5152 153 5378 563
T OT AL LIABILIT Y AND EQUIT Y
2014INDUST RY
2014COMPANY
2013INDUST RY
2013COMPANY
2012INDUST RY
2012COMPANY
V H V H V H V H V H V H
Total Liabilities And Net Worth 10000 1610 10000 -901 10000 -585 10000 -243 10000 -1368 10000 -1039
EMIS Credit Analyt ics - Company vs Industry Income Statement
Company vs Industry - Income Statement
REPORTING DETAILS
2014 2013 2012
Statement type Individual Individual Individual
Audited Non-Audited Non-Audited Non-Audited
Provider NotoriaMonitor B Fins NotoriaMonitor B Fins NotoriaMonitor B Fins
Companies in Industry 43 54 52
EMIS Benchmark Score 5266 6892 7170
Reporting Standard 197 197 197
OPERAT ING PROFIT
2014INDUST RY
2014COMPANY
2013INDUST RY
2013COMPANY
2012INDUST RY
2012COMPANY
V H V H V H V H V H V H
Sales 10000 2089 10000 -575 10000 -1145 10000 -551 10000 500 10000 1190
Cost Of Goods Sold 9924 2648 9938 -150 9485 -1062 9509 -427 9396 612 9386 1253
Gross Profit 0 76 -8210 062 -8814 515 -2441 491 -2451 604 -978 614 313
Administrative AndGeneral Expenses
149 3309 141 420 135 -905 127 -479 132 -638 126 379
Selling Expenses 2650 5320 364 095 2091 094 340 028 1835 1798 320 578
Operational Profit -439 -165868 -438 -163453 034 -8046 027 -8483 154 -2807 168 -206
NON OPERAT ING INCOME
2014INDUST RY
2014COMPANY
2013INDUST RY
2013COMPANY
2012INDUST RY
2012COMPANY
V H V H V H V H V H V H
Total Non-Operating Revenue 036 465 033 -2304 042 -6818 040 -6944 117 -4630 125 -4930
- Financial Revenue 036 465 033 -2304 042 -6818 040 -6944 117 -4630 125 -4930
Total Non-Operating Expenses 190 24437 176 20967 067 -2118 053 -3252 075 -6320 075 -5970
- Financial Expenses 190 24438 176 20967 067 -2119 053 -3252 075 -6320 075 -5970
Other Extraordinary Result 0 00 10000 000 NA -000 9992 000 NA -000 NA -000 NA
EMIS Business Report Generated on 2016-06-02
Copyright copy 2015 EMIS all rights reserved A Euromoney Institutional Investor company Page 39 of 48
Fiscal year 2014Companies in Industries 43
IndustryPetroleum Refineries
Profit Before Income Taxes -594 -909715 -580 -407834 008 -9639 014 -9402 196 -1306 217 -601
T AXES AND OT HERS
2014INDUST RY
2014COMPANY
2013INDUST RY
2013COMPANY
2012INDUST RY
2012COMPANY
V H V H V H V H V H V H
Extraordinary Income (Charges) 0 02 8819 005 4250 002 NA 004 NA 000 -10000 000 NA
Changes Due To Consolidation 027 -8018 002 -8023 162 -5086 008 -5086 292 -4973 014 -4977
Income Tax -0 74 -468549 -039 -72388 -002 7245 006 -8524 -006 -11275 038 -4155
NET PROFIT
2014INDUST RY
2014COMPANY
2013INDUST RY
2013COMPANY
2012INDUST RY
2012COMPANY
V H V H V H V H V H V H
Net Income -519 -406205 -540 -340170 016 -9342 015 -9249 213 544 194 -078
EMIS Credit Analyt ics - Company vs Industry Cash Flow
Company vs Industry - Cash Flow
REPORTING DETAILS
2014 2013 2012
Statement type Individual Individual Individual
Audited Non-Audited Non-Audited Non-Audited
Provider NotoriaMonitor B Fins NotoriaMonitor B Fins NotoriaMonitor B Fins
Companies in Industry 43 54 52
EMIS Benchmark Score 5266 6892 7170
Reporting Standard 197 197 197
CASH OPENING BALANCE
2014INDUST RY
2014COMPANY
2013INDUST RY
2013COMPANY
2012INDUST RY
2012COMPANY
V H V H V H V H V H V H
Initial Cash 222 410 267 851 257 -4599 232 -5387 422 9240 474 8565
CASH FROM SALES
2014INDUST RY
2014COMPANY
2013INDUST RY
2013COMPANY
2012INDUST RY
2012COMPANY
V H V H V H V H V H V H
Net Sales 10000 2089 10000 -575 10000 -1145 10000 -551 10000 500 10000 1190
+- Trade AccountsReceivable
-0 91 -28672 066 13160 059 -4685 027 779616 098 16969 -000 9978
Cash From Sales 9909 1908 10066 -539 10059 -1179 10027 -525 10098 763 10000 1377
CASH FOR PRODUCT ION
2014INDUST RY
2014COMPANY
2013INDUST RY
2013COMPANY
2012INDUST RY
2012COMPANY
V H V H V H V H V H V H
(-) Sales Cost -9924 -2648 -9938 150 -9485 1062 -9509 427 -9396 -612 -9386 -1253
(-) (Inc) Inventory 125 -1020 364 21062 168 -1077 111 -183 167 13866 106 12570
(+) (Inc) Suppliers 174 188875 -162 -30445 -012 9818 075 11510 -572 -26577 -468 -25767
EMIS Business Report Generated on 2016-06-02
Copyright copy 2015 EMIS all rights reserved A Euromoney Institutional Investor company Page 40 of 48
Cash For Production -9625 -2474 -9736 159 -9328 1572 -9324 962 -9801 -961 -9748 -1525
CASH FOR OPERAT ING
2014INDUST RY
2014COMPANY
2013INDUST RY
2013COMPANY
2012INDUST RY
2012COMPANY
V H V H V H V H V H V H
(-) Administrative Expenses -149 -3309 -141 -420 -135 905 -127 479 -132 638 -126 -379
+- Other Operating Results -0 00 -12524 000 NA 001 NA 000 NA 000 NA 000 NA
(-) Selling Expenses -2650 -5320 -364 -095 -2091 -094 -340 -028 -1835 -1798 -320 -578
(-) Period Income Taxes 074 468549 039 72388 002 -7245 -006 8524 006 11275 -038 4155
(+) (Inc) Taxes Payable 002 69344 000 NA -000 -14351 000 NA 001 17119 000 NA
(-) (Inc) Labor EstimatesAnd Provision
-0 12 9215 -000 9200 -189 -12719 -004 -12717 614 184104751 015 NA
Cash For Operation -2736 -3712 -466 794 -2413 -5873 -477 379 -1346 2282 -469 405
OPERAT IONAL CASHFLOW
2014INDUST RY
2014COMPANY
2013INDUST RY
2013COMPANY
2012INDUST RY
2012COMPANY
V H V H V H V H V H V H
Net Operating Cashflow -2453 -7631 -137 -15709 -1682 -4202 225 19816 -1049 1952 -217 -3750
INVEST MENT S IN ASSET S
2014INDUST RY
2014COMPANY
2013INDUST RY
2013COMPANY
2012INDUST RY
2012COMPANY
V H V H V H V H V H V H
(-) (Inc) Net Fixed Assets -329 -67408 210 151250 069 -8689 -014 -10872 468 25487 152 12255
(ndash) (Inc) Investments -0 34 2746 -020 7025 -056 -47405 -062 -48471 -009 -10215 -010 -10826
FREE CASHFLOW
2014INDUST RY
2014COMPANY
2013INDUST RY
2013COMPANY
2012INDUST RY
2012COMPANY
V H V H V H V H V H V H
Free Cashflow -2816 -10396 054 -6596 -1669 -15077 150 28813 -589 5095 -075 -33837
FINANCIAL
2014INDUST RY
2014COMPANY
2013INDUST RY
2013COMPANY
2012INDUST RY
2012COMPANY
V H V H V H V H V H V H
(-) Financial Expenses -154 -65083 -143 -92333 -025 -15241 -013 -12496 042 20392 050 -1713
Cashflow After Financial Costs -2969 -11196 -089 -16127 -1694 -17395 136 60823 -547 5391 -025 -12770
(+) (Inc) Debt Short Term -000 9949 000 NA -000 -21237 000 NA 000 10091 000 NA
(+) (Inc) Debt Long Term 002 69344 000 NA -000 -14351 000 NA 001 17119 000 NA
Cashflow After FinancialExpenses
-2968 -11175 -089 -16127 -1694 -17455 136 60823 -546 5512 -025 -12770
CASHFLOW
2014INDUST RY
2014COMPANY
2013INDUST RY
2013COMPANY
2012INDUST RY
2012COMPANY
V H V H V H V H V H V H
(-) Dividends 503 42726 -126 -4528 -186 682 -082 -1139 -176 -73580 -069 -52834
(-) Other Expenses 002 8819 005 4250 002 NA 004 NA 000 -10000 000 NA
(-) Other Current Debtors 000 NA 000 NA 000 NA 000 NA 000 NA 000 NA
(-) Other Current Assets 002 -7807 002 -2258 011 361835 003 15505 000 10702 -005 -48602
(-) Long-Term AccountsReceivable
000 NA 000 NA 000 NA 000 NA 000 NA 000 NA
EMIS Business Report Generated on 2016-06-02
Copyright copy 2015 EMIS all rights reserved A Euromoney Institutional Investor company Page 41 of 48
(-)(Inc) Deferred And OtherLong Term Assets
-0 72 -37515 -022 -26027 032 11570 013 4240 -178 -88060 008 14351
(-) (Inc) Other Long TermLiabilities
406 56718 294 37011 -105 8205 -103 7364 -518 -37893 -368 -40951
(+) Inflation Adjustmentst Non Recurring Incomes
000 NA 000 NA 000 NA 000 NA 000 NA 000 NA
(+) (Inc) Other AccountsPayable
115 218744 105 82115 -007 -10274 -014 -10676 216 2710149 191 NA
(+) Extraordinary Income Consolidation
027 -8018 002 -8023 162 -5085 008 -5057 292 -4974 014 -5006
(-) Intangible Goods -007 -12244 011 -8077 040 29906 055 230557 009 12060 -002 8712
Complementary Cash-Flow 976 240248 271 31907 -051 8725 -117 5210 -356 -14616 -230 -28078
Net Cash Generation -1992 -3796 183 77289 -1745 -7131 020 10729 -902 -10194 -255 -21675
Ending Cash -1770 -4381 449 6846 -1488 -17434 251 851 -480 -11112 219 -5387
EMIS Business Report Generated on 2016-06-02
Copyright copy 2015 EMIS all rights reserved A Euromoney Institutional Investor company Page 42 of 48
Score Scale
Financial ScaleFinancial Model has 8 risk categories
A - Very Low RiskAA - Low RiskBB - Moderate Low RiskB - Below Average RiskCC - Above Average RiskC - Moderate High RiskD - High Risk E - Very High Risk
Risk Profile
High RiskHigh Risk - used when the loan amounts are relatively high and have a longrepayment period A loss in the Credit would seriously affect the companyresults Commercial credit with maturity exceeding 36 months
A loss in the Credit would seriously affect the results Bank credited to morethan 36 months
Vertical Weighting
Pampl
Sales Growth 12
Operating Profit 12
Net Profit 12
Sub t ot al 36
Balance
Days Receivables 12
Days Inventory 10
Current Ratio 8
Indebtness 8
Indebtednesssales 8
Balance Sub T ot al 46
Cash Flow
Cash From Sales 2
Cash For Production 2
Cash For Operations 2
Operating Cash Generation 5
Free Cash Flow 3
Cash Flow After Fin Ex 2
Cash Flow After Fin Result 2
Reduction In Debt 0
Cash Flow Sub T ot al 18
Total Vertical Weights 100
Tolerance Margin 5
Financial Conditions
Condit ions Score
Negative Net Worth CC
Final Weighting
EMIS Benchmark Score 90
EMIS Trend Score 10
EMIS Credit Analyt ics - EMIS Credit Analyt ics Assumptions
EMIS Business Report Generated on 2016-06-02
Copyright copy 2015 EMIS all rights reserved A Euromoney Institutional Investor company Page 43 of 48
Ret urn on Asset s (ROA)
An indicator of how profitable a company is relative to its total assets ROA gives an
idea as to how efficient management is at using its assets to generate earnings
Calculated by dividing a companys annual earnings by its total assets
Calculated as Net prof it T ot al Asset
Ret urn on Equit y (ROE)
A measure of a corporations profitability that reveals how much profit a company
generates with the money shareholders have invested
Calculated as Net prof it Shareholders equit y
Ret urn on Sales (ROS)
A ratio widely used to evaluate a companys operational efficiency ROS is also
known as a firms operating profit margin
Calculated as Net Prof it Net Sales Revenue
Bookvalue
A companys common stock equity as it appears on a balance sheet equal to total
assets minus liabilities preferred stock and intangible assets such as goodwill
Current Rat io
A liquidity ratio that measures a companys ability to pay short-term obligations
Calculated as Current Asset sCurrent Liabilit ies
Quick rat io
An indicator of a companys short-term liquidity The quick ratio measures a
companys ability to meet its short-term obligations with its most liquid assets The
higher the quick ratio the better the position of the company
Calculated as (Current Asset s-Invent ories)Current Liabilit ies
Debt t o equit y
A measure of a companys financial leverage calculated by dividing its total
liabilities by stockholders equity It indicates what proportion of equity and debt the
company is using to finance its assets
Calculated as T ot al Liabilit iesShareholders Equit y
Debt t o t ot al asset s
A metric used to measure a companys financial risk by determining how much of
the companys assets have been financed by debt Calculated by adding short-term
and long-term debt and then dividing by the companys total assets
Calculated as Short T erm Debt s+Long T erm Debt sT ot al Asset s
Leverage rat io
Leverage ratio provide an indication of the long term solvency of the firm
Calculated as T ot al Asset sShareholders Equit y
Debt Ent erprise Value
This metric is equivalent to the payback period used by debtholders Calculated as
Debt Ent erprise Value
Market Capit alizat ionEBIT DA
Calculated as Market Capit alizat ionEBIT DA
Earning Bef ore Int erest s and T axes (EBIT )
Earning Before Interests and Taxes (EBIT)
EBIT DA
Earnings before interest taxes depreciation and amortization (EBITDA) is a non-
GAAP metric that can be used to evaluate a companys profitability Calculated as
Ent erprise valueNet Sales
Dividing the enterprise value of a firm by its sales or revenues is a way of
comparing firms in cyclical industries Calculated as Enterprise Value Net Sales
Revenue
Ent erprise valueGross income
Calculated as Enterprise value Gross income
Ent erprise valueT ot al Asset s
Calculated as Enterprise value Total Assets
EBIT DA Margin
A measurement that provides a clear view of the companyrsquos core profitability
Calculated as EBITDA Net Sales Revenue
T ot al Operat ing Revenue T rend
Calculated as Total Operating Revenue current year Total Operating Revenue
previous year
Gross Prof it T rend
Calculated in percentage as (Gross Prof it Current Year Gross Prof it
Previous Year) ndash 1
EBIT DA T rend
Calculated as EBITDA current year EBITDA previous year
Account s Receivables T rend
Calculated in percentage as T rade Account s Receivables current year
T rade Account Receivables previous year
Invent ory T rend
Calculated as Inventories current year Inventories previous year
Net Propert y Plant and Equipment (PPampE) T rend
Calculated as Net PPampE current year Net PPampE previous year
T ot al Asset s T rend
Calculated as Total Assets current year Total Assets previous year
Bookvalue T rend
Calculated as Bookvalue current year Bookvalue previous year
Shareholders Equit y T rend
Calculated as Shareholdersrsquo Equity current year Shareholdersrsquo Equity previous
year
Cash f rom Operat ions T rend
Calculated as Net Cash Flow from Operations current year Net Cash Flow from
Operations previous year
Capit al Expendit ures T rend
Calculated as CAPEX current year CAPEX previous year
Dividend per Share T rend
Calculated as Dividend value per (common) share current year Dividend value
per (common) share previous year
Cost t o Income Rat io
A key financial measure showing a bankrsquos cost in relation to its income Ratio is
calculated as Total Operational Cost Total Operational Income
Glossary
EMIS Business Report Generated on 2016-06-02
Copyright copy 2015 EMIS all rights reserved A Euromoney Institutional Investor company Page 44 of 48
EBIT DA = Operat ing Revenue - Operat ing Expenses (Depriciat ion and
Amort izat ion excluded)
Ent erprise Value EBIT DA
Enterprise Value EBITDA is the metric most used to measure how many years it
would take to pay back the investment
Ent erprise Value
A measure of a companys value often used as an alternative to straightforward
market capitalization EV is calculated as market cap plus debt minority interest
and preferred shares minus total cash and cash equivalents
Dooms day rat io
Calculated as Cash Current Liabilit ies
Long T erm Debt t o Capit al
A ratio showing the financial leverage of a firm calculated by dividing long-term
debt by the amount of capital available Calculated as Long t erm debt Long
t erm debt + Pref f ered St ock + Common St ock
Int erest Coverage Rat io
A ratio used to determine how easily a company can pay interest on outstanding
debt The interest coverage ratio is calculated by dividing a companys earnings
before interest and taxes (EBIT) of one period by the companys interest expenses of
the same period Calculated as EBIT Int erest expense
Cash Flow t o Debt
This coverage ratio compares a companys operating cash flow to its total debt
which for purposes of this ratio is defined as the sum of short-term borrowings the
current portion of long-term debt and long-term debt This ratio provides an
indication of a companys ability to cover total debt with its yearly cash flow from
operations The higher the percentage ratio the better the companys ability to carry
its total debt Calculates as Operat ing Cash Flow T ot al Debt
Ret urn on Capit al
A ratio that indicates the efficiency and profitability of a companys capital
investments Calculated as Net Income (Total Asset - Current Liabilities)
Gross Prof it Margin
A financial metric used to assess a firms financial health by revealing the
proportion of money left over from revenues after accounting for the cost of goods
sold Gross profit margin serves as the source for paying additional expenses and
future savings Calculated as (Net Sales Revenue - Cost of Goods Sold) Net
Sales Revenue
Operat ing Prof it Margin
A ratio used to measure a companys pricing strategy and operating efficiency
Calculated as Operat ing prof it Net sales
Account s Receivable T urnover
An accounting measure used to quantify a firms effectiveness in extending credit
as well as collecting debts The receivables turnover ratio is an activity ratio
measuring how efficiently a firm uses its assets Calculated as Net Sales
Revenue T rade Account s Receivable (Net )
Invent ory T urnover
A ratio showing how many times a companys inventory is sold and replaced over a
period Calculated as Sales Invent ory
Current asset t urnover
Calculated as Net Sales Revenue T ot al Current Asset
Ef f iciency Rat io
Calculated as Total non-interest expenses (Total net interest income + Total non-
interest income)
Loans t o Deposit s Rat io
A commonly used statistic for assessing a banks liquidity Calculated as Total
Loans Total Deposits
Liquid Asset s t o Deposit s Rat io
This ratio indicates extent of liquidity maintained by a bank for meeting the demand
made by the depositors Calculated as (Cash + Financial assets held for trading)
Total Deposits
Loans t o Asset Rat io
Calculated as Total Loans Total Assets
Net Int erest Income T rend
Calculated as Net Interest Income current year Net Interest Income previous year
Net Fee and Commission Income T rend
Calculated as Net Fee and Commission Income current year Net Fee and
Commission Income previous year
Loans and Advances t o Cust omers T rend
Calculated as Loans and Advances to Customers current year Loans and
Advances to Customers previous year
Deposit s f rom Cust omers T rend
Calculated as Deposits from Customers current year Deposits from Customers
previous year
Loss Rat io
This ratio indicates the average cost of insurance protection per each dollar of net
premiums earned during the period Calculated as Total Losses Incurred in Claims
Net Insurance Premium Revenue
Underwrit ing Expenses Rat io
This ratio measures operational efficiency in underwriting Calculated as
Underwriting expenses Net Insurance Premium Revenue
Policyholder Dividend Rat io
Calculated as Dividends Net Insurance Premium Revenue
Combined LossExpense Rat io
Calculated as Loss Ratio + Underwriting Expenses Ratio + Policyholder Dividend
Ratio When the combined ratio is under 100 underwriting results are
considered profitable when the combined ratio is over 100 underwriting results
are considered unprofitable
Ceded Premium Rat io
Calculated as Insurance Premium Ceded to Reinsurers Insurance Premium
Revenue
Net Premiums Earned T rend
Calculated as Net Insurance Premium Revenue current year Net Insurance
Premium Revenue previous year
Fees and Commissions T rend
Calculated as Net Fees and Commissions Income current year Net Fees and
Commissions Income previous year
Net Invest ment Income T rend
EMIS Business Report Generated on 2016-06-02
Copyright copy 2015 EMIS all rights reserved A Euromoney Institutional Investor company Page 45 of 48
Fixed-asset t urnover
This ratio is a rough measure of the productivity of a companys fixed assets
(property plant and equipment or PPampE) with respect to generating sales For most
companies their investment in fixed assets represents the single largest
component of their total assets This annual turnover ratio is designed to reflect a
companys efficiency in managing these significant assets Simply put the higher
the yearly turnover rate the better Calculated as Revenue Propert y Plant and
Equipment
Asset T urnover
The amount of sales generated for every dollars worth of assets It is calculated by
dividing sales in dollars by assets in dollars Calculated as Revenue Asset s
Revenue T rend
Calculated as (Net Sales Current Year Net Sales Previous Year)
Net Income T rend
Calculated as (Net Income Current Year Net Income Previous Year)
Operat ing Income T rend
Calculated as (Operat ing Income Current Year Operat ing Income
Previous year)
PriceBook Rat io
A ratio used to compare a stocks market value to its book value It is calculated by
dividing the current closing price of the stock by the latest years book value per
share Calculated as St ock price (T ot al Asset - Int angible asset s and
Liabilit ies)
PriceEarnings Rat io
A valuation ratio of a companys current share price compared to its per-share
earnings Calculated as Market value per share Earning per share EPS
Market capShareholder equit y
A financial ratio showing the premium which is included in the current market price
compared to the actual value of Shareholder equity of the company Calculated as
Market capit alizat ion Shareholders equit y
PriceEBIT Rat io
The PriceEBIT ratio is a market value indicator similar to the PE ratio which shows
the number of times the market price exceeds the earnings per share before the
effects of gross interest abnormal items and tax The PriceEBIT ratio is calculated
as follows Valuat ion price EBIT
T ot al Capit al Rat io
Calculated as T ot al capit al (T ier 1 and T ier 2) rat io = T ot al capit al (T ier 1
and T ier 2) Risk-adjust ed asset s
T ier 1 Rat io
Tier 1 capital is the core measure of a banks financial strength from a regulators
point of view It consists primarily of shareholders equity but may also include
preferred stock that is irredeemable and non-cumulative and retained earnings
Risk Weight ed Asset s
Risk weights are in five categories from zero to 100 per cent Those carrying a
zero weight include notes and coins gold matched by gold liabilities balances with
the Reserve Bank and commonwealth government securities with less than twelve
months to maturity Commonwealth government securities with more than twelve
months to maturity carry a 10 per cent risk weighting as do state government
securities Claims on other banks Australian local governments and public-sector
organisations other than those with corporate status or which operate
Calculated as Investment Income current year Investment Income previous year
Receivables Arising Out Of Direct Insurance Operat ions T rend
Calculated as Receivables Arising out of Direct Insurance Operations current year
Receivables Arising out of Direct Insurance Operations previous year
Operat ing ROA
An indicator that shows the type of net profit which is actually generated by business
effort Calculated as Operat ing Prof it (EBIT ) T ot al Asset s
Payables T urnover
An indicator that evaluates how fast a company pays off its creditors (suppliers)
Calculated as Purchases T rade Payables
Working Capit al T urnover
A measure that indicates how efficiently the company generates revenue with its
working capital Working capital is defined as current assets minus current liabilities
Calculated as Net Sales (T ot al Current Asset s ndash T ot al Current
Liabilit ies)
Working Capit al
A measure of a companyrsquos short term financial health Calculated as T ot al
Current Asset s ndash T ot al Current Liabilit ies
Cash Rat io
A measure of a companyrsquos liquidity in crisis situation Only highly marketable
securities and cash are included Calculated as (T ot al Cash and Cash
Equivalent s + Market able securit ies) T ot al Current Liabilit ies
Cash Flow f rom Operat ion Rat io
A measure of how well current liabilities are covered by the cash flow generated
from a companyrsquos operations Calculated as Net Cash Flow f rom Operat ing
Act ivit ies T ot al Current Liabilit ies
Debt Coverage
A measure that shows a companyrsquos ability to cover total debt with its yearly cash
flow from operations Calculated as Net Cash Flow f rom Operat ing Act ivit ies
T ot al Debt
Cash Flow t o Revenue
This ratio measures the amount of operating cash flow generated for each dollar of
revenue Calculated as Net Cash Flow f rom Operat ing Act ivit ies Net Sales
Revenue
Cash Ret urn on Asset s
This ratio measures the return of operating cash flow attributed to all providers of
capital Calculated as Net Cash Flow f rom Operat ing Act ivit ies T ot al
Asset s
Cash Ret urn on Equit y
This ratio measures the return of operating cash flow attributed to shareholders
Calculated as Net Cash Flow f rom Operat ing Act ivit ies T ot al
Shareholdersrsquo Equit y
Cash t o Income
This ratio measures the ability to generate cash from companyrsquos operations
Calculated as Net Cash Flow f rom Operat ing Act ivit ies Operat ing Prof it
(EBIT )
CashT ot al Asset s
Calculated as Cash and Cash Equivalent s T ot al Asset s
EMIS Business Report Generated on 2016-06-02
Copyright copy 2015 EMIS all rights reserved A Euromoney Institutional Investor company Page 46 of 48
commercially carry a 20 per cent risk weighting Loans secured by a mortgage
over residential property and with a loan-to-valuation of 80 per cent or less carry a
50 per cent risk weighting and loans to companies or individuals carry a 100 per
cent risk weighting
Market Cap Net cash
A ratio measure the market value of the company to the Net cash position of the
company Calculated as Market capit alizat ion (Cash and cash equivalent s
minus long-t erm debt )
Net Cash
Net cash is commonly used in evaluating a companys cash flow More generally
net cash can refer to the amount of cash remaining after a transaction has been
completed and all charges and deductions related to the transaction have been
subtracted Calculated as T ot al cash minus t ot al short t erm liabilit ies
Annualised Ret urn on Equit y (ROE)
Return on Equity ratio (ROE) converted into an annual basis
Annualised Ret urn on Asset s (ROA)
Return on Assets ratio (ROA) converted into an annual basis
Export Proport ion Rat io
The percentage figure of the proportion of the export revenue from the total sales
revenue of the company Calculated as Export revenue T ot al revenue
Net Debt
A metric that shows companys overall debt situation by netting the value of
financial liabilities with its cash and other similar liquid assets Calculated as
financial liabilities - cash and cash equivalents
EPS
The portion of a companys profit allocated to each outstanding share Calculated
as Net Profit Outstanding Shares
PE
A valuation ratio of a companys current share price compared to its per-share
earnings Calculated as Market value per share Earning per share EPS
Market Capit alizat ionNet Sales
Calculated as Market Capitalization Net Sales Revenue
Market Capit alizat ionGross income
Calculated as Market Capitalization Gross Profit
Market Capit alizat ionEBIT
Calculated as Market Capitalization EBIT
Market Capit alizat ionT ot al Asset s
Calculated as Market Capitalization Total Assets
ReceivablesT ot al asset s
Calculated as T rade Account s Receivable T ot al Asset s
Invent oriesT ot al asset s
Calculated as Invent ories T ot al Asset s
Fixed asset sT ot al asset s
Calculated as Non-current Asset s T ot al Asset s
Current Liabilit iesT ot al Liabilit ies
Calculated as T ot al Current Liabilit ies T ot al Liabilit ies
Salaries and Employee Benef it sNet sales
Calculated as Employee Benef it Expenses Net Sales Revenue
Administ rat ive ExpensesNet Sales
Calculated as Administ rat ive Expenses Net Sales Revenue
Depreciat ion and Amort izat ionNet sales
Calculated as Depreciat ion Amort izat ion and Impairment Charges Net
Sales Revenue
Int erest paidNet sales
Calculated as Int erest -t ype Expenses Net Sales Revenue
Income t axNet sales
Calculated as Income T ax Net Sales Revenue
Operat ing Cash Flow t o T ot al Cash Flow
Calculated as Net Cash Flow f rom Operat ing Act ivit ies Net
IncreaseDecrease in Cash and Cash Equivalent s
Cash Flow f rom Invest ing t o T ot al Cash Flow
Calculated as Net cash f low f rom (used in) invest ing act ivit ies Net
IncreaseDecrease in Cash and Cash Equivalent s
Cash f low f rom f inancing t o T ot al cash f low
Calculated as Net cash flow from (used in) financing activities Net
IncreaseDecrease in Cash and Cash Equivalents
Average Yie ld on Asset s
Calculated as T ot al Int erest Income T ot al Asset s
Disclaimer
Whilst EMIS attempts at all times to ensure the accuracy and reliability of the information it provides due to the vast quantity of processed data and the fact that some of
the third-party data cannot always be verified including information provided directly by the subject of the enquiry EMIS does not guarantee the correctness or the
effective delivery of the information and shall not be held responsible for any errors or omissions therein
The content and recommendations shall only be used as a reference in business decisions of EMIS clients and shall not be used for any other purposes EMIS and its
affiliates shall not be held liable for any loss of the clients arising out of its own business decisions whether or not the making of such decision has been referred to this
contentrecommendation
EMIS Business Report Generated on 2016-06-02
Copyright copy 2015 EMIS all rights reserved A Euromoney Institutional Investor company Page 47 of 48
EMIS Business Report Generated on 2016-06-02
Copyright copy 2015 EMIS all rights reserved A Euromoney Institutional Investor company Page 48 of 48
- Table of Contents
- Company Tear Sheet
-
- Contact Information
- NAICS Industry Classification
- Business description
- Basic Information
- EMIS Financial Score
- Share Price information
- Key Executives
- Ownership Details
- Subsidiaries and Affiliates
- Key Financial Highlights
- Financial Performance Charts
- Latest MampA and ECM Deals
- Top Competitors
-
- Financial Statements
-
- Annual Statements
- Interim Statements
- Ratios
- Multiples
-
- Company Documents
-
- Financial DocumentsAnnual Reports
- Corporate Actions
-
- News amp Reports
-
- News
- Reports
-
- MampA and ECM Deals
-
- EMIS DealWatch Deals
- EMIS DealWatch Intents
-
- EMIS Credit Analytics
-
- Summary
- EMIS Financial Score
- EMIS Benchmark Score
- EMIS Credit Quota
- Conclusions
- Company vs Industry Key Stats
- Company vs Industry Balance Sheet
- Company vs Industry Income Statement
- Company vs Industry Cash Flow
- EMIS Credit Analytics Assumptions
-
- Glossary
- Disclaimer
-
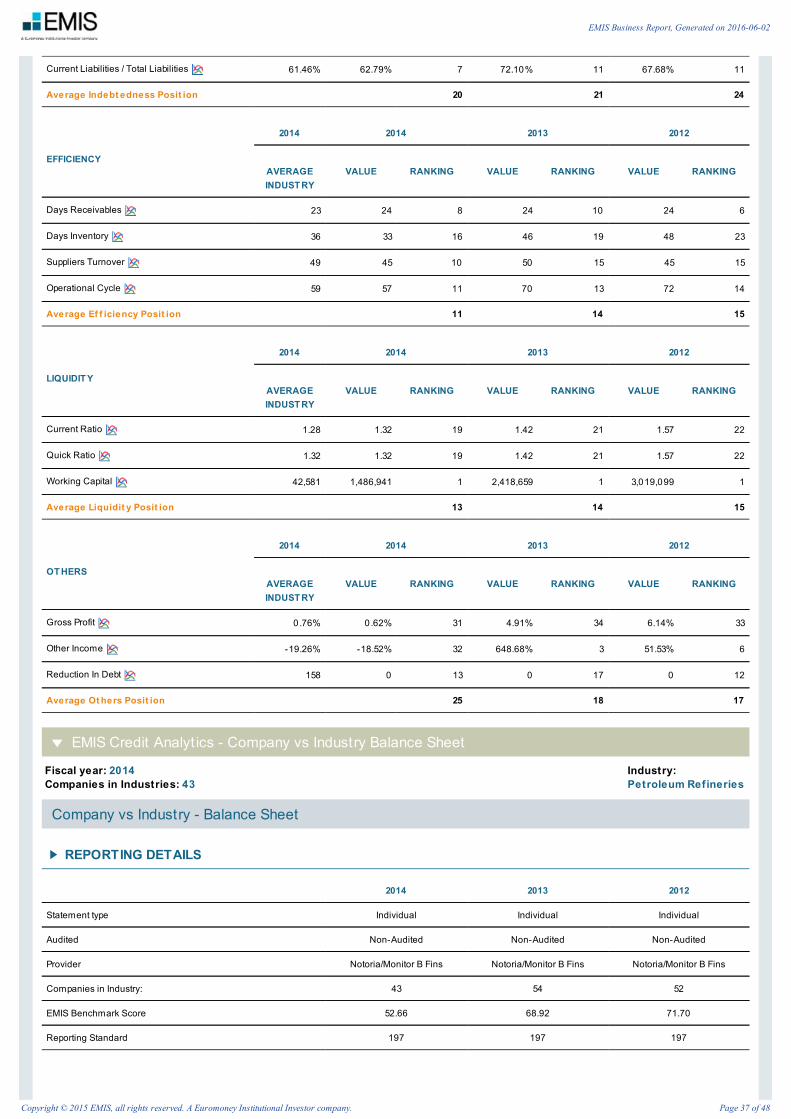
Fiscal year 2014Companies in Industries 43
IndustryPetroleum Refineries
Current Liabilities Total Liabilities 6146 6279 7 7210 11 6768 11
Average Indebt edness Posit ion 20 21 24
EFFICIENCY
2014 2014 2013 2012
AVERAGEINDUST RY
VALUE RANKING VALUE RANKING VALUE RANKING
Days Receivables 23 24 8 24 10 24 6
Days Inventory 36 33 16 46 19 48 23
Suppliers Turnover 49 45 10 50 15 45 15
Operational Cycle 59 57 11 70 13 72 14
Average Ef f iciency Posit ion 11 14 15
LIQUIDIT Y
2014 2014 2013 2012
AVERAGEINDUST RY
VALUE RANKING VALUE RANKING VALUE RANKING
Current Ratio 128 132 19 142 21 157 22
Quick Ratio 132 132 19 142 21 157 22
Working Capital 42581 1486941 1 2418659 1 3019099 1
Average Liquidit y Posit ion 13 14 15
OT HERS
2014 2014 2013 2012
AVERAGEINDUST RY
VALUE RANKING VALUE RANKING VALUE RANKING
Gross Profit 0 76 062 31 491 34 614 33
Other Income -1926 -1852 32 64868 3 5153 6
Reduction In Debt 158 0 13 0 17 0 12
Average Ot hers Posit ion 25 18 17
EMIS Credit Analyt ics - Company vs Industry Balance Sheet
Company vs Industry - Balance Sheet
REPORTING DETAILS
2014 2013 2012
Statement type Individual Individual Individual
Audited Non-Audited Non-Audited Non-Audited
Provider NotoriaMonitor B Fins NotoriaMonitor B Fins NotoriaMonitor B Fins
Companies in Industry 43 54 52
EMIS Benchmark Score 5266 6892 7170
Reporting Standard 197 197 197
EMIS Business Report Generated on 2016-06-02
Copyright copy 2015 EMIS all rights reserved A Euromoney Institutional Investor company Page 37 of 48
CURRENT ASSET S 2014INDUST RY
2014COMPANY
2013INDUST RY
2013COMPANY
2012INDUST RY
2012COMPANY
V H V H V H V H V H V H
Cash And Banks 1003 11838 1034 6846 533 410 559 851 482 -4599 502 -5387
Short Term Investments 003 -404 000 NA 004 -7992 000 NA 018 457613 000 NA
Account Receivables (Trade) 1320 1670 1510 -915 1313 -821 1513 -380 1346 -1338 1534 005
Inventory 2075 -1109 2104 -2851 2710 -1100 2677 -841 2866 -1097 2852 -789
Deferred Assets 014 -1494 007 -4068 020 -2569 011 -3444 025 -385 017 16719
Current Assets 4413 1190 4656 -1101 4579 -900 4760 -533 4737 -1703 4906 -1431
FIXED ASSET
2014INDUST RY
2014COMPANY
2013INDUST RY
2013COMPANY
2012INDUST RY
2012COMPANY
V H V H V H V H V H V H
- Land And Properties 4838 1574 4846 -907 4853 -232 4850 065 4677 -1788 4701 -690
- Other Equipments 004 -262 000 NA 004 6983 000 NA 002 -1186 000 NA
Fixed Assets 4872 1626 4846 -907 4865 -275 4850 065 4710 -1737 4701 -690
Intangible Assets (Net) 202 823 150 -1458 217 -2685 160 -4312 279 -652 275 199
Investments 240 4117 265 2041 197 13125 200 21858 080 2964 061 5970
Deferred Assets 281 11870 082 15497 149 -2699 029 -4916 193 5695 056 -2566
Total Long Term Assets 5585 1962 5344 -720 5421 -302 5240 036 5263 -1044 5094 -625
T OT AL ASSET S
2014INDUST RY
2014COMPANY
2013INDUST RY
2013COMPANY
2012INDUST RY
2012COMPANY
V H V H V H V H V H V H
Total Assets 10000 1610 10000 -901 10000 -585 10000 -243 10000 -1368 10000 -1039
CURRENT LIABILIT Y
2014INDUST RY
2014COMPANY
2013INDUST RY
2013COMPANY
2012INDUST RY
2012COMPANY
V H V H V H V H V H V H
Suppliers 2801 1472 2839 -1163 2835 -082 2923 603 2691 -3100 2690 -2855
Other Short Term Liabilities 13741 2571 701 5233 12691 320 419 -676 11578 NA 438 NA
Total Current Liability 3449 2100 3540 -362 3309 -111 3342 424 3151 -1924 3128 -1691
LONG T ERM LIABILIT Y
2014INDUST RY
2014COMPANY
2013INDUST RY
2013COMPANY
2012INDUST RY
2012COMPANY
V H V H V H V H V H V H
Long Term Deferred Liabilities 839 -299 028 -299 1004 -2717 026 -2717 1298 NA 035 NA
Other Long Term Liabilities 2187 6238 2070 4861 1564 -1129 1267 -1525 1659 -3979 1459 -3665
Long Term Liabilities 2163 6134 2097 4757 1556 -1368 1293 -1553 1698 -3494 1494 -3513
T OT AL LIABILIT Y
2014INDUST RY
2014COMPANY
2013INDUST RY
2013COMPANY
2012INDUST RY
2012COMPANY
V H V H V H V H V H V H
Total Liabilities 5612 3390 5637 1066 4866 -551 4635 -215 4848 -2553 4622 -2383
EQUIT Y
2014INDUST RY
2014COMPANY
2013INDUST RY
2013COMPANY
2012INDUST RY
2012COMPANY
V H V H V H V H V H V H
EMIS Business Report Generated on 2016-06-02
Copyright copy 2015 EMIS all rights reserved A Euromoney Institutional Investor company Page 38 of 48
Fiscal year 2014Companies in Industries 43
IndustryPetroleum Refineries
Capital 212 3149 226 000 187 -325 206 000 182 -237 201 003
Other Reserves 11156 3618 263 000 9512 000 239 000 8955 -143 233 -2444
Equity Appreciation -178 -439428 -173 -142830 005 5496 -010 -47857 003 4198565 003 NA
Retained Earnings 3652 -439 3702 -2707 4435 -418 4618 -192 4357 -050 4594 1065
Minority Interest 5213 074 346 075 6008 -1233 312 -1231 6451 -1929 347 -1929
Total Net Worth 4388 -077 4363 -2601 5134 -618 5365 -267 5152 153 5378 563
T OT AL LIABILIT Y AND EQUIT Y
2014INDUST RY
2014COMPANY
2013INDUST RY
2013COMPANY
2012INDUST RY
2012COMPANY
V H V H V H V H V H V H
Total Liabilities And Net Worth 10000 1610 10000 -901 10000 -585 10000 -243 10000 -1368 10000 -1039
EMIS Credit Analyt ics - Company vs Industry Income Statement
Company vs Industry - Income Statement
REPORTING DETAILS
2014 2013 2012
Statement type Individual Individual Individual
Audited Non-Audited Non-Audited Non-Audited
Provider NotoriaMonitor B Fins NotoriaMonitor B Fins NotoriaMonitor B Fins
Companies in Industry 43 54 52
EMIS Benchmark Score 5266 6892 7170
Reporting Standard 197 197 197
OPERAT ING PROFIT
2014INDUST RY
2014COMPANY
2013INDUST RY
2013COMPANY
2012INDUST RY
2012COMPANY
V H V H V H V H V H V H
Sales 10000 2089 10000 -575 10000 -1145 10000 -551 10000 500 10000 1190
Cost Of Goods Sold 9924 2648 9938 -150 9485 -1062 9509 -427 9396 612 9386 1253
Gross Profit 0 76 -8210 062 -8814 515 -2441 491 -2451 604 -978 614 313
Administrative AndGeneral Expenses
149 3309 141 420 135 -905 127 -479 132 -638 126 379
Selling Expenses 2650 5320 364 095 2091 094 340 028 1835 1798 320 578
Operational Profit -439 -165868 -438 -163453 034 -8046 027 -8483 154 -2807 168 -206
NON OPERAT ING INCOME
2014INDUST RY
2014COMPANY
2013INDUST RY
2013COMPANY
2012INDUST RY
2012COMPANY
V H V H V H V H V H V H
Total Non-Operating Revenue 036 465 033 -2304 042 -6818 040 -6944 117 -4630 125 -4930
- Financial Revenue 036 465 033 -2304 042 -6818 040 -6944 117 -4630 125 -4930
Total Non-Operating Expenses 190 24437 176 20967 067 -2118 053 -3252 075 -6320 075 -5970
- Financial Expenses 190 24438 176 20967 067 -2119 053 -3252 075 -6320 075 -5970
Other Extraordinary Result 0 00 10000 000 NA -000 9992 000 NA -000 NA -000 NA
EMIS Business Report Generated on 2016-06-02
Copyright copy 2015 EMIS all rights reserved A Euromoney Institutional Investor company Page 39 of 48
Fiscal year 2014Companies in Industries 43
IndustryPetroleum Refineries
Profit Before Income Taxes -594 -909715 -580 -407834 008 -9639 014 -9402 196 -1306 217 -601
T AXES AND OT HERS
2014INDUST RY
2014COMPANY
2013INDUST RY
2013COMPANY
2012INDUST RY
2012COMPANY
V H V H V H V H V H V H
Extraordinary Income (Charges) 0 02 8819 005 4250 002 NA 004 NA 000 -10000 000 NA
Changes Due To Consolidation 027 -8018 002 -8023 162 -5086 008 -5086 292 -4973 014 -4977
Income Tax -0 74 -468549 -039 -72388 -002 7245 006 -8524 -006 -11275 038 -4155
NET PROFIT
2014INDUST RY
2014COMPANY
2013INDUST RY
2013COMPANY
2012INDUST RY
2012COMPANY
V H V H V H V H V H V H
Net Income -519 -406205 -540 -340170 016 -9342 015 -9249 213 544 194 -078
EMIS Credit Analyt ics - Company vs Industry Cash Flow
Company vs Industry - Cash Flow
REPORTING DETAILS
2014 2013 2012
Statement type Individual Individual Individual
Audited Non-Audited Non-Audited Non-Audited
Provider NotoriaMonitor B Fins NotoriaMonitor B Fins NotoriaMonitor B Fins
Companies in Industry 43 54 52
EMIS Benchmark Score 5266 6892 7170
Reporting Standard 197 197 197
CASH OPENING BALANCE
2014INDUST RY
2014COMPANY
2013INDUST RY
2013COMPANY
2012INDUST RY
2012COMPANY
V H V H V H V H V H V H
Initial Cash 222 410 267 851 257 -4599 232 -5387 422 9240 474 8565
CASH FROM SALES
2014INDUST RY
2014COMPANY
2013INDUST RY
2013COMPANY
2012INDUST RY
2012COMPANY
V H V H V H V H V H V H
Net Sales 10000 2089 10000 -575 10000 -1145 10000 -551 10000 500 10000 1190
+- Trade AccountsReceivable
-0 91 -28672 066 13160 059 -4685 027 779616 098 16969 -000 9978
Cash From Sales 9909 1908 10066 -539 10059 -1179 10027 -525 10098 763 10000 1377
CASH FOR PRODUCT ION
2014INDUST RY
2014COMPANY
2013INDUST RY
2013COMPANY
2012INDUST RY
2012COMPANY
V H V H V H V H V H V H
(-) Sales Cost -9924 -2648 -9938 150 -9485 1062 -9509 427 -9396 -612 -9386 -1253
(-) (Inc) Inventory 125 -1020 364 21062 168 -1077 111 -183 167 13866 106 12570
(+) (Inc) Suppliers 174 188875 -162 -30445 -012 9818 075 11510 -572 -26577 -468 -25767
EMIS Business Report Generated on 2016-06-02
Copyright copy 2015 EMIS all rights reserved A Euromoney Institutional Investor company Page 40 of 48
Cash For Production -9625 -2474 -9736 159 -9328 1572 -9324 962 -9801 -961 -9748 -1525
CASH FOR OPERAT ING
2014INDUST RY
2014COMPANY
2013INDUST RY
2013COMPANY
2012INDUST RY
2012COMPANY
V H V H V H V H V H V H
(-) Administrative Expenses -149 -3309 -141 -420 -135 905 -127 479 -132 638 -126 -379
+- Other Operating Results -0 00 -12524 000 NA 001 NA 000 NA 000 NA 000 NA
(-) Selling Expenses -2650 -5320 -364 -095 -2091 -094 -340 -028 -1835 -1798 -320 -578
(-) Period Income Taxes 074 468549 039 72388 002 -7245 -006 8524 006 11275 -038 4155
(+) (Inc) Taxes Payable 002 69344 000 NA -000 -14351 000 NA 001 17119 000 NA
(-) (Inc) Labor EstimatesAnd Provision
-0 12 9215 -000 9200 -189 -12719 -004 -12717 614 184104751 015 NA
Cash For Operation -2736 -3712 -466 794 -2413 -5873 -477 379 -1346 2282 -469 405
OPERAT IONAL CASHFLOW
2014INDUST RY
2014COMPANY
2013INDUST RY
2013COMPANY
2012INDUST RY
2012COMPANY
V H V H V H V H V H V H
Net Operating Cashflow -2453 -7631 -137 -15709 -1682 -4202 225 19816 -1049 1952 -217 -3750
INVEST MENT S IN ASSET S
2014INDUST RY
2014COMPANY
2013INDUST RY
2013COMPANY
2012INDUST RY
2012COMPANY
V H V H V H V H V H V H
(-) (Inc) Net Fixed Assets -329 -67408 210 151250 069 -8689 -014 -10872 468 25487 152 12255
(ndash) (Inc) Investments -0 34 2746 -020 7025 -056 -47405 -062 -48471 -009 -10215 -010 -10826
FREE CASHFLOW
2014INDUST RY
2014COMPANY
2013INDUST RY
2013COMPANY
2012INDUST RY
2012COMPANY
V H V H V H V H V H V H
Free Cashflow -2816 -10396 054 -6596 -1669 -15077 150 28813 -589 5095 -075 -33837
FINANCIAL
2014INDUST RY
2014COMPANY
2013INDUST RY
2013COMPANY
2012INDUST RY
2012COMPANY
V H V H V H V H V H V H
(-) Financial Expenses -154 -65083 -143 -92333 -025 -15241 -013 -12496 042 20392 050 -1713
Cashflow After Financial Costs -2969 -11196 -089 -16127 -1694 -17395 136 60823 -547 5391 -025 -12770
(+) (Inc) Debt Short Term -000 9949 000 NA -000 -21237 000 NA 000 10091 000 NA
(+) (Inc) Debt Long Term 002 69344 000 NA -000 -14351 000 NA 001 17119 000 NA
Cashflow After FinancialExpenses
-2968 -11175 -089 -16127 -1694 -17455 136 60823 -546 5512 -025 -12770
CASHFLOW
2014INDUST RY
2014COMPANY
2013INDUST RY
2013COMPANY
2012INDUST RY
2012COMPANY
V H V H V H V H V H V H
(-) Dividends 503 42726 -126 -4528 -186 682 -082 -1139 -176 -73580 -069 -52834
(-) Other Expenses 002 8819 005 4250 002 NA 004 NA 000 -10000 000 NA
(-) Other Current Debtors 000 NA 000 NA 000 NA 000 NA 000 NA 000 NA
(-) Other Current Assets 002 -7807 002 -2258 011 361835 003 15505 000 10702 -005 -48602
(-) Long-Term AccountsReceivable
000 NA 000 NA 000 NA 000 NA 000 NA 000 NA
EMIS Business Report Generated on 2016-06-02
Copyright copy 2015 EMIS all rights reserved A Euromoney Institutional Investor company Page 41 of 48
(-)(Inc) Deferred And OtherLong Term Assets
-0 72 -37515 -022 -26027 032 11570 013 4240 -178 -88060 008 14351
(-) (Inc) Other Long TermLiabilities
406 56718 294 37011 -105 8205 -103 7364 -518 -37893 -368 -40951
(+) Inflation Adjustmentst Non Recurring Incomes
000 NA 000 NA 000 NA 000 NA 000 NA 000 NA
(+) (Inc) Other AccountsPayable
115 218744 105 82115 -007 -10274 -014 -10676 216 2710149 191 NA
(+) Extraordinary Income Consolidation
027 -8018 002 -8023 162 -5085 008 -5057 292 -4974 014 -5006
(-) Intangible Goods -007 -12244 011 -8077 040 29906 055 230557 009 12060 -002 8712
Complementary Cash-Flow 976 240248 271 31907 -051 8725 -117 5210 -356 -14616 -230 -28078
Net Cash Generation -1992 -3796 183 77289 -1745 -7131 020 10729 -902 -10194 -255 -21675
Ending Cash -1770 -4381 449 6846 -1488 -17434 251 851 -480 -11112 219 -5387
EMIS Business Report Generated on 2016-06-02
Copyright copy 2015 EMIS all rights reserved A Euromoney Institutional Investor company Page 42 of 48
Score Scale
Financial ScaleFinancial Model has 8 risk categories
A - Very Low RiskAA - Low RiskBB - Moderate Low RiskB - Below Average RiskCC - Above Average RiskC - Moderate High RiskD - High Risk E - Very High Risk
Risk Profile
High RiskHigh Risk - used when the loan amounts are relatively high and have a longrepayment period A loss in the Credit would seriously affect the companyresults Commercial credit with maturity exceeding 36 months
A loss in the Credit would seriously affect the results Bank credited to morethan 36 months
Vertical Weighting
Pampl
Sales Growth 12
Operating Profit 12
Net Profit 12
Sub t ot al 36
Balance
Days Receivables 12
Days Inventory 10
Current Ratio 8
Indebtness 8
Indebtednesssales 8
Balance Sub T ot al 46
Cash Flow
Cash From Sales 2
Cash For Production 2
Cash For Operations 2
Operating Cash Generation 5
Free Cash Flow 3
Cash Flow After Fin Ex 2
Cash Flow After Fin Result 2
Reduction In Debt 0
Cash Flow Sub T ot al 18
Total Vertical Weights 100
Tolerance Margin 5
Financial Conditions
Condit ions Score
Negative Net Worth CC
Final Weighting
EMIS Benchmark Score 90
EMIS Trend Score 10
EMIS Credit Analyt ics - EMIS Credit Analyt ics Assumptions
EMIS Business Report Generated on 2016-06-02
Copyright copy 2015 EMIS all rights reserved A Euromoney Institutional Investor company Page 43 of 48
Ret urn on Asset s (ROA)
An indicator of how profitable a company is relative to its total assets ROA gives an
idea as to how efficient management is at using its assets to generate earnings
Calculated by dividing a companys annual earnings by its total assets
Calculated as Net prof it T ot al Asset
Ret urn on Equit y (ROE)
A measure of a corporations profitability that reveals how much profit a company
generates with the money shareholders have invested
Calculated as Net prof it Shareholders equit y
Ret urn on Sales (ROS)
A ratio widely used to evaluate a companys operational efficiency ROS is also
known as a firms operating profit margin
Calculated as Net Prof it Net Sales Revenue
Bookvalue
A companys common stock equity as it appears on a balance sheet equal to total
assets minus liabilities preferred stock and intangible assets such as goodwill
Current Rat io
A liquidity ratio that measures a companys ability to pay short-term obligations
Calculated as Current Asset sCurrent Liabilit ies
Quick rat io
An indicator of a companys short-term liquidity The quick ratio measures a
companys ability to meet its short-term obligations with its most liquid assets The
higher the quick ratio the better the position of the company
Calculated as (Current Asset s-Invent ories)Current Liabilit ies
Debt t o equit y
A measure of a companys financial leverage calculated by dividing its total
liabilities by stockholders equity It indicates what proportion of equity and debt the
company is using to finance its assets
Calculated as T ot al Liabilit iesShareholders Equit y
Debt t o t ot al asset s
A metric used to measure a companys financial risk by determining how much of
the companys assets have been financed by debt Calculated by adding short-term
and long-term debt and then dividing by the companys total assets
Calculated as Short T erm Debt s+Long T erm Debt sT ot al Asset s
Leverage rat io
Leverage ratio provide an indication of the long term solvency of the firm
Calculated as T ot al Asset sShareholders Equit y
Debt Ent erprise Value
This metric is equivalent to the payback period used by debtholders Calculated as
Debt Ent erprise Value
Market Capit alizat ionEBIT DA
Calculated as Market Capit alizat ionEBIT DA
Earning Bef ore Int erest s and T axes (EBIT )
Earning Before Interests and Taxes (EBIT)
EBIT DA
Earnings before interest taxes depreciation and amortization (EBITDA) is a non-
GAAP metric that can be used to evaluate a companys profitability Calculated as
Ent erprise valueNet Sales
Dividing the enterprise value of a firm by its sales or revenues is a way of
comparing firms in cyclical industries Calculated as Enterprise Value Net Sales
Revenue
Ent erprise valueGross income
Calculated as Enterprise value Gross income
Ent erprise valueT ot al Asset s
Calculated as Enterprise value Total Assets
EBIT DA Margin
A measurement that provides a clear view of the companyrsquos core profitability
Calculated as EBITDA Net Sales Revenue
T ot al Operat ing Revenue T rend
Calculated as Total Operating Revenue current year Total Operating Revenue
previous year
Gross Prof it T rend
Calculated in percentage as (Gross Prof it Current Year Gross Prof it
Previous Year) ndash 1
EBIT DA T rend
Calculated as EBITDA current year EBITDA previous year
Account s Receivables T rend
Calculated in percentage as T rade Account s Receivables current year
T rade Account Receivables previous year
Invent ory T rend
Calculated as Inventories current year Inventories previous year
Net Propert y Plant and Equipment (PPampE) T rend
Calculated as Net PPampE current year Net PPampE previous year
T ot al Asset s T rend
Calculated as Total Assets current year Total Assets previous year
Bookvalue T rend
Calculated as Bookvalue current year Bookvalue previous year
Shareholders Equit y T rend
Calculated as Shareholdersrsquo Equity current year Shareholdersrsquo Equity previous
year
Cash f rom Operat ions T rend
Calculated as Net Cash Flow from Operations current year Net Cash Flow from
Operations previous year
Capit al Expendit ures T rend
Calculated as CAPEX current year CAPEX previous year
Dividend per Share T rend
Calculated as Dividend value per (common) share current year Dividend value
per (common) share previous year
Cost t o Income Rat io
A key financial measure showing a bankrsquos cost in relation to its income Ratio is
calculated as Total Operational Cost Total Operational Income
Glossary
EMIS Business Report Generated on 2016-06-02
Copyright copy 2015 EMIS all rights reserved A Euromoney Institutional Investor company Page 44 of 48
EBIT DA = Operat ing Revenue - Operat ing Expenses (Depriciat ion and
Amort izat ion excluded)
Ent erprise Value EBIT DA
Enterprise Value EBITDA is the metric most used to measure how many years it
would take to pay back the investment
Ent erprise Value
A measure of a companys value often used as an alternative to straightforward
market capitalization EV is calculated as market cap plus debt minority interest
and preferred shares minus total cash and cash equivalents
Dooms day rat io
Calculated as Cash Current Liabilit ies
Long T erm Debt t o Capit al
A ratio showing the financial leverage of a firm calculated by dividing long-term
debt by the amount of capital available Calculated as Long t erm debt Long
t erm debt + Pref f ered St ock + Common St ock
Int erest Coverage Rat io
A ratio used to determine how easily a company can pay interest on outstanding
debt The interest coverage ratio is calculated by dividing a companys earnings
before interest and taxes (EBIT) of one period by the companys interest expenses of
the same period Calculated as EBIT Int erest expense
Cash Flow t o Debt
This coverage ratio compares a companys operating cash flow to its total debt
which for purposes of this ratio is defined as the sum of short-term borrowings the
current portion of long-term debt and long-term debt This ratio provides an
indication of a companys ability to cover total debt with its yearly cash flow from
operations The higher the percentage ratio the better the companys ability to carry
its total debt Calculates as Operat ing Cash Flow T ot al Debt
Ret urn on Capit al
A ratio that indicates the efficiency and profitability of a companys capital
investments Calculated as Net Income (Total Asset - Current Liabilities)
Gross Prof it Margin
A financial metric used to assess a firms financial health by revealing the
proportion of money left over from revenues after accounting for the cost of goods
sold Gross profit margin serves as the source for paying additional expenses and
future savings Calculated as (Net Sales Revenue - Cost of Goods Sold) Net
Sales Revenue
Operat ing Prof it Margin
A ratio used to measure a companys pricing strategy and operating efficiency
Calculated as Operat ing prof it Net sales
Account s Receivable T urnover
An accounting measure used to quantify a firms effectiveness in extending credit
as well as collecting debts The receivables turnover ratio is an activity ratio
measuring how efficiently a firm uses its assets Calculated as Net Sales
Revenue T rade Account s Receivable (Net )
Invent ory T urnover
A ratio showing how many times a companys inventory is sold and replaced over a
period Calculated as Sales Invent ory
Current asset t urnover
Calculated as Net Sales Revenue T ot al Current Asset
Ef f iciency Rat io
Calculated as Total non-interest expenses (Total net interest income + Total non-
interest income)
Loans t o Deposit s Rat io
A commonly used statistic for assessing a banks liquidity Calculated as Total
Loans Total Deposits
Liquid Asset s t o Deposit s Rat io
This ratio indicates extent of liquidity maintained by a bank for meeting the demand
made by the depositors Calculated as (Cash + Financial assets held for trading)
Total Deposits
Loans t o Asset Rat io
Calculated as Total Loans Total Assets
Net Int erest Income T rend
Calculated as Net Interest Income current year Net Interest Income previous year
Net Fee and Commission Income T rend
Calculated as Net Fee and Commission Income current year Net Fee and
Commission Income previous year
Loans and Advances t o Cust omers T rend
Calculated as Loans and Advances to Customers current year Loans and
Advances to Customers previous year
Deposit s f rom Cust omers T rend
Calculated as Deposits from Customers current year Deposits from Customers
previous year
Loss Rat io
This ratio indicates the average cost of insurance protection per each dollar of net
premiums earned during the period Calculated as Total Losses Incurred in Claims
Net Insurance Premium Revenue
Underwrit ing Expenses Rat io
This ratio measures operational efficiency in underwriting Calculated as
Underwriting expenses Net Insurance Premium Revenue
Policyholder Dividend Rat io
Calculated as Dividends Net Insurance Premium Revenue
Combined LossExpense Rat io
Calculated as Loss Ratio + Underwriting Expenses Ratio + Policyholder Dividend
Ratio When the combined ratio is under 100 underwriting results are
considered profitable when the combined ratio is over 100 underwriting results
are considered unprofitable
Ceded Premium Rat io
Calculated as Insurance Premium Ceded to Reinsurers Insurance Premium
Revenue
Net Premiums Earned T rend
Calculated as Net Insurance Premium Revenue current year Net Insurance
Premium Revenue previous year
Fees and Commissions T rend
Calculated as Net Fees and Commissions Income current year Net Fees and
Commissions Income previous year
Net Invest ment Income T rend
EMIS Business Report Generated on 2016-06-02
Copyright copy 2015 EMIS all rights reserved A Euromoney Institutional Investor company Page 45 of 48
Fixed-asset t urnover
This ratio is a rough measure of the productivity of a companys fixed assets
(property plant and equipment or PPampE) with respect to generating sales For most
companies their investment in fixed assets represents the single largest
component of their total assets This annual turnover ratio is designed to reflect a
companys efficiency in managing these significant assets Simply put the higher
the yearly turnover rate the better Calculated as Revenue Propert y Plant and
Equipment
Asset T urnover
The amount of sales generated for every dollars worth of assets It is calculated by
dividing sales in dollars by assets in dollars Calculated as Revenue Asset s
Revenue T rend
Calculated as (Net Sales Current Year Net Sales Previous Year)
Net Income T rend
Calculated as (Net Income Current Year Net Income Previous Year)
Operat ing Income T rend
Calculated as (Operat ing Income Current Year Operat ing Income
Previous year)
PriceBook Rat io
A ratio used to compare a stocks market value to its book value It is calculated by
dividing the current closing price of the stock by the latest years book value per
share Calculated as St ock price (T ot al Asset - Int angible asset s and
Liabilit ies)
PriceEarnings Rat io
A valuation ratio of a companys current share price compared to its per-share
earnings Calculated as Market value per share Earning per share EPS
Market capShareholder equit y
A financial ratio showing the premium which is included in the current market price
compared to the actual value of Shareholder equity of the company Calculated as
Market capit alizat ion Shareholders equit y
PriceEBIT Rat io
The PriceEBIT ratio is a market value indicator similar to the PE ratio which shows
the number of times the market price exceeds the earnings per share before the
effects of gross interest abnormal items and tax The PriceEBIT ratio is calculated
as follows Valuat ion price EBIT
T ot al Capit al Rat io
Calculated as T ot al capit al (T ier 1 and T ier 2) rat io = T ot al capit al (T ier 1
and T ier 2) Risk-adjust ed asset s
T ier 1 Rat io
Tier 1 capital is the core measure of a banks financial strength from a regulators
point of view It consists primarily of shareholders equity but may also include
preferred stock that is irredeemable and non-cumulative and retained earnings
Risk Weight ed Asset s
Risk weights are in five categories from zero to 100 per cent Those carrying a
zero weight include notes and coins gold matched by gold liabilities balances with
the Reserve Bank and commonwealth government securities with less than twelve
months to maturity Commonwealth government securities with more than twelve
months to maturity carry a 10 per cent risk weighting as do state government
securities Claims on other banks Australian local governments and public-sector
organisations other than those with corporate status or which operate
Calculated as Investment Income current year Investment Income previous year
Receivables Arising Out Of Direct Insurance Operat ions T rend
Calculated as Receivables Arising out of Direct Insurance Operations current year
Receivables Arising out of Direct Insurance Operations previous year
Operat ing ROA
An indicator that shows the type of net profit which is actually generated by business
effort Calculated as Operat ing Prof it (EBIT ) T ot al Asset s
Payables T urnover
An indicator that evaluates how fast a company pays off its creditors (suppliers)
Calculated as Purchases T rade Payables
Working Capit al T urnover
A measure that indicates how efficiently the company generates revenue with its
working capital Working capital is defined as current assets minus current liabilities
Calculated as Net Sales (T ot al Current Asset s ndash T ot al Current
Liabilit ies)
Working Capit al
A measure of a companyrsquos short term financial health Calculated as T ot al
Current Asset s ndash T ot al Current Liabilit ies
Cash Rat io
A measure of a companyrsquos liquidity in crisis situation Only highly marketable
securities and cash are included Calculated as (T ot al Cash and Cash
Equivalent s + Market able securit ies) T ot al Current Liabilit ies
Cash Flow f rom Operat ion Rat io
A measure of how well current liabilities are covered by the cash flow generated
from a companyrsquos operations Calculated as Net Cash Flow f rom Operat ing
Act ivit ies T ot al Current Liabilit ies
Debt Coverage
A measure that shows a companyrsquos ability to cover total debt with its yearly cash
flow from operations Calculated as Net Cash Flow f rom Operat ing Act ivit ies
T ot al Debt
Cash Flow t o Revenue
This ratio measures the amount of operating cash flow generated for each dollar of
revenue Calculated as Net Cash Flow f rom Operat ing Act ivit ies Net Sales
Revenue
Cash Ret urn on Asset s
This ratio measures the return of operating cash flow attributed to all providers of
capital Calculated as Net Cash Flow f rom Operat ing Act ivit ies T ot al
Asset s
Cash Ret urn on Equit y
This ratio measures the return of operating cash flow attributed to shareholders
Calculated as Net Cash Flow f rom Operat ing Act ivit ies T ot al
Shareholdersrsquo Equit y
Cash t o Income
This ratio measures the ability to generate cash from companyrsquos operations
Calculated as Net Cash Flow f rom Operat ing Act ivit ies Operat ing Prof it
(EBIT )
CashT ot al Asset s
Calculated as Cash and Cash Equivalent s T ot al Asset s
EMIS Business Report Generated on 2016-06-02
Copyright copy 2015 EMIS all rights reserved A Euromoney Institutional Investor company Page 46 of 48
commercially carry a 20 per cent risk weighting Loans secured by a mortgage
over residential property and with a loan-to-valuation of 80 per cent or less carry a
50 per cent risk weighting and loans to companies or individuals carry a 100 per
cent risk weighting
Market Cap Net cash
A ratio measure the market value of the company to the Net cash position of the
company Calculated as Market capit alizat ion (Cash and cash equivalent s
minus long-t erm debt )
Net Cash
Net cash is commonly used in evaluating a companys cash flow More generally
net cash can refer to the amount of cash remaining after a transaction has been
completed and all charges and deductions related to the transaction have been
subtracted Calculated as T ot al cash minus t ot al short t erm liabilit ies
Annualised Ret urn on Equit y (ROE)
Return on Equity ratio (ROE) converted into an annual basis
Annualised Ret urn on Asset s (ROA)
Return on Assets ratio (ROA) converted into an annual basis
Export Proport ion Rat io
The percentage figure of the proportion of the export revenue from the total sales
revenue of the company Calculated as Export revenue T ot al revenue
Net Debt
A metric that shows companys overall debt situation by netting the value of
financial liabilities with its cash and other similar liquid assets Calculated as
financial liabilities - cash and cash equivalents
EPS
The portion of a companys profit allocated to each outstanding share Calculated
as Net Profit Outstanding Shares
PE
A valuation ratio of a companys current share price compared to its per-share
earnings Calculated as Market value per share Earning per share EPS
Market Capit alizat ionNet Sales
Calculated as Market Capitalization Net Sales Revenue
Market Capit alizat ionGross income
Calculated as Market Capitalization Gross Profit
Market Capit alizat ionEBIT
Calculated as Market Capitalization EBIT
Market Capit alizat ionT ot al Asset s
Calculated as Market Capitalization Total Assets
ReceivablesT ot al asset s
Calculated as T rade Account s Receivable T ot al Asset s
Invent oriesT ot al asset s
Calculated as Invent ories T ot al Asset s
Fixed asset sT ot al asset s
Calculated as Non-current Asset s T ot al Asset s
Current Liabilit iesT ot al Liabilit ies
Calculated as T ot al Current Liabilit ies T ot al Liabilit ies
Salaries and Employee Benef it sNet sales
Calculated as Employee Benef it Expenses Net Sales Revenue
Administ rat ive ExpensesNet Sales
Calculated as Administ rat ive Expenses Net Sales Revenue
Depreciat ion and Amort izat ionNet sales
Calculated as Depreciat ion Amort izat ion and Impairment Charges Net
Sales Revenue
Int erest paidNet sales
Calculated as Int erest -t ype Expenses Net Sales Revenue
Income t axNet sales
Calculated as Income T ax Net Sales Revenue
Operat ing Cash Flow t o T ot al Cash Flow
Calculated as Net Cash Flow f rom Operat ing Act ivit ies Net
IncreaseDecrease in Cash and Cash Equivalent s
Cash Flow f rom Invest ing t o T ot al Cash Flow
Calculated as Net cash f low f rom (used in) invest ing act ivit ies Net
IncreaseDecrease in Cash and Cash Equivalent s
Cash f low f rom f inancing t o T ot al cash f low
Calculated as Net cash flow from (used in) financing activities Net
IncreaseDecrease in Cash and Cash Equivalents
Average Yie ld on Asset s
Calculated as T ot al Int erest Income T ot al Asset s
Disclaimer
Whilst EMIS attempts at all times to ensure the accuracy and reliability of the information it provides due to the vast quantity of processed data and the fact that some of
the third-party data cannot always be verified including information provided directly by the subject of the enquiry EMIS does not guarantee the correctness or the
effective delivery of the information and shall not be held responsible for any errors or omissions therein
The content and recommendations shall only be used as a reference in business decisions of EMIS clients and shall not be used for any other purposes EMIS and its
affiliates shall not be held liable for any loss of the clients arising out of its own business decisions whether or not the making of such decision has been referred to this
contentrecommendation
EMIS Business Report Generated on 2016-06-02
Copyright copy 2015 EMIS all rights reserved A Euromoney Institutional Investor company Page 47 of 48
EMIS Business Report Generated on 2016-06-02
Copyright copy 2015 EMIS all rights reserved A Euromoney Institutional Investor company Page 48 of 48
- Table of Contents
- Company Tear Sheet
-
- Contact Information
- NAICS Industry Classification
- Business description
- Basic Information
- EMIS Financial Score
- Share Price information
- Key Executives
- Ownership Details
- Subsidiaries and Affiliates
- Key Financial Highlights
- Financial Performance Charts
- Latest MampA and ECM Deals
- Top Competitors
-
- Financial Statements
-
- Annual Statements
- Interim Statements
- Ratios
- Multiples
-
- Company Documents
-
- Financial DocumentsAnnual Reports
- Corporate Actions
-
- News amp Reports
-
- News
- Reports
-
- MampA and ECM Deals
-
- EMIS DealWatch Deals
- EMIS DealWatch Intents
-
- EMIS Credit Analytics
-
- Summary
- EMIS Financial Score
- EMIS Benchmark Score
- EMIS Credit Quota
- Conclusions
- Company vs Industry Key Stats
- Company vs Industry Balance Sheet
- Company vs Industry Income Statement
- Company vs Industry Cash Flow
- EMIS Credit Analytics Assumptions
-
- Glossary
- Disclaimer
-
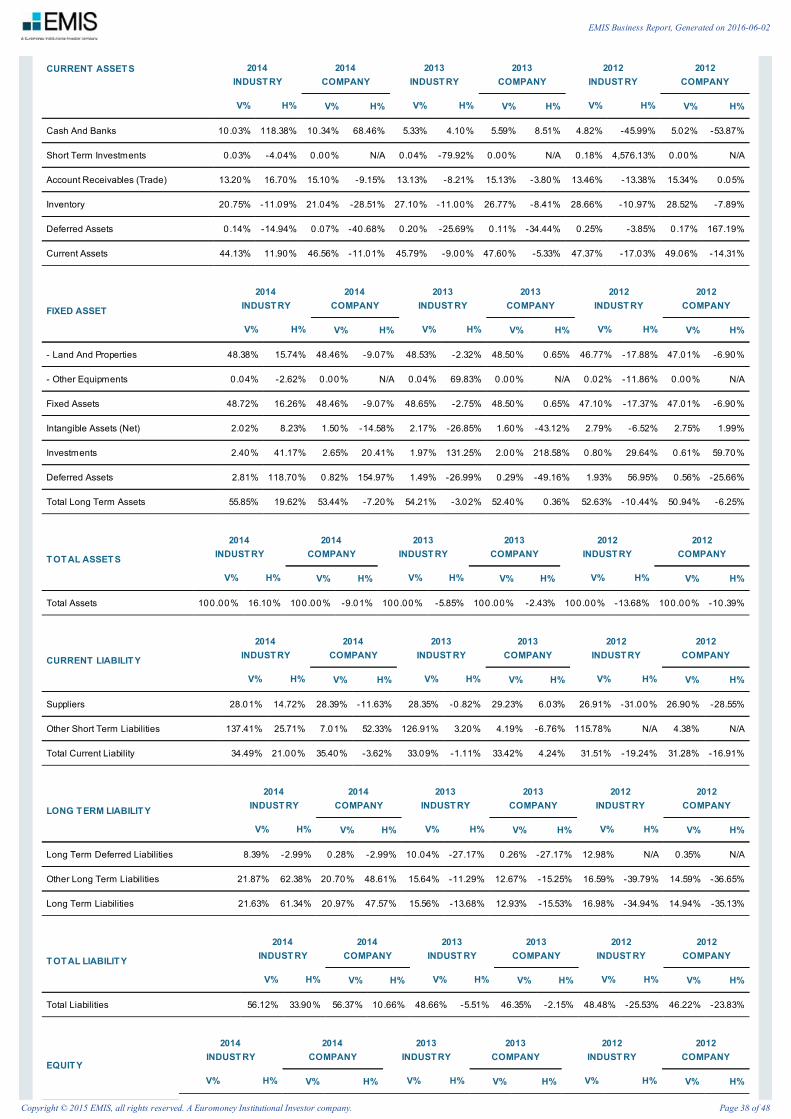
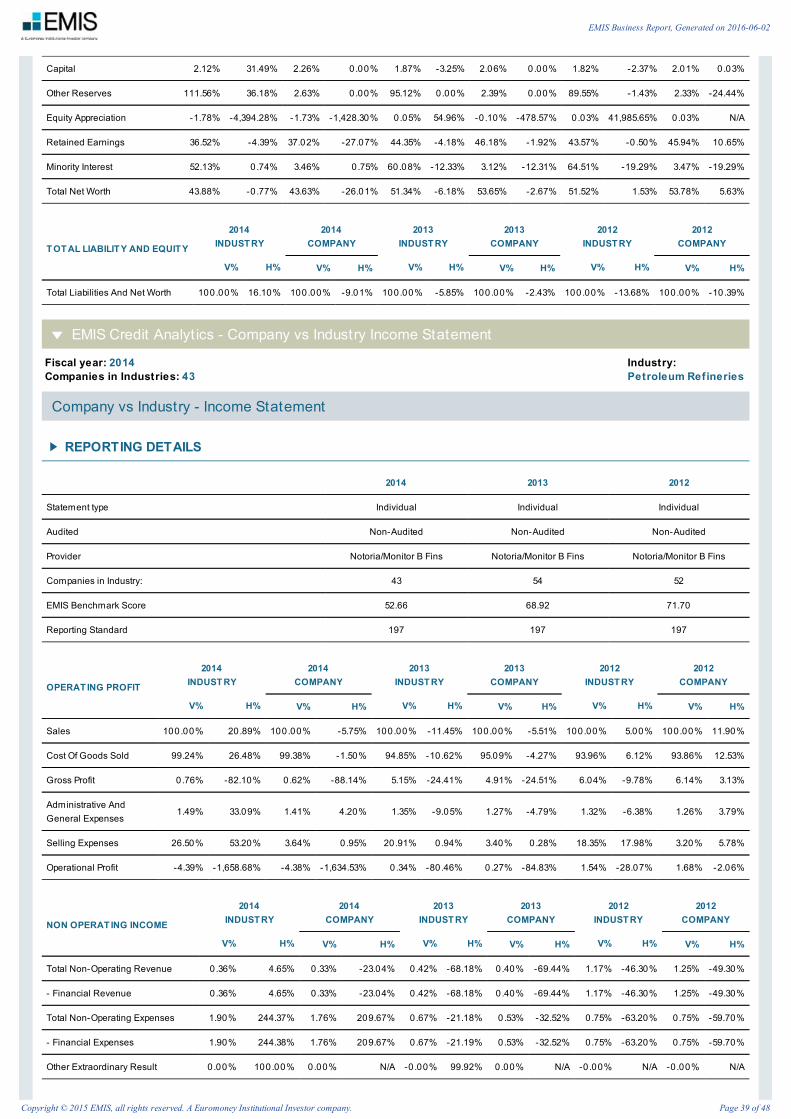
Fiscal year 2014Companies in Industries 43
IndustryPetroleum Refineries
Capital 212 3149 226 000 187 -325 206 000 182 -237 201 003
Other Reserves 11156 3618 263 000 9512 000 239 000 8955 -143 233 -2444
Equity Appreciation -178 -439428 -173 -142830 005 5496 -010 -47857 003 4198565 003 NA
Retained Earnings 3652 -439 3702 -2707 4435 -418 4618 -192 4357 -050 4594 1065
Minority Interest 5213 074 346 075 6008 -1233 312 -1231 6451 -1929 347 -1929
Total Net Worth 4388 -077 4363 -2601 5134 -618 5365 -267 5152 153 5378 563
T OT AL LIABILIT Y AND EQUIT Y
2014INDUST RY
2014COMPANY
2013INDUST RY
2013COMPANY
2012INDUST RY
2012COMPANY
V H V H V H V H V H V H
Total Liabilities And Net Worth 10000 1610 10000 -901 10000 -585 10000 -243 10000 -1368 10000 -1039
EMIS Credit Analyt ics - Company vs Industry Income Statement
Company vs Industry - Income Statement
REPORTING DETAILS
2014 2013 2012
Statement type Individual Individual Individual
Audited Non-Audited Non-Audited Non-Audited
Provider NotoriaMonitor B Fins NotoriaMonitor B Fins NotoriaMonitor B Fins
Companies in Industry 43 54 52
EMIS Benchmark Score 5266 6892 7170
Reporting Standard 197 197 197
OPERAT ING PROFIT
2014INDUST RY
2014COMPANY
2013INDUST RY
2013COMPANY
2012INDUST RY
2012COMPANY
V H V H V H V H V H V H
Sales 10000 2089 10000 -575 10000 -1145 10000 -551 10000 500 10000 1190
Cost Of Goods Sold 9924 2648 9938 -150 9485 -1062 9509 -427 9396 612 9386 1253
Gross Profit 0 76 -8210 062 -8814 515 -2441 491 -2451 604 -978 614 313
Administrative AndGeneral Expenses
149 3309 141 420 135 -905 127 -479 132 -638 126 379
Selling Expenses 2650 5320 364 095 2091 094 340 028 1835 1798 320 578
Operational Profit -439 -165868 -438 -163453 034 -8046 027 -8483 154 -2807 168 -206
NON OPERAT ING INCOME
2014INDUST RY
2014COMPANY
2013INDUST RY
2013COMPANY
2012INDUST RY
2012COMPANY
V H V H V H V H V H V H
Total Non-Operating Revenue 036 465 033 -2304 042 -6818 040 -6944 117 -4630 125 -4930
- Financial Revenue 036 465 033 -2304 042 -6818 040 -6944 117 -4630 125 -4930
Total Non-Operating Expenses 190 24437 176 20967 067 -2118 053 -3252 075 -6320 075 -5970
- Financial Expenses 190 24438 176 20967 067 -2119 053 -3252 075 -6320 075 -5970
Other Extraordinary Result 0 00 10000 000 NA -000 9992 000 NA -000 NA -000 NA
EMIS Business Report Generated on 2016-06-02
Copyright copy 2015 EMIS all rights reserved A Euromoney Institutional Investor company Page 39 of 48
Fiscal year 2014Companies in Industries 43
IndustryPetroleum Refineries
Profit Before Income Taxes -594 -909715 -580 -407834 008 -9639 014 -9402 196 -1306 217 -601
T AXES AND OT HERS
2014INDUST RY
2014COMPANY
2013INDUST RY
2013COMPANY
2012INDUST RY
2012COMPANY
V H V H V H V H V H V H
Extraordinary Income (Charges) 0 02 8819 005 4250 002 NA 004 NA 000 -10000 000 NA
Changes Due To Consolidation 027 -8018 002 -8023 162 -5086 008 -5086 292 -4973 014 -4977
Income Tax -0 74 -468549 -039 -72388 -002 7245 006 -8524 -006 -11275 038 -4155
NET PROFIT
2014INDUST RY
2014COMPANY
2013INDUST RY
2013COMPANY
2012INDUST RY
2012COMPANY
V H V H V H V H V H V H
Net Income -519 -406205 -540 -340170 016 -9342 015 -9249 213 544 194 -078
EMIS Credit Analyt ics - Company vs Industry Cash Flow
Company vs Industry - Cash Flow
REPORTING DETAILS
2014 2013 2012
Statement type Individual Individual Individual
Audited Non-Audited Non-Audited Non-Audited
Provider NotoriaMonitor B Fins NotoriaMonitor B Fins NotoriaMonitor B Fins
Companies in Industry 43 54 52
EMIS Benchmark Score 5266 6892 7170
Reporting Standard 197 197 197
CASH OPENING BALANCE
2014INDUST RY
2014COMPANY
2013INDUST RY
2013COMPANY
2012INDUST RY
2012COMPANY
V H V H V H V H V H V H
Initial Cash 222 410 267 851 257 -4599 232 -5387 422 9240 474 8565
CASH FROM SALES
2014INDUST RY
2014COMPANY
2013INDUST RY
2013COMPANY
2012INDUST RY
2012COMPANY
V H V H V H V H V H V H
Net Sales 10000 2089 10000 -575 10000 -1145 10000 -551 10000 500 10000 1190
+- Trade AccountsReceivable
-0 91 -28672 066 13160 059 -4685 027 779616 098 16969 -000 9978
Cash From Sales 9909 1908 10066 -539 10059 -1179 10027 -525 10098 763 10000 1377
CASH FOR PRODUCT ION
2014INDUST RY
2014COMPANY
2013INDUST RY
2013COMPANY
2012INDUST RY
2012COMPANY
V H V H V H V H V H V H
(-) Sales Cost -9924 -2648 -9938 150 -9485 1062 -9509 427 -9396 -612 -9386 -1253
(-) (Inc) Inventory 125 -1020 364 21062 168 -1077 111 -183 167 13866 106 12570
(+) (Inc) Suppliers 174 188875 -162 -30445 -012 9818 075 11510 -572 -26577 -468 -25767
EMIS Business Report Generated on 2016-06-02
Copyright copy 2015 EMIS all rights reserved A Euromoney Institutional Investor company Page 40 of 48
Cash For Production -9625 -2474 -9736 159 -9328 1572 -9324 962 -9801 -961 -9748 -1525
CASH FOR OPERAT ING
2014INDUST RY
2014COMPANY
2013INDUST RY
2013COMPANY
2012INDUST RY
2012COMPANY
V H V H V H V H V H V H
(-) Administrative Expenses -149 -3309 -141 -420 -135 905 -127 479 -132 638 -126 -379
+- Other Operating Results -0 00 -12524 000 NA 001 NA 000 NA 000 NA 000 NA
(-) Selling Expenses -2650 -5320 -364 -095 -2091 -094 -340 -028 -1835 -1798 -320 -578
(-) Period Income Taxes 074 468549 039 72388 002 -7245 -006 8524 006 11275 -038 4155
(+) (Inc) Taxes Payable 002 69344 000 NA -000 -14351 000 NA 001 17119 000 NA
(-) (Inc) Labor EstimatesAnd Provision
-0 12 9215 -000 9200 -189 -12719 -004 -12717 614 184104751 015 NA
Cash For Operation -2736 -3712 -466 794 -2413 -5873 -477 379 -1346 2282 -469 405
OPERAT IONAL CASHFLOW
2014INDUST RY
2014COMPANY
2013INDUST RY
2013COMPANY
2012INDUST RY
2012COMPANY
V H V H V H V H V H V H
Net Operating Cashflow -2453 -7631 -137 -15709 -1682 -4202 225 19816 -1049 1952 -217 -3750
INVEST MENT S IN ASSET S
2014INDUST RY
2014COMPANY
2013INDUST RY
2013COMPANY
2012INDUST RY
2012COMPANY
V H V H V H V H V H V H
(-) (Inc) Net Fixed Assets -329 -67408 210 151250 069 -8689 -014 -10872 468 25487 152 12255
(ndash) (Inc) Investments -0 34 2746 -020 7025 -056 -47405 -062 -48471 -009 -10215 -010 -10826
FREE CASHFLOW
2014INDUST RY
2014COMPANY
2013INDUST RY
2013COMPANY
2012INDUST RY
2012COMPANY
V H V H V H V H V H V H
Free Cashflow -2816 -10396 054 -6596 -1669 -15077 150 28813 -589 5095 -075 -33837
FINANCIAL
2014INDUST RY
2014COMPANY
2013INDUST RY
2013COMPANY
2012INDUST RY
2012COMPANY
V H V H V H V H V H V H
(-) Financial Expenses -154 -65083 -143 -92333 -025 -15241 -013 -12496 042 20392 050 -1713
Cashflow After Financial Costs -2969 -11196 -089 -16127 -1694 -17395 136 60823 -547 5391 -025 -12770
(+) (Inc) Debt Short Term -000 9949 000 NA -000 -21237 000 NA 000 10091 000 NA
(+) (Inc) Debt Long Term 002 69344 000 NA -000 -14351 000 NA 001 17119 000 NA
Cashflow After FinancialExpenses
-2968 -11175 -089 -16127 -1694 -17455 136 60823 -546 5512 -025 -12770
CASHFLOW
2014INDUST RY
2014COMPANY
2013INDUST RY
2013COMPANY
2012INDUST RY
2012COMPANY
V H V H V H V H V H V H
(-) Dividends 503 42726 -126 -4528 -186 682 -082 -1139 -176 -73580 -069 -52834
(-) Other Expenses 002 8819 005 4250 002 NA 004 NA 000 -10000 000 NA
(-) Other Current Debtors 000 NA 000 NA 000 NA 000 NA 000 NA 000 NA
(-) Other Current Assets 002 -7807 002 -2258 011 361835 003 15505 000 10702 -005 -48602
(-) Long-Term AccountsReceivable
000 NA 000 NA 000 NA 000 NA 000 NA 000 NA
EMIS Business Report Generated on 2016-06-02
Copyright copy 2015 EMIS all rights reserved A Euromoney Institutional Investor company Page 41 of 48
(-)(Inc) Deferred And OtherLong Term Assets
-0 72 -37515 -022 -26027 032 11570 013 4240 -178 -88060 008 14351
(-) (Inc) Other Long TermLiabilities
406 56718 294 37011 -105 8205 -103 7364 -518 -37893 -368 -40951
(+) Inflation Adjustmentst Non Recurring Incomes
000 NA 000 NA 000 NA 000 NA 000 NA 000 NA
(+) (Inc) Other AccountsPayable
115 218744 105 82115 -007 -10274 -014 -10676 216 2710149 191 NA
(+) Extraordinary Income Consolidation
027 -8018 002 -8023 162 -5085 008 -5057 292 -4974 014 -5006
(-) Intangible Goods -007 -12244 011 -8077 040 29906 055 230557 009 12060 -002 8712
Complementary Cash-Flow 976 240248 271 31907 -051 8725 -117 5210 -356 -14616 -230 -28078
Net Cash Generation -1992 -3796 183 77289 -1745 -7131 020 10729 -902 -10194 -255 -21675
Ending Cash -1770 -4381 449 6846 -1488 -17434 251 851 -480 -11112 219 -5387
EMIS Business Report Generated on 2016-06-02
Copyright copy 2015 EMIS all rights reserved A Euromoney Institutional Investor company Page 42 of 48
Score Scale
Financial ScaleFinancial Model has 8 risk categories
A - Very Low RiskAA - Low RiskBB - Moderate Low RiskB - Below Average RiskCC - Above Average RiskC - Moderate High RiskD - High Risk E - Very High Risk
Risk Profile
High RiskHigh Risk - used when the loan amounts are relatively high and have a longrepayment period A loss in the Credit would seriously affect the companyresults Commercial credit with maturity exceeding 36 months
A loss in the Credit would seriously affect the results Bank credited to morethan 36 months
Vertical Weighting
Pampl
Sales Growth 12
Operating Profit 12
Net Profit 12
Sub t ot al 36
Balance
Days Receivables 12
Days Inventory 10
Current Ratio 8
Indebtness 8
Indebtednesssales 8
Balance Sub T ot al 46
Cash Flow
Cash From Sales 2
Cash For Production 2
Cash For Operations 2
Operating Cash Generation 5
Free Cash Flow 3
Cash Flow After Fin Ex 2
Cash Flow After Fin Result 2
Reduction In Debt 0
Cash Flow Sub T ot al 18
Total Vertical Weights 100
Tolerance Margin 5
Financial Conditions
Condit ions Score
Negative Net Worth CC
Final Weighting
EMIS Benchmark Score 90
EMIS Trend Score 10
EMIS Credit Analyt ics - EMIS Credit Analyt ics Assumptions
EMIS Business Report Generated on 2016-06-02
Copyright copy 2015 EMIS all rights reserved A Euromoney Institutional Investor company Page 43 of 48
Ret urn on Asset s (ROA)
An indicator of how profitable a company is relative to its total assets ROA gives an
idea as to how efficient management is at using its assets to generate earnings
Calculated by dividing a companys annual earnings by its total assets
Calculated as Net prof it T ot al Asset
Ret urn on Equit y (ROE)
A measure of a corporations profitability that reveals how much profit a company
generates with the money shareholders have invested
Calculated as Net prof it Shareholders equit y
Ret urn on Sales (ROS)
A ratio widely used to evaluate a companys operational efficiency ROS is also
known as a firms operating profit margin
Calculated as Net Prof it Net Sales Revenue
Bookvalue
A companys common stock equity as it appears on a balance sheet equal to total
assets minus liabilities preferred stock and intangible assets such as goodwill
Current Rat io
A liquidity ratio that measures a companys ability to pay short-term obligations
Calculated as Current Asset sCurrent Liabilit ies
Quick rat io
An indicator of a companys short-term liquidity The quick ratio measures a
companys ability to meet its short-term obligations with its most liquid assets The
higher the quick ratio the better the position of the company
Calculated as (Current Asset s-Invent ories)Current Liabilit ies
Debt t o equit y
A measure of a companys financial leverage calculated by dividing its total
liabilities by stockholders equity It indicates what proportion of equity and debt the
company is using to finance its assets
Calculated as T ot al Liabilit iesShareholders Equit y
Debt t o t ot al asset s
A metric used to measure a companys financial risk by determining how much of
the companys assets have been financed by debt Calculated by adding short-term
and long-term debt and then dividing by the companys total assets
Calculated as Short T erm Debt s+Long T erm Debt sT ot al Asset s
Leverage rat io
Leverage ratio provide an indication of the long term solvency of the firm
Calculated as T ot al Asset sShareholders Equit y
Debt Ent erprise Value
This metric is equivalent to the payback period used by debtholders Calculated as
Debt Ent erprise Value
Market Capit alizat ionEBIT DA
Calculated as Market Capit alizat ionEBIT DA
Earning Bef ore Int erest s and T axes (EBIT )
Earning Before Interests and Taxes (EBIT)
EBIT DA
Earnings before interest taxes depreciation and amortization (EBITDA) is a non-
GAAP metric that can be used to evaluate a companys profitability Calculated as
Ent erprise valueNet Sales
Dividing the enterprise value of a firm by its sales or revenues is a way of
comparing firms in cyclical industries Calculated as Enterprise Value Net Sales
Revenue
Ent erprise valueGross income
Calculated as Enterprise value Gross income
Ent erprise valueT ot al Asset s
Calculated as Enterprise value Total Assets
EBIT DA Margin
A measurement that provides a clear view of the companyrsquos core profitability
Calculated as EBITDA Net Sales Revenue
T ot al Operat ing Revenue T rend
Calculated as Total Operating Revenue current year Total Operating Revenue
previous year
Gross Prof it T rend
Calculated in percentage as (Gross Prof it Current Year Gross Prof it
Previous Year) ndash 1
EBIT DA T rend
Calculated as EBITDA current year EBITDA previous year
Account s Receivables T rend
Calculated in percentage as T rade Account s Receivables current year
T rade Account Receivables previous year
Invent ory T rend
Calculated as Inventories current year Inventories previous year
Net Propert y Plant and Equipment (PPampE) T rend
Calculated as Net PPampE current year Net PPampE previous year
T ot al Asset s T rend
Calculated as Total Assets current year Total Assets previous year
Bookvalue T rend
Calculated as Bookvalue current year Bookvalue previous year
Shareholders Equit y T rend
Calculated as Shareholdersrsquo Equity current year Shareholdersrsquo Equity previous
year
Cash f rom Operat ions T rend
Calculated as Net Cash Flow from Operations current year Net Cash Flow from
Operations previous year
Capit al Expendit ures T rend
Calculated as CAPEX current year CAPEX previous year
Dividend per Share T rend
Calculated as Dividend value per (common) share current year Dividend value
per (common) share previous year
Cost t o Income Rat io
A key financial measure showing a bankrsquos cost in relation to its income Ratio is
calculated as Total Operational Cost Total Operational Income
Glossary
EMIS Business Report Generated on 2016-06-02
Copyright copy 2015 EMIS all rights reserved A Euromoney Institutional Investor company Page 44 of 48
EBIT DA = Operat ing Revenue - Operat ing Expenses (Depriciat ion and
Amort izat ion excluded)
Ent erprise Value EBIT DA
Enterprise Value EBITDA is the metric most used to measure how many years it
would take to pay back the investment
Ent erprise Value
A measure of a companys value often used as an alternative to straightforward
market capitalization EV is calculated as market cap plus debt minority interest
and preferred shares minus total cash and cash equivalents
Dooms day rat io
Calculated as Cash Current Liabilit ies
Long T erm Debt t o Capit al
A ratio showing the financial leverage of a firm calculated by dividing long-term
debt by the amount of capital available Calculated as Long t erm debt Long
t erm debt + Pref f ered St ock + Common St ock
Int erest Coverage Rat io
A ratio used to determine how easily a company can pay interest on outstanding
debt The interest coverage ratio is calculated by dividing a companys earnings
before interest and taxes (EBIT) of one period by the companys interest expenses of
the same period Calculated as EBIT Int erest expense
Cash Flow t o Debt
This coverage ratio compares a companys operating cash flow to its total debt
which for purposes of this ratio is defined as the sum of short-term borrowings the
current portion of long-term debt and long-term debt This ratio provides an
indication of a companys ability to cover total debt with its yearly cash flow from
operations The higher the percentage ratio the better the companys ability to carry
its total debt Calculates as Operat ing Cash Flow T ot al Debt
Ret urn on Capit al
A ratio that indicates the efficiency and profitability of a companys capital
investments Calculated as Net Income (Total Asset - Current Liabilities)
Gross Prof it Margin
A financial metric used to assess a firms financial health by revealing the
proportion of money left over from revenues after accounting for the cost of goods
sold Gross profit margin serves as the source for paying additional expenses and
future savings Calculated as (Net Sales Revenue - Cost of Goods Sold) Net
Sales Revenue
Operat ing Prof it Margin
A ratio used to measure a companys pricing strategy and operating efficiency
Calculated as Operat ing prof it Net sales
Account s Receivable T urnover
An accounting measure used to quantify a firms effectiveness in extending credit
as well as collecting debts The receivables turnover ratio is an activity ratio
measuring how efficiently a firm uses its assets Calculated as Net Sales
Revenue T rade Account s Receivable (Net )
Invent ory T urnover
A ratio showing how many times a companys inventory is sold and replaced over a
period Calculated as Sales Invent ory
Current asset t urnover
Calculated as Net Sales Revenue T ot al Current Asset
Ef f iciency Rat io
Calculated as Total non-interest expenses (Total net interest income + Total non-
interest income)
Loans t o Deposit s Rat io
A commonly used statistic for assessing a banks liquidity Calculated as Total
Loans Total Deposits
Liquid Asset s t o Deposit s Rat io
This ratio indicates extent of liquidity maintained by a bank for meeting the demand
made by the depositors Calculated as (Cash + Financial assets held for trading)
Total Deposits
Loans t o Asset Rat io
Calculated as Total Loans Total Assets
Net Int erest Income T rend
Calculated as Net Interest Income current year Net Interest Income previous year
Net Fee and Commission Income T rend
Calculated as Net Fee and Commission Income current year Net Fee and
Commission Income previous year
Loans and Advances t o Cust omers T rend
Calculated as Loans and Advances to Customers current year Loans and
Advances to Customers previous year
Deposit s f rom Cust omers T rend
Calculated as Deposits from Customers current year Deposits from Customers
previous year
Loss Rat io
This ratio indicates the average cost of insurance protection per each dollar of net
premiums earned during the period Calculated as Total Losses Incurred in Claims
Net Insurance Premium Revenue
Underwrit ing Expenses Rat io
This ratio measures operational efficiency in underwriting Calculated as
Underwriting expenses Net Insurance Premium Revenue
Policyholder Dividend Rat io
Calculated as Dividends Net Insurance Premium Revenue
Combined LossExpense Rat io
Calculated as Loss Ratio + Underwriting Expenses Ratio + Policyholder Dividend
Ratio When the combined ratio is under 100 underwriting results are
considered profitable when the combined ratio is over 100 underwriting results
are considered unprofitable
Ceded Premium Rat io
Calculated as Insurance Premium Ceded to Reinsurers Insurance Premium
Revenue
Net Premiums Earned T rend
Calculated as Net Insurance Premium Revenue current year Net Insurance
Premium Revenue previous year
Fees and Commissions T rend
Calculated as Net Fees and Commissions Income current year Net Fees and
Commissions Income previous year
Net Invest ment Income T rend
EMIS Business Report Generated on 2016-06-02
Copyright copy 2015 EMIS all rights reserved A Euromoney Institutional Investor company Page 45 of 48
Fixed-asset t urnover
This ratio is a rough measure of the productivity of a companys fixed assets
(property plant and equipment or PPampE) with respect to generating sales For most
companies their investment in fixed assets represents the single largest
component of their total assets This annual turnover ratio is designed to reflect a
companys efficiency in managing these significant assets Simply put the higher
the yearly turnover rate the better Calculated as Revenue Propert y Plant and
Equipment
Asset T urnover
The amount of sales generated for every dollars worth of assets It is calculated by
dividing sales in dollars by assets in dollars Calculated as Revenue Asset s
Revenue T rend
Calculated as (Net Sales Current Year Net Sales Previous Year)
Net Income T rend
Calculated as (Net Income Current Year Net Income Previous Year)
Operat ing Income T rend
Calculated as (Operat ing Income Current Year Operat ing Income
Previous year)
PriceBook Rat io
A ratio used to compare a stocks market value to its book value It is calculated by
dividing the current closing price of the stock by the latest years book value per
share Calculated as St ock price (T ot al Asset - Int angible asset s and
Liabilit ies)
PriceEarnings Rat io
A valuation ratio of a companys current share price compared to its per-share
earnings Calculated as Market value per share Earning per share EPS
Market capShareholder equit y
A financial ratio showing the premium which is included in the current market price
compared to the actual value of Shareholder equity of the company Calculated as
Market capit alizat ion Shareholders equit y
PriceEBIT Rat io
The PriceEBIT ratio is a market value indicator similar to the PE ratio which shows
the number of times the market price exceeds the earnings per share before the
effects of gross interest abnormal items and tax The PriceEBIT ratio is calculated
as follows Valuat ion price EBIT
T ot al Capit al Rat io
Calculated as T ot al capit al (T ier 1 and T ier 2) rat io = T ot al capit al (T ier 1
and T ier 2) Risk-adjust ed asset s
T ier 1 Rat io
Tier 1 capital is the core measure of a banks financial strength from a regulators
point of view It consists primarily of shareholders equity but may also include
preferred stock that is irredeemable and non-cumulative and retained earnings
Risk Weight ed Asset s
Risk weights are in five categories from zero to 100 per cent Those carrying a
zero weight include notes and coins gold matched by gold liabilities balances with
the Reserve Bank and commonwealth government securities with less than twelve
months to maturity Commonwealth government securities with more than twelve
months to maturity carry a 10 per cent risk weighting as do state government
securities Claims on other banks Australian local governments and public-sector
organisations other than those with corporate status or which operate
Calculated as Investment Income current year Investment Income previous year
Receivables Arising Out Of Direct Insurance Operat ions T rend
Calculated as Receivables Arising out of Direct Insurance Operations current year
Receivables Arising out of Direct Insurance Operations previous year
Operat ing ROA
An indicator that shows the type of net profit which is actually generated by business
effort Calculated as Operat ing Prof it (EBIT ) T ot al Asset s
Payables T urnover
An indicator that evaluates how fast a company pays off its creditors (suppliers)
Calculated as Purchases T rade Payables
Working Capit al T urnover
A measure that indicates how efficiently the company generates revenue with its
working capital Working capital is defined as current assets minus current liabilities
Calculated as Net Sales (T ot al Current Asset s ndash T ot al Current
Liabilit ies)
Working Capit al
A measure of a companyrsquos short term financial health Calculated as T ot al
Current Asset s ndash T ot al Current Liabilit ies
Cash Rat io
A measure of a companyrsquos liquidity in crisis situation Only highly marketable
securities and cash are included Calculated as (T ot al Cash and Cash
Equivalent s + Market able securit ies) T ot al Current Liabilit ies
Cash Flow f rom Operat ion Rat io
A measure of how well current liabilities are covered by the cash flow generated
from a companyrsquos operations Calculated as Net Cash Flow f rom Operat ing
Act ivit ies T ot al Current Liabilit ies
Debt Coverage
A measure that shows a companyrsquos ability to cover total debt with its yearly cash
flow from operations Calculated as Net Cash Flow f rom Operat ing Act ivit ies
T ot al Debt
Cash Flow t o Revenue
This ratio measures the amount of operating cash flow generated for each dollar of
revenue Calculated as Net Cash Flow f rom Operat ing Act ivit ies Net Sales
Revenue
Cash Ret urn on Asset s
This ratio measures the return of operating cash flow attributed to all providers of
capital Calculated as Net Cash Flow f rom Operat ing Act ivit ies T ot al
Asset s
Cash Ret urn on Equit y
This ratio measures the return of operating cash flow attributed to shareholders
Calculated as Net Cash Flow f rom Operat ing Act ivit ies T ot al
Shareholdersrsquo Equit y
Cash t o Income
This ratio measures the ability to generate cash from companyrsquos operations
Calculated as Net Cash Flow f rom Operat ing Act ivit ies Operat ing Prof it
(EBIT )
CashT ot al Asset s
Calculated as Cash and Cash Equivalent s T ot al Asset s
EMIS Business Report Generated on 2016-06-02
Copyright copy 2015 EMIS all rights reserved A Euromoney Institutional Investor company Page 46 of 48
commercially carry a 20 per cent risk weighting Loans secured by a mortgage
over residential property and with a loan-to-valuation of 80 per cent or less carry a
50 per cent risk weighting and loans to companies or individuals carry a 100 per
cent risk weighting
Market Cap Net cash
A ratio measure the market value of the company to the Net cash position of the
company Calculated as Market capit alizat ion (Cash and cash equivalent s
minus long-t erm debt )
Net Cash
Net cash is commonly used in evaluating a companys cash flow More generally
net cash can refer to the amount of cash remaining after a transaction has been
completed and all charges and deductions related to the transaction have been
subtracted Calculated as T ot al cash minus t ot al short t erm liabilit ies
Annualised Ret urn on Equit y (ROE)
Return on Equity ratio (ROE) converted into an annual basis
Annualised Ret urn on Asset s (ROA)
Return on Assets ratio (ROA) converted into an annual basis
Export Proport ion Rat io
The percentage figure of the proportion of the export revenue from the total sales
revenue of the company Calculated as Export revenue T ot al revenue
Net Debt
A metric that shows companys overall debt situation by netting the value of
financial liabilities with its cash and other similar liquid assets Calculated as
financial liabilities - cash and cash equivalents
EPS
The portion of a companys profit allocated to each outstanding share Calculated
as Net Profit Outstanding Shares
PE
A valuation ratio of a companys current share price compared to its per-share
earnings Calculated as Market value per share Earning per share EPS
Market Capit alizat ionNet Sales
Calculated as Market Capitalization Net Sales Revenue
Market Capit alizat ionGross income
Calculated as Market Capitalization Gross Profit
Market Capit alizat ionEBIT
Calculated as Market Capitalization EBIT
Market Capit alizat ionT ot al Asset s
Calculated as Market Capitalization Total Assets
ReceivablesT ot al asset s
Calculated as T rade Account s Receivable T ot al Asset s
Invent oriesT ot al asset s
Calculated as Invent ories T ot al Asset s
Fixed asset sT ot al asset s
Calculated as Non-current Asset s T ot al Asset s
Current Liabilit iesT ot al Liabilit ies
Calculated as T ot al Current Liabilit ies T ot al Liabilit ies
Salaries and Employee Benef it sNet sales
Calculated as Employee Benef it Expenses Net Sales Revenue
Administ rat ive ExpensesNet Sales
Calculated as Administ rat ive Expenses Net Sales Revenue
Depreciat ion and Amort izat ionNet sales
Calculated as Depreciat ion Amort izat ion and Impairment Charges Net
Sales Revenue
Int erest paidNet sales
Calculated as Int erest -t ype Expenses Net Sales Revenue
Income t axNet sales
Calculated as Income T ax Net Sales Revenue
Operat ing Cash Flow t o T ot al Cash Flow
Calculated as Net Cash Flow f rom Operat ing Act ivit ies Net
IncreaseDecrease in Cash and Cash Equivalent s
Cash Flow f rom Invest ing t o T ot al Cash Flow
Calculated as Net cash f low f rom (used in) invest ing act ivit ies Net
IncreaseDecrease in Cash and Cash Equivalent s
Cash f low f rom f inancing t o T ot al cash f low
Calculated as Net cash flow from (used in) financing activities Net
IncreaseDecrease in Cash and Cash Equivalents
Average Yie ld on Asset s
Calculated as T ot al Int erest Income T ot al Asset s
Disclaimer
Whilst EMIS attempts at all times to ensure the accuracy and reliability of the information it provides due to the vast quantity of processed data and the fact that some of
the third-party data cannot always be verified including information provided directly by the subject of the enquiry EMIS does not guarantee the correctness or the
effective delivery of the information and shall not be held responsible for any errors or omissions therein
The content and recommendations shall only be used as a reference in business decisions of EMIS clients and shall not be used for any other purposes EMIS and its
affiliates shall not be held liable for any loss of the clients arising out of its own business decisions whether or not the making of such decision has been referred to this
contentrecommendation
EMIS Business Report Generated on 2016-06-02
Copyright copy 2015 EMIS all rights reserved A Euromoney Institutional Investor company Page 47 of 48
EMIS Business Report Generated on 2016-06-02
Copyright copy 2015 EMIS all rights reserved A Euromoney Institutional Investor company Page 48 of 48
- Table of Contents
- Company Tear Sheet
-
- Contact Information
- NAICS Industry Classification
- Business description
- Basic Information
- EMIS Financial Score
- Share Price information
- Key Executives
- Ownership Details
- Subsidiaries and Affiliates
- Key Financial Highlights
- Financial Performance Charts
- Latest MampA and ECM Deals
- Top Competitors
-
- Financial Statements
-
- Annual Statements
- Interim Statements
- Ratios
- Multiples
-
- Company Documents
-
- Financial DocumentsAnnual Reports
- Corporate Actions
-
- News amp Reports
-
- News
- Reports
-
- MampA and ECM Deals
-
- EMIS DealWatch Deals
- EMIS DealWatch Intents
-
- EMIS Credit Analytics
-
- Summary
- EMIS Financial Score
- EMIS Benchmark Score
- EMIS Credit Quota
- Conclusions
- Company vs Industry Key Stats
- Company vs Industry Balance Sheet
- Company vs Industry Income Statement
- Company vs Industry Cash Flow
- EMIS Credit Analytics Assumptions
-
- Glossary
- Disclaimer
-
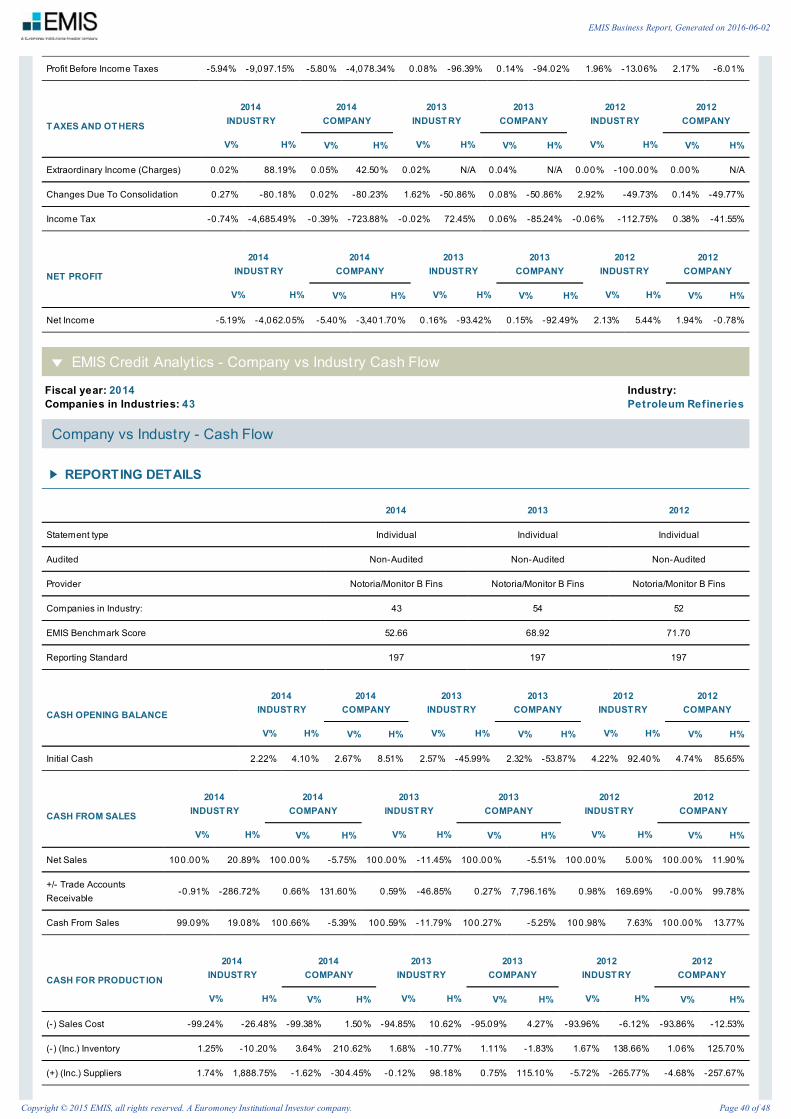
Fiscal year 2014Companies in Industries 43
IndustryPetroleum Refineries
Profit Before Income Taxes -594 -909715 -580 -407834 008 -9639 014 -9402 196 -1306 217 -601
T AXES AND OT HERS
2014INDUST RY
2014COMPANY
2013INDUST RY
2013COMPANY
2012INDUST RY
2012COMPANY
V H V H V H V H V H V H
Extraordinary Income (Charges) 0 02 8819 005 4250 002 NA 004 NA 000 -10000 000 NA
Changes Due To Consolidation 027 -8018 002 -8023 162 -5086 008 -5086 292 -4973 014 -4977
Income Tax -0 74 -468549 -039 -72388 -002 7245 006 -8524 -006 -11275 038 -4155
NET PROFIT
2014INDUST RY
2014COMPANY
2013INDUST RY
2013COMPANY
2012INDUST RY
2012COMPANY
V H V H V H V H V H V H
Net Income -519 -406205 -540 -340170 016 -9342 015 -9249 213 544 194 -078
EMIS Credit Analyt ics - Company vs Industry Cash Flow
Company vs Industry - Cash Flow
REPORTING DETAILS
2014 2013 2012
Statement type Individual Individual Individual
Audited Non-Audited Non-Audited Non-Audited
Provider NotoriaMonitor B Fins NotoriaMonitor B Fins NotoriaMonitor B Fins
Companies in Industry 43 54 52
EMIS Benchmark Score 5266 6892 7170
Reporting Standard 197 197 197
CASH OPENING BALANCE
2014INDUST RY
2014COMPANY
2013INDUST RY
2013COMPANY
2012INDUST RY
2012COMPANY
V H V H V H V H V H V H
Initial Cash 222 410 267 851 257 -4599 232 -5387 422 9240 474 8565
CASH FROM SALES
2014INDUST RY
2014COMPANY
2013INDUST RY
2013COMPANY
2012INDUST RY
2012COMPANY
V H V H V H V H V H V H
Net Sales 10000 2089 10000 -575 10000 -1145 10000 -551 10000 500 10000 1190
+- Trade AccountsReceivable
-0 91 -28672 066 13160 059 -4685 027 779616 098 16969 -000 9978
Cash From Sales 9909 1908 10066 -539 10059 -1179 10027 -525 10098 763 10000 1377
CASH FOR PRODUCT ION
2014INDUST RY
2014COMPANY
2013INDUST RY
2013COMPANY
2012INDUST RY
2012COMPANY
V H V H V H V H V H V H
(-) Sales Cost -9924 -2648 -9938 150 -9485 1062 -9509 427 -9396 -612 -9386 -1253
(-) (Inc) Inventory 125 -1020 364 21062 168 -1077 111 -183 167 13866 106 12570
(+) (Inc) Suppliers 174 188875 -162 -30445 -012 9818 075 11510 -572 -26577 -468 -25767
EMIS Business Report Generated on 2016-06-02
Copyright copy 2015 EMIS all rights reserved A Euromoney Institutional Investor company Page 40 of 48
Cash For Production -9625 -2474 -9736 159 -9328 1572 -9324 962 -9801 -961 -9748 -1525
CASH FOR OPERAT ING
2014INDUST RY
2014COMPANY
2013INDUST RY
2013COMPANY
2012INDUST RY
2012COMPANY
V H V H V H V H V H V H
(-) Administrative Expenses -149 -3309 -141 -420 -135 905 -127 479 -132 638 -126 -379
+- Other Operating Results -0 00 -12524 000 NA 001 NA 000 NA 000 NA 000 NA
(-) Selling Expenses -2650 -5320 -364 -095 -2091 -094 -340 -028 -1835 -1798 -320 -578
(-) Period Income Taxes 074 468549 039 72388 002 -7245 -006 8524 006 11275 -038 4155
(+) (Inc) Taxes Payable 002 69344 000 NA -000 -14351 000 NA 001 17119 000 NA
(-) (Inc) Labor EstimatesAnd Provision
-0 12 9215 -000 9200 -189 -12719 -004 -12717 614 184104751 015 NA
Cash For Operation -2736 -3712 -466 794 -2413 -5873 -477 379 -1346 2282 -469 405
OPERAT IONAL CASHFLOW
2014INDUST RY
2014COMPANY
2013INDUST RY
2013COMPANY
2012INDUST RY
2012COMPANY
V H V H V H V H V H V H
Net Operating Cashflow -2453 -7631 -137 -15709 -1682 -4202 225 19816 -1049 1952 -217 -3750
INVEST MENT S IN ASSET S
2014INDUST RY
2014COMPANY
2013INDUST RY
2013COMPANY
2012INDUST RY
2012COMPANY
V H V H V H V H V H V H
(-) (Inc) Net Fixed Assets -329 -67408 210 151250 069 -8689 -014 -10872 468 25487 152 12255
(ndash) (Inc) Investments -0 34 2746 -020 7025 -056 -47405 -062 -48471 -009 -10215 -010 -10826
FREE CASHFLOW
2014INDUST RY
2014COMPANY
2013INDUST RY
2013COMPANY
2012INDUST RY
2012COMPANY
V H V H V H V H V H V H
Free Cashflow -2816 -10396 054 -6596 -1669 -15077 150 28813 -589 5095 -075 -33837
FINANCIAL
2014INDUST RY
2014COMPANY
2013INDUST RY
2013COMPANY
2012INDUST RY
2012COMPANY
V H V H V H V H V H V H
(-) Financial Expenses -154 -65083 -143 -92333 -025 -15241 -013 -12496 042 20392 050 -1713
Cashflow After Financial Costs -2969 -11196 -089 -16127 -1694 -17395 136 60823 -547 5391 -025 -12770
(+) (Inc) Debt Short Term -000 9949 000 NA -000 -21237 000 NA 000 10091 000 NA
(+) (Inc) Debt Long Term 002 69344 000 NA -000 -14351 000 NA 001 17119 000 NA
Cashflow After FinancialExpenses
-2968 -11175 -089 -16127 -1694 -17455 136 60823 -546 5512 -025 -12770
CASHFLOW
2014INDUST RY
2014COMPANY
2013INDUST RY
2013COMPANY
2012INDUST RY
2012COMPANY
V H V H V H V H V H V H
(-) Dividends 503 42726 -126 -4528 -186 682 -082 -1139 -176 -73580 -069 -52834
(-) Other Expenses 002 8819 005 4250 002 NA 004 NA 000 -10000 000 NA
(-) Other Current Debtors 000 NA 000 NA 000 NA 000 NA 000 NA 000 NA
(-) Other Current Assets 002 -7807 002 -2258 011 361835 003 15505 000 10702 -005 -48602
(-) Long-Term AccountsReceivable
000 NA 000 NA 000 NA 000 NA 000 NA 000 NA
EMIS Business Report Generated on 2016-06-02
Copyright copy 2015 EMIS all rights reserved A Euromoney Institutional Investor company Page 41 of 48
(-)(Inc) Deferred And OtherLong Term Assets
-0 72 -37515 -022 -26027 032 11570 013 4240 -178 -88060 008 14351
(-) (Inc) Other Long TermLiabilities
406 56718 294 37011 -105 8205 -103 7364 -518 -37893 -368 -40951
(+) Inflation Adjustmentst Non Recurring Incomes
000 NA 000 NA 000 NA 000 NA 000 NA 000 NA
(+) (Inc) Other AccountsPayable
115 218744 105 82115 -007 -10274 -014 -10676 216 2710149 191 NA
(+) Extraordinary Income Consolidation
027 -8018 002 -8023 162 -5085 008 -5057 292 -4974 014 -5006
(-) Intangible Goods -007 -12244 011 -8077 040 29906 055 230557 009 12060 -002 8712
Complementary Cash-Flow 976 240248 271 31907 -051 8725 -117 5210 -356 -14616 -230 -28078
Net Cash Generation -1992 -3796 183 77289 -1745 -7131 020 10729 -902 -10194 -255 -21675
Ending Cash -1770 -4381 449 6846 -1488 -17434 251 851 -480 -11112 219 -5387
EMIS Business Report Generated on 2016-06-02
Copyright copy 2015 EMIS all rights reserved A Euromoney Institutional Investor company Page 42 of 48
Score Scale
Financial ScaleFinancial Model has 8 risk categories
A - Very Low RiskAA - Low RiskBB - Moderate Low RiskB - Below Average RiskCC - Above Average RiskC - Moderate High RiskD - High Risk E - Very High Risk
Risk Profile
High RiskHigh Risk - used when the loan amounts are relatively high and have a longrepayment period A loss in the Credit would seriously affect the companyresults Commercial credit with maturity exceeding 36 months
A loss in the Credit would seriously affect the results Bank credited to morethan 36 months
Vertical Weighting
Pampl
Sales Growth 12
Operating Profit 12
Net Profit 12
Sub t ot al 36
Balance
Days Receivables 12
Days Inventory 10
Current Ratio 8
Indebtness 8
Indebtednesssales 8
Balance Sub T ot al 46
Cash Flow
Cash From Sales 2
Cash For Production 2
Cash For Operations 2
Operating Cash Generation 5
Free Cash Flow 3
Cash Flow After Fin Ex 2
Cash Flow After Fin Result 2
Reduction In Debt 0
Cash Flow Sub T ot al 18
Total Vertical Weights 100
Tolerance Margin 5
Financial Conditions
Condit ions Score
Negative Net Worth CC
Final Weighting
EMIS Benchmark Score 90
EMIS Trend Score 10
EMIS Credit Analyt ics - EMIS Credit Analyt ics Assumptions
EMIS Business Report Generated on 2016-06-02
Copyright copy 2015 EMIS all rights reserved A Euromoney Institutional Investor company Page 43 of 48
Ret urn on Asset s (ROA)
An indicator of how profitable a company is relative to its total assets ROA gives an
idea as to how efficient management is at using its assets to generate earnings
Calculated by dividing a companys annual earnings by its total assets
Calculated as Net prof it T ot al Asset
Ret urn on Equit y (ROE)
A measure of a corporations profitability that reveals how much profit a company
generates with the money shareholders have invested
Calculated as Net prof it Shareholders equit y
Ret urn on Sales (ROS)
A ratio widely used to evaluate a companys operational efficiency ROS is also
known as a firms operating profit margin
Calculated as Net Prof it Net Sales Revenue
Bookvalue
A companys common stock equity as it appears on a balance sheet equal to total
assets minus liabilities preferred stock and intangible assets such as goodwill
Current Rat io
A liquidity ratio that measures a companys ability to pay short-term obligations
Calculated as Current Asset sCurrent Liabilit ies
Quick rat io
An indicator of a companys short-term liquidity The quick ratio measures a
companys ability to meet its short-term obligations with its most liquid assets The
higher the quick ratio the better the position of the company
Calculated as (Current Asset s-Invent ories)Current Liabilit ies
Debt t o equit y
A measure of a companys financial leverage calculated by dividing its total
liabilities by stockholders equity It indicates what proportion of equity and debt the
company is using to finance its assets
Calculated as T ot al Liabilit iesShareholders Equit y
Debt t o t ot al asset s
A metric used to measure a companys financial risk by determining how much of
the companys assets have been financed by debt Calculated by adding short-term
and long-term debt and then dividing by the companys total assets
Calculated as Short T erm Debt s+Long T erm Debt sT ot al Asset s
Leverage rat io
Leverage ratio provide an indication of the long term solvency of the firm
Calculated as T ot al Asset sShareholders Equit y
Debt Ent erprise Value
This metric is equivalent to the payback period used by debtholders Calculated as
Debt Ent erprise Value
Market Capit alizat ionEBIT DA
Calculated as Market Capit alizat ionEBIT DA
Earning Bef ore Int erest s and T axes (EBIT )
Earning Before Interests and Taxes (EBIT)
EBIT DA
Earnings before interest taxes depreciation and amortization (EBITDA) is a non-
GAAP metric that can be used to evaluate a companys profitability Calculated as
Ent erprise valueNet Sales
Dividing the enterprise value of a firm by its sales or revenues is a way of
comparing firms in cyclical industries Calculated as Enterprise Value Net Sales
Revenue
Ent erprise valueGross income
Calculated as Enterprise value Gross income
Ent erprise valueT ot al Asset s
Calculated as Enterprise value Total Assets
EBIT DA Margin
A measurement that provides a clear view of the companyrsquos core profitability
Calculated as EBITDA Net Sales Revenue
T ot al Operat ing Revenue T rend
Calculated as Total Operating Revenue current year Total Operating Revenue
previous year
Gross Prof it T rend
Calculated in percentage as (Gross Prof it Current Year Gross Prof it
Previous Year) ndash 1
EBIT DA T rend
Calculated as EBITDA current year EBITDA previous year
Account s Receivables T rend
Calculated in percentage as T rade Account s Receivables current year
T rade Account Receivables previous year
Invent ory T rend
Calculated as Inventories current year Inventories previous year
Net Propert y Plant and Equipment (PPampE) T rend
Calculated as Net PPampE current year Net PPampE previous year
T ot al Asset s T rend
Calculated as Total Assets current year Total Assets previous year
Bookvalue T rend
Calculated as Bookvalue current year Bookvalue previous year
Shareholders Equit y T rend
Calculated as Shareholdersrsquo Equity current year Shareholdersrsquo Equity previous
year
Cash f rom Operat ions T rend
Calculated as Net Cash Flow from Operations current year Net Cash Flow from
Operations previous year
Capit al Expendit ures T rend
Calculated as CAPEX current year CAPEX previous year
Dividend per Share T rend
Calculated as Dividend value per (common) share current year Dividend value
per (common) share previous year
Cost t o Income Rat io
A key financial measure showing a bankrsquos cost in relation to its income Ratio is
calculated as Total Operational Cost Total Operational Income
Glossary
EMIS Business Report Generated on 2016-06-02
Copyright copy 2015 EMIS all rights reserved A Euromoney Institutional Investor company Page 44 of 48
EBIT DA = Operat ing Revenue - Operat ing Expenses (Depriciat ion and
Amort izat ion excluded)
Ent erprise Value EBIT DA
Enterprise Value EBITDA is the metric most used to measure how many years it
would take to pay back the investment
Ent erprise Value
A measure of a companys value often used as an alternative to straightforward
market capitalization EV is calculated as market cap plus debt minority interest
and preferred shares minus total cash and cash equivalents
Dooms day rat io
Calculated as Cash Current Liabilit ies
Long T erm Debt t o Capit al
A ratio showing the financial leverage of a firm calculated by dividing long-term
debt by the amount of capital available Calculated as Long t erm debt Long
t erm debt + Pref f ered St ock + Common St ock
Int erest Coverage Rat io
A ratio used to determine how easily a company can pay interest on outstanding
debt The interest coverage ratio is calculated by dividing a companys earnings
before interest and taxes (EBIT) of one period by the companys interest expenses of
the same period Calculated as EBIT Int erest expense
Cash Flow t o Debt
This coverage ratio compares a companys operating cash flow to its total debt
which for purposes of this ratio is defined as the sum of short-term borrowings the
current portion of long-term debt and long-term debt This ratio provides an
indication of a companys ability to cover total debt with its yearly cash flow from
operations The higher the percentage ratio the better the companys ability to carry
its total debt Calculates as Operat ing Cash Flow T ot al Debt
Ret urn on Capit al
A ratio that indicates the efficiency and profitability of a companys capital
investments Calculated as Net Income (Total Asset - Current Liabilities)
Gross Prof it Margin
A financial metric used to assess a firms financial health by revealing the
proportion of money left over from revenues after accounting for the cost of goods
sold Gross profit margin serves as the source for paying additional expenses and
future savings Calculated as (Net Sales Revenue - Cost of Goods Sold) Net
Sales Revenue
Operat ing Prof it Margin
A ratio used to measure a companys pricing strategy and operating efficiency
Calculated as Operat ing prof it Net sales
Account s Receivable T urnover
An accounting measure used to quantify a firms effectiveness in extending credit
as well as collecting debts The receivables turnover ratio is an activity ratio
measuring how efficiently a firm uses its assets Calculated as Net Sales
Revenue T rade Account s Receivable (Net )
Invent ory T urnover
A ratio showing how many times a companys inventory is sold and replaced over a
period Calculated as Sales Invent ory
Current asset t urnover
Calculated as Net Sales Revenue T ot al Current Asset
Ef f iciency Rat io
Calculated as Total non-interest expenses (Total net interest income + Total non-
interest income)
Loans t o Deposit s Rat io
A commonly used statistic for assessing a banks liquidity Calculated as Total
Loans Total Deposits
Liquid Asset s t o Deposit s Rat io
This ratio indicates extent of liquidity maintained by a bank for meeting the demand
made by the depositors Calculated as (Cash + Financial assets held for trading)
Total Deposits
Loans t o Asset Rat io
Calculated as Total Loans Total Assets
Net Int erest Income T rend
Calculated as Net Interest Income current year Net Interest Income previous year
Net Fee and Commission Income T rend
Calculated as Net Fee and Commission Income current year Net Fee and
Commission Income previous year
Loans and Advances t o Cust omers T rend
Calculated as Loans and Advances to Customers current year Loans and
Advances to Customers previous year
Deposit s f rom Cust omers T rend
Calculated as Deposits from Customers current year Deposits from Customers
previous year
Loss Rat io
This ratio indicates the average cost of insurance protection per each dollar of net
premiums earned during the period Calculated as Total Losses Incurred in Claims
Net Insurance Premium Revenue
Underwrit ing Expenses Rat io
This ratio measures operational efficiency in underwriting Calculated as
Underwriting expenses Net Insurance Premium Revenue
Policyholder Dividend Rat io
Calculated as Dividends Net Insurance Premium Revenue
Combined LossExpense Rat io
Calculated as Loss Ratio + Underwriting Expenses Ratio + Policyholder Dividend
Ratio When the combined ratio is under 100 underwriting results are
considered profitable when the combined ratio is over 100 underwriting results
are considered unprofitable
Ceded Premium Rat io
Calculated as Insurance Premium Ceded to Reinsurers Insurance Premium
Revenue
Net Premiums Earned T rend
Calculated as Net Insurance Premium Revenue current year Net Insurance
Premium Revenue previous year
Fees and Commissions T rend
Calculated as Net Fees and Commissions Income current year Net Fees and
Commissions Income previous year
Net Invest ment Income T rend
EMIS Business Report Generated on 2016-06-02
Copyright copy 2015 EMIS all rights reserved A Euromoney Institutional Investor company Page 45 of 48
Fixed-asset t urnover
This ratio is a rough measure of the productivity of a companys fixed assets
(property plant and equipment or PPampE) with respect to generating sales For most
companies their investment in fixed assets represents the single largest
component of their total assets This annual turnover ratio is designed to reflect a
companys efficiency in managing these significant assets Simply put the higher
the yearly turnover rate the better Calculated as Revenue Propert y Plant and
Equipment
Asset T urnover
The amount of sales generated for every dollars worth of assets It is calculated by
dividing sales in dollars by assets in dollars Calculated as Revenue Asset s
Revenue T rend
Calculated as (Net Sales Current Year Net Sales Previous Year)
Net Income T rend
Calculated as (Net Income Current Year Net Income Previous Year)
Operat ing Income T rend
Calculated as (Operat ing Income Current Year Operat ing Income
Previous year)
PriceBook Rat io
A ratio used to compare a stocks market value to its book value It is calculated by
dividing the current closing price of the stock by the latest years book value per
share Calculated as St ock price (T ot al Asset - Int angible asset s and
Liabilit ies)
PriceEarnings Rat io
A valuation ratio of a companys current share price compared to its per-share
earnings Calculated as Market value per share Earning per share EPS
Market capShareholder equit y
A financial ratio showing the premium which is included in the current market price
compared to the actual value of Shareholder equity of the company Calculated as
Market capit alizat ion Shareholders equit y
PriceEBIT Rat io
The PriceEBIT ratio is a market value indicator similar to the PE ratio which shows
the number of times the market price exceeds the earnings per share before the
effects of gross interest abnormal items and tax The PriceEBIT ratio is calculated
as follows Valuat ion price EBIT
T ot al Capit al Rat io
Calculated as T ot al capit al (T ier 1 and T ier 2) rat io = T ot al capit al (T ier 1
and T ier 2) Risk-adjust ed asset s
T ier 1 Rat io
Tier 1 capital is the core measure of a banks financial strength from a regulators
point of view It consists primarily of shareholders equity but may also include
preferred stock that is irredeemable and non-cumulative and retained earnings
Risk Weight ed Asset s
Risk weights are in five categories from zero to 100 per cent Those carrying a
zero weight include notes and coins gold matched by gold liabilities balances with
the Reserve Bank and commonwealth government securities with less than twelve
months to maturity Commonwealth government securities with more than twelve
months to maturity carry a 10 per cent risk weighting as do state government
securities Claims on other banks Australian local governments and public-sector
organisations other than those with corporate status or which operate
Calculated as Investment Income current year Investment Income previous year
Receivables Arising Out Of Direct Insurance Operat ions T rend
Calculated as Receivables Arising out of Direct Insurance Operations current year
Receivables Arising out of Direct Insurance Operations previous year
Operat ing ROA
An indicator that shows the type of net profit which is actually generated by business
effort Calculated as Operat ing Prof it (EBIT ) T ot al Asset s
Payables T urnover
An indicator that evaluates how fast a company pays off its creditors (suppliers)
Calculated as Purchases T rade Payables
Working Capit al T urnover
A measure that indicates how efficiently the company generates revenue with its
working capital Working capital is defined as current assets minus current liabilities
Calculated as Net Sales (T ot al Current Asset s ndash T ot al Current
Liabilit ies)
Working Capit al
A measure of a companyrsquos short term financial health Calculated as T ot al
Current Asset s ndash T ot al Current Liabilit ies
Cash Rat io
A measure of a companyrsquos liquidity in crisis situation Only highly marketable
securities and cash are included Calculated as (T ot al Cash and Cash
Equivalent s + Market able securit ies) T ot al Current Liabilit ies
Cash Flow f rom Operat ion Rat io
A measure of how well current liabilities are covered by the cash flow generated
from a companyrsquos operations Calculated as Net Cash Flow f rom Operat ing
Act ivit ies T ot al Current Liabilit ies
Debt Coverage
A measure that shows a companyrsquos ability to cover total debt with its yearly cash
flow from operations Calculated as Net Cash Flow f rom Operat ing Act ivit ies
T ot al Debt
Cash Flow t o Revenue
This ratio measures the amount of operating cash flow generated for each dollar of
revenue Calculated as Net Cash Flow f rom Operat ing Act ivit ies Net Sales
Revenue
Cash Ret urn on Asset s
This ratio measures the return of operating cash flow attributed to all providers of
capital Calculated as Net Cash Flow f rom Operat ing Act ivit ies T ot al
Asset s
Cash Ret urn on Equit y
This ratio measures the return of operating cash flow attributed to shareholders
Calculated as Net Cash Flow f rom Operat ing Act ivit ies T ot al
Shareholdersrsquo Equit y
Cash t o Income
This ratio measures the ability to generate cash from companyrsquos operations
Calculated as Net Cash Flow f rom Operat ing Act ivit ies Operat ing Prof it
(EBIT )
CashT ot al Asset s
Calculated as Cash and Cash Equivalent s T ot al Asset s
EMIS Business Report Generated on 2016-06-02
Copyright copy 2015 EMIS all rights reserved A Euromoney Institutional Investor company Page 46 of 48
commercially carry a 20 per cent risk weighting Loans secured by a mortgage
over residential property and with a loan-to-valuation of 80 per cent or less carry a
50 per cent risk weighting and loans to companies or individuals carry a 100 per
cent risk weighting
Market Cap Net cash
A ratio measure the market value of the company to the Net cash position of the
company Calculated as Market capit alizat ion (Cash and cash equivalent s
minus long-t erm debt )
Net Cash
Net cash is commonly used in evaluating a companys cash flow More generally
net cash can refer to the amount of cash remaining after a transaction has been
completed and all charges and deductions related to the transaction have been
subtracted Calculated as T ot al cash minus t ot al short t erm liabilit ies
Annualised Ret urn on Equit y (ROE)
Return on Equity ratio (ROE) converted into an annual basis
Annualised Ret urn on Asset s (ROA)
Return on Assets ratio (ROA) converted into an annual basis
Export Proport ion Rat io
The percentage figure of the proportion of the export revenue from the total sales
revenue of the company Calculated as Export revenue T ot al revenue
Net Debt
A metric that shows companys overall debt situation by netting the value of
financial liabilities with its cash and other similar liquid assets Calculated as
financial liabilities - cash and cash equivalents
EPS
The portion of a companys profit allocated to each outstanding share Calculated
as Net Profit Outstanding Shares
PE
A valuation ratio of a companys current share price compared to its per-share
earnings Calculated as Market value per share Earning per share EPS
Market Capit alizat ionNet Sales
Calculated as Market Capitalization Net Sales Revenue
Market Capit alizat ionGross income
Calculated as Market Capitalization Gross Profit
Market Capit alizat ionEBIT
Calculated as Market Capitalization EBIT
Market Capit alizat ionT ot al Asset s
Calculated as Market Capitalization Total Assets
ReceivablesT ot al asset s
Calculated as T rade Account s Receivable T ot al Asset s
Invent oriesT ot al asset s
Calculated as Invent ories T ot al Asset s
Fixed asset sT ot al asset s
Calculated as Non-current Asset s T ot al Asset s
Current Liabilit iesT ot al Liabilit ies
Calculated as T ot al Current Liabilit ies T ot al Liabilit ies
Salaries and Employee Benef it sNet sales
Calculated as Employee Benef it Expenses Net Sales Revenue
Administ rat ive ExpensesNet Sales
Calculated as Administ rat ive Expenses Net Sales Revenue
Depreciat ion and Amort izat ionNet sales
Calculated as Depreciat ion Amort izat ion and Impairment Charges Net
Sales Revenue
Int erest paidNet sales
Calculated as Int erest -t ype Expenses Net Sales Revenue
Income t axNet sales
Calculated as Income T ax Net Sales Revenue
Operat ing Cash Flow t o T ot al Cash Flow
Calculated as Net Cash Flow f rom Operat ing Act ivit ies Net
IncreaseDecrease in Cash and Cash Equivalent s
Cash Flow f rom Invest ing t o T ot al Cash Flow
Calculated as Net cash f low f rom (used in) invest ing act ivit ies Net
IncreaseDecrease in Cash and Cash Equivalent s
Cash f low f rom f inancing t o T ot al cash f low
Calculated as Net cash flow from (used in) financing activities Net
IncreaseDecrease in Cash and Cash Equivalents
Average Yie ld on Asset s
Calculated as T ot al Int erest Income T ot al Asset s
Disclaimer
Whilst EMIS attempts at all times to ensure the accuracy and reliability of the information it provides due to the vast quantity of processed data and the fact that some of
the third-party data cannot always be verified including information provided directly by the subject of the enquiry EMIS does not guarantee the correctness or the
effective delivery of the information and shall not be held responsible for any errors or omissions therein
The content and recommendations shall only be used as a reference in business decisions of EMIS clients and shall not be used for any other purposes EMIS and its
affiliates shall not be held liable for any loss of the clients arising out of its own business decisions whether or not the making of such decision has been referred to this
contentrecommendation
EMIS Business Report Generated on 2016-06-02
Copyright copy 2015 EMIS all rights reserved A Euromoney Institutional Investor company Page 47 of 48
EMIS Business Report Generated on 2016-06-02
Copyright copy 2015 EMIS all rights reserved A Euromoney Institutional Investor company Page 48 of 48
- Table of Contents
- Company Tear Sheet
-
- Contact Information
- NAICS Industry Classification
- Business description
- Basic Information
- EMIS Financial Score
- Share Price information
- Key Executives
- Ownership Details
- Subsidiaries and Affiliates
- Key Financial Highlights
- Financial Performance Charts
- Latest MampA and ECM Deals
- Top Competitors
-
- Financial Statements
-
- Annual Statements
- Interim Statements
- Ratios
- Multiples
-
- Company Documents
-
- Financial DocumentsAnnual Reports
- Corporate Actions
-
- News amp Reports
-
- News
- Reports
-
- MampA and ECM Deals
-
- EMIS DealWatch Deals
- EMIS DealWatch Intents
-
- EMIS Credit Analytics
-
- Summary
- EMIS Financial Score
- EMIS Benchmark Score
- EMIS Credit Quota
- Conclusions
- Company vs Industry Key Stats
- Company vs Industry Balance Sheet
- Company vs Industry Income Statement
- Company vs Industry Cash Flow
- EMIS Credit Analytics Assumptions
-
- Glossary
- Disclaimer
-
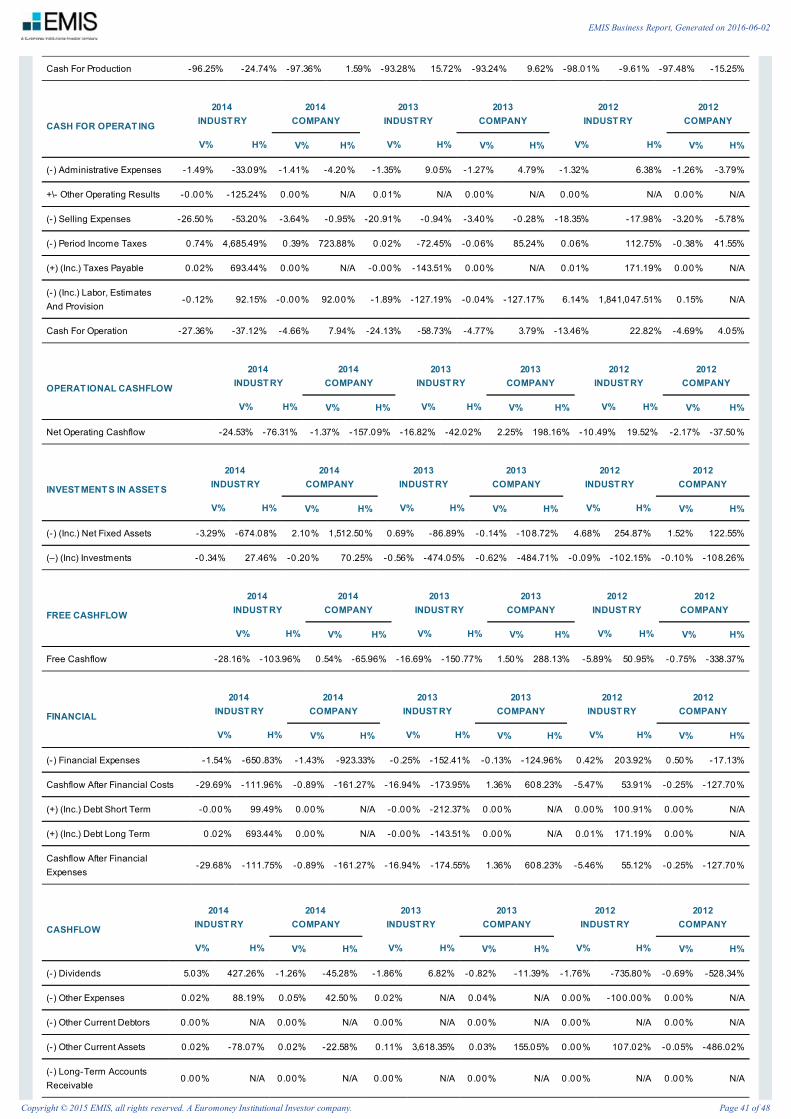
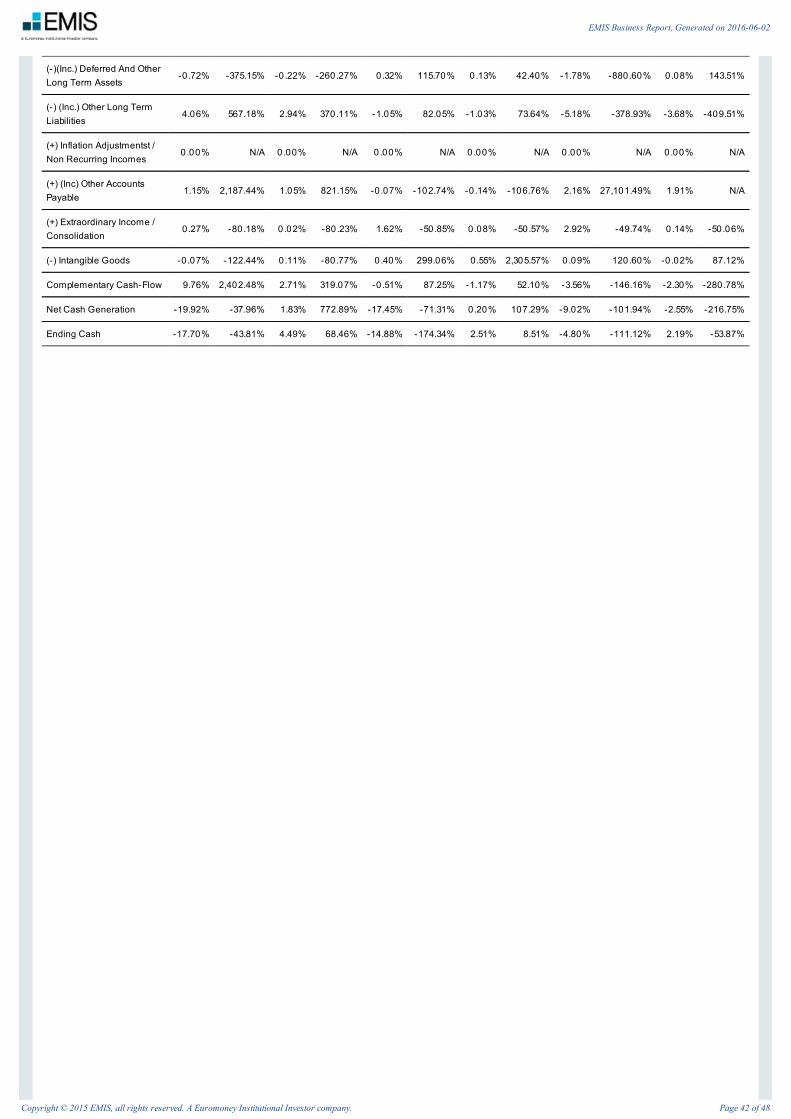
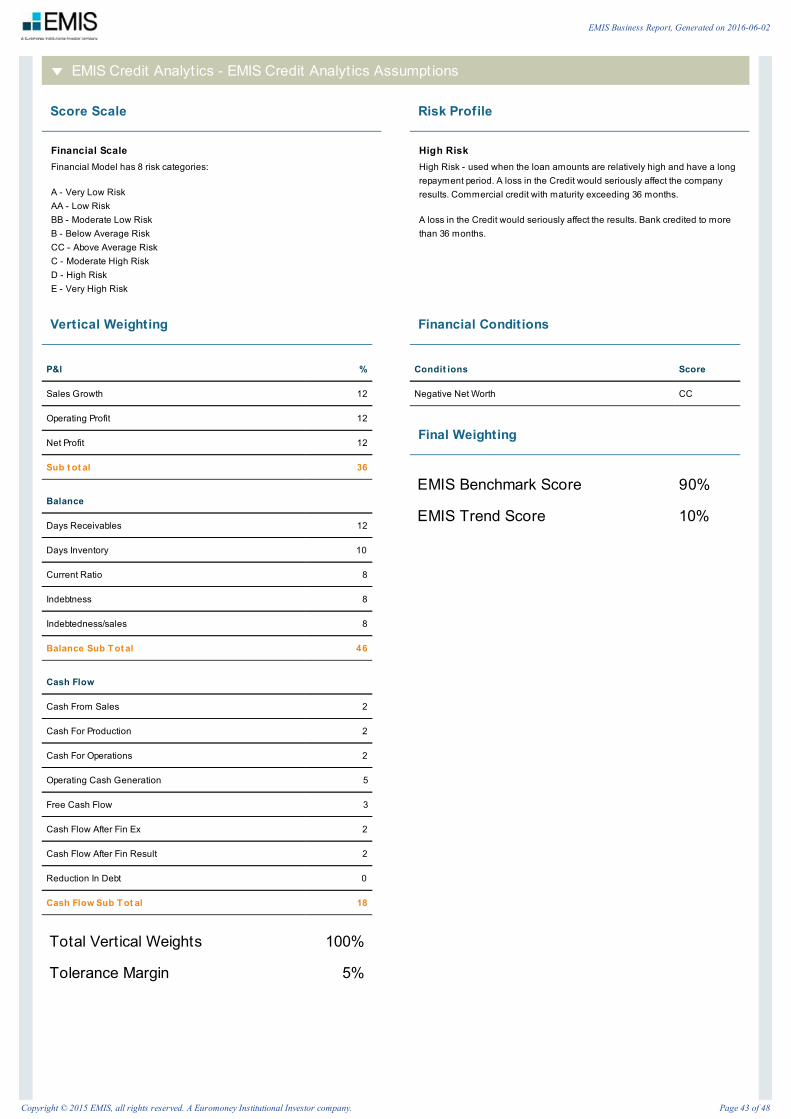