soil test laboratory analysis and fertilizer …department/deptdocs.nsf/ba3468a2a...key messages...
TRANSCRIPT
Soil Test Laboratory Analysis
and
Fertilizer Recommendations
Len Kryzanowski, P.Ag.
Director, Environmental Strategy and Research
Environmental Stewardship Branch
Alberta Agriculture and Forestry

Key Messages Soil test laboratories provide a critical step in management
decisions of nutrients for optimum crop production, howeverthe best analytical process can not compensate for poorsample collection and handling.
Laboratory methods, calibrations and recommendations mustbe based on local (Alberta or western Canada) research.
Soil test methods will vary among laboratories and in their ability to measure crop available nutrients.
Calibration of soil test methods and recommendations can beinfluenced by soil properties (soil pH, texture, seedbed moisture), agro-climatic zones and cropping systems.
AFFIRM will provide access to 4R Nutrient Stewardshipfor a range of laboratory soil test methods.
Needs extensive field and laboratory research.
Needs to provide a measure of the nutrient proportional to what a plant utilizes for a wide range of soils.
Able to identify responsive vs non-responsive soils based on soil test critical level and/or other related properties.
Able to predict nutrient application rate forresponsive soil.
Able to identify excessive nutrient levels.
A Good Nutrient Soil Test
Limits of a Nutrient Soil Test
One-time snap-shot of nutrient levels that must be able to take the entire crop growing season into account.
Misconception – nutrient measure equals availability; Soil analysis is an index of nutrient levels in the soil.
Requires continuous verification, evaluation and updates.
Field research related to management changes crops, varieties, nutrient sources, rates, time of application, placement, tillage, etc.
Laboratory improvements: procedures, detection limits, multiple nutrient extraction
Soil Testing Recommendation Process
Extraction and Chemical AnalysisTo extract “available” forms of nutrients. The values extracted this way have no absolute meaning, i.e., they are only indices and as such they must be calibrated against yield.
Correlation and InterpretationThe process whereby the “indices” derived from extraction and chemical analysis are calibrated against plant growth or nutrient uptake.
Fertilizer RecommendationThe process whereby the “calibrated indices” are applied to providing a fertilizer recommendation using crop response curves or production models.
Soil Test Calibration
Nutrient soil test laboratory methods must be calibrated with crop yield response across many different soil types
May use crop nutrient removal
Often regionally specific
Costly and time consuming
Soil Test Interpretation
Interpretation directly related to philosophy and subsequent recommendation.
Philosophies Sufficiency – Deficiency Correction:
Deficient, Marginal, Adequate, Excessive, Toxic
Replacement - Crop Removal:Uses target yield goals for nutrient requirements
Build and Maintenance:Application of nutrients in excess of crop removal
Base Cation Saturation Ratio (BCSR):Maximum yield is only achieved by creating an ideal ratio of soil calcium, magnesium and potassium.
Laboratory Soil Test Questions
Soil test methods will vary among laboratories.What chemical extractant is used for the soil nutrient analysis? Is it appropriate for your area?
Determination of fertilizer required for sufficiency? What is the source of the data gathered to assess how much fertilizer would be required?
What method of supplying the fertilizers is used? Some labs consider the fertilizer is applied by broadcast application, others banding – are you broadcasting or banding?

Soil Testing Laboratory Objectives
Maintain high analytical standards – Participate in the North American Proficiency Testing or equivalent program.
Identify soil related problems (fertility, salinity, pH) that may be limiting yields.
Analytical results to formulate a fertilizer recommendation.
Timely sample turnaround.
Agronomic and environmental limits.
Quality Control/Quality Assurance
The goal of the Analytical Laboratory QA/QC Program is to guarantee the generation of precise and accurate analytical data.
Includes: Standard operating procedures (SOPs), Training, Reliable and well-maintained equipment, Traceability, Annual QC results review, QC samples.
Soil Analytical Process Contains Errors:
80% due to the soil
20% due to the analytical equipment
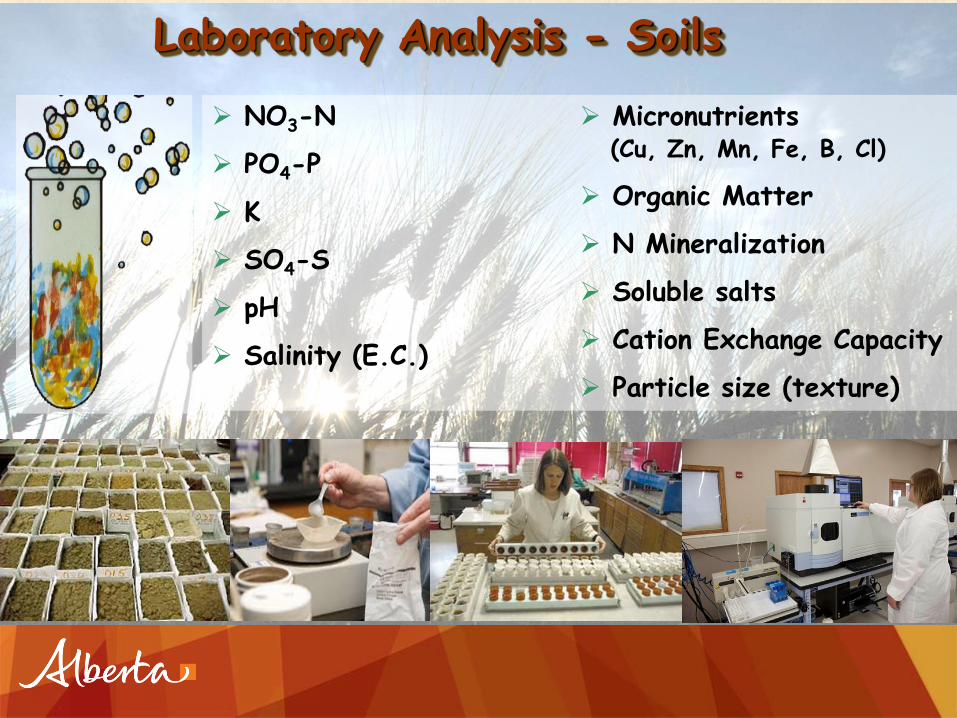
Laboratory Analysis - Soils
NO3-N
PO4-P
K
SO4-S
pH
Salinity (E.C.)
Micronutrients (Cu, Zn, Mn, Fe, B, Cl)
Organic Matter
N Mineralization
Soluble salts
Cation Exchange Capacity
Particle size (texture)
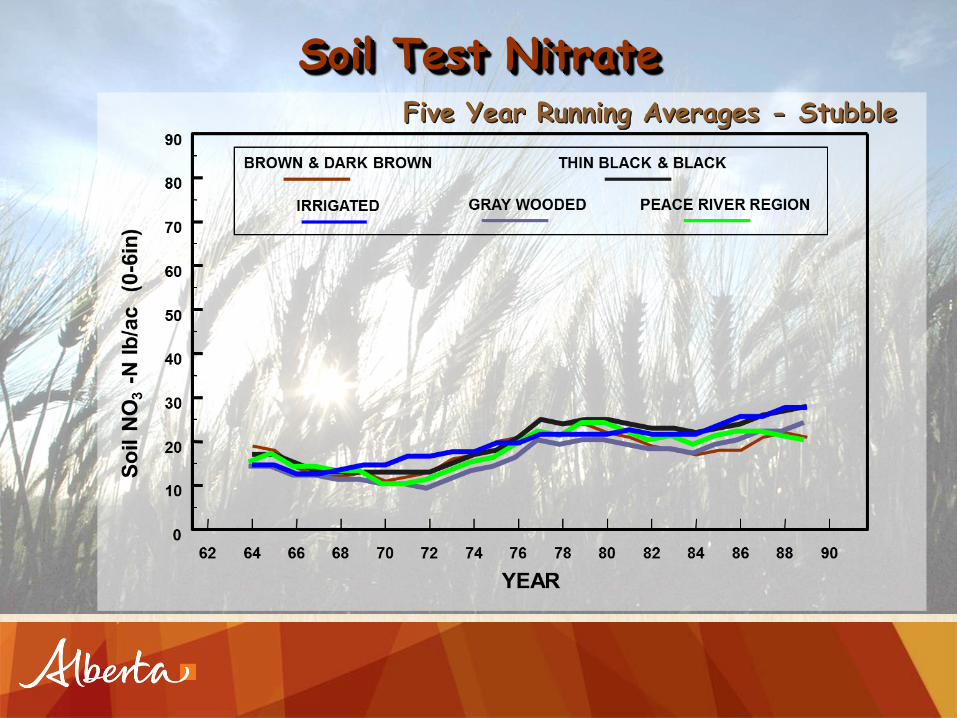
Soil Test NitrateFive Year Running Averages - Stubble
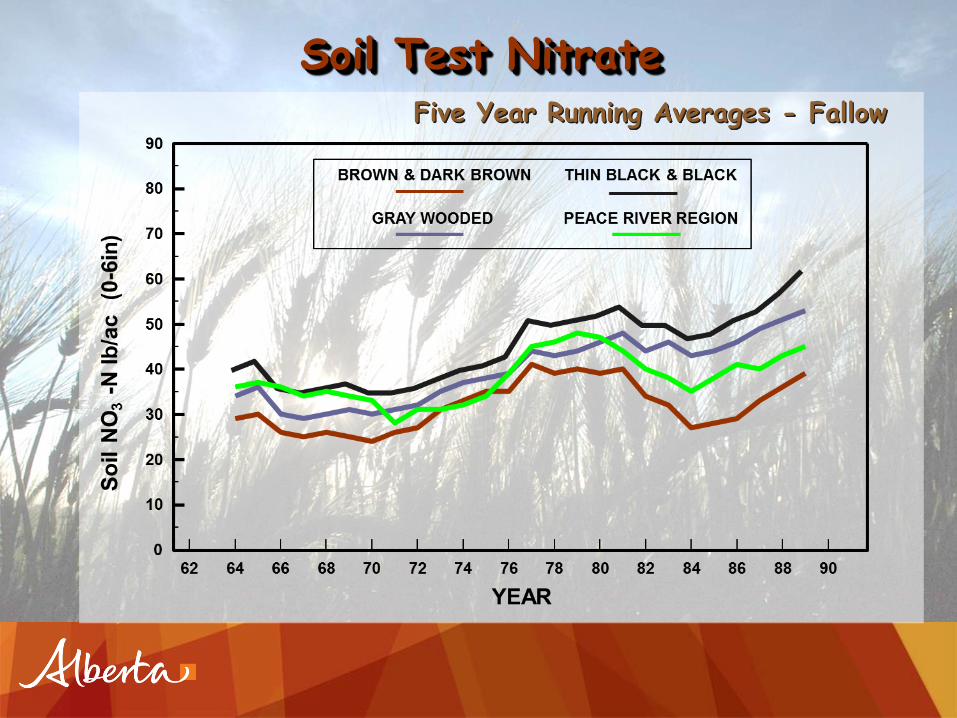
Soil Test NitrateFive Year Running Averages - Fallow

62 64 66 68 70 72 74 76 78 80 82 84 86 88 900
10
20
30
40
50
60
70
YEAR
So
il P
lb
/ac
(0
-6 i
n)
BROWN & DARK BROWN THIN BLACK & BLACK
GRAY WOODED PEACE RIVER REGIONIRRIGATED
Soil Test PhosphorusFive Year Running Averages - Stubble

Soil Test PhosphorusFive Year Running Averages - Fallow
62 64 66 68 70 72 74 76 78 80 82 84 86 88 900
10
20
30
40
50
60
70
YEAR
So
il P
lb
/ac
(0
-6 i
n)
BROWN & DARK BROWN THIN BLACK & BLACK
GRAY WOODED PEACE RIVER REGION
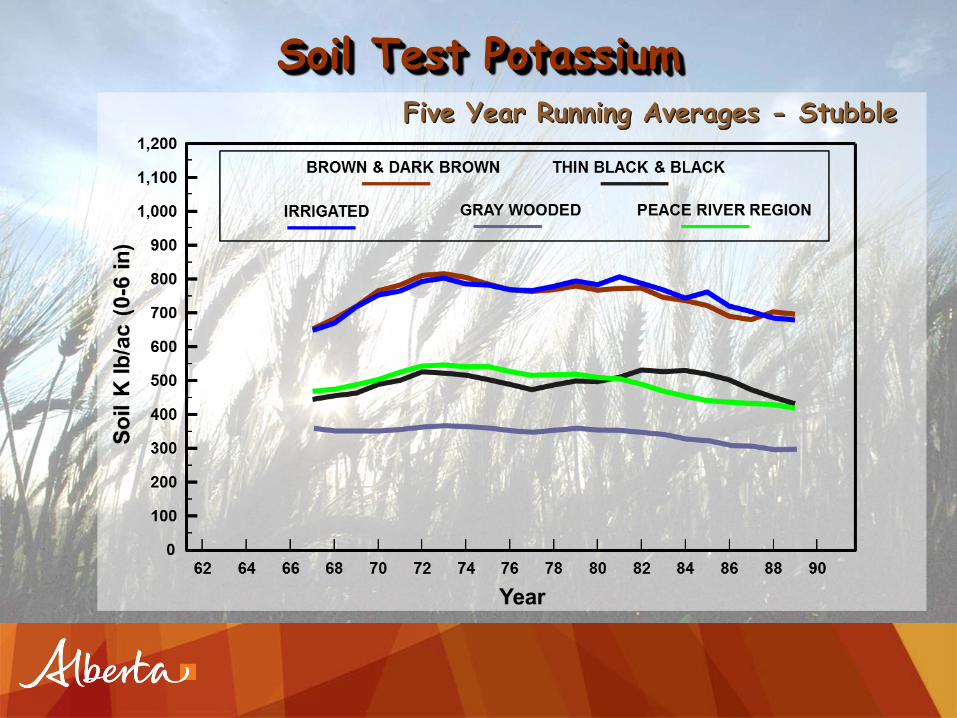
Soil Test PotassiumFive Year Running Averages - Stubble
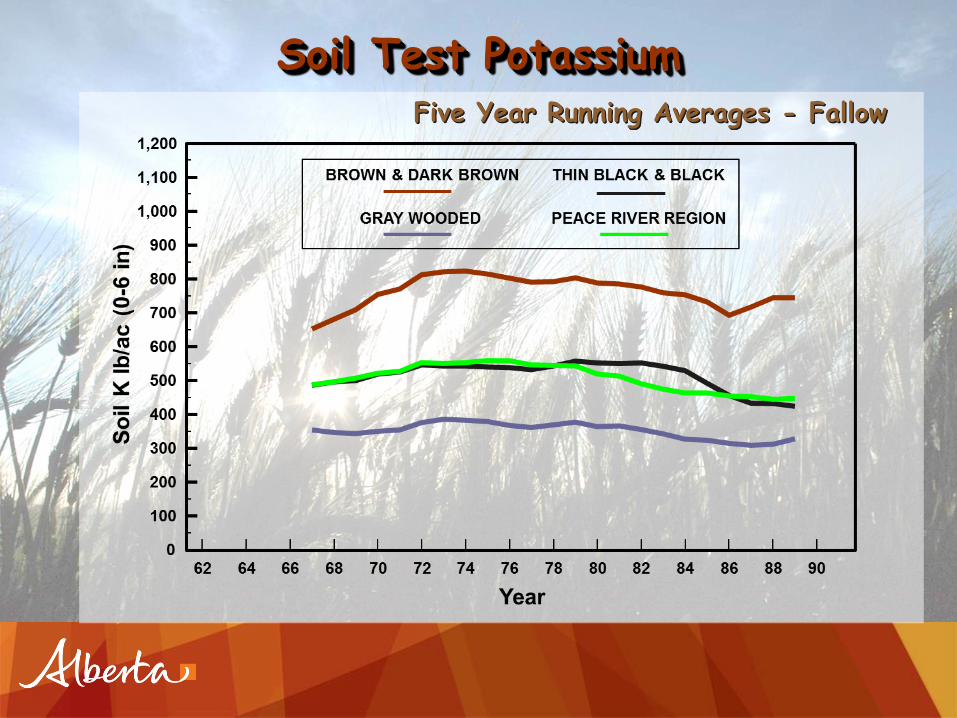
Soil Test PotassiumFive Year Running Averages - Fallow
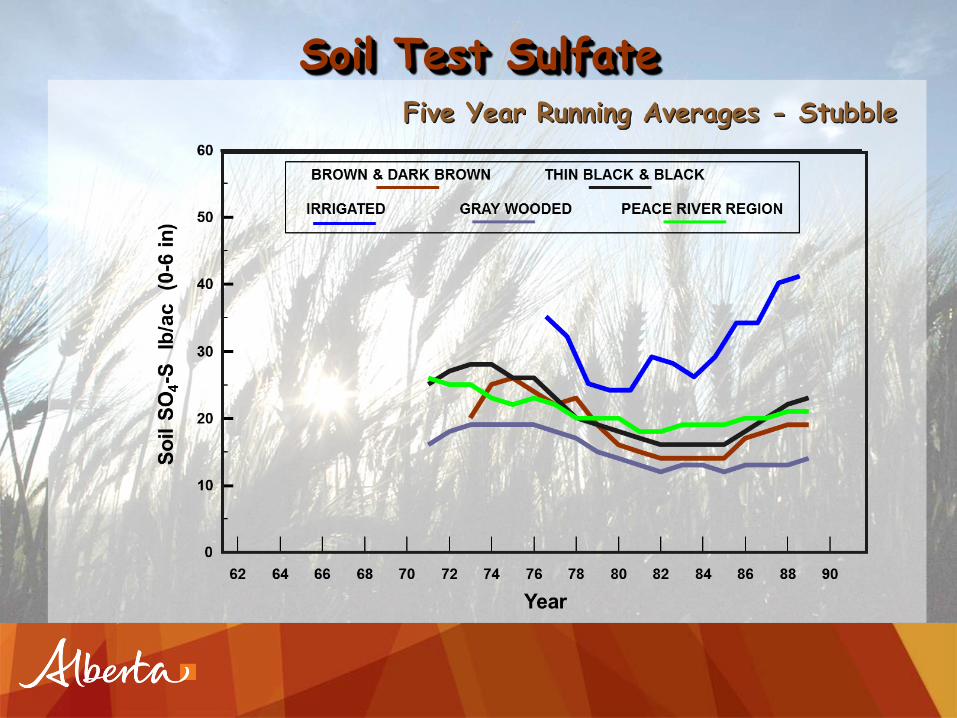
Soil Test SulfateFive Year Running Averages - Stubble
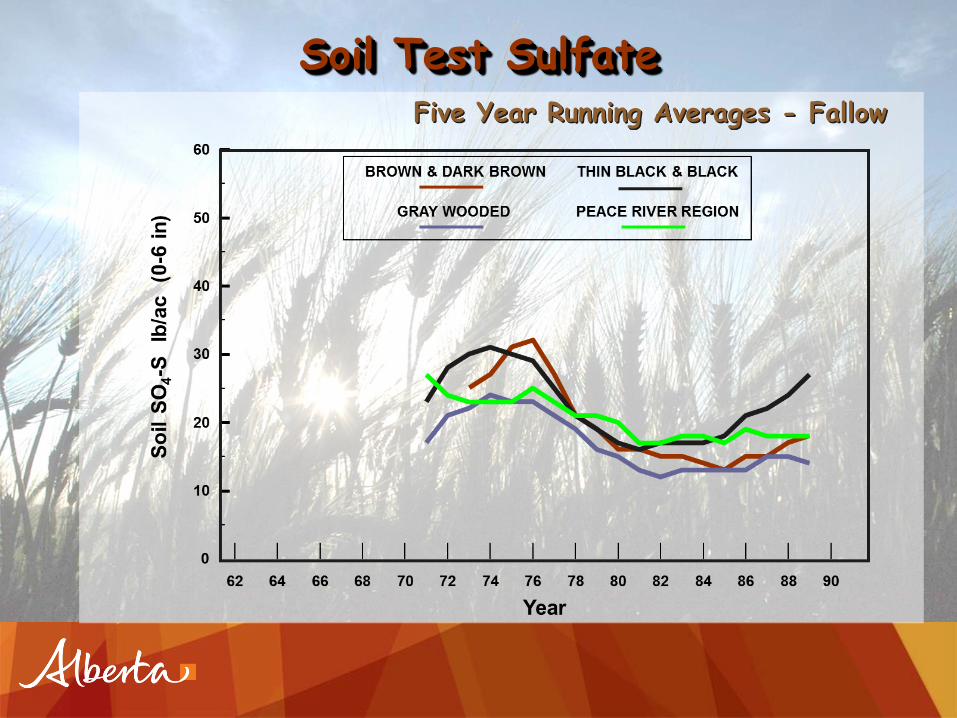
Soil Test SulfateFive Year Running Averages - Fallow

Soil Test Calibration ResearchField trials - Variables:
Crops, varieties, fertilizer products, time of application, fertilizer placement, tillage
Regions - soil types, climate, soil moisture, irrigation Soil samples
Laboratory soil test methods - Chemistry: Chemical extraction solutions
Acids, bases, neutral salts Anion and cation displacement
Correlation - How good is the relationship: Crop response – Fertilizer rate relationship Soil test - Crop response relationship Soil test – Fertilizer rate relationship Linear, Non-linear, Spline, etc As the soil test increases, the recommended fertilizer rate
decreases

Soil test P calibration trials in Alberta
Kelowna
Modified Kelowna (ALS)
Modified Kelowna (Exova)
Miller & Axley
Olsen

Calibration curve indicates which soil test levels tend to limit yields.
The results of this calibration data set from Alberta show a critical level (sufficiency) of 20 to 25 ppm (40 to 50 lb/ac) P.
This is the level of soil test P above which minimal response to applied P can be expected. 0
10
20
30
40
50
60
70
80
90
100
110
0 5 10 15 20 25 30 35 40 45 50 55
Kelowna P, ppm
Re
lati
ve
yie
ld,
%
Sufficiency Soil Test P Level for Canola
McKenzie et al., 1995
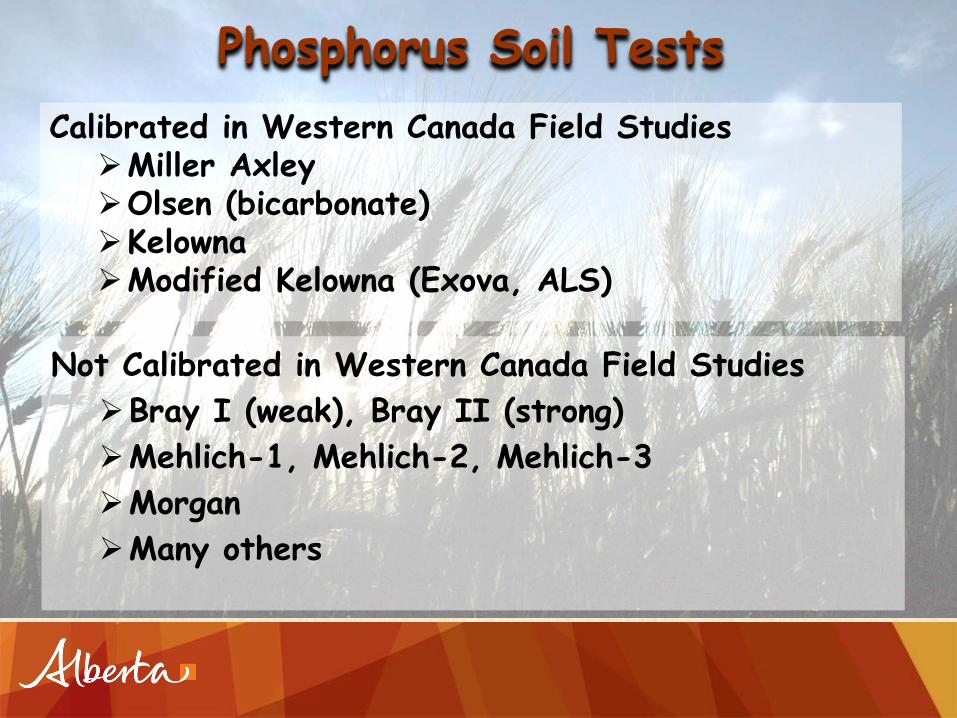
Calibrated in Western Canada Field StudiesMiller AxleyOlsen (bicarbonate) Kelowna Modified Kelowna (Exova, ALS)
Not Calibrated in Western Canada Field Studies
Bray I (weak), Bray II (strong)
Mehlich-1, Mehlich-2, Mehlich-3
Morgan
Many others
Phosphorus Soil Tests
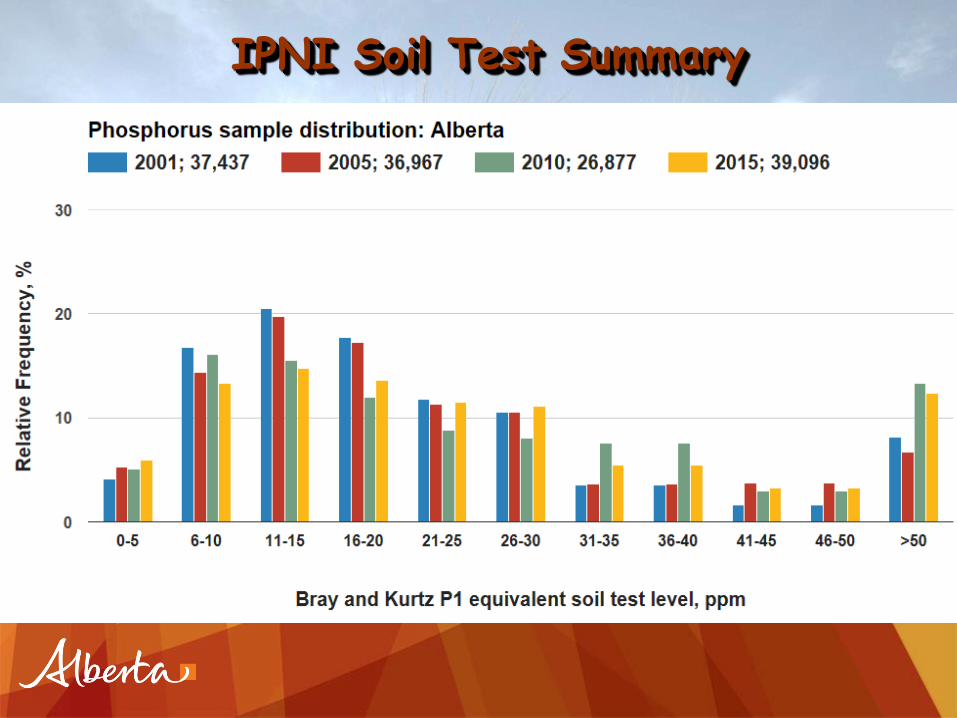
IPNI Soil Test Summary

IPNI Soil Test Summary

IPNI Soil Test Summary
< 5.1
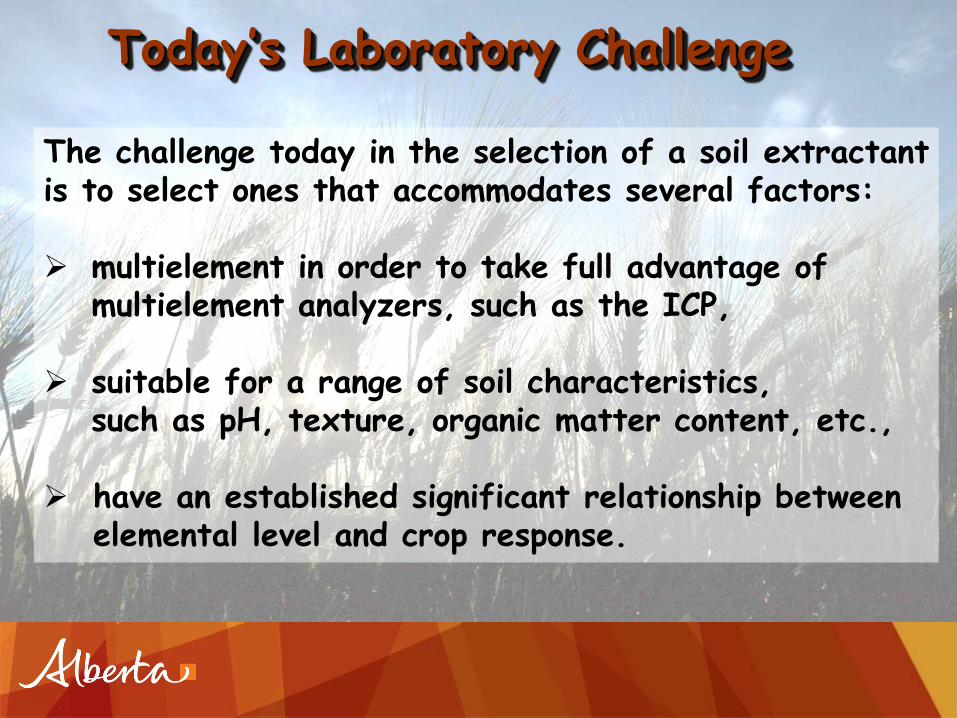
Today’s Laboratory Challenge
The challenge today in the selection of a soil extractantis to select ones that accommodates several factors:
multielement in order to take full advantage of multielement analyzers, such as the ICP,
suitable for a range of soil characteristics,such as pH, texture, organic matter content, etc.,
have an established significant relationship betweenelemental level and crop response.
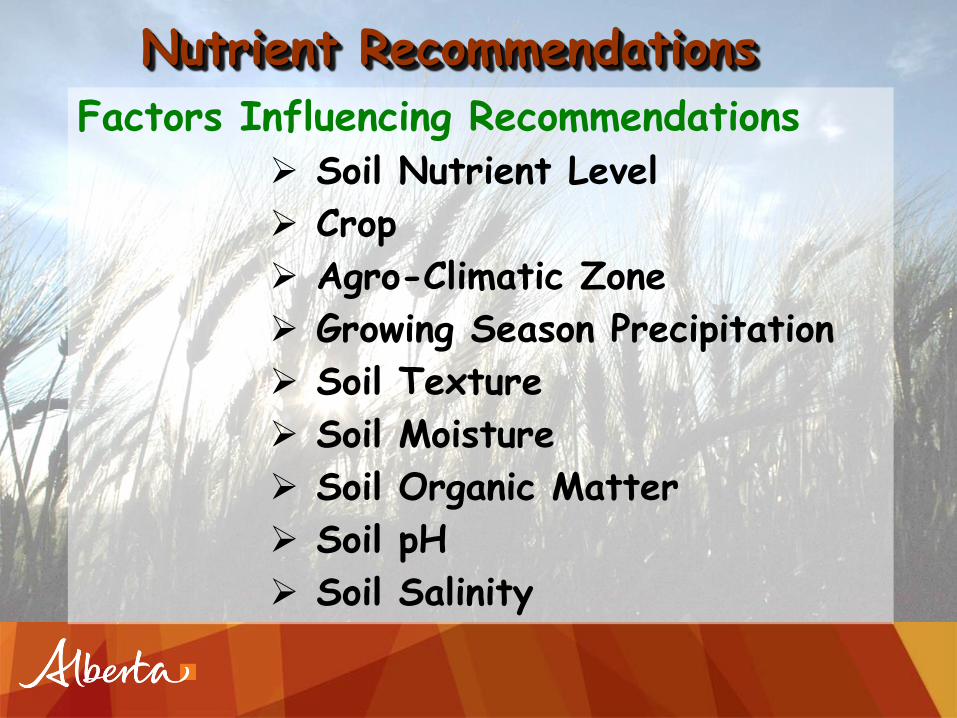
Nutrient Recommendations
Factors Influencing Recommendations Soil Nutrient Level
Crop
Agro-Climatic Zone
Growing Season Precipitation
Soil Texture
Soil Moisture
Soil Organic Matter
Soil pH
Soil Salinity
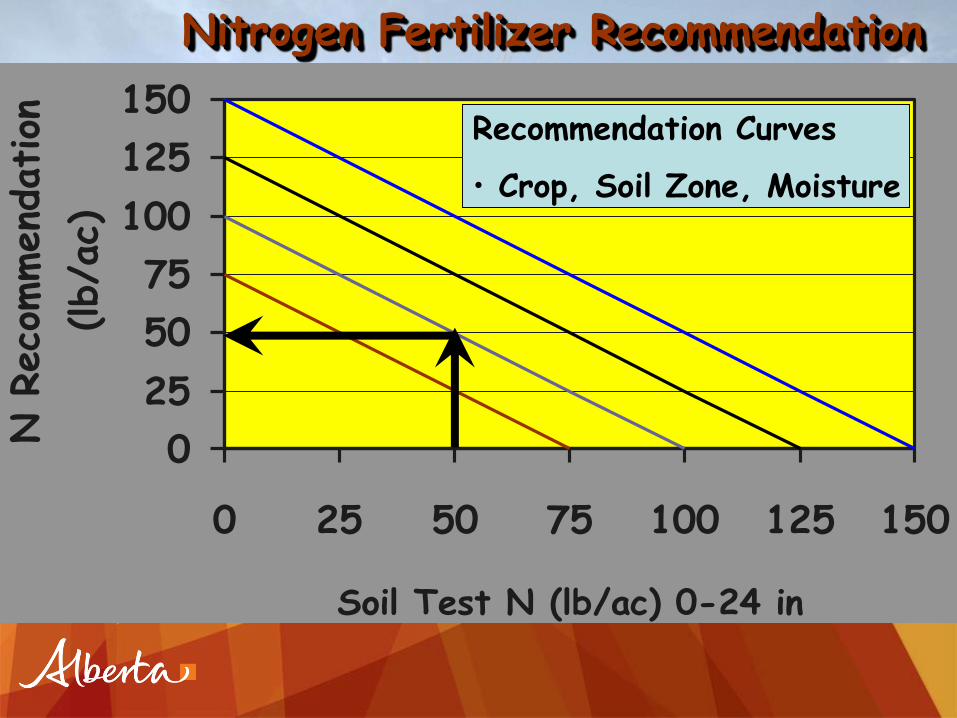
Nitrogen Fertilizer Recommendation
0
25
50
75
100
125
150
0 25 50 75 100 125 150
Soil Test N (lb/ac) 0-24 in
N R
eco
mmend
ation
(lb/a
c)Recommendation Curves
• Crop, Soil Zone, Moisture

Phosphate Fertilizer Recommendation
0
10
20
30
40
50
60
0 20 40 60 80 100
Soil Test P (lb/ac) 0-6 in
P 2O
5 R
ecom
men
dat
ion
(lb/a
c)Recommendation Curves
• Crop, Soil Zone, Moisture
Responsive Zone Maintenance Zone
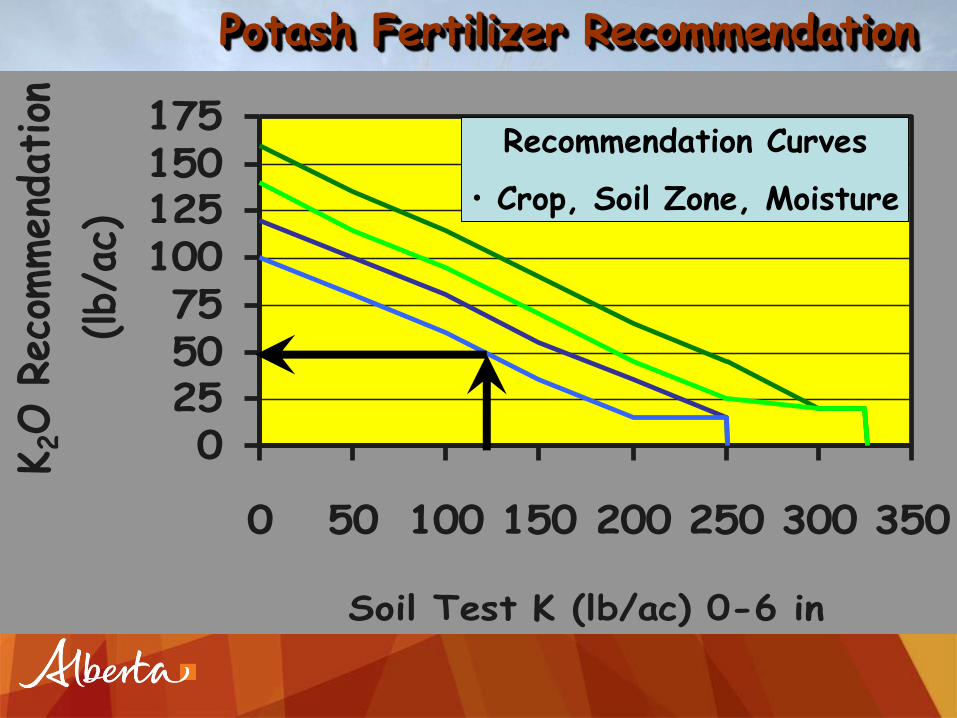
Potash Fertilizer Recommendation
0255075
100125150175
0 50 100 150 200 250 300 350
Soil Test K (lb/ac) 0-6 in
K2O R
ecom
men
dat
ion
(lb/a
c)Recommendation Curves
• Crop, Soil Zone, Moisture
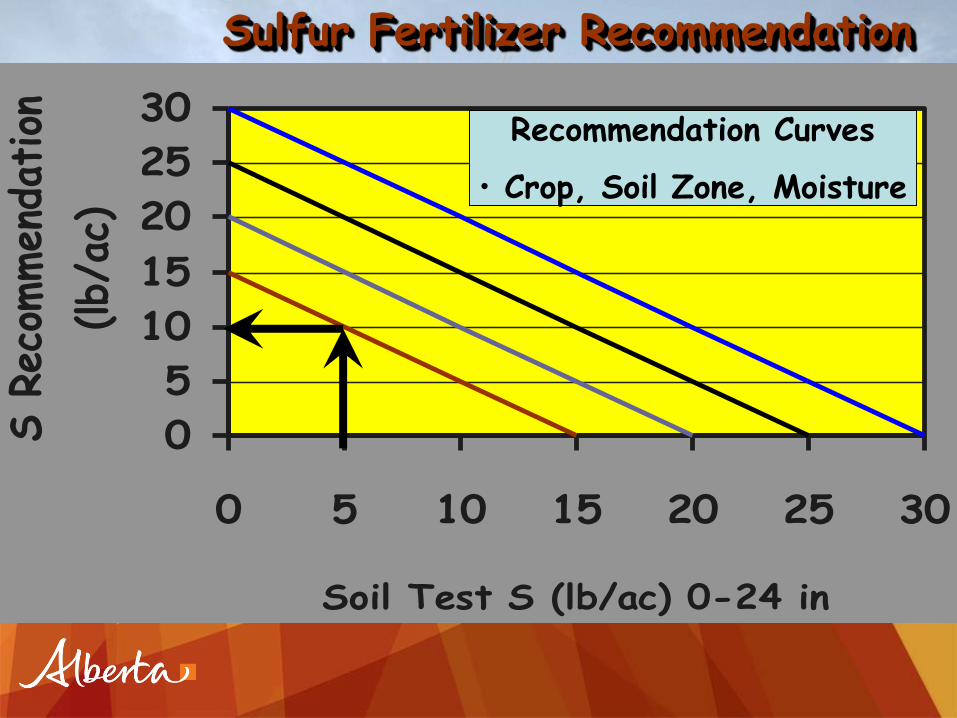
Sulfur Fertilizer Recommendation
0
5
10
15
20
25
30
0 5 10 15 20 25 30
Soil Test S (lb/ac) 0-24 in
S R
ecom
men
dation
(lb/
ac)Recommendation Curves
• Crop, Soil Zone, Moisture
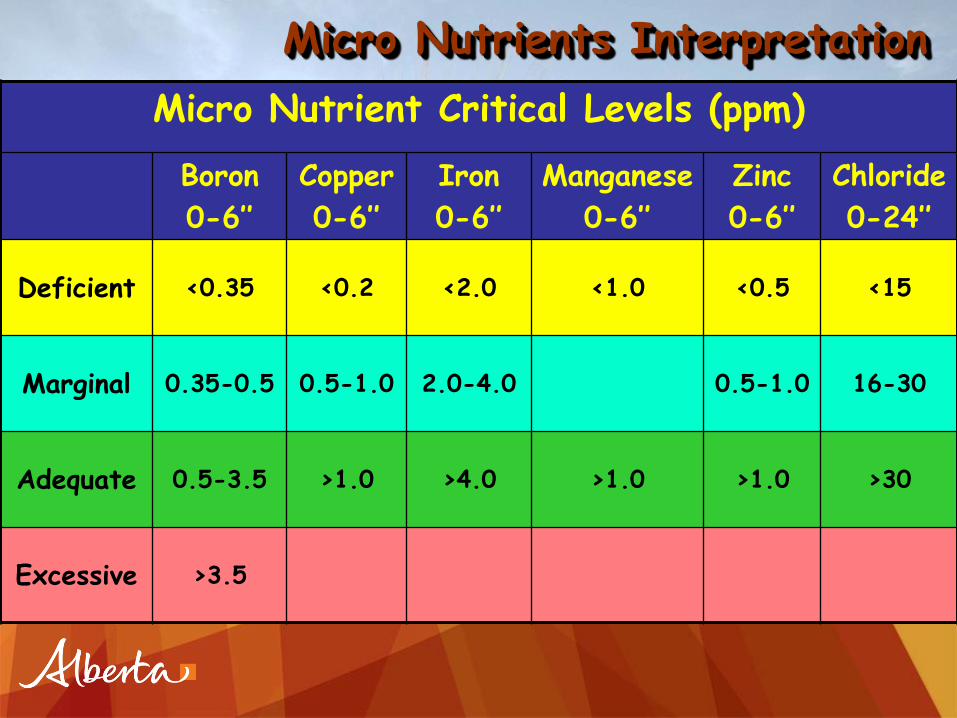
Micro Nutrients Interpretation
Micro Nutrient Critical Levels (ppm)
Boron
0-6’’
Copper
0-6’’
Iron
0-6’’
Manganese
0-6’’
Zinc
0-6’’
Chloride
0-24’’
Deficient <0.35 <0.2 <2.0 <1.0 <0.5 <15
Marginal 0.35-0.5 0.5-1.0 2.0-4.0 0.5-1.0 16-30
Adequate 0.5-3.5 >1.0 >4.0 >1.0 >1.0 >30
Excessive >3.5
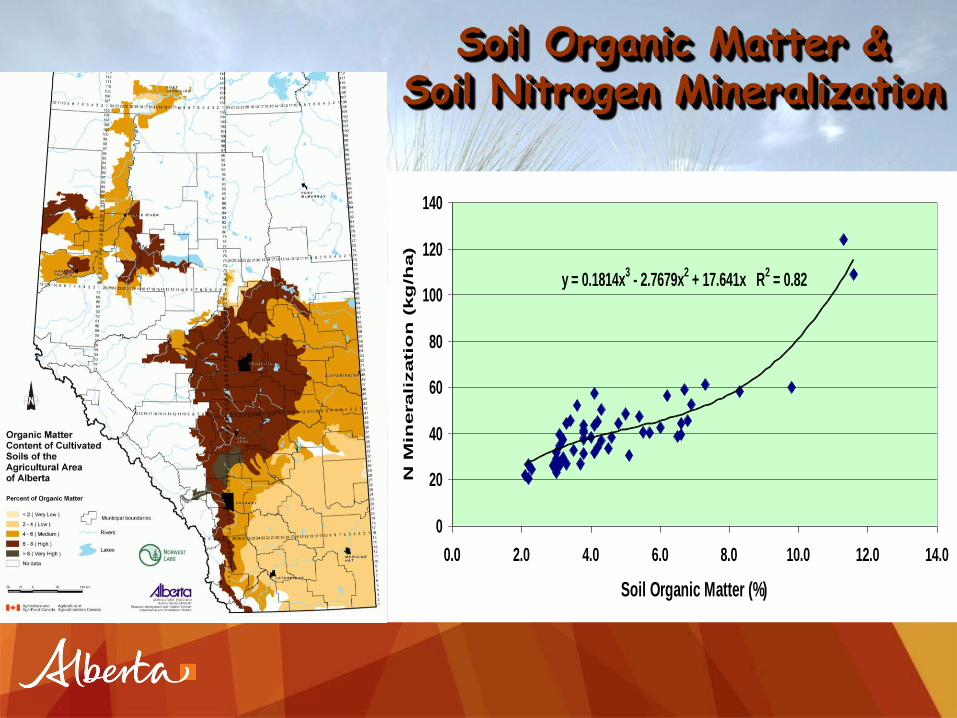
Soil Organic Matter & Soil Nitrogen Mineralization
y = 0.1814x3 - 2.7679x
2 + 17.641x R
2 = 0.82
0
20
40
60
80
100
120
140
0.0 2.0 4.0 6.0 8.0 10.0 12.0 14.0
Soil Organic Matter (%)
N M
inerali
zatio
n (
kg
/ha)
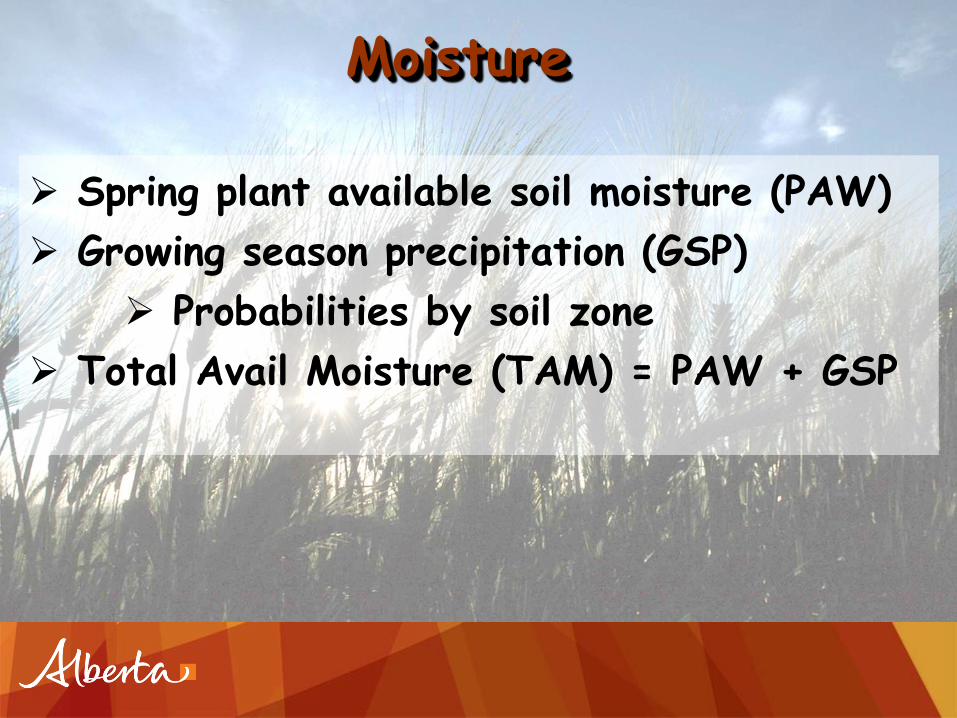
Spring plant available soil moisture (PAW)
Growing season precipitation (GSP)
Probabilities by soil zone
Total Avail Moisture (TAM) = PAW + GSP
Moisture
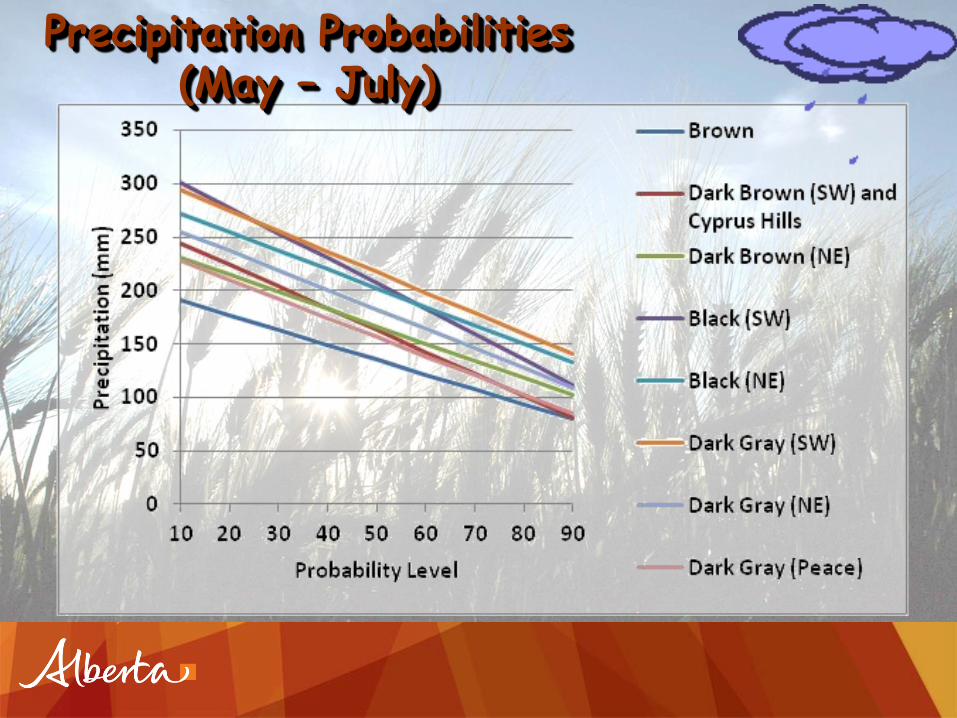
Precipitation Probabilities(May – July)

Precipitation Probabilities(May – August)

Estimating Plant Available Soil Moisture
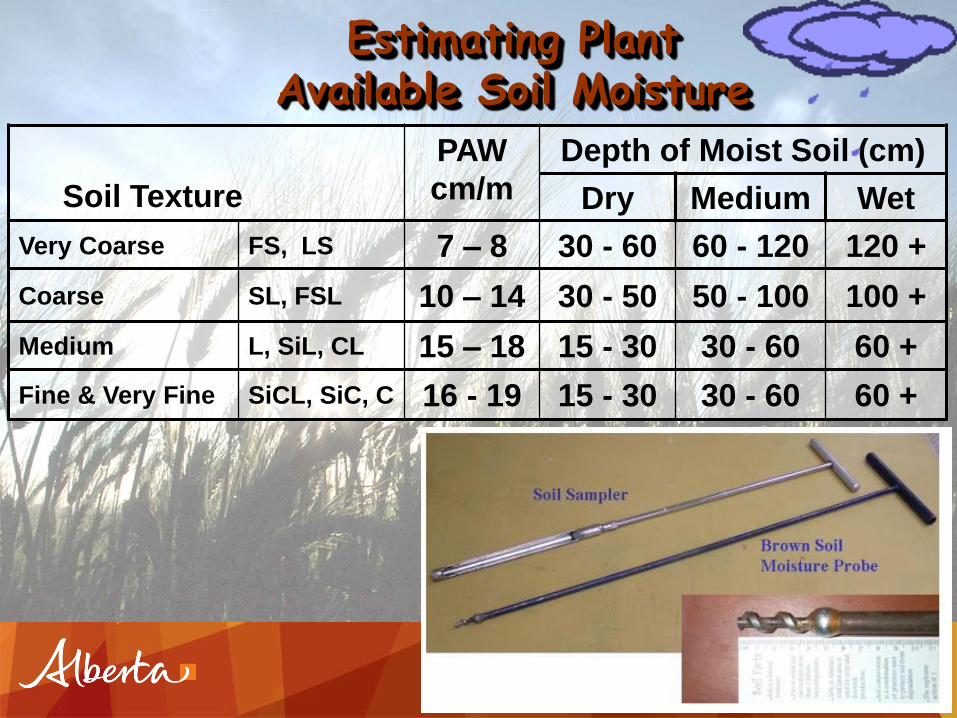
Soil Texture
PAW
cm/m
Depth of Moist Soil (cm)
Dry Medium Wet
Very Coarse FS, LS 7 – 8 30 - 60 60 - 120 120 +
Coarse SL, FSL 10 – 14 30 - 50 50 - 100 100 +
Medium L, SiL, CL 15 – 18 15 - 30 30 - 60 60 +
Fine & Very Fine SiCL, SiC, C 16 - 19 15 - 30 30 - 60 60 +
Estimating Plant Available Soil Moisture
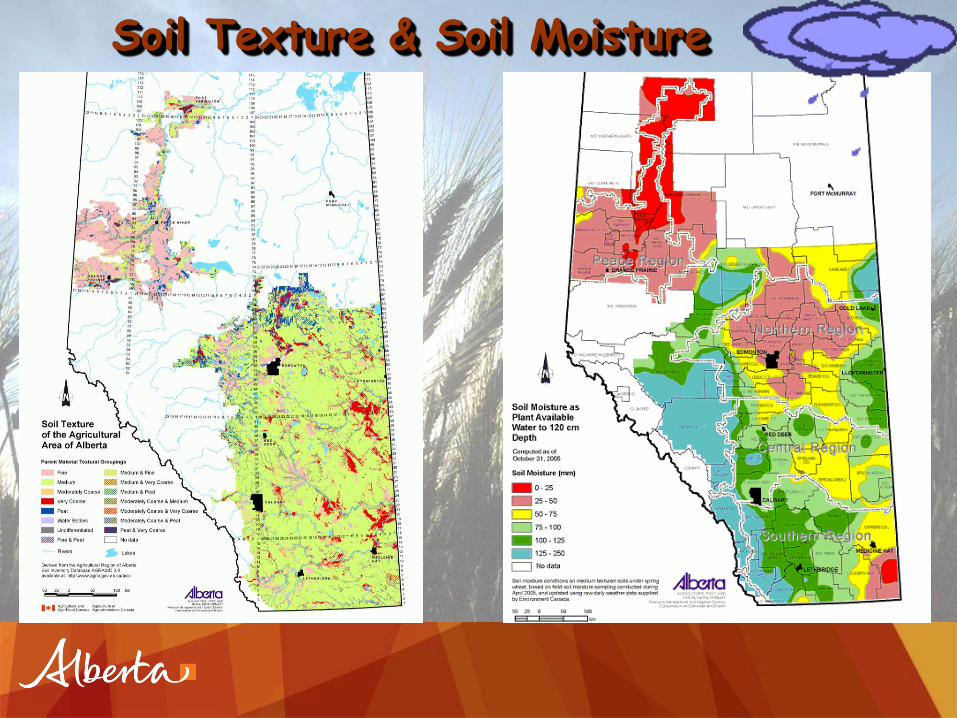
Soil Texture & Soil Moisture
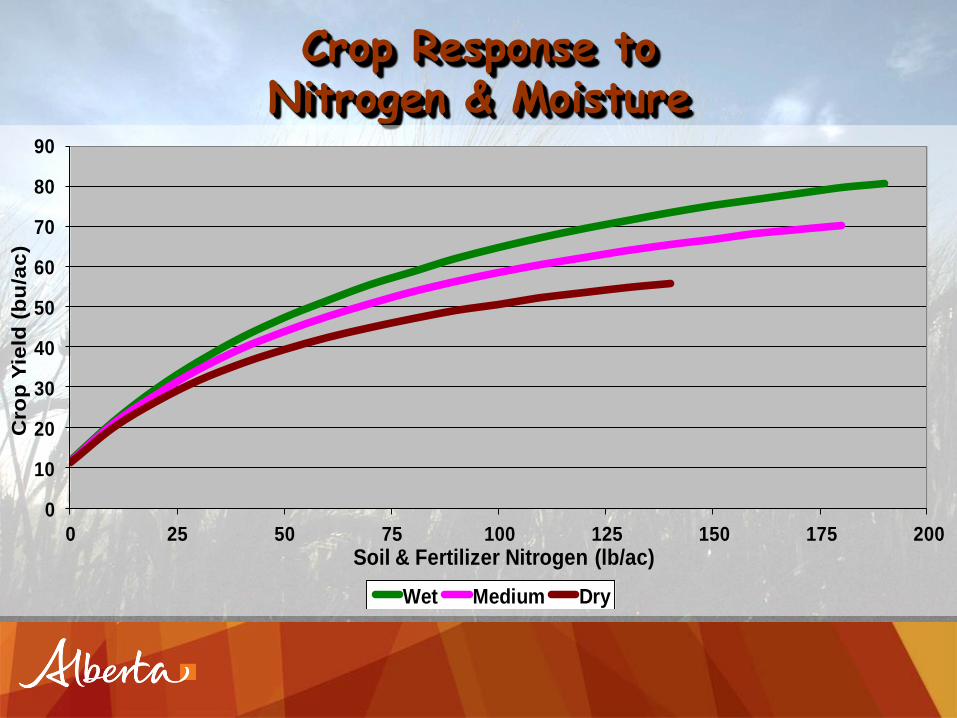
Crop Response toNitrogen & Moisture
0
10
20
30
40
50
60
70
80
90
0 25 50 75 100 125 150 175 200
Cro
p Y
ield
(b
u/a
c)
Soil & Fertilizer Nitrogen (lb/ac)
Wet Medium Dry
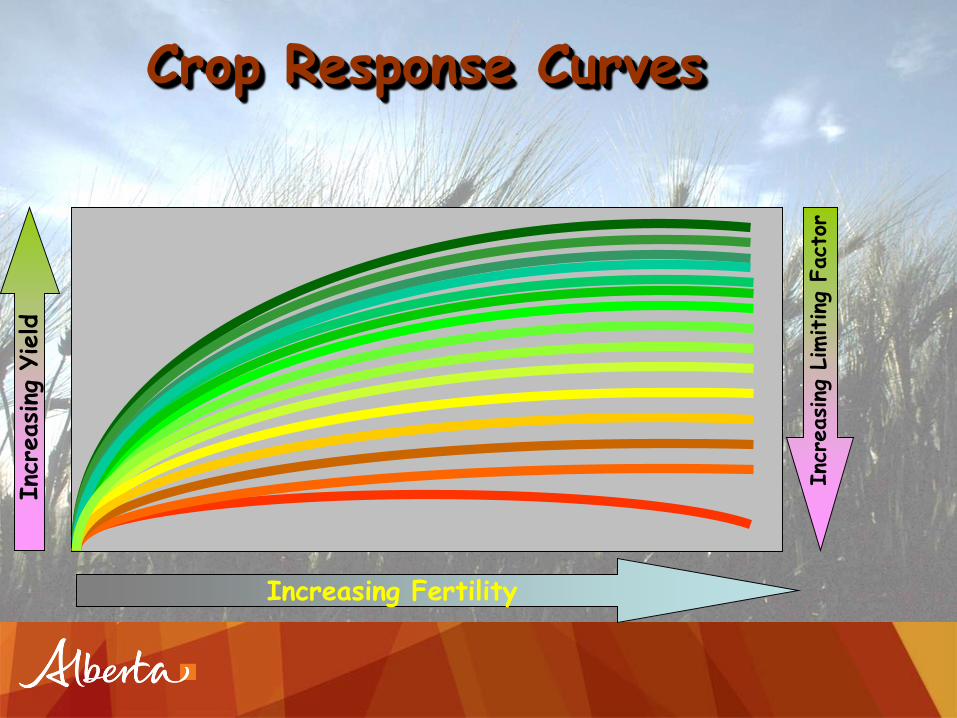
Increasing Fertility
Inc
reasing
Yield
Inc
reasing
Lim
iting
Fact
or
Crop Response Curves

Intermediate
Average
Increasing Fertility
Inc
reasing
Yield
Optimum
Irrigation
IrrigationLevel
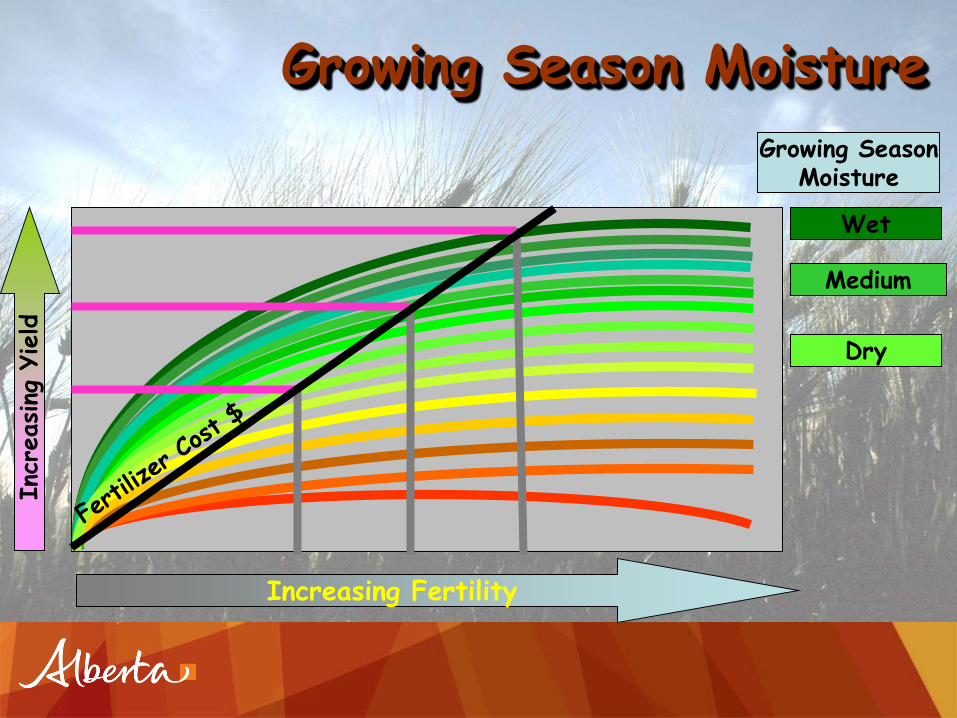
Medium
Dry
Increasing Fertility
Inc
reasing
Yield
Wet
Growing Season Moisture
Growing SeasonMoisture
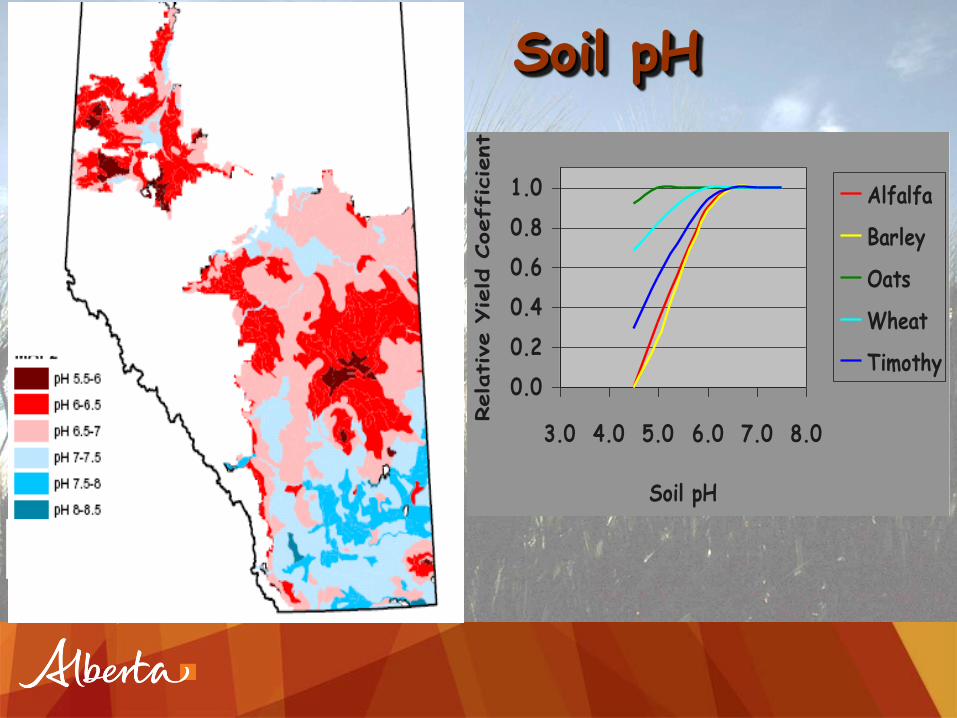
Soil pH
0.0
0.2
0.4
0.6
0.8
1.0
3.0 4.0 5.0 6.0 7.0 8.0
Soil pHRelative Y
ield
Coefficient
Alfalfa
Barley
Oats
Wheat
Timothy
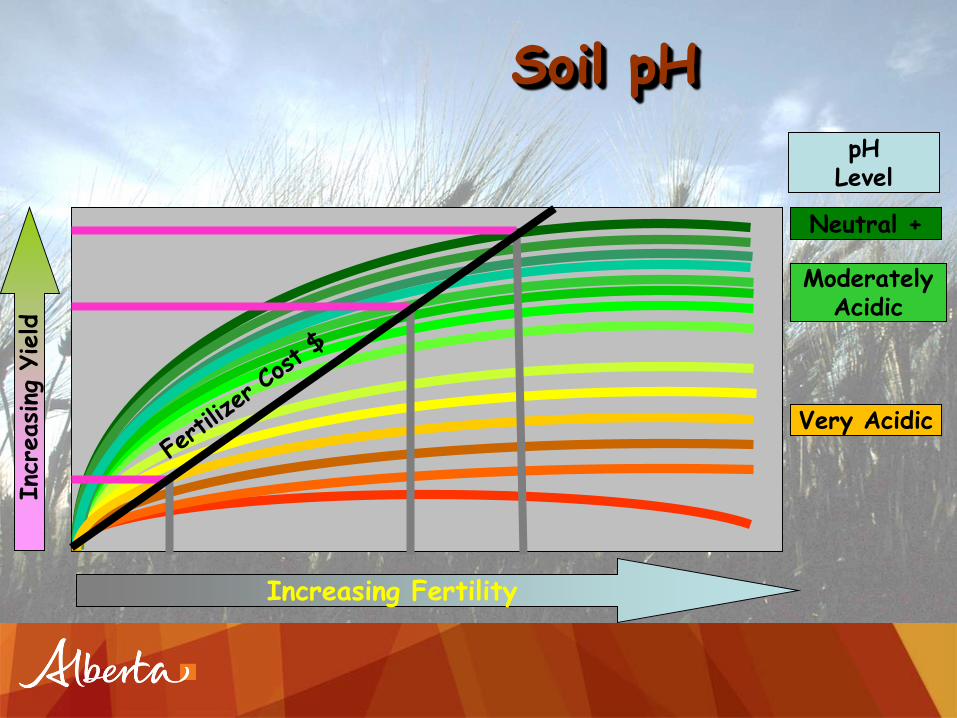
ModeratelyAcidic
Very Acidic
Increasing Fertility
Inc
reasing
Yield
Neutral +
Soil pH
pHLevel
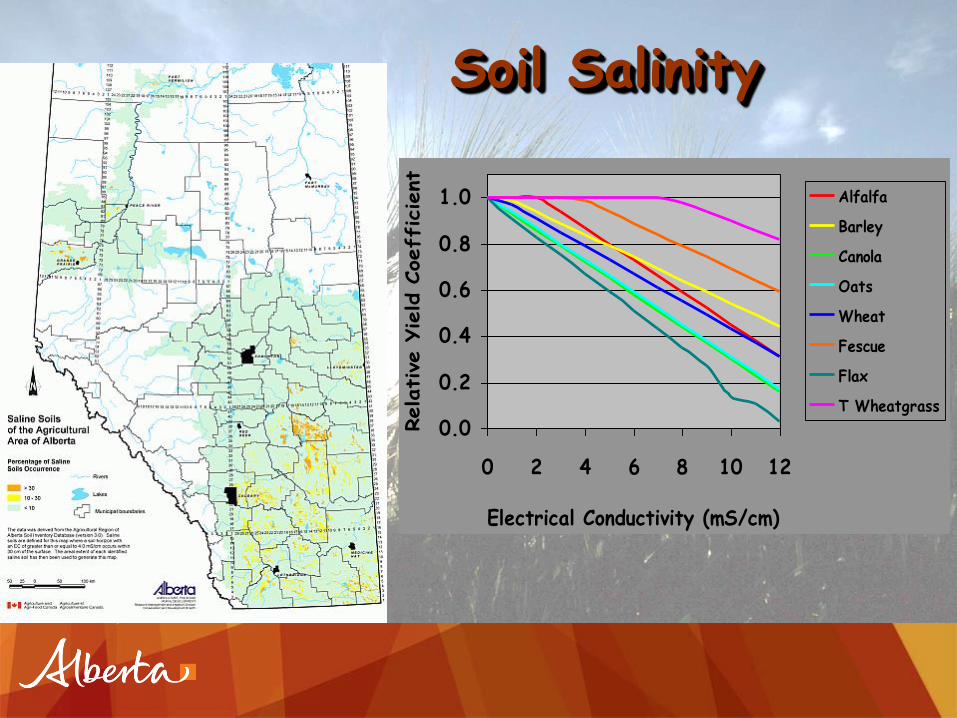
Soil Salinity
0.0
0.2
0.4
0.6
0.8
1.0
0 2 4 6 8 10 12
Electrical Conductivity (mS/cm)
Relative
Yield C
oefficient
Alfalfa
Barley
Canola
Oats
Wheat
Fescue
Flax
T Wheatgrass
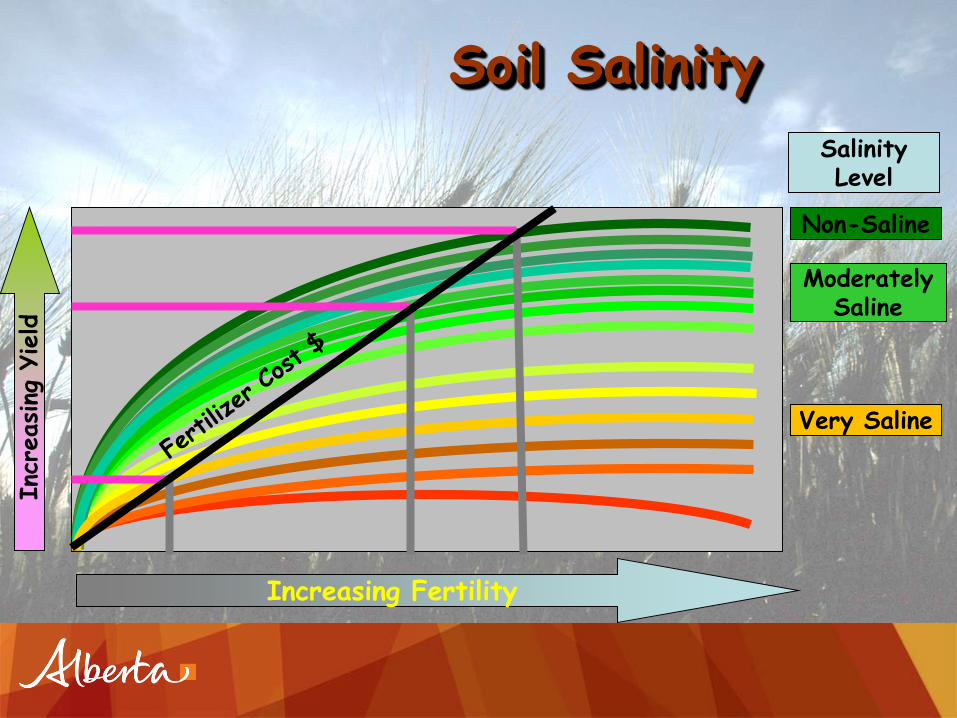
ModeratelySaline
Very Saline
Increasing Fertility
Inc
reasing
Yield
Non-Saline
Soil Salinity
SalinityLevel

Zones reflect differences Soils
Climate
(pptn, temp, growing season)
Crop management
Yield potential
Nutrient availability
Nutrient requirements
Agro-Climatic Zones
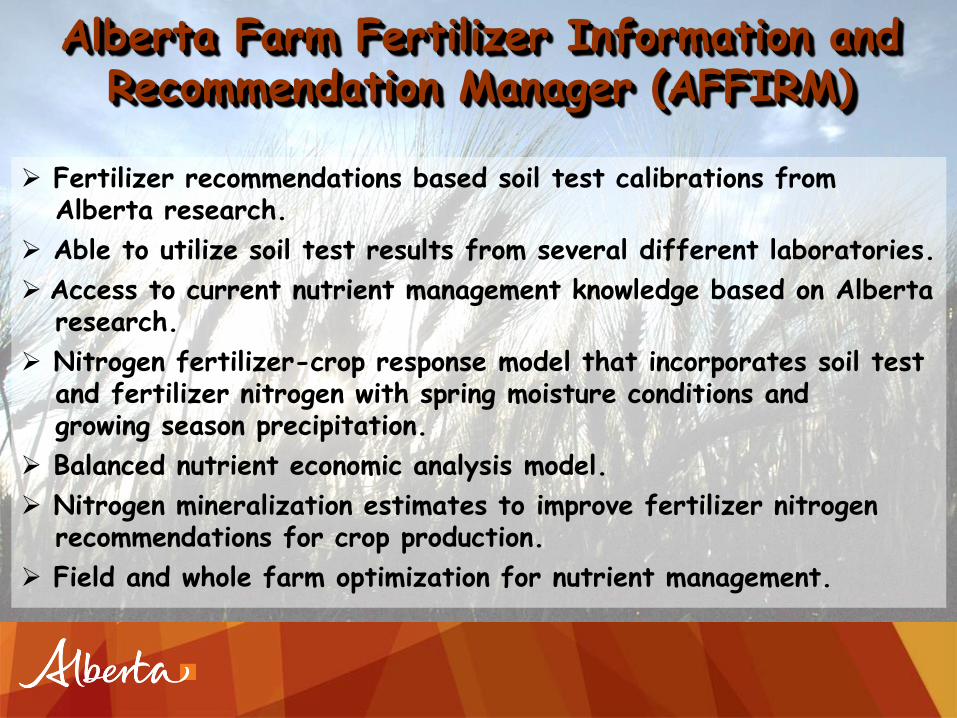
Alberta Farm Fertilizer Information and Recommendation Manager (AFFIRM)
Fertilizer recommendations based soil test calibrations from Alberta research.
Able to utilize soil test results from several different laboratories.
Access to current nutrient management knowledge based on Albertaresearch.
Nitrogen fertilizer-crop response model that incorporates soil test and fertilizer nitrogen with spring moisture conditions and growing season precipitation.
Balanced nutrient economic analysis model.
Nitrogen mineralization estimates to improve fertilizer nitrogenrecommendations for crop production.
Field and whole farm optimization for nutrient management.

AFFIRM Enhancements
Update Laboratories and Soil Test Calibrations
New fertilizer products research
Enhanced Efficiency FertilizersESN (coated urea) and other fertilizer products
4R Nutrient Stewardship
Product, Rate, Time, Placement
Incorporate nutrients from manure sources
Linkage to AB Climate Information Services andAB Soil Information Viewer
Your Responsibility Need to collect and handle the best representative sample.
Use a reputable laboratory.
Surface and subsurface samples.
Provide field management information.
Be aware of the soil test methods that the laboratory uses.
Is the laboratory using research data, soil test calibrations and recommendations appropriate for your region?
Does the laboratory have a QA/QC program?
Be careful when switching laboratories.
Unusual soil test results need to checked. Reanalyze or resample?
Key Messages Soil test laboratories provide a critical step in management
decisions of nutrients for optimum crop production, howeverthe best analytical process can not compensate for poorsample collection and handling.
Laboratory methods, calibrations and recommendations mustbe based on local (Alberta or western Canada) research.
Soil test methods will vary among laboratories and in their ability to measure crop available nutrients.
Calibration of soil test methods and recommendations can beinfluenced by soil properties (soil pH, texture, seedbed moisture), agro-climatic zones and cropping systems.
AFFIRM will provide access to 4R Nutrient Stewardshipfor a range of laboratory soil test methods.

Thank YouLen Kryzanowski, P.Ag.Director,
Environmental Strategy and Research
Alberta Agriculture and Forestry
Edmonton, AB
Phone: (780) 422-1252