assessing soil quality and interpreting soil test results · pdf filesustainable agriculture...
TRANSCRIPT
SuStainable agriculture FACTSHEET NO 3
1
Assessing soil quality and interpreting soil test resultsIntroductionSoil quality, in a viticultural context, can be thought of as the soil’s ability to support grapevine growth and the production of a crop (with consideration to both yield and quality) without resulting in soil degradation or harm to the environment. It includes the functions of soil such as the provision of a medium for vine growth, the retention and release of water, nutrient cycling and the regulation of biological populations. The assessment of soil quality should therefore include the analysis of its physical, chemical and biological properties. By conducting a range of fi eld and laboratory analytical tests, grape growers can determine whether corrective action is required to alleviate any constraints to soil use or whether their practices are having any benefi cial or deleterious impacts on soil quality. In established vineyards, soil testing is undertaken regularly (i.e. annually or biennially) in order to provide information that is required for making decisions on the need for and application rate of inputs such as fertilisers, soil amendments (e.g. lime and gypsum) and bio-fertilisers/inoculants (i.e. products which contain living micro-organisms).
Regular soil monitoring over time using sound sampling and measurement strategies is important. There is no single descriptor of soil quality; instead a ‘tool kit’ of indicator tests is used. Results from these tests should be evaluated by comparing them with known benchmark (or optimum threshold) values and vine performance criteria such as crop yield and fruit quality. Benchmark values should be evaluated against vine performance on a regional basis using diff erent soils and management practices over time.
The fi eld and laboratory measurements described in this publication have been selected on the basis of scientifi c merit and practicality (e.g. Oliver et al. 2013, Riches et al. 2013). For some soil tests (e.g. biological properties), little information is available on benchmark values to aid data interpretation.
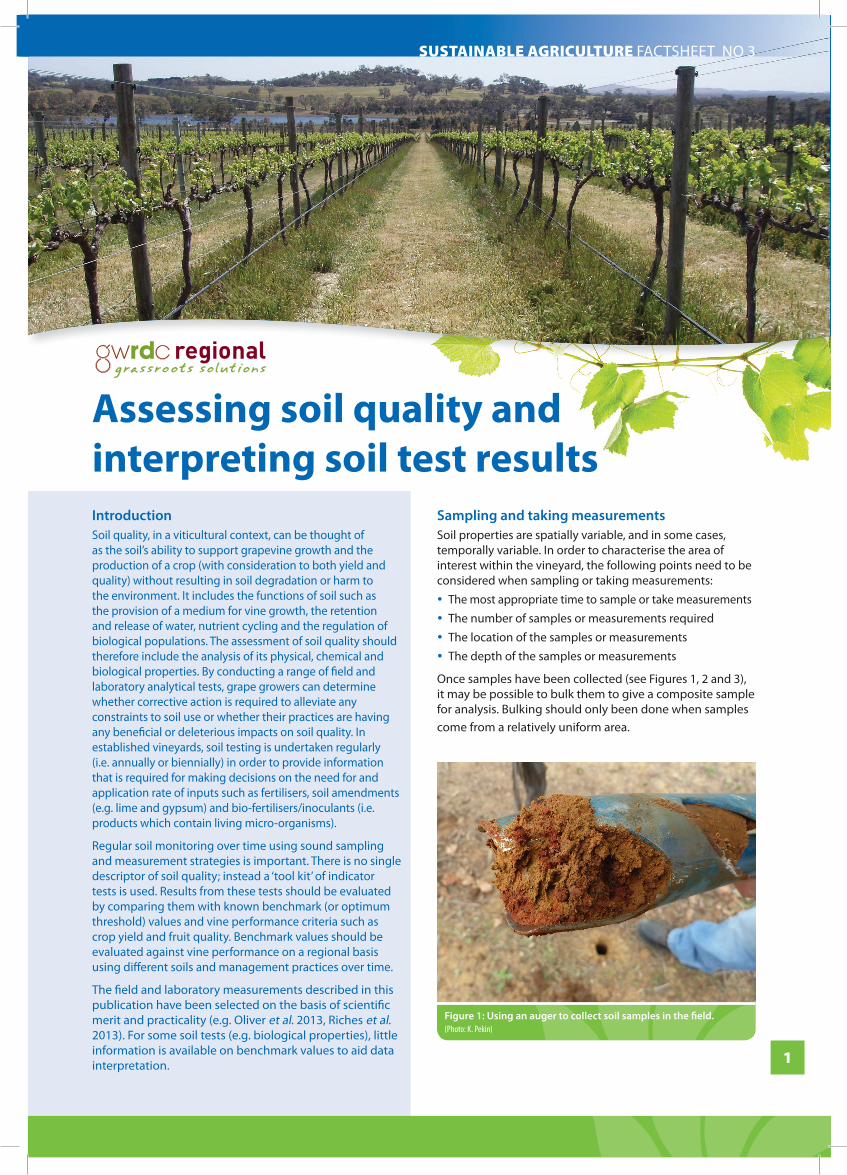
Figure 1: Using an auger to collect soil samples in the fi eld. (Photo: K. Pekin)
SuStainable agriculture FACTSHEET NO 3
Sampling and taking measurementsSoil properties are spatially variable, and in some cases, temporally variable. In order to characterise the area of interest within the vineyard, the following points need to be considered when sampling or taking measurements:
y The most appropriate time to sample or take measurements y The number of samples or measurements required y The location of the samples or measurements y The depth of the samples or measurements
Once samples have been collected (see Figures 1, 2 and 3), it may be possible to bulk them to give a composite sample for analysis. Bulking should only been done when samples come from a relatively uniform area.
2
Soil physical propertiesMeasures of soil physical properties are not routinely performed by laboratories and require specialised equipment which makes it difficult for grape growers to perform the measurements themselves. Due to the nature of these properties, it may take many years before changes are detectable.
Texture Soil texture (the proportion of sand, silt and clay) is an inherent property of soil and changes little with land use or management practice. It can be measured qualitatively in the field (see Figure 4) or quantitatively in the laboratory and is an important property because it determines the amount of water a soil can hold when fully wet and the rate at which water and dissolved solutes are potentially available for vine uptake. The information is of value for initial soil characterisation but not for monitoring change over time.
Soil structure and aggregate stabilitySoil structure has profound effects on water infiltration, available water capacity, drainage, aeration and root penetration (see Figure 5). These effects are partly due to the arrangements of aggregates of sand, silt and clay and the pores between them and partly due to the stability of the aggregates when immersed in water.
Aggregate stability can be measured in the field or laboratory using the slaking/dispersion test (see Figure 6 and Table 1) or, less commonly, in the laboratory using the wet sieving technique (Table 2). Soils which slake readily (i.e. aggregates separate into micro-aggregates) and/or disperse readily (i.e. micro-aggregates separate into single particles) indicate a weak structure that is easily degraded by raindrop impact and mechanical disturbance. This in turn impacts on the availability of water for meeting transpirational demand, the availability of oxygen for respiration at the soil-root interface and the functionality of the root system. Aggregate stability can be improved by increasing the organic matter content of the soil and by applying gypsum (calcium sulphate; CaSO4).
StrengthSoil strength determines the resistance of soil to breaking or deformation and is usually measured in the field quantitatively using a penetrometer (see Figure 7 and Table 3) or semi-quantitatively by hand and foot (Table 4). A soil with high strength (e.g. due to compaction, see Figure 8) is likely to limit the volume of soil that can be accessed by plant roots, as well as by soil flora and fauna. Since the results are highly dependent on soil water content, measurements should be taken and results compared at the same water content (preferably field capacity). The standard unit for expressing soil strength measurement is mega-pascal (MPa).
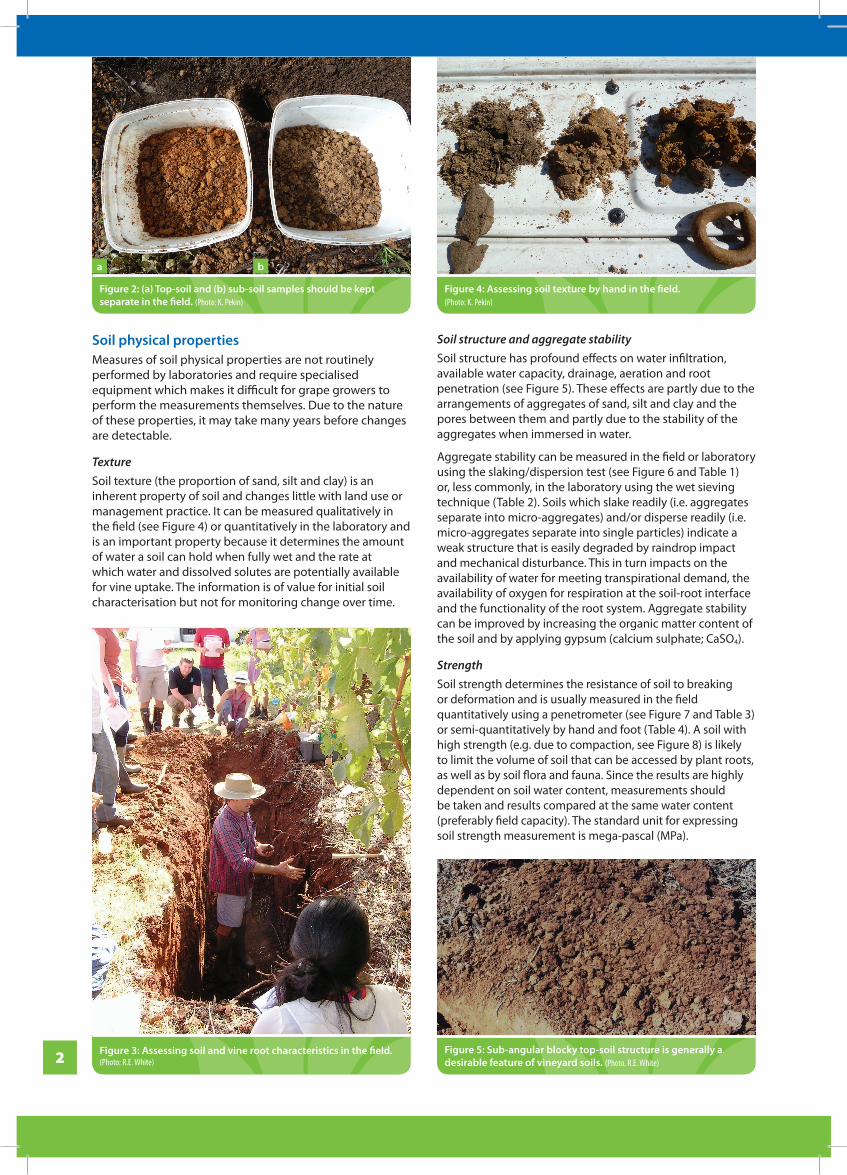
Figure 3: Assessing soil and vine root characteristics in the field. (Photo: R.E. White)
Figure 2: (a) Top-soil and (b) sub-soil samples should be kept separate in the field. (Photo: K. Pekin)
Figure 4: Assessing soil texture by hand in the field. (Photo: K. Pekin)
a b
Figure 5: Sub-angular blocky top-soil structure is generally a desirable feature of vineyard soils. (Photo. R.E. White)
3
SuStainable agriculture factsheet No 3
Table 1 Interpreting soil aggregate stability results derived from the dispersion test
Degree of dispersion1 Emerson aggregate class
ASWAT2 score
High (complete dispersion) 1 >12
High to moderate (partial dispersion)
2 9–12
Moderate to slight (complete or partial dispersion after remoulding)
3 1–8
Negligible (well-aggregated, with no dispersion after remoulding)
4 0
1 Dispersion may be suppressed in saline soils 2 Aggregate Stability to Water Source: Adapted from Hazelton and Murphy (2007)
Table 2 Interpreting soil aggregate stability results derived from the wet sieving technique
Aggregate stability rating % stable aggregates (1–2 mm)
Very low <10
Low 10–20
Moderate 20–30
High >30
Source: Adapted from Hazelton and Murphy (2007)
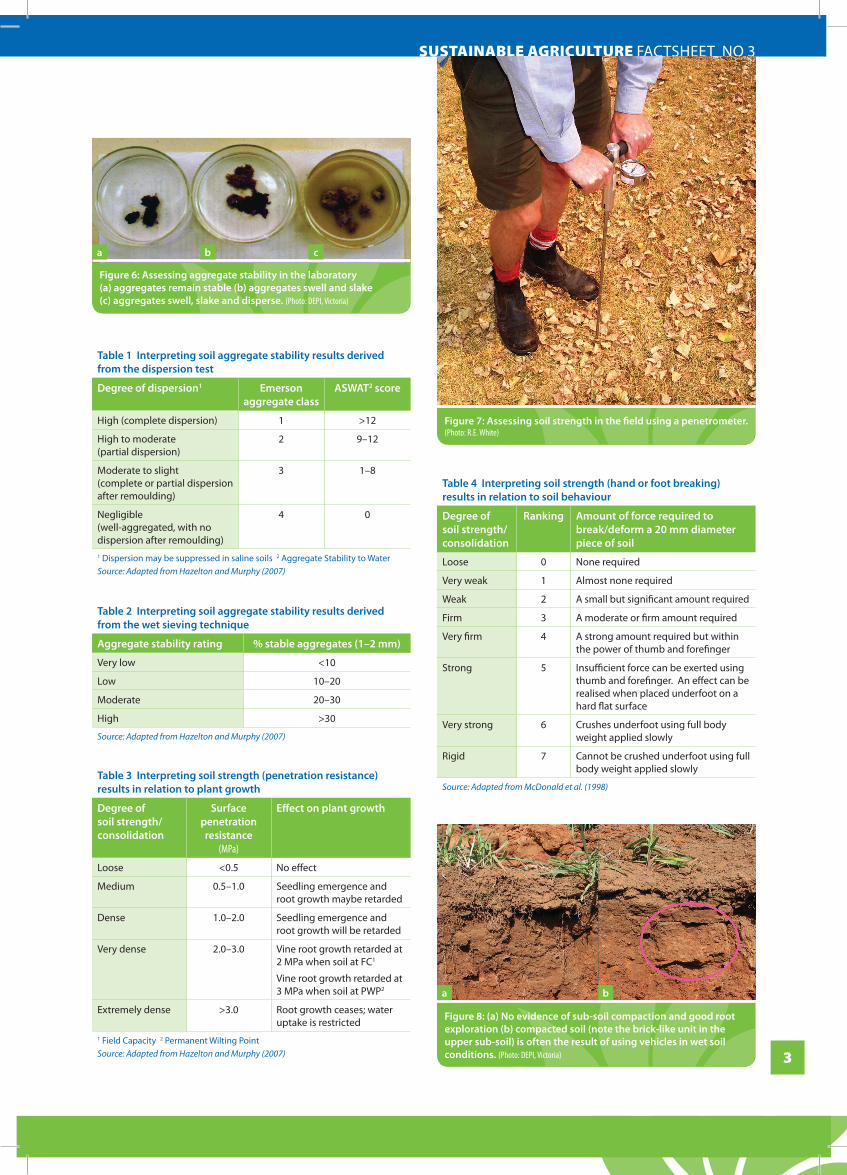
Table 4 Interpreting soil strength (hand or foot breaking) results in relation to soil behaviour
Degree of soil strength/consolidation
Ranking Amount of force required to break/deform a 20 mm diameter piece of soil
Loose 0 None required
Very weak 1 Almost none required
Weak 2 A small but significant amount required
Firm 3 A moderate or firm amount required
Very firm 4 A strong amount required but within the power of thumb and forefinger
Strong 5 Insufficient force can be exerted using thumb and forefinger. An effect can be realised when placed underfoot on a hard flat surface
Very strong 6 Crushes underfoot using full body weight applied slowly
Rigid 7 Cannot be crushed underfoot using full body weight applied slowly
Source: Adapted from McDonald et al. (1998)
Figure 7: Assessing soil strength in the field using a penetrometer. (Photo: R.E. White)
Figure 6: Assessing aggregate stability in the laboratory (a) aggregates remain stable (b) aggregates swell and slake (c) aggregates swell, slake and disperse. (Photo: DEPI, Victoria)
a b c
Figure 8: (a) No evidence of sub-soil compaction and good root exploration (b) compacted soil (note the brick-like unit in the upper sub-soil) is often the result of using vehicles in wet soil conditions. (Photo: DEPI, Victoria)
a b
Table 3 Interpreting soil strength (penetration resistance) results in relation to plant growth
Degree of soil strength/consolidation
Surface penetration resistance
(MPa)
Effect on plant growth
Loose <0.5 No effect
Medium 0.5–1.0 Seedling emergence and root growth maybe retarded
Dense 1.0–2.0 Seedling emergence and root growth will be retarded
Very dense 2.0–3.0 Vine root growth retarded at 2 MPa when soil at FC1
Vine root growth retarded at 3 MPa when soil at PWP2
Extremely dense >3.0 Root growth ceases; water uptake is restricted
1 Field Capacity 2 Permanent Wilting PointSource: Adapted from Hazelton and Murphy (2007)
4
Soil chemical propertiesThe primary function of soil in relation to chemical properties is to provide nutrients for plant and crop growth. In addition, the soil’s chemical properties need to be suitable for nutrient uptake. Commercial laboratories off er a range of soil chemical tests such as pH, electrical conductivity, cation exchange capacity and exchangeable cations, sodicity and the availability of macro- and micro-nutrients.
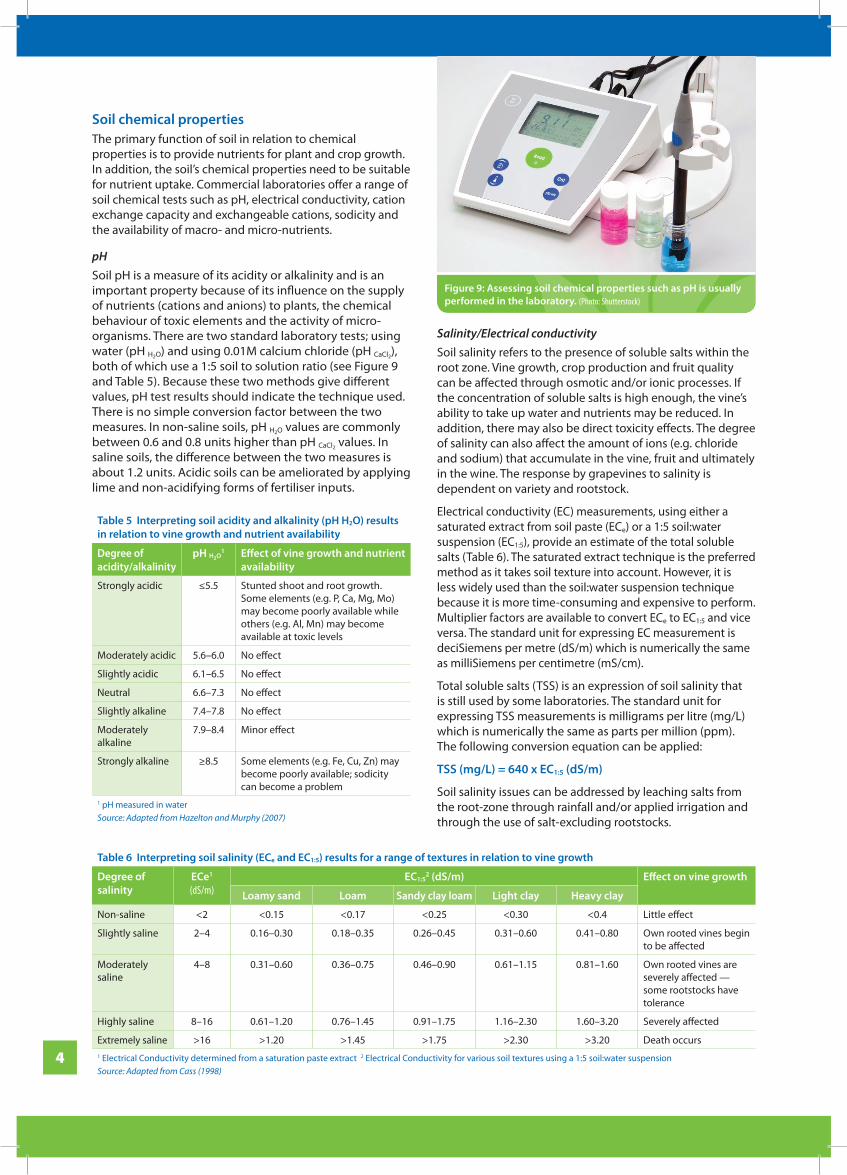
pHSoil pH is a measure of its acidity or alkalinity and is an important property because of its infl uence on the supply of nutrients (cations and anions) to plants, the chemical behaviour of toxic elements and the activity of micro-organisms. There are two standard laboratory tests; using water (pH H2O) and using 0.01M calcium chloride (pH CaCl2), both of which use a 1:5 soil to solution ratio (see Figure 9 and Table 5). Because these two methods give diff erent values, pH test results should indicate the technique used. There is no simple conversion factor between the two measures. In non-saline soils, pH H2O values are commonly between 0.6 and 0.8 units higher than pH CaCl2 values. In saline soils, the diff erence between the two measures is about 1.2 units. Acidic soils can be ameliorated by applying lime and non-acidifying forms of fertiliser inputs.
Salinity/Electrical conductivitySoil salinity refers to the presence of soluble salts within the root zone. Vine growth, crop production and fruit quality can be aff ected through osmotic and/or ionic processes. If the concentration of soluble salts is high enough, the vine’s ability to take up water and nutrients may be reduced. In addition, there may also be direct toxicity eff ects. The degree of salinity can also aff ect the amount of ions (e.g. chloride and sodium) that accumulate in the vine, fruit and ultimately in the wine. The response by grapevines to salinity is dependent on variety and rootstock.
Electrical conductivity (EC) measurements, using either a saturated extract from soil paste (ECe) or a 1:5 soil:water suspension (EC1:5), provide an estimate of the total soluble salts (Table 6). The saturated extract technique is the preferred method as it takes soil texture into account. However, it is less widely used than the soil:water suspension technique because it is more time-consuming and expensive to perform. Multiplier factors are available to convert ECe to EC1:5 and vice versa. The standard unit for expressing EC measurement is deciSiemens per metre (dS/m) which is numerically the same as milliSiemens per centimetre (mS/cm).
Total soluble salts (TSS) is an expression of soil salinity that is still used by some laboratories. The standard unit for expressing TSS measurements is milligrams per litre (mg/L) which is numerically the same as parts per million (ppm). The following conversion equation can be applied:
TSS (mg/L) = 640 x EC1:5 (dS/m)
Soil salinity issues can be addressed by leaching salts from the root-zone through rainfall and/or applied irrigation and through the use of salt-excluding rootstocks.
Table 6 Interpreting soil salinity (ECe and EC1:5) results for a range of textures in relation to vine growth
Degree of salinity
ECe1 (dS/m)
EC1:52 (dS/m) Eff ect on vine growth
Loamy sand Loam Sandy clay loam Light clay Heavy clay
Non-saline <2 <0.15 <0.17 <0.25 <0.30 <0.4 Little eff ect
Slightly saline 2–4 0.16–0.30 0.18–0.35 0.26–0.45 0.31–0.60 0.41–0.80 Own rooted vines begin to be aff ected
Moderately saline
4–8 0.31–0.60 0.36–0.75 0.46–0.90 0.61–1.15 0.81–1.60 Own rooted vines are severely aff ected — some rootstocks have tolerance
Highly saline 8–16 0.61–1.20 0.76–1.45 0.91–1.75 1.16–2.30 1.60–3.20 Severely aff ected
Extremely saline >16 >1.20 >1.45 >1.75 >2.30 >3.20 Death occurs1 Electrical Conductivity determined from a saturation paste extract 2 Electrical Conductivity for various soil textures using a 1:5 soil:water suspension Source: Adapted from Cass (1998)
Table 5 Interpreting soil acidity and alkalinity (pH H2O) results in relation to vine growth and nutrient availability
Degree of acidity/alkalinity
pH H2O1 Eff ect of vine growth and nutrient
availability
Strongly acidic ≤5.5 Stunted shoot and root growth. Some elements (e.g. P, Ca, Mg, Mo) may become poorly available while others (e.g. Al, Mn) may become available at toxic levels
Moderately acidic 5.6–6.0 No eff ect
Slightly acidic 6.1–6.5 No eff ect
Neutral 6.6–7.3 No eff ect
Slightly alkaline 7.4–7.8 No eff ect
Moderately alkaline
7.9–8.4 Minor eff ect
Strongly alkaline ≥8.5 Some elements (e.g. Fe, Cu, Zn) may become poorly available; sodicity can become a problem
1 pH measured in water Source: Adapted from Hazelton and Murphy (2007)
Figure 9: Assessing soil chemical properties such as pH is usually performed in the laboratory. (Photo: Shutterstock)

5
Cation exchange capacityThe cation exchange capacity (CEC) of a soil represents the capacity of the soil to hold and exchange positively charged cations. It is an important property since it infl uences the structural stability and pH of soil, the availability of nutrients for plant growth, and the soil’s reaction to fertilisers and other ameliorants. CEC can be measured directly in the laboratory by determining the amount of cations exchanged from the extracting solution (CEC measured). Alternatively in non-acid soils, CEC can be calculated as the sum of the base cations (CEC bases) (Table 7).
The CEC is a single value and therefore does not indicate which cation(s) predominate. Soils with a low value (CEC <5) generally have a low fertility status and a low resistance to changes in soil chemistry caused by land management practices. Sandy soils and acid soils often have a low CEC, while clay soils generally have a high CEC. The type of clay mineral also has a strong infl uence on CEC. The standard unit for expressing CEC and individual exchangeable cation measurements is centimole per kilogram of soil (cmol[+]/kg) which is numerically the same as milliequivalents per 100 grams of soil (meq/100 g).
The fi ve most abundant exchangeable cations in soils are sodium (Na+), calcium (Ca2+), magnesium (Mg2+), potassium (K+) and, in strongly acidic soils, aluminium (Al3+) (Table 8). Aluminium may become freely available to vines at toxic levels when Al3+ is >5% of the CEC and when the soil is strongly acidic (pH H2O ≤5.5). Other cations are usually in amounts that do not contribute signifi cantly to the cation complement.
SodicityThe sodicity of a soil is assessed in the laboratory and is expressed as either the exchangeable sodium percentage (ESP) or the sodium adsorption ratio (SAR) (Table 9). ESP is the amount of Na+ adsorbed on to soil particle surfaces as a proportion of the CEC. SAR is the relative concentration of Na+ to Ca2+ and Mg2 in the soil solution and is determined using either a saturation extract (SARe) or a 1:5 soil:water extract (SAR1:5). The soil:water extract method is cheaper but less accurate.
When in contact with water, a sodic soil will generally swell and disperse into small clay particles. As the soil dries, the clay particles block the soil pores resulting in poor water infi ltration, decreased available water capacity, hard setting and drainage/aeration issues (see Figure 10). These physical soil conditions generally have an adverse eff ect on vine growth and productivity. They can be ameliorated by applying gypsum and by reducing the frequency and severity of tillage operations, avoiding over-irrigation and increasing soil organic matter levels through the use of cover crops and mulches.
Macro- and micro-nutrientsA number of macro- and micro-nutrients are required for vegetative and reproductive growth. Certain nutrients can also infl uence the quality of fruit produced which, in turn, may aff ect the quality of must and wine. For a number of reasons, plant tissue analysis (e.g. petioles) as opposed to soil analysis is considered to be more eff ective and more reliable in assessing a grapevine’s nutritional status and hence the defi ciency or excess of nutrients in established vineyards. Even so, it remains common practice to have nutrient concentrations analysed in soil samples (particularly at the time of vineyard establishment) and a number of benchmark values have been derived, albeit based on limited calibration data (Table 10). The concentrations of nutrients (e.g. nitrogen) change over time, which make soil test results inconsistent and therefore diffi cult to interpret reliably.
Table 7 Interpreting soil cation exchange capacity (CEC measured and CEC bases) results
CEC rating CEC measured1
(cmol[+]/kg)CEC bases
2 (cmol[+]/kg)
Low <5 <3
Moderate 5–15 3–10
High >15 >101 Cation Exchange Capacity determined as the amount of cations exchanged from the extracting solution 2 Cation Exchange Capacity calculated as the sum of the base cations Source: Adapted from Nicholas (2004)
Table 9 Interpreting soil sodicity (ESP, SARe and SAR1:5) results in relation to soil structural stability
Degree of sodicity ESP (%)1 SARe2 SAR1:5
3 Eff ect on soil structural stability
Non-sodic <6 <6 <3 Generally stable
Marginally sodic 6–15 6–15 3–7 Aggregates susceptible to dispersion when wet
Strongly sodic >15 >15 >7 Dispersion occurs spontaneously by rainfall and/or irrigation 1 Exchangeable Sodium Percentage 2 Sodium Adsorption Ratio determined using a saturation extract 3 Sodium Adsorption Ratio determined using a 1:5 soil:water extractSource: Adapted from (Nicholas 2004)
Figure 10: The dispersion of clay particles results in a crusted/sealed soil surface which limits the infi ltration of water and the emergence of plants. (Photo: T. Proffi tt)
Table 8 Interpreting exchangeable cation results1
Cation Low (cmol[+]/kg)
Moderate (cmol[+]/kg)
High (cmol[+]/kg)
Ca <5 5-10 >10
Mg <1 1-5 >5
Na <0.3 0.3-1.0 >1
K <0.5 0.5-1.0 >1
Al <0.1 0.1-1.0 >11 Note that desirable levels of individual cations vary according to soil type and the crop being grownSource: Adapted from Nicholas (2004)
SuStainable agriculture FACTSHEET NO 3

6
Petiole benchmark values for assessing vine nutrient status are available in Robinson et al. (1997) and in Goldspink and Howes (2001). These should also be viewed with some caution since they are considered appropriate for commercial, high yielding (8–15+ t/ha), irrigated vineyards but not necessarily appropriate for lower yielding (4–8 t/ha), irrigated or dry-grown vineyards. They are also not appropriate for all grapevine varieties or rootstocks.
Soil biological propertiesSoil biological properties encompass living soil organisms (micro-fl ora, meso-fauna and macro-fauna) and residues (dead material making up soil organic matter) living on and in the soil (see Figure 11). Soil organisms have an impact on plant production systems through the modifi cation of the soil physical, chemical and biological environment. They can be grouped according to their main functions; (i) the micro-food web organisms (e.g. bacteria and fungi), (ii) the litter transformers (e.g. micro-, meso- and macro-fauna) that assist in the decomposition of organic matter, and (iii) the habitat creators/modifi ers (e.g. earthworms, ants and termites).
Soil biological tests relate primarily to measurements of the amount, activity and diversity of soil organisms and their related biochemical processes. However, because they are diffi cult to measure and quantify, benchmark values are not as readily available as for physical and chemical soil tests. Where information is available, it has generally been derived from broad-acre agriculture rather than from viticultural research.
Organic matter/carbonOrganic matter (OM) is usually expressed in the form of organic carbon (OC). OC is readily available as a carbon and energy source and is important because of its association with nutrients and the benefi cial contributions it makes
Table 10 Interpreting commonly analysed soil nutrient results (expressed in mg/kg) in relation to wine grape production
Nutrient1 Defi cient Marginal Adequate High Toxic
Nitrogen (NO3-) (N) <1 1–2 2–10 >10 -
Potassium (K) <50 50–100 100–250 >250 -
Phosphorus (P) <25 25–35 35–80 >80 -
Copper (Cu) <0.1 0.1–0.2 0.2–0.4 >0.4 >2
Zinc (Zn) <0.5 0.5–1.0 1–2 2–20 >20
Manganese (Mn) - <2 2–4 - -
Iron (Fe) - - >4.5 - -
Aluminium (Al) - - - - >100
Boron (B) <0.1 - 0.2–1.0 - >3
Sulphur (S) <10 - - - -1 NO3- Nitrate form of N; K, P — Colwell bicarbonate extractable; Cu, Zn, Mn, Fe — DTPA extractable; Al — ammonium chloride extract; B — hot water extractSource: Adapted from Lanyon et al. (2004)
Figure 11: The diversity of soil organisms found in soils can be extremely high. (a) Fungi (b) Arbuscular mycorrhizae (c) Bacteria (d) Protozoa (e) Nematodes. (Photo: DEPI, Victoria)
a b c d e
to all soil properties. OM levels are usually determined by measuring the amount of OC present in the soil, and then multiplying this value by 1.72.
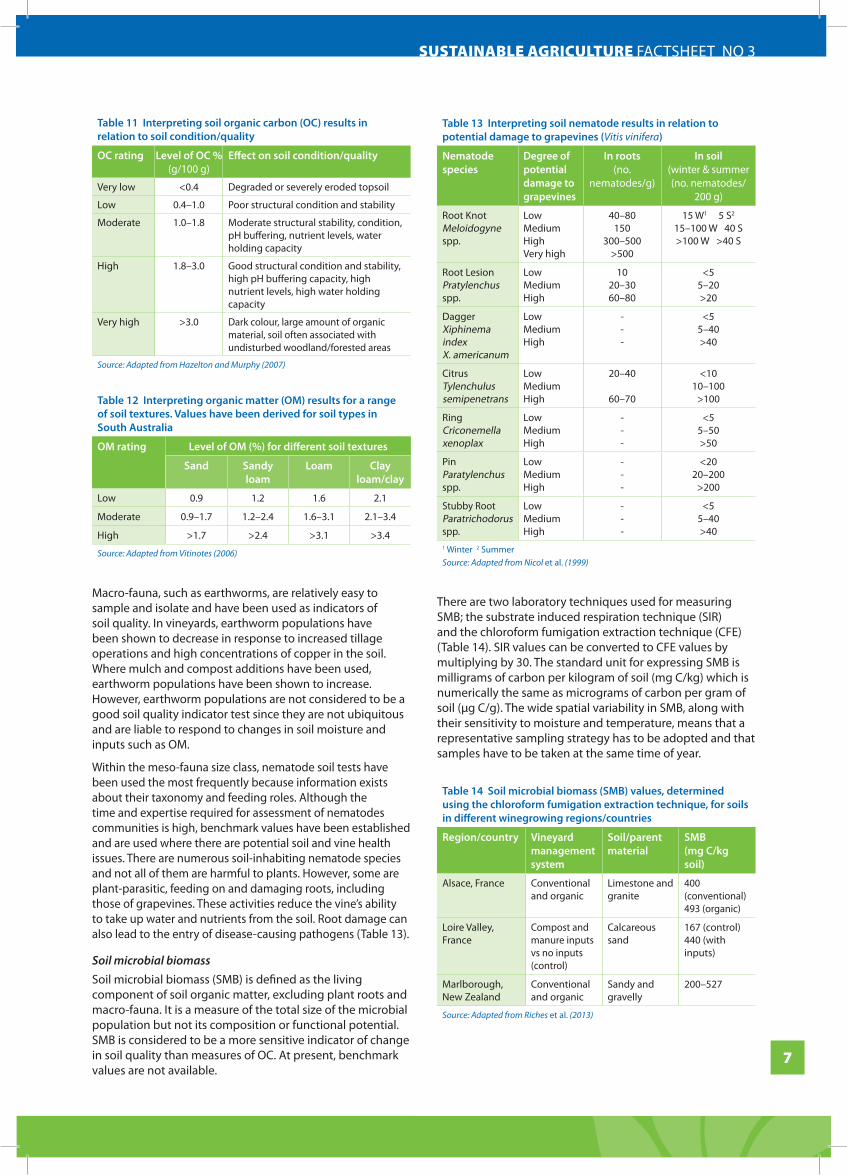
A number of laboratory tests are used to measure OC, with the majority focusing on the total amount present rather than the labile forms. OM and OC values are generally expressed as either a % or as g/100 g of soil. OC values for diff erent textures are usually interpreted with respect to soil condition (or quality) since interpretive criteria that are meaningful to vine performance are not readily available (Tables 11 and 12).
Soil micro-fl oraSoils contain a diverse range of micro-fl ora (archaea, bacteria and fungi). At present, the ecological function of many species within this group of soil organisms is unknown and hence benchmark values have yet to be established. Where benchmark values do exist, they are primarily for soil pathogens.
One group of organism with a known ecological function is the arbuscular mycorrhizal fungi (AMF). AMF have been shown to be benefi cial through their symbiotic relationship with plant root systems, including grapevines. The level of AMF infection may be a good indicator of soil quality in low input vineyards, but may not be of universal use for viticulture.
Soil faunaSoil fauna are categorised into three size classes based on body width; micro-fauna (<100 µm; e.g. protozoa), meso-fauna (100 µm to 2 mm; e.g. nematodes, mites, springtails) and macro-fauna (>2 mm; e.g. earthworms, ants). As for micro-fl ora, benchmark values exist for only a few groups due to diffi culties associated with sampling, isolation and identifi cation.
7
SuStainable agriculture FACTSHEET NO 3
Macro-fauna, such as earthworms, are relatively easy to sample and isolate and have been used as indicators of soil quality. In vineyards, earthworm populations have been shown to decrease in response to increased tillage operations and high concentrations of copper in the soil. Where mulch and compost additions have been used, earthworm populations have been shown to increase. However, earthworm populations are not considered to be a good soil quality indicator test since they are not ubiquitous and are liable to respond to changes in soil moisture and inputs such as OM.
Within the meso-fauna size class, nematode soil tests have been used the most frequently because information exists about their taxonomy and feeding roles. Although the time and expertise required for assessment of nematodes communities is high, benchmark values have been established and are used where there are potential soil and vine health issues. There are numerous soil-inhabiting nematode species and not all of them are harmful to plants. However, some are plant-parasitic, feeding on and damaging roots, including those of grapevines. These activities reduce the vine’s ability to take up water and nutrients from the soil. Root damage can also lead to the entry of disease-causing pathogens (Table 13).
Soil microbial biomassSoil microbial biomass (SMB) is defi ned as the living component of soil organic matter, excluding plant roots and macro-fauna. It is a measure of the total size of the microbial population but not its composition or functional potential. SMB is considered to be a more sensitive indicator of change in soil quality than measures of OC. At present, benchmark values are not available.
Table 12 Interpreting organic matter (OM) results for a range of soil textures. Values have been derived for soil types in South Australia
OM rating Level of OM (%) for diff erent soil textures
Sand Sandy loam
Loam Clay loam/clay
Low 0.9 1.2 1.6 2.1
Moderate 0.9–1.7 1.2–2.4 1.6–3.1 2.1–3.4
High >1.7 >2.4 >3.1 >3.4
Source: Adapted from Vitinotes (2006)
Table 11 Interpreting soil organic carbon (OC) results in relation to soil condition/quality
OC rating Level of OC % (g/100 g)
Eff ect on soil condition/quality
Very low <0.4 Degraded or severely eroded topsoil
Low 0.4–1.0 Poor structural condition and stability
Moderate 1.0–1.8 Moderate structural stability, condition, pH buff ering, nutrient levels, water holding capacity
High 1.8–3.0 Good structural condition and stability, high pH buff ering capacity, high nutrient levels, high water holding capacity
Very high >3.0 Dark colour, large amount of organic material, soil often associated with undisturbed woodland/forested areas
Source: Adapted from Hazelton and Murphy (2007)
Table 13 Interpreting soil nematode results in relation to potential damage to grapevines (Vitis vinifera)
Nematode species
Degree of potential damage to grapevines
In roots (no.
nematodes/g)
In soil (winter & summer (no. nematodes/
200 g)
Root Knot Meloidogyne spp.
LowMediumHighVery high
40–80150
300–500>500
15 W1 5 S2
15–100 W 40 S>100 W >40 S
Root LesionPratylenchus spp.
LowMediumHigh
1020–3060–80
<55–20>20
DaggerXiphinema indexX. americanum
Low MediumHigh
---
<55–40>40
CitrusTylenchulus semipenetrans
Low MediumHigh
20–40
60–70
<1010–100
>100
RingCriconemella xenoplax
Low MediumHigh
---
<55–50>50
PinParatylenchus spp.
LowMediumHigh
---
<2020–200
>200
Stubby RootParatrichodorus spp.
LowMediumHigh
---
<55–40>40
1 Winter 2 SummerSource: Adapted from Nicol et al. (1999)
Table 14 Soil microbial biomass (SMB) values, determined using the chloroform fumigation extraction technique, for soils in diff erent winegrowing regions/countries
Region/country Vineyard management system
Soil/parent material
SMB(mg C/kg soil)
Alsace, France Conventional and organic
Limestone and granite
400 (conventional) 493 (organic)
Loire Valley, France
Compost and manure inputs vs no inputs (control)
Calcareous sand
167 (control) 440 (with inputs)
Marlborough, New Zealand
Conventional and organic
Sandy and gravelly
200–527
Source: Adapted from Riches et al. (2013)
There are two laboratory techniques used for measuring SMB; the substrate induced respiration technique (SIR) and the chloroform fumigation extraction technique (CFE) (Table 14). SIR values can be converted to CFE values by multiplying by 30. The standard unit for expressing SMB is milligrams of carbon per kilogram of soil (mg C/kg) which is numerically the same as micrograms of carbon per gram of soil (µg C/g). The wide spatial variability in SMB, along with their sensitivity to moisture and temperature, means that a representative sampling strategy has to be adopted and that samples have to be taken at the same time of year.
8
Publ
ishe
d A
pril
2014
Acknowledgements The Grape and Wine Research and Development Corporation (GWRDC) provided funding for this publication through their ‘Regional Grassroots Solutions’ program which is managed in Western Australia by Wines of Western Australia (WWA). WWA acknowledge the input of Tony Proffitt (AHA Viticulture) who researched and wrote the contents of this publication, Robert White (University of Melbourne) for his comments and photographs and Keith Pekin (Perth Region NRM) who managed the project on behalf of WWA through funding provided by the Federal Government’s ‘Caring for our Country’ program.
disclAimer The interpretations of soil and water test results provided in this publication are to be used as a general guide only. Wines of Western Australia accept no liability by reason of negligence or otherwise arising from the use or release of this information or any part of it. In relying on or using any advice or information that has been expressed or implied and contained within this publication, you accept all risks and responsibility.
ContactKeith Pekin Manager, Sustainable Agriculture Perth Region Natural Resource Management
M: 0466 744 957 E: [email protected] W: www.perthregionnrm.com
References1. Cass, A. (1998). Measuring and managing chemical impediments to
growth. Australian Grapegrower & Winemaker. 415, 13–16.2. Goldspink, B.H. and Howes, K.M. (Eds) (2001). Fertilisers for Wine
Grapes. 3rd Edition. Department of Agriculture and Food Western Australia. Bulletin 4421.
3. Hazelton, P. and Murphy, B. (2007). Interpreting soil test results. What do all the numbers mean? CSIRO Publishing, Victoria.
4. McDonald, R.C., Isbell, R.F., Speight, J.G., Walker, J. and Hopkins, M.S. (1998). Australian soil and land survey field handbook. 2nd Edition. CSIRO Publishing, Victoria.
5. Nicholas, P. (2004). Soil, irrigation and nutrition. Grape Production Series No. 2. South Australian Research and Development Institute. Adelaide, South Australia.
6. Nicol, J.M., Stirling, G.R., Rose, B.J., May, P. and Van Heeswijck, R. (1999). Impact of nematodes on grapevine growth and productivity: current knowledge and future directions, with special reference to Australian viticulture. Australian Journal of Grape and Wine Research 5(3): 109–127.
7. Oliver, D.P., Bramley, R.G.V., Riches, D., Porter, I. and Edwards, J. (2013). Review: soil physical and chemical properties as indicators of soil quality in Australian viticulture. Australian Journal of Grape and Wine Research. 19(2): 129–139.
8. Riches, D., Porter, I., Bramley, R.G.V., Rawnsley, B., Edwards, J. and White, R.E. (2013). Review: soil biological properties as indicators of soil quality in Australian viticulture. Australian Journal of Grape and Wine Research. 19(3): 311–323.
9. Robinson, J.B. (1997). Grapevine nutrition. In: B.G. Coombe and P.R. Dry (Eds). Viticulture Volume 2 — Practices. Winetitles, Adelaide, South Australia.
10. Vitinotes (2006). Measuring organic carbon in soil. Cooperative Research Centre for Viticulture, Adelaide, South Australia.
Publication referenceProffitt, T. (2014). Assessing soil quality and interpreting soil test results. www.winewa.asn.au
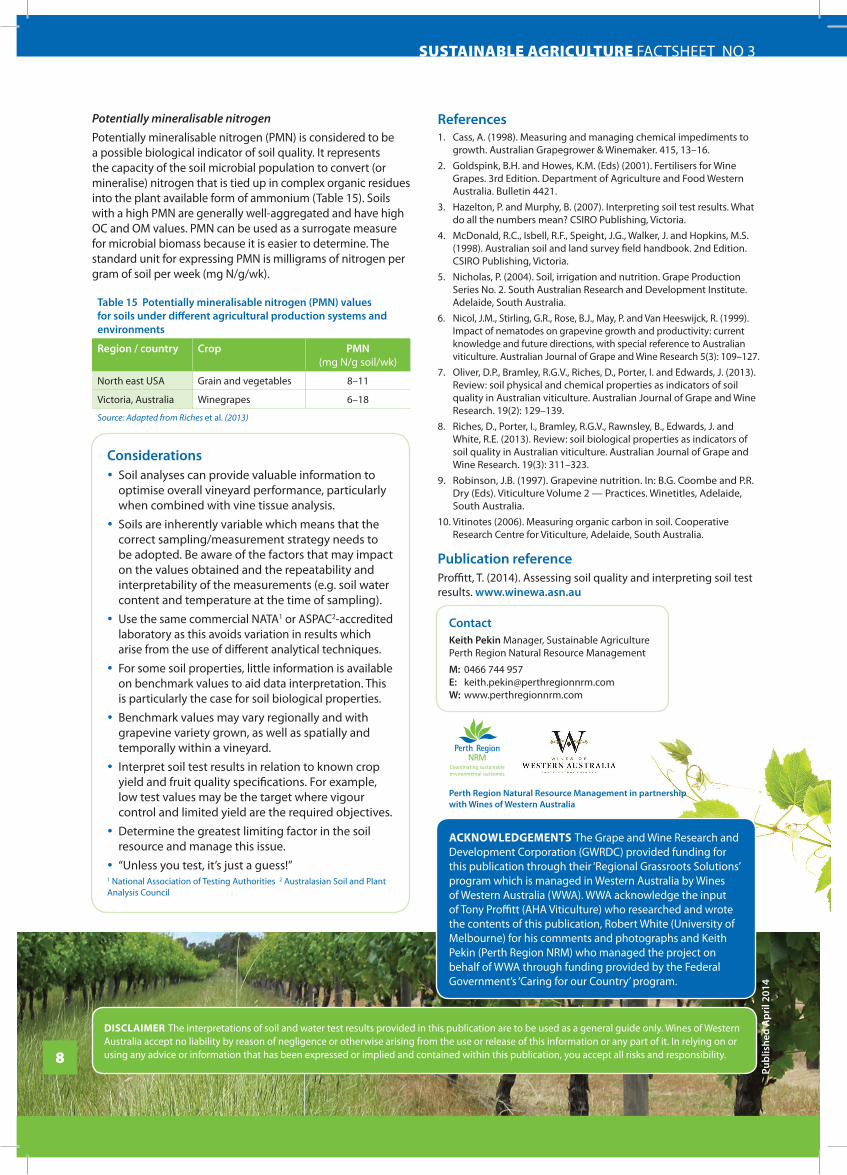
Potentially mineralisable nitrogen Potentially mineralisable nitrogen (PMN) is considered to be a possible biological indicator of soil quality. It represents the capacity of the soil microbial population to convert (or mineralise) nitrogen that is tied up in complex organic residues into the plant available form of ammonium (Table 15). Soils with a high PMN are generally well-aggregated and have high OC and OM values. PMN can be used as a surrogate measure for microbial biomass because it is easier to determine. The standard unit for expressing PMN is milligrams of nitrogen per gram of soil per week (mg N/g/wk).
Table 15 Potentially mineralisable nitrogen (PMN) values for soils under different agricultural production systems and environments
Region / country Crop PMN (mg N/g soil/wk)
North east USA Grain and vegetables 8–11
Victoria, Australia Winegrapes 6–18
Source: Adapted from Riches et al. (2013)
Considerations y Soil analyses can provide valuable information to
optimise overall vineyard performance, particularly when combined with vine tissue analysis.
y Soils are inherently variable which means that the correct sampling/measurement strategy needs to be adopted. Be aware of the factors that may impact on the values obtained and the repeatability and interpretability of the measurements (e.g. soil water content and temperature at the time of sampling).
y Use the same commercial NATA1 or ASPAC2-accredited laboratory as this avoids variation in results which arise from the use of different analytical techniques.
y For some soil properties, little information is available on benchmark values to aid data interpretation. This is particularly the case for soil biological properties.
y Benchmark values may vary regionally and with grapevine variety grown, as well as spatially and temporally within a vineyard.
y Interpret soil test results in relation to known crop yield and fruit quality specifications. For example, low test values may be the target where vigour control and limited yield are the required objectives.
y Determine the greatest limiting factor in the soil resource and manage this issue.
y “Unless you test, it’s just a guess!”1 National Association of Testing Authorities 2 Australasian Soil and Plant Analysis Council
SuStainable agriculture FACTSHEET NO 3
Perth Region Natural Resource Management in partnership with Wines of Western Australia