soil phosphorus soil test recommendations and phosphate...
TRANSCRIPT

Soil Phosphorus,Soil Test Recommendations and
Phosphate Fertilizer Management
Len Kryzanowski, P.Ag.
Director, Environmental Strategy and Research
Environmental Stewardship Branch
Alberta Agriculture and Forestry

Dr Ross McKenzie Dr Rigas Karamanos
(Koch Fertilizer/Koch Agronomic Services) International Plant Nutrition Institute (IPNI) Pulse Canada and Stratus Ag Research
Acknowledgements

Second most widely deficient nutrient - Why?– Soils low in P minerals in the parent material – Very low solubility in the soil of phosphate
2 anionic forms available for plant uptake; – pH dependent– primary orthophosphate (H2PO4
-)– secondary orthophosphate (HPO4
=) Compared to N & K, plant content is smaller
- Plants contain 0.1 – 0.5% P P forms organic compounds in the plant P is mobile in plants
Phosphorus Overview
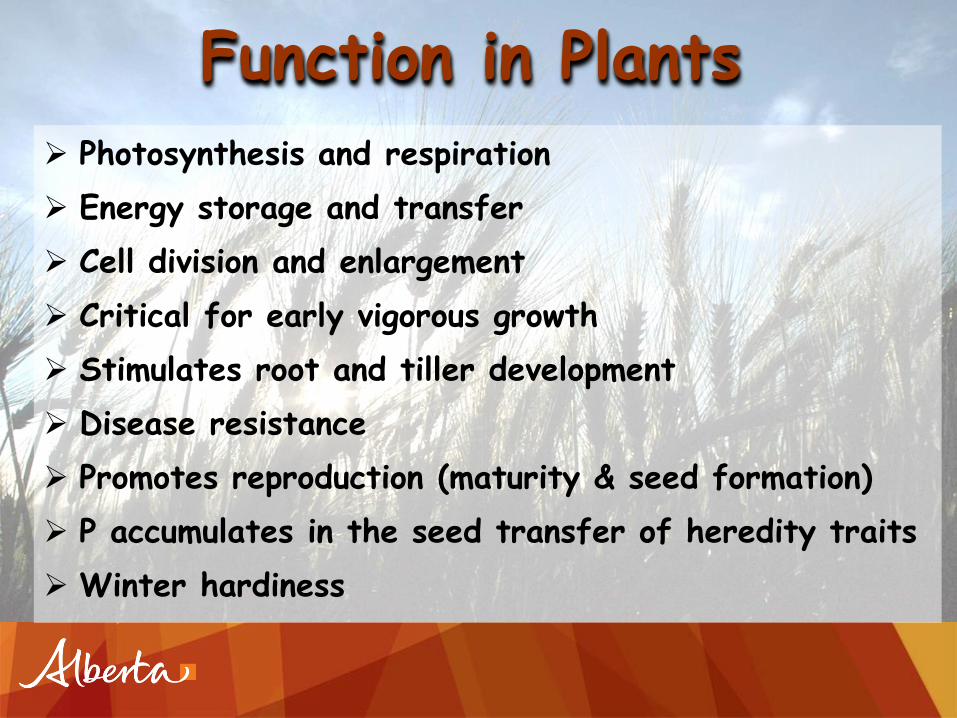
Photosynthesis and respiration
Energy storage and transfer
Cell division and enlargement
Critical for early vigorous growth
Stimulates root and tiller development
Disease resistance
Promotes reproduction (maturity & seed formation)
P accumulates in the seed transfer of heredity traits
Winter hardiness
Function in Plants

Soil Phosphorus

Needs extensive field and laboratory research.
Needs to provide a measure of the nutrient proportional to what a plant utilizes.
Able to identify responsive vs non-responsive soils based on soil test critical level and/or other related properties.
Able to predict nutrient application rate forresponsive soil.
Able to identify excessive nutrient levels.
A Good Nutrient Soil Test

Limits of a Nutrient Soil Test
One time snap shot of nutrient levels that must be able to take the entire crop growing season into account
Misconception – nutrient measure equals availability; Soil analysis is an inventory of nutrient levels in the soil
Requires continuous verification, evaluation and updates
Field research related to management changes crops, varieties, nutrient sources, rates, time of application, placement, tillage, etc.
Laboratory improvements: procedures, detection limits, multiple nutrient extraction

Calibration, Interpretation & Recommendation
Soil Test Calibration: Process by which a soil test provides a means to
measure soil nutrient levels.
Soil Test Interpretation: Guidelines to identify nutrient levels:
deficient, marginal, adequate or excessive.
Soil Test Nutrient Recommendation: Process by which soil test calibration curve provides
the basic nutrient requirement.
Any factor that enhances or limits crop growth will increase or decrease crop nutrient requirements.

Soil Test Calibration
Gain information about a soil and provide a fertilizer recommendation that is economically and environmentally sound.
Nutrient soil test must be calibrated with crop yield response across many different soil types
May use crop nutrient removal
Often regionally specific
Costly and time consuming
Soil test methods will vary between laboratories

Soil Test Calibration ResearchField trials - Variables:
Crops, varieties, fertilizer products, time of application, fertilizer placement, tillage
Regions - soil types, climate, soil moisture, irrigation Soil samples
Laboratory soil test methods - Chemistry: Chemical extraction solutions
Acids, bases, neutral salts Anion and cation displacement
Correlation - How good is the relationship: Crop response – Fertilizer rate relationship Soil test - Crop response relationship Soil test – Fertilizer rate relationship Linear, Non-linear, Spline, etc As the soil test increases, the recommended fertilizer rate
decreases
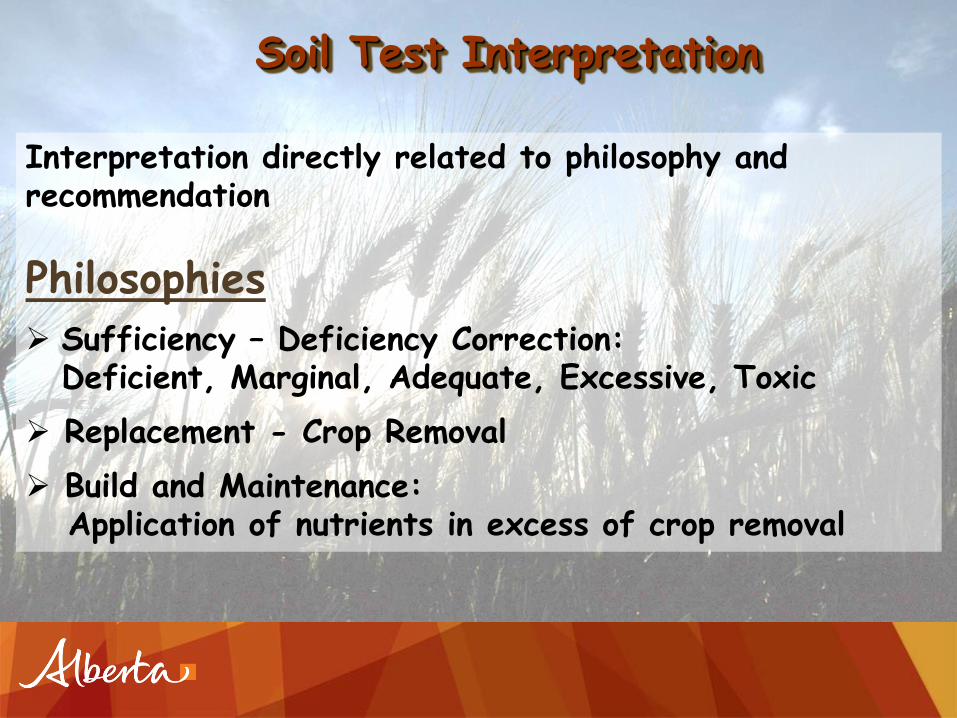
Soil Test Interpretation
Interpretation directly related to philosophy and recommendation
Philosophies Sufficiency – Deficiency Correction:
Deficient, Marginal, Adequate, Excessive, Toxic
Replacement - Crop Removal
Build and Maintenance:Application of nutrients in excess of crop removal
62 64 66 68 70 72 74 76 78 80 82 84 86 88 900
10
20
30
40
50
60
70
YEAR
So
il P
lb
/ac
(0
-6 i
n)
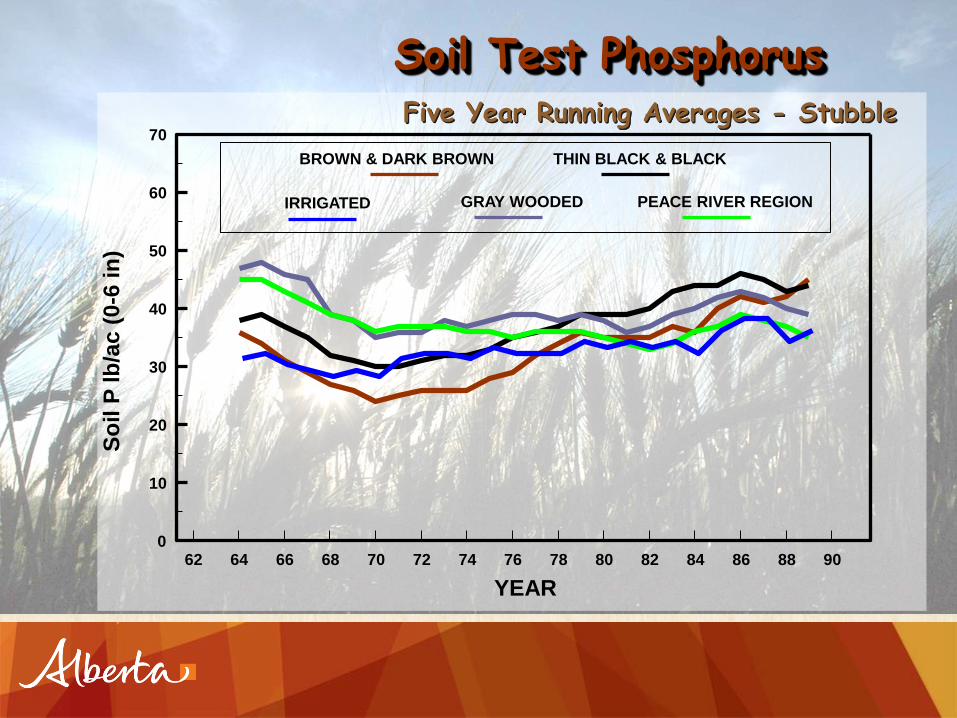
BROWN & DARK BROWN THIN BLACK & BLACK
GRAY WOODED PEACE RIVER REGIONIRRIGATED
Soil Test PhosphorusFive Year Running Averages - Stubble

Soil Test PhosphorusFive Year Running Averages - Fallow
62 64 66 68 70 72 74 76 78 80 82 84 86 88 900
10
20
30
40
50
60
70
YEAR
So
il P
lb
/ac
(0
-6 i
n)
BROWN & DARK BROWN THIN BLACK & BLACK
GRAY WOODED PEACE RIVER REGION

P Fertilizer Trials in Alberta1969-73 (J. Robertson, UofA)38 sitesEvaluate response of spring wheatCalibration of P soil tests
1971-75 Risk Adjusted Yield Potential (RAYP)125 sitesEvaluate response of barley and canolaCalibration of P soil tests
1990-93 (R. McKenzie, AARD)427 sitesEvaluate response of wheat, barley and canolaCalibration response to different soil P tests
(McKenzie et al.)

P Trials in Alberta (1990-93)
% Response
Wheat Barley Canola
1991 78 (48)* 89 (47) 82 (38)
1992 89 (51) 96 (54) 77 (43)
1993 82 (49) 89 (46) 89 (36)
* total sites(McKenzie et al. 1993)

91-93 Soil test P calibration trials

Soil test P methods evaluated in P calibration trials in Alberta
Method Extractant
Miller and Axley ammonium fluoride and sulfuric acid
(0.03N NH4F + 0.03N H2SO4)
Olsen sodium bicarbonate (0.5M NaHCO3)
Kelowna acetic acid and ammonium fluoride
(0.25N HOAc + 0.015N NH4F)
Modified Kelowna acetic acid, ammonium fluoride and ammonium acetate
(Exova) (0.5N HOAc + 0.015N NH4F + 1.0N NH4Oac)
Modified Kelowna acetic acid, ammonium fluoride and ammonium acetate
(ALS) (0.25N HOAc + 0.015N NH4F + 0.25N NH4Oac)

Soil test P calibration trials in Alberta
Kelowna
Modified Kelowna (ALS)
Modified Kelowna (Exova)
Miller & Axley
Olsen

Calibration curve indicates which soil test levels tend to limit yields.
The results of this calibration data set from Alberta show a critical level (sufficiency) of 20 to 25 ppm (40 to 50 lb/A) P.
This is the level of soil test P above which minimal response to applied P can be expected. 0
10
20
30
40
50
60
70
80
90
100
110
0 5 10 15 20 25 30 35 40 45 50 55
Kelowna P, ppm
Re
lati
ve
yie
ld,
%
Sufficiency Soil Test P Level for Canola
McKenzie et al., 1995
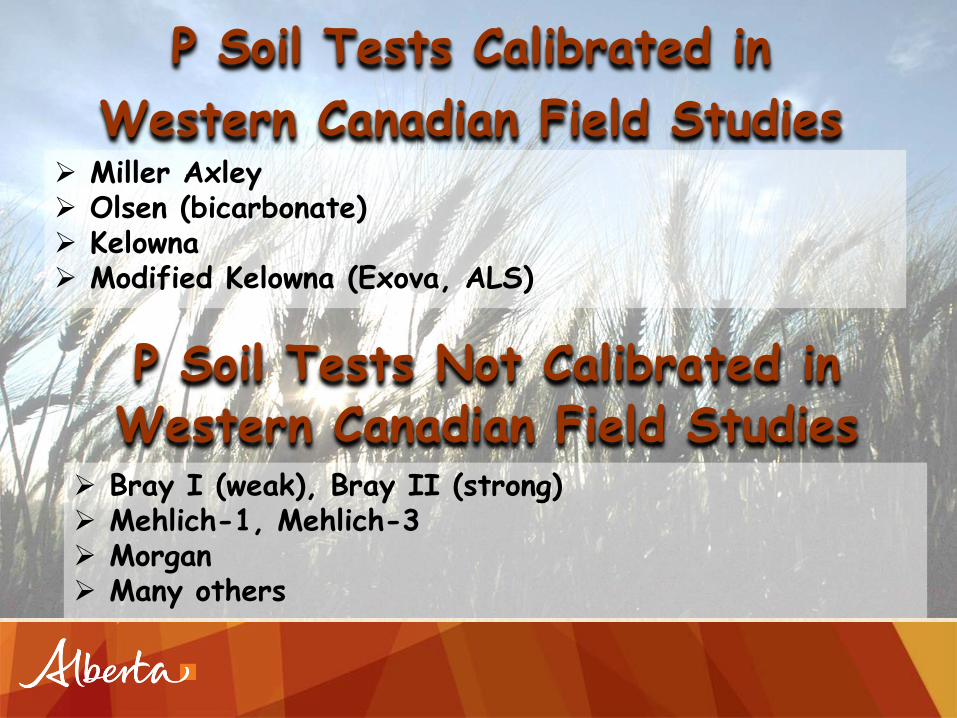
Miller Axley Olsen (bicarbonate) Kelowna Modified Kelowna (Exova, ALS)
Bray I (weak), Bray II (strong) Mehlich-1, Mehlich-3 Morgan Many others
P Soil Tests Calibrated in
Western Canadian Field Studies
P Soil Tests Not Calibrated in Western Canadian Field Studies

IPNI Soil Test Summary
Alberta, Saskatchewan, Manitoba

IPNI Soil Test Summary

IPNI Soil Test Summary

IPNI Soil Test Summary

Soil Sampling & Soil Testing
Nutrient Recommendations
Factors Influencing Recommendations Soil Nutrient Level
Crop
Agro-Climatic Zone
Growing Season Precipitation
Soil Texture
Soil Moisture
Soil Organic Matter
Soil pH
Soil Salinity

Soil pH
Affects the dominate
form of soil phosphorus
Crops have variable
tolerance that will effect
yield potential
Affects the soil test
extraction effectiveness

Phosphate Recommendation
0
10
20
30
40
50
60
0 20 40 60 80 100
Soil Test P (lb/ac) 0-6 in
P 2O
5 R
ecom
men
dat
ion
(lb/a
c)Recommendation Curves
• Crop, Soil Zone, Moisture
Responsive Zone Maintenance Zone

Zones reflect differences Soils
Climate
(pptn, temp, growing season)
Crop management
Yield potential
Nutrient availability
Nutrient requirements
Agro-Climatic Zones

Copyright © 2016, Stratus Ag Research. All rights reserved.All graphics, charts, data and comments contained in this report remain the property of Stratus Agri-Marketing Inc. and cannot be disclosed to any third party without the consent of Stratus.
FERTILIZER MANAGEMENT SURVEY
2014 CROP YEAR2015 CROP YEAR

Source:
Timing:
Placement:
Rate:
Source:
Timing:
Placement:
Rate:
Source:
Timing:
Placement:
Rate:
Source:
Timing:
Placement:
Rate:
Spring Wheat
Barley
Canola
Peas
Phosphorus fertilizers were applied on 87% of Spring Wheat acres.
MAP represents 86% of total phosphorus volume applied in spring wheat.
94% of Phosphorus volumes were applied at planting.
At planting, the main placements were: 47% seed placed; 26% side banded.
Average rate (including untreated) = 26.1 lbs./ac; average rate when used at planting = 26 lbs./ac.
Phosphorus fertilizers were applied on 88% of barley acres.
MAP represents 84% of total phosphorus volume applied in barley.
96% of Phosphorus volumes were applied at planting.
At planting, the main placements were: 51% seed placed; 32% side banded.
Average rate (including untreated) = 27.8 lbs./ac; average rate when used at planting = 30 lbs./ac.
Phosphorus fertilizers were applied on 86% of canola acres.
MAP represents 73% of total phosphorus volume applied in canola.
92% of Phosphorus volumes were applied at planting.
At planting, the main placements were: 51% seed placed; 36% side banded.
Average rate (including untreated) = 31 lbs./ac; average rate when used at planting = 31 lbs./ac.
Phosphorus fertilizers were applied on 44% of peas acres.
MAP represents 88% of total phosphorus volume applied in peas.
94% of Phosphorus volumes were applied at planting.
At planting, the main placements were: 43% (27 AB) seed placed; 26% side banded.
Average rate (including untreated) = 12 (20 AB) lbs./ac ; average rate when used at planting = 27 lbs./ac.
Phosphorus Fertilizer Use Survey

Alberta Farm Fertilizer Information and Recommendation Manager (AFFIRM)
Fertilizer recommendations based soil test calibrations from Alberta research.
Able to utilize soil test results from several different laboratories.
Access to current nutrient management knowledge based on Albertaresearch.
Nitrogen fertilizer-crop response model that incorporates soil test and fertilizer nitrogen with spring moisture conditions and growing season precipitation.
Balanced nutrient economic analysis model.
Nitrogen mineralization estimates to improve fertilizer nitrogen recommendations for crop production.
Field and whole farm optimization for nutrient management.

AFFIRM Enhancements
Update Laboratories and Soil Test Calibrations
New fertilizer products research
Enhanced Efficiency FertilizersESN (coated urea) and other fertilizer products
4R Nutrient Stewardship
Product, Rate, Time, Place
Incorporate nutrients from manure sources
Linkage to AB Climate Information Services andAB Soil Information Viewer

Key Messages P fertilizer is essential for optimum crop production.
There is a need for P fertilizer in Alberta; 50 to 80%of provincial soils are severely to marginally deficient.
Soil test P methods vary greatly among laboratories and in their ability to measure crop available soil P.
Calibration of soil test P methods can be influenced by soil pH, texture and seedbed moisture.
MAP, seed placed, spring application represents themajority of P fertilizer management; Average application rates range from 12 to 31 lb/ac.
AFFIRM will provide access to 4R Nutrient Stewardshipfor a range of laboratory soil test P methods.

Thank YouLen Kryzanowski, P.Ag.Director,
Environmental Strategy and Research
Alberta Agriculture and Forestry
Edmonton, AB
Phone: (780) 422-1252