socio-economic impact study - garfield county, colorado · pdf filefinal report garfield...
TRANSCRIPT

Final Report
Garfield County Socio-Economic Impact Study
Volume 1: Socio-Economic Study
and Projections
Volume 2: Socio-Economic Model User’s Guide and Technical Documentation

FINAL REPORT
January 17, 2007
Garfield County Socio-Economic Impact Study Volume 1: Socio-Economic Study and Projections
Volume 2: Socio-Economic Model User’s Guide and
Technical Documentation
Prepared for
Garfield County 108 8th Street, Suite 213 Glenwood Springs, Colorado 81601 Prepared by
BBC Research & Consulting 3773 Cherry Creek N. Drive, Suite 850 Denver, Colorado 80209-3827 303.321.2547 fax 303.399.0448 www.bbcresearch.com [email protected]

TABLE OF CONTENTS
BBC RESEARCH & CONSULTING i
VOLUME 1: Socio-Economic Study and Projections
I. Introduction
Study Participants and Process .................................................................................................... I–1
II. Past Garfield County Trends and Current Conditions
Trends........................................................................................................................................ II–1
Current Economic Base .............................................................................................................. II–6
Current Garfield County Demographics ................................................................................... II–10
Summary ................................................................................................................................. II–11
III. Projected Future Economic and Demographic Conditions
Methodology ............................................................................................................................ III–1
Baseline Scenario....................................................................................................................... III–3
Alternative Commuting Scenario............................................................................................. III–14
Rio Blanco Scenario ................................................................................................................. III–20
VOLUME 2: Socio-Economic Model User’s Guide and Technical Documentation
IV. Users Guide and Tutorial
Logging In and Basic Model Navigation .................................................................................... IV–1
Viewing and Downloading Results ............................................................................................ IV–3
Creating a New Scenario ........................................................................................................... IV–6
Creating a New Set of Economic Base Assumptions................................................................. IV–16
V. Garfield Socio-Economic Model Technical Documentation
Economic Assumptions ............................................................................................................... V–3
Commuting Assumptions ........................................................................................................... V–6
Demographic Assumptions ......................................................................................................... V–8
Geographic Allocation .............................................................................................................. V–11

VOLUME 1 Socio-Economic Study and Projections

SECTION I. INTRODUCTION

SECTION I. Introduction
In October 2005, Garfield County (County) retained BBC Research & Consulting (BBC) to study the local economy and develop an economic and demographic model specific to the County’s circumstances. The purposes of this effort were to help the County understand the implications of current and projected trends and to provide a flexible tool that the County can use to examine alternative future scenarios. In other words, to develop a tool that can help answer “what if” questions.
The primary result of this effort is the Garfield County Socio-Economic Model, a web-based application designed for use by the County, local municipalities and school districts. The model combines an integrated economic and demographic model with user-friendly menus to help users access a wide range of projected data from pre-defined scenarios and to allow users to develop and run their own scenarios.
Other outcomes of this effort included a Baseline Scenario of projected 2005 through 2030 economic and demographic conditions for the County, its municipalities and school districts. Two alternative scenarios were also developed.
This report documents the Garfield County socioeconomic study and model. Volume 1 describes current condition in Garfield County and the economic and demographic forecast scenarios developed in 2006. Volume 2 provides a users guide for the Garfield County SEIS Model and technical documentation regarding the model’s assumptions and methods.
Study Participants and Process
This project was directed by BBC, a Denver-based economic, market and policy research firm. BBC was assisted in this effort by ForeSee Consulting, LLC, which provided assistance in data analysis, mapping and geographic information services. BBC was also assisted by Mark Chain Consulting, LLC, which provided assistance with local representation, data gathering and perspectives, and John Tobin—who assisted BBC in evaluating energy-related issues.
Within Garfield County, Jesse Smith, Assistant County Administrator, and Randy Russell, Long Range Planner, provided extensive assistance and guidance.
BBC RESEARCH & CONSULTING SECTION I, PAGE 1
BBC held a total of five meetings with a Socioeconomic Committee established by Garfield County to provide input and review for this project. The Committee included representatives from a variety of perspectives, including:
Businesses,
Developers
Financial services,
Human services organizations,
Municipalities/public sector organizations,
Natural gas exploration and production companies,
Real estate representatives,
Residents,
Schools, and
Tourism.
Members of the study team also met with each of the cities and each of the school districts in Garfield County to gather further perspective on key issues, local capacities and recent trends.
BBC also held two meetings with representatives of the Colorado State Demography Office. The Demography Office offered input regarding proposed modeling approaches and providing demographic data for use in the model.
BBC RESEARCH & CONSULTING SECTION I, PAGE 2

SECTION II. Past Garfield County Trends and Current Conditions
SECTION II. Past Garfield County Trends and Current Conditions
This section provides a brief overview of recent trends in Garfield County and describes the County’s current economic base and demographic characteristics.
Trends
Garfield County is one the most physically and economically diverse counties on Colorado’s Western Slope. The far western portion of the County is sparsely populated, arid and contains mostly public lands. The central portion of the County, along the Colorado River Valley, contains five municipalities aligned along I-70 and supports the majority of the County’s population and economic activity. The southeastern corner of the County has one municipality (Carbondale) that is situated between Glenwood Springs and Aspen on Highway 82. This southeastern area, defined by the Roaring Fork and Crystal River Valleys, is economically aligned with the resort and recreation economy of Aspen and Pitkin County.
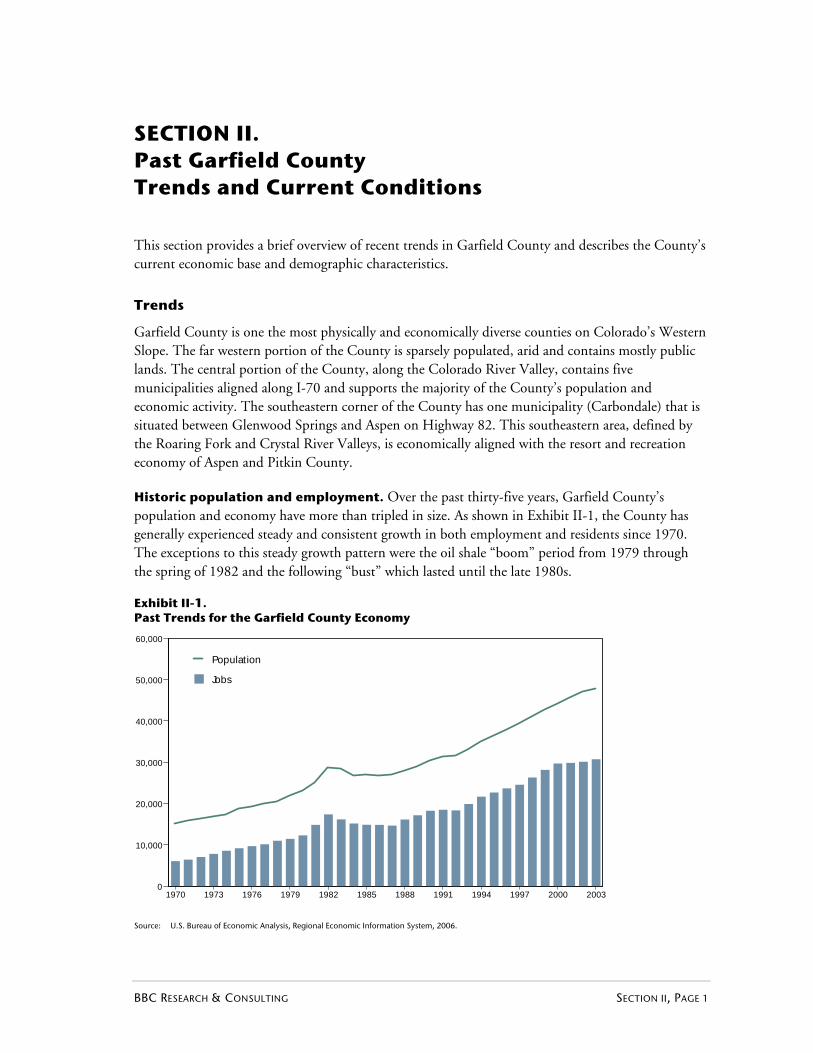
Historic population and employment. Over the past thirty-five years, Garfield County’s population and economy have more than tripled in size. As shown in Exhibit II-1, the County has generally experienced steady and consistent growth in both employment and residents since 1970. The exceptions to this steady growth pattern were the oil shale “boom” period from 1979 through the spring of 1982 and the following “bust” which lasted until the late 1980s.
Exhibit II-1. Past Trends for the Garfield County Economy
1970 1973 1976 1979 1982 1985 1988 1991 1994 1997 2000 20030
10,000
20,000
30,000
40,000
50,000
60,000
Jobs
Population
Source: U.S. Bureau of Economic Analysis, Regional Economic Information System, 2006.
BBC RESEARCH & CONSULTING SECTION II, PAGE 1

More recent developments. Since the mid-1990s, the burgeoning resort and real estate economies of Eagle and Pitkin Counties have stimulated associated economic activity—particularly residential development throughout Garfield County. Glenwood Springs, the county seat, has traditionally served as a regional retail and services center for west central Colorado, including Eagle, Rio Blanco and Pitkin counties. More recently, as resort and recreation development activity has spread “down valley,” Garfield County, with its warmer climate and more reasonably priced housing, has emerged as a residential alternative for Eagle and Pitkin County workers. In the last few years, Garfield County has also strengthened economic ties with Grand Junction and Mesa County, as natural gas development has spurred economic interrelationships and increased workers commuting between Mesa, Rio Blanco and Garfield Counties.
Finally, the prospect of new gas exploration activity on the Roan Plateau, and potential oil shale development in northwest Colorado, suggests that Garfield County will likely develop further economic relationships with Rio Blanco County on its northern border.
Recent population growth patterns. Exhibit II-2 compares population for Garfield County and its incorporated municipalities. The County has grown rapidly in recent years as increased housing costs in the Roaring Fork Valley have pushed growth down-valley from Carbondale and Glenwood Springs to New Castle, Silt, Rifle and Parachute, and as local energy development has drawn new workers and households to the communities in the Colorado River Valley.
Exhibit II-2. Population, Garfield County, 2000-2004
Municipality
Carbondale 5,196 5,509 5,565 5,689 5,767 2.6%
Glenwood Springs 7,736 8,135 8,301 8,406 8,517 2.4%
New Castle 1,984 2,268 2,604 2,825 2,949 10.4%
Parachute 1,006 1,269 1,297 1,320 1,338 7.4%
Rifle 6,784 7,079 7,349 7,541 7,760 3.4%
Silt 1,740 1,901 2,039 2,089 2,184 5.8%
Unincorp. Area 19,345 20,012 20,286 20,526 20,810 1.8%
Garfield County 43,791 46,173 47,441 48,396 49,325 3.0%
2000-20042004
Annual Growth Rate
2003200220012000
Source: Colorado Department of Local Affairs.
BBC RESEARCH & CONSULTING SECTION II, PAGE 2

Employment. The total labor force in Garfield County has been steadily increasing since 1997, with the exception of a brief dip in 2001. Exhibit II-3 shows the labor force and unemployment in Garfield County from 1997 to 2005.
Exhibit II-3. Labor Force and Unemployment Rate, Garfield County, 1997-2005
1997 1998 1999 2000 2001 2002 2003 2004 2005
0
5,000
10,000
15,000
20,000
25,000
30,000
35,000
832
2089421,726
855
2200722,862
686
2299423,680
643
2412424,767
781
2295723,738
1028
2483925,867
1168
2567926,847
1240
2691928,159
1110
2896430,074
Unemployment Employment
3.8% 3.7% 2.9% 2.6% 3.3% 4.0% 4.4% 4.4% 3.7%
Source: Colorado Department of Local Affairs.
Unemployment has remained fairly consistent, as the labor force has increased, reflecting a very strong local economy. The number of employed County residents increased from 24,838 in 2001 to 28,964 in 2005, an increase of nearly 17 percent over four years. During this same period, statewide employment in Colorado grew by only five percent.
BBC RESEARCH & CONSULTING SECTION II, PAGE 3

Employment by sector. Exhibit II-4 shows employment by sector for Garfield County in 2005, based on wage and salary jobs reported by the Colorado Department of Labor. Bold sectors indicate a larger share of employment in Garfield County than the state in that particular sector. The red figures show the state’s share of employment in that sector.
Exhibit II-4. Employment by Sector, Garfield County, 2005
Agriculture (0.7%)
Mining (6.7%)Utilities (0.9%)
Construction (15.0%)
Manufacturing (1.9%)
Wholesale trade (2.8%)
Retail Trade (13.6%)
Transportation and warehousing (2.6%)Information (1.0%)
Finance activities (2.4%)Real estate (2.2%)Professional and business services (4.4%)
Management of companies and enterprise (0.6%)Admin and waste (3.5%)
Education (0.7%)
Health Services (8.0%)
Arts (1.6%)
Accommodation and food (11.2%)
Other services (3.0%)
Government (17.2%) 0.4%
7.3%
11.2%
2.1%
9.8%
15.8%
0.8%
Note: Figures in Red show the comparable state share of employment in selected sectors. These wage and salary job percentages do not include self-
employed proprietors – which understates the share of jobs in agriculture.
Source: Colorado Department of Labor.
Garfield County has a larger share of its employment in the accommodation and food services, retail trade, real estate, construction, mining and utilities sectors than the state as a whole. The distribution of jobs by sector provides some insight into the makeup of the County’s economic base, discussed in more detail later in this section.
BBC RESEARCH & CONSULTING SECTION II, PAGE 4

Job location and commuting. While the majority of Garfield County residents work at jobs located in the County, out-commuting to jobs in the resort areas to the east is also an important component of the local economy. As depicted in Exhibit II-5, more than 3,600 jobs in Pitkin County were filled by Garfield County residents in 2000 and County residents also commuted to more than 1,700 jobs in Eagle County. More than four out of each ten new jobs in Pitkin County during the 1990s were filled by Garfield County residents along with about one in ten new jobs in Eagle County during that decade.
Exhibit II-5. Residence Location for Employees at Eagle County and Pitkin County Jobs
Source:
1990 and 2000 Census, Journey to Work Files.
Worker Residence
Pitkin County 7,482 8,602 32%
Garfield County 2,186 3,685 43%
Other 2,613 3,481 25%
Total 12,281 15,768 100%
Worker Residence 2000
Eagle County 10,865 21,206 85%
Garfield County 544 1,746 10%
Other 2,106 2,692 5%
Total 13,515 25,644 100%
Share ofNew Jobs
Jobs in Pitkin County
Share ofNew Jobs1990
1990 2000
Jobs in Eagle County
Exhibit II-6 on the following page shows the percent of residents who work in the same community in which they live and trends in commuting behavior for the combined Garfield County and Pitkin County area. With the exception of Aspen residents, commuting is increasing. Outside of Aspen and Glenwood Springs, relatively few residents in the two counties work in the same community in which they live. The effects of strong recent job growth in the western portion of the Colorado River Valley, largely in response to natural gas development, is not fully reflected in this two year old data.
BBC RESEARCH & CONSULTING SECTION II, PAGE 5

Exhibit II-6. Percent of Residents that Work in the Same Community in Which They Live, 1990 Census, 2000 Census, 2004 Employee Survey
Parachute*
Rifle
Silt*
New Castle
Glenwood Springs
Carbondale
Aspen
0% 10% 20% 30% 40% 50% 60% 70% 80% 90% 100%
84%
78%
80%
16%
27%
35%
59%
60%
66%
5%
10%
9%
18%
10%
32%
36%
40%
16%
31%
2004 Employee Survey
2000 Census
1990 Census
Note: * Incorporated Silt and Parachute responses to the 2004 survey are less than 40.
Source: Bureau of Transportation Statistics, 2000 US Census, RRC Associates, Inc.
Current Economic Base
A number of activities bring dollars into Garfield County, providing the foundation for the local economy. The economic base (sometimes also referred to as “primary jobs”) includes:
Activities that export a product or service to customers outside the County (such as natural gas production, agriculture and manufacturing);
Activities that draw funds from visitors from outside the County (such as tourism and regional services); and
Other sources of revenue from outside the County (such as wages earned by Garfield County residents who work outside the County, state and federal government jobs and local spending by retirees and second homeowners).
BBC RESEARCH & CONSULTING SECTION II, PAGE 6
Using an approach similar to a previous examination of the Garfield County economic base completed by the Colorado State Demography Office1, this study and the Garfield SOCIO-ECONOMIC Model divide the County’s economic base into nine categories:
Tourism;
Regional services;
Gas;
Oil shale;
Government2;
Agriculture and agricultural services;
Manufacturing;
Net out-commuting; and
External household funding.
Tourism and regional services. Together, tourism and regional services presently comprise approximately one half of the Garfield County economic base. BBC estimates that there were about 3,780 Garfield County jobs directly related to tourism in 2005 and about 4,000 jobs directly related to regional services. The largest components of Garfield County tourism-related employment include a portion of jobs in eating and drinking establishments and most jobs in amusements and recreation and hotels and lodging. Portions of the real estate and construction sectors are also tourism-related, primarily in terms of meeting the needs of second homeowners in Garfield County and Pitkin County. Regional services includes a wide array of trade and service jobs supported, at least in part, by sales to individuals and businesses based outside the County. Construction services provided to customers based outside the County, rental and leasing services and motor vehicle and parts dealers are examples of regional services employment in Garfield County.
Gas and oil shale. During the past few years, rapid development of natural gas wells and associated infrastructure has had substantial effects on Garfield County’s economy and population. About 4,000 wells had been completed as of mid-2006, with well development continuing at a pace of about 1,000 new wells per year.
Approximately 70 drilling rigs were actively working in Garfield County in mid-2006 on behalf of a number of exploration and production companies, with Williams and EnCana controlling the largest number of rigs. Working with representatives of these and other gas production companies, the study team estimated there were approximately 4,000 people working in Garfield County that were directly employed by gas development companies and their subcontractors in 2005.
1 2003 Jobs and Income Summary by Base Industry Group: Garfield County. Colorado State Demography Office. Accessed
at http://www.dola.state.co.us/Demog/leifa2.cfm. 2 Only a portion of government jobs, primarily state and federal jobs, is considered part of the economic base. Most local
government jobs are considered part of local services and are determined largely by local population levels, though the allocation can differ in communities with large second home and tourist industries.
BBC RESEARCH & CONSULTING SECTION II, PAGE 7
Not all gas-related workers in Garfield County live in the County or work for establishments based in the County. Based on the companies’ severance tax-related workforce filings (which cover many of the 4,000 estimated workers), the study team estimated that about 50 percent of the workers were based out of offices located in the County. In other words, about 2,000 gas-related jobs are based in Garfield County, with most of the remainder based in Mesa County. An even smaller percentage of the gas development workforce actually resides in Garfield County – likely about one third of the total as of 2005. Thus, gas development is not only a source of economic base jobs in Garfield County, but also generates in-commuting to the County from Mesa County and Rio Blanco County.
In 2005, there were few, if any, jobs in Garfield County directly tied to potential oil shale development. However, a number of research, development and demonstration projects are beginning in the region and a modest level of direct jobs will be supported by these projects over the next several years. Full scale, commercial oil shale development could ultimately have a very substantial effect on Garfield County’s economic base—if it occurs.
Net out-commuting. Although some workers commute into Garfield County from homes located elsewhere, primarily to work at gas-related jobs, a far larger number of Garfield County residents commute to jobs in neighboring counties. As a portion of the income earned by these out-commuters is re-spent within the County, it becomes part of the County’s economic base.
Based on 2000 Census Journey-to-Work data, and recent economic trends, BBC estimates that there were over 4,000 more out-commuters than in-commuters in 2005. The 2005 earnings from this “net out-commuting” are estimated at about $100 million and support nearly 800 direct jobs in the County. As will be discussed in subsequent sections of this report, future scenarios anticipate substantial increases in net out-commuting to Pitkin and Eagle Counties.
External household funding. Another source of funding that supports retail and service jobs in Garfield County is spending of non-wage-related income of Garfield County residents and second home owners. The study team estimated that more than $300 million in retirement benefits, transfer payments and investment income flowed into Garfield County in 2005, directly supporting almost 2,500 jobs throughout the County.
Other base sectors (agriculture, manufacturing and government). The remainder of Garfield County’s 2005 economic base consisted of jobs in agriculture, small-scale manufacturing and a portion of the government jobs in the County. Agricultural and agricultural services directly supported an estimated 500 jobs in Garfield County in 2005. These include jobs in cattle ranching and hay growing, veterinary services and nursery/greenhouse jobs. Garfield County has a number of small manufacturing operations and manufacturing supported an estimated 400 jobs in 2005. Most state and federal government jobs are considered part of the economic base (since their primary funding comes from outside the County) along with a portion of local government jobs. The study team estimates that there were 1,750 basic jobs out of roughly 4,250 total government jobs in Garfield County in 2005.
The various economic base activities just described support additional “local service” jobs in Garfield County. Local services includes firms that sell goods and services to establishments engaged in the economic base activities as well as firms that sell goods and services to local households. The relationship between economic base jobs and the number of jobs they support throughout the
BBC RESEARCH & CONSULTING SECTION II, PAGE 8

economy (including both the base jobs and the local service jobs) is commonly termed the “multiplier.” The study team used the IMPLAN regional economic model to estimate the multipliers associated with each Garfield County economic base activity.3
Exhibit II-7 summarizes the estimated number of jobs in each component of Garfield County’s 2005 economic base. The exhibit also shows the estimated employment multipliers associated with each economic base activity and the total number of jobs directly and indirectly supported by each activity.
Exhibit II-7. Estimated 2005 Garfield County Economic Base Jobs, Multipliers and Total Employment
Economic Base Activity
Tourism 3,780 1.75 6,615
Regional Services 4,000 2.07 8,280
Gas Development 2,000 2.15 4,300
Oil Shale 0 2.15 0
Government 1,750 1.71 2,993
Agriculture/Ag. Services 500 1.87 935
Manufacturing 400 2.67 1,068
Net Outcommuting* 790 1.80 1,422
External Household Funding** 2,450 1.80 4,410
Total 15,670 1.92 30,023
Total Jobs SupportedEstimated MultiplierDirect Jobs
Note: *Estimated jobs supported by local spending of estimated 4,000 “net-out commuters” (total outcommuters net of total in-commuters).
**Estimated jobs supported by local spending of approximately $250 million in retirement income, transfer payments and other non-wage income.
Source: BBC Research & Consulting, 2006.
In total, the study team estimates there were approximately 30,000 full and part-time jobs based in Garfield County in 2005.4 The average earnings per Garfield County job were approximately $37,500.
3 The IMPLAN model is a widely used input-output regional economic model originally designed by the U.S. Forest
Service. BBC used the IMPLAN model, along with 2003 data files for Garfield County (the most recent year available) to develop estimated multipliers for each economic base activity. The multipliers were further adjusted to make the resulting total employment estimates correspond to estimated 2005 employment. 4 These estimates include both full and part-time jobs and include proprietors (business owners) as well as wage and salary
employees. This definition of employment is consistent with the approach used in the IMPLAN model, but differs somewhat from the definitions used by the Bureau of Economic Analysis (BEA) and Colorado Department of Labor and Employment (CDLE). CDLE job estimates do not include proprietors, farm jobs, railroad jobs and other jobs not covered by unemployment insurance. BEA job estimates include a higher estimate of the number of proprietors. The Garfield SOCIO-ECONOMIC Model/IMPLAN model job counts are about 40 percent higher than the CDLE job counts and about 15 percent lower than the BEA job counts.
BBC RESEARCH & CONSULTING SECTION II, PAGE 9

Current Garfield County Demographics
Age distribution. The age distribution of the Garfield County population in 2005 is not greatly different from the age distribution of Colorado’s population as a whole. In both the County and the state, the largest group of residents are currently in their forties. However, Garfield County does have a proportionately larger share of residents under the age of 10 and a smaller share of residents over the age of 60 than the state as a whole. Garfield County also has a smaller share of residents in their twenties than the overall Colorado population. Exhibit II-8 depicts the 2005 age distributions of Garfield County and Colorado as a whole.
Exhibit II-8. 2005 Age Distribution of Garfield County and State of Colorado Populations
80 and over
70 to 79
60 to 69
50 to 59
40 to 49
30 to 39
20 to 29
10 to 19
0 to 9
0% 10% 20% 30% 40% 50% 60% 70% 80% 90% 100%
Ag
e C
oh
ort
Share of Total
16%14%
14%14%
12%14%
15%15%
17%16%
13%13%
6%7%
4%4%
2%2%
Garfield County
Colorado
Source: Colorado Economic and Demographic Infromation System, 2006.
Labor force participation and household formation. About 79 percent of Garfield County residents age 16 and older were in the labor force in 2005, either employed or actively seeking employment. As noted previously, less than four percent of these individuals were unemployed. This is a relatively high labor force participation rate compared with the 70 percent rate for Colorado as a whole, especially given the relatively similar age distribution of the population.5
Household formation. BBC estimates that there were approximately 18,720 households in Garfield County in 2005, up from 16,230 at the time of the 2000 Census. Average household size likely remains similar to the 2.65 residents per household in 2000.
5 Aggregate labor force participation rates estimated by dividing 2005 labor force reported by CDLE by estimated
population age 16+ from Office of Demography.
BBC RESEARCH & CONSULTING SECTION II, PAGE 10

Residents with Limited English Proficiency. A significant and growing proportion of the Garfield County population consists of residents with limited capabilities in reading and speaking English. BBC estimates that there were about 3,500 County residents in 2005 with limited English proficiency (LEP), compared with approximately 3,200 such residents identified at the time of the 2000 Census. These estimates are based on residents who self-identify themselves as LEP by reporting that they speak English less than “very well.”
It is important to note that the LEP population is closely correlated with the population of undocumented workers and residents. These populations are believed by many in Garfield County to have been significantly undercounted during the 2000 Census and some believe there may be as many as 10,000 or more LEP individuals currently living in the County. The number of students in Garfield County schools currently participating in the English Language Proficiency Act (ELPA) supports the notion that the LEP population is substantially undercounted and underestimated. There are approximately 50 percent more Garfield County school district students in ELPA than would be expected based on the estimate of 3,500 overall LEP residents in the County, though some of this difference could be accounted for by open enrollment at Garfield County schools (particularly Carbondale schools which may draw LEP children from Pitkin County).
Summary
Garfield County is a physically and economically diverse region. A large share of the County is held in remote public lands, although current and future gas development on these public properties has shaped, and will continue to influence, local employment and commuting patterns. A large share of the unincorporated County remains in agricultural use. The central County contains the I-70 corridor, the core population base and the most rapidly growing communities. The southeastern portion of the County, encompassing the town of Carbondale, the Crystal River Valley and the Roaring Fork River Valley is economically tied to resort and second home development in neighboring Pitkin County. Glenwood Springs is the county seat, largest community and Garfield County’s regional service center.
Garfield County’s economy is tied to tourism, regional services, natural gas development and jobs in Eagle and Pitkin Counties as well as what may be termed “quality of life migrants” who are drawn to the area by local recreation opportunities, climate and the attractive landscape. The County has generally experienced steady growth over the past three decades and is currently growing rapidly as both the recreation/retirement and the natural gas industry have expanded. Home and land values have increased substantially in recent years. The focus of population growth is shifting westward towards the New Castle, Silt, Rifle and Parachute areas in response to both recent employment opportunities spawned by gas development and the diminishing affordability of homes in the Glenwood Springs and Carbondale areas as those areas begin to approach their buildout capacities.
Garfield County’s population includes relatively larger shares of very young residents and smaller proportions of elderly residents and residents in their twenties than Colorado as a whole. Labor force participation rates in Garfield County are higher than those typically found in Colorado or the U.S. as a whole. The County has a significant and growing population with limited English skills that may well be substantially undercounted and underestimated in official statistics.
BBC RESEARCH & CONSULTING SECTION II, PAGE 11

SECTION III. Projected Future Economic and Demographic Conditions

SECTION III. Projected Future Economic and Demographic Conditions
This section describes projected Garfield County economic and demographic growth from 2005 through 2030 under the Baseline Scenario and two alternative scenarios.
Methodology
BBC developed baseline projections for Garfield County and two alternative scenarios using the Garfield County Socio-Economic Model. The model was developed specifically for Garfield County as part of this project and was designed for ongoing use by the County. Volume II of this report provides a users guide and technical documentation for the Socio-Economic Model, the following is a summary of the modeling methodology.
The Garfield Socio-Economic Model combines several standard economic and demographic modeling techniques into an integrated, web-based application. Major components of the model include:
A labor demand module that converts assumptions about future economic base jobs and future commuting activity into projections of overall county employment,
An out-commuting module that calculates the effect on Garfield County’s economy and population from out-commuting to jobs in neighboring counties,
A cohort-component demographic model of the overall county population,
A modified gravity model used to allocate population changes to Garfield County municipalities and surrounding areas, and
Allocation modules that project future enrollments of Garfield County school districts and the size of the Limited English Proficient population throughout the county.
The structure of the model is depicted in the flow chart on the following page. The labor demand module is shown in red, the out-commuting module is shown in gray and the demographic and population allocation modules are shown in blue.
BBC RESEARCH & CONSULTING SECTION III, PAGE 1

Exhibit III-1. Garfield County Socio-Economic Model Structure
Initial Res. PopulationInitial Res. Initial Res. PopulationPopulation
Survived PopulationSurvived Survived
PopulationPopulation
Fertility Rates and Mortality RatesFertility Rates and Mortality Rates
Initial Labor Force
Initial Initial Labor ForceLabor Force
Labor Force Participation RatesLabor Force Participation Rates
Initial Res. Employed
Initial Initial Res. EmployedRes. Employed
Unemployment RateUnemployment Rate
Initial In-County Labor Force
Initial InInitial In--County County Labor ForceLabor Force
Pitkin EmploymentPitkin EmploymentPitkin Employment
Eagle EmploymentEagle EmploymentEagle Employment
Mesa EmploymentMesa EmploymentMesa Employment
Garfield Out Commuters
Garfield Out Garfield Out CommutersCommuters
Economic Base Jobs• Oil and Gas• Tourism• Created by Commuting• Other
– Ag.– Manu.– Gov.
• Regional Services• Households (Income Inflows)
Economic Base JobsEconomic Base Jobs•• Oil and GasOil and Gas•• TourismTourism•• Created by CommutingCreated by Commuting•• OtherOther
–– Ag.Ag.–– Manu.Manu.–– Gov.Gov.
•• Regional ServicesRegional Services•• HouseholdsHouseholds (Income Inflows)(Income Inflows)
Indirect andInduced JobsIndirect andIndirect andInduced JobsInduced Jobs
Garfield Multipliers Garfield Multipliers ((Implan Implan based)based)
Labor DemandLabor DemandLabor Demand
Worker In-migration or Out-migration
Worker InWorker In--migration migration or Outor Out--migrationmigration
Total EconomicMigration
Total EconomicTotal EconomicMigrationMigration
Labor Force Participation RatesLabor Force Participation RatesEconomic Out/InEconomic Out/In--migrant Distributionmigrant Distribution
Remaining Garfield Residents
Remaining Remaining Garfield ResidentsGarfield Residents
NonNon--Economic OutEconomic Out--migrationmigration
Final Res. Population
Final Final Res. PopulationRes. Population
Garfield In-Commuters
Garfield Garfield InIn--CommutersCommuters
LEP PopulationLEP PopulationLEP PopulationHouseholds and Population Allocation
Households and Households and Population AllocationPopulation Allocation
Rio Blanco EmploymentRio Blanco Rio Blanco
EmploymentEmployment
Garfield Share of EmploymentGarfield Share of EmploymentMultiple Job Multiple Job Holder RateHolder Rate
BBC RESEARCH & CONSULTING SECTION III, PAGE 2
In essence, the Garfield County Socio-Economic Model projects future employment demand in Garfield County based on user-specified assumptions regarding the future of the County’s economic base and out-commuting. The model then balances labor supply with labor demand by in-migrating or out-migrating workers and their families. Migration – along with natural change due to births, deaths and aging – determines future population levels.
The model also allocates future population changes to Garfield County cities, unincorporated and school district areas based on the location of growth pressure(s), historic capture rates and the relative capacity/affordability of each area. The size of the Limited English Proficient population is projected based primarily on job growth by sector and forecast changes in out-commuting to jobs in other counties.
Caveats and limitations. The Garfield County Socio-Economic Model was designed to be a useful tool for developing internally consistent long-range planning scenarios or evaluating “big picture” effects from substantial changes in the County’s economy or demographics. The model is not designed to capture or anticipate short-term economic cycles that may affect the County. The model may also not be an ideal tool for examining smaller scale and more localized impacts, such as the opening of a new retail outlet or re-development of an individual property.
The planning scenarios described in the remainder of this section are designed to be updated regularly as new information and insights become available.
Baseline Scenario
The Baseline Scenario reflects current (year 2006) perceptions of likely future growth in each component of Garfield County’s economic base. This scenario also incorporates current estimates of the growth capacity of the cities and unincorporated sub-areas throughout the County. The projected countywide population under the Baseline Scenario by 2030 is not substantially different from the projections developed by the State Demographer.
Projected growth in Garfield County’s economic base. As described in Section II of this report, Garfield County’s economic base can be broken down into nine components—including potential future oil shale-related activity. With the exception of detailed projections of future natural gas-related employment developed specifically for this study, most of the economic base growth assumptions incorporated in the Baseline Scenario are consistent with the assumptions currently incorporated in the Colorado State Demographer’s forecast for Garfield County.
Projected energy-related employment. The study team worked with representatives of the natural gas industry in Garfield County to develop projections of future gas-related employment. The general view within the industry is that Garfield County well development will continue forward at a fairly consistent rate of about 1,000 wells per year over the next 10 to 15 years. Given about 3,900 wells at present, this implies an ultimate total of about 15,000 to 20,000 wells in the County.
Sufficiently high long-term contract prices are the key to continued drilling viability. At present, the minimum price needed to support drilling in Garfield County is reportedly around $3 per million BTU. Natural gas prices have been highly volatile in recent months – ranging from over $14 per million BTU in late 2005 to under $5 per million BTU in September 2006. John Tobin, a member of the study team, has been producing probabilistic energy price forecasts for many years. While
BBC RESEARCH & CONSULTING SECTION III, PAGE 3

future energy prices will remain volatile and uncertain, Mr. Tobin’s latest price forecast anticipates gas prices to gravitate toward the $5 to $7 per million BTU range over the longer term, consistent with oil prices trending toward $35 to $45 per barrel.1
In the short-run, industry representatives noted that the rate of gas well development is primarily constrained by worker availability. Additional pipeline and processing capacity is being developed as needed. Newer rigs, gradually replacing the more traditional rigs used up to now in Garfield County, are up to 30 percent more efficient in terms of labor requirements.
Based on meetings with the industry representatives, the study team determined that gas-related employment could best be projected by dividing the workforce into two components. Drilling related employment is estimated at approximately 35 workers per well, with that number gradually diminishing as the more efficient newer rigs replace older rigs. Maintenance related employment, including work over crews, pumpers and manpower for the gas plants, is estimated to require about one worker per six completed wells.
As shown in Exhibit III-3, the total natural gas workforce operating in Garfield County is projected to peak at about 5,300 workers in approximately 2017, and then gradually decline to an ongoing maintenance workforce of less than 2,900 workers. About 50 percent of these workers will be based out of Garfield County, with most of the remainder commuting in from companies based in Mesa County. The peak workforce would be about 30 percent larger than the 4,000 gas workers operating in the County, and 2,000 jobs based in the County, in 2005.
Exhibit III-3. Projected Natural Gas-related Jobs in Garfield County
Year
2005 1,000 3,900 100 3,417 583 4,000 50% 2,0002006 1,000 4,900 105 3,254 817 4,071 50% 2,0362007 1,000 5,900 110 3,106 983 4,089 50% 2,0452008 1,000 6,900 115 2,971 1,150 4,121 50% 2,0612009 1,000 7,900 120 2,847 1,317 4,164 50% 2,0822010 1,000 8,900 125 2,733 1,483 4,216 50% 2,1082011 1,000 9,900 130 2,628 1,650 4,278 50% 2,1392012 1,000 10,900 130 2,628 1,817 4,445 50% 2,2232013 1,000 11,900 130 2,628 1,983 4,611 50% 2,3062014 1,000 12,900 130 2,628 2,150 4,778 50% 2,3892015 1,000 13,900 130 2,628 2,317 4,945 50% 2,4732016 1,000 14,900 130 2,628 2,483 5,111 50% 2,5562017 1,000 15,900 130 2,628 2,650 5,278 50% 2,6392018 750 16,650 130 1,971 2,775 4,746 50% 2,3732019 500 17,150 130 1,314 2,858 4,172 50% 2,0862020 0 17,150 130 0 2,858 2,858 50% 1,429
Based in Garfield**Total Workforce Operating in GarfieldDrilling Maintenance TotalDrilled
New WellsDrilling
Efficiency(vs 2005)*
GarfieldWorkersCompletions
CumulativeLocal
Percent
* New rigs are 30 percent more efficient than older ones. Assumes new rigs fully phased in by 2011.
** As of 2005, approximately 50 percent of the workforce reports out of offices in Garfield County. A smaller percentage (about 35 percent) of the workforce is housed in Garfield County.
1Garfield County: Energy Economic Environment, July 1, 2006 (draft working paper).
BBC RESEARCH & CONSULTING SECTION III, PAGE 4
Although natural gas development has been one of the most visible, and at times controversial, components of Garfield County’s economic base in recent years, the Baseline Scenario does not anticipate large increases in the size of the natural gas workforce. Commercial oil shale production, which could have dramatic implications for Garfield County’s economic base and population, did not appear likely enough to be included in the Baseline Scenario.
The largest source of projected Garfield County growth under the Baseline Scenario stems from anticipated increases in the number of Garfield residents out-commuting to jobs in Pitkin County and Eagle County.
Projected out-commuting. During 2005, planning staff from Eagle County, Garfield County and Pitkin County—along with the State Demography Office—undertook a major effort to evaluate long-term regional job growth and workforce housing needs. This effort, termed the Watershed Collaboratives Growth Scenarios Project, culminated in a report entitled Demographic Forecasts: Eagle, Garfield and Pitkin Counties 2000-2030. An Interim Report.
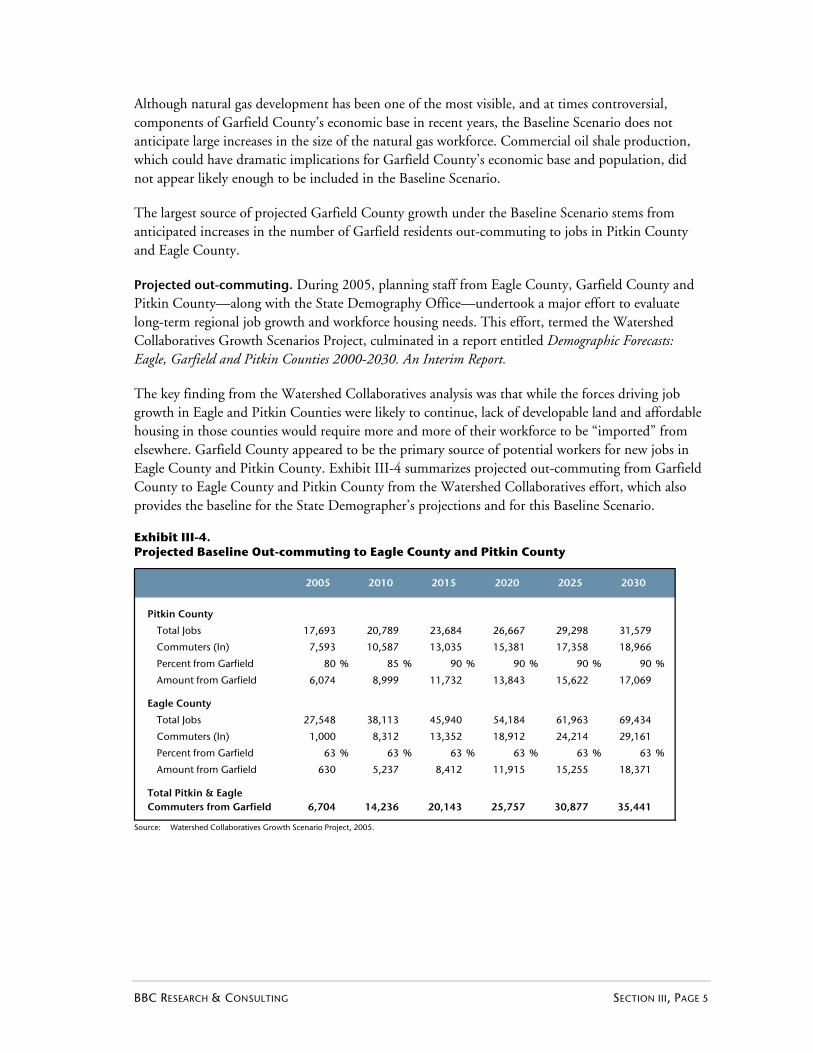
The key finding from the Watershed Collaboratives analysis was that while the forces driving job growth in Eagle and Pitkin Counties were likely to continue, lack of developable land and affordable housing in those counties would require more and more of their workforce to be “imported” from elsewhere. Garfield County appeared to be the primary source of potential workers for new jobs in Eagle County and Pitkin County. Exhibit III-4 summarizes projected out-commuting from Garfield County to Eagle County and Pitkin County from the Watershed Collaboratives effort, which also provides the baseline for the State Demographer’s projections and for this Baseline Scenario.
Exhibit III-4. Projected Baseline Out-commuting to Eagle County and Pitkin County
Pitkin County
Total Jobs 17,693 20,789 23,684 26,667 29,298 31,579
Commuters (In) 7,593 10,587 13,035 15,381 17,358 18,966
Percent from Garfield 80 % 85 % 90 % 90 % 90 % 90
Amount from Garfield 6,074 8,999 11,732 13,843 15,622 17,069
Eagle County
Total Jobs 27,548 38,113 45,940 54,184 61,963 69,434
Commuters (In) 1,000 8,312 13,352 18,912 24,214 29,161
Percent from Garfield 63 % 63 % 63 % 63 % 63 % 63
Amount from Garfield 630 5,237 8,412 11,915 15,255 18,371
Total Pitkin & Eagle Commuters from Garfield 6,704 14,236 20,143 25,757 30,877 35,441
2025 20302015 20202005 2010
%
%
Source: Watershed Collaboratives Growth Scenario Project, 2005.
BBC RESEARCH & CONSULTING SECTION III, PAGE 5

During this study, representatives of the study team held further meetings with the planning staffs in Eagle County and Pitkin County, as well as with the State Demography Office. Although all acknowledge the uncertainties surrounding future commuting patterns, the Watershed Collaboratives projections remain the baseline. Recent trends in Garfield County home and property values, as well as strong job growth within the County, do raise the concern that Garfield County may also become increasingly unaffordable for commuters. Effects of alternative commuting assumptions are explored later in this report.
Other economic base projections. Growth rates for the County’s other economic base activities are consistent with the assumptions currently being used by the State Demographer’s Office in their projections for Garfield County. Tourism and regional service jobs are projected to increase at annual rates ranging from 1.5 percent to 2.5 percent over the twenty-five year forecast period. Government base jobs, and the County’s small manufacturing sector, are projected to increase at one percent per year. No growth is projected in the agricultural and agricultural services portion of the economic base.
External household funding from non-wage sources, including second homeowners, retirement income and transfer payments is projected to grow at rates ranging from two to four percent per year. Under the Baseline Scenario, the number of second homes in Garfield County is projected to increase from about 600 in 2005 to over 1,500 by 2030.
Exhibit III-5 summarizes projected Garfield County economic base jobs in 2005, 2015 and 2030. The number of base jobs shown for net out-commuting and external household funding reflect the model’s estimates of the direct employment generated within Garfield County by the spending of out-commuter earnings (net of in-commuter earnings taken out of the County) and external household funding.
Exhibit III-5. Projected Baseline Economic Base Jobs: 2005, 2015 and 2030
Source:
BBC Research and Consulting, 2006.
External Funding
Net Outcommuting
Manufacturing
Agriculture
Government
Gas
Regional Services
Tourism
0 2,000 4,000 6,000 8,000
2,4503,371
6,223
7903,175
5,829
400442513
500500500
1,7501,933
2,244
2,0002,473
1,429
4,0004,700
6,561
3,7804,441
6,200
2005
2015
2030
BBC RESEARCH & CONSULTING SECTION III, PAGE 6
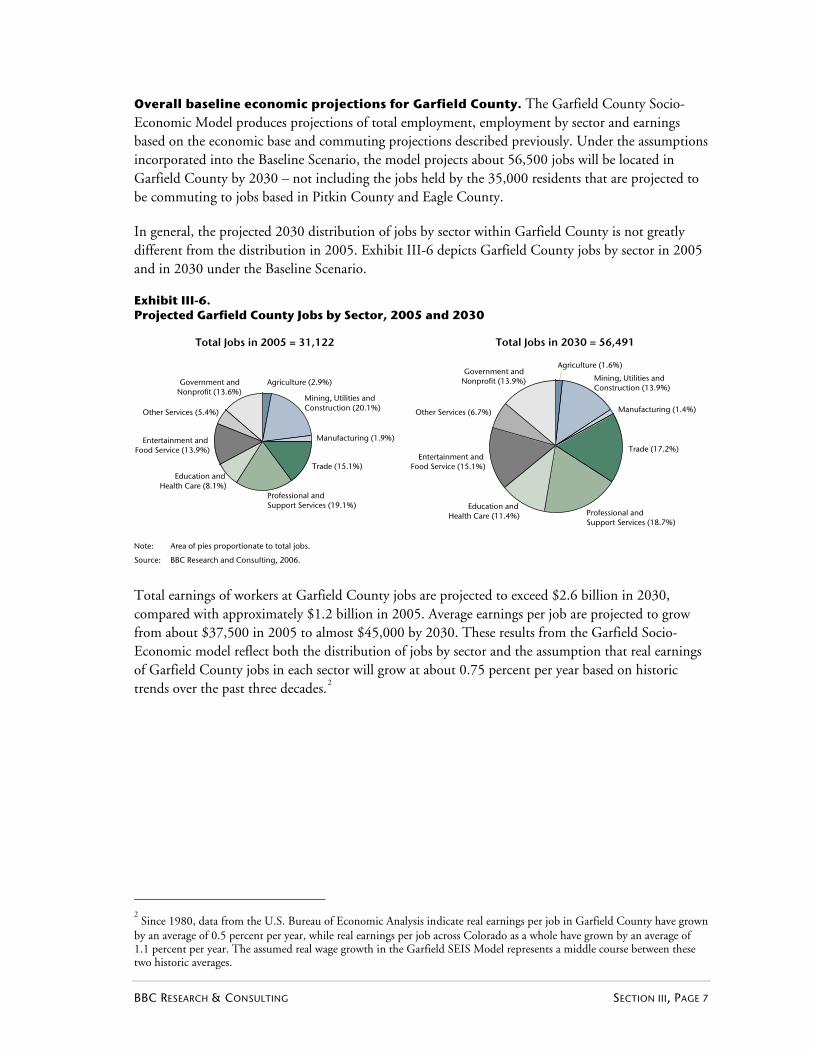
Overall baseline economic projections for Garfield County. The Garfield County Socio-Economic Model produces projections of total employment, employment by sector and earnings based on the economic base and commuting projections described previously. Under the assumptions incorporated into the Baseline Scenario, the model projects about 56,500 jobs will be located in Garfield County by 2030 – not including the jobs held by the 35,000 residents that are projected to be commuting to jobs based in Pitkin County and Eagle County.
In general, the projected 2030 distribution of jobs by sector within Garfield County is not greatly different from the distribution in 2005. Exhibit III-6 depicts Garfield County jobs by sector in 2005 and in 2030 under the Baseline Scenario.
Exhibit III-6. Projected Garfield County Jobs by Sector, 2005 and 2030
Total Jobs in 2005 = 31,122 Total Jobs in 2030 = 56,491
Agriculture (2.9%)
Mining, Utilities andConstruction (20.1%)
Manufacturing (1.9%)
Trade (15.1%)
Professional andSupport Services (19.1%)
Education andHealth Care (8.1%)
Entertainment andFood Service (13.9%)
Other Services (5.4%)
Government andNonprofit (13.6%)
Agriculture (1.6%)
Mining, Utilities andConstruction (13.9%)
Manufacturing (1.4%)
Trade (17.2%)
Professional andSupport Services (18.7%)
Education andHealth Care (11.4%)
Entertainment andFood Service (15.1%)
Other Services (6.7%)
Government andNonprofit (13.9%)
Note: Area of pies proportionate to total jobs.
Source: BBC Research and Consulting, 2006.
Total earnings of workers at Garfield County jobs are projected to exceed $2.6 billion in 2030, compared with approximately $1.2 billion in 2005. Average earnings per job are projected to grow from about $37,500 in 2005 to almost $45,000 by 2030. These results from the Garfield Socio-Economic model reflect both the distribution of jobs by sector and the assumption that real earnings of Garfield County jobs in each sector will grow at about 0.75 percent per year based on historic trends over the past three decades.2
2 Since 1980, data from the U.S. Bureau of Economic Analysis indicate real earnings per job in Garfield County have grown
by an average of 0.5 percent per year, while real earnings per job across Colorado as a whole have grown by an average of 1.1 percent per year. The assumed real wage growth in the Garfield SEIS Model represents a middle course between these two historic averages.
BBC RESEARCH & CONSULTING SECTION III, PAGE 7
Based upon the large increase in out-commuting to Eagle County and Pitkin County assumed under the Baseline Scenario, the earnings of Garfield County residents that commute to jobs outside the county will grow dramatically. In 2005, the total earnings of the 6,500 Garfield County residents working outside the County were estimated at about $150 million. By 2030, the gross earnings of the projected 35,000 out-commuters are projected to exceed $950 million. Average earnings from out-commuting are expected to remain substantially lower than the average earnings per job based within the County.
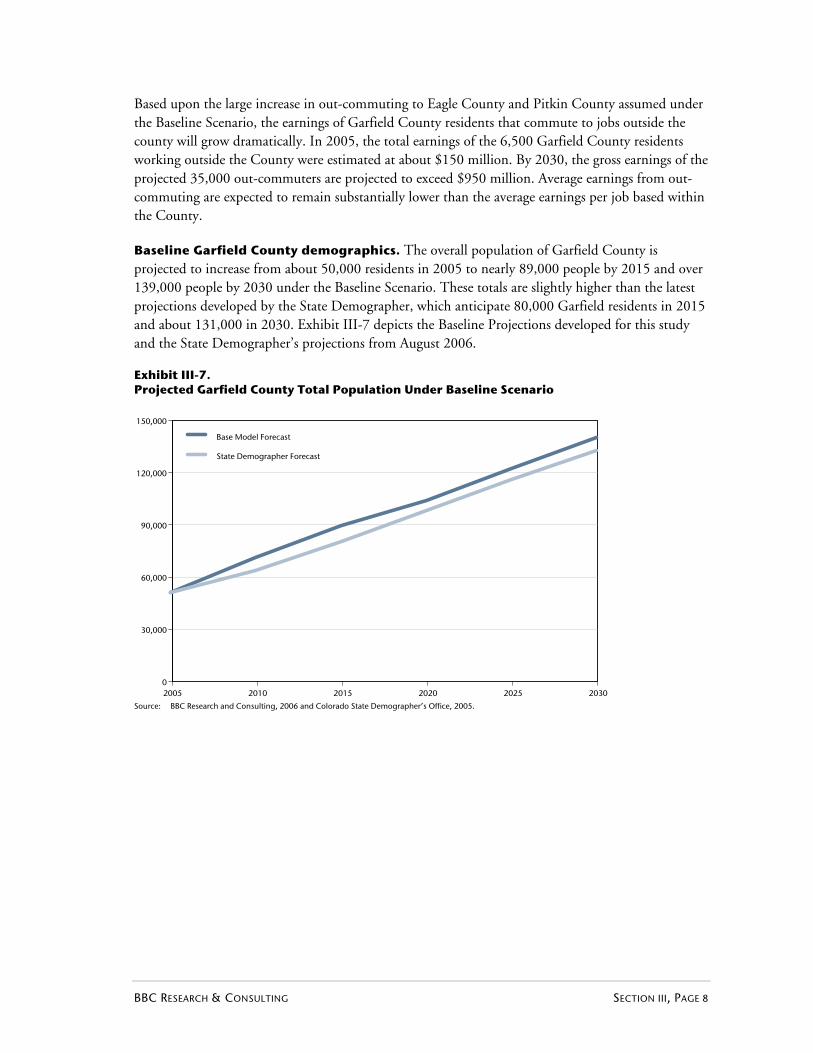
Baseline Garfield County demographics. The overall population of Garfield County is projected to increase from about 50,000 residents in 2005 to nearly 89,000 people by 2015 and over 139,000 people by 2030 under the Baseline Scenario. These totals are slightly higher than the latest projections developed by the State Demographer, which anticipate 80,000 Garfield residents in 2015 and about 131,000 in 2030. Exhibit III-7 depicts the Baseline Projections developed for this study and the State Demographer’s projections from August 2006.
Exhibit III-7. Projected Garfield County Total Population Under Baseline Scenario
2005 2010 2015 2020 2025 20300
30,000
60,000
90,000
120,000
150,000
Base Model Forecast
State Demographer Forecast
Source: BBC Research and Consulting, 2006 and Colorado State Demographer’s Office, 2005.
BBC RESEARCH & CONSULTING SECTION III, PAGE 8

In 2005, Garfield County was home to approximately 18,700 households. By 2030, the Baseline Scenario anticipates there will be over 50,000 households in the County.
Apart from the projected increases in the overall size of the population, Garfield County demographics are projected to change in other ways under the Baseline Scenario. As shown in Exhibit III-8, the proportions of the County population under the age of 20 and between the ages of 60 and 79 are projected to increase by 2030. The proportions of Garfield County residents between the ages of 20 and 59 are expected to be smaller in 2030 than in 2005.
Exhibit III-8. Baseline Garfield County Age Distribution: 2005 and 2030
Source:
BBC Research and Consulting, 2006 and Colorado State Demographer’s Office, 2005.
80 and over
70 to 79
60 to 69
50 to 59
40 to 49
30 to 39
20 to 29
10 to 19
0 to 9
0% 10% 20% 30% 40% 50% 60% 70% 80% 90% 100%
Ag
e C
oh
ort
Share of Total
16%17%
14%15%
12%12%
15%14%
17%15%
13%12%
6%9%
4%4%
2%2%
2005
2030
The number of County residents with Limited English Proficiency is also projected to increase under the Baseline Scenario. Just under 3,500 County residents had limited English skills in 2005, by 2030 the LEP population is projected to exceed 11,000. As noted in Section II, these estimates/projections are Census-based and may reflect a significant undercount of this population group in official data.
BBC RESEARCH & CONSULTING SECTION III, PAGE 9
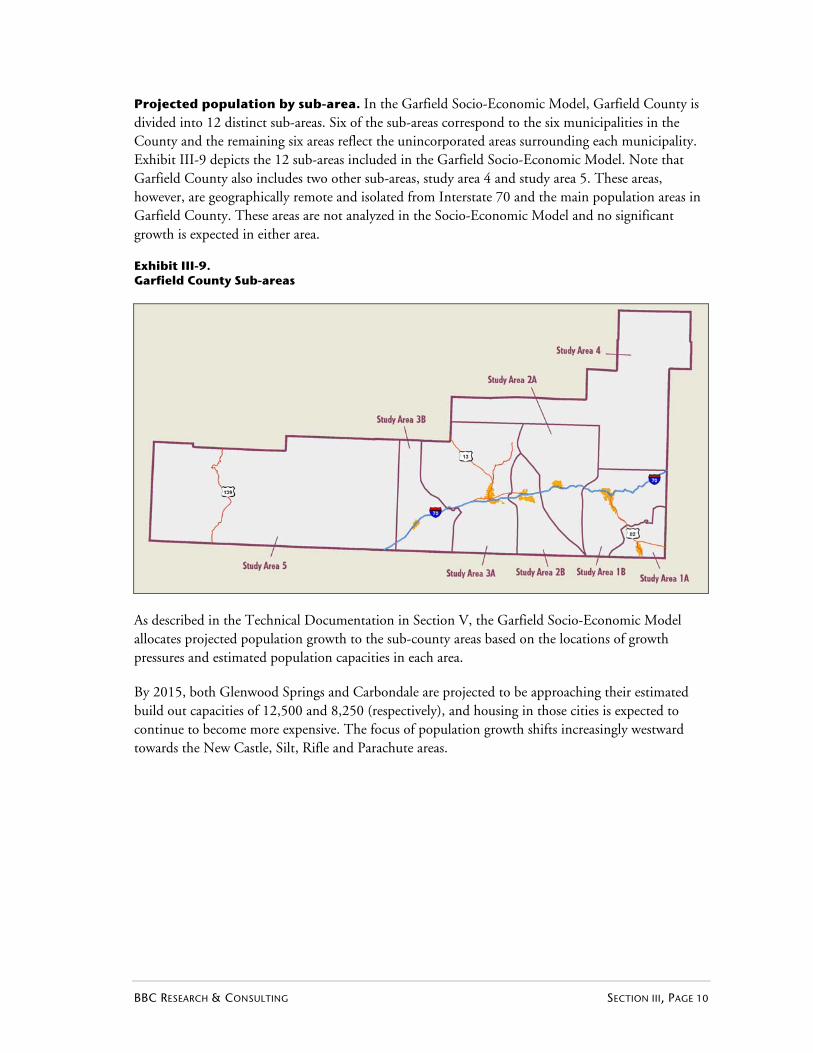
Projected population by sub-area. In the Garfield Socio-Economic Model, Garfield County is divided into 12 distinct sub-areas. Six of the sub-areas correspond to the six municipalities in the County and the remaining six areas reflect the unincorporated areas surrounding each municipality. Exhibit III-9 depicts the 12 sub-areas included in the Garfield Socio-Economic Model. Note that Garfield County also includes two other sub-areas, study area 4 and study area 5. These areas, however, are geographically remote and isolated from Interstate 70 and the main population areas in Garfield County. These areas are not analyzed in the Socio-Economic Model and no significant growth is expected in either area.
Exhibit III-9. Garfield County Sub-areas
As described in the Technical Documentation in Section V, the Garfield Socio-Economic Model allocates projected population growth to the sub-county areas based on the locations of growth pressures and estimated population capacities in each area.
By 2015, both Glenwood Springs and Carbondale are projected to be approaching their estimated build out capacities of 12,500 and 8,250 (respectively), and housing in those cities is expected to continue to become more expensive. The focus of population growth shifts increasingly westward towards the New Castle, Silt, Rifle and Parachute areas.
BBC RESEARCH & CONSULTING SECTION III, PAGE 10

Under the Baseline Scenario, Rifle is projected to become the largest city in Garfield County and home to nearly 30,000 residents by 2030. Silt, New Castle and Parachute—as well as the unincorporated areas proximate to each of the cities in the Colorado River Valley—are also projected to experience substantial growth. Exhibit III-10 depicts the 2005 population in each study area and the projected population in 2030.
Exhibit III-9. Garfield County Sub-areas Baseline Population Projection
0
5,000
10,000
15,000
20,000
25,000
30,000
35,000
40,000
45,000
50,000
2000
8,455
2030
15,554
2000
12,355
2030
22,215
2000
4,020
2030
19,623
2000
3,495
2030
17,360
2000
10,395
2030
43,859
2000
5,115
2030
20,905
CarbondaleArea
Glenwood Springs Area
New CastleArea
SiltArea
RifleArea
ParachuteArea
Total Population
Municipal
Unincorporated
0
5,000
10,000
15,000
20,000
25,000
30,000
35,000
40,000
45,000
50,000
2000
8,455
2030
15,554
2000
8,455
2000
8,455
2030
15,554
2030
15,554
2000
12,355
2030
22,215
2000
12,355
2000
12,355
2030
22,215
2030
22,215
2000
4,020
2030
19,623
2000
4,020
2000
4,020
2030
19,623
2030
19,623
2000
3,495
2030
17,360
2000
3,495
2000
3,495
2030
17,360
2030
17,360
2000
10,395
2030
43,859
2000
10,395
2000
10,395
2030
43,859
2030
43,859
2000
5,115
2030
20,905
2000
5,115
2000
5,115
2030
20,905
2030
20,905
CarbondaleArea
Glenwood Springs Area
New CastleArea
SiltArea
RifleArea
ParachuteArea
Total Population
Municipal
Unincorporated
Source: BBC Research and Consulting, 2006.
These projected growth patterns would have important implications for the three school districts based in Garfield County. Under the Baseline Scenario, School District RE-2 (based in Rifle) is projected to pass School District RE-1 in terms of enrollment and become the largest district in the County between 2010 and 2015. School District 15 (based in Parachute) is projected to see substantial enrollment growth during the later years of the forecast period, reaching about 4,100 students by 2030.
BBC RESEARCH & CONSULTING SECTION III, PAGE 11

Exhibit III-9 depicts projected school district enrollments from 2005 to 2030.
Exhibit III-10. Garfield County Sub-areas
School District
Roaring Fork RE-1 1.15 4,990 8,915
Garfield RE-2 1.04 4,005 16,602
Garfield 16 0.83 1,037 4,084
Enrollment Adjustment Factor 2005 2030
Enrollment
Source: BBC Research and Consulting, 2006.
Potential development patterns. Community Viz, a tool for geographic analysis, provides another way to visualize the projected population growth, and the geographic distribution of that growth, under the Baseline Scenario. Based on the sub-area population projections, jobs described, parcel specific data regarding attractions and impediments to growth, and projected development density, ForeSee Consulting analyzed the potential geographic distribution of the Garfield County population under the Baseline Scenario.
Attraction factors included the proximity of individual parcels to features that would tend to promote housing development, such as:
Cities;
County roads;
Subdivisions;
Public lands;
Highways; and
Rivers and lakes.
Impediments included factors that would tend to limit or slow development, such as:
Floodplains;
Geologic hazards;
Steep slopes;
Septic limitations; and
Gas fields.
Exhibits III-11 through III-13 depict Garfield County population density, by square mile, in 2005 and projected density in 2015 and 2030 under the Baseline Scenario. Areas in white are publicly owned lands not available for development.
BBC RESEARCH & CONSULTING SECTION III, PAGE 12
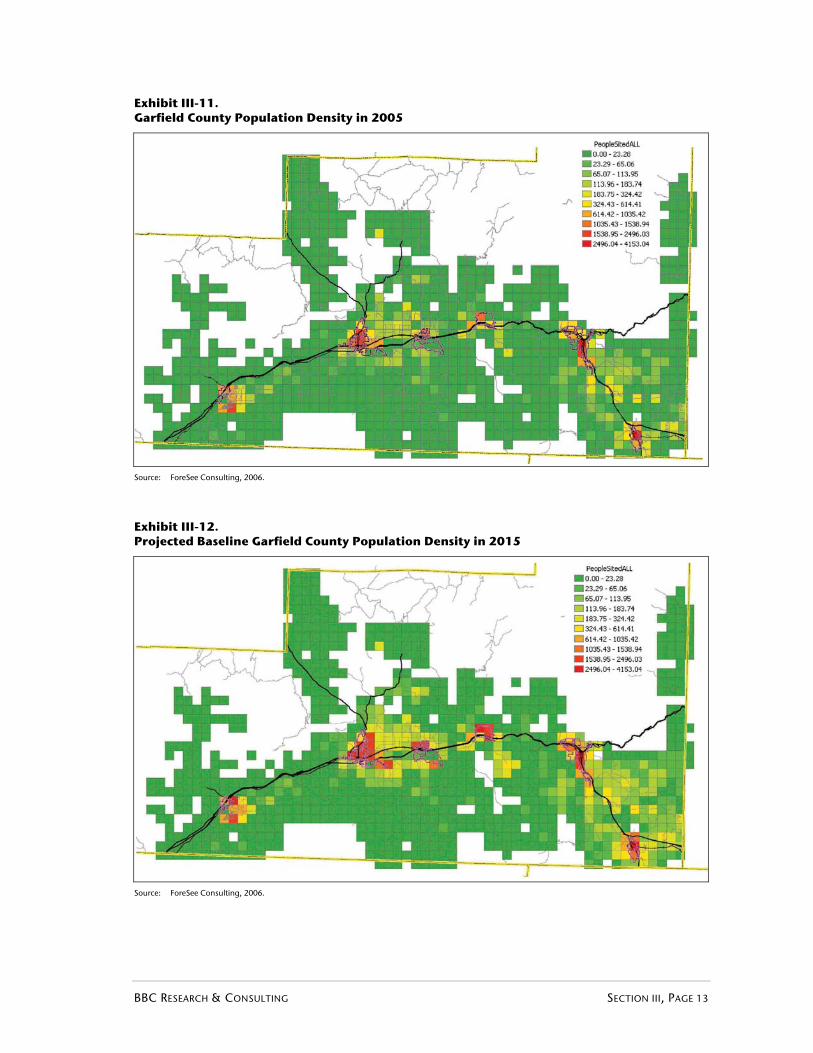
Exhibit III-11. Garfield County Population Density in 2005
Source: ForeSee Consulting, 2006.
Exhibit III-12. Projected Baseline Garfield County Population Density in 2015
Source: ForeSee Consulting, 2006.
BBC RESEARCH & CONSULTING SECTION III, PAGE 13

Exhibit III-13. Projected Baseline Garfield County Population Density in 2030
Source: ForeSee Consulting, 2006.
Alternative Commuting Scenario
Much of the projected long-term population growth in Garfield County under the baseline scenario stems from expectations that there will be robust employment growth in Eagle County and Pitkin County over the next thirty years and that a growing proportion of the workers needed in those two counties will live in Garfield County. Out-commuting projections were carefully developed during the Watershed Collaboratives Growth Scenarios Project in 2005 and revisited in meetings between the study team and the planning staff of all three counties during development of the Garfield County Socio-Economic Model.
Although the large increases in out-commuting projected during the Watershed Collaboratives effort remain the baseline planning scenario in all three counties (as well as the State Demographer’s Office), all parties recognize there is a large amount of uncertainty surrounding these projections. Recent increases in housing prices throughout most of Garfield County, largely driven by energy-related job growth, also raise concerns that there may not be enough affordable housing to accommodate all of the anticipated future out-commuters.
Given these uncertainties, the study team developed an alternative commuting scenario to consider how the baseline projections would change with less growth in out-commuting than assumed under the Baseline Scenario
BBC RESEARCH & CONSULTING SECTION III, PAGE 14

Alternative commuting assumptions. To develop a reduced out-commuting growth scenario, the study team assumed that the proportion of the jobs in Pitkin County and Eagle County worked by residents of Garfield County would increase more slowly than anticipated by the Watershed Collaboratives Project. Exhibit III-14 depicts the current and projected proportions of Pitkin County jobs and Eagle County jobs worked by out-commuters from Garfield County under the Alternative Commuting Scenario and under the Baseline Scenario (which reflects the Watershed Collaboratives assumptions).
Exhibit III-14. Projected Shares of Eagle County and Pitkin County Jobs Worked by Garfield County Residents
Year
2005 2.3% 34.4% 2.3% 34.4%
2015 10.3% 42.0% 18.3% 49.5%
2030 14.4% 44.2% 26.5% 54.1%
Alternative Commuting Scenario Baseline Scenario
Pitkin CountyEagle CountyPitkin CountyEagle County
Source: BBC Research and Consulting, 2006.
By way of comparison, data from the U.S. Census Journey-to-Work files for 1990 and 2000 indicate that during the 1990s, Garfield County residents filled one in ten new jobs in Eagle County and four in ten new jobs in Pitkin County.
In total, the number of out-commuters from Garfield County to Eagle County and Pitkin County is projected to increase from about 6,700 in 2005 to nearly 24,000 by 2030 under the Alternative Commuting Scenario. Under the Baseline Scenario/Watershed Collaboratives assumptions, there would be almost 35,500 Garfield County out-commuters in 2030. Exhibit III-15 depicts projected out-commuting to both counties under each scenario.
BBC RESEARCH & CONSULTING SECTION III, PAGE 15

Exhibit III-15. Projected Garfield County Out-commuting Under the Alternative Commuting Scenario and the Baseline Scenario
Alternative
Baseline
Alternative
Baseline
Alternative
Baseline
Alternative
Baseline
Alternative
Baseline
Alternative
Baseline
0 10,000 20,000 30,000 40,000 50,000
6346,068 6,702
6346,068 6,702
5,221 9,002 14,223
3,0498,087 11,136
8,407 11,724 20,131
4,732 9,947 14,679
11,920 13,840 25,760
6,556 11,520 18,076
15,243 15,616 30,859
8,365 12,862 21,227
18,400 17,084 35,484
9,998 13,958 23,956
2005
2010
2015
2020
2025
2030
Eagle County
BaselineSenario
AlternativeCommutingSenario
Pitkin County
BaselineSenario
AlternativeCommutingSenario
Source: BBC Research and Consulting, 2006 and Watershed Collaboratives Growth Scenarios Project, 2005.
Overall economic projections under the Alternative Commuting Scenario. The smaller number of out-commuters under the Alternative Commuting Scenario implies a smaller overall population than under the Baseline Scenario and less money imported into Garfield County to support retail and service sector jobs. The total number of jobs within the County is projected to reach about 52,600 by 2030 – compared to about 56,500 jobs under the Baseline Scenario.
The largest differences in projected 2030 employment between the Alternative Commuting Scenario and the Baseline Scenario are in the following sectors:
Education and healthcare services (-14 percent);
Other services (-11 percent);
Trade (-9 percent); and
Government and non-profits (-8 percent).
Under the Alternative Commuting Scenario, total earnings of workers at Garfield County jobs would be under $2.4 billion in 2030, compared with $2.6 billion under the Baseline Scenario and approximately $1.2 billion in 2005. Projected average earnings per job are not significantly different between the Alternative Commuting Scenario and the Baseline Scenario.
BBC RESEARCH & CONSULTING SECTION III, PAGE 16

Garfield County demographics under the Alternative Commuting Scenario. Garfield County’s population would grow more slowly under the Alternative Commuting Scenario than under the Baseline Scenario. By 2030, the Alternative Commuting Scenario anticipates a total county population of about 112,600 compared to the Baseline Scenario’s population of 139,500. Exhibit III-16 compares the countywide population projections under the two scenarios.
Exhibit III-16. Projected Garfield County Total Population under Alternative Commuting Scenario and Baseline Scenario
2005 2010 2015 2020 2025 20300
20,000
40,000
60,000
80,000
100,000
120,000
140,000
Year
Reduced Out-Commuting
Base Case
Source: BBC Research and Consulting, 2006.
Under the Alternative Commuting Scenario, the number of households in the County would grow from 18,700 in 2005 to 41,100 by 2030. Under the Baseline Scenario, there would be over 50,000 households by 2030.
County social services requirements might also be smaller under the Alternative Commuting Scenario than under the Baseline Scenario. The number of residents over the age of 70 in 2030 is projected at fewer than 7,500 under the Alternative Commuting Scenario versus about 8,400 under the Baseline Scenario. The number of Limited English Proficient residents is projected to reach about 9,100 by 2030 under the Alternative Commuting Scenario compared with 11,300 under the Baseline Scenario.
BBC RESEARCH & CONSULTING SECTION III, PAGE 17
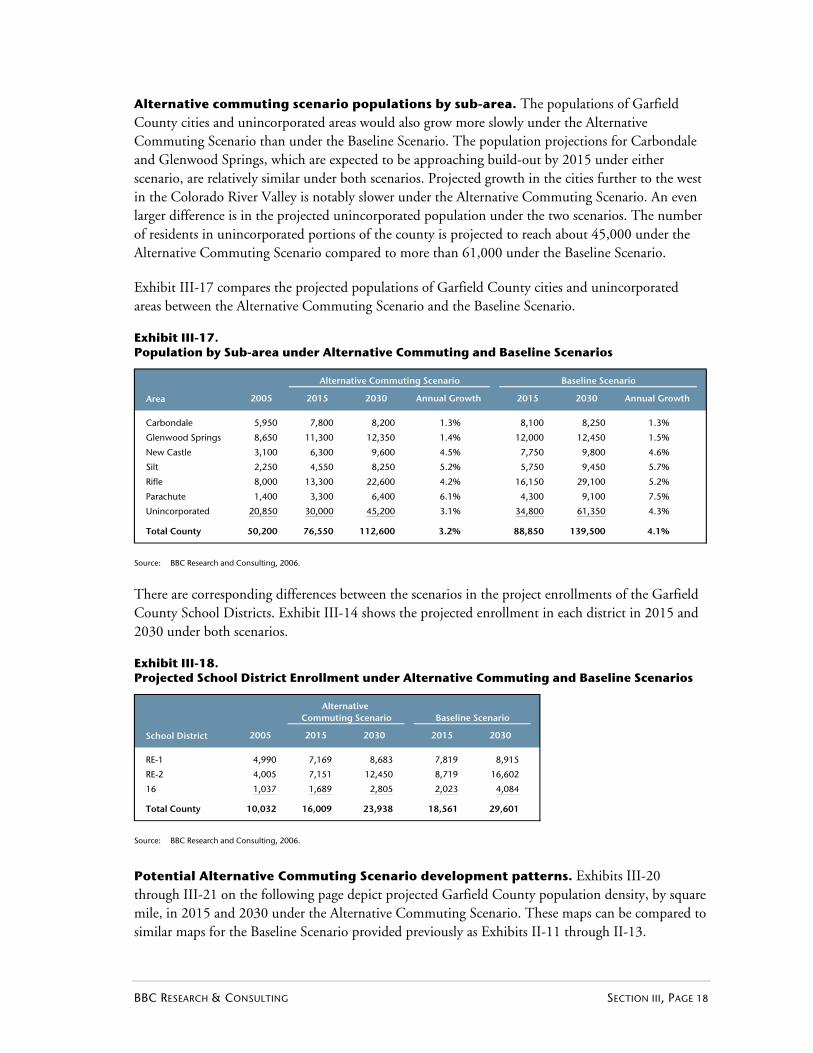
Alternative commuting scenario populations by sub-area. The populations of Garfield County cities and unincorporated areas would also grow more slowly under the Alternative Commuting Scenario than under the Baseline Scenario. The population projections for Carbondale and Glenwood Springs, which are expected to be approaching build-out by 2015 under either scenario, are relatively similar under both scenarios. Projected growth in the cities further to the west in the Colorado River Valley is notably slower under the Alternative Commuting Scenario. An even larger difference is in the projected unincorporated population under the two scenarios. The number of residents in unincorporated portions of the county is projected to reach about 45,000 under the Alternative Commuting Scenario compared to more than 61,000 under the Baseline Scenario.
Exhibit III-17 compares the projected populations of Garfield County cities and unincorporated areas between the Alternative Commuting Scenario and the Baseline Scenario.
Exhibit III-17. Population by Sub-area under Alternative Commuting and Baseline Scenarios
Area
Carbondale 5,950 7,800 8,200 1.3% 8,100 8,250 1.3%
Glenwood Springs 8,650 11,300 12,350 1.4% 12,000 12,450 1.5%
New Castle 3,100 6,300 9,600 4.5% 7,750 9,800 4.6%
Silt 2,250 4,550 8,250 5.2% 5,750 9,450 5.7%
Rifle 8,000 13,300 22,600 4.2% 16,150 29,100 5.2%
Parachute 1,400 3,300 6,400 6.1% 4,300 9,100 7.5%
Unincorporated 20,850 30,000 45,200 3.1% 34,800 61,350 4.3%
Total County 50,200 76,550 112,600 3.2% 88,850 139,500 4.1%
Alternative Commuting Scenario Baseline Scenario
Annual Growth203020152005 Annual Growth 2015 2030
Source: BBC Research and Consulting, 2006.
There are corresponding differences between the scenarios in the project enrollments of the Garfield County School Districts. Exhibit III-14 shows the projected enrollment in each district in 2015 and 2030 under both scenarios.
Exhibit III-18. Projected School District Enrollment under Alternative Commuting and Baseline Scenarios
School District
RE-1 4,990 7,169 8,683 7,819 8,915
RE-2 4,005 7,151 12,450 8,719 16,602
16 1,037 1,689 2,805 2,023 4,084
Total County 10,032 16,009 23,938 18,561 29,601
Baseline Scenario
2030 2015 2030
Alternative
20152005
Commuting Scenario
Source: BBC Research and Consulting, 2006.
Potential Alternative Commuting Scenario development patterns. Exhibits III-20 through III-21 on the following page depict projected Garfield County population density, by square mile, in 2015 and 2030 under the Alternative Commuting Scenario. These maps can be compared to similar maps for the Baseline Scenario provided previously as Exhibits II-11 through II-13.
BBC RESEARCH & CONSULTING SECTION III, PAGE 18

Exhibit III-20. Projected Alternative Commuting Scenario Garfield County Population Density in 2015
Source: ForeSee Consulting, 2006.
Exhibit III-21. Projected Alternative Commuting Scenario Garfield County Population Density in 2030
Source: ForeSee Consulting, 2006.
BBC RESEARCH & CONSULTING SECTION III, PAGE 19

Rio Blanco Boom Scenario
While the Alternative Commuting Scenario describes a potential future of somewhat slower growth than the Baseline Scenario, there are also potential factors that could increase Garfield County growth beyond the Baseline projections. Perhaps the most significant of these potential growth factors is the possibility of substantial energy resource development in neighboring Rio Blanco County.
Projected Rio Blanco Boom jobs worked by Garfield County residents. Rio Blanco County energy development could occur in several forms and several stages. Study team interviews with representatives of the natural gas industry currently active in Garfield County indicated that the industry anticipates increasing development of gas wells in Rio Blanco County as well development in Garfield County begins to slow during the next decade. Rio Blanco County is also situated atop some of the largest oil shale resources in the western U.S. In the near term, the Bureau of Land Management (BLM) is expecting to lease five tracts of land in the Piceance Basin in central Rio Blanco County for oil shale research, development and demonstration projects.
The natural gas industry currently expects that 10,000 to 15,000 wells may ultimately be developed in Rio Blanco County. Assuming similar efficiency to well development in Garfield County, the study team anticipates the workforce for Rio Blanco gas-related activity may approach 3,000 workers by 2020 and 5,000 workers by 2030.
The closest towns to most of the future wells will be Meeker, in Rio Blanco County, and Rifle and Parachute in Garfield County. Given Meeker’s smaller size (relative to Rifle) and limited housing supply, about one half of the workforce for Rio Blanco natural gas development activity may commute from homes in Garfield County. Exhibit III-22 on the following portrays the projected Rio Blanco County natural gas workforce under the Rio Blanco Boom Scenario and the number of workers projected to commute to gas-related work in Rio Blanco County from homes in Garfield County.
BBC RESEARCH & CONSULTING SECTION III, PAGE 20

Exhibit III-22. Projected Rio Blanco Gas-related Employment and Commuters from Garfield County
Year
2010 100 100 125 273 17 290 50% 145
2011 150 250 130 394 42 436 50% 218
2012 200 450 130 526 75 601 50% 300
2013 250 700 130 657 117 774 50% 387
2014 300 1,000 130 788 167 955 50% 478
2015 350 1,350 130 920 225 1,145 50% 572
2016 400 1,750 130 1,051 292 1,343 50% 672
2017 500 2,250 130 1,314 375 1,689 50% 845
2018 600 2,850 130 1,577 475 2,052 50% 1,026
2019 700 3,550 130 1,840 592 2,432 50% 1,216
2020 850 4,400 130 2,234 733 2,967 50% 1,483
2021 1,000 5,400 130 2,628 900 3,528 50% 1,764
2022 1,000 6,400 130 2,628 1,067 3,695 50% 1,848
2023 1,000 7,400 130 2,628 1,233 3,861 50% 1,931
2024 1,000 8,400 130 2,628 1,400 4,028 50% 2,014
2025 1,000 9,400 130 2,628 1,567 4,195 50% 2,098
2026 1,000 10,400 130 2,628 1,733 4,361 50% 2,181
2027 1,000 11,400 130 2,628 1,900 4,528 50% 2,264
2028 1,000 12,400 130 2,628 2,067 4,695 50% 2,348
2029 1,000 13,400 130 2,628 2,233 4,861 50% 2,431
2030 1,000 14,400 131 2,608 2,400 5,008 50% 2,504
Drilling New wells Cumulative efficiency
Total workforce Based in Garfieldoperating in Rio Blanco Percent Garfield
Maintenance Total Garfield commutersDrilling (vs. 2005*) completionsdrilled
* New rigs are 30 percent more efficient than older ones. Assumes new rigs fully phased in by 2011.
Source: BBC Research and Consulting, 2006.
The companies proposing to lease land from the BLM for oil shale research, development and demonstration projects have recently developed Environmental Assessments (EAs) for those projects. Analysis of those EAs by Garfield County planning staff indicates that the combined construction and operating workforce on the five pilot tracts may peak at about 800 workers around 2010, then gradually decline to a stable operating workforce of around 200 workers over the following 15 years. About one half of the workers for these projects are expected to reside in Garfield County.3
3 Randy Russell, Garfield County Long-range Planner, personal communication on August 16, 2006.
BBC RESEARCH & CONSULTING SECTION III, PAGE 21
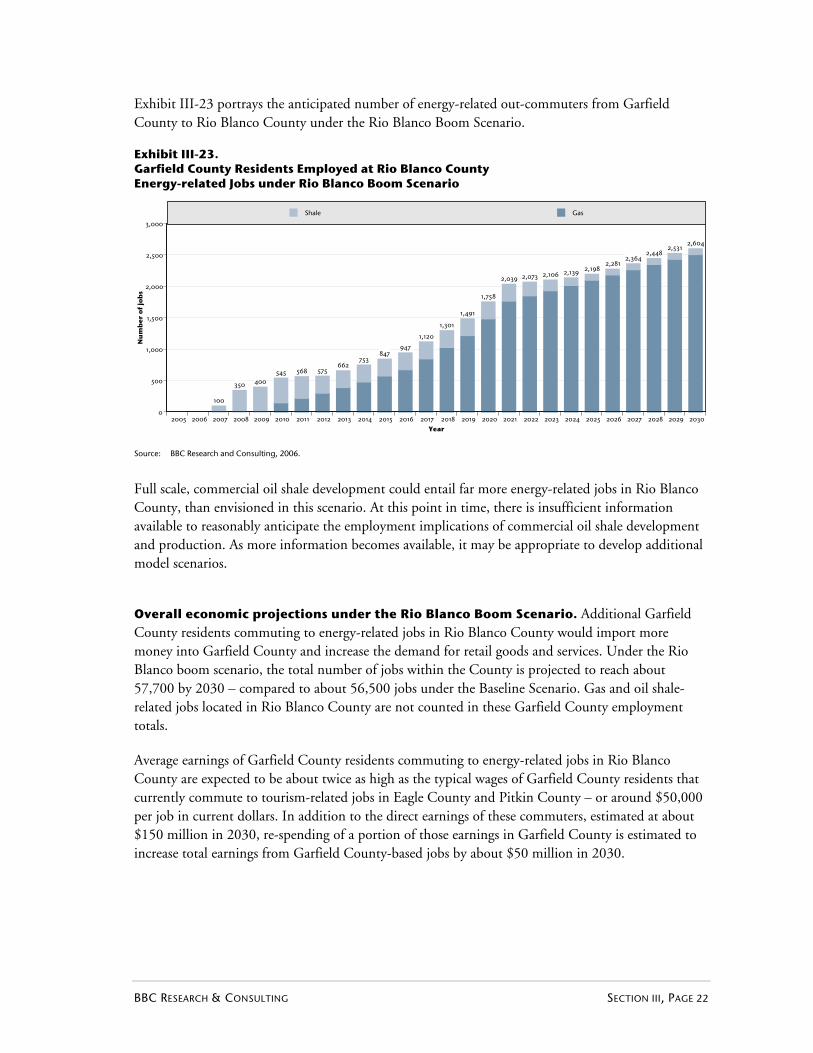
Exhibit III-23 portrays the anticipated number of energy-related out-commuters from Garfield County to Rio Blanco County under the Rio Blanco Boom Scenario.
Exhibit III-23. Garfield County Residents Employed at Rio Blanco County Energy-related Jobs under Rio Blanco Boom Scenario
2005 2006 2007 2008 2009 2010 2011 2012 2013 2014 2015 2016 2017 2018 2019 2020 2021 2022 2023 2024 2025 2026 2027 2028 2029 20300
500
1,000
1,500
2,000
2,500
3,000
Nu
mb
er o
f jo
bs
Year
100
350 400545 568 575
662753
847947
1,120
1,301
1,491
1,758
2,039 2,073 2,106 2,139 2,1982,281
2,3642,448
2,5312,604
GasShale
Source: BBC Research and Consulting, 2006.
Full scale, commercial oil shale development could entail far more energy-related jobs in Rio Blanco County, than envisioned in this scenario. At this point in time, there is insufficient information available to reasonably anticipate the employment implications of commercial oil shale development and production. As more information becomes available, it may be appropriate to develop additional model scenarios.
Overall economic projections under the Rio Blanco Boom Scenario. Additional Garfield County residents commuting to energy-related jobs in Rio Blanco County would import more money into Garfield County and increase the demand for retail goods and services. Under the Rio Blanco boom scenario, the total number of jobs within the County is projected to reach about 57,700 by 2030 – compared to about 56,500 jobs under the Baseline Scenario. Gas and oil shale-related jobs located in Rio Blanco County are not counted in these Garfield County employment totals.
Average earnings of Garfield County residents commuting to energy-related jobs in Rio Blanco County are expected to be about twice as high as the typical wages of Garfield County residents that currently commute to tourism-related jobs in Eagle County and Pitkin County – or around $50,000 per job in current dollars. In addition to the direct earnings of these commuters, estimated at about $150 million in 2030, re-spending of a portion of those earnings in Garfield County is estimated to increase total earnings from Garfield County-based jobs by about $50 million in 2030.
BBC RESEARCH & CONSULTING SECTION III, PAGE 22

Garfield County demographics under the Rio Blanco Boom Scenario. By 2030, the Rio Blanco Boom Scenario anticipates a total county population of about 145,000 compared to the Baseline Scenario’s population of 139,500. Exhibit III-24 compares the countywide population projections under the two scenarios.
Exhibit III-24. Projected Garfield County Total Population Under Rio Blanco Boom Scenario and Baseline Scenario
2005 2010 2015 2020 2025 20300
20,000
40,000
60,000
80,000
100,000
120,000
140,000
160,000
Year
Rio Blanco Boom
Base Case
Source: BBC Research and Consulting, 2006.
Under the Alternative Commuting Scenario, the number of households in the County would grow from 18,700 in 2005 to 52,300 by 2030. Under the Baseline Scenario, there would be about 50,450 households by 2030. Garfield County’s population of senior residents and residents with Limited English Proficiency would be slightly larger under the Rio Blanco Boom Scenario than under the Baseline Scenario.
Rio Blanco Boom Scenario populations by sub-area. The populations of Garfield County cities and unincorporated areas would be larger under the Rio Blanco Boom Scenario than under the Baseline Scenario. The population projections for Carbondale and Glenwood Springs, which are expected to be approaching build-out by 2015 under either scenario, are relatively similar under both scenarios. There are somewhat larger differences in the projected populations in the cities further to the west in the Colorado River Valley and in the projected unincorporated population under the two scenarios.
BBC RESEARCH & CONSULTING SECTION III, PAGE 23

Exhibit III-25 compares the projected populations of Garfield County cities and unincorporated areas between the Rio Blanco Boom Scenario and the Baseline Scenario.
Exhibit III-25. Population by Sub-area under Rio Blanco Boom and Baseline Scenarios
Area
Carbondale 5,950 8,100 8,250 1.3% 8,100 8,250 1.3%
Glenwood Springs 8,650 12,050 12,450 1.5% 12,000 12,450 1.5%
New Castle 3,100 7,900 9,850 4.6% 7,750 9,800 4.6%
Silt 2,250 5,950 9,500 5.8% 5,750 9,450 5.7%
Rifle 8,000 16,650 29,350 5.2% 16,150 29,100 5.2%
Parachute 1,400 4,550 9,100 7.5% 4,300 9,100 7.5%
Unincorporated 20,850 35,550 66,500 4.6% 34,800 61,350 4.3%
Total County 50,200 90,750 145,000 4.2% 88,850 139,500 4.1%
20152005
Rio Blanco Boom Scenario Baseline Scenario
Annual Growth2030 Annual Growth 2015 2030
Source: BBC Research and Consulting, 2006.
There are also differences between the Rio Blanco Boom Scenario and the Baseline Scenario in the project enrollments of the Garfield County School Districts, particularly in the projected enrollment in School District 16 during the latter years of the forecast period. Exhibit III-26 shows the projected enrollment in each district in 2015 and 2030 under both scenarios.
Exhibit III-26. Projected School District Enrollment under Rio Blanco Boom and Baseline Scenarios
School District
RE-1 4,990 7,857 8,943 7,819 8,915
RE-2 4,005 8,962 17,375 8,719 16,602
16 1,037 2,105 4,414 2,023 4,084
Total County 10,032 18,924 30,732 18,561 29,601
Alternative
20152005
Commuting Scenario Baseline Scenario
2030 2015 2030
Source: BBC Research and Consulting, 2006.
Potential Rio Blanco Boom Scenario development patterns. Exhibits III-27 and III-28 depict projected Garfield County population density, by square mile, in 2015 and 2030 under the Rio Blanco Boom Scenario. These maps can be compared to similar maps for the Baseline Scenario provided previously as Exhibits 11 through 13.
BBC RESEARCH & CONSULTING SECTION III, PAGE 24

Exhibit III-27. Projected Rio Blanco Boom Scenario Garfield County Population Density in 2015
Source: ForeSee Consulting, 2006.
Exhibit III-28. Projected Rio Blanco Boom Scenario Garfield County Population Density in 2030
Source: ForeSee Consulting, 2006.
BBC RESEARCH & CONSULTING SECTION III, PAGE 25
VOLUME 2 Socio-Economic Model User’s Guide and Technical Documentation

SECTION IV. Users Guide and Tutorial
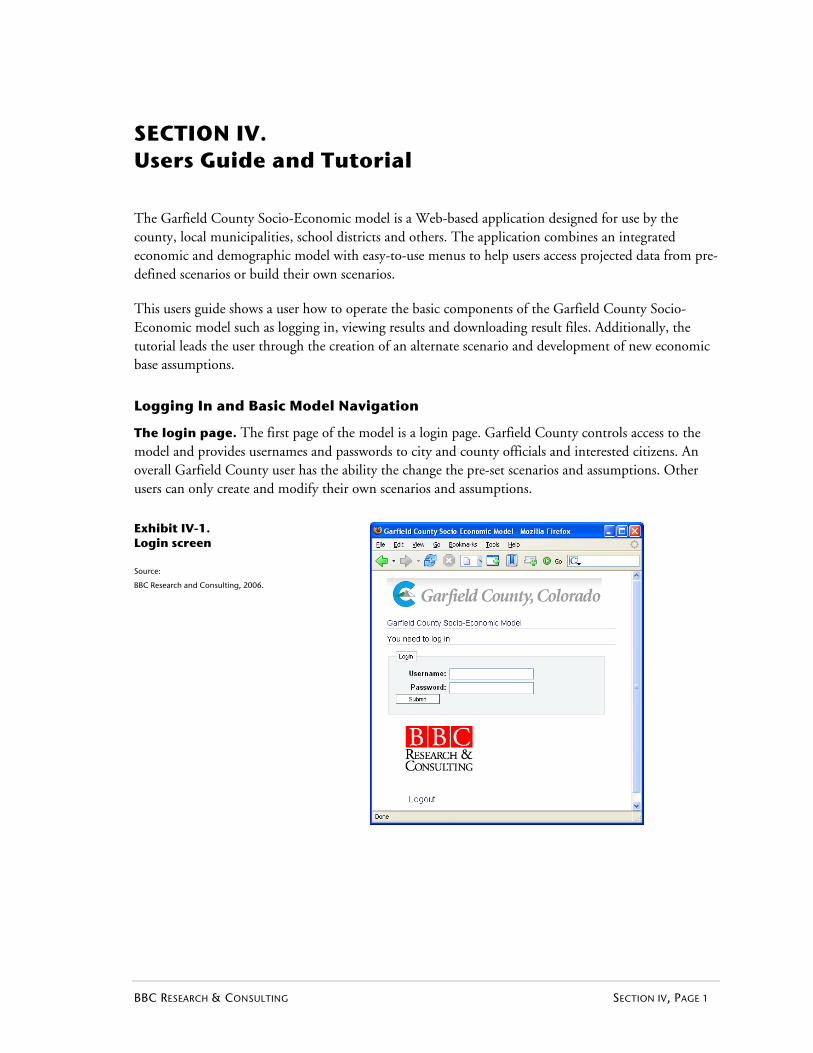
SECTION IV. Users Guide and Tutorial
The Garfield County Socio-Economic model is a Web-based application designed for use by the county, local municipalities, school districts and others. The application combines an integrated economic and demographic model with easy-to-use menus to help users access projected data from pre-defined scenarios or build their own scenarios.
This users guide shows a user how to operate the basic components of the Garfield County Socio-Economic model such as logging in, viewing results and downloading result files. Additionally, the tutorial leads the user through the creation of an alternate scenario and development of new economic base assumptions.
Logging In and Basic Model Navigation
The login page. The first page of the model is a login page. Garfield County controls access to the model and provides usernames and passwords to city and county officials and interested citizens. An overall Garfield County user has the ability the change the pre-set scenarios and assumptions. Other users can only create and modify their own scenarios and assumptions.
Exhibit IV-1. Login screen
Source:
BBC Research and Consulting, 2006.
BBC RESEARCH & CONSULTING SECTION IV, PAGE 1

The front page. The front page of the model gives three options for the user; View or Modify Model Assumptions, Run Model and View Results. Clicking on the title of any page (“Garfield County Socio-Economic Model”) returns the user to the front page.
Exhibit IV-2. Front page
Source: BBC Research and Consulting, 2006.
Two important terms used in the Garfield County Socio-economic model are “scenarios” and “assumptions.” A scenario is a set of assumptions for each of the key components of the model including demographics (fertility, mortality, migration, etc.), economics (base job projections, commuting information) and geographic allocation (study area capacities). The first part of the tutorial explains how to view and download results from a given scenario. The second part explains how a user creates a scenario. A user may also create a new set of assumptions and include that data in a new scenario. The last part of the tutorial gives instructions for creating a new set of assumptions.
BBC RESEARCH & CONSULTING SECTION IV, PAGE 2

Viewing and Downloading Results
Viewing Results. The “View Results” page allows users to download or view results from any user’s scenario that has been created and run. Note that the results pages may be empty for a scenario if the creator of the scenario has not run the model using the given scenario. Results tables can be downloaded (in a comma delimited file) and opened in Microsoft Excel or Access.
The “Population” page allows users to drill down into tables by year, geographic area, cohort and limited English proficiency population. On the “Economics” page users can view results by sector, year and the type of economic measure (total output, total earnings or jobs). Users can view results on the “Households” page by year and study area. School district population forecasts can be found under the “School Districts” tab by school district and year. The “Summary” tab allows users to see an overview of demographic, economic and geographic distribution results for a given scenario in 2015 and 2030.
Exhibit IV-3. Viewing results
Source: BBC Research and Consulting, 2006.
BBC RESEARCH & CONSULTING SECTION IV, PAGE 3

Downloading Results. Results can be downloaded by clicking on the “Download Data” tab of the “View Results” page. Exhibit IV-4 shows the “Download Results” screen.
Exhibit IV-4. ”Download results” screen
Source: BBC Research and Consulting, 2006.
BBC RESEARCH & CONSULTING SECTION IV, PAGE 4
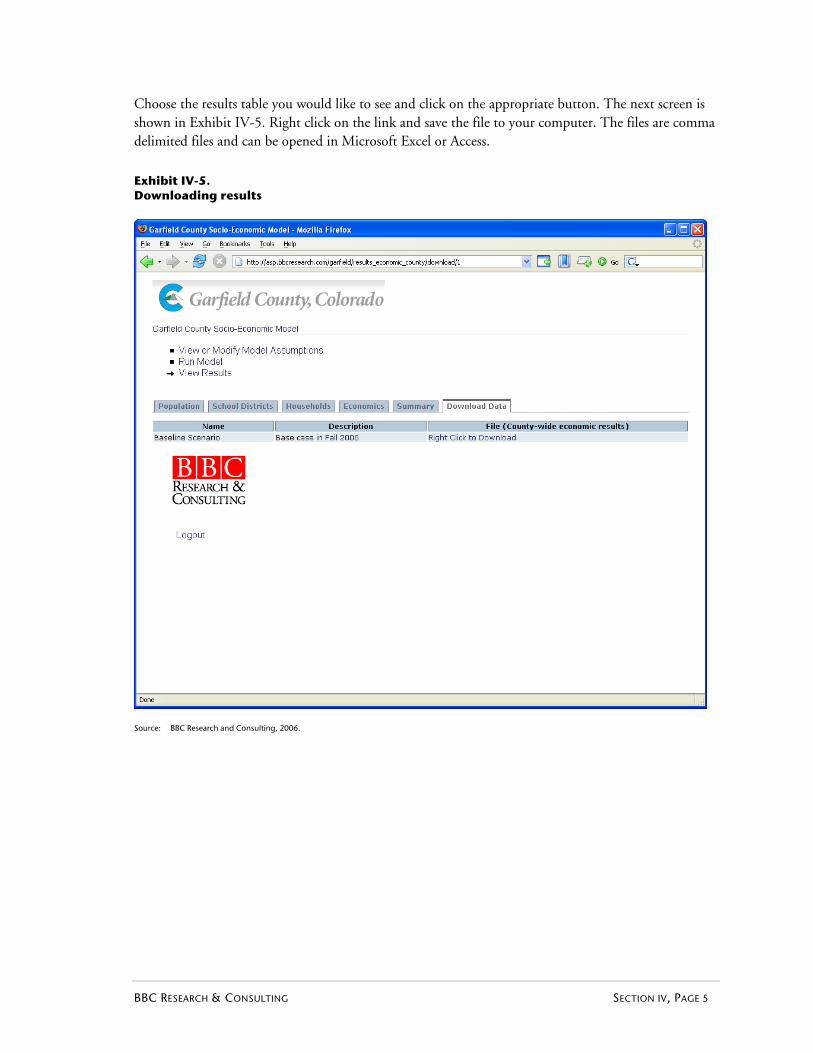
Choose the results table you would like to see and click on the appropriate button. The next screen is shown in Exhibit IV-5. Right click on the link and save the file to your computer. The files are comma delimited files and can be opened in Microsoft Excel or Access.
Exhibit IV-5. Downloading results
Source: BBC Research and Consulting, 2006.
BBC RESEARCH & CONSULTING SECTION IV, PAGE 5

Creating a New Scenario
This tutorial outlines the process for a user to create a new scenario in the Garfield County Socio-Economic Model.
1. Click on the “Run Model” link. The top of the page should appear similar to the picture in Exhibit IV-6.
Exhibit IV-6. The “Run model” screen
Source: BBC Research and Consulting, 2006.
BBC RESEARCH & CONSULTING SECTION IV, PAGE 6

2. Scroll to the bottom of the screen. The box at the bottom of the screen allows the user to name a new scenario, document its description and choose from various assumptions to use in the new scenario. Exhibit IV-7 shows a picture of the bottom of the “Run Model” page.
Exhibit IV-7. The “Add a new scenario” box on the “Run model” screen
Source: BBC Research and Consulting, 2006.
BBC RESEARCH & CONSULTING SECTION IV, PAGE 7

3. Each of the drop down boxes in the “Add a new scenario” box has the assumptions that have been previously created by all model users. For example, the “Out-commuting Group” drop down box includes four sets of out-commuting assumptions, the “Watershed Collaborative Commuting Assumption,” the “Alternative Commuting Assumption,” the “No Out-commuting Growth Scenario” and the “Rio Blanco Boom with original Watershed Collaborative.” The user can create a new scenario with any of these existing out-commuting assumptions. (Later in the section, we will describe how to create new assumptions).
4. In order to look at the differences among the existing sets of out-commuting assumptions you can click on the “View or Modify Model Assumptions” link at the top of the page. From the list of assumption options, choose “Economic Assumptions.” Exhibit IV-8 shows the “Economic Assumptions” page.
Exhibit IV-8. View or modify economic assumptions
Source: BBC Research and Consulting, 2006.
BBC RESEARCH & CONSULTING SECTION IV, PAGE 8

5. Click on the “Out-commuting” tab. This view is shown in Exhibit IV-9.
Exhibit IV-9. Out-commuting assumptions page
Source: BBC Research and Consulting, 2006.
BBC RESEARCH & CONSULTING SECTION IV, PAGE 9

6. Click on the “Number of out-commuters by County” tab. Exhibit IV-10 shows the resulting screen.
Exhibit IV-10. ”Number of out commuters by county” assumptions
Source: BBC Research and Consulting, 2006.
BBC RESEARCH & CONSULTING SECTION IV, PAGE 10

7. Notice the four sets of assumptions. Note that all assumptions were created by the “Garfield County” user and can only be edited by that user. Click on the “Year” button under “View / Edit By,” for the “Watershed Collaborative Commuting Assumption” assumption set and click on thes “Show” button in the 2030 row. Your screen should appear similar to the screen in Exhibit IV-11.
Exhibit IV-11. Viewing the “Watershed collaborative commuting assumptions” for 2030
Source: BBC Research and Consulting, 2006.
BBC RESEARCH & CONSULTING SECTION IV, PAGE 11

8. In order to calculate the number of out-commuters in Garfield County, the model uses an assumed number of total workers (jobs) for the neighboring counties and assumed proportions of those workers that reside in Garfield County. The “Watershed Collaborative Commuting Assumption” projects 31,579 workers in Pitkin County in 2030. Under this assumption, 54 percent of those workers will reside in Garfield County. Compare this to the “Alternative Commuting Scenario” (see Exhibit IV-12). This assumption set assumes the same number of workers in Pitkin County, but only 44 percent will reside Garfield County.
Exhibit IV-12. Viewing the “Alternative commuting assumptions” for 2030
Source: BBC Research and Consulting, 2006.
BBC RESEARCH & CONSULTING SECTION IV, PAGE 12

9. Explore the differences between other years for the two scenarios and then return to the “Run Model” page.
10. Scroll down and choose the “Watershed Collaborative Commuting Assumption” under “Out-Commuting Assumptions.” Make sure that you enter a name and description for your scenario as shown in Exhibit IV-13 in the “Name Assumptions” box and the “Description Assumptions” box. Press the create button to save your new scenario.
Exhibit IV-13. Adding a new scenario
Source: BBC Research and Consulting, 2006.
BBC RESEARCH & CONSULTING SECTION IV, PAGE 13

11. After pressing create, the screen will look similar Exhibit IV-14. Review your assumption selections and click on the Return to “Scenarios” button.
Exhibit IV-14. Reviewing the new scenario
Source: BBC Research and Consulting, 2006.
BBC RESEARCH & CONSULTING SECTION IV, PAGE 14

12. Next press the “Run” button next to your scenario. This will create results that you can browse on the “View Results” pages. Exhibit IV-15 shows the post-run screen.
Exhibit IV-15. The post run screen
Source: BBC Research and Consulting, 2006.
BBC RESEARCH & CONSULTING SECTION IV, PAGE 15

Creating a New Set of Economic Base Assumptions
Suppose that an energy company announced that they would be adding 200 oil shale jobs in the county beginning in 2020 and continuing through the remainder of the study period. Instead of just creating a new scenario, a user would need to add a new set of base job assumptions and then edit the oil shale job numbers for 2020, 2025 and 2030. The following steps show how to add an assumption that can then be used to build an alternate model scenario.
1. From the model frontpage, click on the “View or Modify Assumptions” link. After loading, the page should look like Exhibit IV-16.
Exhibit IV-16. View or modify assumptions
Source: BBC Research and Consulting, 2006.
BBC RESEARCH & CONSULTING SECTION IV, PAGE 16

2. Click on “Economic Assumptions,” followed by the “Base Industry Jobs” tab. The screen should look similar to the picture in Exhibit IV-17.
Exhibit IV-17. Base industry jobs assumptions
Source: BBC Research and Consulting, 2006.
BBC RESEARCH & CONSULTING SECTION IV, PAGE 17
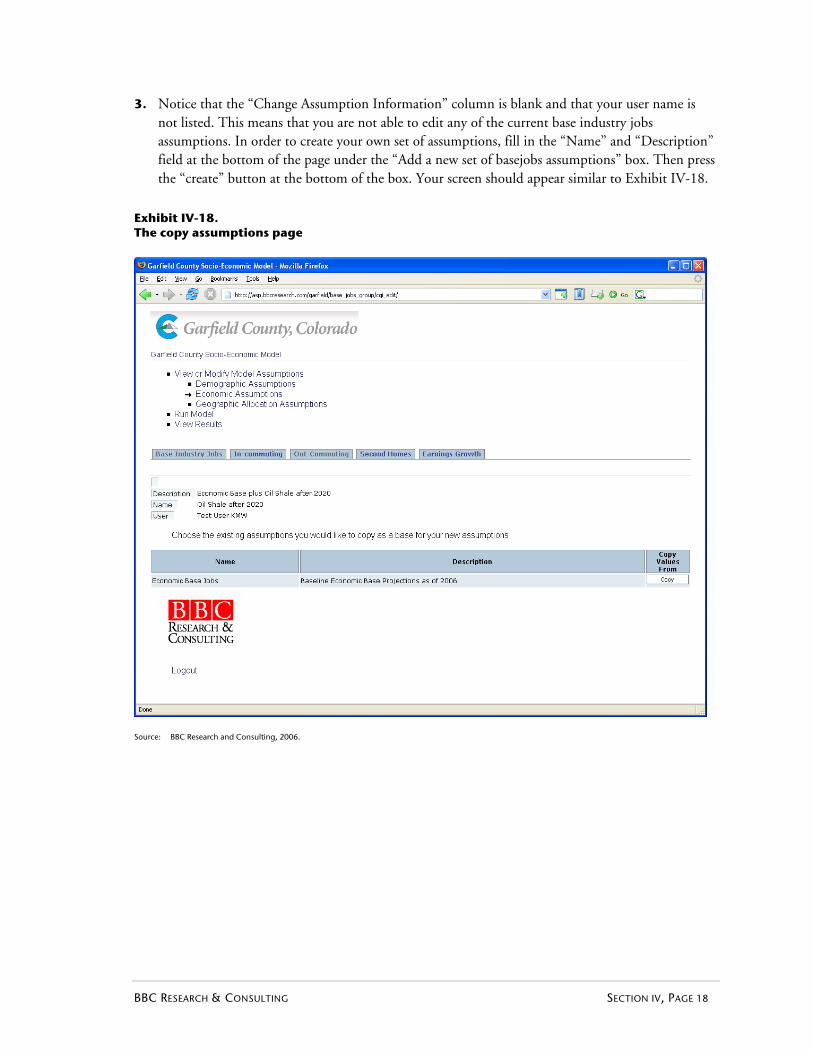
3. Notice that the “Change Assumption Information” column is blank and that your user name is not listed. This means that you are not able to edit any of the current base industry jobs assumptions. In order to create your own set of assumptions, fill in the “Name” and “Description” field at the bottom of the page under the “Add a new set of basejobs assumptions” box. Then press the “create” button at the bottom of the box. Your screen should appear similar to Exhibit IV-18.
Exhibit IV-18. The copy assumptions page
Source: BBC Research and Consulting, 2006.
BBC RESEARCH & CONSULTING SECTION IV, PAGE 18

4. The model then prompts you to select the current set of assumptions that will provide the base for your new assumptions. In this case, select the “Economic Base Jobs” by pressing the “Copy” button on the first row. After pressing the button, your screen will look similar to Exhibit IV-19. In addition, the values for each base industry and year will be identical to the initial values for the “Economic Base Jobs.”
Exhibit IV-19. After a successful copy
Source: BBC Research and Consulting, 2006.
BBC RESEARCH & CONSULTING SECTION IV, PAGE 19
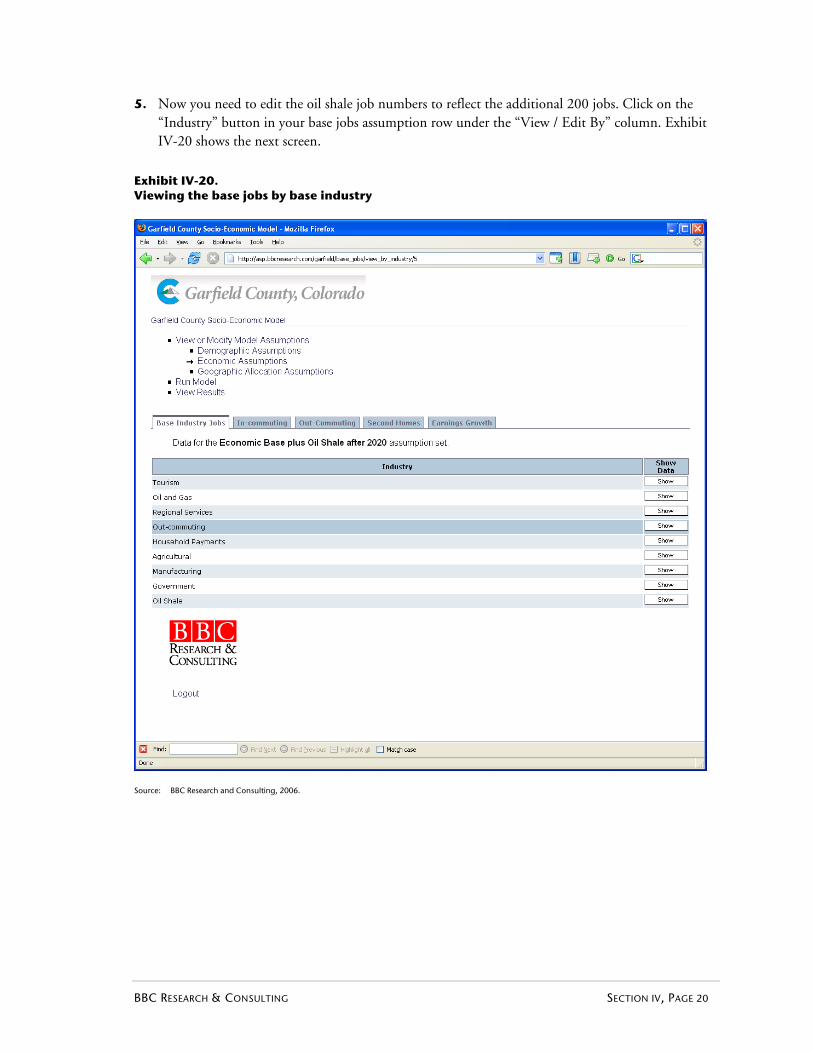
5. Now you need to edit the oil shale job numbers to reflect the additional 200 jobs. Click on the “Industry” button in your base jobs assumption row under the “View / Edit By” column. Exhibit IV-20 shows the next screen.
Exhibit IV-20. Viewing the base jobs by base industry
Source: BBC Research and Consulting, 2006.
BBC RESEARCH & CONSULTING SECTION IV, PAGE 20
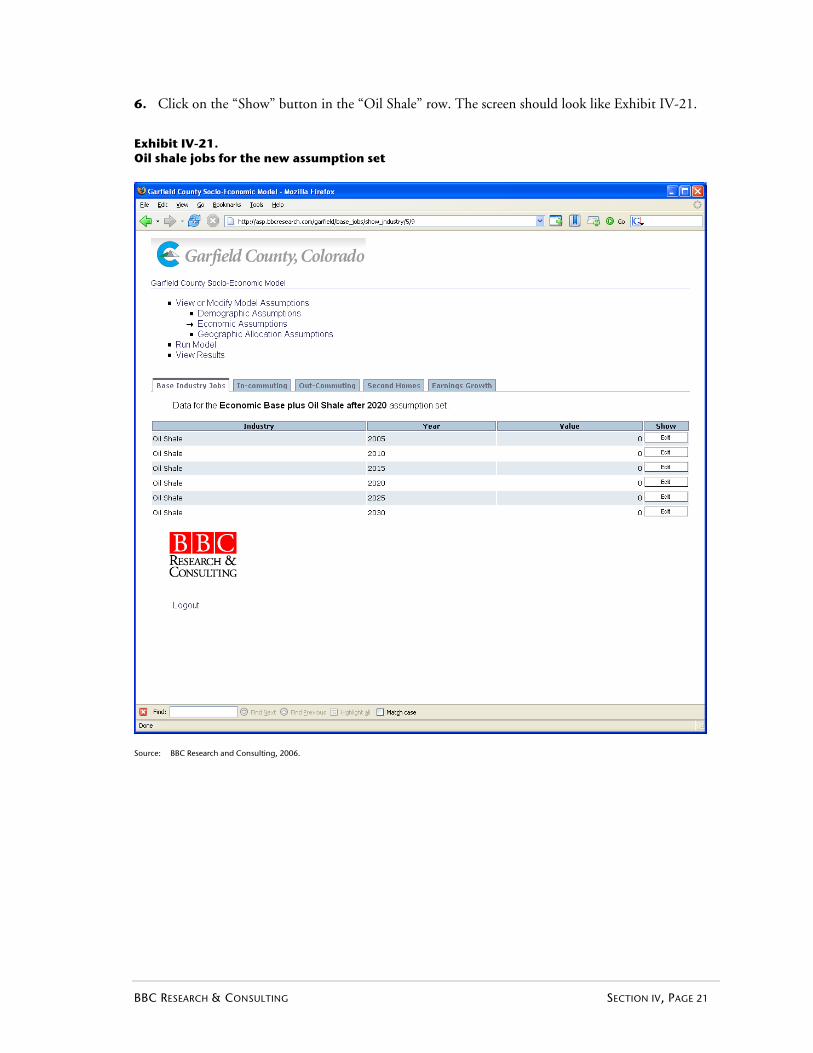
6. Click on the “Show” button in the “Oil Shale” row. The screen should look like Exhibit IV-21.
Exhibit IV-21. Oil shale jobs for the new assumption set
Source: BBC Research and Consulting, 2006.
BBC RESEARCH & CONSULTING SECTION IV, PAGE 21

7. Click on the “Edit” button for the year 2020. The screen should appear as in Exhibit IV-22.
Exhibit IV-22. Editing the 2020 oil shale jobs for the new assumption set
Source: BBC Research and Consulting, 2006.
BBC RESEARCH & CONSULTING SECTION IV, PAGE 22

8. Enter 200 in the Value box and click on the “Save Changes” button. This will take you to a screen similar to the one shown in Exhibit IV-23.
Exhibit IV-23. After editing the 2020 oil shale jobs for the new assumption set
Source: BBC Research and Consulting, 2006.
BBC RESEARCH & CONSULTING SECTION IV, PAGE 23
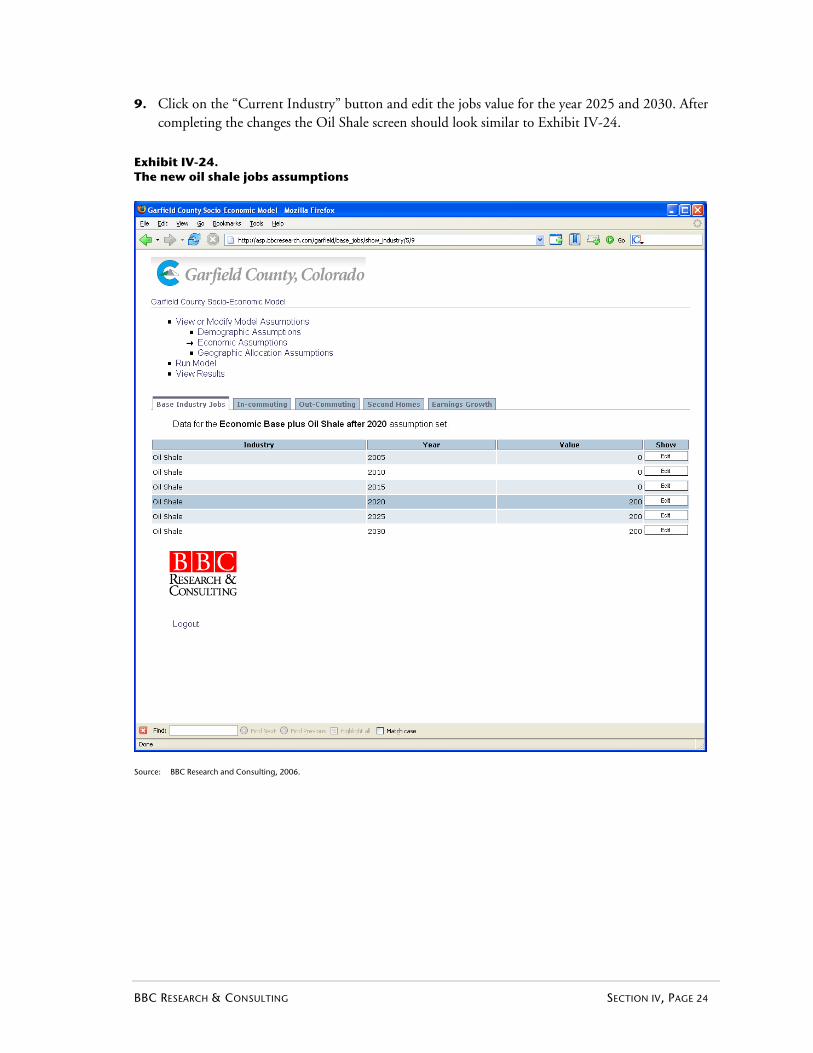
9. Click on the “Current Industry” button and edit the jobs value for the year 2025 and 2030. After completing the changes the Oil Shale screen should look similar to Exhibit IV-24.
Exhibit IV-24. The new oil shale jobs assumptions
Source: BBC Research and Consulting, 2006.
BBC RESEARCH & CONSULTING SECTION IV, PAGE 24

10. Return to the “Base Industry Jobs” page by clicking on the “Base Industry Jobs” tab. This view is shown in Exhibit IV-25.
Exhibit IV-25. The “Base industry jobs” page
Source: BBC Research and Consulting, 2006.
BBC RESEARCH & CONSULTING SECTION IV, PAGE 25

11. If you would like to change the name or description of the assumption set, click on the “Edit” button. The edit screen appears in Exhibit IV-26.
Exhibit IV-26. Editing the name of the new assumption set
Source: BBC Research and Consulting, 2006.
12. Make the changes you want and then press the “edit” button.
Using a similar procedure, users can create other economic, demographic or geographic allocation assumptions. Users may create new assumptions for any of the categories required to create a scenario (see Exhibit IV-7 on page IV-7). After creating a new set of assumptions, users can build new scenarios based on the steps listed on pages IV-6 through IV-15.
BBC RESEARCH & CONSULTING SECTION IV, PAGE 26
SECTION V. Garfield Socio-Economic Model Technical Documentation

SECTION V. Garfield Socio-Economic Model Technical Documentation
The Garfield County Socio-Economic Model combines several standard economic and demographic modeling techniques into an integrated, web-based application. Major components of the model include:
A labor demand module that converts assumptions about future economic base jobs and future commuting activity into projections of overall county employment;
An out-commuting module that calculates the effect on Garfield County’s economy and population from out-commuting to jobs in neighboring counties;
A cohort-component demographic model of the overall county population;
A modified gravity model used to allocate population changes to Garfield County municipalities and surrounding areas; and
Allocation modules that project future enrollments of Garfield County school districts and the size of the Limited English Proficient population throughout the county.
The structure of the model is depicted in the flow chart on the following page. The labor demand module is shown in red, the out-commuting module is shown in gray and the demographic and population allocation modules are shown in blue.
BBC RESEARCH & CONSULTING SECTION V, PAGE 1
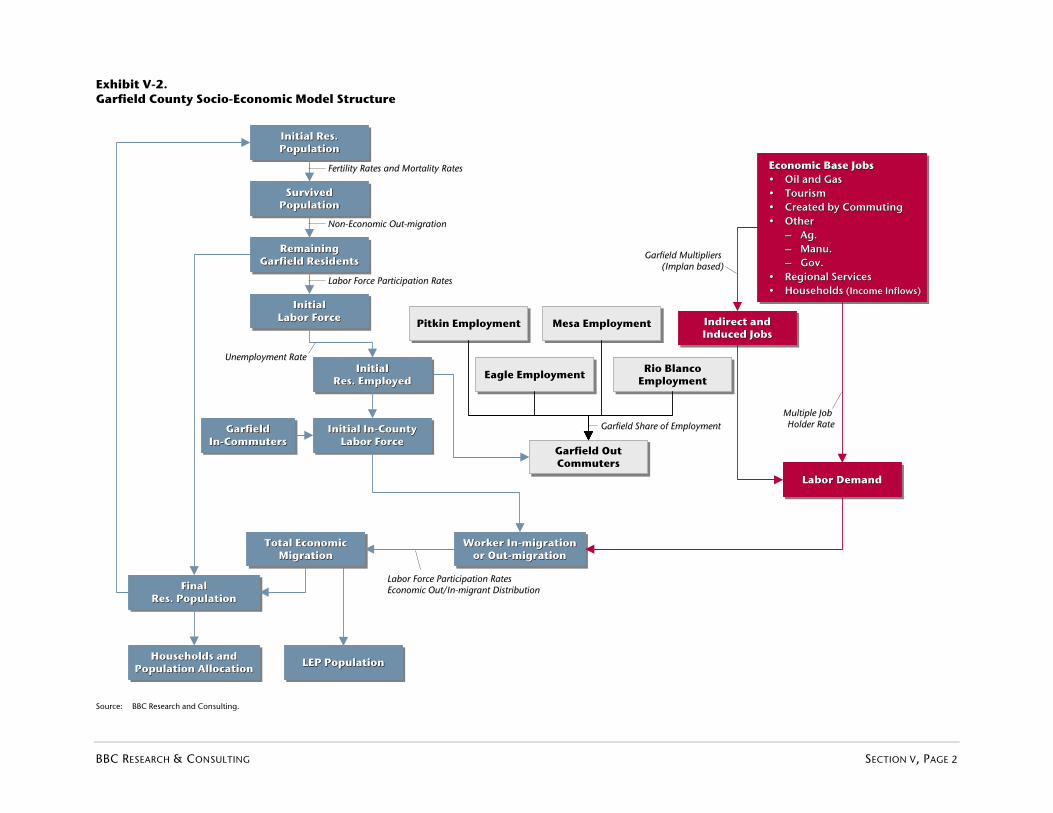
Exhibit V-2. Garfield County Socio-Economic Model Structure
Initial Res. PopulationInitial Res. Initial Res. PopulationPopulation
Survived PopulationSurvived Survived
PopulationPopulation
Fertility Rates and Mortality RatesFertility Rates and Mortality Rates
Initial Labor Force
Initial Initial Labor ForceLabor Force
Labor Force Participation RatesLabor Force Participation Rates
Initial Res. Employed
Initial Initial Res. EmployedRes. Employed
Unemployment RateUnemployment Rate
Initial In-County Labor Force
Initial InInitial In--County County Labor ForceLabor Force
Pitkin EmploymentPitkin EmploymentPitkin Employment
Eagle EmploymentEagle EmploymentEagle Employment
Mesa EmploymentMesa EmploymentMesa Employment
Garfield Out Commuters
Garfield Out Garfield Out CommutersCommuters
Economic Base Jobs• Oil and Gas• Tourism• Created by Commuting• Other
– Ag.– Manu.– Gov.
• Regional Services• Households (Income Inflows)
Economic Base JobsEconomic Base Jobs•• Oil and GasOil and Gas•• TourismTourism•• Created by CommutingCreated by Commuting•• OtherOther
–– Ag.Ag.–– Manu.Manu.–– Gov.Gov.
•• Regional ServicesRegional Services•• HouseholdsHouseholds (Income Inflows)(Income Inflows)
Indirect andInduced JobsIndirect andIndirect andInduced JobsInduced Jobs
Garfield Multipliers Garfield Multipliers ((Implan Implan based)based)
Labor DemandLabor DemandLabor Demand
Worker In-migration or Out-migration
Worker InWorker In--migration migration or Outor Out--migrationmigration
Total EconomicMigration
Total EconomicTotal EconomicMigrationMigration
Labor Force Participation RatesLabor Force Participation RatesEconomic Out/InEconomic Out/In--migrant Distributionmigrant Distribution
Remaining Garfield Residents
Remaining Remaining Garfield ResidentsGarfield Residents
NonNon--Economic OutEconomic Out--migrationmigration
Final Res. Population
Final Final Res. PopulationRes. Population
Garfield In-Commuters
Garfield Garfield InIn--CommutersCommuters
LEP PopulationLEP PopulationLEP PopulationHouseholds and Population Allocation
Households and Households and Population AllocationPopulation Allocation
Rio Blanco EmploymentRio Blanco Rio Blanco
EmploymentEmployment
Garfield Share of EmploymentGarfield Share of EmploymentMultiple Job Multiple Job Holder RateHolder Rate
Source: BBC Research and Consulting.
BBC RESEARCH & CONSULTING SECTION V, PAGE 2

The remainder of this section describes key terms and assumptions used in the Garfield Socio-Economic Model. Many assumptions, where noted, are user adjustable to allow model users to develop alternative scenarios and run “what if” simulations. Other assumptions that are less likely to be modified by users are built into the model. These built-in assumptions can, however, be modified in the future by BBC if needed.
Economic Assumptions
Base jobs (user adjustable). Among the most important assumptions in the Socio-Economic model, and in any future county economic and demographic scenario, are the assumptions regarding the growth of economic base jobs. Basic economic activity, sometimes referred to as “primary jobs,” refers to activities that bring money into the county’s economy from sales to consumers or businesses outside the county or local sales to visitors from other areas. Other components included as part of the Garfield County economic base include “external household funding” and the earnings that Garfield County out-commuters earn from jobs in other counties. External household funding refers to external sources of funds spent in Garfield County, such as wealth spent by second homeowners, transfer payments from the federal government and retirement income.
The Garfield Socio-Economic Model includes nine economic base activities:
Tourism;
Regional services;
Gas;
Oil shale;
Government1;
Agriculture and agricultural services;
Manufacturing;
Net Out-commuting; and
External household funding.
The definitions of many of these economic base sectors, and the estimates of current activity levels in those sectors, were drawn from several sources including previous work by the Colorado Demography Section (State Demographer) and Center for Business and Economic Forecasting, data files from the IMPLAN model, data from the Bureau of Economic Analysis and work with representatives of the natural gas industry in Garfield County.2
1 Only a portion of government jobs, primarily state and federal jobs, is considered part of the economic base. Most local
government jobs are considered part of local services and are determined largely by local population levels. 2 Information used in defining and quantifying the 2005 economic base included the 2003 Jobs and Income Summary by
Base Industry Group developed by the State Demographer as part of their Local Economic Information and Forecasting Assistance efforts, the 2001 Tourism Jobs Gain Ground in Colorado study by the Center for Business and Economic Forecasting, Inc., estimated 2005 jobs by detailed industry sector from the IMPLAN data file for Garfield County developed by Minnesota IMPLAN Group, estimated 2003 transfer payments and retirement income of Garfield County residents from the Bureau of Economic Analysis Regional Economic Information System and input from energy firms active in Garfield County including EnCana, Williams and Occidental.
BBC RESEARCH & CONSULTING SECTION V, PAGE 3
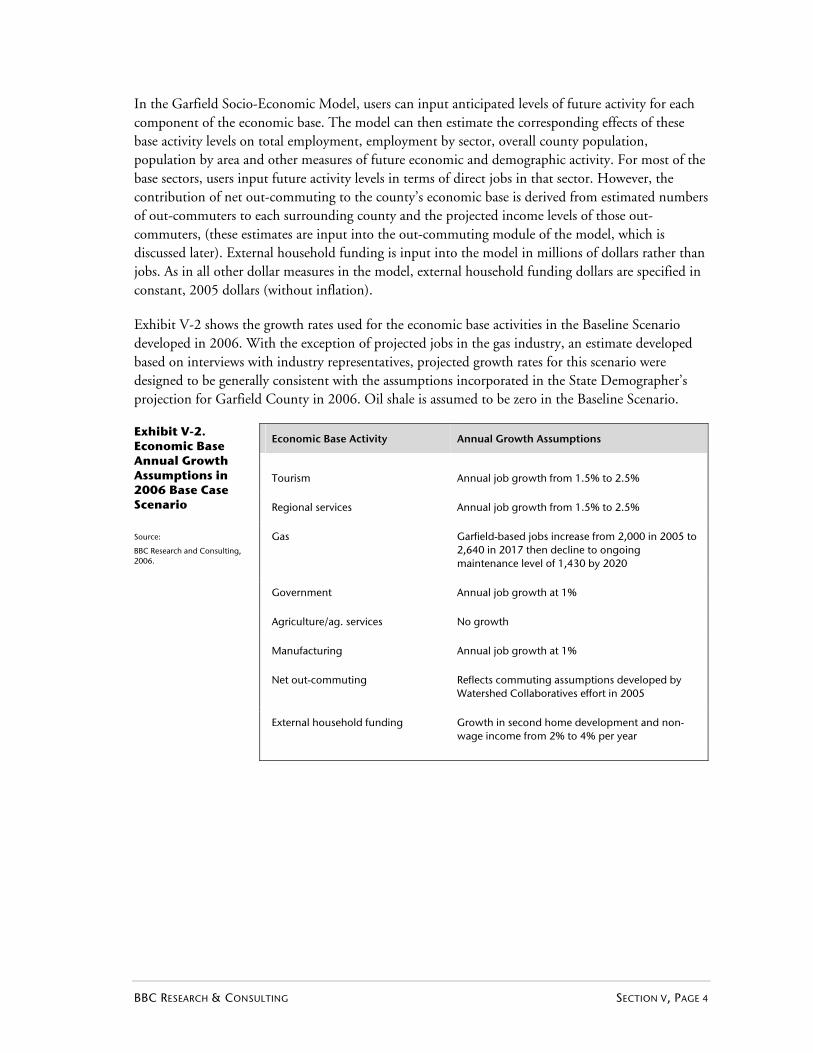
In the Garfield Socio-Economic Model, users can input anticipated levels of future activity for each component of the economic base. The model can then estimate the corresponding effects of these base activity levels on total employment, employment by sector, overall county population, population by area and other measures of future economic and demographic activity. For most of the base sectors, users input future activity levels in terms of direct jobs in that sector. However, the contribution of net out-commuting to the county’s economic base is derived from estimated numbers of out-commuters to each surrounding county and the projected income levels of those out-commuters, (these estimates are input into the out-commuting module of the model, which is discussed later). External household funding is input into the model in millions of dollars rather than jobs. As in all other dollar measures in the model, external household funding dollars are specified in constant, 2005 dollars (without inflation).
Exhibit V-2 shows the growth rates used for the economic base activities in the Baseline Scenario developed in 2006. With the exception of projected jobs in the gas industry, an estimate developed based on interviews with industry representatives, projected growth rates for this scenario were designed to be generally consistent with the assumptions incorporated in the State Demographer’s projection for Garfield County in 2006. Oil shale is assumed to be zero in the Baseline Scenario.
Economic Base Activity Annual Growth Assumptions
Tourism Annual job growth from 1.5% to 2.5%
Regional services Annual job growth from 1.5% to 2.5%
Gas Garfield-based jobs increase from 2,000 in 2005 to 2,640 in 2017 then decline to ongoing maintenance level of 1,430 by 2020
Government Annual job growth at 1%
Agriculture/ag. services No growth
Manufacturing Annual job growth at 1%
Net out-commuting Reflects commuting assumptions developed by Watershed Collaboratives effort in 2005
External household funding Growth in second home development and non-wage income from 2% to 4% per year
Exhibit V-2. Economic Base Annual Growth Assumptions in 2006 Base Case Scenario
Source:
BBC Research and Consulting, 2006.
BBC RESEARCH & CONSULTING SECTION V, PAGE 4
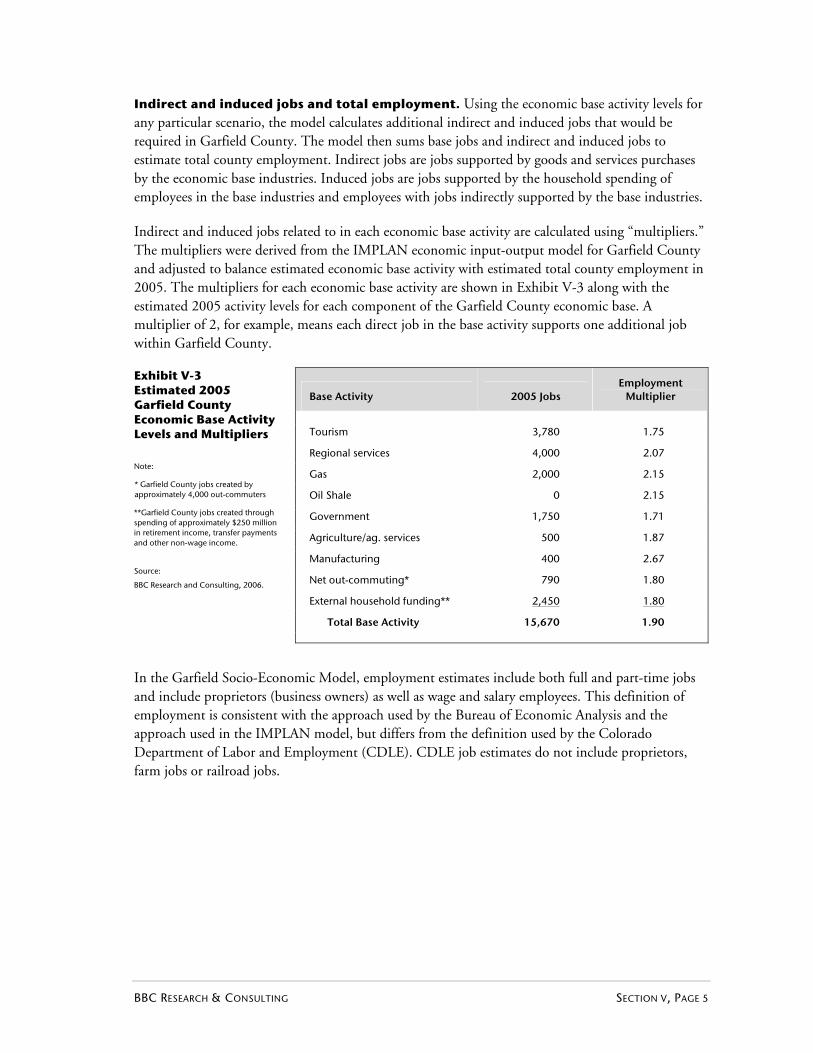
Indirect and induced jobs and total employment. Using the economic base activity levels for any particular scenario, the model calculates additional indirect and induced jobs that would be required in Garfield County. The model then sums base jobs and indirect and induced jobs to estimate total county employment. Indirect jobs are jobs supported by goods and services purchases by the economic base industries. Induced jobs are jobs supported by the household spending of employees in the base industries and employees with jobs indirectly supported by the base industries.
Indirect and induced jobs related to in each economic base activity are calculated using “multipliers.” The multipliers were derived from the IMPLAN economic input-output model for Garfield County and adjusted to balance estimated economic base activity with estimated total county employment in 2005. The multipliers for each economic base activity are shown in Exhibit V-3 along with the estimated 2005 activity levels for each component of the Garfield County economic base. A multiplier of 2, for example, means each direct job in the base activity supports one additional job within Garfield County.
Base Activity 2005 Jobs Employment
Multiplier
Tourism 3,780 1.75
Regional services 4,000 2.07
Gas 2,000 2.15
Oil Shale 0 2.15
Government 1,750 1.71
Agriculture/ag. services 500 1.87
Manufacturing 400 2.67
Net out-commuting* 790 1.80
External household funding** 2,450 1.80
Total Base Activity 15,670 1.90
Exhibit V-3 Estimated 2005 Garfield County Economic Base Activity Levels and Multipliers
Note:
* Garfield County jobs created by approximately 4,000 out-commuters
**Garfield County jobs created through spending of approximately $250 million in retirement income, transfer payments and other non-wage income.
Source:
BBC Research and Consulting, 2006.
In the Garfield Socio-Economic Model, employment estimates include both full and part-time jobs and include proprietors (business owners) as well as wage and salary employees. This definition of employment is consistent with the approach used by the Bureau of Economic Analysis and the approach used in the IMPLAN model, but differs from the definition used by the Colorado Department of Labor and Employment (CDLE). CDLE job estimates do not include proprietors, farm jobs or railroad jobs.
BBC RESEARCH & CONSULTING SECTION V, PAGE 5

Jobs by sector, employee earnings and economic output. As well as producing estimates of total employment in Garfield County, the model also projects jobs for each of nine major industry classifications (as defined in the North American Industry Classification System developed by the Office of Management and Budget). These classifications include:
Agriculture and agricultural services;
Mining, utilities and construction;
Manufacturing;
Trade;
Professional and support services;
Education and health care;
Entertainment and food service;
Other services; and
Government and non-profits.
The model also projects earnings by Garfield County workers and economic output by Garfield County businesses. These estimates are based on projected employment by sector; current (2005) earnings and output per employee in each sector; and projected growth in employee earnings and output per employee in the future (excluding inflation).3
Second homes (user adjustable). The model includes the contribution to the Garfield County economy based on the number of second homes in the county. BBC estimated there were approximately 600 second homes in 2005 based on data from the 2000 Census. Based on previous research sponsored by the Colorado Department of Local Affairs, BBC assumed that second-home households have an average income of $150,000 and spend approximately 50 percent of that income in Garfield County. In the Base Case Scenario, BBC assumed two to four percent annual growth rates in the number of second homes over the study period, resulting in a Baseline Scenario projection of about 1,500 second homes by 2030.
Commuting Assumptions
Garfield County is part of a broader, regional economy that ranges from tourism and resort-related activity in Eagle and Pitkin Counties to energy and other economic activities in Mesa and Rio Blanco counties. In part, these regional relationships are captured in the regional services component of the Garfield County economic base (identified previously). Daily commuting by Garfield residents to jobs in other counties, and commuting by residents of other counties to jobs in Garfield County, are also important aspects of this regional relationship.
3 Earnings and output per employee by sector are developed from the IMPLAN model. Future earnings and output per
employee are assumed to grow by 0.75 percent per year (excluding inflation). This growth rate reflects a middle course between the experience of the past 25 years in Colorado (1.1 percent average annual real growth in employee earnings) and Garfield County (0.5 percent average annual real growth in employee earnings).
BBC RESEARCH & CONSULTING SECTION V, PAGE 6

Out-commuting assumptions (user adjustable). A series of user adjustable inputs are designed to capture the effect of out-commuting on Garfield County’s economy and population. The number of out-commuters to each neighboring Colorado county (Eagle, Pitkin, Mesa and Rio Blanco) is determined based on user input assumptions on the number of jobs in those counties in future years and the percentage of those jobs filled by Garfield County residents. The State Demographer produces annually updated employment forecasts which could be used to update the job projections for neighboring counties. The earnings per commuter are also a user-adjustable assumption and can be varied by county.
Baseline Scenario. In the Base Case Scenario, projected out-commuting to Eagle and Pitkin Counties is based on projections developed by the Watershed Collaboratives Growth Scenarios Project in their Fall 2005 study: Demographic Forecasts: Eagle, Garfield and Pitkin Counties 2005-2030 Interim Report. These projections reflect the results of a collaborative effort among the planners in all three counties and are currently incorporated in the county population projections produced by the State Demographer. The Watershed Collaboratives commuting projections anticipate a substantial increase in out-commuting from Garfield County to both Eagle and Pitkin Counties in response to strong projected employment growth and lack of available and affordable workforce housing in those counties. Under the Watershed Collaboratives based commuting scenario, the number of Garfield County residents commuting to Eagle and Pitkin Counties will increase from approximately 6,700 in 2005 to over 35,000 by 2030, as shown in Exhibit V-4.
Exhibit V-4. Base Case Scenario Out-commuting Projections, 2005-2030
Pitkin County
Total Jobs 17,693 20,789 23,684 26,667 29,298 31,579
Commuters (In) 7,593 10,587 13,035 15,381 17,358 18,966
Percent from Garfield 80 % 85 % 90 % 90 % 90 % 90 %
Amount from Garfield 6,074 8,999 11,732 13,843 15,622 17,069
Eagle County
Total Jobs 27,548 38,113 45,940 54,184 61,963 69,434
Commuters (In) 1,000 8,312 13,352 18,912 24,214 29,161
Percent from Garfield 63 % 63 % 63 % 63 % 63 % 63 %
Amount from Garfield 630 5,237 8,412 11,915 15,255 18,371
Total Pitkin & Eagle 6,704 14,236 20,143 25,757 30,877 35,441Commuters from Garfield
2030201520102005 20252020
Source: Watershed Collaboratives Growth Scenarios Project. Demographic Forecasts: Eagle, Garfield and Pitkin Counties 2005-2030 Interim Report. (2005).
The large increase in out-commuting projected by the Watershed Collaboratives project is a very important factor in the Baseline Scenario projections of future economic activity and population growth in Garfield County. Although these projections represent the consensus view of the planners in each of the three counties in 2005, the extent of the increase in out-commuting from Garfield County in the future is, of course, uncertain. Moreover, even as of late 2006, strong job opportunities within Garfield County were already raising wages and housing prices. Robust growth in employment opportunities within the county might tend to reduce the number of Garfield residents willing to commute to jobs in other counties further from home.
BBC RESEARCH & CONSULTING SECTION V, PAGE 7

Reduced out-commuting scenario. In light of uncertainties surrounding future out-commuting, two further out-commuting scenarios were developed. The first alternative scenario is termed simply the Alternative Commuting Scenario. The Watershed Collaboratives commuting assumptions anticipate that the share of Pitkin County jobs filled by Garfield County residents will increase from about 34 percent in 2005 to 54 percent by 2030, while the share of Eagle County jobs filled by Garfield County residents will increase from 2 percent in 2005 to 26 percent by 2030. Under the Alternative Commuting Scenario, the share of jobs in Eagle and Pitkin Counties held by Garfield County residents was projected to grow, but only at half the rate implied by the Watershed Collaborative scenario—reaching 44 percent of Pitkin County jobs and 14 percent of Eagle County jobs by 2030. Consequently, total out-commuting to these two neighboring counties is projected to reach about 24,000 people by 2030 under the r Alternative Commuting Scenario (versus over 35,000 under the Baseline Scenario).
Rio Blanco boom scenario. Neither the Baseline Scenario, nor the Alternative Commuting Scenario, anticipates significant out-commuting to areas other than Eagle and Pitkin Counties. However, it appears increasingly likely that there may be a substantial increase in energy related jobs in Rio Blanco County during the forecast period. Development of natural gas wells is beginning in Rio Blanco County and within next couple of decades natural gas development in Rio Blanco County is expected to reach a scale similar to the current experience in Garfield County. Oil shale pilot projects, administered by the Bureau of Land Management (BLM), are also anticipated in Rio Blanco County. The Rio Blanco boom scenario assumes that about 50 percent of the workforce for oil shale test projects and natural gas development in Rio Blanco County will reside in Garfield County, primarily in or near Rifle. Under this scenario, out-commuting from Garfield County to Rio Blanco County would reach about 1,000 commuters by 2017 and exceed 2,500 out-commuters by 2029.
In-commuting assumptions. At the time of the 2000 Census, about 2,000 people commuted from residences outside of Garfield County to jobs located within the county. In-commuters were about equally divided between residents of Eagle, Mesa and Pitkin Counties. BBC has assumed about 8 percent of the future Garfield County workforce will continue to commute into the county from residences in other counties.
Demographic Assumptions
The combination of economic and commuting assumptions that are input into the model for any scenario determine the demand for workers in Garfield County. The supply of workers, along with the overall size and composition of the county population, is determined in the model’s demographic module. The model separates the current population of the county, and the future population throughout the forecast period, into demographic cohorts. Cohorts describe the county population in terms of five-year age range groupings by gender, such as five through nine-year-old females.
Labor force participation rates (user adjustable). Labor force participation rates describe the percentage of the population in each cohort that is either employed or unemployed but actively seeking work. BBC used county-specific labor force participation rates obtained from the State Demographer and used in the Demographer’s cohort-component population model. The first cohort relevant to determining the size of the labor force contains ages 15 through 19. BBC calculated a revised labor force participation rate for the two 15-19 cohorts included in the model by assuming the labor force participation rate for 15 year-olds was zero.
BBC RESEARCH & CONSULTING SECTION V, PAGE 8
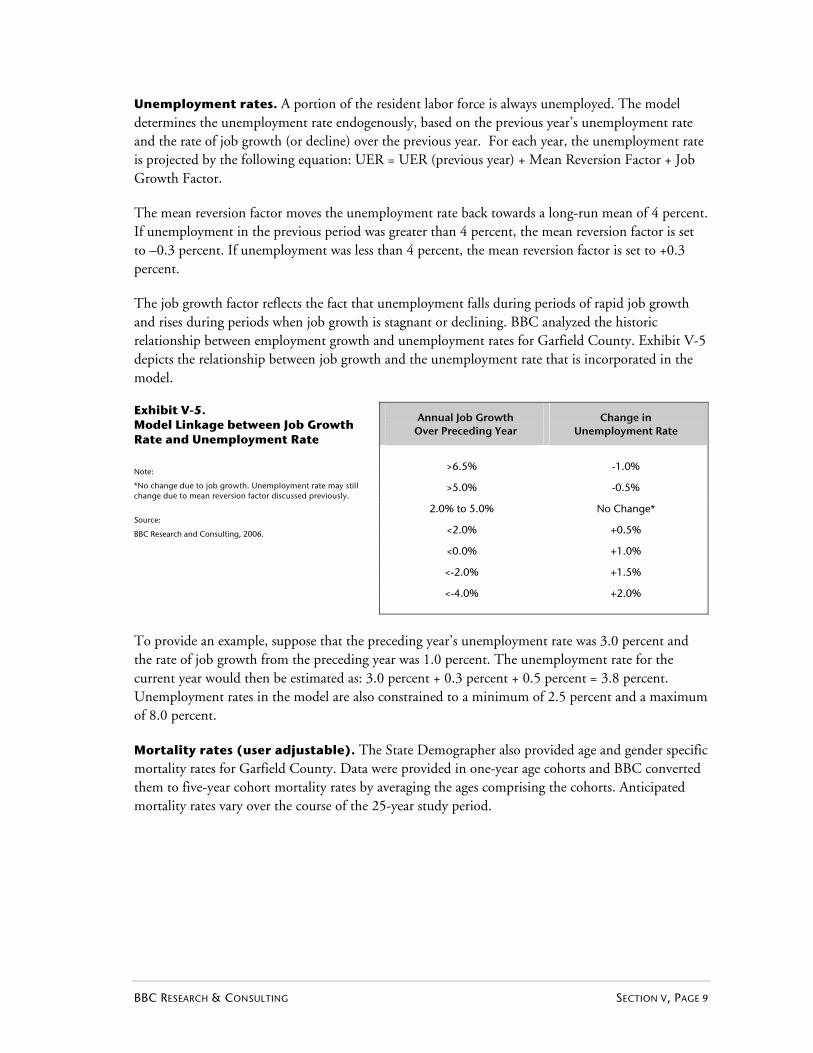
Unemployment rates. A portion of the resident labor force is always unemployed. The model determines the unemployment rate endogenously, based on the previous year’s unemployment rate and the rate of job growth (or decline) over the previous year. For each year, the unemployment rate is projected by the following equation: UER = UER (previous year) + Mean Reversion Factor + Job Growth Factor.
The mean reversion factor moves the unemployment rate back towards a long-run mean of 4 percent. If unemployment in the previous period was greater than 4 percent, the mean reversion factor is set to –0.3 percent. If unemployment was less than 4 percent, the mean reversion factor is set to +0.3 percent.
The job growth factor reflects the fact that unemployment falls during periods of rapid job growth and rises during periods when job growth is stagnant or declining. BBC analyzed the historic relationship between employment growth and unemployment rates for Garfield County. Exhibit V-5 depicts the relationship between job growth and the unemployment rate that is incorporated in the model.
Annual Job Growth Over Preceding Year
Change in Unemployment Rate
>6.5% -1.0%
>5.0% -0.5%
2.0% to 5.0% No Change*
<2.0% +0.5%
<0.0% +1.0%
<-2.0% +1.5%
<-4.0% +2.0%
Exhibit V-5. Model Linkage between Job Growth Rate and Unemployment Rate
Note:
*No change due to job growth. Unemployment rate may still change due to mean reversion factor discussed previously.
Source:
BBC Research and Consulting, 2006.
To provide an example, suppose that the preceding year’s unemployment rate was 3.0 percent and the rate of job growth from the preceding year was 1.0 percent. The unemployment rate for the current year would then be estimated as: 3.0 percent + 0.3 percent + 0.5 percent = 3.8 percent. Unemployment rates in the model are also constrained to a minimum of 2.5 percent and a maximum of 8.0 percent.
Mortality rates (user adjustable). The State Demographer also provided age and gender specific mortality rates for Garfield County. Data were provided in one-year age cohorts and BBC converted them to five-year cohort mortality rates by averaging the ages comprising the cohorts. Anticipated mortality rates vary over the course of the 25-year study period.
BBC RESEARCH & CONSULTING SECTION V, PAGE 9

Fertility rates (user adjustable). The State Demographer also provided fertility rates for the model. The rates remain constant throughout the study period. In addition, the fertility rates from the State Demographer included 14-year-old females in the 14 through 19 cohort while the Garfield Socio-Economic Model includes 14 year olds in the 10 through 14 cohort. The fertility rate for 10-14 year-old females was placed at about 1.7 births per 1000. BBC calculated this number to give approximately three births per year in this cohort given the 2006 population. The Colorado Department of Public Health and Environment (CDPHE) reported fewer than three births per year for this cohort from 1990 through 2004.
Cohort graduation and retention. For purposes of graduation (moving part of a cohort to the next older cohort each year) and retention (the number retained in a given cohort each year), the model uses the cumulative survival rate of each age within a given cohort (based on the mortality rates discussed previously). This results in fewer members of each cohort moving to the next cohort each year.
Birth allocation by sex. The Garfield Socio-Economic Model allocates 51.2 percent of births as male and 48.8 percent as female. This is approximately equal to the under-20 male-to-female ratio reported by the U.S. Census in 2000 (105 males for every 100 females, or 51.2 percent male). Data from the CDPHE show a 51.3 percent average of male births for Garfield County from 1990 through 2004.
Economic migration distribution (user adjustable). The Garfield Socio-Economic Model calculates economic migration based on the assumed Garfield County labor force participation rates by cohort and an age-cohort distribution of in-migrants provided by the State Demographer. Essentially, the model migrates enough people into (or out of) the county to balance labor supply and labor demand in each year. The total economic migrants for each year are determined based on the number of workers per 100 economic migrants (the product of the age-cohort distribution of in-migrants and the labor force participation rates used in the scenario) and the unfulfilled labor demand. The annual economic migrants are then distributed among the age cohorts using the in-migrant distribution.
Youth out-migration rate (user adjustable). Youth out-migration rates are included in the model for the 15-19, 20-24 and 25-29 year-old cohorts. These out-migration rates recognize that a portion of the younger population of the county typically moves away to attend school or seek different economic or lifestyle opportunities in other areas. The current youth out-migration rate is an average of the Census out-migration data for 1995-2000 and the Colorado Demography Section’s migration data. The Census data was the average annual rate of out-migration for each cohort, calculated from the total out-migration by cohort for the five-year period 1995-2000. The Colorado Demography Section’s data was provided for one-year cohorts. BBC converted this to five-year cohorts by averaging the one-year values.
Elderly out-migration (user adjustable). Elderly out-migration for the model is included for the 65-69, 70-74, 75-79, 80-84, 85-89 and 90+ year-old cohorts. The data was drawn from the US Census out-migration data for 1995-2000. The Census data was the average annual rate of out-migration for each cohort, calculated from the total out-migration by cohort for the five-year period 1995-2000. For the purposes of the Garfield Socio-Economic Model, BBC used the Census 85+ year-old cohort rate for the 85-89 and 90+ year-old cohorts.
BBC RESEARCH & CONSULTING SECTION V, PAGE 10

Householder rates (user adjustable). Householder rates indicate the proportion of individuals in a given cohort (e.g., females age 30-34) that are the heads of their own households. Rates for the model were calculated from 2000 U.S. Census PUMS data for PUMA 00101 (PUMA 00101 includes all of Garfield, Rio Blanco, Moffat, Routt, and Jackson counties in addition to the western portion of Larimer County and the northern portion of Mesa County).
Limited English Proficient population (user adjustable). The Garfield Socio-Economic Model estimates the number of county residents that have limited proficiency in the English language (LEP). The number of LEP county residents in 2005 was estimated based on the number of Garfield County residents that identified themselves as speaking English less than “very well” during the 2000 Census. The number of LEP residents in each succeeding year throughout the projection period is determined based on the LEP population in the previous year (net of an assumed decay rate of five percent per year) and the number of new LEP in-migrants based on economic opportunities. The decay rate reflects a combination of gradual English acquisition by long-time LEP residents and mobility and mortality among the LEP population.
To identify the number of LEP residents moving to the county in response to economic opportunities, BBC analyzed the 2000 Census Public Use Microdata Sample (PUMS) for western Colorado to estimate the proportion of new jobs, by sector, that were filled by LEP individuals between 1995 and 2000. Estimated LEP proportions of new employment between 1995 and 2000 ranged from over 40 percent in sectors such as agriculture, mining, construction, food services and accommodations to less than 20 percent in education and health care services. LEP individuals filled less than 10 percent of jobs in the government sector.
Apart from changing economic opportunities, the size of the future Garfield County LEP population may also be influenced by changes in federal immigration policy or changes in state policies. The Garfield Socio-Economic Model includes a “Limited English Proficiency Policy Factor” that allows users to increase or decrease the estimated flow of new LEP residents in response to economic opportunities. The baseline value of the policy factor is 1.00 for all years, reflecting a continuation of immigration conditions consistent with the 1995 through 2000 period. For example, if a user believed that new federal policies would cut immigration by 50 percent, the policy factor could be set to 0.50 to simulate this effect and produce modified scenario results.
Geographic Allocation
Along with forecasts of the overall county population, the Garfield Socio-Economic Model also breaks down the projected population into 12 sub-county areas. The 12 study areas correspond to the six incorporated cities in Garfield County and the unincorporated portions of the county closest to each of the six cities. The study areas are illustrated in Exhibit V-6.
BBC RESEARCH & CONSULTING SECTION V, PAGE 11

Exhibit V-6. Garfield County Sub-areas
Source: BBC Research and Consulting.
The model also produces estimates of the school age population and enrollment in each of the three Garfield County school districts. The remainder of this section provides further information on the methods and assumptions used to develop the sub-county population projections.
Methodology for allocating population growth to study areas. In the Garfield Socio-Economic Model, the amount of population growth that occurs in each of the cities and in the unincorporated study areas is based on:
Amount of overall growth in the county’s population;
Location of the growth pressure;
Relative “attraction coefficients” for each city and study area that vary based on the locations of the growth pressure; and
Population capacity of each area and how close the area is to its capacity.
BBC RESEARCH & CONSULTING SECTION V, PAGE 12
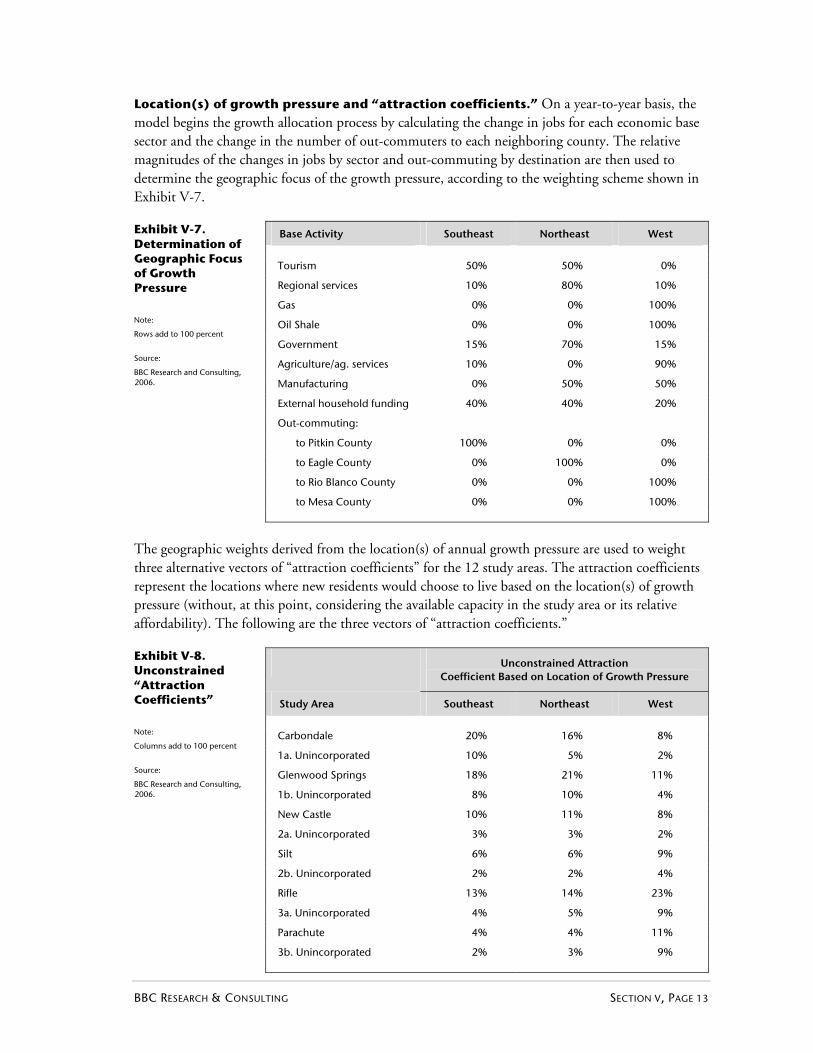
Location(s) of growth pressure and “attraction coefficients.” On a year-to-year basis, the model begins the growth allocation process by calculating the change in jobs for each economic base sector and the change in the number of out-commuters to each neighboring county. The relative magnitudes of the changes in jobs by sector and out-commuting by destination are then used to determine the geographic focus of the growth pressure, according to the weighting scheme shown in Exhibit V-7.
Base Activity Southeast Northeast West
Tourism 50% 50% 0%
Regional services 10% 80% 10%
Gas 0% 0% 100%
Oil Shale 0% 0% 100%
Government 15% 70% 15%
Agriculture/ag. services 10% 0% 90%
Manufacturing 0% 50% 50%
External household funding 40% 40% 20%
Out-commuting:
to Pitkin County 100% 0% 0%
to Eagle County 0% 100% 0%
to Rio Blanco County 0% 0% 100%
to Mesa County 0% 0% 100%
Exhibit V-7. Determination of Geographic Focus of Growth Pressure
Note:
Rows add to 100 percent
Source:
BBC Research and Consulting, 2006.
The geographic weights derived from the location(s) of annual growth pressure are used to weight three alternative vectors of “attraction coefficients” for the 12 study areas. The attraction coefficients represent the locations where new residents would choose to live based on the location(s) of growth pressure (without, at this point, considering the available capacity in the study area or its relative affordability). The following are the three vectors of “attraction coefficients.”
Unconstrained Attraction Coefficient Based on Location of Growth Pressure
Study Area Southeast Northeast West
Carbondale 20% 16% 8%
1a. Unincorporated 10% 5% 2%
Glenwood Springs 18% 21% 11%
1b. Unincorporated 8% 10% 4%
New Castle 10% 11% 8%
2a. Unincorporated 3% 3% 2%
Silt 6% 6% 9%
2b. Unincorporated 2% 2% 4%
Rifle 13% 14% 23%
3a. Unincorporated 4% 5% 9%
Parachute 4% 4% 11%
3b. Unincorporated 2% 3% 9%
Exhibit V-8. Unconstrained “Attraction Coefficients”
Note:
Columns add to 100 percent
Source:
BBC Research and Consulting, 2006.
BBC RESEARCH & CONSULTING SECTION V, PAGE 13

To illustrate the processes for incorporating the geographic location(s) of growth pressure and the unconstrained attraction coefficients, consider the following example. Assume a hypothetical future year in which the only changes in economic base jobs and out-commuting were a gain of 100 tourism-related jobs and an increase of 100 commuters to Eagle County. The geographic weights for new residents in that year would then become:
Southeast = (100 tourism jobs * 50% weight + 100 Eagle County commuters * 0 percent weight)/200 total new jobs and commuters = 25 percent;
Northeast = (100 tourism jobs * 50 percent weight + 100 Eagle County commuters * 100 percent weight)/150 total new jobs and commuters = 75 percent; and
West = (100 tourism jobs * 0 percent weight + 100 Eagle County commuters * 0 percent weight)/150 total new jobs and commuters = 0 percent.
The unconstrained attraction coefficient for the Town of Carbondale would then become:
25 percent (Southeast weight from previous step) * 20 percent (attraction coefficient) + 75 percent (Northeast weight from previous step) * 16 percent = 17 percent.
Absent further constraints due to capacity limitations, in this example the model would seek to allocate 17 percent of new county residents to the Town of Carbondale. However, capacity constraints also play an important role—as discussed in the following narrative.
Study area capacities (user adjustable). The estimated maximum number of people that can live in each study area (incorporated or unincorporated) is an important assumption in the model. The study area capacity provides an absolute limit on the number of people that the model will allocate to each area. The capacity factor is also used in modeling the expectation that as areas approach their ultimate population capacity, their ability to capture new Garfield County residents diminishes due to implicit factors such as higher costs for land and housing and greater difficulty in accommodating new developments.
BBC interviewed municipal officials to derive study area capacities for each of the municipal areas. The capacity numbers are intended to reflect a combination of physical limitations (such as the limits of developable land) and current political thinking (such as growth boundaries and zoning limitations), but not short-term infrastructure constraints that will likely be overcome through investment in basic infrastructure.
BBC worked with Garfield County officials to estimate approximate capacities for unincorporated areas. Unincorporated capacities also reflect GIS-based estimates of developable land and an assumption that unincorporated development would be a roughly equal mix of 5 acre and 35 acre parcels.
BBC RESEARCH & CONSULTING SECTION V, PAGE 14

Exhibit V-9 shows the estimated study area population capacities currently incorporated in the model. All capacity constraints are user adjustable.
Study Area Estimated Capacity
Approximate 2005 Population Share of Total Capacity
Carbondale 8,250 72%
1a. Unincorporated 7,500 47%
Glenwood Springs 12,500 69%
1b. Unincorporated 10,000 50%
New Castle 10,000 31%
2a. Unincorporated 12,500 18%
Silt 10,000 23%
2b. Unincorporated 12,500 15%
Rifle 30,000 27%
3a. Unincorporated 17,500 22%
Parachute 10,000 14%
3b. Unincorporated 17,500 25%
County Total 158,250 32%
Exhibit V-9. Estimated Study Area Population Capacities
Source:
BBC Research and Consulting, 2006.
To simulate the greater difficulty of development and the rising cost of land and housing as areas approach capacity, this constraint is modeled as an increasing restriction as the population approaches the capacity limit. The following formula describes the population allocation algorithm for the Garfield Socio-Economic Model:
ΔPopx = Sx (1-(Popx/Capx)2) ΔPopc
Where:
ΔPopx = change in population in area x for the year.
Sx = the geographically weighted attraction coefficient for area x (as described earlier).
Popx = the previous year’s population in area x.
Capx = the population capacity of area x.
ΔPopc = change in population in the overall county for the year.
The effect of incorporating relative capacity constraints into the geographic allocation process is to reduce the geographically weighted attraction coefficients for all study areas, with the greatest reduction occurring in areas that are already relatively crowded and comparatively expensive. For an area such as Carbondale (which is currently at 72 percent of estimated capacity), the formula reduces the attraction coefficient to approximately one-half of its unconstrained value. After calculating revised attraction coefficients for each study area using the processes just described, the model then “rebenches” all of the attraction coefficients to sum to 100 percent.
BBC RESEARCH & CONSULTING SECTION V, PAGE 15

Overall, this algorithm serves to make sure capacity limitations are not exceeded in the population allocation process and to “bump” residents that might have preferred to live in crowded areas closer to their work to less crowded (and presumably less expensive) areas of the county.
The geographic allocation process is modified in two special cases. In years in which the model determines that there is very little growth (less than one percent) or a decline in overall economic base jobs and out-commuting, the overall geographic allocation process is revised. In such cases, the unconstrained attraction coefficients for each study area are set to that area’s share of the total county population in the preceding year. If, on the other hand, the economic assumptions for a scenario result in a projected county population that exceeds the sum total of the capacities in all of the study areas, the excess population is placed by the model into a bin called “population beyond capacity.”
School district enrollment (user adjustable). The model employs a relatively simple three-step process for estimating school district enrollments:
1. Calculate total population for each district based on the study area population projections (GIS analysis was used to overlay the school district boundaries on the study area boundaries);
2. Results from Step 1 are multiplied by the percentage of countywide residents that are age 6 to 18 to develop an estimate of the school age population in each district; and
3. Results from Step 2 are multiplied by an enrollment adjustment factor specific to each district.
The enrollment adjustment factor accounts for issues such as open enrollment and private school attendance, as well as differences in the age distribution of residents within the school district from the county as a whole. The default enrollment adjustment factor values are based on 2005 enrollment versus school age population for each district. Users can adjust this factor in future years of the projection period if desired.
BBC RESEARCH & CONSULTING SECTION V, PAGE 16