socio-economic monitoring: a baseline assessment of … · socio-economic monitoring: a baseline...
TRANSCRIPT

Brian Jones
Socio-economic Monitoring: A baseline assessment of the fishing villages of the Kirindy-Mite MPA
309 A/B Aberdeen House, 22-24 Highbury Grove, London N5 2EA, UK. [email protected] Tel: +44 (0)20 7359 1287 Fax: +44 (0)800 066 4032
Blue Ventures Conservation Report
Socio-economic Monitoring: A baseline assessment of the fishing villages of the Kirindy-Mite MPA Page i
© Blue Ventures 2011. Copyright in this publication and in all text, data and images contained herein, except as otherwise indicated, rests with Blue Ventures.
Cover Page: Traditional sailing pirogue in Belo-sur-Mer lagoon at sunrise
Keywords: Belo-Sur-Mer, Kirindy Mite, Socio-economic monitoring, Baseline assessment
Acknowledgements: I would like to thank all staff at Madagascar National Parks. I would also like to thank all Blue Ventures staff and finally I would like to pass my thanks to all those communities in the region that aided us in our surveys and were extremely accommodating and hospitable to all of our staff during this period.
Recommended citation: Jones B., (2011) Socio-economic Monitoring: A baseline assessment of the fishing villages of the Kirindy-Mite MPA. Blue Ventures Conservation Report

Blue Ventures Conservation Report
Socio-economic Monitoring: A baseline assessment of the fishing villages of the Kirindy-Mite MPA Page ii
Executive Summary The Kirindy-Mite MPA has been implemented as a marine extension to the existing Kirindy-Mite National Park. The core and buffer zones of the MPA, which currently benefit from a two-year temporary protection, will be managed by MNP as a national marine park, and the surrounding “protection” zones will be a community-managed area focusing on sustainable use of marine resources. The MPA is still in the midst of the establishment process with core protection areas already being decided, but no physical infrastructure yet installed, and governance institutions still to be established.
A baseline socio-economic assessment was conducted throughout 11 villages within the vicinity of the national park in order to: Gauge community perceptions of (1) the current state of marine resources and (2) the MPA establishment process, and finally to (3) Inform the on-going MPA establishment process. The indicators identified for evaluation in this baseline assessment have been derived from preliminary MPA goals and objectives, and should be the focus of on-going monitoring in subsequent years.
The coastal communities of the Kirindy-Mite area exhibit low levels of formal education, a high dependence on harvesting of marine resources, and low diversification of livelihood strategies. The traditional fishery of the Kirindy-Mite area is in marked decline, as a result of environmental stressors, such as cyclones and sustained high water temperatures leading to mass coral bleaching, as well as sustained fishing pressure from traditional, artisanal and industrial fishers. This situation leaves fishing communities of the Kirindy-Mite area highly susceptible to a potential future collapse of the traditional fishery.
Despite a participatory approach being taken by the MPA manager, Madagascar National Parks, including village, communal, inter-communal and regional level public consultations, community knowledge of the MPA zoning and rules and regulations is currently very low.
This study recommends that a number of actions be made a priority by the MPA manager and partner organisations, including the following:
· Finalisation, and subsequent awareness raising in stakeholder communities, of MPA governance prerequisites such as:
o MPA management and zoning plan o Enforcement procedures for rules and regulations o Installation of MPA infrastructure (buoys, signage, etc...) o Establishment of community-based patrol and enforcement committees (comité de vigilance)
· Awareness raising activities to improve knowledge of MPA zoning, rules and regulations in stakeholder communities.
· Lobbying to regional and national authorities for the obtaining of temporary protection for the surrounding “protection zone” in order to effectively enforce a ban on industrial and artisanal shrimp trawlers.
· Environmental education activities to increase awareness among fishing communities of the potential for no-take marine reserves to benefit traditional fisheries.
· Development of alternative livelihoods to decrease dependence and alleviate pressure on marine resources.
Finally, a schedule for the on-going monitoring of socioeconomic and governance indicators is proposed.

Blue Ventures Conservation Report
Socio-economic Monitoring: A baseline assessment of the fishing villages of the Kirindy-Mite MPA Page iii
Table of Contents Executive Summary ....................................................................................................................................................... ii
Acronyms ....................................................................................................................................................................... v
List of Tables ................................................................................................................................................................. vi
List of Figures .............................................................................................................................................................. vii
1. Introduction ................................................................................................................................................................ 1
1.1 Study site ............................................................................................................................................................. 1
1.2 Ecological context ................................................................................................................................................ 1
1.3 Jurisdiction ........................................................................................................................................................... 1
1.4 Language ............................................................................................................................................................. 3
1.5 Coastal populations ............................................................................................................................................. 3
1.6 Artisanal/Industrial fishers .................................................................................................................................... 5
1.7 Project history ...................................................................................................................................................... 6
1.8 Purpose of the study ............................................................................................................................................ 9
2. Methodology ............................................................................................................................................................ 10
2.1 Elaboration of indicators and surveying methodology ....................................................................................... 10
2.2 Sampling ............................................................................................................................................................ 11
2.3 Research methods ............................................................................................................................................. 13
2.4 Challenges/Limitations/Sources of error ............................................................................................................ 14
3. Results ..................................................................................................................................................................... 16
3.1 Community demographics ................................................................................................................................. 16
3.2 Community infrastructure and business............................................................................................................. 19
3.3 Livelihoods ......................................................................................................................................................... 19
3.4 Material Style of Life (MSL) ............................................................................................................................... 22
3.5 Resource use patterns ....................................................................................................................................... 27
3.6 Perceptions of local resource harvest ................................................................................................................ 31
3.7 Local values/beliefs about marine resources and conservation measures ........................................................ 33
3.8 Perceptions of non-market value of resources/Environmental awareness ........................................................ 36
3.9 Extent of participation in MPA establishment process/Degree of interaction between managers and stakeholders ............................................................................................................................................................ 38
3.10 Knowledge of MPA rules and regulations ........................................................................................................ 41
3.11 Existence and composition of management structure ..................................................................................... 44
3.12 Existence and adoption of a management and zoning plan ............................................................................ 45

Blue Ventures Conservation Report
Socio-economic Monitoring: A baseline assessment of the fishing villages of the Kirindy-Mite MPA Page iv
3.13 Availability of administrative resources ............................................................................................................ 45
3.14 Existence and application of scientific input..................................................................................................... 46
3.15 Clearly defined enforcement procedures ......................................................................................................... 46
3.16 Communications .............................................................................................................................................. 47
4. Conclusions and recommendations ......................................................................................................................... 49
4.1 Socioeconomics................................................................................................................................................. 49
4.2 Governance ....................................................................................................................................................... 50
4.3 On-going Monitoring .......................................................................................................................................... 51
Bibliography ................................................................................................................................................................. 53
Annexe 1 : Survey Forms ............................................................................................................................................. 55

Blue Ventures Conservation Report
Socio-economic Monitoring: A baseline assessment of the fishing villages of the Kirindy-Mite MPA Page v
Acronyms BV- Blue Ventures COAP- Code de Gestion des Aires Protégées (Protected Areas Management Code) COSAP- Comite d’Orientation et Soutien aux Aires Protégées (Protected Area Orientation and Support Committee) CVCPM- Chef de Volet Conservation Parc Marin (Marine Park “Team Leader”) IUCN- International Union for the Conservation of Nature MNP- Madagascar National Parks MPA- Marine Protected Area NTZ- No-Take Zone; an area strictly off-limits to all fishing activities SAPM- Système des Aires Protégées de Madagascar (Madagascar System of Protected Areas) WIO- Western Indian Ocean

Blue Ventures Conservation Report
Socio-economic Monitoring: A baseline assessment of the fishing villages of the Kirindy-Mite MPA Page vi
List of Tables Table 1 Jurisdiction and population of study site villages ............................................................................................... 2 Table 2: Socioeconomic and governance indicators for the Kirindy-Mite MPA ............................................................ 11 Table 3 Estimated difference in population: households observed vs. secondary source ........................................... 16 Table 4 Formal education in surveyed villages ............................................................................................................ 18 Table 5 Community infrastructure and business in surveyed villages .......................................................................... 19 Table 6 Estimate of fishing households across study site ............................................................................................ 20 Table 7 Material style of life: House construction materials ......................................................................................... 22 Table 8 Material Style of Life: Possessions and animal raising ................................................................................... 23 Table 9 Material Style of Life comparison to northern Kenya ....................................................................................... 24 Table 10 Fishing gear ownership ................................................................................................................................. 25 Table 11 Seasonal fishing activities, participation and estimated yields ...................................................................... 28 Table 12 Years since first noticing decrease in fish catches by age bracket ............................................................... 31 Table 13 Knowledge of MPA rules, regulations and zoning by section and village ...................................................... 44 Table 14 Members of the Kirindy-Mite National Park COSAP ..................................................................................... 45 Table 15 Radio listenership in surveyed villages ......................................................................................................... 48 Table 16 Recommended schedule for on-going monitoring ......................................................................................... 52

Blue Ventures Conservation Report
Socio-economic Monitoring: A baseline assessment of the fishing villages of the Kirindy-Mite MPA Page vii
List of Figures Figure 1 Map of study site showing District divisions (Source: SAHA Intercooperation) ................................................ 3 Figure 2 Proposed zoning of the Kirindy-Mite MPA (Source: Madagascar National Parks) ........................................... 8 Figure 3 Populations of migrant fishers on islands by month, 2010 ............................................................................. 17 Figure 4 Distribution of commune of origin of migrant fishers by month, 2010 ............................................................ 17 Figure 5 Age structure in surveyed villages ................................................................................................................. 18 Figure 6 Primary livelihood strategies of "fishing" households ..................................................................................... 21 Figure 7 # of non-marine resource dependant activities in fishing households ............................................................ 21 Figure 8 Responses to "If you weren't able to fish, you could do other work to support yourself" ............................... 22 Figure 9 Distribution of net mesh size (mm), all sites ................................................................................................... 26 Figure 10 Distribution of net mesh size (mm) by section ............................................................................................. 26 Figure 11 Primary fishing activities, all surveyed villages ............................................................................................ 27 Figure 12 Average estimated daily capture for fishing activities .................................................................................. 29 Figure 13 Average estimated daily capture by activity and area .................................................................................. 30 Figure 14 Percentage of respondents who report fishing on off-shore reefs................................................................ 30 Figure 15 Perceptions of fish abundance, size, type and capture ................................................................................ 31 Figure 16 Perceptions of when catch decline began by age group .............................................................................. 32 Figure 17 Perceptions of what is causing decrease in catches, by section.................................................................. 33 Figure 18 Perceptions of NTZ effect on catches in surrounding fishing sites ............................................................... 34 Figure 19 Perceptions of trawler ban on catches ......................................................................................................... 34 Figure 20 Belief of effect of NTZ on catches in surrounding areas, by section ............................................................ 35 Figure 21 Responses to: "When coral reefs are destroyed, fish becomes more abundant" ........................................ 36 Figure 22 Responses to: "Seagrass is not important for the lives of fish" .................................................................... 36 Figure 23 Responses to "If there were no mangroves, coastal soils would erode quicker" ......................................... 37 Figure 24 Responses to: "Coral reefs in this area are much healthier than they were 20 years ago" .......................... 37 Figure 25 Percent of respondents who have attended a meeting regarding the MPA ................................................. 38 Figure 26 Percent of respondents, by section, who have attended a meeting regarding the MPA .............................. 38 Figure 27 Perceived extent of participation in the MPA establishment process ........................................................... 39 Figure 28 Perceived extent of participation in MPA establishment process, by section ............................................... 39 Figure 29 Responses to "Who was involved in making the MPA rules?" ..................................................................... 40 Figure 30 Reponses to "How clear are MNP explanations?", all respondents ............................................................. 40 Figure 31 Responses to "How clear are MNP explanations?", respondents who had attended a meeting ................. 41 Figure 32 Percent of respondents, by section, correctly identifying island regulations ................................................ 42 Figure 33 Responses to "Should people be allowed to live on the islands?" ............................................................... 42 Figure 34 Percent of respondents, by section, who can identify any of 4 core NTZs ................................................... 43 Figure 35 Percent of respondents, by section, who identified incorrect reef as core NTZ ........................................... 43 Figure 36 Responses to "Who is responsible for enforcing MPA rules and regulations?" ........................................... 47 Figure 37 Responses to "What time do you listen to the radio?" ................................................................................. 48

Blue Ventures Conservation Report
Socio-economic Monitoring: A baseline assessment of the fishing villages of the Kirindy-Mite MPA Page 1
1. Introduction 1.1 Study site Madagascar, the world’s fourth largest island, is often cited as a biodiversity “hotspot” due to its high levels of endemicity in terrestrial flora and fauna. With over 5,000 kilometres of coastline, however, it is also home to some of the most extensive coral reefs, mangrove forests and other in-shore marine and coastal habitats in the western Indian Ocean (WIO), supporting high levels of biodiversity and providing breeding and foraging grounds for species of international conservation importance (Cooke et al. 2003). Compared to other WIO countries such as Kenya and Tanzania, Madagascar’s system of Marine Protected Areas (MPAs) is relatively underdeveloped, with the country’s first true MPA, the Mananara Nord Biosphere, coming into existence as recently as 1989. Recent years have seen an increased focus on establishing MPAs, following former President Marc Ravalomanana’s 2003 “Durban Vision” to more than triple the coverage of Madagascar’s system of protected areas from 1.7 million to 6 million hectares. An initial target of 1 million hectares of marine protected areas was established as part of this expansion. The Kirindy-Mite Marine Protected Area (MPA) is among these newly proposed MPAs and is currently in the process of applying for official protection and gazetting under Madagascar’s System of Protected Areas (SAPM- Système des Aires Protégées de Madagascar). It is situated on the west coast of Madagascar approximately 450 kilometres southwest of the capital Antananarivo. The area proposed for protection encompasses a stretch of coast approximately 105 kilometres in length and extending approximately 25 kilometres off-shore, with a total surface area of over 228,000 hectares. If official protection is granted, this would make it Madagascar’s largest single MPA. 1.2 Ecological context The area is home to dense stands of mangrove forests, vast seagrass meadows, as well as near-shore and off-shore coral reefs. The near-shore coral reefs are less well developed than the off-shore reefs, likely due to a lack of proper substrate, as well as high levels of sedimentation and fresh water input from terrestrial river mouths resulting in turbid waters as well as enhanced nutrient load favouring the growth of turf algae. The off-shore islands and their associated coral reefs are part of a larger ancient barrier reef system which extends 600 km to the north and also encompasses the Barren Isles ecosystem, approximately 400 km north of the study site. These coral reefs benefit from clearer water and less sediment input, due to their distance from near-shore river outlets, and have, until recently, been relatively unexploited by fishing activities. While a dearth of quantitative scientific information currently exists regarding the previous health of the coral reefs of the Kirindy-Mite area, a largely qualitative study from the early 1980’s ranked them among the best reefs in Madagascar, and cited them as having high conservation priority (Salomon 1980). Dive surveying undertaken in 2009/10, however, has found the reefs to be in a fairly degraded state with hard coral cover and reef fish biomass similar to that of other fished areas throughout the WIO (Gough 2010). 1.3 Jurisdiction Jurisdictionally, Madagascar is divided into 22 regions. These regions are then subdivided into Districts, which are subdivided into Communes (both rural and urban), which are finally subdivided into Fokontany. While fokontany are the lowest jurisdictional level in Madagascar and are governed by a democratically elected “President”, they often encompass several smaller independent villages. In such a case, these smaller settlements are governed by a “Chef du village” who is appointed by the president of the fokontany under which the village’s jurisdiction falls. The Kirindy-Mite MPA is located in the Menabe region, and encompasses two rural communes which are part of two separate Districts. Andranopasy Rural Commune, in the southern end of the MPA site, is part of the Manja District and Belo-sur-Mer Rural Commune, in the northern end, is part of the Morondava District. Eight officially recognised fokontany are located adjacent to the MPA, however the population is relatively dispersed, and approximately 22 recognisable settlements or villages exist along the coast. Two of these villages, Andranopasy and Belo-sur-Mer, are

Blue Ventures Conservation Report
Socio-economic Monitoring: A baseline assessment of the fishing villages of the Kirindy-Mite MPA Page 2
larger commune-heads, with populations of 2,112 and 1,733, respectively. The remainder of the villages are relatively small with populations not exceeding 400. All of the villages in the project area, with the most recent available population data are shown in Table 1 below (Raharison 2010). Table 1 Jurisdiction and population of study site villages
Village Fokontany Population Households Seasonal/Permanent
Andr
anop
asy
Comm
une
Marohata Andranopasy II 82 29 Permanent Ampasilava Andranopasy 47 11 Quasi-permanent Ambalahonko Andranopasy 178 40 Permanent Andranopasy Andranopasy 2112 518 Permanent Ankalapoaky Andranopasy 79 38 Quasi-permanent Itampolo Andranopasy 78 25 Permanent Ankoba (north and south) Ankoba an-tety 208 42 Permanent Antsaranandaka Ankoba an-tety 96 23 Permanent Eleo Ankoba an-tety 96 24 Permanent
Belo-
sur-M
er C
ommu
ne Manahy an-driake/Ambohitse Ankilifolo 81 15 Permanent
Antanimanimbo Belo-sur-Mer 215 43 Permanent Belo-sur-Mer Belo-sur-Mer 1733 346 Permanent Menaky Belo-sur-Mer 84 22 Permanent Ankaotelo Belo-sur-Mer 82 20 Quasi-permanent Ankevo-sur-Mer Ankevo-sur-Mer 235 64 Permanent Antanagnabo Ankevo-sur-Mer N/A N/A Quasi-permanent Nosinihita Ankevo-sur-Mer 51 12 Permanent Belagnora Belalanda 94 17 Permanent Marovitike/Belalanda Belalanda 232 47 Permanent Andika-sur-Mer/Begamela Andika-sur-Mer 420 75 Permanent
The study site is rural and isolated, with the nearest population centres being the city of Morondava, administrative centre of the Menabe Region, and head of the Morondava district as well as the city of Manja, the head of Manja District. Some coastal villages in the Kirindy-Mite region have a “quasi-permanent” status, as they experience seasonal influxes of populations, with fishers from the larger, more established villages moving to these smaller settlements to improve access to productive fishing grounds. Many of these inhabitants then move back to their original villages during the summer months of December through March.

Blue Ventures Conservation Report
Socio-economic Monitoring: A baseline assessment of the fishing villages of the Kirindy-Mite MPA Page 3
Figure 1 Map of study site showing District divisions
1.4 Language Madagascar has three official languages: Malagasy, French and English. Neither English nor French are widely spoken in rural areas. The Malagasy language contains many distinct dialects. However, despite the country’s size, and relative isolation of its populations, the Malagasy language spoken throughout the island is remarkably similar, and Malagasy people from any part of the country are generally able to easily communicate. The dialect most commonly spoken in the study site is the Sakalava/Vezo dialect. 1.5 Coastal populations The west and southwest coast of Madagascar is home to the Vezo, a historically semi-nomadic seafaring people who depend almost entirely on the ocean’s resources for their daily survival. To be “Vezo” is to live and struggle with the sea, and it is not necessarily an ethnographic tribe, but rather a way of life which makes one Vezo (Astuti 1995). The Vezo in the area of the Kirindy-Mite MPA are of Sakalava descent, a tribe of people who populate the vast expanse of Madagascar’s western and north-western coast and inland territories. The Menabe region is extremely hot and arid, with average summer and winter temperatures of 27.7 °C and 21.5 °C, respectively, and average annual rainfall of 764 mm falling over a few months of the year, making the coastal area, with its sandy soil, largely inhospitable to agriculture (MAEP 2003). Indeed, recent studies of the Vezo and their livelihood strategies have shown that over 80% of these coastal people employ harvesting of marine resources as their primary form of income (Raharison 2010, Iida 2005).

Blue Ventures Conservation Report
Socio-economic Monitoring: A baseline assessment of the fishing villages of the Kirindy-Mite MPA Page 4
Technology today remains fairly rudimentary, with traditional Vezo fishermen utilising dugout canoes of 3-5 meters (molanga), made from the endemic farafatse tree (Givotia madagascariensis), for near-shore fishing, and larger sailing canoes of 5-8 meters (lakana), which are fitted with an outrigger and mast, for longer distance travel and off-shore fishing. The utilisation of outboard motors by traditional Vezo fishermen is exceedingly rare, and is likely contained to a handful of cases along the length of Madagascar’s vast west/southwest coast. Vezo fishermen employ a wide array of gear, including spears (voloso), spear-guns (basim-pia), hook and line (vinta), and various types of gill nets (harato). The 1970s and 80s saw a large shift from traditional nets made from weaving plant fibres or nylon cord (harato kere) to monofilament nylon nets (harato talirano). These nets generally range anywhere from 100 to 800 meters in length, and mesh sizes typically used range from 15mm to 40mm (Gough et al. 2009b). The traditional fishery targets finfish (including sharks and rays), crustaceans (shrimp, crab), molluscs (octopus, squid) and marine turtles. Historically, it has been a traditional subsistence fishery where portions of the daily catch not used for immediate consumption would be bartered for goods that the Vezo themselves are not able to produce, such as corn and cassava, with members of the inland Sakalava/Masikoro tribe (Langley 2006). However, developments in the last couple of decades, such as increased access to international markets and expanding coverage of commercial collection companies have resulted in fairly inexhaustible demand for commercially valuable resources, which are not consumed locally and would not generally be heavily targeted by traditional fishermen, such as octopus, sea cucumbers and shark fins1
(Langley 2006, Iida 2005). This situation has resulted in the transformation of a traditionally subsistence fishery to one in which a significant proportion of fishermen choose to pursue the higher gains received from harvesting these export oriented resources. This transformation has seen an accompanying proliferation of large-mesh (25-40cm) jarifa shark nets, which are employed in near to off-shore waters at depths of anywhere from 20 to 300 m, as well as the proliferation of free diving for sea cucumbers in water up to 30 meters deep, pushing the limits of the human body with sometimes tragic consequences (personal communication with Vezo fishermen).
Due to the relative abundance of commercially valuable shark and invertebrate species in the area of the Kirindy-Mite MPA, the chain of off-shore islands have seen a recent influx of migrant Vezo fishermen, coming primarily from areas to the south but also from villages to the north near Morondava. These migrant fishers have increased in number drastically in the past two decades, and spend up to as many as 10 months of the year living on the islands, essentially without access to public services such as primary schools and health clinics. Moreover, the islands lack any source of fresh water, which must be brought out from the mainland along with all staples such as rice, and cooking oil. This influx of humans has seen an accompanying influx of pests such as rats. Paradoxically, these rats have subsequently been deemed the physical embodiment of the spirits of the islands and consequently have been elevated to taboo status, resulting in the uncontrolled proliferation of their population and the destruction of eggs of nesting seabird and marine turtle populations. This chain of seven islands, three of which are inhabitable insomuch as they are never fully submerged at high tide, have traditionally been barred by mainland communities from human settlement, with the exception of situations in which a fisher must take refuge in the event of bad weather or poor sailing conditions that prevent his return to the mainland. The quasi-permanent presence of these migrant fishermen on the islands has proven itself to be a point of contention, as local communities try to resolve their widely held view of open-access to marine resources (“riake tsy misy tompony” or literally “the sea has no owner”) with their traditional belief that the islands were not meant for human settlement. Migrant fishermen were forced to vacate the northernmost island, Nosy Andravoho, in 2008 by the mayor of Belo-sur-Mer, but have subsequently returned with no negative consequences (Cripps 2009).
1 Octopus (mal. horita) is consumed locally but was not exploited heavily until the arrival of commercial export companies. Likewise, shark meat has been consumed traditionally, but fishing pressure on sharks (mal. akio) has risen dramatically with the arrival of independent collectors who purchase shark fins.

Blue Ventures Conservation Report
Socio-economic Monitoring: A baseline assessment of the fishing villages of the Kirindy-Mite MPA Page 5
Another evolving trend is the tendency for inland Sakalava/Masikoro agro-pastoralists to augment their meagre income by harvesting coastal and marine resources. These traditional farmers of starchy staple crops, such as corn, cassava, and sweet potatoes, and herders of cows and goats, do not possess the same seafaring ability as their Vezo neighbours, and their harvesting of resources is mostly restricted to the coastal mangrove and seagrass habitats. Often times, as a result of this lack of traditional fishing knowledge, these people resort to highly effective, yet highly destructive means of fishing, such as the use of poison (laro) and beach-seine nets (kajaoto), where a small-mesh net is weighted, fitted with a mosquito net pocket, and dragged from the shore, capturing anything in its path and destroying benthic habitat. As population rapidly expands, doubling every 15-20 years, and global climate change continues to make seasonal rains, and therefore agricultural yields, less reliable, these inland populations will likely continue turning to the sea, and their destructive methods of harvesting, as a short-term solution to failing crops and the increasing number of mouths to feed. 1.6 Artisanal/Industrial fishers In addition to the traditional fishing activities undertaken in the coastal waters of the Kirindy-Mite area, there are a number of artisanal and industrial fishing operations. It is important to note that Malagasy fisheries law distinguishes artisanal fishing as any vessel that utilizes a motor greater than 25hp but less than 50hp, and industrial fishing as any vessel with a motor greater than 50hp (MAEP 2005). With the abrogation in 1971 of the national fisheries law establishing a 2 nautical mile zone reserved exclusively for the use of traditional fishermen, the near-shore coastal and marine habitats of Madagascar were effectively opened to exploitation by industrial and artisanal commercial fishing ventures. This move was originally taken by the Malagasy government in a context of low population densities and traditional fishing pressure, as well as the realization that as much as 85% of Madagascar’s commercially exploitable shrimp (Penaeus sp.) stock is located within this near-shore zone (Gillett 2008). Industrial trawlers use non-discriminatory fine-mesh (15mm) nets, dragged behind the vessel to capture their target shrimp species. The dragging action of the net along with its small mesh size results in destruction of seagrass habitat, as well as large amounts of bycatch. The ratio of shrimp to bycatch on industrial trawlers is estimated at 1:3, which, calculating this ratio against total shrimp landings for all industrial and artisanal trawlers, resulted in a total bycatch of approximately 20,000 tonnes of fish in 2004 (Gillett 2008). In addition to this landed bycatch, other studies have estimated total discard to be as much as 30,000 tonnes (Gillett 2008). In recent years, with rapidly increasing coastal populations, and diminishing returns on traditional fisheries, conflict has arisen between traditional fishermen, who often have their gear damaged, and resources heavily depleted by these shrimp trawlers, who hail mostly from the northern cities of Majanga, NosyBe and Diego Suarez. Additionally, anecdotal evidence suggests that turtles are a common by-catch within the nets of these trawling vessels, as dead turtles are often found washed ashore shortly after their passing (personal communication, Vezo fishers). The Project ZAC (Zone d’Aménagement Concertée) was undertaken with the goal of mitigating conflict and helping traditional fishermen and industrial fishing operations to come to a consensus suitable to both parties. Unfortunately, these negotiations have not had the desired outcome, and conflict continues to this day. The seafood exporter SOPEMO, based in Morondava, previously employed smaller artisanal shrimp trawlers, but has since discontinued this practice due to lack of profitability. Currently, SOPEMO’s only fishing activities include artisanal long-lining near the off-shore reefs targeting higher value pelagic species such as tuna and mackerel (Scombridae) (personal communication, Director of SOPEMO). The Kirindy-Mite area is also frequented by teams of artisanal divers, using SCUBA gear to collect sea cucumbers. This practice is forbidden by Malagasy law (MAEP 2005, Titre III, Article 10.d), but, due to a combination of politically connected individuals and a lack of enforcement capacity on the part of the fisheries authorities, these teams currently operate with relative impunity.

Blue Ventures Conservation Report
Socio-economic Monitoring: A baseline assessment of the fishing villages of the Kirindy-Mite MPA Page 6
The area has also been visited by teams of “barrage” fishermen, hailing from the northern cities of Diego Suarez and Majanga. These teams employ large-mesh nets of up to 8km in length, and target off-shore populations of sharks and, notably, guitarfish for their high priced fins. Malagasy fisheries law currently puts no limit on the length of nets that can be employed by traditional fishermen (MAEP 2005). Thus, in an effort to avoid the bureaucracy and cost of applying for an artisanal fishing permit (which is considerably more expensive than a traditional fishing permit) the members of these teams carry traditional fisher registration cards. 1.7 Project history 1.7.1 Project partners Madagascar National Parks (MNP) Madagascar National Parks, established in 1990, is a para-statal organisation that is mandated by the Malagasy government to manage the country’s network of national parks. MNP (formerly known as ANGAP or the Association National pour la Gestion des Aires Protégées) currently manages a network of over 50 national parks which fall under the IUCN protected areas classifications of Category I, II, and IV2
. While MNP focuses on the protection of Madagascar’s unique terrestrial and marine biodiversity, they also have a social mandate to promote development in stakeholder communities, and 50% of the entrance fees to the national parks are ear-marked to be reinvested into local development projects.
Blue Ventures Conservation (BV) Blue Ventures Conservation, a British NGO, works actively with fishing communities in western and south-western Madagascar. BV is working in partnership with MNP to support the Kirindy-Mite MPA, and their operations are based in the village of Belo-sur-Mer, approximately 60 km south of the regional capital Morondava. BV is currently undertaking a broad array of ecological and fisheries monitoring, as well as working with local communities to sustainably manage their coastal and marine resources. Additionally, the socio-economic monitoring of fishing communities affected by the implementation of the Kirindy-Mite MPA has been delegated to BV, and they are the principal investigating organisation for the current socio-economic assessment. Since 2003, BV has worked with the fishing communities of the Andavadoaka area, located approximately 200 kilometres south of the Kirindy-Mite MPA, in establishing Madagascar’s largest community-managed Marine Protected Area, the Velondriake MPA. The initial success and rapid expansion of the Velondriake MPA has been based largely on the implementation and replication of temporary no-take zones, aimed at maximising production of the economically important grey octopus (Octopus cyanea). Focusing on a fast-growing species, these temporary reserves, which close for 3-4 months on average, have demonstrated the benefits of fisheries closures on time scales acceptable to temporally constrained traditional fishermen. To date, more than 100 of these temporary closures have been organised throughout the southwest as well as in Ivovona, Diego in the northwest and Rodrigues, Mauritius. The buy-in generated by these temporary closures have led to the successful permanent closure of four coral reef fishing sites and two mangrove areas in the subsequent years. It has been this success in working with Vezo fishing communities, as well as BV’s expertise in ecologic and socio-economic monitoring, that led to the MNP engagement with BV as a partner for the Kirindy-Mite MPA project. 1.7.2 Project history The Kirindy-Mite MPA is part of the larger Kirindy-Mite National Park complex which includes both a terrestrial and marine component. The Kirindy-Mite terrestrial park was created in 1998 in an effort to conserve some of the best remaining tracts of deciduous dry forest, representative of the unique flora and fauna of western Madagascar. The Kirindy-Mite terrestrial park is reportedly home to the highest concentration of endemic baobab trees in Madagascar, 2 Madagascar uses a classification similar, but not identical, to the IUCN system of classification for protected areas. The country is currently in the process of amending its protected areas legislation to include less-restrictive sustainable use zones, comparable to the IUCN Category V and VI classifications.

Blue Ventures Conservation Report
Socio-economic Monitoring: A baseline assessment of the fishing villages of the Kirindy-Mite MPA Page 7
and it’s southern section is also believed by some to be the extreme northern limit for the range of the charismatic ring-tailed lemur (Lemur catta) (personal communication, Dr. Rebecca Lewis). In 2005, extension of the protected area was proposed to include a large southern portion of largely pristine forest, as well as a coastal and marine component, aimed at protecting key mangrove forest and coral reef habitats. MNP has been holding community consultations since mid 2009 to generate consensus on the MPA zoning plan and regulations. At the time of this study, community and regional consultations to finalise the MPA zoning plan had been completed (in late 2010), and a tour of all of the villages in the project area had been conducted by MNP marine park agents to disseminate information about the zoning of the park. During this tour, village meetings and one-on-one conversations were held by marine park agents with local community members to explain the marine park zoning as well as the newly imposed regulations (personal communication, marine park agents). This awareness raising tour took place in the last few months of 2010, and communities were told that the MPA would come into effect in early 2011. 1.7.3 MPA zoning and regulations The Kirindy-Mite MPA is planned as a marine extension to the existing Kirindy-Mite National Park, which corresponds closely to the IUCN Category II classification. Madagascar has specific legal text dedicated to the zoning and management of its protected areas, known as the Code de Gestion des Aires Protégées or Protected Areas Management Code (COAP). According to the COAP, all protected areas must have a core zone (noyau(x) dur) of highest protection, a buffer zone (zone tampon), and a protection zone (zone de protection). As of completion of this study, MNP plans to manage the core and buffer zones as a national park, and to delegate the management of the vast “protection zone” to a community management structure. The NGO Blue Ventures plans to work in partnership with MNP and stakeholder communities to develop and build capacity within this community management structure. An interministerial arêtté (No 52005/2010) issued on the 20th of December, 2010, granted two years of temporary protected status to the core and buffer zones of the Kirindy-Mite MPA, while the surrounding “protection zone” remained listed as a “potential site”, but does not, at the time of writing this report, benefit from any sort of official protected status. It is expected that an all inclusive protection will be obtained in 2011. The preliminary zoning plan for the Kirindy Mite MPA is shown in Figure 2 below.

Blue Ventures Conservation Report
Socio-economic Monitoring: A baseline assessment of the fishing villages of the Kirindy-Mite MPA Page 8
Figure 2 Proposed zoning of the Kirindy-Mite MPA (Source: Madagascar National Parks)

Blue Ventures Conservation Report
Socio-economic Monitoring: A baseline assessment of the fishing villages of the Kirindy-Mite MPA Page 9
The areas indicated as noyaux dur, or “core zones”, on the map are strict no-take zones (NTZ), with periodic ecological surveying being the only activity allowed within their limits. These noyaux dur are surrounded by zone tampon (buffer zones) where sustainable traditional fishing is allowed, but artisanal and industrial fishing, as well as destructive practices, will be excluded. The three inhabitable islands (Nosy Andriamitaroke, Nosy Be, and Nosy Andravoho) are classified as zones de service, which, in accordance with the Procedures Manual for the Creation of Marine Protected Areas in Madagascar (MEFT 2009), are destined for the implementation of infrastructure for tourism, education or MPA functioning. These islands officially ban the settlement of fishermen except for the case of bad weather, when staying on the island is necessary for security. Finally, the surrounding zone de protection (protection zone) will be a wider sustainable use zone, where future proposed management strategies include an industrial fishing ban, bans on destructive traditional fishing practices, and the implementation of community managed temporary and permanent no-take zones. It is apparent from this preliminary zoning plan that the areas designated as noyaux dur are largely situated in the southern end of the MPA, and that the fishing communities who traditionally utilise these NTZs can be expected to suffer greater short-term losses through restriction of fishing area, while also enjoying greater potential long-term benefit from the spillover of juvenile and adult fish due to build-up of biomass and spawning stock in the NTZs. It is important to note that, due to time constraints related to project funding, this study had to be conducted before any physical infrastructure demarcating the limits of the no-take zones and the periphery of the MPA were installed. These activities are currently scheduled for mid-2011 (personal communication CVCPM). 1.8 Purpose of the study The present study has been undertaken to serve as both a complement to previous social studies that have been undertaken by the Malagasy association Kily Be (Raharison 2010), as well as to serve as a baseline against which the results of future monitoring and evaluation of the MPA will be compared. The study aims to establish and collect baseline data related to a set of socio-economic and governance indicators to assess the effectiveness of MPA management, as well as to establish a systematic methodology and timeframe for future monitoring and evaluation activities to be carried out. The results of this future monitoring, combined with the results of on-going ecological and fisheries monitoring, will be used to evaluate the effectiveness of the MPA at achieving its goals and objectives, as well as to inform long-term project planning. Furthermore, this study serves as a preliminary diagnostic tool for the MPA manager to evaluate the effectiveness of the MPA implementation process to date in order to inform short-term decision-making and project planning.
Blue Ventures Conservation Report
Socio-economic Monitoring: A baseline assessment of the fishing villages of the Kirindy-Mite MPA Page 10
2. Methodology 2.1 Elaboration of indicators and surveying methodology The first step in designing this socio-economic assessment was to identify the MPAs goals and objectives. Initial goals and objectives for the Kirindy-Mite MPA were drafted by MNP in collaboration with BV, and are divided into three categories: (i) Biophysical, (ii) Socio-economic, and (iii) Governance. The IUCN guidebook “How is your MPA Doing?” was used to guide the formulation of these goals and objectives, and was also used to identify indicators for monitoring and evaluation (Pomeroy et al, 2004). While the indicators of success in achieving the biophysical goals and objectives are being monitored by MNP and BV in on-going ecological and fisheries monitoring, this study sets out to establish and collect baseline information in relation to socio-economic and governance indicators corresponding to the MPA goals and objectives. Two socio-economic and three governance goals, with their related objectives, were identified and used as the basis for elaboration of indicators for monitoring. The socioeconomic and governance goals for the Kirindy-Mite MPA are as follows:
Socioeconomic goal 1: Maintain livelihoods and enhance standard of living among Vezo fishing communities.
Objective 1: Maintain or enhance traditional fisheries capture Objective 2: Improve standard of living of local communities Objective 3: Diversify household livelihoods
Socioeconomic goal 2: Increase stakeholder awareness of ecosystems function, the related effects of anthropogenic pressure/destructive fishing practices, and sustainable resource use.
Objective 1: Increase stakeholder awareness and decrease prevalence of destructive practices Objective 2: Increase stakeholder awareness of non-monetary values of in-tact, functioning ecosystems
Governance goal 1: Establish a management and decision-making structure which is effective at enforcing regulations, reducing resource use conflicts, and is representative of all stakeholder groups.
Objective 1: All stakeholders feel represented in management organization and decision-making process Objective 2: Management organization and method of enforcing regulations is effective and culturally appropriate Objective 3: High level of local ownership over decision-making process and enforcement of regulations Objective 4: Resource use conflicts effectively managed and reduced
Governance goal 2: Establish a zoning and management plan that is in accordance with national and international policy, yet is locally accepted, culturally and ecologically appropriate, and is subject to a periodic process of evaluation and adaptation.
Objective 1: Zoning plan established in a participatory manner Objective 2: Existing national and international laws/treaties are respected and/or enhanced Objective 3: Design of zoning plan adheres to widely accepted scientific standards for maintenance and recovery of ecosystems, as well as resilience to climate change Objective 4: Rules governing MPA are clear, easily understood, and easily enforceable

Blue Ventures Conservation Report
Socio-economic Monitoring: A baseline assessment of the fishing villages of the Kirindy-Mite MPA Page 11
Objective 5: Periodic evaluation and adaptation of management and zoning plan carried out using a maximum of stakeholder feedback
Governance goal 3: Create a co-management model in which the protected area promoters provide on-going, quality technical support to stakeholder communities, and focuses on devolving management to the community level as much as possible.
Objective 1: Build local management capacity, and devolve responsibility to local community Objective 2: Maintain robust communication between stakeholder community and MPA management entity Objective 3: Build atmosphere of mutual trust and respect between stakeholder community and MPA management entity
Based on these socio-economic and governance goals and objectives, eight socioeconomic and nine governance indicators have been selected for on-going monitoring (Table 2). For a more detailed description of these indicators, consult the IUCN guidebook “How is your MPA Doing?” (Pomeroy et al. 2004). Table 2: Socioeconomic and governance indicators for the Kirindy-Mite MPA
Socio-economic Indicators S1: Resource use patterns S2: Local values and beliefs about marine resources S3: Perceptions of local resource harvest S4: Perceptions of non-market value of resources S5: Material style of life (MSL) S6: Household income distribution by source S7: Community infrastructure and business S8: Community demographics Governance Indicators G1: Existence and composition of management structure G2: Existence and adoption of a management and zoning plan G3: Local understanding of MPA boundaries, rules and regulations G4: Level of stakeholder participation and satisfaction in management G5: Degree of interaction between managers and stakeholders G6: Level of resource conflict G7: Availability of MPA administration resources G8: Existence and application of scientific input G9: Clearly defined enforcement procedures
2.2 Sampling Limitations on time and resources meant that it was not possible to undertake surveying in all of the villages that had been involved in the MPA establishment process as well as with populations of migrant fishermen temporarily living on the islands. The stakeholder population was thus divided into the following four categories, based on proximity to the MPA core no-take zones:
(i) Close proximity (within 25 kilometres of NTZs) (ii) Intermediate proximity (between 25 and 50 kilometres from NTZs)

Blue Ventures Conservation Report
Socio-economic Monitoring: A baseline assessment of the fishing villages of the Kirindy-Mite MPA Page 12
(iii) Far proximity (greater than 50 kilometres from NTZs) (iv) Island populations (located within the MPA, and whose temporary settlements will be displaced)
A power analysis using R version 2.9.1 statistical software determined that a sample size of 75 for each of these four categories would be adequate to expose the desired level of definition in results. Villages and corresponding sample sizes selected for surveying were as follows: Close proximity:
· Andranopasy (50) · Antseranandaka (10) · Eleo (7) · Ankoba South (8)
Intermediate proximity:
· Antanimanimbo (25) · Belo-sur-Mer (50)
Far proximity:
· Ankevo-sur-Mer (30) · Belagnora (10) · Nosinihita (5) · Begamela (15) · Andika-sur-Mer (15)
Islands:
· Nosy Andriamitaroke (50) · Nosy Be (25)
Random sampling strategy Village maps were created for villages selected for surveying, and fishing households were sequentially numbered, as well as assigned a random number between 1 and 100 (generated by Microsoft Excel). The proportion of households in the village to be surveyed was determined, and any fishing household whose randomly assigned number fell within this proportion was selected for surveying. For example, in a village of 60 households, with a sample size of 20, any households receiving a random number between 0 and 34 (20/60=0.33) would be surveyed.
Household number Random number Survey (yes/no) 41 87 No
42 14 Yes
43 62 No
The households selected for surveying were then approached and asked if they would be willing to take part in the survey. In the event that they declined, or that the household was absent from the village at the time of surveying, they were replaced with the next household on the list with a corresponding randomised number within the sampling range.

Blue Ventures Conservation Report
Socio-economic Monitoring: A baseline assessment of the fishing villages of the Kirindy-Mite MPA Page 13
2.3 Research methods Literature Review Due to BV’s on-going involvement in the KMT MPA project, and the principal investigator’s permanent employment by the project, a literature review was not conducted during a discrete time period, but rather was an on-going iterative process as more relevant documents and information regarding the project area became available. Village maps Maps of each of the surveyed villages were created in order to take an inventory of existing social infrastructure (such as wells, shops, bars, etc...), as well as to determine the survey sample (as described in section 2.2). Village maps were created with the village president, or a member of the community delegated by the president in the event that he could not accompany the survey team. Construction material for all houses was recorded, as well as the location of distinct households, and whether or not the households engaged in fishing activities. Resource use maps In addition to village maps, resource use maps were also created with the village president in order to gain a general understanding of what fishing activities existed in the village to be surveyed, where and when these activities generally occurred, and where fishing grounds overlapped with those of adjacent villages. Google Earth imagery was used to aid in creation of resource use maps by providing geographically accurate reference points/landmarks. Resource use mapping activities for this assessment were complementary to previous fishing site mapping activities which had been undertaken through the course of ecological surveying. Community Leader Interviews (CL) Community leader interviews were conducted with the fokontany president, in the event that the village to be surveyed was a fokontany proper, and with the “chef du village”, in the event that the village to be surveyed was a separate settlement of an existing fokontany. While it is possible for women to be elected as president of fokontany or delegated as chef du village, the practice is not common in rural Madagascar, and no female presidents or chef du village were encountered during the surveying. Community leader interviews were conducted in a semi-structured format, with mostly open-ended questioning, and were integrated with the creation of the resource use map. Best efforts were made to conduct these interviews with only the selected community leader in order to minimise the influence of others on answers to questions, however on several occasions passers-by and/or family members of the community leader eavesdropped or actively participated in the mapping exercises. It was deemed too disruptive to activities to ask these individuals to leave, but they were reminded by the survey team that the selected community leader was to answer all questions. Household Head Interviews (HHI) 225 household head interviews were conducted and lasted an average of 31 minutes. HHIs covered the topics of household specific resource use patterns, estimates of effort and catch, perceptions of resources, environmental awareness, perception of effectiveness of management strategies, and awareness of MPA rules and regulations. Questions were a mixture of close and open-ended questions, with responses to open-ended questions being sorted by the surveyor into pre-determined categories or being recorded as “other” in the event that they did not fit into a pre-determined category. This strategy was implemented to ease data analysis and allow for the statistical quantification of responses. In rural Madagascar, most households are based around a male leader who generally separates from his parents in his late teens or early twenties, builds a house and soon thereafter takes a wife and starts a family. Households may also include children whose parents have either passed away or are absent for long periods of time. Therefore, 99% (222/225) of HHIs were conducted with men, as women-led households are still a relative rarity in rural Madagascar. For the purposes of this assessment, a “household” was defined as those people who live and share meals together. Significant dependence may still exist between households, such as the use of shared fishing gears, and, indeed,

Blue Ventures Conservation Report
Socio-economic Monitoring: A baseline assessment of the fishing villages of the Kirindy-Mite MPA Page 14
some fishing activities such as the use of jarifa shark nets and diving for sea cucumbers are conducted in teams, often combining members of various households. Household Survey (HS) 225 household surveys were carried out and lasted an average of 18 minutes. Household surveys were paired with household head interviews, and 64% (143/225) were conducted with an older female member of the household, usually the spouse of the household head. Household surveys focused on household demographics, levels of education, sources of income and material style of life. Observation The use of observation was on-going throughout the socio-economic assessment, and was specifically employed to gain a better understanding of resource use patterns, access to markets and social dimensions that community members may either take for granted, or be hesitant to discuss openly. Key Informant Interviews Three formal key informant interviews were carried out during the socio-economic assessment, in order to gain a stronger understanding of project history, long-term goals, management capacity and institutional support for the MPA. Interviewees included the following list of people:
· (1) Kirindy-Mite Marine Park “Chef de Volet” (« Team leader ») · (2) KMT Marine Park field agents
Owing to the nature of the MNP/Blue Ventures partnership and BV’s permanent presence in Belo-sur-Mer, communications with MNP staff, as well as members of the fishing community were on-going prior to and throughout the assessment. Surveying team Surveyors for the socio-economic assessment were recruited locally in Belo-sur-Mer and trained in socio-economic surveying techniques. All surveyors spoke the Vezo dialect fluently and were familiar with the fishing lifestyle and vernacular. Five of the six surveyors were, in fact, fishers themselves or had previously helped in fishing teams. Additionally, some community leader interviews and household head interviews were conducted by the principal investigator, an expatriate who has worked with Vezo fishing communities for years and speaks the Vezo dialect fluently. Field based data collection was conducted over a period of three months from February through April of 2011. 2.4 Challenges/Limitations/Sources of error Rural Madagascar, and especially the villages of the study site, remains extremely isolated and is characterized by very limited exposure to and general mistrust of foreigners (be they fellow Malagasy who are identified as outsiders of the area, or expatriates such as the principal investigator). While European colonization from 1896-1960 certainly contributes to this mistrust, it has its origins as far back as the 1700s, when teams dispatched by regional kings to collect taxes and conscribe labourers were sent to discern family trees and assess assets (Astuti 1995, pg. 73). This, combined with low levels of literacy and formal education, results in a general reluctance on the part of rural fishermen to take part in surveys, as well as a noticeable discomfort with their answers to questions being recorded on paper. The expansion of conservation activities by governmental and non-governmental agencies in recent decades also serves as a potential source of error in participants’ responses. Many of these conservation efforts have been perceived by local communities as restricting access to resources and constraining livelihood strategies, and therefore not in their best interest. Indeed, many anecdotal reports of feelings of deception on the part of the local

Blue Ventures Conservation Report
Socio-economic Monitoring: A baseline assessment of the fishing villages of the Kirindy-Mite MPA Page 15
community regarding the establishment of the Kirindy-Mite terrestrial park were expressed throughout the course of this socio-economic assessment. While it is not within the remit of this study to determine the source or validity of these claims, it is important to consider that Blue Ventures’ status as a conservation NGO as well as its association with MNP may have brought with it certain preconceived notions as to the nature of surveying within surveyed communities. In order to minimize the effects of these sources of error, particular attention was paid to explaining to communities the purpose of socio-economic surveying, what surveying results would be used for, and the confidentiality of their responses. The village leader of each surveyed village was approached upon arrival of the survey team, and village meetings were held prior to surveying in order to explain the aforementioned points to the communities. Additionally, village leaders were employed as local guides for mapping activities in order to further familiarise villagers with the survey team and ease concerns regarding participation in surveying. All requests for gifts by interviewees were politely declined. Community leaders, who made a significant investment of time in helping with village mapping and resource mapping exercises, were compensated with a modest per diem of 3,000 ariary (≈1.5USD). Questionnaires and interview guides were created in English and then translated into the Vezo dialect of Malagasy, with responses being translated back into English for data analysis and reporting. Phrasing of questions was trialled with Vezo fishermen in order to ensure that translations retained the original question’s intent as much as possible. All data collection was conducted in Vezo, and responses were translated back into English by the principal investigator with the aid of the surveyors. Despite the principal investigators fluency in the Vezo dialect, there still exist language and cultural barriers which make exact translations of questions difficult. Additionally, the Likert scale format of some questions was abstract and difficult to comprehend for some respondents, and surveyors were given a certain degree of freedom to rephrase questions, with efforts being made to not lead/bias answers. In order to minimise error introduced by rephrasing and further changes in the interpretation of questions’ meaning, surveyors were trained extensively, by the principle surveyor, on posing open-ended questions, and not leading answers while also repeatedly reviewing the intent of questions prior to the start of surveying.

Blue Ventures Conservation Report
Socio-economic Monitoring: A baseline assessment of the fishing villages of the Kirindy-Mite MPA Page 16
3. Results 3.1 Community demographics Table 3 below shows the number of households identified by mapping activities carried out in each of the surveyed villages. In the 225 households surveyed, 1,026 individuals were listed, giving an average household size of 4.6 ±0.14 people. When extrapolated for total number of households identified, a striking difference is seen compared to population statistics available from secondary sources, suggesting that the study site’s population may have previously been considerably underestimated. Table 3 Estimated difference in population: households observed vs. secondary source
Village Households Estimated Population Existing population data (Raharison 2010)
Difference
Andranopasy 632 2907 2112 +795 Ankoba south 43 198 104 +94 Antsaranandaka 42 193 96 +97 Eleo 31 143 96 +47 Antanimanimbo 57 262 215 +47 Belo-sur-Mer 564 2594 1733 +861 Ankevo-sur-Mer 141 649 235 +414 Belagnora (incl. Nosinihita) 37 170 116 +54 Begamela 67 308 210 +98 Andika-sur-Mer 93 428 210 +218 Total (surveyed villages) 1707 7972 5127 +2725 One trend that emerged throughout data collection, which persistently confounded the sampling strategy, was the high mobility of fishing populations throughout the area. The larger village, and commune head, of Andranopasy is a primary example of this. Many fishing families spend most of the year in the tiny surrounding villages (such as Ankalapoaky, Lohabao, and Ampasilava), living in very basic housing, in order to improve access to productive fishing grounds. During the cyclone season (Dec-March), they mostly return to Andranopasy where they have their more permanent settlements. This high fluidity in settlement patterns is quite characteristic of Vezo fishing communities throughout the study area, and was found in other villages surveyed. Populations of fishers living on the islands also exhibit a high level of fluidity, and can change dramatically from week to week in the event that a more productive fishing ground is discovered. Independent of this study, Blue Ventures has been conducting a monthly census on the islands, as well as collecting data on levels of shark and turtle capture since 2009. Figure 3 below displays populations on the islands month by month for 2010. The months of December through March represent the annual cyclone season, when living on the island is generally considered unsafe, and most fishers return home for a few months to celebrate the Christmas and New Year holidays. As can be seen from this graph, the southernmost island, Andriamitaroke, is the most heavily populated, followed by the middle island, Nosy Be, with Andravoho, which is little more than a sand bar, void of vegetation and prone to submersion at the highest annual spring tides, being the least populated.

Blue Ventures Conservation Report
Socio-economic Monitoring: A baseline assessment of the fishing villages of the Kirindy-Mite MPA Page 17
Figure 3 Populations of migrant fishers on islands by month, 2010
Figure 4 shows percent distribution by origin of fishers living on the islands throughout 2010.
Figure 4 Distribution of commune of origin of migrant fishers by month, 2010
It is apparent from this figure that the majority (81.4%) of fishers living on the islands come from the southern communes of Befandefa and Morombe. A census taken in October of 1996 found 135 people camping on the island of Andriamitaroke (Iida 2005). Compared with the 326 who were found on the same island in October 2010, it is also apparent that this migration of traditional fishermen has experienced a substantial augmentation over the past 15 years. During the course of conducting this socio-economic assessment, a ban on settlement of the islands came into effect, resulting in a fracturing of the island populations, with some migrant fishermen returning to their home villages, some moving further north to the Barren Isles, and the rest dispersing throughout the coastal villages. It was thus not possible to complete surveying intended for populations of migrant fishers.
0
100
200
300
400
500
Jan Feb Mar Apr May Jun Jul Aug Sep Oct Nov Dec
# of
peo
ple
2010
Andravoho Andriamitaroke Nosy be
0%10%20%30%40%50%60%70%80%90%
100%
2010
Other
Morondava
Belo sur mer
Andranopasy
Manombo
Morombe
Befandefa

Blue Ventures Conservation Report
Socio-economic Monitoring: A baseline assessment of the fishing villages of the Kirindy-Mite MPA Page 18
Age structure Of the 1,026 individuals identified in household surveys the average age was 20.8 years, and 51% were under the age of 18. Figure 5 below shows the breakdown of age classes for each village, with 65.8% of the population falling into the 0-25 year-old classes. This pyramidal age structure is typical of coastal villages in Madagascar where birth rates are high (Gough et al. 2009, Cinner 2006, Epps 2008). Figure 5 Age structure in surveyed villages
3.1.2 Formal education Respondents to household surveys were asked to indicate the highest level of formal education that all members of their household had attained. These levels were then translated into “years of formal education” with each subsequent level obtained corresponding to one “year”. This ranking of years of formal education does not, therefore, reflect total years spent in school, as certain levels may have been repeated multiple times before progressing to the next. Table 4 below shows the average years of formal education for: (1) All respondents, (2) Respondents above the age of 18, and (3) The percentage of respondents above the age of 6 (the age at which children enter school) who have never had a formal education. Table 4 Formal education in surveyed villages
Village Avg. years formal education (all)
Avg. years formal education (≥18)
% with no formal education (>6)
Nosinihita 2.1 3.2 7.7% Belo-sur-Mer 3.8 5.2 9.6% Andranopasy 2.2 3.2 19.3% Andika-sur-Mer 1.9 2.6 27.1% Ankevo-sur-Mer 2.5 3.2 31.1% Ankoba south 2.6 3.2 35.0% Eleo 1.8 3.6 43.8% Antanimanimbo 1.5 2.1 43.8% Antsaranandaka 1.4 2.3 51.5% Begamela 0.9 1.6 51.9% Belagnora 1.7 3.5 58.8% Total 2.4 3.4 27.4%
0%10%20%30%40%50%60%70%80%90%
100%
>50
26-50
16-25
0-15

Blue Ventures Conservation Report
Socio-economic Monitoring: A baseline assessment of the fishing villages of the Kirindy-Mite MPA Page 19
These results show that a higher percentage of people have entered the formal education system in the population centres of Belo-sur-Mer and Andranopasy. While Nosinihita had the lowest percentage of people who had no formal education, the sample size of five households was very small, and thus prone to error. In general, people throughout the study area have a very low level of formal education, with an area-wide average of 3.4 years of formal education per adult. Of the 1,026 people listed in household surveys, only 20 (1.9%) were identified as being able to speak French, and not a single person was said to be able to speak English, again indicating a low level of formal education and very low levels of contact with outsiders and/or tourists. 3.2 Community infrastructure and business Table 5 Community infrastructure and business in surveyed villages
Village Water points Epicerie/Bar Snack stands Hotels/restaurants Andranopasy 41 9 6 3 Ankoba south 1 0 0 0 Antsaranandaka 2 0 0 0 Eleo 1 2 2 0 Antanimanimbo 4 4 4 0 Belo-sur-Mer 36 17 17 10 Ankevo-sur-Mer 3 3 2 1 Belagnora (incl. Nosinihita) 1 4 0 0 Begamela 1 4 3 0 Andika-sur-Mer 2 4 1 0 Total 92 47 35 14 A census of existing social infrastructure, including schools, hospitals and access to mobile phone networks was taken in 2009, the results of which have been published by KilyBe (Raharison 2009). This study counted the number of water points, small stores/bars, snack stands, and hotels/restaurants in the surveyed villages (Table 5). 3.3 Livelihoods Community maps were created in order to identify fishing households as well as aid the randomised sampling of these households. A household was considered as a “fishing” household if it engaged in any sort of marine resource harvesting. Across all surveyed villages, 36.8% of households were reported to engage in fishing. In eight of the nine smaller villages surveyed, 100% of households participated in fishing activities. The lone exception to this trend was Ankevo-sur-Mer (88.7%), where 16 of the 141 observed households were reported to not engage in any harvesting of marine resources. The larger commune heads of Andranopasy and Belo-sur-Mer showed more diversified livelihood strategies, with only 9.0% and 13.7%, respectively, of households being identified as fishing households. Andranopasy is a coastal village, but is closer to land suitable for agriculture, and thus agriculture has a larger contribution to the local economy. Belo-sur-Mer also benefits from the fact that it is the epicentre of boutry (large schooners used for the transport of goods and people) construction for the west coast of Madagascar and has in the past fifteen years become a minor tourist destination, both contributing appreciably to the local economy. The inclusion of the two large villages of Belo-sur-Mer and Andranopasy, where livelihood strategies are most diversified, risks underestimating the true proportion of fishing households throughout the study site. Indeed, the nine other villages not included in surveying are reported by key informants to be of a similar character to the eight small surveyed villages, with 100% of households engaging in harvesting of marine resources.

Blue Ventures Conservation Report
Socio-economic Monitoring: A baseline assessment of the fishing villages of the Kirindy-Mite MPA Page 20
Community maps created for this assessment found that, on average, villages had 68% more households than reported in the 2009 KilyBe study (Raharison 2010). In order to get a more accurate estimate of total percentage of households dependent upon fishing across the entire study site, the number of households in unsurveyed villages is estimated by adjusting the existing secondary data by this average difference. The results of this calculation are shown below in Table 6. Table 6 Estimate of fishing households across study site
Village Total Households Observed Fishing households % Andranopasy 632 57 9.0% Ankoba south 43 43 100% Antsaranandaka 42 42 100% Eleo 31 31 100% Antanimanimbo 57 57 100% Belo-sur-Mer 564 77 13.7% Ankevo-sur-Mer 141 125 88.7% Belagnora (incl. Nosinihita) 37 37 100% Begamela 67 67 100% Andika-sur-Mer 93 93 100% Unsurveyed villages Est. Households Est. Fishing households % Marohata 49 49 100% Ambalahonko 40 40 100% Ampasilava 19 19 100% Ankalapoaky 64 64 100% Manahy an-driake 25 25 100% Menaky 37 37 100% Ankaotelo 34 34 100% Antagnanabo N/A N/A 100% Belalanda/Marovitike 12 12 100% Total (surveyed villages) 1707 629 36.8% Est. Total (all villages) 2056 978 47.6% With an average household size of 4.6 ±0.14 people, it is therefore estimated that the coastal villages of the Kirindy-Mite area are home to just over 9,400 people, approximately half of which depend upon fishing for their daily survival. It is also important to take into account the populations of migrant fishers discussed in section 3.1. At the peak of the migration in August 2010, a total of 724 individuals were counted on the three islands. These families are completely dependent upon fishing, and thus push the total number of people dependent on fishing in the Kirindy-Mite area to a figure in excess of 5,000. Diversification of livelihoods Of the fishing households surveyed, respondents were asked to list all of the income-generating activities that the household participates in, and rank their relative importance. As shown in Figure 6 below, fishing was indicated as the primary livelihood strategy for 100% of fishing households in eight of the eleven surveyed villages, and 86.7%, 90.0% and 92.0% for the villages of Ankevo-sur-Mer, Belo-sur-Mer, and Antanimanimbo respectively.

Blue Ventures Conservation Report
Socio-economic Monitoring: A baseline assessment of the fishing villages of the Kirindy-Mite MPA Page 21
Figure 6 Primary livelihood strategies of "fishing" households
Activities were classified as either “marine-resource dependent” or “non-marine resource dependent”. An example of a “marine-resource dependent” activity other than fishing would be the collection of fish or other products for sale in local or regional markets. An example of “non-marine resource dependent” activities would be mat weaving, snack/coffee sales or sales of dry goods. This is an over simplification of local economies for reasons of data analysis, as in reality sales of snacks and dry goods in fishing villages will be directly related to successful returns on fishing activities. Figure 7 below shows a village by village breakdown of number of “non-marine resource dependent” activities per household. As shown in this figure, a large proportion (59.6% across surveyed villages) of households are completely dependent on marine resources for their daily survival.
Figure 7 # of non-marine resource dependant activities in fishing households
0%10%20%30%40%50%60%70%80%90%
100%
Fishing Farming Sales Fish sales Boutry Handicrafts
0%10%20%30%40%50%60%70%80%90%
100%
Andr
anop
asy
Anko
ba
Ants
aran
anda
ka
Eleo
Anta
nim
anim
bo
Belo
-sur
-Mer
Andi
ka
Anke
vo
Bega
mel
a
Bela
gnor
a
Nos
inih
ita
Near Mid Far
# of non-marine resource dependant activities0 1 2 3

Blue Ventures Conservation Report
Socio-economic Monitoring: A baseline assessment of the fishing villages of the Kirindy-Mite MPA Page 22
Finally, household heads were posed with the statement “If you were not able to fish anymore, you could do other work to support yourself” and asked to respond saying they “strongly agree”, “slightly agree”, “slightly disagree”, “strongly disagree” with the statement or that they “don’t know”. Responses showed a low perception of adaptability on the part of fishing communities (Figure 8) with a total of 63% disagreeing with this statement either strongly or slightly. Figure 8 Responses to "If you weren't able to fish, you could do other work to support yourself"
In summary, the 47.6% of households in the Kirindy-Mite area engaging in fishing activities exhibit an excessively high dependence on fishing as their primary livelihood strategy, and show very little diversification of activities or perceived ability to adapt in the case of a fishery collapse. 3.4 Material Style of Life (MSL) Obtaining trustworthy household income/expenditure data via door-to-door surveying can prove both obtrusive and difficult, and was deemed inappropriate for the purposes of this assessment. Material Style of Life (MSL) can be useful in obtaining a snapshot, as well as monitoring over time, the relative wealth of communities (Pomeroy 2004). Respondents to household surveys were asked if they possessed a list of commonly owned household items, animals and fishing gears. Additionally, construction material of houses was observed and noted by surveyors. Tables 7 and 8 show the results on a village by village basis for MSL. Table 7 Material style of life: House construction materials
Strongly agree28%
Slightly agree
9%
Slightly disagree
4%
Strongly disagree
59%
Andika A/pasy Ankevo Ankoba A/nimbo A/daka Begamela Belagnora Belo Eleo Nosinihita Total Roof Thatch 100.0 84.0 96.7 100.0 96.0 90.0 93.3 100.0 72.0 100.0 80.0 88.0
Sheet metal 0.0 14.0 3.3 0.0 0.0 0.0 0.0 0.0 26.0 0.0 0.0 9.3
Tree bark 0.0 2.0 0.0 0.0 4.0 0.0 6.7 0.0 0.0 0.0 20.0 1.8
Tarpaulin 0.0 0.0 0.0 0.0 0.0 10.0 0.0 0.0 2.0 0.0 0.0 0.9
Wall Thatch 100.0 78.0 83.3 100.0 96.0 90.0 66.7 90.0 44.0 100.0 80.0 76.4

Blue Ventures Conservation Report
Socio-economic Monitoring: A baseline assessment of the fishing villages of the Kirindy-Mite MPA Page 23
Table 8 Material Style of Life: Possessions and animal raising
Andika A/pasy Ankevo Ankoba A/nimbo A/daka B/mela B/nora Belo Eleo N/nihita Total
Possessions Table 66.7 86.0 93.3 50.0 64.0 50.0 86.7 60.0 98.0 42.9 80.0 80.4
Bed 53.3 70.0 76.7 37.5 36.0 30.0 80.0 50.0 100.0 28.6 60.0 68.0
Suitcase 40.0 68.0 63.3 50.0 60.0 60.0 73.3 50.0 88.0 28.6 60.0 66.2 Foam mattress 53.3 56.0 73.3 37.5 40.0 30.0 100.0 60.0 88.0 14.3 20.0 62.7
Radio 66.7 48.0 36.7 26.7 56.0 40.0 53.3 60.0 68.0 71.4 40.0 54.2 Mobile phone 13.3 4.0 33.3 6.7 28.0 0.0 0.0 20.0 72.0 14.3 0.0 27.1 Wooden chair 13.3 28.0 26.7 0.0 12.0 10.0 13.3 10.0 54.0 0.0 0.0 25.8
Plastic chair 6.7 22.0 23.3 0.0 16.0 10.0 33.3 20.0 48.0 0.0 0.0 24.4
Generator 0.0 2.0 3.3 0.0 24.0 10.0 0.0 0.0 14.0 0.0 0.0 7.1
Television 0.0 2.0 3.3 0.0 24.0 10.0 0.0 0.0 12.0 0.0 0.0 6.7
Video player 0.0 2.0 0.0 0.0 24.0 10.0 0.0 0.0 14.0 0.0 0.0 6.7
Salon chair 0.0 2.0 3.3 0.0 4.0 0.0 0.0 0.0 10.0 0.0 0.0 3.6
Solar panel 0.0 0.0 0.0 0.0 4.0 0.0 0.0 0.0 0.0 0.0 0.0 0.4
Outhouse 0.0 0.0 0.0 0.0 0.0 0.0 0.0 0.0 2.0 0.0 0.0 0.4
Animals Chicken 53.3 54.0 56.7 37.5 56.0 50.0 80.0 60.0 54.0 28.6 80.0 55.6 Other poultry 26.7 28.0 36.7 37.5 20.0 10.0 46.7 40.0 56.0 28.6 80.0 36.9
Pig 13.3 22.0 26.7 0.0 0.0 30.0 0.0 0.0 18.0 0.0 0.0 14.7
Goat 20.0 6.0 20.0 25.0 24.0 0.0 26.7 20.0 6.0 0.0 0.0 12.9
Cow 0.0 2.0 16.7 12.5 8.0 0.0 13.3 0.0 6.0 0.0 0.0 6.2 It is apparent from this MSL data that households throughout the Kirindy-Mite area possess very little material wealth. A large majority of house roofs and walls (84% and 76.4%, respectively) are constructed from locally available
Planks 0.0 16.0 16.7 0.0 4.0 0.0 33.3 10.0 54.0 0.0 20.0 21.3
Mud 0.0 6.0 0.0 0.0 0.0 0.0 0.0 0.0 0.0 0.0 0.0 1.3
No wall 0.0 0.0 0.0 0.0 0.0 10.0 0.0 0.0 0.0 0.0 0.0 0.4
Sheet metal 0.0 0.0 0.0 0.0 0.0 0.0 0.0 0.0 2.0 0.0 0.0 0.4
Floor Woven mat 73.3 72.0 70.0 87.5 84.0 90.0 60.0 70.0 52.0 71.4 20.0 68.0
Sand 26.7 16.0 16.7 0.0 8.0 10.0 0.0 20.0 6.0 28.6 60.0 13.3
Planks 0.0 8.0 6.7 0.0 4.0 0.0 33.3 10.0 14.0 0.0 0.0 8.9
Cement 0.0 4.0 3.3 0.0 0.0 0.0 6.7 0.0 18.0 0.0 20.0 6.2
Tarpaulin 0.0 0.0 3.3 0.0 0.0 0.0 0.0 0.0 8.0 0.0 0.0 2.2
Balatome 0.0 0.0 0.0 12.5 4.0 0.0 0.0 0.0 2.0 0.0 0.0 1.3

Blue Ventures Conservation Report
Socio-economic Monitoring: A baseline assessment of the fishing villages of the Kirindy-Mite MPA Page 24
materials such as reeds and palm leaves which are made into thatch, and an equally large proportion of houses either have no floor (13.3%) or a mat floor woven out of the same locally available materials (68%). Table 9 below puts these results into a regional context by comparing with common indicators of wealth from a socio-economic assessment conducted throughout traditional fishing communities in northern Kenya in 2006 (Cinner 2006). Table 9 Material Style of Life comparison to northern Kenya
Kirindy-Mite, W Madagascar Northern Kenya (Cinner 2006) Item Cement floor 6.2% 33.7% Metal roof 9.3% 23.5% Radio 54.2% 61.7% Electricity (incl. generator and/or solar panel) 7.5% 12.0%
Television 6.7% 7.4% Outhouse 0.4% 75.5% Comparison of these indicators of wealth would suggest that the traditional fishing communities of the Kirindy-Mite region are generally less well-off than their Kenyan counterparts. This is most apparent in terms of household construction materials. It is important to note that the lack of outhouses, and its implications for public health, is likely more related to social customs as opposed to a lack of economic means to construct one. Anecdotally, members of the community have expressed that it is both disrespectful to put human excrement in the same place as the ancestors (i.e. underground), as well as a general feeling of disgust at the thought of collecting human waste in one area in proximity to their homes. Fishing gear Household survey respondents were prompted as to their ownership of a list of common fishing gears, as well as the number owned. In order to standardise the quantification of monofilament nets, each 100m section of net was recorded as one “net”. Therefore, someone owning three 100m sections of 25mm net and four 100m sections of 30mm net was recorded as owning seven “nets”, as these sections could theoretically be assembled in any combination of lengths, or used independently. Table 10 below shows the percentage of respondents by village, grouped by section, who own certain gears, as well as the average total length of net owned per household, expressed in metres.

Blue Ventures Conservation Report
Socio-economic Monitoring: A baseline assessment of the fishing villages of the Kirindy-Mite MPA Page 25
Table 10 Fishing gear ownership
Near Mid Far
A/pasy Ankoba A/daka Eleo A/nimbo Belo Andika Ankevo Begamela Belagnora N/nihita Total Net % owning 84.0% 62.5% 90.0% 28.6% 92.0% 80.0% 93.3% 70.0% 86.7% 100.0% 80.0% 81.3% Avg. length (m) 308 640 356 250 330 421 300 243 300 375 300 341
Hook/line 42.0% 50.0% 70.0% 85.7% 76.0% 42.0% 60.0% 83.3% 100.0% 80.0% 80.0% 61.8%
Sasy 86.0% 75.0% 80.0% 42.9% 72.0% 72.0% 93.3% 96.7% 100.0% 100.0% 100.0% 83.1%
Spear 70.0% 62.5% 80.0% 57.1% 80.0% 88.0% 73.3% 73.3% 73.3% 70.0% 80.0% 76.0% Spear gun 4.0% 12.5% 30.0% 0.0% 12.0% 30.0% 0.0% 20.0% 0.0% 0.0% 0.0% 13.3%
ZDZD 6.0% 25.0% 20.0% 14.3% 28.0% 26.0% 0.0% 10.0% 6.7% 10.0% 40.0% 15.6%
Jarifa 12.0% 37.5% 60.0% 57.1% 16.0% 26.0% 0.0% 20.0% 13.3% 10.0% 0.0% 20.0%
Long line 10.0% 12.5% 20.0% 0.0% 0.0% 2.0% 13.3% 6.7% 20.0% 0.0% 0.0% 7.1% Sailing Pirogue 42.0% 50.0% 90.0% 57.1% 52.0% 46.0% 26.7% 80.0% 73.3% 40.0% 20.0% 52.4%
Molanga 80.0% 62.5% 80.0% 57.1% 96.0% 84.0% 93.3% 33.3% 80.0% 100.0% 100.0% 77.3% The most commonly owned fishing gear (83.1%) is the “sasy”, a small-mesh net used largely to catch small-bodied seasonal migratory species. This activity is discussed in more detail in section 3.5. Next is the monofilament net, with 81.3% of households owning at least one 100m section of this gear. The average length of net owned by a single household across all sites was 341 ±14.7 meters. This is simply an average, not an actual net size, which indicates that households generally own between 300 to 400 metres of net. The largest amount owned by a single household was 1,000 meters (three households). As mentioned previously, mesh size of these nets ranges from 10-50mm. However, as seen in Figures 9 and 10 below, the 15 and 20mm sizes are by far the most commonly employed across all sites.

Blue Ventures Conservation Report
Socio-economic Monitoring: A baseline assessment of the fishing villages of the Kirindy-Mite MPA Page 26
Figure 9 Distribution of net mesh size (mm), all sites
Figure 10 Distribution of net mesh size (mm) by section
Spears as well as hook and line were also commonly owned gears (76.0% and 61.8%, respectively). Gears more effective at catching high value species such as long-lines (palangre), as well as ZDZD and jarifa shark nets had lower levels of ownership (7.1%, 15.6%, and 20.0%, respectively) likely reflecting their higher price, as well as difficulty of implementation, as they must be deployed farther off-shore. Fishing activities take place from dugout canoes, constructed from farafatse (Givotia madagascariensis), a soft-bodied tree endemic to the dry forests of western Madagascar. Some of these dugout canoes (lakana) are fitted with outriggers and masts for sailing, in order to increase stability on rougher seas and improve access to more distant fishing grounds. Only about half of households surveyed (52.4%) reported owning a lakana. Conversely, 77.3% of households reported owning a molanga, a smaller dugout canoe without an outrigger, reflecting the heavy dependence on the near-shore fishery, and relative inability to spread fishing pressure to off-shore fishing grounds.
0
50
100
150
200
250
300
350
# of
net
s
Mesh size (mm)10 15 20 25
0
20
40
60
80
100
120
140
160
Near Mid Far
# of
net
s
Mesh size (mm)10 15 20 25 30 40 50

Blue Ventures Conservation Report
Socio-economic Monitoring: A baseline assessment of the fishing villages of the Kirindy-Mite MPA Page 27
This is in stark contrast to the Vezo fishing communities of the Velondriake area, 200km south, where molanga are not used. None of the households surveyed owned an outboard motor, or used motorized vessels of any sort. 3.5 Resource use patterns Household Heads were asked to list all of the fishing activities they partake in, as well as to estimate average daily returns, in kilograms, and average effort, in days/month, for all activities. Many activities exhibit a certain degree of seasonality depending on availability of target species and accessibility to fishing grounds. Responses were, therefore, split into three distinct seasons:
· “Faosa”- corresponding roughly to the spring months of September through November. · “Asara”- corresponding to the summer months of December through April. · “Asotry”- corresponding to the colder winter months of May through August.
The traditional fishery in the Kirindy-Mite area is a multi-species fishery exhibiting a variety of low-technology gears. A large majority (78%) of fishers interviewed identified use of monofilament nets, hook and line, or a combination of both, as their primary fishing activity. Mesh sizes of nets employed range from 10-40mm, and the length of nets generally varies from 100-700 meters. As mentioned previously, nets are sewn together in 100m segments, and a single net often includes various mesh sizes throughout its length. Malagasy fisheries law requires a minimum mesh-size of 25mm when targeting finfish, with exceptions for small-mesh nets being made only for certain small-bodied pelagic species such as anchovy, and does not currently place any limit on the length of nets employed by traditional fishermen (MAEP 2005). At the time of surveying, enforcement of this law in rural Madagascar was essentially non-existent. Additional primary activities include the use of large-mesh nets, “ZDZD” and “jarifa”, (11%) targeting primarily sharks, guitarfish and larger pelagic species; free-diving for fish and sea cucumbers (6%) using either spears or spear-guns; crab harvesting (4%); and the use of sasy (1%), a small-mesh net of 6-8 meters in length, employed from the shoreline and used to catch small, seasonal species such as patsa (Acetes eurythraeus) and sardines. Figure 11 shows the distribution of primary fishing activities over the entire study area. Figure 11 Primary fishing activities, all surveyed villages
Net/line/combo79%
Crab3%
Sasy1%
Diving6%
ZDZD/Jarifa11%
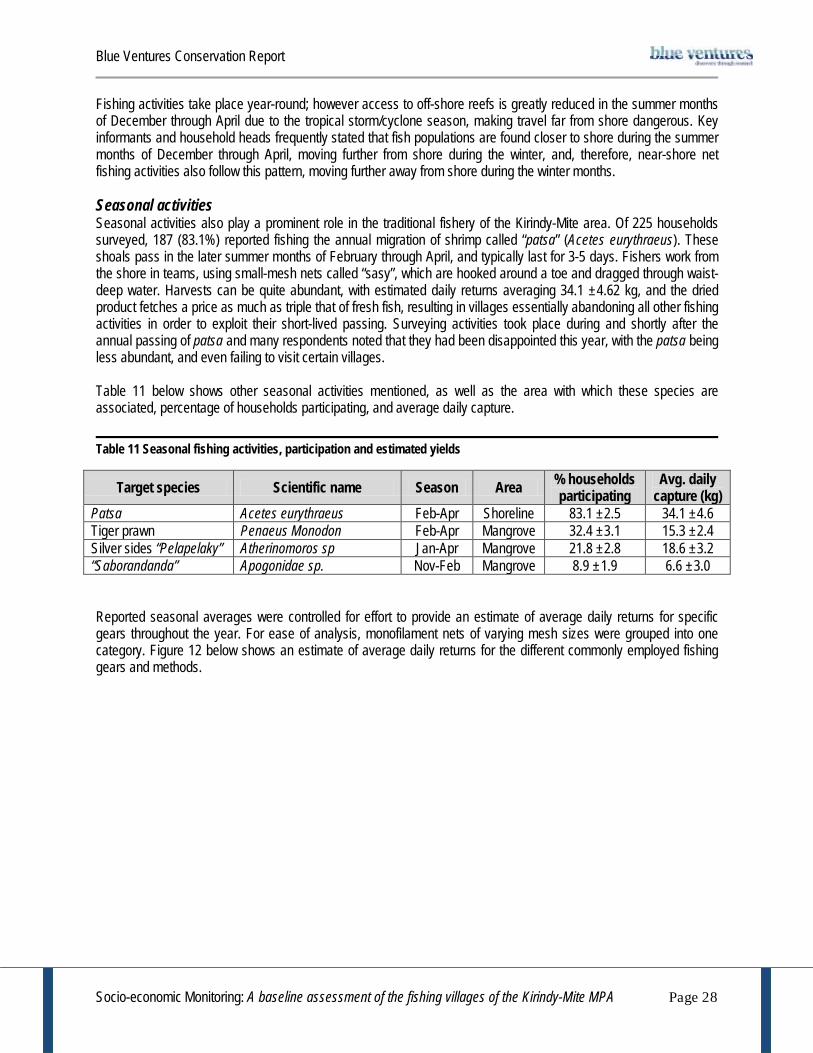
Blue Ventures Conservation Report
Socio-economic Monitoring: A baseline assessment of the fishing villages of the Kirindy-Mite MPA Page 28
Fishing activities take place year-round; however access to off-shore reefs is greatly reduced in the summer months of December through April due to the tropical storm/cyclone season, making travel far from shore dangerous. Key informants and household heads frequently stated that fish populations are found closer to shore during the summer months of December through April, moving further from shore during the winter, and, therefore, near-shore net fishing activities also follow this pattern, moving further away from shore during the winter months. Seasonal activities Seasonal activities also play a prominent role in the traditional fishery of the Kirindy-Mite area. Of 225 households surveyed, 187 (83.1%) reported fishing the annual migration of shrimp called “patsa” (Acetes eurythraeus). These shoals pass in the later summer months of February through April, and typically last for 3-5 days. Fishers work from the shore in teams, using small-mesh nets called “sasy”, which are hooked around a toe and dragged through waist-deep water. Harvests can be quite abundant, with estimated daily returns averaging 34.1 ±4.62 kg, and the dried product fetches a price as much as triple that of fresh fish, resulting in villages essentially abandoning all other fishing activities in order to exploit their short-lived passing. Surveying activities took place during and shortly after the annual passing of patsa and many respondents noted that they had been disappointed this year, with the patsa being less abundant, and even failing to visit certain villages. Table 11 below shows other seasonal activities mentioned, as well as the area with which these species are associated, percentage of households participating, and average daily capture. Table 11 Seasonal fishing activities, participation and estimated yields
Target species Scientific name Season Area % households participating
Avg. daily capture (kg)
Patsa Acetes eurythraeus Feb-Apr Shoreline 83.1 ±2.5 34.1 ±4.6 Tiger prawn Penaeus Monodon Feb-Apr Mangrove 32.4 ±3.1 15.3 ±2.4 Silver sides “Pelapelaky” Atherinomoros sp Jan-Apr Mangrove 21.8 ±2.8 18.6 ±3.2 “Saborandanda” Apogonidae sp. Nov-Feb Mangrove 8.9 ±1.9 6.6 ±3.0 Reported seasonal averages were controlled for effort to provide an estimate of average daily returns for specific gears throughout the year. For ease of analysis, monofilament nets of varying mesh sizes were grouped into one category. Figure 12 below shows an estimate of average daily returns for the different commonly employed fishing gears and methods.

Blue Ventures Conservation Report
Socio-economic Monitoring: A baseline assessment of the fishing villages of the Kirindy-Mite MPA Page 29
Figure 12 Average estimated daily capture for fishing activities
Fishing areas were broadly sorted into the following categories:
· “Mangrove”- including mangrove channels and areas within the actual mangrove forest · “Near-shore”- a broadly defined area ranging up to roughly 10 meters from shore and consisting largely of
sand/mud/seagrass with occasional patch reefs · “Off-shore”- fishing grounds associated with the chain of off-shore islands and the associated coral reefs
Figure 13 below shows the results for average estimated catches when controlled for these three areas.
0.00
5.00
10.00
15.00
20.00
25.00
30.00
35.00
40.00
45.00
50.00
55.00
Diving Hook and line Jarifa Monofilament net
Sasy ZDZD
Aver
age
catc
h kg
/day
(Effo
rt a
djus
ted)

Blue Ventures Conservation Report
Socio-economic Monitoring: A baseline assessment of the fishing villages of the Kirindy-Mite MPA Page 30
Figure 13 Average estimated daily capture by activity and area
Clearly, off-shore fishing grounds are more productive, which is likely due to their proximity to highly productive coral reefs which are able to support large populations of fish, as well as a more recent history of exploitation. Despite this fact, the coastal villages of the Kirindy-Mite area do not heavily exploit these grounds. Figure 14 below shows a percentage breakdown per section of fishers surveyed who mentioned fishing on or around these reefs. Figure 14 Percentage of respondents who report fishing on off-shore reefs
0
5
10
15
20
25
30
35
40
45
50
55
60
Diving Hook and line Jarifa Monofilament net
Sasy ZDZD
Estim
ated
ave
rage
cap
ture
(kg/
day)
Mangrove Near-shore Off-shore
10.70%
26.70%16.00%
89.30%
73.30%84.00%
0.00%10.00%20.00%30.00%40.00%50.00%60.00%70.00%80.00%90.00%
100.00%
Near Mid Far
Yes No

Blue Ventures Conservation Report
Socio-economic Monitoring: A baseline assessment of the fishing villages of the Kirindy-Mite MPA Page 31
3.6 Perceptions of local resource harvest Respondents were asked about their perception of the current state of the fishery, and were prompted to respond based on a 5-point scale of “greatly decreasing”, “slightly decreasing”, “no change”, “slightly increasing”, or “greatly increasing” with the sixth option being “don’t know”. They were asked about their perceptions of:
· Number of fish in the area · Size of fish · Types of fish · Total catch quantity
Of the 225 respondents, 93.78% (75.56% and 18.22% for categories 1 and 2, respectively) stated that the number of fish is decreasing, and 90.67% (77.78% and 12.89%, respectively) indicated that total catch quantity is decreasing (Figure 15). Figure 15 Perceptions of fish abundance, size, type and capture
A follow-up question asked how many years ago the respondent had first noticed this change. When sorted by years of fishing experience, the results show a trend of fishers who have been in the fishery longer identifying a longer period of decline, with fishers having been in the fishery for over 50 years responding with an average of 18.2 years (Table 12, and Figure 16). This is typical of the trend of “shifting ecological baselines”, where younger generations assume that the fishery they enter is “normal”, when, in fact, it may be far below its initial levels of production (Bunce et al. 2007). Table 12 Years since first noticing decrease in fish catches by age bracket
Years since first noticing decrease in catch
Age group (years fishing) Maximum Minimum Average 1-10 15 0 3.1 11-20 30 0 5.7 21-30 21 0 6.4 31-40 37 1 12.8 41-50 40 3 13.1 >50 30 10 18.2
0%10%20%30%40%50%60%70%80%90%
100%
Number of fish
Size of fish Type of fish Catch quantity
Don't know
Large increase
Small increase
No change
Small decrease
Large decrease
N/A

Blue Ventures Conservation Report
Socio-economic Monitoring: A baseline assessment of the fishing villages of the Kirindy-Mite MPA Page 32
Figure 16 Perceptions of when catch decline began by age group
When posed with an open-ended question as to what was causing the decrease in catches, respondents were allowed to name as many causes as they wished, with answers being sorted into pre-determined categories. Answers that did not fit into any categories were recorded as “other” and the response was noted. Respondents were not prompted on any of the category titles. Of the 204 respondents who stated that total catch quantity was decreasing, 48% stated that industrial shrimp trawlers were responsible for the decline in catches, with 39.7% responding “too many people fishing”, and 32.4% citing destructive fishing practices. Figure 17 shows the distribution of responses by area.
0.002.004.006.008.00
10.0012.0014.0016.0018.0020.00
1-10 11-20 21-30 31-40 41-50 >50Avg.
(yea
rs si
nce
notic
ing
decr
ease
)
Age bracket (years fishing experience)
"When did you first notice catch decreasing?"

Blue Ventures Conservation Report
Socio-economic Monitoring: A baseline assessment of the fishing villages of the Kirindy-Mite MPA Page 33
Figure 17 Perceptions of what is causing decrease in catches, by section
Anecdotally, a frequently expressed view was that actual populations of fish could not be exhausted, but that sustained fishing pressure, and especially that of the shrimp trawlers, was frightening fish thus chasing them into farther off-shore waters, as well as causing them to become more savvy at avoiding nets. A metaphor often proposed to explain this was of a village constantly under attack by bandits, having the effect of chasing the residents away to a more secure area and causing the remaining residents to be more on guard. 3.7 Local values/beliefs about marine resources and conservation measures Respondents were asked what they believed the effect of establishing a no-take marine reserve, as well as an outright ban on shrimp trawling would be on catches in surrounding fishing sites. Responses were grouped into “increase returns”, “decrease returns”, “no effect”, and “don’t know”. Figure 18 below shows the relative distribution of responses for the entire study area.
0
20
40
60
80
100
120
Too many people fishing
Shrimp trawlers
Weather God Violation of
traditional rules
Destructive fishing
# of
resp
onde
nts
Far
Mid
Near

Blue Ventures Conservation Report
Socio-economic Monitoring: A baseline assessment of the fishing villages of the Kirindy-Mite MPA Page 34
Figure 18 Perceptions of NTZ effect on catches in surrounding fishing sites
Figure 19 Perceptions of trawler ban on catches
Approximately 20% of respondents stated that the establishment of no-take marine reserves would decrease catch in surrounding fishing sites. A frequently stated justification for this response was that the marine reserves would create a “sanctuary/vacuum” effect, where fish migrate into the reserve to escape from the threat of being caught in surrounding areas. Again, the metaphor of a village constantly under attack by bandits was frequently invoked, where, given the option of a village guaranteed to be safe, all residents would surely relocate there. While opinions were fairly divided regarding the anticipated effects of NTZ establishment on fisheries capture, strong consensus existed as to the positive effects of a ban on shrimp trawlers throughout the area. The small proportion of respondents (8 in total) who said that a trawler ban would result in decreased catches often expressed the idea that the trawlers “chase” fish closer to shore, improving their catchability, or that the discarded by-catch attracts sharks and larger carnivorous species that can then be caught by fishermen.
Increase43%
Decrease20%
No effect28%
Don't know
9%
Increase82%
Decrease4%
No effect9%
Don't know
5%

Blue Ventures Conservation Report
Socio-economic Monitoring: A baseline assessment of the fishing villages of the Kirindy-Mite MPA Page 35
Dividing responses by section provides insight into the effectiveness of awareness raising activities to date, as well as providing a baseline against which to compare changing attitudes as fishing reserves are implemented and enforced. Figure 20 below shows the breakdown of responses by section. Figure 20 Belief of effect of NTZ on catches in surrounding areas, by section
Upon first inspection, it may appear that, for a community with such low levels of formal education and no history of traditionally established no-take areas or fishing bans, a surprisingly high percentage (43%) of respondents believe in the ability of no-take marine reserves to increase fishing returns in surrounding areas. This may be attributable to the general effectiveness of explanations regarding the effects of marine reserves by national parks staff throughout the MPA establishment process. However, there may also be a couple of alternative explanations for this trend. A common misperception voiced by many respondents, when asked about the effectiveness of NTZs to improve catch, was that NTZs would only be subject to temporary closures. This may have come about due to a couple of reasons. First, explanations of MPA zoning in village meetings may not have been entirely clear. Anecdotal evidence from conversations held with fishers and local authorities, as well as personal observation by the principal investigator at some of these meetings, confirmed that core NTZs were proposed by communities to be reopened to fishing after a pre-determined amount of time (three years in some instances), and that these proposals were not rejected outright by MNP staff as impossible. Second, the Velondriake community-managed MPA, approximately 200 km south of the Kirindy Mite area, has been based around demonstrations of the benefits of conservation via short-term closures of certain fishing grounds to maximise production of the economically important and fast-growing grey octopus (Octopus cyanea). Fishers from the Velondriake area frequently travel to the Kirindy-Mite area, and vice versa, and therefore, fishers in the area may have the perception that fishing reserves are temporary in nature based on what they’ve learned about the Velondriake LMMA from other fishermen. It will be important to monitor how these perceptions of no-take reserves change in the coming years as reserves are closed, and not subsequently re-opened.
0%
10%
20%
30%
40%
50%
60%
70%
80%
90%
100%
Near Mid Far
Increase Decrease No effect Don't know
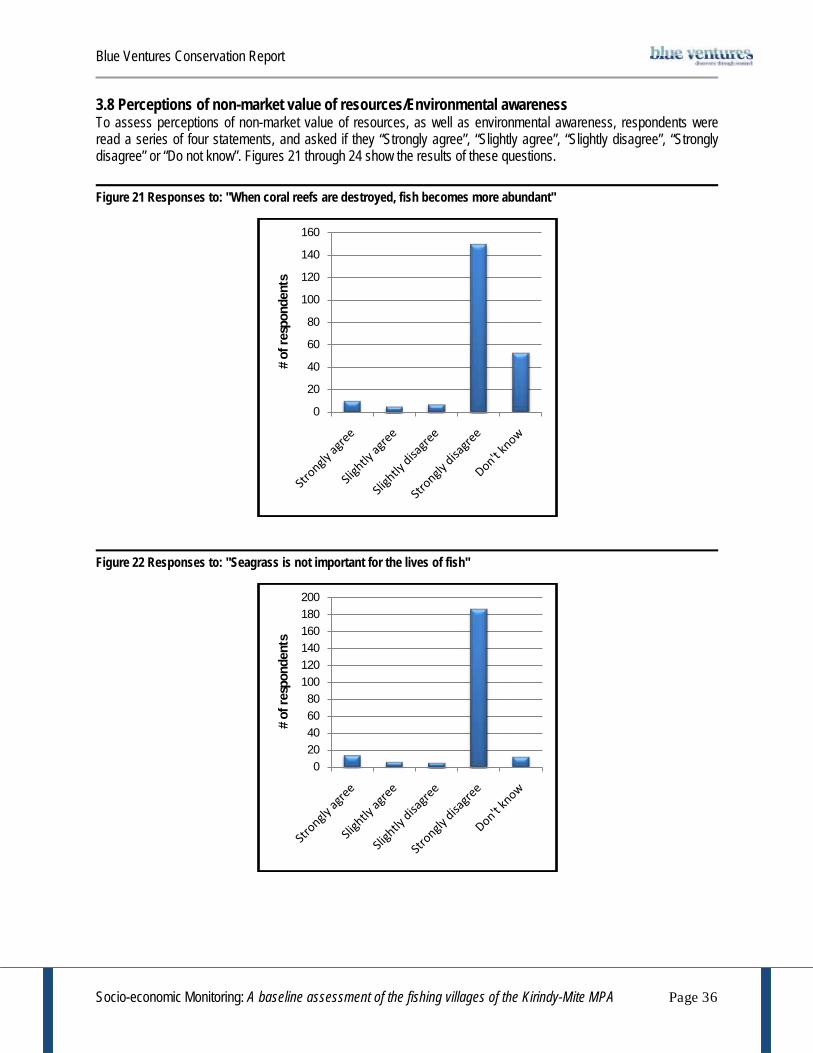
Blue Ventures Conservation Report
Socio-economic Monitoring: A baseline assessment of the fishing villages of the Kirindy-Mite MPA Page 36
3.8 Perceptions of non-market value of resources/Environmental awareness To assess perceptions of non-market value of resources, as well as environmental awareness, respondents were read a series of four statements, and asked if they “Strongly agree”, “Slightly agree”, “Slightly disagree”, “Strongly disagree” or “Do not know”. Figures 21 through 24 show the results of these questions. Figure 21 Responses to: "When coral reefs are destroyed, fish becomes more abundant"
Figure 22 Responses to: "Seagrass is not important for the lives of fish"
0
20
40
60
80
100
120
140
160
# of
resp
onde
nts
020406080
100120140160180200
# of
resp
onde
nts

Blue Ventures Conservation Report
Socio-economic Monitoring: A baseline assessment of the fishing villages of the Kirindy-Mite MPA Page 37
Figure 23 Responses to "If there were no mangroves, coastal soils would erode quicker"
Figure 24 Responses to: "Coral reefs in this area are much healthier than they were 20 years ago"
Awareness of the importance of coral reefs and seagrass in supporting fish populations and mangroves in stabilising coastal soils was overwhelmingly high, with 69.8%, 85.7% and 79.4% of respondents providing “correct” reactions to these statements. Awareness of the degraded state of the area’s coral reefs, however, was considerably lower with only 40.9% of respondents stating either “slightly disagree” or “strongly disagree”, compared to 35.6% stating that they “do not know”. As discussed previously, despite a dearth of scientific data regarding the previous health of these reefs, they were described as among the best in Madagascar in the late 1970’s (Salomon 1980) but are now found to be in a relatively degraded state (Gough 2010).
020406080
100120140160180
# of
resp
onde
nts
0
10
20
30
40
50
60
70
80
90
# of
resp
onde
nts

Blue Ventures Conservation Report
Socio-economic Monitoring: A baseline assessment of the fishing villages of the Kirindy-Mite MPA Page 38
This relative disconnect with the health of the area’s coral reefs is likely due largely to the fact that diving is not a widespread activity, and a majority of the area’s fishers largely exploit the near-shore seagrass and mangrove habitats. 3.9 Extent of participation in MPA establishment process/Degree of interaction between managers and stakeholders Of the 225 respondents, 58% said that they had never attended a meeting regarding the MPA (Figure 25). 15% of respondents claimed to have attended 3 or more meetings, with 14% and 13% saying they had attended 1 and 2 meetings, respectively. Figure 25 Percent of respondents who have attended a meeting regarding the MPA
Figure 26 Percent of respondents, by section, who have attended a meeting regarding the MPA
Dividing these results by section shows that attendance of meetings exhibits an increasing trend further from the core no-take areas (Figure 26). This also corresponds to moving closer to the city of Morondava, where MNP was based at the time of this assessment, and may indicate more frequent contact with marine park staff. Additionally, the northern section of the study site (the villages “far” from core NTZs) has a more developed mobile phone network, benefiting from towers in Belo-sur-Mer and Morondava, thus facilitating the remote coordination of meeting dates.
Yes42%No
58%
0%10%20%30%40%50%60%70%80%90%
100%
Near Mid Far
Yes No

Blue Ventures Conservation Report
Socio-economic Monitoring: A baseline assessment of the fishing villages of the Kirindy-Mite MPA Page 39
When asked how heavily they feel they had participated in the MPA establishment process, 21% of respondents claimed that they had participated heavily, 13% said they had participated slightly, and 52% said they had not participated at all, with the remaining 14% saying they “do not know” how heavily they had participated, likely indicating a relatively low level of participation and general confusion with the question (Figure 27). Indeed, some respondents appeared to have absolutely no prior knowledge of the MPA, and a question as to how heavily they participated in the establishment of something they had no knowledge of generally elicited a confused response. Figure 27 Perceived extent of participation in the MPA establishment process
Figure 28 Perceived extent of participation in MPA establishment process, by section
Not surprisingly, when controlled for section, a larger proportion of respondents in the “far” section expressed that they had participated in the MPA establishment, corresponding to the higher percentage of respondents who had attended meetings (Figure 28). Respondents were asked who they thought participated in the establishment of the MPA rules and regulations (Figure 29)
Not at all52%
Heavily21%
Don't know14%
A little13%
0%10%20%30%40%50%60%70%80%90%
100%
Near Mid Far
Don't know
Not at all
A little
Heavily

Blue Ventures Conservation Report
Socio-economic Monitoring: A baseline assessment of the fishing villages of the Kirindy-Mite MPA Page 40
Figure 29 Responses to "Who was involved in making the MPA rules?"
Despite the majority of respondents (52%) saying that they personally did not participate at all in the MPA establishment process, it is encouraging that 31% say that the “community” was involved in making the MPA rules and regulations. Respondents were asked how clear they feel MNP’s explanations regarding the MPA are (Figures 30 and 31)
Figure 30 Reponses to "How clear are MNP explanations?", all respondents
Community31%
MNP19%
Blue Ventures9%
Ministry of fisheries
Myself12%
Don't know23%
Very clear23%
Somewhat clear13%
Not very clear15%
Not clear at all32%
Don't know17%

Blue Ventures Conservation Report
Socio-economic Monitoring: A baseline assessment of the fishing villages of the Kirindy-Mite MPA Page 41
Figure 31 Responses to "How clear are MNP explanations?", respondents who had attended a meeting
Out of all respondents, only 35% reported MNP explanations being either “very” or “somewhat” clear with 32% saying they are “not clear at all” (Figure 30). When controlling for only those respondents who had attended at least one meeting, however, the results look a bit more encouraging, with 69% responding that explanations are “very” (50%) or “somewhat” (19%) clear (Figure 31). 3.10 Knowledge of MPA rules and regulations Respondents were asked two sets of questions regarding their knowledge of the MPA rules and regulations. First, they were asked if there were any rules regarding the inhabitation of the islands, and, in the case of a positive response, what these rules and regulations are. Second, they were asked if there were any reefs or fishing grounds off-limit to fishing and, in the case of a positive response, what the names of these fishing grounds are. Answers to the question “Are there any rules regarding the inhabitation of the islands” were grouped broadly into “correct” or “incorrect”. As of the data collection phase of this assessment, Marine Park staff had stated that permanent settlement on the islands would no longer be permitted, but that fishers would still be allowed to fish in the surrounding areas, and could use the islands as a base camp for a day or two. Owing to the vagaries of this regulation, any answer stating that stays on the islands were to be limited to five days or less, or were completely prohibited, was deemed to be “correct”, as it demonstrated a basic understanding of the rules. Separating responses by section, 37.7%, 60.0%, and 32.0% of respondents from the “near”, “mid”, and “far” areas, respectively, were able to correctly identify rules regarding inhabitation of the islands (Figure 32).
Very clear50%
Somewhat clear
19%
Not very clear16%
Not clear at all14%
Don't know
1%

Blue Ventures Conservation Report
Socio-economic Monitoring: A baseline assessment of the fishing villages of the Kirindy-Mite MPA Page 42
Figure 32 Percent of respondents, by section, correctly identifying island regulations
A follow-up question asked the respondent’s personal opinion as to if people should be allowed to live on the islands. 55% of respondents stated “yes”, 32% said “no” and the remaining 13% said they “do not know” (Figure 33). This may indicate a general disconnect between local communities attitudes and MPA regulations, as a majority of respondents believe the islands should be open to inhabitation. Figure 33 Responses to "Should people be allowed to live on the islands?"
In response to the question “Are there areas here where fishing is prohibited?”, 48.0%, 45.3% and 50.7% of respondents from the near, mid, and far sections, respectively, answered “yes”. However, only 24.0%, 16.0% and 2.7%, respectively, were able to correctly identify any of the four reefs designated as no-take zones within the Marine Park (Figure 34, Table 13). More concerning, 13.3%, 12.0% and 34.7% of respondents from the near, mid and far sections, respectively, indicated NTZs to be located at reefs that had not been included in the marine park NTZs (Figure 35, Table 13). As there are currently no other formal or traditional management regimes in effect, to the best
0%10%20%30%40%50%60%70%80%90%
100%
Near Mid Far
Correct Incorrect
No32%
Yes55%
Don't know13%

Blue Ventures Conservation Report
Socio-economic Monitoring: A baseline assessment of the fishing villages of the Kirindy-Mite MPA Page 43
knowledge of the investigating team, this indicates a level of misunderstanding on the part of the communities regarding the zoning of the MPA. Figure 34 Percent of respondents, by section, who can identify any of 4 core NTZs
Figure 35 Percent of respondents, by section, who identified incorrect reef as core NTZ
Table 13 below provides a section by section and village by village summary of respondents’ knowledge regarding the basic rules and regulations of the Kirindy-Mite MPA.
0%10%20%30%40%50%60%70%80%90%
100%
Near Mid Far
No
Yes
0%10%20%30%40%50%60%70%80%90%
100%
Near Mid Far
No
Yes

Blue Ventures Conservation Report
Socio-economic Monitoring: A baseline assessment of the fishing villages of the Kirindy-Mite MPA Page 44
Table 13 Knowledge of MPA rules, regulations and zoning by section and village
Islands NTZs
Correct
response Yes should be allowed
% Yes there are NTZs
Any of 4 NTZs
named Named all 4
NTZS % Incorrectly named reef
Near 37.7% 64.0% 48.0% 24.0% 0.0% 13.3% A/pasy 38.6% 68.0% 44.0% 20.0% 0.0% 12.0% Ankoba 50.0% 50.0% 75.0% 25.0% 0.0% 25.0% A/daka 20.0% 70.0% 50.0% 40.0% 0.0% 0.0% Eleo 42.9% 42.9% 42.9% 28.6% 0.0% 28.6%
Mid 60.0% 45.3% 45.3% 16.0% 1.3% 12.0% A/nimbo 56.0% 52.0% 64.0% 32.0% 4.0% 12.0% Belo/Mer 62.0% 42.0% 36.0% 8.0% 0.0% 12.0%
Far 32.0% 54.7% 50.7% 2.7% 0.0% 34.7% Andika 33.3% 46.7% 66.7% 0.0% 0.0% 33.3% Ankevo 43.3% 66.7% 53.3% 6.7% 0.0% 30.0% Begamela 26.7% 26.7% 53.3% 0.0% 0.0% 53.3% Belagnora 20.0% 60.0% 30.0% 0.0% 0.0% 30.0% Nosinihita 0.0% 80.0% 20.0% 0.0% 0.0% 20.0%
Total 43.4% 54.7% 48.0% 14.2% 0.4% 20.0% 3.11 Existence and composition of management structure As discussed in section 1.7.3, MNP is the manager of the core and buffer zones of the Kirindy-Mite MPA. The MNP marine park team intends to have established five village “vigilance” committees (comité de vigilance) by the end of 2011. These committees will each include five to seven villagers who will aid in the patrolling of the MPA, and act as local contact people in the event that the community catches someone violating the MPA’s rules and regulations. As of the writing of this report, these committees were not yet officially in existence (personal communications CVCPM). While MNP remains the manager of the core and buffer zones of the MPA, the COSAP (Comite d’Orientation et Soutien aux Aires Protégées) acts as a steering committee for the entire Kirindy-Mite National Park protected area. The COSAP plays an important role in the social sustainability of the protected area, as they decide how to allocate the 50% of entrance fees which are dedicated to community development projects. The COSAP for the Kirindy-Mite National Park already exists, and is composed of 32 members from various stakeholder groups (Table 14)

Blue Ventures Conservation Report
Socio-economic Monitoring: A baseline assessment of the fishing villages of the Kirindy-Mite MPA Page 45
Table 14 Members of the Kirindy-Mite National Park COSAP
Stakeholder group # of members in COSAP Rural Commune of Belo-sur-Mer 2 Rural Commune of Befasy 1 Rural Commune of Soaserana 1 Rural Commune of Andranopasy 1 Menabe Region 1 Morondava District 1 Regional Gendarmerie 1 Regional Direction of the Ministry of Environment and Forests (DREF) 1 Regional Direction of the Ministry of Education (DREN) 1 Regional Direction of Rural Development (DRDR) 1 Regional Fund for Agricultural Development (FRDA) 1 SAHA Intercooperation (Development NGO) 1 Madagascar National Parks 1 Economic Operators 3 Local Associations 8 Village Presidents 2 Village elders/Traditional leaders 5 Total members 32 The surrounding “protection zone”, as mentioned earlier, currently benefits from no form of official protection. The management structure envisioned for this future sustainable use zone will be based upon the community management model being developed 200 km south in the Velondriake MPA. This model is based around a structure which implicates members of all concerned stakeholders, but delegates the majority of management responsibilities to the members of the fishing community themselves. As of the completion of this study, no such community management structure exists, however one local association, BE ANDRIAKY, based in Belo-sur-Mer, has begun establishing community-managed mangrove reserves and has spread to three of the surrounding villages. 3.12 Existence and adoption of a management and zoning plan The Kirindy-Mite MPA is a marine extension to the existing Kirindy-Mite National Park. As such, it is to be governed by the same management plan as the terrestrial park (personal communication CVCPM). A management and zoning plan for the Kirindy-Mite National Park does exist (MNP 2011), however it currently contains no mention of the marine sector, despite the fact that maps include it in the zoning. Thus, it is safe to conclude that a management and zoning plan for the Kirindy-Mite MPA is not yet publically available. 3.13 Availability of administrative resources The marine extension has available to it the following human and material resources: Human resources:
· Park Director (1) · Marine Park Team Leader ("Chef de volet”) (1) · Marine Park Agents (2) · Speed boat driver/aide (2) · Driver (2)

Blue Ventures Conservation Report
Socio-economic Monitoring: A baseline assessment of the fishing villages of the Kirindy-Mite MPA Page 46
Material resources: · Field-based office (1) · Speedboat (2x60hp engine) (1) · Motorised pirogue (motor not yet purchased) (1) · Off-road motorcycle (1) · Land Rover (2)
Project funding is currently coming to the end of a funding cycle, and is only secure through to the end of 2012 (personal communication CVCPM). Income from entrance fees is currently negligible, with the latest available data indicating that the park had only 43 and 37 visitors in 2007 and 2008, respectively (MNP 2011). 3.14 Existence and application of scientific input A baseline assessment of the health of the Kirindy-Mite region’s coral reefs was undertaken in late 2009, concurrent with public consultations being held by MNP staff to reach consensus on the MPA’s zoning plan. The results of these SCUBA surveys showed coral reefs that had been heavily degraded by the previous year’s cyclone, with the most extensive damage occurring on the northern reefs, around the islands of Nosy Andravoho and Nosy Motsadinitsy, and the southern reefs, around Nosy Andriamitaroke, remaining in better health, showing higher percentages of hard coral cover (Gough 2010). The core protection zones of the MPA focus heavily on these southern reefs, with two of the three reefs (Ankolake and Maihelolo) mentioned as among the healthiest being zoned as permanent no-take zones (Figure 2). Baseline assessments of the regions other key coastal and marine habitats, including sand dunes, mangrove forests, and seagrass meadows, were undertaken in 2010-11, and are still in the process of final report production. The effective preservation of these key habitats will also be crucial to the area’s ability to support biodiversity, as well as the long-term sustainability of the traditional fishery. It is expected that reports from these baseline assessments will contain management suggestions to be presented to MNP and any future community management structures. Landings surveys of the traditional fishery are currently being carried out in four villages in the Kirindy-Mite area (Andranopasy, Antsaranandaka, Belo-sur-Mer, and Ankevo-sur-Mer). Similar to the aforementioned ecological surveying of key habitats, the results of this surveying will also be important for informing the adaptive management of the Kirindy-Mite MPA. 3.15 Clearly defined enforcement procedures Enforcement procedures for violations of the MPA’s rules and regulations are also still in the preparation phase and no official procedure currently exists (personal communication CVCPM). Enforcement procedures do, however, exist for the terrestrial sector of the Kirindy-Mite National Park, and it is believed that procedures for the marine sector will be similar, if not identical. A rough zoning plan, including which reefs will be included as core no-take zones, and rules governing the inhabitation of the off-shore islands, currently exists. Despite this, the lack of any physical demarcation indicating the limits of these no-take zones, as well as a lack of any distinguishable landmarks, means that their enforcement is difficult to impossible, and is not currently being pursued by MNP marine park staff. Rules which do not depend on the installation of physical infrastructure, such as the prohibition of permanent settlement on the islands, the use of SCUBA gear for harvesting of marine resources (almost exclusively sea cucumbers), and the use of large “barrage” nets by itinerant fishermen are currently being enforced on an ad hoc basis, with mixed results (personal communication CVCPM, author’s personal observation).

Blue Ventures Conservation Report
Socio-economic Monitoring: A baseline assessment of the fishing villages of the Kirindy-Mite MPA Page 47
During public consultations with stakeholder communities, sets of rules and fines for violations were elaborated by both Belo-sur-Mer and Andranopasy communes. These rules and subsequent penalties have been approved by the Belo-sur-Mer commune, which has issued a communal arrêté, but still await approval by the Andranopasy commune, as well as other concerned authorities, such as the Menabe Region administration, and the regional Fisheries administration. Respondents to household head interviews were asked who they thought is responsible for enforcing the MPA rules and regulations (Figure 36) Figure 36 Responses to "Who is responsible for enforcing MPA rules and regulations?"
The results of this question indicate a general confusion as to who is responsible for enforcement of MPA rules and regulations. It is, however, encouraging, that 24% of respondents felt the community would be responsible for enforcing rules; approximately the same percentage as those who mentioned MNP (23%). More concerning, 10% of respondents indicated that Blue Ventures, who, in promoting community-based management explicitly avoids playing an enforcement role, would be involved in enforcing the MPA rules and regulations. 3.16 Communications Communications does not relate to any one monitoring indicator per se, but it was deemed important and included in surveying for this assessment. Radio was by far the most widespread means of accessing information from outside the community, with 98.7% (222/225) of household survey respondents stating that they listen to the radio. Additionally, 8 of the 21 villages throughout the project area have access to mobile phone networks, and this presents another opportunity for the transmission of information regarding the MPA, via calls or SMS. Table 15 provides a summary of available communications for each of the surveyed villages, as well as the non-surveyed villages and Figure 37 shows the times at which respondents reported listening to the radio.
MNP23%
Community24%
Min. of fisheries
8%Gendarme
1%
Blue Ventures
10%
Commune9%
Don't know25%
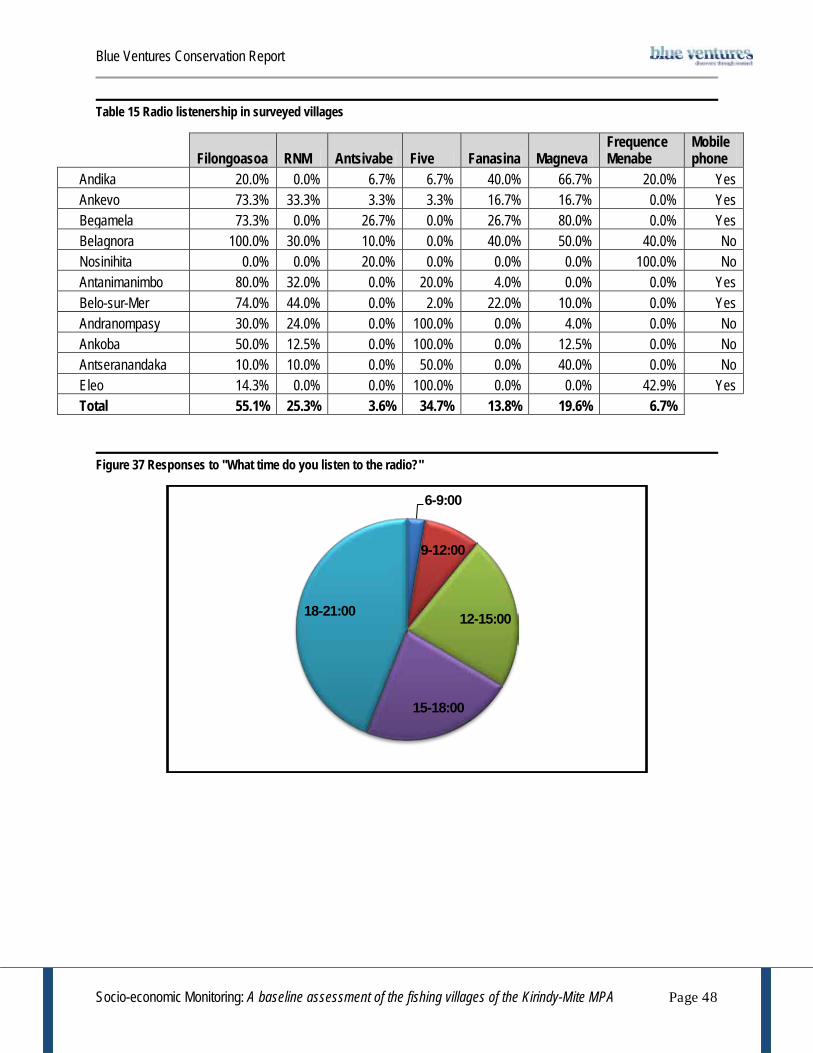
Blue Ventures Conservation Report
Socio-economic Monitoring: A baseline assessment of the fishing villages of the Kirindy-Mite MPA Page 48
Table 15 Radio listenership in surveyed villages
Filongoasoa RNM Antsivabe Five Fanasina Magneva Frequence Menabe
Mobile phone
Andika 20.0% 0.0% 6.7% 6.7% 40.0% 66.7% 20.0% Yes Ankevo 73.3% 33.3% 3.3% 3.3% 16.7% 16.7% 0.0% Yes Begamela 73.3% 0.0% 26.7% 0.0% 26.7% 80.0% 0.0% Yes Belagnora 100.0% 30.0% 10.0% 0.0% 40.0% 50.0% 40.0% No Nosinihita 0.0% 0.0% 20.0% 0.0% 0.0% 0.0% 100.0% No Antanimanimbo 80.0% 32.0% 0.0% 20.0% 4.0% 0.0% 0.0% Yes Belo-sur-Mer 74.0% 44.0% 0.0% 2.0% 22.0% 10.0% 0.0% Yes Andranompasy 30.0% 24.0% 0.0% 100.0% 0.0% 4.0% 0.0% No Ankoba 50.0% 12.5% 0.0% 100.0% 0.0% 12.5% 0.0% No Antseranandaka 10.0% 10.0% 0.0% 50.0% 0.0% 40.0% 0.0% No Eleo 14.3% 0.0% 0.0% 100.0% 0.0% 0.0% 42.9% Yes Total 55.1% 25.3% 3.6% 34.7% 13.8% 19.6% 6.7%
Figure 37 Responses to "What time do you listen to the radio?"
6-9:00
9-12:00
12-15:00
15-18:00
18-21:00

Blue Ventures Conservation Report
Socio-economic Monitoring: A baseline assessment of the fishing villages of the Kirindy-Mite MPA Page 49
4. Conclusions and recommendations 4.1 Socioeconomics The Kirindy-Mite area currently exhibits a low level of socioeconomic development (Raharison 2010). Over the entire study site, approximately half of households participate in the traditional fishery, with many of the small coastal villages being comprised exclusively of fishing households. These households exhibit an extraordinarily high dependence on fishing and low diversification of livelihoods. Indeed, in 7 of 11 villages surveyed, 100% of households indicated fishing as their primary livelihood activity and 59.6% of fishing households surveyed do not engage in any “non-marine resource dependent” activities. Fishing households throughout the Kirindy-Mite area exhibit a low MSL (material style of life) ranking relative to traditional fishing communities in northern Kenya, putting their poverty into a regional context. Faced with diminishing returns, low levels of formal education, geographic isolation, and a distinct lack of alternative livelihood opportunities, fishing communities in the Kirindy-Mite area find themselves in a precarious situation. Fishers throughout the study site were acutely aware of the degraded state of the fishery and the decreases in their returns (90.67%), with the eldest fishers of the area indicating declines as far back as 40 years. However the causes of this were not as widely agreed upon. Strong consensus (82%) exists for a ban on industrial shrimp trawlers as a measure to increase returns in the traditional fishery. In view of the large amount of by-catch, as well as destruction of key seagrass habitat attributed to these trawlers, this may be part, but likely not all, of the solution. Diminishing returns in traditional fisheries throughout Madagascar are ubiquitous, even in areas where industrial fishing does not take place (Langley 2006, Gough et al. 2009a), suggesting that a trawler ban is not a silver bullet, and that a wide array of management strategies is needed. The Kirindy-Mite MPA is an extension of the existing Kirindy-Mite National Park. The primary objectives of Madagascar’s national parks are to conserve biodiversity while providing alternative livelihoods and sustainable development through promotion of tourism and reinvestment of entrance fees in local development projects. The core and buffer zones of the MPA are not, however, being implemented primarily as a fisheries management tool. Whereas the ability of no-take marine reserves to preserve ecological function and promote resilience within key habitats, as well as increase abundance and diversity of associated fish populations, is well established (Russ and Alcala 1996, Obura and Grimsditch 2008), their ability to provide benefits to local fisheries remains largely theoretical, with real-world examples being limited to a few specific case studies (Russ et al. 2004, McClanahan and Mangi 2000). While 43% of respondents felt that establishing no-take zones would increase catches, this must be taken with a grain of salt, as anecdotal evidence suggests that the communities of the Kirindy-Mite area may not possess a proper understanding of the permanent nature of the MPA’s core no-take zones. The four NTZs, forming the MPA’s core, are all located on off-shore reefs, which are not heavily exploited by local fishers. In addition to the fact that only limited areas of the off-shore reefs have been designated as NTZs, it does not appear as if the implementation of the MPA currently stands to have a great adverse effect on the fishing activities of local communities. These reef closures, along with a ban on permanent settlements on the islands, do, however, stand to significantly affect the fishing activities of the more than 700 migrant fishers who come to the area’s islands every year. Regrettably, surveying was not able to include these populations of migrant fishers, as the ban on island settlements was enforced concurrently with field-based data collection. Recommendations
· In order to decrease dependence and pressure on the traditional fishery, as well as improve fishing households’ adaptability to continually declining fisheries returns and the potential effects of global climate change, alternative livelihood activities should be developed throughout the entire project area. Examples of

Blue Ventures Conservation Report
Socio-economic Monitoring: A baseline assessment of the fishing villages of the Kirindy-Mite MPA Page 50
potential activities could be the development of community-based aquaculture (e.g. algae, sea cucumbers, or crab fattening).
· The current low level of French language skills in stakeholder communities throughout the project site presents itself as a significant obstacle to local fishers realising direct benefits from the promotion of tourism. Language and guide trainings should be provided along with the development and promotion of community-based tourism activities to complement the Kirindy-Mite National Park.
· Environmental education and awareness raising activities should be undertaken to reinforce the potential fisheries benefits to be gained from establishing permanent no-take marine reserves.
· Populations of migrant fishers, who have yet to be actively involved in the MPA establishment process, should be approached and encouraged to join the on-going MPA establishment process.
4.2 Governance The Kirindy-Mite MPA is a very new protected area, with community consultations only beginning in early 2009. At the time of this study, governance of the MPA was still underdeveloped, and mostly remained in the planning stages. The current low level of awareness of MPA rules and regulations is not particularly surprising, given the relatively recent undertaking of the MPA establishment process, the highly mobile nature of stakeholder communities, and the limited human resources on the part of MNP. It does, however, present a major obstacle to the success of the MPA, as a lack of knowledge of rules and regulations on the part of stakeholder fishing communities will likely result in either poorly respected core no-take zones, or social conflict as fines are enforced upon fishers who are caught unwittingly violating MPA rules. As noted earlier, due to time constraints, this study had to be conducted before any physical infrastructure demarcating the limits of the no-take zones and the periphery of the MPA were installed. It would stand to reason that knowledge of the location of NTZs will increase markedly once this delimitation has been completed. Additionally, shortly after the completion of village surveying, the ban on permanent settlements on the islands was enforced by a delegation of MNP staff, community members and local authorities. It is expected that this will have also resulted in a corresponding spike in awareness of rules regarding inhabitation of the islands. To ensure the social sustainability of the Kirindy-Mite MPA, MNP has taken an inclusive approach with local fishing communities, involving them in both the zoning of the MPA and the elaboration of rules for sustainable use zones. In an area covering over 100km of coast, no access by land for half the year, and approximately half of the project area not covered by mobile phone networks, this is no simple task. Paradoxically, the fruits of these labours are seen most clearly in the villages farthest away from the MPA’s core no-take zones, as these villages reported having attended more meetings and expressed a higher level of participation in the MPA establishment process. This is likely due to the fact that MNP, as of the writing of this report, bases its operations out of the regional capital of Morondava, located about 25km north of the MPA’s farthest northern limit and approximately 85km north of the MPA’s first core NTZ. This has resulted in less frequent contact with stakeholder villages closer to the NTZs, and thus lower levels of stakeholder participation. Recommendations:
· A ban on industrial shrimp trawlers should be sought for the entire area, including the “protection zone”, which does not yet benefit from an official temporary protection. This will require close collaboration with all concerned authorities, and especially the Centre de Surveillance de Pêche, the authority in charge of enforcing Madagascar’s fishery laws. Continued lobbying of SAPM for granting of temporary protection for the entire “protection zone” area will be crucial for implementing this industrial fishing ban.
· Local and regional authorities should be co-opted to facilitate more effective enforcement of the national ban on harvesting of sea cucumbers using underwater breathing apparatus’.

Blue Ventures Conservation Report
Socio-economic Monitoring: A baseline assessment of the fishing villages of the Kirindy-Mite MPA Page 51
· Awareness raising activities should be made a top priority, along with the installation of MPA infrastructure (buoys, signage, etc...), in order to increase awareness of MPA rules and regulations amongst stakeholder communities.
· A wide array of management strategies, including banning of destructive fishing methods (e.g. kajaoto small-mesh nets and laro poison fishing), establishment of temporary no-take reserves for short-lived, fast growing species such as octopus and crabs, and establishment of permanent seagrass and mangrove reserve areas should be implemented in order to protect breeding stock and ensure the continued functioning of key habitats (Gough 2010).
· Enforcement procedures, as well as an exhaustive list of MPA rules and regulations, should be established and communicated to stakeholder communities.
· Members of the local community should be co-opted in MPA patrolling and enforcement of fines on those caught violating the MPA rules and regulations.
· Feedback mechanisms, by which stakeholder communities can change MPA rules and regulations should be established in order to improve community buy-in.
· The MPA management team should maintain a stronger field presence, and increase their level of direct interaction with stakeholder communities.
· Alternative forms of communication (such as radio, or mobile phone networks) should be utilised for more effective information sharing.
· Fledgling community management efforts, such as the temporary mangrove reserves established in Belo-sur-Mer in 2011, and local associations should be supported and expanded throughout the entire project area.
Many of the recommendations put forth by this study are self-evident, and already integral parts of MNP’s work plan for 2011-12 (personal communication CVCPM). 4.3 On-going Monitoring Incorporating programs for monitoring and evaluation is an integral part of designing a successful MPA. Monitoring and evaluation not only allows MPA managers and stakeholders to reflect upon progress made and adapt management strategies, but also provides quantifiable results and feedback to show to stakeholders, project funders, and the greater scientific community (IUCN 2004). The purpose of this assessment is to provide a baseline against which the results of future monitoring can be compared. Subsequent monitoring activities need not be as labour intensive as the baseline assessment. Table 16 below contains a proposed schedule for subsequent monitoring of socioeconomic and governance indicators. Many of the socioeconomic indicators, such as resource use patterns, MSL, and community infrastructure are not expected to change significantly on short time scales. In order to minimise demand on human and financial resources, as well as to avoid creating “survey fatigue” in stakeholder communities, monitoring of these indicators can be conducted less frequently. The forthcoming updated code for management of Madagascar’s protected areas (COAP) states that management and zoning plans are subject to evaluation and, if necessary, corrective measures every five years (Projet de Loi N° 028/2008 du 29 Octobre 2008, Article 40). Therefore, this study suggests subsequent monitoring activities be carried out every 5 years, prior to management and zoning plan evaluation.

Blue Ventures Conservation Report
Socio-economic Monitoring: A baseline assessment of the fishing villages of the Kirindy-Mite MPA Page 52
Table 16 Recommended schedule for on-going monitoring
Indicator Schedule Socioeconomic S1: Resource use patterns 5 years S2: Local values and beliefs about marine resources 2 years S3: Perceptions of local resource harvest 2 years S4: Perceptions of non-market value of resources 2 years S5: Material style of life (MSL) 5 years S6: Household income distribution by source 5 years S7: Community infrastructure and business 5 years S8: Community demographics 5 years Governance G1: Existence and composition of management structure 2 years G2: Existence and adoption of a management and zoning plan 2 years G3: Local understanding of MPA boundaries, rules and regulations 2 years G4: Level of stakeholder participation and satisfaction in management 2 years G5: Degree of interaction between managers and stakeholders 2 years G6: Level of resource conflict 2 years G7: Availability of MPA administration resources 5 years G8: Existence and application of scientific input 5 years G9: Clearly defined enforcement procedures 2 years Certain indicators, such as local perception of resource harvest, values and beliefs about marine resources, and perception of non-market values can be expected to change more quickly, and should therefore be monitored more frequently. This study proposes that these indicators are monitored after 2 years, and again after 5 years. It is important to note that perceptions of local resource harvest may differ from actual returns on fishing, depending on fishers’ perceptions of the effectiveness of the MPA management strategies at increasing fish stocks in surrounding areas. MPA governance can be expected to change relatively quickly as well, as improving governance will largely be the focus of MNP and Blue Ventures’ on-going activities. This study suggests that many of the governance indicators be monitored after 2 years and again after 5 years. In summary, two subsequent studies are proposed. One after two years, covering 10 of the 17 indicators, and a comprehensive study of all 17 indicators after five years, to be completed prior to evaluation and adaptation of the protected area’s management plan.

Blue Ventures Conservation Report
Socio-economic Monitoring: A baseline assessment of the fishing villages of the Kirindy-Mite MPA Page 53
Bibliography Astuti, R. (1995) People of the sea: identity and descent among the Vezo of Madagascar. Cambridge studies in
social and cultural anthropology. Cambridge University Press. Bunce M., Rodwell LD., Gibb R., and Mee L., (2007) Shifting baselines in fishers’ perceptions of island reef fishery
degradation. Ocean and Coastal Management: 1-18 Cinner J., McClanahan T. (2006) A Socioeconomic Assessment of Fishing Communities Along the North Coast of
Kenya. Wildlife Conservation Society Cooke, A., J. R. E. Lutjeharms and P. Vasseur. 2003. Marine and coastal ecosystems. Page 179-202. In Natural
History of Madagascar. S. Goodman and J. Benstead, eds. Chicago University Press. Cripps G. (2009) Understanding Migration amongst Small-Scale Fishers in Madagascar. Blue Ventures Conservation
Report. Epps, M. 2008. A Socioeconomic Baseline Assessment: Implementing the socioeconomic monitoring guidelines in
southwest Madagascar. Blue Ventures Conservation Report. Gillett R. (2008) Global study of shrimp fisheries. FAO Fisheries Technical Paper. No. 475. Rome, FAO. 331p. Gough C. (2010). Ecological Assessment of the marine and coastal ecosystems of Kirindy Mite, Menabe: West
Madagascar. Blue Ventures Conservation Report. Gough C., Thomas R., Ettienne B., Harris A., Humber F., and Roy R. (2009a). Socioeconomic Monitoring: A baseline
survey of villages in the Androka and Itampolo regions of Southwest Madagascar. Gough, C., Thomas, T., Humber, F., Harris, A., Cripps, G., and Peabody, S. (2009b) Vezo Fishing: An Introduction to
the Methods Used by Fishers in Andavadoaka Southwest Madagascar. Blue Ventures Conservation Report. Iida T (2005) The Past and Present of the Coral Reef Fishing Economy in Madagascar: Implications for Self-
Determination in Resource Use. Senri Ethnological Studies 67: 237-258. IUCN 2004. Managing Marine Protected Areas: A Toolkit for the Western Indian Ocean. IUCN Eastern African
Regional Programme, Nairobi, Kenya, xii + 172pp. Langley, J. (2006). Vezo Knowledge: Traditional Ecological Knowledge in Andavadoaka, southwest Madagascar.
Blue Ventures Conservation Report.
Madagascar National Parks (MNP), KfW, and World Wide Fund for Nature (WWF) (2011) Plan d’Amenagement et de Gestion Du Parc National De Kirindy Mite
Malleret-King D., Glass A., Wanyonyi I., Bunce L., Pomeroy B. (2006). Socio-economic Monitoring guidelines for coastal managers of the Western Indian Ocean, SocMon WIO. CORDIO East Africa publication. (Version 1). Pp 108.
Mascia, M.B. 2001. Designing Effective Coral Reef Marine Protected Areas: A Synthesis Report Based on Presentations at the 9th International Coral Reef Symposium. Special Report to the IUCN World

Blue Ventures Conservation Report
Socio-economic Monitoring: A baseline assessment of the fishing villages of the Kirindy-Mite MPA Page 54
Commission on Protected Areas - Marine. Washington, DC: International Program Office, National Ocean Service, National Oceanic and Atmospheric Administration
McClanahan TR, and Mangi S. (2000) Spillover of exploitable fishes from a marine park and its effect on the adjacent fishery. Ecological Applications 10(6): 1792-1805
Ministère de l’Agriculture, de l’Elevage et de la Pêche (MAEP) (2003) Monographie de la Région de Menabe. Ministère de l’Agriculture, de l’Elevage et de la Pêche (MAEP) (2005) Recueil des Textes Législatifs et
Réglementaires. Ministère de L'Environnement, des Forêts, et des Tourisme (MEFT) (2009) Manuel de création des Aires Marine
Protégées a Madagascar. Obura D, Grimsditch G (2008) Resilience - Integrating Science and Management in Coral Reefs Relevant to Climate
Change. CORDIO Status Report
Pomeroy, R.S., Parks, J.E. and Watson, L.M. (2004). How is your MPA doing? A Guidebook of Natural and Social Indicators for Evaluating Marine Protected Area Management Effectiveness. IUCN, Gland, Switzerland and Cambridge, UK. xvi + 261pp.
Projet de Loi N° 028/2008 du 29 Octobre 2008 portant refonte du Code de Gestion des Aires Protégées. Salomon J-N (1980) Les Recifs Coralliens de Belo sur Mer: Etude Geomorphologique (Sud-Ouest de Madagascar).
Madagascar Revue de Geologie 37: 87–109 Raharison D.A. (2010) Travaux d'appui a l'etablissement de l'aire protégée marine et cotiere du sud Menabe: Etude
d'Impacts Sociaux. KilyBe Russ GR, Alcala AC (1996) Marine Reserves- Rates & Patterns of Recovery and Decline of Large Predatory Fish.
Ecological Applications 6: 947-961 Russ GR, Alcala AC, Maypa AP, Calumpong HP, White AT (2004) Marine Reserve Benefits Local Fisheries.
Ecological Applications 14(2): 597-606

Blue Ventures Conservation Report
Socio-economic Monitoring: A baseline assessment of the fishing villages of the Kirindy-Mite MPA Page 55
Annexe 1 : Survey Forms

Blue Ventures Conservation Report
Socio-economic Monitoring: A baseline assessment of the fishing villages of the Kirindy-Mite MPA Page 56
Household Survey
Interview ID Name of surveyor
Date of survey
Town of survey Household number Date of data entry
Name of data entree
Interviewee agrees to participate: Is your family native to this village? If no, where did you move here from? _____________ £Outside MPA area £Inside MPA area How long ago did you move here? ________ Why did you move here? £Better fishing £Salaried labor £Problem in prior residence Members of the household
N° Age Sex Highest level of
school completed
Occupation Secondary work Lives here year
round? (indicate time here if no)
If any members do not live here year round, where do they go, and when?
Age Sex Time not present in village Destination Reason for going
Agree Disagree
Yes No

Blue Ventures Conservation Report
Socio-economic Monitoring: A baseline assessment of the fishing villages of the Kirindy-Mite MPA Page 57
Does anyone in your household speak other languages? (Official, French, English, etc…)
French English Other (indicate)
What are all of your family’s sources of income?
Activity Season Relative importance Are there any seasonal activities you partake in that produce income for your family?
Activity Season Who does it Material style of life (MSL) Are you the owner of your house? How many rooms in your house (not including kitchen): ____ Roofing material
Thatch Mud tiles (kapily)
Sheet metal Tarpaulin
Wall material Thatch Planks Mudbrick Sheet metal Cinder blocks Floor material Sand Woven mat Planks Cement
Yes No

Blue Ventures Conservation Report
Socio-economic Monitoring: A baseline assessment of the fishing villages of the Kirindy-Mite MPA Page 58
Household items Present Absent Number Radio Generator Television DVD/VCD player Mobile phone Wooden chair Plastic chair Salon chair (with cushions) Table Bed Foam mattress Suitcase Solar panel (not including ToughStuff)
Outhouse toilet Flush toilet (septic tank)
Livestock Present Absent Number Chickens Other poultry Goats Cows Pigs
Fishing material Present Absent Number Net (size, length) Hook/line Spear Spear-gun ZDZD; length ________ Jarifa: chest-lengths _______ Sasim-patsa (small mesh net) Mask/fins Palangre Sailing pirogue (length) Motorised pirogue (length) Motor HP _______
Dugout canoe (Molanga) If radio present: What frequencies do you usually listen to? £Filongoa soa £RNM £Antsivabe £Five £Fanasina £Maneva
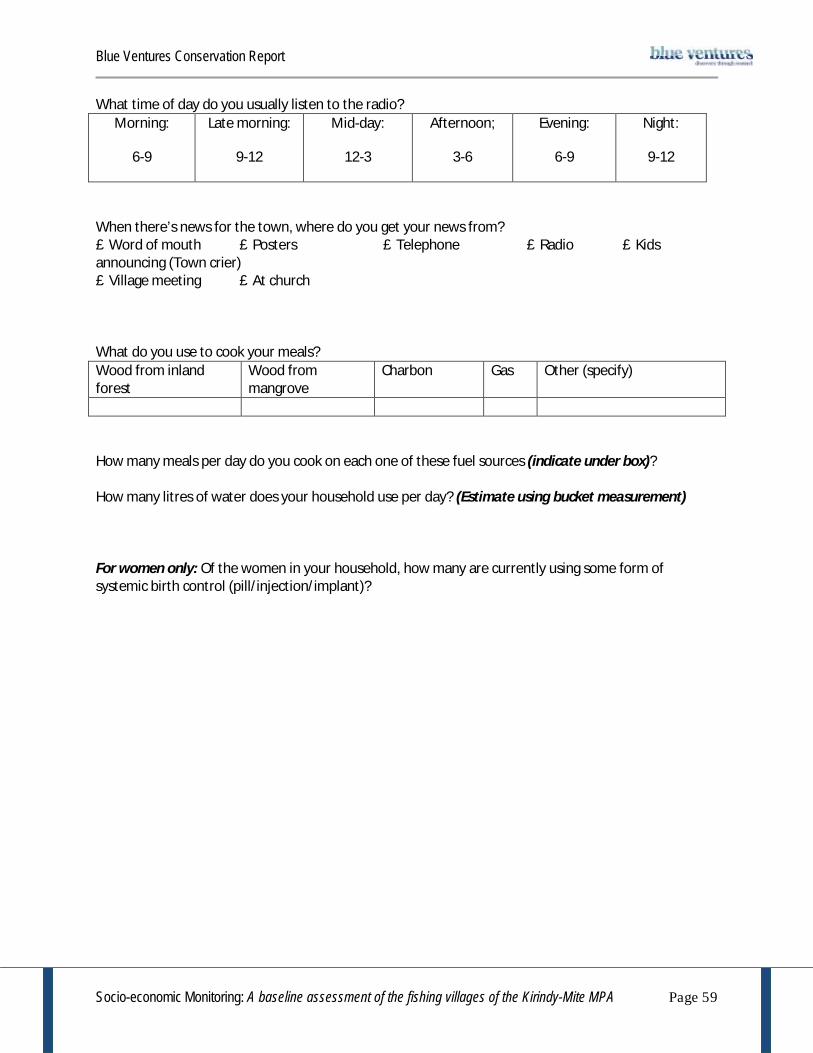
Blue Ventures Conservation Report
Socio-economic Monitoring: A baseline assessment of the fishing villages of the Kirindy-Mite MPA Page 59
What time of day do you usually listen to the radio? Morning:
6-9
Late morning:
9-12
Mid-day:
12-3
Afternoon;
3-6
Evening:
6-9
Night:
9-12
When there’s news for the town, where do you get your news from? £Word of mouth £Posters £Telephone £Radio £Kids announcing (Town crier) £Village meeting £At church What do you use to cook your meals? Wood from inland forest
Wood from mangrove
Charbon Gas Other (specify)
How many meals per day do you cook on each one of these fuel sources (indicate under box)? How many litres of water does your household use per day? (Estimate using bucket measurement) For women only: Of the women in your household, how many are currently using some form of systemic birth control (pill/injection/implant)?

Blue Ventures Conservation Report
Socio-economic Monitoring: A baseline assessment of the fishing villages of the Kirindy-Mite MPA Page 60
Household Head Interview
Interview ID Name of surveyor Date of survey Town of survey Household number Sex of interviewee Age of interviewee Date of data entry Name of data
enterer
Time of interview start
Time of interview end
Interviewee agrees to participate: Do you Fish? What marine and coastal activities do you take part in? Activity (Gear and method) Target species Area and habitat Avg. catch Frequency
(trips/week)
Summer: Winter: Spring:
Summer: Winter: Spring:
Summer: Winter: Spring:
Summer: Winter: Spring:
Summer: Winter: Spring:
Summer: Winter: Spring:
Summer: Winter: Spring:
Summer: Winter: Spring:
Agree Disagree
Yes No

Blue Ventures Conservation Report
Socio-economic Monitoring: A baseline assessment of the fishing villages of the Kirindy-Mite MPA Page 61
Summer: Winter: Spring:
Summer: Winter: Spring:
How long have you been a fisher? Were your parents fishers? Have you changed the fishing activities you take part in? Why?
Change from (gear)
Changed to (gear) When (approx.
years ago)
Reason
£Catches decreasing with former gear £Better catches with new gear £New market developed £New gear cheaper £Learned new method £Other (note)
£Catches decreasing with former gear £Better catches with new gear £New market developed £New gear cheaper £Learned new method £Other (note)
£Catches decreasing with former gear £Better catches with new gear £New market developed £New gear cheaper £Learned new method £Other (note)
£Catches decreasing with former gear £Better catches with new gear £New market developed £New gear cheaper
Yes No

Blue Ventures Conservation Report
Socio-economic Monitoring: A baseline assessment of the fishing villages of the Kirindy-Mite MPA Page 62
£Learned new method £Other (note)
£Catches decreasing with former gear £Better catches with new gear £New market developed £New gear cheaper £Learned new method £Other (note)
Please tell me about the trends you’ve noticed in your fishing returns: Large
decrease Small
decrease No
change Small
increase Large
increase Don’t know
When (years)?
Number of fish
Size of fish Type of fish
Total quantity of catch
How many years ago did you begin to notice this change (note in table)? If “type of fish” changed, what types of fish have you noticed a change in?
More frequent Less frequent
Are there types of fish you used to catch that you don’t see at all anymore? If decreasing, what do you think is causing this? (Indicate order of importance: 1,2,3 etc…)

Blue Ventures Conservation Report
Socio-economic Monitoring: A baseline assessment of the fishing villages of the Kirindy-Mite MPA Page 63
£Too many people fishing £Shrimp trawlers £Weather £God (zanahary) £Don’t know £Violation of traditional rules (fomban-draza) £Destructive fishing (specify) __ ⃝ Laro ⃝ Small-mesh net ⃝ Kijaoto (type of purse-seining) ⃝
Beach Seine £Other (specify) ________________
If increasing, what do you think is causing this? If total quantity decreasing: What have you done to make up for the decrease in your catch? £ Fish more frequently £Fish for longer £Fish farther away [travel further to find fish] £Changed gear £Started working in another job using skills I already had [name job/skills] ________________________________ £Learned to do other work [name other work]__________________________ £Stopped fishing £Nothing What do you think could be done to stop this decrease? £Ban use of poison fishing £Establish marine reserve (marine park) £Ban industrial fishing vessels £Ban living on islands £Create alternative livelihoods £Obtain better fishing gear £Other (note)_______________ What effect do you think establishing no-take zones would have on fishing in surrounding areas? £Increase fishing returns £No effect £Decrease fishing returns £Don’t know

Blue Ventures Conservation Report
Socio-economic Monitoring: A baseline assessment of the fishing villages of the Kirindy-Mite MPA Page 64
What effect do you think banning shrimp trawlers would have on fishing in the area? £Increase fishing returns £No effect £Decrease fishing returns £Don’t know Agree/Disagree Ecological knowledge When the coral reef is destroyed, fish become more abundant
Strongly agree Agree Disagree Strongly
Disagree Don’t know
Seagrass is not important for the lives of fish
Strongly agree Agree Disagree Strongly
Disagree Don’t know
If there were no mangroves, coastal soils would erode quicker
Strongly agree Agree Disagree Strongly
Disagree Don’t know
Environmental conditions awareness The coral reefs in this area are much healthier than they were 20 years ago
Strongly agree Agree Disagree Strongly
Disagree Don’t know
Adaptation If fishing were to completely stop, you could do other work to support yourself
Strongly agree Agree Disagree Strongly
Disagree Don’t know
If you have a problem, people in your village would help you.
Strongly agree Agree Disagree Strongly
Disagree Don’t know
Migrant fishermen have as much right to fish here as locals
Strongly agree Agree Disagree Strongly
Disagree Don’t know
Turtles
If you were not able to catch turtles, you would lose part of what makes you Vezo
Strongly agree Agree Disagree Strongly
Disagree Don’t know
People should be allowed to catch turtles strictly to sell for money
Strongly agree Agree Disagree Strongly
Disagree Don’t know
Are there currently any rules governing living on the islands?
Yes No Don’t know If yes, what are they? In your opinion, do you think that people should be allowed to live on the islands (Andriamitaroke, Andriangory, Andravoho)?

Blue Ventures Conservation Report
Socio-economic Monitoring: A baseline assessment of the fishing villages of the Kirindy-Mite MPA Page 65
Yes No Don’t know If yes, for how long? If not, why not? £Taboo (fady) £Don’t pay taxes to commune
£Too far from social infrastructure (schools, hospitals, etc…) £Exert too much pressure on fishery
£Other (note)___________
Are there any areas where fishing is not allowed?
If yes, which areas: £Ankolake £Mailolo £Ankarambanda sud £Angoraoke £Antanimanimbo mangrove (southern section) £Andika mangrove area £Other (note)________ £Don’t know
Who is responsible for enforcing the rules in these areas (check all that apply)? £MNP £Community £Service de Peche £Gendarme £Blue Ventures £Commune £Other (specify) _____________ Who was involved in making these rules and regulations (check all that apply)? £Community £MNP £Blue Ventures £Svc. de Peche £I was £Other (specify)____________ To what extent did you participate in making these rules and regulations?
Participated heavily Participated weakly Didn’t participate at all Don’t know How clear to you are the explanations of the protected area provided by MNP?
Yes No Don’t know

Blue Ventures Conservation Report
Socio-economic Monitoring: A baseline assessment of the fishing villages of the Kirindy-Mite MPA Page 66
Very clear Slightly clear Slightly unclear Very unclear Don’t know Please explain your answer: How many meetings have you attended regarding the MPA? How do you think the following people would be affected by the MPA? Benefit
greatly Benefit a
bit Suffer a bit Suffer
greatly Unaffected Don’t
know Local fishermen Migrant fishermen (Leantimo)
Migrant fishermen from the area (Belo, Morondava, etc…)
MNP Blue Ventures Tourist operators Boutry operators Local government (Commune)
Regional/national government
Other (specify) _____________
Finally: Do you have any questions you’d like to ask me, or any comments you’d like to add? Thank you very much for your time, and we hope you’ll be willing to talk with us again in the future.