shining pearl in the shadow of the cape town metro drakenstein … · shining pearl in the shadow...
TRANSCRIPT

SHINING PEARL IN THE SHADOW OF THE CAPE TOWN METRO: DRAKENSTEIN, A PLACE OF
(SPATIAL) EXCELLENCE?
SPATIAL DEVELOPMENT FRAMEWORK VISION
The Drakenstein Municipality located at the heart of the Winelands, and building on its assets – its dramatic scenic landscape, precious natural and cultural heritage, quality educational institutions and sporting facilities, thriving agricultural economy and unrivalled access to the regional access and logistics networks – will be a place of excellence for all its residents
(Drakenstein Municipality, 2015:19)
Report prepared by
Ronnie Donaldson
July 2017

Drakenstein | Page ii
TABLE OF CONTENTS
List of Figures ....................................................................................................................... iii
List of Tables ........................................................................................................................ iv
List of Acronyms ................................................................................................................... v
1. Introduction ...................................................................................................................... 1
2. Demographic and Economic Overview ............................................................................. 5
3. Main Spatial Transformation Issues .................................................................................. 9
4. Alignment with Other Plans ............................................................................................ 11
5. An Overview of The Spatial Development Framework .................................................... 13
6. Assessment of the Spatial Development Framework ...................................................... 20 6.1 The quality of the planning process ....................................................................................... 20 6.2 The quality of the plan ........................................................................................................... 23 6.3 Degree of implementation ..................................................................................................... 29
7. General Conclusions ...................................................................................................... 36
Reference List ..................................................................................................................... 39
Annexure A SPLUMA shortcomings .................................................................................... 42

Drakenstein | Page iii
LIST OF FIGURES
Figure 1: KWV wine producers ................................................................................................... 2
Figure 2: Wine farms .................................................................................................................. 2
Figure 3: Development of the Val de Vie .................................................................................... 3
Figure 4: The extent of gated development urban sprawl to the south of the N1 ...................... 4
Figure 5: A gated estate in the vineyards to the south of the N1 ............................................... 4
Figure 6: Mbekweni urban sprawl linking Paarl and Wellington spatially ................................... 5
Figure 7: The six themes of the Spatial Development Framework .......................................... 15
Figure 8: Matrix of six Spatial Development Framework themes, the ten spatial principles and
the new approaches matrix of themes ...................................................................... 16
Figure 9: Six key strategies of the Spatial Development Framework ...................................... 17
Figure 10: Location of the 13 focus areas .................................................................................. 18
Figure 11: Waterpoel: Agricultural land earmarked for development ......................................... 19
Figure 12: Paarl Gimnasium ....................................................................................................... 20
Figure 13: Informal infill housing in Mbekweni ........................................................................... 29
Figure 14: Formal infill project at the old prison in Paarl Central ................................................ 29
Figure 15: High priority project distribution ................................................................................. 33

Drakenstein | Page iv
LIST OF TABLES
Table 1: Comparative census data for selected data, 1996, 2001, 2011 ................................. 6
Table 2: Key statistics for Drakenstein Municipality (2011) ...................................................... 6
Table 3: Selected population, economic and infrastructure statistics ........................................ 7
Table 4: Drakenstein Municipality – Sectoral growth, 2005–2013 ............................................ 8
Table 5: Drakenstein Municipality – Sectoral growth for various periods ................................. 9
Table 6: Summary of organisational issues pertaining to the Spatial Development Framework
process ...................................................................................................................... 20
Table 7: Spatial planning concepts ......................................................................................... 25

Drakenstein | Page v
LIST OF ACRONYMS
ANC African National Congress
CBD Central Business District
CIP Capital Investment Plan
CWDM Cape Winelands District Municipality
DA Democratic Alliance
DM Drakenstein Municipality
DRDLR Department of Rural Development and Land Reform
EMF Environmental Management Framework
FA Focus areas
GDPR Gross Domestic Product Regional
GIS Geographic Information System
IDP Integrated Development Planning
IUDF Integrated Urban Development Framework
KPAs Key Performance Areas
LUPO Land Use Planning Ordinance
LUPA Land Use Planning Act
MSA Municipal Systems Act
NDP National Development Plan
RDP Reconstruction and Development Programme
RSA Republic of South Africa
SACN South African Cities Network
SDF Spatial Development Framework
SPLUMA Spatial Planning and Land Use Management Act
TOD Transit-Oriented Development
WCPSDF Western Cape Provincial Spatial Development Framework

Drakenstein | Page 1
1. INTRODUCTION
To understand the contemporary history of the Drakenstein Municipality (DM), it will
be necessary to briefly reflect on the formation of its current administrative and political
boundaries. Following the first phases of local government’s post-apartheid municipal
transition of the early 1990s, the Local Government Municipal Structures Act, Act 117
of 1998, made provision for the establishment of municipalities. A vexing question at
the time was whether the so-called fringe areas – Paarl, Wellington, Franschhoek,
Stellenbosch, and the Helderberg Basin (Strand, Gordon’s Bay and Somerset-West)
– had to be included in the Cape Town metropole. Whereas proponents of a larger
metropolitan area argued that the fringe towns “were inextricably linked with the
metropolitan area economically and in respect of services”, these assumptions were
disputed by these municipalities and they argued that the fringe areas were
“dependent upon the core area for only 13% of manufacturing inputs” (Cameron,
1999:120). The commuting figures from Paarl and Wellington to the Cape Town
metropolitan area were very low at 6.9% and 4.9%, respectively (Cameron, 1999).
After numerous public hearings and various reports, the Demarcation Board decided
to include only the Helderberg Basin. It was claimed that given the large tracts of
rural/agricultural land, these towns and their environs did not fulfil the criterion of being
densely populated in a metropolitan sense. The reports reviewed by the Demarcation
Board thus interpreted that large tracts of rural land located in the shadow of the
metropolitan area should not be included in the metro.
The Drakenstein Municipality (DM) was established in 2000 as one of five
municipalities located in the Cape Winelands District Municipality (CWDM) (the other
four are Stellenbosch, Witzenberg, Breede Valley and Langeberg) and is located
about 60 km north-east of the Cape Town inner city. The DM is strategically located
on the national road and railway route to the rest of South Africa and effectively forms
the gateway to the City of Cape Town. As will be shown in this report, by 2017 the
emphasis on rurality of the DM still features prominently in spatial plans as well as the
Spatial Development Framework (SDF).
There has, however, been a distinct historical rural settlement pattern in the area long
before the finalisation of the DM boundaries as we know it today. The Paarl valley was
first colonised in 1687 when land was allocated to 23 families from Stellenbosch. The
district was initially known as Drakenstein, named after its church congregation, but
when a village was founded at the foot of Paarl Rock in 1690, it was named Paarl
(South African History Online, 2012) – derived from Parel, meaning Pearl in Dutch.
The other settlements within the DM are also steeped in colonial history. Currently, the
DM covers an area of 1 538 km2 and comprises a mix of settlement types, namely the
intermediate city of Paarl, the small town of Wellington, the Saron mission station and
the two rural villages of Gouda and Hermon.

Drakenstein | Page 2
The Democratic Alliance (DA) is the dominant political force and has increased their
lead in votes by 9% between the 2011 and 2016 local government elections (2011 –
57%; 2016 – 66%). The African National Congress (ANC) has seen a drop in votes
from 31% to 24% over the same period. The municipality received unqualified audits
since 2012 (RSA, Department: National Treasury, 2016). The motto of the DM is
‘Place of Excellence’. Some national assets include a decentralised campus of the
Cape Peninsula University of Technology and a Paarl campus of the Boland College.
The DM is also home to the Boland Rugby Union (with its professional rugby team,
the Boland Kavaliers) that plays in the national Currie Cup rugby league.
The spatial (and segregated) geography of the urban conurbation of Paarl/Wellington
is defined by a river (the Berg River), a national highway (N1) and a town’s boundary.
To the west of the river is the predominantly former ‘whites only’ part of Paarl – mostly
well-off citizens, loaded with heritage, the central business district (CBD), a regional
mall, as well as the KWV South Africa (Pty) Ltd. wine producers, and some wine farms
located within the urban area (Figure 1 and Figure 2). The psyche of Paarl West (the
main urban area in the DM) is strongly based on tradition and heritage. The school
you attended puts you in a specific ‘grouping in society’, whether it is Paarl Boys’ High
or Paarl Gimnasium (the two well-known and highly sought-after top-rated model-C
schools). Inkommers (inmigrants) are not easily assimilated into the broader
community.
Source: Author’s own (2017) Source: Author’s own (2017)
Figure 1: KWV wine producers Figure 2: Wine farms
To the east of the river one will find the former coloured and black residential areas,
the predominately low-middle income class, but with pockets of middle income
residents in the coloured areas. The psyche of Paarl East is mainly that of survival. To
the south of the N1 is a ‘sprawl’ of urban sprawl! Three major gated developments
(Boschenmeer Golf Estate, Val de Vie Winelands Lifestyle Estate and the Pearl Valley
Golf Estate and Spa) were developed since the 1990s, and are spatially separated
from the rest of the urban built-up area of Paarl by the national highway (N1). Figure 3

Drakenstein | Page 3
shows the area in the distance being cleared for the next phase of sprawled
development of the Val de Vie. The psyche there is that of affluence, exclusion and
segregation.
Source: Author’s own (2017)
Figure 3: Development of the Val de Vie
Across the Paarl town boundary lies Wellington which is said to be a very close-knit
community where inkommers find it extremely difficult to assimilate. The main urban
area of the DM is therefore essentially divided into four segregated compartments.
The elongated shaped conurbation of Paarl, Mbekweni and Wellington forms the
urban core of the municipality and makes for an interesting urban growth scenario.
The length of the urban sprawled gated estates south of the N1 is almost the length of
Paarl West (Figure 4).

Drakenstein | Page 4
Note: Northern blue line depicts the total length of the Paarl (main central part) and the southern blue line depicts the gated developments. Source: Adapted from Google Maps (2017)
Figure 4: The extent of gated development urban sprawl to the south of the N1
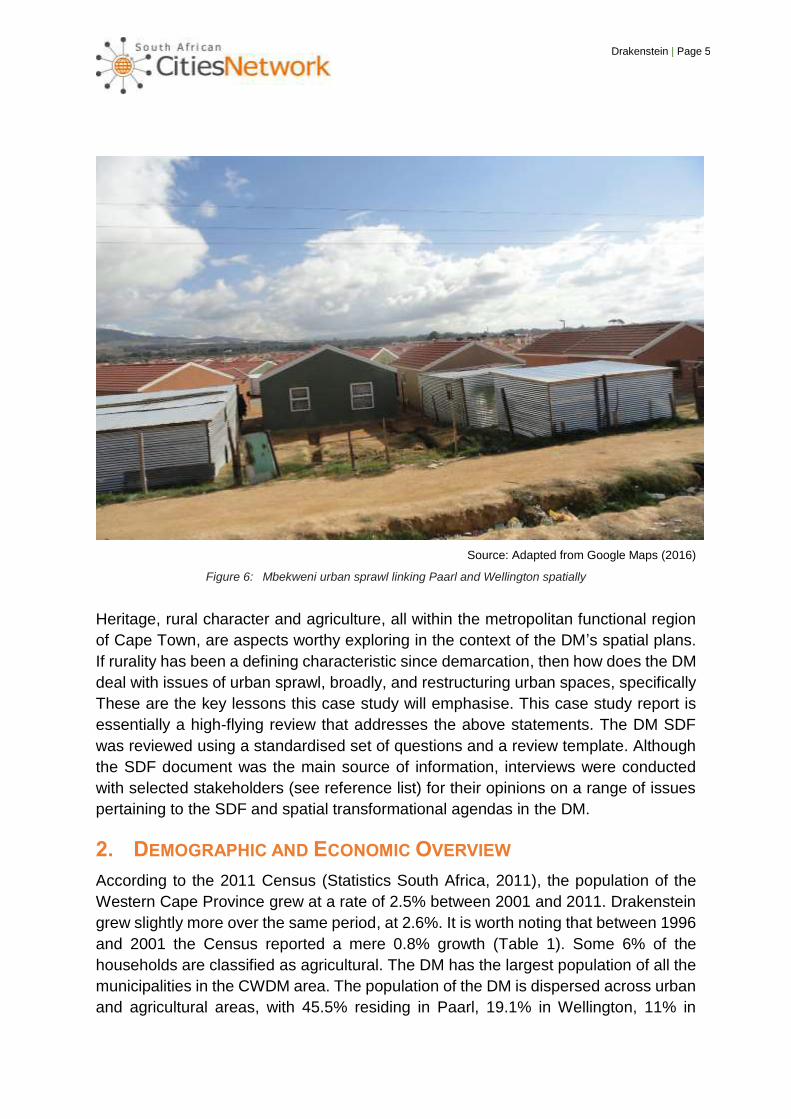
Figure 5 shows a gated estate in the vineyards to the south of the N1. In addition,
Paarl has, through the dramatic expansion of the Mbekweni township since the 2000s,
spatially grown towards Wellington. As a result, the main township area of Mbekweni
is at present comfortably in the middle between the two towns (Figure 6). It is evident
that housing provision remained being driven by a socio-political logic and not an
economic logic (South African Cities Network [SACN], 2014).
Source: Author’s own (2017).
Figure 5: A gated estate in the vineyards to the south of the N1
Drakenstein | Page 5
Source: Adapted from Google Maps (2016)
Figure 6: Mbekweni urban sprawl linking Paarl and Wellington spatially
Heritage, rural character and agriculture, all within the metropolitan functional region
of Cape Town, are aspects worthy exploring in the context of the DM’s spatial plans.
If rurality has been a defining characteristic since demarcation, then how does the DM
deal with issues of urban sprawl, broadly, and restructuring urban spaces, specifically
These are the key lessons this case study will emphasise. This case study report is
essentially a high-flying review that addresses the above statements. The DM SDF
was reviewed using a standardised set of questions and a review template. Although
the SDF document was the main source of information, interviews were conducted
with selected stakeholders (see reference list) for their opinions on a range of issues
pertaining to the SDF and spatial transformational agendas in the DM.
2. DEMOGRAPHIC AND ECONOMIC OVERVIEW
According to the 2011 Census (Statistics South Africa, 2011), the population of the
Western Cape Province grew at a rate of 2.5% between 2001 and 2011. Drakenstein
grew slightly more over the same period, at 2.6%. It is worth noting that between 1996
and 2001 the Census reported a mere 0.8% growth (Table 1). Some 6% of the
households are classified as agricultural. The DM has the largest population of all the
municipalities in the CWDM area. The population of the DM is dispersed across urban
and agricultural areas, with 45.5% residing in Paarl, 19.1% in Wellington, 11% in

Drakenstein | Page 6
Mbekweni; and a small percentage residing in Victor Verster, Saron, Gouda,
Drommedaris, and in the Reserves. Coloureds (60%) make up the bulk of the
population, followed by blacks (26%) and whites (13%).
TABLE 1: COMPARATIVE CENSUS DATA FOR SELECTED DATA, 1996, 2001, 2011
Selected characteristics of Drakenstein Municipality
1996 2001 2011
Total population 184 932 194 417 251 262
Population growth rate No data 0.8
(1996–2002) 2.6
(2001–2011)
Unemployment rate 16.3% 22.8% 17.2%
Employed (aged between 15 and 64) 64 266 65 209 83 824
Average household size 4.3 4.1 3.9
Households by formal dwellings 34 790 36 360 50 875
Households by informal dwellings 6 422 7 089 8 015
Source: Compiled from Statistics South Africa (2011)
Statistics on the unemployment rate of the DM (17%) shows that it is lower than the
provincial (22%) and national (30%) rates (Table 1). Although the average household
size has decreased by 0.2% between 2001 and 2011, the number of households has
increased by just over 15 000 over the same period. Informal dwellings have increased
slightly by just under 1 000 units over this ten-year period. Other selected
demographic, economic and infrastructure data are shown in Table 2 and Table 3.
TABLE 2: KEY STATISTICS FOR DRAKENSTEIN MUNICIPALITY (2011)
Number of households 59 774
Number of agricultural households 3 645
Housing owned/paying off 46.3%
Flush toilet connected to sewerage 90.2%
Weekly refuse removal 86.1%
Piped water inside dwelling 80%
Electricity for lighting 95%
Source: Drakenstein Municipality (2016)

Drakenstein | Page 7
TABLE 3: SELECTED POPULATION, ECONOMIC AND INFRASTRUCTURE STATISTICS
DRAKENSTEIN POPULATION
Indicator 1996 2001 2011 2016
Total number of people 186 334 194 417 251 262 280 195
Total number of people – urban N/A N/A 214 389 257 505
Total number of people – rural N/A N/A 36 873 22 690
Rural – traditional N/A N/A
Rural – commercial farms N/A N/A 36 873 22 690
Total number of households 42 108 44 410 59 774 71 686
Average annual growth rate of population since previous period
N/A 0.9 2.6 2.2
Average annual growth rate of households since previous period
N/A 1.1 3.0 3.7
Density
Total area of the municipality 1 538 km² 1 538 km² 1 538 km² 1 53 8km²
Total area of built-up area (urban area) 48 km² 55 km² 61 km² 64 km²
Persons per m2/density per km² 126.41 per km² 163.4 per km²
Persons per m2 for built-up area 126.41 per km² 163.4 per km²
Households per m2 for built-up area 0.0008 per m²/ 807 per km²
0.0009 per m²/ 980 per km²
DRAKENSTEIN ECONOMY
Total population 186 334 194 417 251 262 280 195
Total number of people employed 65 253 65 323 87 336 N/A
Employed people as a percentage of total population
35.0 33.6 34.8 N/A
Unemployment rate N/A 22.8 17.6 N/A
Youth unemployment rate N/A 60.3 47.1 N/A
Average household income N/A 67 687 143 354 N/A
Annual growth in household income (2001–2011)
N/A N/A 7,8 N/A
Average annual CPI (2001–2011) N/A N/A 5,9 N/A
Dependency ration N/A 49,5 44,5 52.9
DRAKENSTEIN INFRASTRUCTURE
Indicator 1996 2001 2011 2016
Total number of households 42 108 44 410 59 774 71 686
Number of households with indoor water access 30 707 29 247 47 827 60 557
% of households with indoor water access 72.9 65.9 80.0 84.5
Number of households with flush toilet access 35 998 39 384 55 984 70 529
% of households with flush toilet access 85.5 88.7 93.7 98.4
Number of households with electricity access 35 115 38 550 56 800 68 527
Percentage of households with electricity access 83.4 86.8 95.0 95.6
Number of households living in informal structures
6 422 7 089 8 015 6 825
% of households living in informal structures 15.3 16.0 13.4 9.5
Hectare of land occupied by informal settlements
Value of all building plans submitted R123 555 200 R135 435 241 R563 432 515
Source: Source: Drakenstein Municipality (2016)

Drakenstein | Page 8
The small-town growth potential study that informed the Western Cape Provincial
SDF, found that Drakenstein was considered a municipality with very high growth
potential (only 5 out of 24 municipalities in the province were grouped in this category)
(Van Niekerk et al., 2014). Despite this status, the DM’s growth trend was a modest
3% over the period 2005–2013 (Table 4); only the third fastest growing local
municipality in the CWDW after Stellenbosch (4.8%) and Langeberg (4.3%). The DM
growth trend is also below the average provincial (3.4%) and district (3.5%) rates
(Western Cape Government Provincial Treasury, 2015:20a and b). Nevertheless, the
DM contributed the second largest share (31%, R15.4 billion) to the district’s Gross
Domestic Product Regional (GDPR) in 2013.
Given the agricultural context of the DM, it is not surprising that agriculture and related
industries play a major role in the municipality’s economy. More than a quarter of the
workers (27%) are employed in the agricultural sector, 16% in social services, 14% in
manufacturing and 12% in trade (DM, 2010). The three largest contributors to GDPR
in 2013 for Drakenstein were the financial sector, insurance and business services
(30%), manufacturing (23%), as well as the wholesale, retail, trade, catering and
accommodation sectors (12%). The “finance and wholesale industries form part of the
broader commercial services sector and maintained the highest growth rate
throughout the period 2005–2013” (Western Cape Government Provincial Treasury,
2015a:23).
The DM sectoral growth rates from different sources and for various periods are shown
in Tables 4 and 5.
TABLE 4: DRAKENSTEIN MUNICIPALITY – SECTORAL GROWTH, 2005–2013
Industry Drakenstein Municipality
Agriculture, forestry and fishing 1.0
Manufacturing 0.6
Construction 3.4
Commercial services (inclusive of finance and wholesale) 5.1
General government and community, social and personal services 2.2
Other (fringe economic activities/industries within the region which includes
mining and quarrying, transport, storage and communication, as well as water
and electricity services)
4.1
Overall growth total 3.0
Source: Western Cape Government Provincial Treasury (2015a:21)
From Table 4 it can be seen that strong growth was experienced over the nine-year
period within the construction and commercial services sectors that maintained an
average growth rate of 3.4% and 5.1%, respectively. Manufacturing (0.6%) was the
worst performing sector. That said, although the agricultural sector performed
relatively weak, it did maintain the second highest growth rate amongst local

Drakenstein | Page 9
municipalities within the Cape Winelands (Table 4). The Drakenstein agricultural
sector also outperformed the district’s average agricultural growth rate (0.6%). The
performance of the agricultural sector is encouraging, considering that there has been
a noticeable contraction of this sector throughout the province (Western Cape
Government Provincial Treasury, 2015a:22). Construction and finance has
experienced the best growth rates between 1996 and 2015, followed by finance,
insurance, real estate and business services (Table 5).
TABLE 5: DRAKENSTEIN MUNICIPALITY – SECTORAL GROWTH FOR VARIOUS PERIODS
Sectors 1996–2001
2001–2011
2011–2015
1996–2015
2001–2015
Total 2.2 3.2 2.2 2.7 2.9
I01: Agriculture, forestry and fishing [QSIC 1] 2.3 2.5 1.2 2.2 2.2
I02: Mining and quarrying [QSIC 2] 15.9 0.3 1.4 4.3 0.2
I03: Manufacturing [QSIC 3] 0.3 2.4 2.1 1.6 2.3
I04: Electricity, gas and water [QSIC 4] 2.4 4.5 1.9 3.4 3.8
I05: Construction [QSIC 5] 0.8 12.1 5.0 7.5 10.0
I06: Wholesale and retail trade, catering and accommodation [QSIC 6]
6.7 5.1 3.4 5.2 4.6
I07: Transport, storage and communication [QSIC 7] 7.2 4.0 2.4 4.5 3.5
I08: Finance. insurance, real estate and business services [QSIC 8]
4.8 7.0 3.8 5.7 6.1
I09: General government [QSIC 91] 2.9 3.0 2.2 1.2 2.8
I10: Community, social and personal services [QSIC 92–96, 99]
4.0 4.3 2.8 3.9 3.8
Drakenstein has dropped its position as top contributor to district GDPR (overtook by
Stellenbosch) and its “growth has been subdued and below average over the past
decade. The adverse employment trend in agriculture and construction, which did not
abate during the economic recovery period, 2010–2013, is a worrying aspect of the
regional economy. On the other hand, the relatively strong manufacturing recovery
(2010–2013), which arrested the adverse employment trend in this sector, is
heartening. A more vibrant manufacturing sector will ensure that the relatively robust
growth in the region’s commercial services sectors can be sustained” (Western Cape
Government Provincial Treasury, 2015b).
3. MAIN SPATIAL TRANSFORMATION ISSUES
Williams’ (2000:169) conception of transformation – a term more often than not used
loosely and sometimes interchangeably with urban restructuring – is used in the State
of South African Cities Report (South African Cities Network [SACN], 2016:58) to
explain its abstract and fluid meaning: “a spatially defined, socially embedded process;
… an interrelated series of materially driven practices, whereby the form, substance
and overall dimensions of urban space are purposefully changed to reflect the
Drakenstein | Page 10
principles of a more equitable social order”, and it is a fluid process of change,
organically linked to the past, present and future. In a 2014 conference on spatial
transformation of cities hosted by the SACN, transformation of cities was suggested
to mean involving “spatial and social transformation, and requires the collaboration
and support of all role-players (public sector, private sector, business and residents)
where politics is seen as a governance issue and where space is contested” (SACN,
2014). It is argued that the challenge of urban transformation is to “balance the long-
term urban vision of inclusive, liveable, sustainable and resilient cities with the short-
term realities of urban spaces designed for segregation, migration and poverty. The
need is for a shared vision and collaboration across government spheres, the private
sector and citizens” (SACN, 2014).
Most spatial transformation issues arise from the relationship between transport,
human settlements and economic opportunity. Development issues typically arising
from such spatial transformation include economic opportunity isolation/exclusion;
economic consumption isolation; welfare exclusion; growing commuter distance and
cost issues; lack of racial integration in space (or persistent racial segregation); spatial
inequality and its ongoing exacerbation; rampant and uncoordinated spatial growth;
income threshold problems in spatially homogeneous areas (incomes and densities);
high costs of doing business for firms; high costs of governance and servicing for
government; unnecessary loss of agricultural land; and environmental issues.
The participants in the study were asked to identify the main spatial transformation
challenges that should be addressed by the city and how significant these are with
regard to other development and transformation goals. In no particular order, the
participants identified the five most prominent challenges as: (i) the need for public
transport, (ii) politics (political interference and lack of political will coupled with own
agendas of the private sector), (iii) infrastructure (renewal, upgrading, new
infrastructure), (iv) development pressures, and (v) dealing with vacant municipal-
owned land. Some more explanation about the above are as follow:
$ First, the current public transport system is complicated, highly contested and lead
to volatile situations between different combi-taxi companies. Although the SDF
does not refer to non-motorised transport systems as part of a city-wide transport
plan, the idea of introducing a public transport system similar to MyCiti in Cape
Town is needed for a better functioning transit-oriented development (TOD)
(namely to align a transport system with the suggested spatial TOD).
$ Second, politics is a major stumbling block in advancing the course for the
development of a truly just and equitable transformed city. Some choices of spatial
planning decisions made by the Drakenstein Municipal Council are counter the
calls for creating a sustainable city. Councillors (by implication therefore politicians)
are easily persuaded by private developers to allow for developments that are
contradictory to sustainable planning principles.

Drakenstein | Page 11
$ A third major spatial transformation issue mentioned is that of the upgrading of
basic infrastructure: aging infrastructure, rapid migration in the predominately
informal settlements (in need of infrastructure) and new developments (existing
substations provided by the municipality are over-capacitated). The infrastructure
dilemma was stated by one participant as ‘a hot potato’.
$ A fourth problem was dealing with the pressure for development in certain parts of
the city. The two main areas of developmental growth pressures are for gated
developments and informal housing. As might be expected, politics are intertwined
with development applications. The case in point is the development of Paarl South
(below the N1). What started out as urban sprawl of gated developments are now
being pressurised for the mixing of land uses, and in doing so ‘invading’ more green
fields. Tensions are created between private businesses with interest in the core
of the city as opposed to those wanting to invest in the mixed-use areas of the
gated development node. Another conflict that arises here is how such new
developments are to take place, taking the sensitive biodiversity, general
environmental conditions, as well as sense of place, into consideration. A group of
town planning students and lecturers from the University of Cape Town are in the
process of advising the DM on suitable spatial development of the area. Although
the Provincial Department of Environmental Affairs is also advising the municipality
in this regard, they also have difficulty in finding appropriate solutions on how to
balance the different issues, namely agriculture, environment, residential and
mixed-use developments, and social services (that will be needed as a
consequence of these developments). The DM expressed their desire to conduct
a study to determine if the heavy economic burden placed on city infrastructure
and services outweighs the financial benefit from property tax (as argued by
developers).
$ The spatial planning department has recently completed an audit of municipal-
owned property that is suitable for development (of which there are a lot
apparently). The information is, however, confidential and cannot be shared due to
the sensitivity of the issue. Therefore, as a fifth challenge, the Drakenstein Council
has to be convinced that these pockets of vacant land should be developed
appropriately to advance spatial transformation and not merely to benefit private
developers. However, there is no intention to apply for transformation planning
such as mixed-income areas.
4. ALIGNMENT WITH OTHER PLANS
The DM SDF is based on a set of generic spatial considerations, namely:
• The central spatial principles that have informed the framework proposals for each
focus area.
• An expansion of the principles and their implications for the approaches to the SDF
proposals.

Drakenstein | Page 12
• A common set of elements making up the spatial frameworks (such as the
components of the framework).
• The interpretation of the land use implications for the focus area frameworks (DM,
2015:15).
The SDF planning agenda is framed within the following policies and legislation:
National Development Plan (NDP); Spatial Planning and Land Use Management Act,
2013 (SPLUMA); Western Cape Land Use Planning Act, 2014 (LUPA); Western Cape
Provincial SDF (WCPSDF); Drakenstein Integrated Development Plan (IDP); and the
Drakenstein Joint Planning Initiative (a project between DM and the Western Cape
Provincial Government that aims to identify joint priorities for the Drakenstein area, as
well as to attain complete agreement on the joint initiatives that will support those
priorities) (DM, 2015:12).
In addition to the policies above, the SDF is based upon the following points of
departure:
• The revision of the urban edge, approved by the Drakenstein Council, as part of
the 2010 SDF, was not included in the scope of this SDF review. Only minor
adjustments to align with approvals granted since 2010 were incorporated.
• At the same time, the assumption that all land within the urban edge is developable,
is questioned as a starting point to land use decisions, and accordingly, the 2010
SDF has made recommendations for land within the urban edge to retain its rural
character.
• Limiting development of land within the urban edge is the availability of
infrastructure capacity in the short to medium term. These limitations have been
considered in the implementation framework of the SDF. Limitations in the capacity
of the bulk infrastructure networks of the municipality will impact on the time frames
for the development of land parcels, identified as suitable for development. The
SDF includes prioritisation of development options for the short, medium and long
term, but ultimately the implementation of this plan is dependent on the municipal
budget allocation.
• The findings of the Environmental Management Framework (EMF) for the DM, and
in particular the identification of critical biodiversity areas, were adopted as a
starting point. It is, however, noted that since the publication of the draft EMF, some
ground-truthing has been conducted and this information was used to refine the
proposals.
• The findings of the heritage survey for the municipal area (Drakenstein Heritage
Survey Group, 2010), including the proposed heritage overlay zones, were taken
as a point of departure. However, supplementary research may be needed to
identify heritage resources related to pre-colonial history and the struggle against
apartheid. The municipality is in the process of compiling heritage-related by-laws

Drakenstein | Page 13
and character statements for these proposed Heritage Overlay Zones. The
character statements will comprise a character description, a list of character
forming elements and a list of decision-making criteria for all proposed
developments within these areas.
• The land use management principles employed in the protection of the ‘Paarl
Farms’ Policy, inform the reservation of peri-urban agricultural areas within, and
peripheral to, the urban edge in order to protect high value and unique agricultural
land; ensure ongoing agricultural production and food security; protect the heritage
value of the working landscape; facilitate agrarian reform and address food
insecurity in urban communities (DM, 2015:13).
5. AN OVERVIEW OF THE SPATIAL DEVELOPMENT FRAMEWORK
To achieve the suggested spatial outcomes of the SDF, ten interrelated spatial
development principles and six spatial logic themes manifested in six key strategies
for future spatial development. The 2015 SDF has set out ten interrelated spatial
development principles to guide the formulation of the focus area proposals and the
future development of the DM:
i. Continuity of green networks: Ensure the continuity and connection of core
biodiversity areas, river systems and landscape elements to establish connected
green networks.
ii. Establish well-defined and designed development – open space interfaces:
Ensure that the interface between green space and development is well
designed so that open space is overlooked and not edged by blank edges.
iii. Protect and enhance rural character: Ensure that all interventions in rural
areas are of an appropriate scale and nature to support rural livelihoods, whilst
at the same time protecting the sense of place and the agricultural resource base.
iv. Enable strategic densification: Densify residential development and cluster
activities in these areas for efficient use of infrastructure and available land.
v. Enable and promote mixed-use: Promote a mix of uses around nodes and
along corridors within the accessibility grid.
vi. Protect and enhance heritage resources: Acknowledge the importance of
heritage resources and carefully manage impacts at all scales of planning and
development, from the broader DM landscape and its settlement pattern to
individual buildings.
vii. Ensure connectivity between settlements and a hierarchy of nodes and
connectivity within settlements: Connect nodes and communities via safe and
attractive public transport and pedestrian friendly routes and activity corridors
within a hierarchical accessibility grid.

Drakenstein | Page 14
viii. Promote spatial integration: Facilitate integration through well-located new
development and infill, reducing barriers between communities and enabling
more efficient access to facilities and opportunities.
ix. Establish an accessible hierarchy of public facilities: Locate new facilities
and resources so that they relate to the accessibility grid. High-order regional
facilities should be within easy reach of the primary public transport and street
network.
x. Cluster social facilities: Cluster social facilities and activities within nodes to
optimise accessibility and convenience, while also improving security and
maintenance (DM, 2015:15-18).
The six themes that drive the spatial logic of the SDF are shown in Figure 7. In the
centre are the core elements of economy, infrastructure and tourism that are cross-
cutting the six themes. Ten land use management implications for each of the
elements that combine to constitute the SDF for each area, are then set out in the SDF
(DM, 2015:21). These are: Retained Rural Areas; Protected Green Core and Green
Gateways; Peri-Urban Farming; Agrarian Settlement Development; Urban Infill;
Industrial Core; Densification Zone; Nodes and Community Spines; Gateways; and
Scenic Routes.
A matrix of alignment between the six SDF themes, the ten spatial principles and the
new approaches to development is shown in Figure 8.

Drakenstein | Page 15
Source: DM (2015:20)
Figure 7: The six themes of the Spatial Development Framework

Drakenstein | Page 16
Source: DM (2015: 24)
Figure 8: Matrix of the six Spatial Development Framework themes, the ten spatial principles
and the new approaches matrix of themes
The SDF then distils the key spatial elements highlighted in the six themes into a high
level spatial concept that comprises six key strategies for the future spatial
development of the municipal area (Figure 9).

Drakenstein | Page 17
Six key strategies:
1. Focus growth in areas of socio-economic opportunity where multiplier effects already exist, for example the large urban settlements of Paarl, Mbekweni and Wellington.
2. Minimise spatial growth in the smaller settlements where economic opportunities are limited.
3. Protect the natural and agricultural resource base of the municipality as the basis of the local economy.
4. At the same time, allow for opportunities to broaden participation in key sectors such as agriculture and agroprocessing through small-scale peri-urban farming and expansion of industrial opportunities.
5. Protect and enhance the scenic and heritage assets of the municipality by limiting the expansion of the footprint of historic settlements, for example focussing on infill development.
6. Plan for future growth in the area to the south of the N1 in a holistic manner to ensure the establishment of an integrated settlement with a variety of opportunities, for example insuring that returns on infrastructure investment are maximised.
Source: DM (2015:31)
Figure 9: Six key strategies of the Spatial Development Framework
Although the SDF seemingly places much emphasis on the rural and natural
environments, it only focusses on 13 so-called urban focus areas (FA): FA1 Paarl;
FA2 Paarl East; FA3 Mbekweni; FA4 Wellington; FA5 Paarl South; FA6 Simondium;
FA7 Ben Bernhard; FA8 Klapmuts North; FA9 Windmeul; FA10 Hermon; FA11 Gouda;
FA12 Saron; FA13 Bainskloof Village (Figure 10). The rural areas are dealt with at a
broader municipal scale within the environmental management SDF theme.
Each of these areas are being guided by the 10 land use elements. A key spatial
restructuring component in the FAs is densification:
The Focus Area Plans identify areas for densification in well-located areas to
support transit oriented development in alignment with higher density mixed use
developments. Such densification could include formalising backyard dwellings,
redevelopment of existing buildings and residential conversions and subdivisions.
The motivation for this is to decrease the impacts of new growth on the long term
operating costs for the municipality by containing the extent of infrastructure and

Drakenstein | Page 18
transport networks. Equally important is the role that this spatial containment can
play in reducing the loss of agricultural land, cultural landscapes and ecosystems.
A total area of 414 ha has been identified for densification in well located nodes
(DM, 2015:45).
Source: DM (2015:50)
Figure 10: Location of the 13 focus areas
It is evident from the SDF that the DM has a strong emphasis on retaining the
farm/rural, heritage and biodiversity character of the municipal area. Contrary to the
shortcomings of applying an urban edge policy until the early 2000s (Smit, Interview),
the current SDF makes provision for retaining/conserving some open spaces/farm
areas within the urban edge. However, the SDF also contradicts itself by saying that
residential development on farmlands at Waterpoel (Figure 11) will be allowed:
“Adjusting the urban edge to include area south of Waterpoel for future low density off-
grid low impact rural lifestyle development to attract investment to Windmeul and
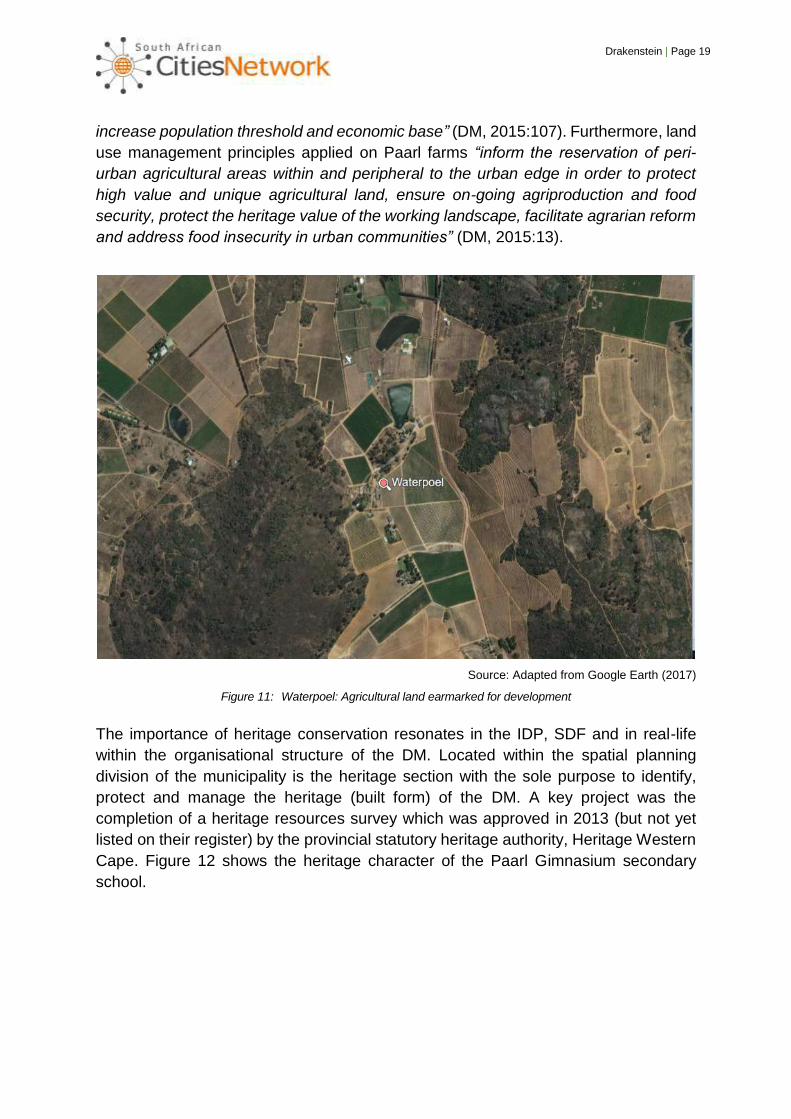
Drakenstein | Page 19
increase population threshold and economic base” (DM, 2015:107). Furthermore, land
use management principles applied on Paarl farms “inform the reservation of peri-
urban agricultural areas within and peripheral to the urban edge in order to protect
high value and unique agricultural land, ensure on-going agriproduction and food
security, protect the heritage value of the working landscape, facilitate agrarian reform
and address food insecurity in urban communities” (DM, 2015:13).
Source: Adapted from Google Earth (2017)
Figure 11: Waterpoel: Agricultural land earmarked for development
The importance of heritage conservation resonates in the IDP, SDF and in real-life
within the organisational structure of the DM. Located within the spatial planning
division of the municipality is the heritage section with the sole purpose to identify,
protect and manage the heritage (built form) of the DM. A key project was the
completion of a heritage resources survey which was approved in 2013 (but not yet
listed on their register) by the provincial statutory heritage authority, Heritage Western
Cape. Figure 12 shows the heritage character of the Paarl Gimnasium secondary
school.

Drakenstein | Page 20
Source: Author’s own (2017)
Figure 12: Paarl Gimnasium
6. ASSESSMENT OF THE SPATIAL DEVELOPMENT FRAMEWORK
6.1 The quality of the planning process
To understand the quality of the plan, a number of organisational and capacity-related
questions were posed to participants, as summarised in Table 6.
TABLE 6: SUMMARY OF ORGANISATIONAL ISSUES PERTAINING TO THE SPATIAL DEVELOPMENT
FRAMEWORK PROCESS
Questions 2015 – Five-year review 2016/2017- Annual amendment
To what extent and how did the IDP process influence the SDF process?
IDP Key Performance Areas (KPAs) correlated to SDF themes, no in-depth linkage
New chapter built into SDF to discuss alignment of SDF with IDP
What was the reasoning behind appointing a consortium to do the SDF?
Specialist input. Expertise not all appointed in municipality
Consultant appointed to do part of SDF amendment
What was the budget for the development of the SDF?
R1.2m
What is the budget for administration and monitoring? (annually)
R180 000.00
What was the process, relationship between municipality (and the various departments) and service provider?
Very good relationship Very good relationship

Drakenstein | Page 21
Table 6 continued:
Note: 2016/17 annual review of SDF was not yet approved by Council at time of writing.
The timing of SDF approval was not yet aligned with two other crucial processes,
namely the IDP and the Municipal Infrastructure Master Plan. These all take place in
separate years, so the processes ‘are never on the same page’ in terms of planning
and budgets, according to one participant. Only with the annual review of the SDF in
2017 is there an attempt to align it with the IDP. The timeframe and process of
finalising an IDP and SDF are also different; where the IDP takes less than a year, the
SDF takes up to 18 months to complete.
There appears to be that no power play was at stake between departments in the
municipality, between the municipality and provincial/national government and
between government and the private sector. The real power play takes place in
Council among the councillors. The DM seems to have very good working relations
Questions 2015 – Five-year review 2016/2017- Annual amendment
What is the institutional capacity of the planning/spatial planning function in the municipality? How many persons are employed in the spatial planning / planning department? Number of people employed and at which level?
Spatial Planning Division Manager Senior Town Planner (1) Town Planner (1) Assistant Town Planner (1)
Spatial Planning Division Manager Senior Town Planner (1) Town Planner (1) Assistant Town Planner (1)
Does the municipality have a geographic information system (GIS)?
Yes Yes
How is it kept up to date? Capacity constraints – only 1 GIS operator
Capacity constraints – only 1 GIS operator
Was it used in the latest SDF preparation?
No No
If not in-house, what was the process, relationship between municipality and service provider?
In terms of tender requirements; Very good relationship
In terms of tender requirements; Very good relationship
To what degree was other municipal departments involved (engineering, finance) in SDF?
Community Services (Parks, Housing) Fair Finance Poor Infrastructure Good Environmental Good IDP Good
Community Services (Parks, Housing) Good Finance Poor Infrastructure Good Environmental Good IDP Good
To what extent have stakeholders been consulted in the SDF process?
Invitations to Business Chamber and members on IDP database; councillor workshops, public meetings, chariot, adverts, open days
Adverts to public, adjoining municipalities, departments: Department of Environmental Affairs and Development Planning, agriculture national and provincial, Department of Rural Development and Land Reform (DRDLR), transport, Cape Nature
The approval process and dates – need to establish that it is an approved policy of the municipality (was approved by Council) and approved as part of the IDP as per the Municipal Systems Act (MSA).
Approved by Council on 28 October 2015 in terms of MSA
A report to be submitted to MAYCO during May 2017; approved as core component of the IDP

Drakenstein | Page 22
with the provincial and district municipality. The relationship with neighbouring
Stellenbosch Municipality has strengthened over the past couple of years. Two spatial
nodes, Klapmuts and Simondium, straddles both the municipalities, complicating
shared integrated planning. In the case of Klapmuts, Stellenbosch Municipality has
now taken the lead in preparing a spatial plan (hence only one consultant employed
by Stellenbosch). The WCPSDF has consulted with the DM in the preparation of the
provincial SDF, specifically about Klapmuts. At Simondium, on the other hand,
duplication in processes occurred, instead of merely facilitating communication
between the two municipalities. It was stated that “if you want to apply for Municipal
Infrastructure Grant funding for farm workers and Stellenbosch do the same, in the
process the applications are weakened as opposed to it having been a single
application for the area”.
The public – although they supported the SDF and its principles according to the SDF
statement – objected to increased densities and subdivisions, apparently associating
higher densities with low-income housing. The strength of the free market reigns
supreme, where its interests are not in line with the need for spatial transformation
(Nel, 2017). The SDF is not meant to be prescriptive in terms of housing typologies,
but must instead only be seen as a broader plan. Land use and housing departments
do not want to be prescribed by the SDF; they want to use it as a guide only.
Integrated planning is evident in the cross-cutting themes. As mentioned earlier,
economy, tourism and infrastructure were identified as the three core elements across
the six cross-cutting themes and the ten land use management principles of the SDF.
Tourism is indirectly linked to what can be considered as the three strongest aspects
of the SDF, namely heritage, agriculture and the environment. For example, heritage
tourism, agricultural tourism (local foods and production) and a focus on eco-tourism
(with a strong focus on the natural environment) and planned for in an integrated
manner. Yet, tourism is not a strong industry in DM as it has to compete against
Franschhoek and Stellenbosch.
The plan does not strongly speak to economic prospects and how economic planning
in a spatial context can be advanced. The plan also does not directly address the issue
of spatial transformation. In view of the national policy directive of spatial
transformation, the Integrated Urban Development Framework (IUDF) and its ‘new
deal’ is to maximise “the potential of urban areas by integrating and aligning
investments in a way that improves the urban form” as well as “retrofitting the existing
city footprint to produce compact, coordinated and connected cities, using transit-
oriented development (TOD) and other urban planning strategies to yield desirable
social, economic and environmental outcomes” (RSA, Department of Cooperative
Governance and Traditional Affairs [CoGTA], 2016:43). The DM addresses these
spatial ideals to some extent. Similarly, there is a mixed feeling as to how the DM
addresses the following IUDF policy levers to help restructure urban space:

Drakenstein | Page 23
$ Reducing travel costs and distances.
$ Preventing further development of housing in marginal places.
$ Increasing urban densities to reduce sprawl.
$ Improving public transport and the coordination between transport modes.
$ Shifting jobs and investment towards dense peripheral townships.
$ Making cities and human settlements inclusive, safe, resilient and sustainable.
$ Developing and implementing holistic disaster risk management at all levels (RSA
CoGTA, 2016:36).
Although many of the aspects of the SDF indirectly speak to transformation as a spatial
project, there is no single dedicated plan for spatial transformation and the DM is not
considering one soon.
6.2 The quality of the plan
SPLUMA, implemented on 1 July 2015, and LUPA ushered in a new era of decision-
making in planning and development where the responsibility rests largely on local
municipalities to fulfil their role as land use planning decision-makers as per
constitutional mandates and obligations. Section 24(1) of SPLUMA determines that a
municipality must, after consultation as prescribed in the Act, adopt and approve a
single land use scheme for its entire area within five years from the commencement
of this Act. This land use scheme serves as a tool for municipalities to guide and
manage development according to their vision in terms of its IDP and SDF. This will
provide potential developers and land users with a clear indication of developable land
and its associated land uses within the municipal space. Clarity in land use zones can
avoid any future confusion and lengthy delays in terms of prospective
developments/uses. Currently, many municipalities have a Land Use Management
Scheme in place in the form of Zoning Schemes, which are compliant with the
provisions of the Land Use Planning Ordinance, Ordinance 15 of 1985 (LUPO). These
are known as LUPO section 7 and 8 schemes. The process has commenced to
replace these schemes to meet the requirements for Integrated Zoning Schemes
(Land Use Schemes) in terms of section 24 of SPLUMA. Transitional arrangements
following the planning law reform should be noted. The DRDLR and Circular 1 of 2015
of the South African Local Government Association (SALGA), noted that a municipality
can continue to operate within old-order legislative parameters in so far as that
legislation does not conflict with SPLUMA. The circular proposed that the decision-
making structures associated with SPLUMA must be applied (Western Cape
Government Provincial Treasury, 2015b:27).
The DM has not yet implemented the LUPA. However, their Council has adopted
delegations and tariff structures in place. The municipality currently has a Land Use
Management Scheme in the form of Zoning Schemes, that is compliant with LUPO.
The process has commenced to replace these schemes, known as LUPO section 7
and 8 schemes, in due course to meet the requirements for the Integrated Zoning

Drakenstein | Page 24
Scheme in terms of section 24(1) of SPLUMA (Western Cape Government Provincial
Treasury, 2015b:28).
According to the SACN (2015: 33), “SDFs can be considered as the most critical lever
to achieve spatial transformation. The various levels of SDF determine the key
elements of the desired spatial structure of the relevant spaces where they apply and
provide a long-term development vision. The SDFs are the mechanisms through which
the transformation principles contained in SPLUMA should find expression in a specific
spatial context. If the relevant aspects of spatial transformation are not appropriately
considered and applied at this level of planning, the transformation drive through
SPLUMA may fail in its entirety.”
Therefore, as a starting point, one needs to ask the question if the SDF is SPLUMA1
compliant. The SDF was reviewed with the help of a project team member according
to the legal requirements set out in SPLUMA (as stipulated in Section 21 and S12(1),
(2), (5) and (6) of SPLUMA). A total of 27 shortcomings have been identified. (See
Annexure A for a list of SPLUMA shortcomings in DM.) The stakeholders agreed that
the SDF does not meet all the requirements of SPLUMA. Some of these shortcomings
were addressed in this year’s annual revision of the SDF and that by the 2018 revision,
all the necessary requirements will be addressed. According to the stakeholders, the
provincial government agreed to the process of formulating the SDF according to
SLUMA, as far as possible, and that Provincial Government attend most of the
stakeholders’ forum meetings in this regard. The SDF public participation process was,
however, poorly attended by the community, with the exception of the Paarl western
area (predominantly white, middle- to high-income areas). A rethinking of how the
public participation process takes place, was regarded by stakeholders as important
in the next round of the SDF review in 2020. The filtering down of communication of
the SDF process via the ward committees to the community is hampered by
councillors who are not proactive. The portfolios do not reflect spatial development;
hence it is not viewed as important. Generally, only persons who have their own hidden
agendas will actively participate in such public participation processes.
The IUDF has four overall strategic goals as transformative vision, namely:
1 “SPLUMA overturns 100 years of South African town planning practice, as it recognises that local government is responsible for implementing and drafting planning by-laws, local SDFs and land-use management systems (LUMS). Before SPLUMA, planning and land development were fragmented, with multiple land development processes: The Development Facilitation Act (No. 67 of 1995), the Less Formal Township Establishment Act, Act 113 of 1991, and various provincial planning ordinances. Areas designated for black, coloured and Indian race groups had different planning legislation. In addition, land-use management fell under municipal jurisdictions established prior to the Municipal Structures Act, Act 117 of 1998. This meant that a single municipality would have multiple land-use management schemes with different definitions for land uses, which complicated the finalisation of land development applications. These schemes did not consider informal settlements or informal enterprises, and were defined within a strict modernist paradigm. In addition, the Municipal Systems Act, Act 32 of 2000, introduced the SDF as one component of the broader municipal integrated development plan (IDP). However, the relationship between the IDP, SDF, the land-use management schemes and the land development process was unclear and complex. Municipalities interpreted the various policy mechanisms differently, while provinces controlled certain aspects of the development planning process” (SACN, 2016:64).

Drakenstein | Page 25
$ Spatial integration: To forge new spatial forms in settlement, transport, social and
economic areas.
$ Inclusion and access: To ensure people have access to social and economic
services, opportunities and choices.
$ Growth: To harness urban dynamism for inclusive, sustainable economic growth
and development.
$ Governance: To enhance the capacity of the state and its citizens to work together
to achieve spatial and social integration (RSA CoGTA, 2016).
The purpose of this report was not to provide an opinion on the extent of how these
four visions can be viewed as transformative using DM as case study, but at face
value, as will become clear in this report, transformative agendas as anticipated in the
IUDF, are to be understood by reading between the lines.
The question is therefore posed: How is spatial transformation envisaged? It is argued
that “transformation of spatial form necessitates a critical review of the efficacy of the
tools that planners and city shapers have for a long time” (RSA, Department of
Economic Development [EDD], 2013:6).
Table 7 lists some of the most commonly applied tools/concepts as shown to what
extent these have been employed/introduced in the DM SDF.
TABLE 7: SPATIAL PLANNING CONCEPTS
Spatial concept Concept used
appropriately Reasons
Development/activity
corridors and spines
Yes Activity corridor has been identified as one of the 10 interrelated
spatial development principles. Only one such activity corridor
is planned for completing and/or improving eastwest and
northsouth road linkages, upgrading public facilities such as
Boland Park and the Dal Josafat Stadium and providing
incentives/opportunities for the establishment of vibrant activity
corridors along important routes such as Klein Drakenstein
Road.
Development nodes Yes Nodes, not development nodes, are used in the generic sense
of the word where nodes are strategically located areas on
high-usage routes where a high concentration of activities and
mix of land uses (commercial and public/community facilities)
should be encouraged, appropriate to the character of the area
and its role in the spatial structure. These nodes are clearly
indicated on the spatial concept maps.
Economic development/
investment zones
Yes/No Economic development and unlocking key economic drivers is
a Drakenstein Joint Planning Initiative with the Western Cape
Government.
Civic/community areas;
multipurpose service
delivery centres
Yes/No Only reference made to multipurpose sport centres (not
necessarily service delivery centres).
Mixed-use nodes or
corridors
Yes Mixed-use nodes are well reflected on spatial maps. In most of
the focus areas mixed-use spaces are being planned.

Drakenstein | Page 26
Table 7 continued:
Spatial concept Concept used
appropriately Reasons
Urban edge/boundary Yes The revision of the urban edge, approved by the Drakenstein
Council as part of the 2010 SDF, was not included in the scope
of this SDF review. Only minor adjustments to align with
approvals granted since 2010 were incorporated.
Features prominently, however in SDF, to prevent sprawl. A
realignment of the Edge in a rural area to the north of Paarl for
future low-density off-grid, low impact rural lifestyle development
to attract investment to Windmeul and to increase the population
threshold and economic base, have been planned for as a
medium-term project (2–8 years).
This somewhat contradicts (i) the notion of agrarian reform – peri-
urban agrarian reform to exclude ‘smallholdings’, ensuring a clear
distinction between residential lifestyle units within the urban
edge and small-scale commercial agricultural units outside the
urban edge. Peri-urban agrarian reform development is said to
inter alia serve to reinforce the urban edge and protect
agricultural and environmental resources in close proximity to
urban communities; (ii) at the same time, the assumption that all
land within the urban edge is developable is questioned as a
starting point to land use decisions, and accordingly, this SDF
has made recommendations for land within the urban edge to
retain its rural character.
Densification or infill
areas
Yes An area of 414 ha has been identified for densification. Have a
Densification and Urbanisation Strategy and Open Space
Utilisation Policy dating to the mid-2000s.
Urban development/
expansion areas
Yes Due to lack of services, there is limited scope for urban
expansion. Urban expansion to be contained through the creation
of an agricultural edge and a focus on infill.
Urban renewal/
regeneration zones
Yes DM has an urban renewal / regeneration policy – a clear policy
that provides guidance for the private sector implementing urban
renewal programmes, and spells out the role of the municipality
in supporting such programmes. Urban renewal programmes in
the CBDs of growth nodes and urban regeneration of culturally
and historically significant precincts and neighbourhood. They
will initiate and facilitate urban renewal programmes for strategic
precincts (for example Huguenot Station, Lady Grey, CBD, De
Poort, Paarl Hamlet) – none yet specifically identified.
Open space system Yes Interpreted as ‘Green Core’ as one of the defining elements of
the SDF. Aims to find a balance between open space and well-
defined development. Have a Densification and Urbanisation
Strategy and Open Space Utilisation Policy (2006)
High potential agricultural
land
Yes Many parts within the urban edge are agricultural producing
farms. Agriculture forms part of one of the three corridors of the
DM. Agriculture is one of the six themes of the SDF – promoting
the Drakenstein region as the primary agricultural production
centre of the Western Cape. Capitalising on existing agricultural
activities to strengthen the agricultural economy, while promoting
agrarian reform and rural development and ensuring household
and regional food security. Even talking of urban farming
(agricultural blocks) but no detail.

Drakenstein | Page 27
Table 7 continued:
Densification and mixed-use are two of the ten SDF principles. Of the 1 755 ha
developable land that has been identified in the 2010 study, the following land areas
are still available: Saron 10,38 ha; Gouda 8,79 ha; Hermon 5,6 ha; Wellington
134,89 ha; Mbekweni 217,41 ha; Windmeul 24,1 ha; Paarl 391,14 ha; Paarl South
657,08 ha; Simondium 29,39 ha; Klapmuts 10,96 ha; Ben Bernhard 96,4 ha – a total
of 1 586,14 ha that has been identified in the SDF for mixed-use and housing
developments.
Given the nature of the integrated spatial development maps in the SDF, it is not easy
to view how these densification spots/zones will impact on the overall urban form of
the settlements. However, according to the SDF the “capital and long term operating
costs of implementing new development need to be considered in determining whether
all of these sites should be developed and how they should be prioritized” (DM,
2016:44). There is no real clarity on exactly what is meant or planned for as mixed-
use spaces, besides the most obvious locations such as those around nodes and
along corridors within the accessibility grid. In some cases, these are clear-cut, such
as in FA3 (Mbekweni), at educational facilities (such as Ikhwezi where a school hall is
used as community centre / training facility), and in FA7 (green industry, agro-
processing, office parks and transport-related uses in the Ben Bernhard industrial area
at the southern end of Paarl). Others are not so clear, such as FA3 (to facilitate on-
street activity through well-located mixed-use areas to create more vibrant/complete
neighbourhoods).
Advanced spatial transformation planning such as inclusionary housing (mixed-
income housing and combining this with mixed-use) does not feature in the SDF
mindset at all. Indeed, the closest argument for mixing is that a “socio-economic
gradient with appropriate interfaces between various community groups should be
established so as to ensure that communities are not divided by large gaps in the living
standards between those living near each other” (DM, 2015:131). Future growth areas
should ideally protect land for low- and mixed-income / mixed-use development
(SACN, 2016); yet this is not the case in DM. In terms of the mass produced soulless
Reconstruction and Development Programme (RDP) housing developments that have
been developed across the country (and in the DMn) since 1994, the SDF does call
for a “focus on the importance of good design of housing for low income communities.
Housing design should always include safe public spaces with adequate landscaping
Spatial concept Concept used
appropriately Reasons
Protected or high
biodiversity zones
Yes Included in the EMF (not part of the SDF). Critical biodiversity
areas clearly mapped on the SDF.
Public transport focus
areas
Yes Ensure connectivity between settlements and a hierarchy of
nodes and connectivity within settlements with location of an
accessible hierarchy of public facilities within reach of public
transport route.

Drakenstein | Page 28
and positive street interfaces” (DM, 2015:29). Understanding and planning of
informality is being turned a blind-eye, except when it comes to the demarcated street
trading areas in the CBD. Local spatial development frameworks that will look in detail
at specific areas, will attempt to consider aspects of informality in planning. How this
is to be done, is unclear. Evidently the informal housing upgrading areas are not
included in the SDF (but will be included in the next review of SDF).
The two main modes of public transport are rail and combi-taxi. No provision for non-
motorised transport has been incorporated in the SDF, other than mentioning such
type as a potential green development. PaarlWellingtonMbekweni has a well-
developed sophisticated internal road network providing for good vehicular access to
its many urban facilities and opportunities. This road network supports a road-based
public transport system dominated by minibus taxis providing an internal as well as
external service, connecting the towns with the rural settlements. The railway line
providing for a rail-based passenger service, runs through the length of the
municipality in a northsouth direction with stations located at Paarl; Huguenot;
Mbekweni; Dal Josafat and Wellington in the urban centre of
PaarlWellingtonMbekweni; and Malan; Soetendal; Hermon and Gouda in the rural
areas. Although the railway line passes the town of Saron to its west en route to
Porterville, there is no station or direct rail link with the town (DM, 2012:47). An
interesting suggestion by one participant was the introduction of a social service train
(for example, clinic services, library, and pension pay-outs) to deliver basic
government services to the poor in the surrounding hamlets and isolated nodes such
as Klapmuts, Hermon, Gouda, and even expanding the service beyond the boundary
of the municipality.
The six themes of the SDF are in line with the National Climate Change Response
Policy, and are informed by a two-pronged approach to addressing climate change,
namely mitigation and adaptation. The SDF proposals are compiled to enable the
following climate resilient objectives: energy efficiency and demand-side
management; renewable energy; critical infrastructure, human settlements and
integrated waste management; sustainable transport; water security and efficiency;
biodiversity and ecosystem goods and services; food security; and healthy
communities. Actual proposals on exactly how this will be achieved are limited to, for
example, water recycling and to employ climate change risk reduction infrastructure
through green engineering. Biodiversity features prominently in one of the ten
interrelated spatial development principles (continuity of the green space theme) to
ensure the continuity and connection of core biodiversity areas, river systems and
landscape elements to establish connected green networks. In view of the current
severe drought and its impact on dealing with water scarcity, water should probably
have been prioritised. There is nevertheless no mentioning of any integrated water
sensitive urban design strategies. (See Lottering, Du Plessis and Donaldson, 2015,
for more on this concept.)

Drakenstein | Page 29
There are no dedicated public transport connections between place of residence,
place of work and social amenities. Existing road infrastructure serves this purpose,
linked to a transit-oriented frame of mind.
Limiting “spatial development of land within the urban edge is the availability of
infrastructure capacity in the short to medium term. These limitations have been taken
into account in the implementation framework of the SDF. Limitations in the capacity
of the bulk infrastructure networks of the municipality will impact on the time frames
for development of land parcels, identified as suitable for development. The SDF
includes prioritisation of development options for the short, medium and long term, but
ultimately the implementation of this plan is dependent on the municipal budget
allocation” (DM, 2015:13).
In terms of the implications of the plan for vulnerable groups, it is evident that this is
restricted to the infill projects (Gap housing and breaking new ground [BNG] housing)
in areas located within the existing pockets of poverty spaces. Figure 13 and Figure
14 show examples of an informal infill housing in Mbekweni and a formal infill project
at the old prison in Paarl Central.
Source: Author’s own (2017) Source: Author’s own (2017)
Figure 13: Informal infill housing in Mbekweni Figure 14: Formal infill project at the old prison in
Paarl Central
Growing the spatial economy as feature of the SDF is limited to broad brush
statements. The WCPSDF (2015) makes provision for seven overarching spatial key
elements. DM, together with Stellenbosch Municipality, is spatially located within the
Cape Metro Functional Region spatial planning category. How the DM SDF aligns
within the Cape Town Functional Region is unclear and warrants further investigation.
6.3 Degree of implementation
The procurement process in appointing consultants to prepare the SDF seems to be
counterproductive. In 2010, the SDF was originally prepared by Macroplan (Cape
Town); in 2015, by a consortium led by GAPP Cape Town, but the revision of the plan
has recently been completed by Urban Dynamics Gauteng Inc. The stakeholders felt

Drakenstein | Page 30
that, although they have good working relations with all service providers, continuity is
needed by employing the same consultants for at least a five-year period to do the
annual revisions. Transfer of knowledge and data from one consultancy to another is
complicated by legal processes. Overall, the participants were all in agreement that
the plan is of a high quality.
Achievements over the past 15 years include the following:
• Legislation – SPLUMA, as well as the ability to administer and approve applications
in terms of local by-laws. More freedom to implement local plans.
• Have an approved SDF in place with its principles of restructuring and
densification. Council supports these principles.
• Good relationship with Provincial Government. They are working together and
have identified ideal land for restructuring, but experienced problems with the
process of land transfer from province to municipality.
$ Flexible land use scheme that will make mixed-uses, or extra floors / floor area
possible without much effort.
$ Vacant municipal land audit that enabled the municipality to identify land that could
be used for ‘Gap’ or social housing, as well as land required for service delivery –
for example for disaster management or clinics. Preferred land uses are coupled
to remaining land and this can be made available to the public. With clear
information on the preferred land use they are more likely to get the development
that they want, as the market has greater certainty of what is acceptable or will be
permitted.
$ Beginning to discuss ways of enabling the formalisation/upgrading of backyard
dwellings through additional service connections. Wondering whether there is an
opportunity for a grant from the Department of Human Settlement, specifically for
enabling upgrading of backyard dwellings (given the social factors behind the lease
of these units, but also the health and safety implications of the current situation).
$ Good governance of the municipality is a double-edged sword. Besides the
benefits of good governance, it also attracts more people, including poor/indigents,
to the area with the hope that their lives will improve.
$ Specifically trying to take social facilities to the community that cannot easily
access them otherwise, also providing land for social infrastructure such as
crèches and churches. This includes providing a budget for the construction of
facilities such as community halls. The two Thusong Centres provide access to the
internet (for example for job advertisements) and computers, and enable people to
get their prescriptions and social grants.
$ Building partnerships such as Crime Prevention through neighbourhood
upgrading, that includes a non-profit company and German funding support. This

Drakenstein | Page 31
project seeks to reduce the crime and violence in areas through participatory
planning.
$ Good public participation and ensuring regular communication with all the wards
(Nel, 2017).
Stemming from the previous SDF, the following can be argued as recent spatial
mishaps in planning: the continuous growth of gated developments to the south of the
N1 and the decentralised regional shopping centre, Paarl Mall, adjacent to the N1 in
Paarl South. DM has specifically been mentioned in the 2014 WCPSDF in terms of
the impact of decentralised office and business nodal developments. Paarl Mall is a
regional shopping centre with a shopping floor area of around 37 000 m², with 95
stores and 1 915 parking spots. The mall opened in 2005. The plan to build Paarl Mall
started in 2000 with the application to Drakenstein Municipality for rezoning the land
from industrial use to a special business zone to make the building of the mall possible.
At the time, the planning department stated to the Financial Mail that the CBD would
be revived when Paarl Mall was completed. The first signs of such a plan came to the
fore after 2010, when a partnership agreement was entered into between the
municipality and private owners in Lady Grey Street to improve pavements and
parking areas, which comprised the main policy for urban renewal (Venema, 2016).
However, real satisfactory results failed to appear (DM, 2015). According to Venema
(2016), there is also no evidence of an impact study to justify that there would be no
effect on the CBD when the mall was built. In hindsight, the WCPSDF (2014:72)
suggested that “when designed, planned and located appropriately, commercial and
office developments will assist in improving the economic performance, usability,
attractiveness and experiential quality of the town centre. ‘In centre’ and ‘edge of
centre’ developments are the recommended location for new large-scale
commercial/retail developments having the least negative and most positive impacts
to the town centre and town as a whole.”
A number of what the SDF calls ‘strategic game changers’ are contained within the
spatial concept and represent a significant shift from the 2010 SDF. These strategic
proposals are:
$ A focus on mixed-use infill development (targeted approach).
$ Enabling a wide range of housing opportunities.
$ Promotion of education and sport through the provision and upgrading of strategic
facilities.
$ The integration of residential developments into a more mixed-use neighbourhood
in Paarl South.
$ The establishment of new road linkages between Paarl East and Paarl West.
$ The development of a green industry incubator park at Klapmuts.
$ The consolidation and expansion of the Wellington Industrial Park including a
waste-to-energy, green industry park.
$ The development of a logistics hub in Ben Bernhard (DM, 2015:31).

Drakenstein | Page 32
Regarding spatial targets, 17 high priority projects are identified with clear timeframes
attached to these which are to be aligned with the IDP process and other relevant
sector plans (Box 1).
BOX 1: HIGH PRIORITY PROJECTS
FA1.1 De Poort and Paarl Hamlet Precinct Plan Long Term (5–10 years); Drakenstein Municipality De Poort Board of
Directors (Task Team); Drakenstein Local Tourism Association (DLTA).
FA1.4 Paarl Waterfront and Arboretum Precinct Plan Short to Medium Term (3–7 years); Drakenstein Municipality, Paarl
CBD Partnership, DLTA.
FA2.1 Klein Drakenstein Road Central Improvement District Plan Short to Medium Term (5–7 years); Drakenstein
Municipality.
FA2.4 Huguenot Station Precinct Plan Short Term (2–5 years); Drakenstein Municipality Paarl CBD Partnership DLTA.
FA2.6 VPUU Priority Projects Roll-Out Short to Long Term (ongoing) (2–10 years); Drakenstein Municipality VPUU.
FA3.1 Roggeland Precinct Plan Short to Medium Term (3–6 years); Drakenstein Municipality SAHRA Heritage Western
Cape.
FA3.2 Mbekweni Station Precinct Plan Short Term (2–4 years), Drakenstein Municipality.
FA3.5 Mbekweni NMT Plan Short to Medium Term (2–10 years), Drakenstein Municipality.
FA4.2 Wellington CBD Urban Design Framework Medium to Long Term (5–20 years), Drakenstein Municipality.
FA4.4 Wellington Heritage Management Plan Short Term (2–4 years), Drakenstein Municipality Heritage Western Cape.
FA4.5 Wellington Urban River Plan Short to Medium Term (2–6 years); Drakenstein Municipality WC DEDAT Local
community and land owners.
FA5.1 Paarl South Floodline Study Short to Medium Term (2–4 years), Drakenstein Municipality Private land owners.
FA5.2 Paarl South New Public Road Link Short to Medium Term (3–6 years), Drakenstein Municipality.
FA6.1 Simondium New Rural Village Precinct Plan Short to Medium Term (5–8 years), Drakenstein Municipality.
FA11.1 Gouda Transport Logistics Hub Short to Medium (5–10 years), Drakenstein Municipality Private Developer(s).
FA12.1 Saron Heritage Core Precinct Plan Short to Medium (2–6 years), Drakenstein Municipality, Private Developer(s).
FA12.2 Saron Heritage Festival (Leiwater Festival) Short Term (annual), Drakenstein Municipality DLTA.
Figure 15 shows the spatial distribution of these high priority projects and it is clear
that there is no definite over-representation in certain spaces. These priority areas
were submitted to the DM Council for funding and approval, but not all have been
approved and these are at present in the process to be aligned with the IDP and the
revised SDF. Funding has, however, been cut. Strategic identification of spatial
investment priority zones (priority areas) are primarily done from within the spatial
planning department. Additional projects for subsequent timeframes are shown on the
implementation matrices for each focus area (DM, 2015). A number of these are
precinct plans that emphasises a focus on urban renewal. (The SDF makes provision
for the development of precinct plans for focus areas.) The urban renewal of the
business areas in Paarl and Wellington is a priority. The DM Council has concluded a
Public Private Partnership Agreement with a private sector investor for the
redevelopment and upgrading of the Paarl CBD. In addition, the Southern Paarl
Precinct, the Huguenot Interchange and the Wellington CBD have been identified as
priority areas for urban renewal (DM, 2012:50).

Drakenstein | Page 33
DM (2015:136)
Figure 15: High priority project distribution
“Like almost all South African municipalities, Drakenstein municipality cannot raise
enough finance to provide the infrastructure that is required to eradicate backlogs,
allow for growth and renew the existing infrastructure base. The size of the funding
gap that will be faced will depend on how growth takes place: what will household and
economic growth rates be, and will economic growth be sufficiently high to
accommodate household growth? The need for infrastructure spending can be
reduced somewhat by adopting a more compact urban form” (DM, 2015:47). For this
densification as future growth scenario, “a Municipal Services Financial Model (MSFM)
was run for Drakenstein Municipality as part of the preparation of the SDF in order to
quantify the impact that different spatial decisions make on the need for capital
expenditure in the municipality, the extent to which there is sufficient finance available
to cover this expenditure, and the impact that the capital expenditure is likely to have
on the operating budget” (DM, 2015:45). The cost of developing, for instance ‘gap
housing’, with land prices and services is too high to be profitable for the free market
(Nel, 2017).

Drakenstein | Page 34
Furthermore, on the issue of land, there is sufficient municipal-owned land in the right
places to address restructuring and spatial transformation but the political will to do so
is lacking. The municipality does not have the budget to purchase land in areas with
high land values to provide housing, taxi ranks and social facilities for workers in those
areas. While the provincial government owns some suitable land, the process of
transferring the land is tedious. It often takes so long that by the time the land is
transferred it may have been invaded, and dealing with the squatters requires another
long process. Local authority priorities are not the same as the priorities of other
department, for example the DRDLR was offered land that was suitably located to
accommodate workers who had been evicted from farms that is a priority for the
municipality, but it is not the DRDLR’s priority – thus the opportunity could slip away.
Other land is not available or too expensive (Nel, 2017).
Why is the municipality struggling to address the obstacles?
• Red tape and complicated processes of land transfer between spheres of
government.
• The public’s attitude and fears.
• Municipal government not being proactive enough.
• Lack of budget to implement transformation (on the scale needed).
• No need to find new ways of doing things as the ways it were done, has not yielded
the results that is needed (Nel, 2017).
There is a sentiment shared by numerous stakeholders that the SDF is ‘above the
understanding’ of the finance department. The town planning department will embark
in 2017/18 on a SDF marketing strategy within the municipality, to make the different
sections aware of the importance thereof, as well as how to think spatially, financially
and holistically in terms of engineering space. Although the SDF does have a
monitoring system in terms of reference, there is no real up-to-date integrated system
for monitoring. Monitoring takes place by means of note taking and keeping these
notes in a file on the shelf.
As indicated earlier, the new integrated zoning scheme has not yet been implemented,
but in the process in preparing one, the department of land use first need to consult
with the SDF. The DM has a number of policies in place that will support the SDF
proposals and these include the following: Paarl Farms Land Use Management Policy
(2005); Densification and Urbanisation Strategy and Open Space Utilisation Policy
(2006); Informal Settlement Strategy and Programme (2014); Environmental
Management Framework (2012); Student Accommodation Policy2 (2017). In order for
the SDF to successfully achieve some of its objectives, a number of new policies have
2It is interesting to note that DM has identified the educational economy as a growth sector for the municipality and suggested that the problems and challenges related to student housing and its impacts on urban space (studentification of space) be investigated with a view to providing input to the LUMS and detailed spatial planning for areas under pressure for delivering more student accommodation such as in Wellington. New student housing typologies evolving in Stellenbosch are to be considered, yet these typologies are not without their own problems, especially how they impact on urban space (DM, 2017).

Drakenstein | Page 35
been identified, namely the strategy for the provision of serviced sites; formalisation of
backyard structures; urban renewal/regeneration policy; and sporting economy
strategy. In addition to policies, the DM has recently commissioned a number of
guidelines and by-laws that would support the implementation of the SDF: guidelines
and by-laws for the protection and management of Heritage Overlay Zones and
Heritage Resources; Land Use Management System (Integrated Zoning Scheme);
Provision of Engineering Infrastructure and Services (development charges); and Peri-
Urban Agrarian Reform Guidelines. Other than these policies, there is no specific
spatial transformation implementation strategy and it is not on the agenda to create
such a policy in the near future.
Drakenstein is categorised as a developing or growing municipality and as a result,
will require significant additional resources and funding to conduct the growth that is
expected. The municipality set itself out to implement a comprehensive five-year
capital investment plan (CIP) which would be updated annually with a potential of
extending it to twenty years to ensure “that bulk infrastructure services and internal
infrastructure services together with the foreseen funding sources are planned in an
integrated and coordinated manner” (DM, 2012:151). The municipality make all capital
improvements in accordance with the CIP and IDP. The content of the Capital
Infrastructure Policy (only a two-page policy document!) is vague and does not speak
to the IDP and SDF.
The development of a “capital prioritisation model to identify the capital projects to be
implemented with scarce available financial resources that will have the biggest impact
in improving the quality of life of Drakenstein’s customer base” (DM, 2012:150), can
be considered the most significant transformation tool. As stated in the IDP of 2012:
“The model’s criteria will have four focus areas, i.e. IDP strategic objectives, services
master plan objectives, project dynamics and project consequences. To each of these
criteria and elements per criteria will be allocated weights still to be determined by
Council” (DM, 2012:150). In the interim, a subjective approach was followed to
determine the capital investment programme. It needs to be noted that “national and
provincial government programmes and grant funding often influences the capital
investment programme of Drakenstein. This is something that the municipality has
little control over” (DM, 2012:150). T
he Prioritisation Model for Capital Assets Investment was approved by Council in 2015
and all prioritised capital projects will now be classified in the five-year capital assets
investment programme. This model makes provision for a rating system where each
infrastructure category will have its own rating criteria. Each capital project will be
evaluated against these rating criteria to determine if the capital project affects the
rating criteria. If so, the capital project will score a single point. Each rating criteria will
also have a weight attached to it and the total points a capital project will earn, will
determine its importance to influence the inclusion of the capital project into the capital
budget for the next financial year. One of the rating categories is whether a capital

Drakenstein | Page 36
expenditure/project complies with the developmental directions of the municipality’s
spatial development framework. This category’s weight is 5 out of 100. Other rating
categories and their weights are as follows: statutory requirement (10); service delivery
(12); essential service (8); economic stimulation (8); community benefit (5); permanent
job creation (8); labour intensive construction (7); revenue generating (12); aesthetical
improvement (5); social upliftment (5); risk factor (10), and time factor (5). A
Development and Investment Forum has recently been established within the office of
the municipal manager.
In addition, an indigent policy oversees the mechanisms to determine who qualifies as
an indigent household and the level of free basic services enjoyed by indigent
households. The development and review of a writing-off of an irrecoverable debt
policy with an incentive scheme to encourage outstanding debtors to pay a certain
percentage of their outstanding debt and for the municipality to write-off a certain
percentage of outstanding debt, were done in the first quarter of the 2012/13 financial
year.
7. GENERAL CONCLUSIONS
The national policy intent is very clear on spatial transformation: to build inclusive,
productive, sustainable and well-governed cities (SACN, 2016:48). However, since
1994 there has been mixed progress in addressing spatial injustice and socio-
economic inequality. The following paraphrased and quoted remarks show a striking
resemblance of the lessons learnt from various other case studies and those reported
on in the State of South African Cities Report (SACN, 2016:49-51) and what is
experienced in DM:
$ The spatial and sector plans “lack spatial trend analyses, future projections or
spatial implications of development scenarios” as well as an implementation
monitoring strategy.
$ “Spatial priorities are driven by sector targets and catalytic projects, each with its
own spatial investment logic, rather than by an integrated spatial strategy and
programme.”
$ The potential impact of interventions by the neighbouring municipality of
Stellenbosch in Klapmuts was not evaluated, yet it is seen as alleviating their own
pressures.
$ The SDF seems to “remain focused on managing expected land-use change driven
by the private sector, rather than on coordinating intergovernmental investment,
spatial prioritisation and integrated spatial development strategies, or influencing
the spatial investment logic of different sector strategies/line departments”.
$ Most of the focus area spatial plans do not “include investment plans of the private
sector, other government agencies or civil society and the municipal spatial

Drakenstein | Page 37
priorities do not appear to guide those of national and provincial functional sectors
or even municipal line departments”.
In so far as continued inefficient spatial developmental issues listed in the State of
South African Cities Report (SACN, 2016:49-51, paraphrased and quoted) are
concerned, the following are evident in the DM case:
$ “Lack of affordable accommodation close to economic opportunities, and the view
that informal dwellings/strategies are the only solution for the poor.”
$ On the one hand, public developments (Gap, RDP housing on the periphery)
reinforce city sprawl, resulting in inefficient and costlier infrastructure and services
and, on the other hand, private developments on the periphery (growth in these
higher-end peripheral developments, for example gated housing estates, cluster
housing complexes and eco estates) claim to be sustainable, but take up vast tracts
of open space and encourage the use of private vehicles.
$ The seemingly good location of the Mbekweni township (which is strategically
located between Wellington and Paarl) has not necessarily translated into vastly
improved livelihood prospects for its residents, other than pockets of housing
developments.
$ The regional mall was built around a “car-captive audience, requiring space for
parking and vehicle traffic, and are less flexible and diverse than high street-style
developments.”
$ “The cost of fragmentation in addition to its social and political implications, the
current spatial form has serious cost implications for the state, urban residents and
the environment.” The leapfrog type developments taking place in DM and those
planned for impact on residents because “the fragmented and peripheral locations
mean that they spend more time and money on transport”.
In the DM case, the powerful lobby group such as the heritage associations, have played a crucial role in driving the conservation of the built environment agenda. This is indeed a big plus for the DM SDF. In South Africa, the built environment is often considered unimportant in spatial planning strategies.
The bulky SDF (139 pages, excluding annexures) meets almost all the required tick
boxes of what should be in an SDF. It may come across that there is sufficient focus
on the key issues in the SDF, but in the same sense it seems to be dispersed across
too many issues. It depends on how the text is read. Perhaps aligning the IDP and
budgets with priority SDF targets and developments would contribute to a reduction in
text and would be more realistic for implementation.
Transformation, however, on the other hand, is slow and mostly ill-conceived. They do
have the ideas for spatial restructuring, but translating them from ideas and plans to
change on the ground is difficult (Nel, 2017).

Drakenstein | Page 38
There is a misconception at the municipal Council that private developments are the
panacea for urban renewal and development as these private developments (mostly
gated and reinforcing spatial segregation) bring in money for the DM. There is
uncertainty (because it has not yet been quantified) as to whether such private
developments are actually bringing in real investment for the DM. The size of these
gated developments (Figure 4 & 5), their actual number of dwelling units to the south
of the N1, and the environmental and economic cost of these developments have to
be quantified first before the DM Council will understand the spatial logic of
development. However, the DM is not capable of doing such costing and it seems as
if any such plans to do so, are blocked. It seems to be, at the instruction of senior
management, that development should be seen as planning-led development.
Finance and other relevant departments are now starting to take the SDF into
consideration in guiding their planning. As one participant stated, “they are not fully
there yet”. The main spatial transformation issues have been mostly diagnosed but
this is understood within clear shortcomings of implementation. How politics and the
private sector influence and drive the transformation project, appears to be the main
stumbling block. Making these problems central to the SDF document will not be met
with Council’s approval, hence they are not highlighted.
It is evident from discussions with the participants that the three scenarios postulated
upfront are indeed true:
$ The DM has so far relied mainly on getting plans done and less on thinking hard
about how to implement them.
$ The DM does not effectively use IDPs to spatially coordinate their own activities or
those of other spheres regarding investment. (This is at least true for the 2015 SDF
– the 2017 review document [not the focus of this study] made a dedicated attempt
to better align the SDF and IDP.)
$ There is a limited appreciation in DM of the implementation tools that SPLUMA has
brought to the table and limited progress in giving effect to SPLUMA. The town
planners have an appreciation for SPLUMA and understand its purpose, but the
underlying dynamic of political forces and private developers to curtail such spatial
planning practices and principles are derailing the actual implementation thereof.
These three hypotheses speak directly to three main areas of SDF quality that need
to be addressed before major spatial transformation issues can be addressed/taken
care of. Personal judgement and after the conversations with participants, it can be
stated that spatial transformation, with the emphasis here on transformation, does not
seem to be a priority of the DM.

Drakenstein | Page 39
REFERENCE LIST
Cameron, R. 1999. The democratisation of South African local government: A tale of
three cities. Pretoria: Van Schaik.
Drakenstein Heritage Survey Group, 2010
Penfold, J. 2011. Drakenstein GIS heritage management system. PositionIT,
Nov/Dec. 2011. EE Publishers. Available at http://www.ee.co.za/wp-
content/uploads/legacy/posit11/PositionIT_nov-dec11-Pro_38-42.pdf
Drakenstein Municipality. 2010. Amended Spatial Development Framework (SDF) for
the Drakenstein Municipality. Macroplan, Volume 2. Durbanville: Town and Regional
Planners & Architects. Available at
http://www.drakenstein.gov.za/Administration/Documents/Documents%20For%20Citi
zen%20Viewing/IDP/2013%20-%202018/Spatial%20Development%20Framework/
Spatial%20Development%20Framework%20-%2024%20Nov%202010%20-
%20Vol%202.pdf
Drakenstein Municipality. 2012. Integrated Development Plan (IDP) 2012-2017.
Paarl: Drakenstein Municipality. Available at
http://www.drakenstein.gov.za/Administration/Documents/Documents%20For%20Citi
zen%20Viewing/IDP/2012-2017/IDP%202012-
2017%20MM%20%2017%20Aug%202012.pdf
Drakenstein Municipality. 2015. Spatial Development Framework. A spatial vision
20152035. Final Report. Available at
http://www.drakenstein.gov.za/Residents/Spatial%20Planning/Documents/Spatial%2
0Development%20Framework/150925%20DSDF%20Final%20report.pdf
Drakenstein Municipality. 2016. Drakenstein zoning scheme. Phase 2: Research
report (P02/2014) Compilation of Drakenstein Land Use Management Scheme. Paarl:
Drakenstein Municipality.
Drakenstein Municipality. 2017. Student accommodation policy. Available from:
http://www.drakenstein.gov.za/Administration/Policies/Documents/Student%20Acco
mmodation%20Policy-Council%20Adopted%2020170329.pdf
Google Earth. Volledige link na die spesifieke kaart.
Lottering, N., Du Plessis, D. & Donaldson, R. 2015. Coping with drought: The
experience of water sensitive urban design (WSUD) in the George Municipality. Water
SA 41(1):1-7. http://dx.doi.org/10.4314/wsa.v41i1.1
Nel, V. 2017. Notes from interview with Anthea Shortles, Senior spatial planner at the
Municipality. Conducted 17/3/2017 12.03–12.50

Drakenstein | Page 40
RSA (Republic of South Africa). 1998. Local Government: Municipal Structures Act,
Act 117 of 1998. Cape Town: Government Printer.
RSA CoGTA (Republic of South Africa. Department of Cooperative Governance and
Traditional Affairs). 2016. Integrated Urban Development Framework (IUDF). Pretoria.
RSA EDD (Republic of South Africa. Department of Economic Development), The
National Social Dialogue and Strategic Frameworks Programme, and the South
African Cities Network (SACN). 2013. Reflections on the “Spatial Transformation of
the City”, 29 January 2013. Available at http://www.economic.gov.za/knowledge-
networks/377-spatial-planning
RSA (Republic of South Africa). Department: National Treasury. 2016. Drakenstein.
Available at http://www.Municipalmoney.gov.za [Accessed on 24 April 2017]
SACN (South African Cities Network). 2014. Spatial transformation of cities:
Conference report, 4-6 March 2014. Available at
http://www.jda.org.za/docs/spatial_transformation_conf_report.pdf
SACN. 2015. SPLUMA as a tool for spatial transformation.
http://sacitiesnetwork.co.za/wp-content/uploads/2015/05/SPLUMA-as-a-tool-for-
spatial-transformation_final-_April2015.pdf.
SACN (South African Cities Network). 2016. Chapter 2: The spatial transformation of
South Africa’s cities: From abstract concept to meaning and means. In State of South
African Cities Report 2016. Johannesburg SACN. Available at
http://www.socr.co.za/wp-content/uploads/2016/06/SoCR16-Main-Report-online.pdf
South African History Online. 2012. Paarl. Available at
http://www.sahistory.org.za/places/paarl
Statistics South Africa. 2011. Census 2011. Pretoria.
Van Niekerk, A., Du Plessis, D., Spocter, M., Ferreira, S., Donaldson, R., Loots, L.,
Boonzaaier, I., Janeke, D. and Terhoven, Q. 2014. Growth potential study. Western
Cape Government: Environmental Affairs and Development Planning. Available at
https://www.westerncape.gov.za/eadp/sites/default/files/your-resource-
library/2014%20Growth%20Potential%20Study%20of%20Towns%20(GPS).pdf
[Accessed on 25 April 2017]
Venema, J. 2016. Retail transformations and consumer preferences in Paarl and
Stellenbosch: CBD versus decentralised mall. Unpublished MA thesis, Department of
Geography and Environmental Studies, Stellenbosch University.
http://hdl.handle.net/10019.1/100235
Western Cape Government. 2014. Western Cape Provincial Spatial Development
Framework. Cape Town: Environmental & Spatial Planning, Western Cape
Department of Environmental Affairs and Development Planning. Available at

Drakenstein | Page 41
https://www.westerncape.gov.za/eadp/sites/eadp.westerncape.gov.za/files/your-
resource-
library/2014%20Provincial%20Spatial%20Development%20Framework%20%28PSD
F%29_0.pdf
Western Cape Government, Provincial Treasury. 2015a. Socio-economic profile:
Drakenstein Municipality 2015. Working Paper. Cape Town: Western Cape Provincial
Treasury. Available at
https://www.westerncape.gov.za/assets/departments/treasury/Documents/Socio-
economic-profiles/2016/municipality/Cape-Winelands-
District/wc023_drakenstein_2015_sep-lg_profile.pdf
Western Cape Government, Provincial Treasury. 2015b. Municipal economic review
and outlook. Cape Town: Western Cape Provincial Treasury. Available at
https://www.westerncape.gov.za/assets/departments/treasury/Documents/2015_mer
o_final_to_web_9_october_2015.pdf
Williams 2000. South Africa: Urban transformation. Cities 17(3): 167–183.
Interviews were conducted with:
Anthea Shortles, Manager, Spatial Planning.
Ashley Roelf, senior town planner.
Cindy Winter, Department of Environmental Affairs and Development Planning.
Dirk Breytenbach, Paarl Business Chamber.
Eunice Smit, former DM employee who did a study on urban edges in Paarl in 2008.
Louis Schlechter, assistant town planner.
Johan Miller, Chairperson of the planning and economic development committee.
Schalk Van Heerden, MA Urban Planning student at University of Cape Town, who is
working together with planning students to assist the municipality in the SDF for
specific areas.

Drakenstein | Page 42
ANNEXURE A SPLUMA SHORTCOMINGS
SPLUMA shortcomings in DM • Is mention made of how the land use scheme should promote/encourage redress?
• Inclusion: Does the SDF specifically include informal settlements, areas of poverty/deprivation and the rural part of
the municipality?
• Is mention made of mechanisms or development procedures or provisions in the land use scheme to promote secure
tenure for all and the incremental upgrading of informal settlements?
• Is mention made that the provisions of the land use scheme should be sufficiently flexible and appropriate for the
various forms of settlement in the municipality and specifically informal settlements, and areas of poverty/
deprivation?
• Is there an attempt to quantify the land demand for specific land uses, and the supply of this land (land
allocations) given the constraints imposed by the SDF?
• Do the proposals take current and future costs into account – such as incremental extensions, operational costs (e.g.
staffing) or maintenance – in respect of both infrastructure and social services?
• Will the SDF proposals encourage the functioning of an equitable land market with a variety of choices in type and
price of property for all income groups?
• Do the proposals in the SDF, or the SDF itself, seek to optimise existing resources or infrastructure in the municipal
areas?
• Is there any mention of decision-making processes to minimise the negative impacts (social, economic, financial,
environmental, etc.) of the SDF recommendations in terms of interventions and land use proposals?
• Is there any mention of creating efficient, expeditious and streamlined land use management processes?
• Do the proposals in the plan seek to limit negative impacts of economic or environmental hazards (particularly of poor
or otherwise vulnerable communities)?
• Is there mention of flexibility of policy, etc. to promote sustainable livelihoods (e.g. food gardening, home-based and
small businesses)?
• Does the SDF clearly set out the policies, legislation and procedures that must be followed in drafting and adopting the
plan?
• Does this SDF set out how the public participation process was conducted, and how this process affected the
formulation of the SDF?
• To what extent does the SDF contain all the elements required of a municipal SDF as per §12 & 21 of SPLUMA (as
listed below?
o Give effect to norms and principles
o Spatial representation of a five-year spatial plan
o Five-year employment trends, estimates of economic activity and its location
o Possible inclusionary housing areas
o Incremental upgrading areas
o Areas where land development processes should be applied
o Spatial depiction of integration/alignment of municipal policies, plan and strategies
o A capital expenditure framework – depicted spatially:
− Sectoral requirements, including budgets and resources − Necessary amendments − Institutional arrangements for implementation − Specification of implementation targets, including dates and monitoring indicators − Arrangements for partnerships in implementation
o An implementation plan
o Represent the integration and trade-off between sector plans
o Integration of national, provincial and municipal plans in that space
o Address historical imbalances